Article

Temporal and Spatial Variation Characteristics of Precipitation Isohyets on the Qinghai–Tibet Plateau from 1961 to 2023

1
School of Geographical Science, Qinghai Normal University, Xining 810016, China
2
Academy of Plateau Science and Sustainability, Xining 810016, China
3
School of National Safety and Emergency Management, Qinghai Normal University, Xining 810008, China
4
College of Life Science, Qinghai Normal University, Xining 810016, China
*
Author to whom correspondence should be addressed.
Atmosphere 2025, 16(6), 698; https://doi.org/10.3390/atmos16060698
Submission received: 2 April 2025 / Revised: 6 June 2025 / Accepted: 7 June 2025 / Published: 10 June 2025
(This article belongs to the Section Meteorology)

Abstract

Under a warming–humidifying climate, precipitation patterns on the Qinghai–Tibet Plateau have significantly shifted due to a water imbalance in its solid–liquid structure. Using monthly precipitation data (1961–2023), we analyzed the spatial distribution and dynamics of 200 mm and 400 mm isohyets through climate propensity rates and centroid center migration. The results show: (1) precipitation increased significantly (4.17 mm/decade), decreasing spatially from southeast to northwest. Regionally, it increased in areas like the southern Qinghai Plateau region, but declined in the southern Himalayas and central–southern Altyn−Tagh Mountains. (2) The 200 mm line migrated northward in southern Qiangtang, shrank around Qaidam Basin, with an overall northeastward shift; the 400 mm line moved westward in eastern Qiangtang and Hehuang Valley, northward in southern Qinghai, trending northwest. (3) From 1961 to 1990 and 1991 to 2023, the 200 mm isohyet’s centroid shifted 49 km north and 17 km east, while the 400 mm isohyet moved 22 km north and 19 km west. (4) Vertically, the 200 mm isohyet ascended by 7.11 m/decade, while the 400 mm line rose more slowly (2.61 m/decade). These changes indicate a significant shift in precipitation distribution, impacting regional hydrological processes.

1. Introduction

Climate change is one of the global environmental changes that is of widespread concern today, and the study of the characteristics and mechanisms of regional climate change and the prediction of future climate trends are at the core of global and regional climate change research [1]. The IPCC 6th Assessment Report shows that the global surface temperature in 2011–2020 was 1.09 °C higher than in 1850–1900 [2]. Accompanied by rising temperatures, global warming has led to increased surface evaporation, resulting in an increase in the water-holding capacity of the atmosphere and an acceleration of the global and regional water cycle, which will inevitably result in an increase in localized precipitation [3,4,5]. Precipitation is an important component of the global water cycle, and its spatial and temporal distribution affects processes such as the global atmospheric cycle, climate change, and the hydrological balance [6,7]. The Qinghai–Tibet Plateau, as a sensitive area to global climate change, has experienced significant climate change over the past 50 years, with a rate of increase far exceeding the global average. Against the background of a global surface temperature gradient of 0.17 °C per decade, the increase in the Qinghai–Tibet Plateau region amounted to 0.3–0.4 °C per decade, which is more than twice the global average gradient rate [8,9]. The results of the Second Comprehensive Scientific Expedition to the Qinghai–Tibet Plateau indicate that, due to global warming and the melting of glaciers, Asia’s water towers are becoming warmer and wetter, triggering an imbalance in the “solid–liquid structure” of water bodies [10,11,12].
At present, the study of the spatial distribution and temporal variation of precipitation mainly uses methods such as the interpolation of meteorological stations and the inversion of multi-indicator models. Four General Circulation Models (GCMs) were used to investigate the possible changes in the seasonal temperature and precipitation in the Setif Plateau region (northeastern Algeria) for three time periods (2025, 2050, and 2075), and it was concluded that climate change, and the intensification of climate change, will alter precipitation, temperature, and evapotranspiration, and will increase the vulnerability of the Setif Plateau to changes in the hydrological cycle [13]. The spatial and temporal distribution of water vapor was analyzed using nine GNSS stations, located along the Atlantic coast of Spain and France, and the empirical blind model GPT3 was used as a source of meteorological information, finding that precipitation in the region exhibits a clear seasonal pattern [14]. A methodology was proposed to develop an analytical model for total precipitable water (TPW) retrieval, based on Global Navigation Satellite System (GNSS) observations from 12 distributed stations in Thailand, over a one-year period [15]. The diverse precipitation climate of Iran has been studied using cutting-edge satellite precipitation data and improved modeling techniques, and the complexity of Iran’s precipitation climate has been investigated by harnessing the power of machine learning (ML) using the k-means + + algorithm, in conjunction with satellite information and the ML model, which significantly improves the accuracy of satellite-based precipitation estimation. Studies on the spatial and temporal distribution of precipitation over the Qinghai–Tibet Plateau have focused on the spatial differences and seasonal variations in precipitation [16]. The spatial distribution characteristics of precipitation on the Qinghai–Tibet Plateau, during the period 1998–2011, were analyzed by using the difference correction between the data from 114 meteorological stations and TRMM precipitation data, combined with the kriging interpolation method, and it was found that the precipitation on the Qinghai–Tibet Plateau gradually decreases from the southeast to the northwest, and the seasonal fluctuation of precipitation is obvious [17]. Precipitation data from 97 meteorological stations during 1961–2004 were analyzed, and through the use of regression analysis and cumulative distance-plotting methods, it was found that the precipitation on the Qinghai–Tibet Plateau has shown a clear increasing trend since the 1980s, especially in the southeastern region of the plateau [18].
However, the results of the spatial distribution of precipitation obtained by these methods often only indicate regional variations on a general or grid scale, and do not portray the spatial evolution of precipitation patterns well. In contrast, an isohyet is an important tool for studying the patterns and characteristics of precipitation distribution in different places, during the same period of time [19]. Compared with grid-scale changes, isohyets can better reflect the degree of regional precipitation changes. Studies on isohyets have mainly focused on latitudinal and longitudinal changes. Based on the 0.5° × 0.5° grid point dataset of surface precipitation in China from 1961 to 2015, the spatial distribution of the 800 mm isohyet and its centroid position in the eastern monsoon region are clarified by using GIS-based spatial analysis and temporal change analysis, and the spatial and temporal characteristics of the isohyet are analyzed [20]. The weighted average method was used to obtain the multi-year 400 mm isohyet from 1951 to 2012, and the results found that the 400 mm isohyet in China shifted to the northeast as a whole during the 62-year period [21]. The study on the variation of the 400 mm isohyet and the wet–dry change in China concludes that the location of the 400 mm isohyet and the wet–dry boundary, defined by the aridity index, are basically the same, with a northeast–southwest orientation, and that the 400 mm isohyet in China is mainly shifted to the west and uplifted to the north under future emission scenarios [22]. The 1960–2016 multi-year average semi-arid boundary in northern China was analyzed, and only the middle–eastern section of the 400 mm isohyet was considered, and the multi-year weighted average location was considered to be located at 108°26′31″ E, 38°57′25″ N [23].
The Qinghai–Tibet Plateau is the roof of the world and the water tower of Asia, and is one of China’s most important ecological security barriers and strategic resource reserve bases, as well as being the most sensitive to global climate change [24,25]. Some specific isohyets have become important reference indicators for natural zoning. Among them, the 200 mm isohyet is the geographical demarcation line between arid and semi-arid zones [26]. The 400 mm equal precipitation line is an important geographical demarcation line between China’s semi-humid and semi-arid zones, forest vegetation and grassland vegetation, and farming and nomadic civilizations [27]. The Qinghai–Tibet Plateau, as a unique geological–geographical–resource–ecological unit on Earth, especially in regard to the movement of the 200 mm and 400 mm isopach lines, will have far-reaching impacts on the ecology, agricultural production, and climate patterns of the plateau and the neighboring areas. Therefore, on the basis of obtaining the characteristics of isohyets, this paper analyzes the segmentation and trend of the spatial changes in the 200 mm and 400 mm isohyets on the Qinghai–Tibet Plateau, and reveals the degree of changes in regional precipitation, with a view to providing a reference for the Qinghai–Tibet Plateau region in coping with climate change and in regard to sustainable development.

2. Data and Methods

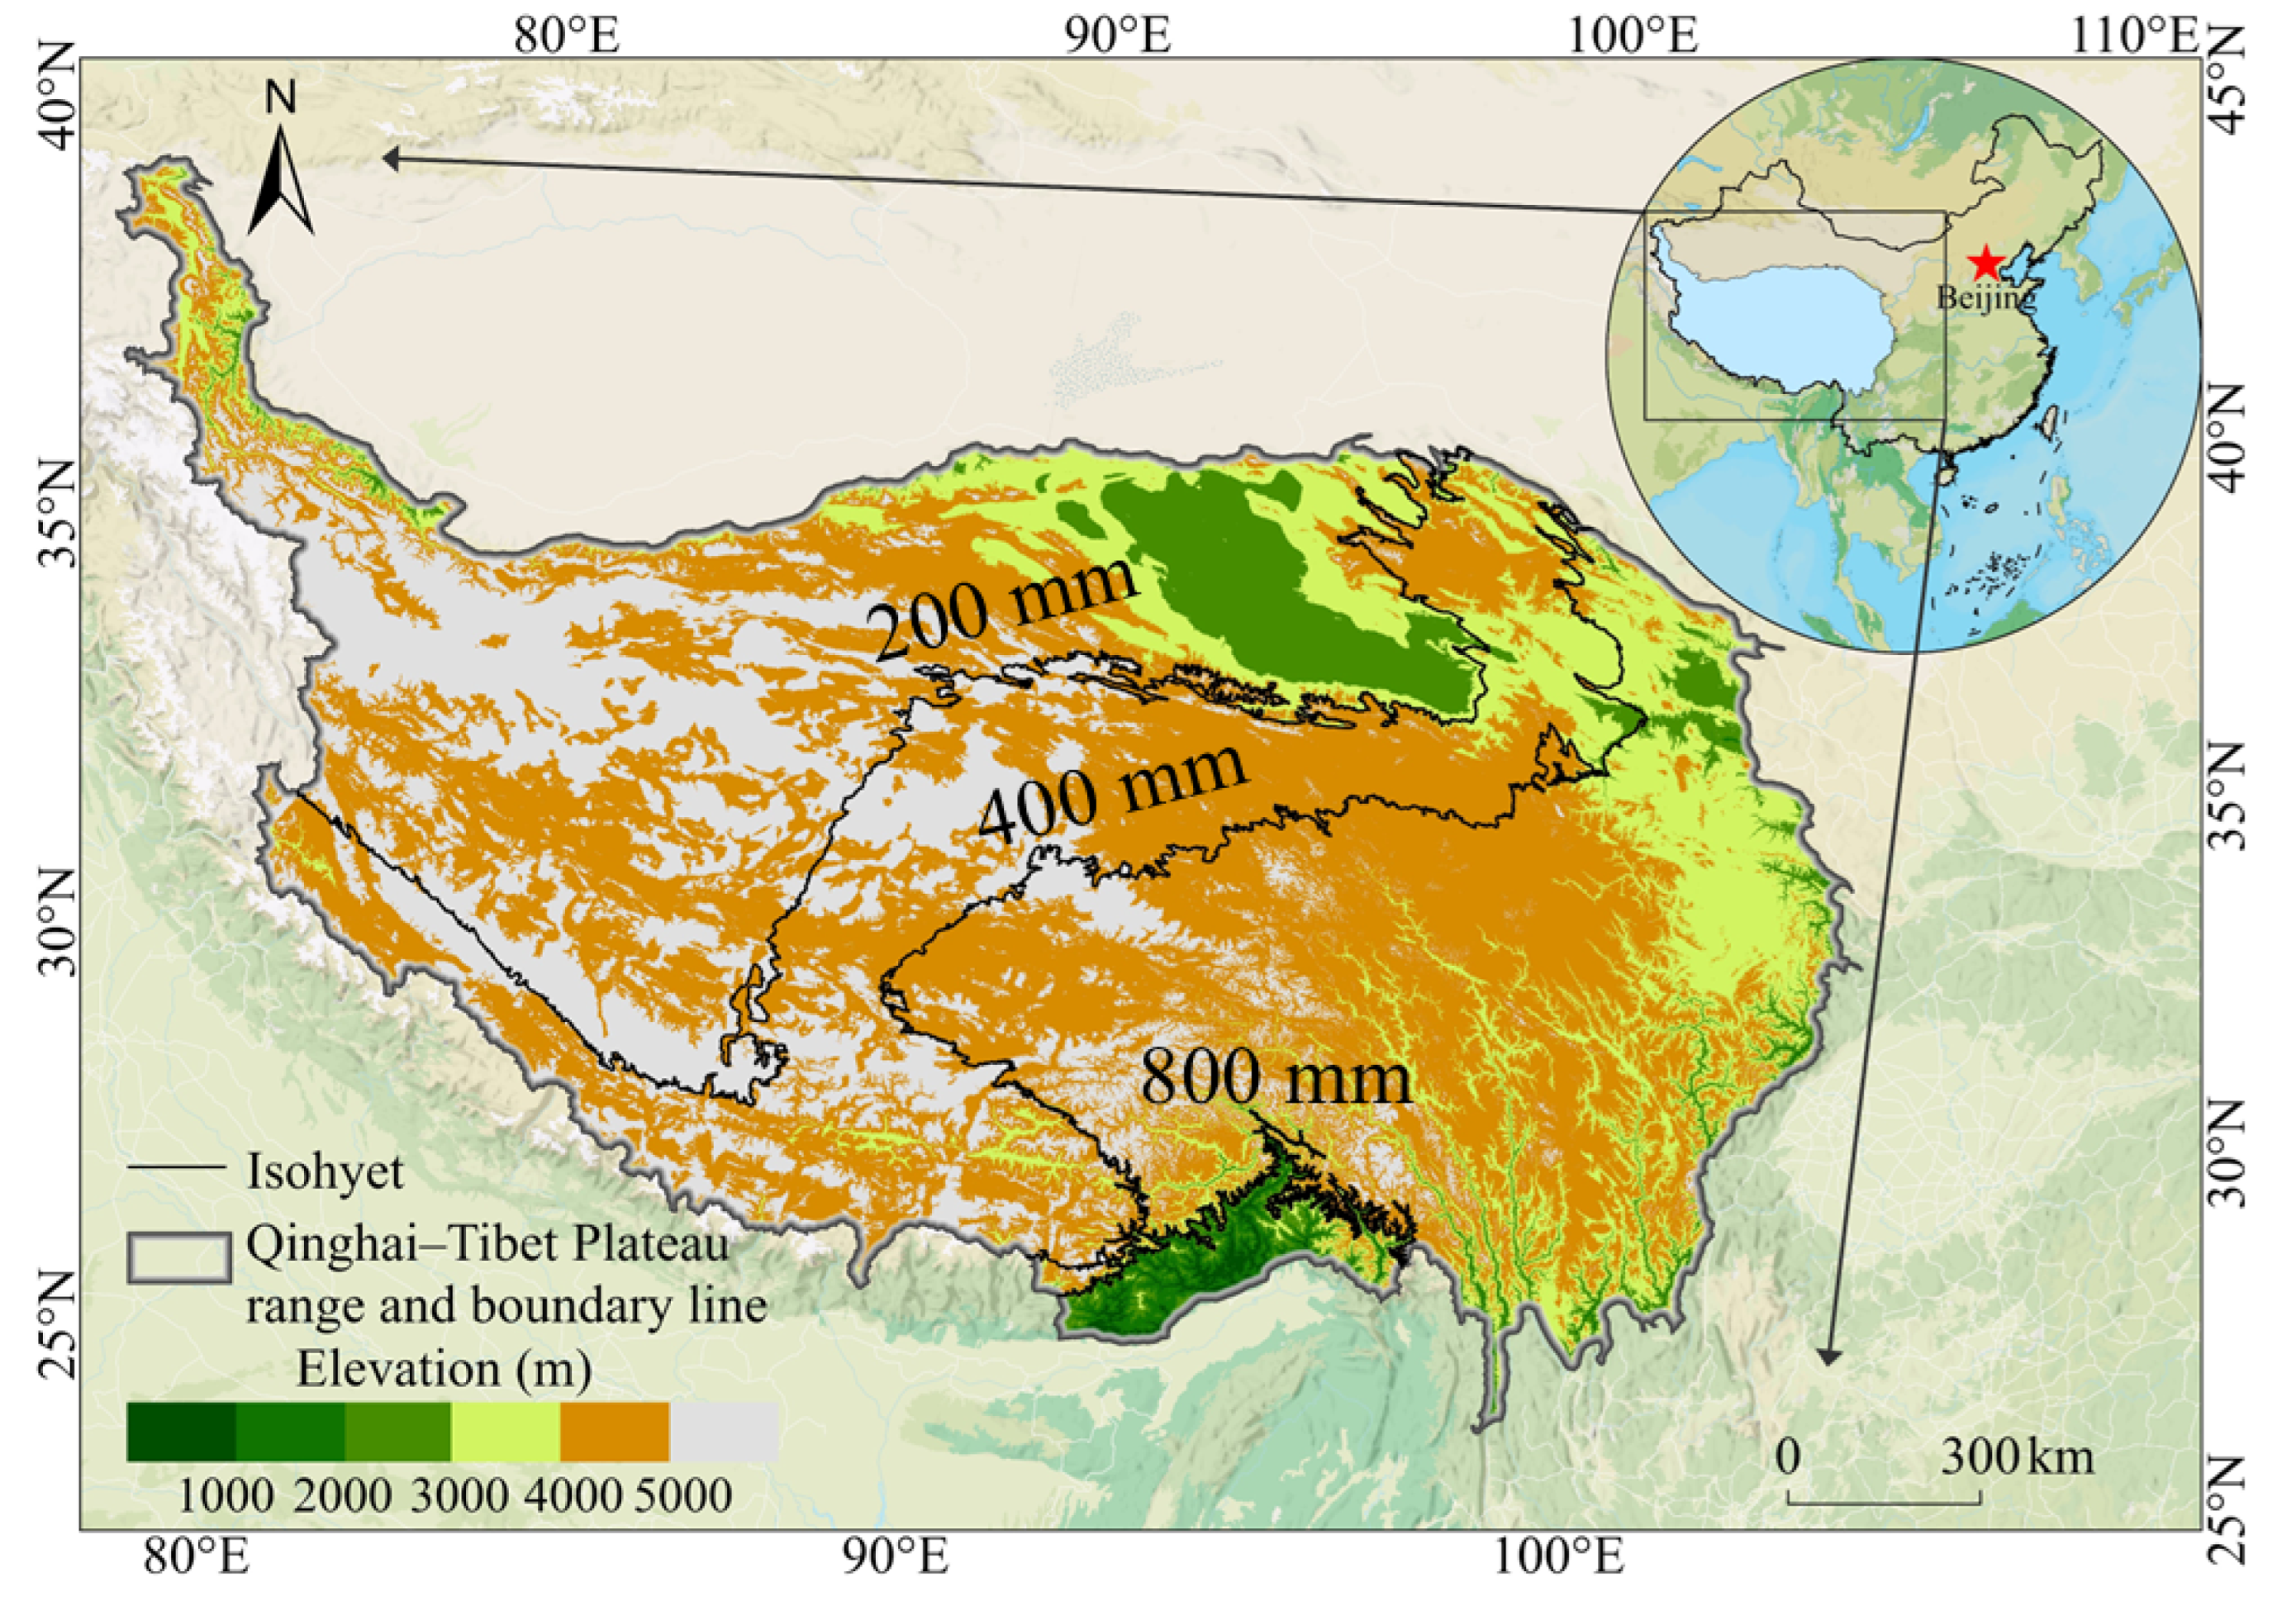
2.1. Study Area Description

The Qinghai–Tibet Plateau is a vast area, with complex and varied topography and large local relief, accounting for 26.80% of China’s total land area, ranging from 26°00′12″ N to 39°46′50″ N, 73°18′52″ E to 104°46′59″ E, with an area of 2.57 × 10⁶ km2 [28]. The spatial variability of precipitation on the Qinghai–Tibet plateau is large and shows a decreasing trend from southeast to northwest [29,30], as shown in Figure 1.
The Qinghai–Tibet Plateau, the “Water Tower of Asia”, is the source of many of Asia’s great rivers. The plateau itself is home to a large number of glaciers, snow, and lakes, which serve the function of a “storage pool” [31]. Regarding the rivers originating in the plateau, the recharge of runoff mainly comes from precipitation, glacial meltwater, and groundwater in three ways, of which precipitation recharge is the main source of recharge of the annual runoff in the Yellow River, Yangtze River, Lancang River, Nujiang River, and Yarlung Tsangpo River; the ecosystem depends on the abundance of water resources, which also mainly come from precipitation, with a contribution rate of 65–78% [32]. However, due to climate change, the water resources pattern in the plateau has changed significantly, which has a knock-on effect on the surrounding ecosystems. In regard to vegetation community types, such as alpine grasslands and alpine meadows, precipitation indirectly affects the composition and structure of plant communities, and species richness and diversity at the sample zone scale show a significant increase in relation to precipitation [33]. For wetland ecosystems, plateau wetlands were at risk of degradation at an overall rate of −0.13%/a during 1990–2006, which also threatens the habitat of rare species, such as black-necked cranes [34]. In addition, accelerated snowmelt from glaciers can exacerbate water scarcity in basin countries, challenging water security and sustainable socio-economic development [35]. Given the critical position of the Qinghai–Tibet Plateau in Asia’s water resources system and the important contribution of precipitation to the recharge of regional rivers, this study on precipitation variability on the Qinghai–Tibet Plateau is of great scientific value and practical significance.

2.2. Data Sources, Accuracy Validation, and Preprocessing

2.2.1. DEM Data

Derived from the SRTMDEMUTM 90 m resolution digital elevation data product, provided by Geospatial Data Cloud (https://www.gscloud.cn/ (accessed on 26 July 2024)), and extracted through the use of masking, according to the Qinghai–Tibet Plateau boundary data (the boundary data of the Qinghai–Tibet Plateau used in this study was obtained from [27], which has been widely used in subsequent studies and has become an important reference for geographic studies of the Qinghai–Tibet Plateau).

2.2.2. Multi-Year Average Precipitation Data

The precipitation data are obtained from the National Earth System Science Data Center (https://www.geodata.cn/ (accessed on 26 May 2024)), with a spatial resolution of 1 km, for the period of 1901–2023. In this paper, the precipitation raster data for the period of 1961–2023 are selected as the basic data for this study, and the sliding average method is applied to divide the 63 years from 1961–2023 into four inter-decadal series, which are 1961–1990 (time period ①), 1971–2000 (time period ②), 1981–2010 (time period ③), and 1991–2023 (time period ④).

2.2.3. Accuracy Validation of the Data

This dataset was validated for accuracy by the producer during the early stages of its existence, which was conducted by combining the 30′CRU time-series dataset with the WorldClim climate dataset and scaled using Delta spatial downscaling, and then the simulation results were evaluated for accuracy using the observations from 496 weather stations. Compared with the original CRU dataset, the accuracy of this dataset is significantly improved: the mean absolute error (MAE) of the PRE (precipitation) is reduced by 25.7%; the root mean square error (RMSE) of the PRE is reduced by 25.8%; the Nash–Sutcliffe efficiency coefficient (NSE) of the PRE is improved by 31.6%; and the correlation coefficient of the PRE is improved by 5.0%. New datasets provide detailed climate data and annual trends that can be validated effectively by weather station observations [36].

2.2.4. Data Preprocessing

The downloaded month-by-month precipitation data (NetCDF format) were converted into year-by-year precipitation data, from 1961 to 2023, by creating a raster layer through the use of ArcGIS and extracting each month’s precipitation, according to the different bands, and converting them via the raster calculator. The sliding average method was applied to divide the 63-year data into four inter-decadal series and calculate the multi-year average precipitation for each of the four periods. The processed precipitation data were extracted into 200 mm and 400 mm isopach lines to further analyze the spatial distribution and spatial–temporal changes in the isopach lines.

2.3. Research Methodology

2.3.1. Contour Line Extraction

ArcGIS provides the Contour List tool to extract contours from raster data. This tool generates contour lines (or precipitation contour lines) based on the pixel values in the raster data. The 200 mm and 400 mm isohyet vectors are generated on the basis of the annual precipitation raster map, using the tool in terms of the “contour list”, and the vector maps are secondarily processed to filter out the shorter arc segments that cannot be used to represent the isohyets, and the isohyets with the largest latitudinal extension span and the strongest arc segment coherence are identified as the final selected isohyets. The isohyet with the largest latitudinal spread and the strongest arc segment coherence is identified as the final isohyet that is selected for subsequent studies.

2.3.2. Climate Trend Rate Method

The propensity rate (X) for site precipitation is generally expressed using a one-dimensional linear equation, which is given below:
X = a 0 + a 1 t
where a0 is a constant term; a1 is the proportionality coefficient, i.e., the linear trend term; and t denotes the ordinal number of the year. The value of a1 is generally scaled up by a factor of 10 to represent the climatic tendency rate of precipitation [37].

2.3.3. Mann–Kendall Abrupt Change Test

Based on the annual average precipitation time series x ( x 1 , x 2 , , x n ), construct an order, Sk:
S k = i = 1 k r i ,   k = 2 ,   3 ,   ,   n
Among them:
r i = 1 ,   x i > x j 0 ,   x i < x j                             j = 1 ,   2 ,   ,   i
Definition of the statistic:
U F k = s k E s k V a r s k k = 1 ,   2 ,   ,   n
In Equation (4), E(sk) = k (k − 1), Var(sk) = k (k − 1) (2k + 5)/72, and UF1 = 0.
UFk is a standard normal distribution, and at the significance level α, when UFk > Uα, then it indicates that the time series x has a significant trend. Then, according to Equation (4), UBk is calculated, so that UBk = UFk (k = n, n − 1, ……., 1), UB1 = 0, that is, two sets of time series UFk and UBk are obtained. If the focus of the UFk and UBk curves is between the critical line, the time corresponding to the point is the time when the mutation happens [38].

2.3.4. Centroid Tracking Method

In regard to ArcGIS spatial analysis, when studying the spatial movement of polygons from one region to another, it is often necessary to assign the variable of interest in the graph to a specific point, such as the center of mass or the center point, to serve as a “representative point” in the graph, so that it can be easily calculated and tracked. The center of mass is often defined in technical terms as the nominal centroid of an object or collection of objects. By analyzing the centroid of precipitation, the change characteristics of things can be observed from multiple dimensions. In regard to the spatial dimension, the centroid model can reflect the degree of fit between the regional development indicators and the analysis of the center of mass, which helps to analyze the spatial mobility and aggregation of regional elements. In regard to the time dimension, dynamic changes in the regional centroid reveal the contrasts and shifts in the distribution of regional factors, thus deepening the study of the history, status, and trends of regional development [39].
X ¯ = i = 1 n X i P i i = 1 n P i Y ¯ = i = 1 n Y i P i i = 1 n   P i
where X ¯ and Y ¯   are the coordinates of the centroid; Xi and Yi are the coordinates of the points on the spatial precipitation contour; Pi is the assignment of the spatial processing of the contour, which is used for the calculation of the spatial weight of the contour coordinate points, and the determination of the spatial centroid location is completed through the use of the spatial analysis module in ArcGIS 10.5 software [20].

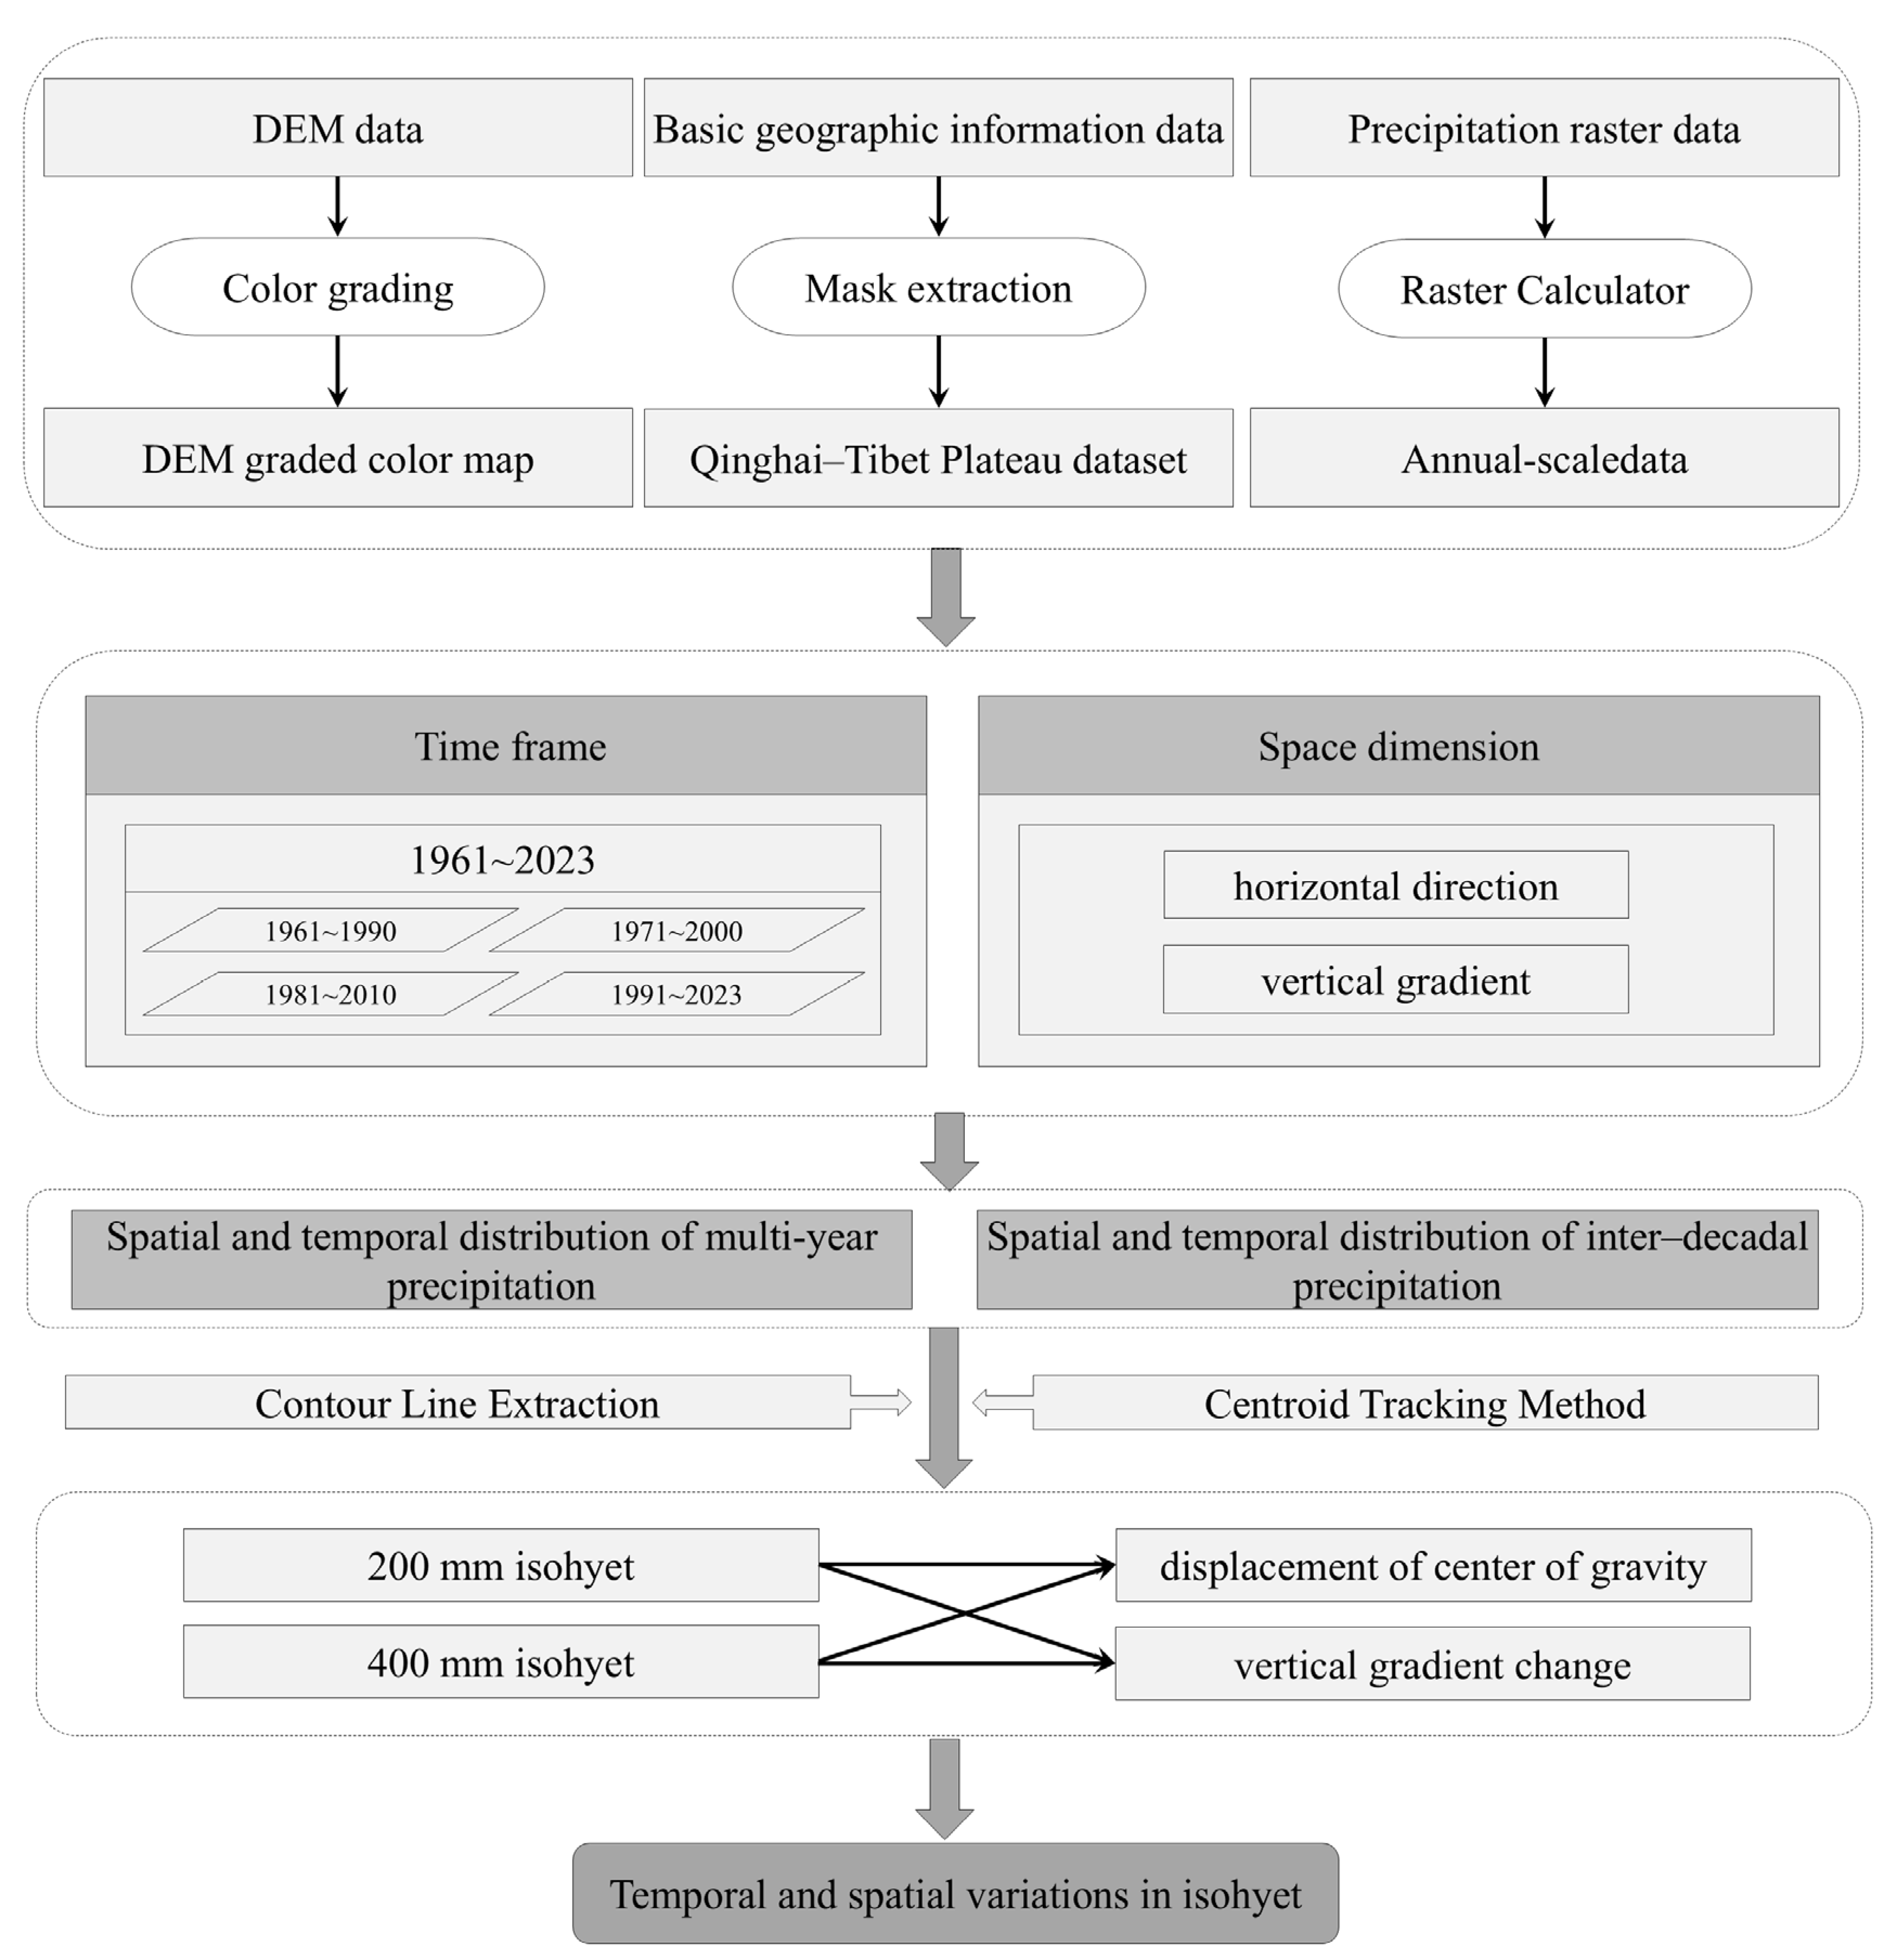
2.4. Technology Roadmap

As shown in Figure 2, this paper employs the methods of contour line extraction, the climate trend rate method, and the centroid tracking method to conduct the analysis efficiently.

3. Results

3.1. Spatiotemporal Distribution of Precipitation over the Qinghai–Tibet Plateau (1961–2023)

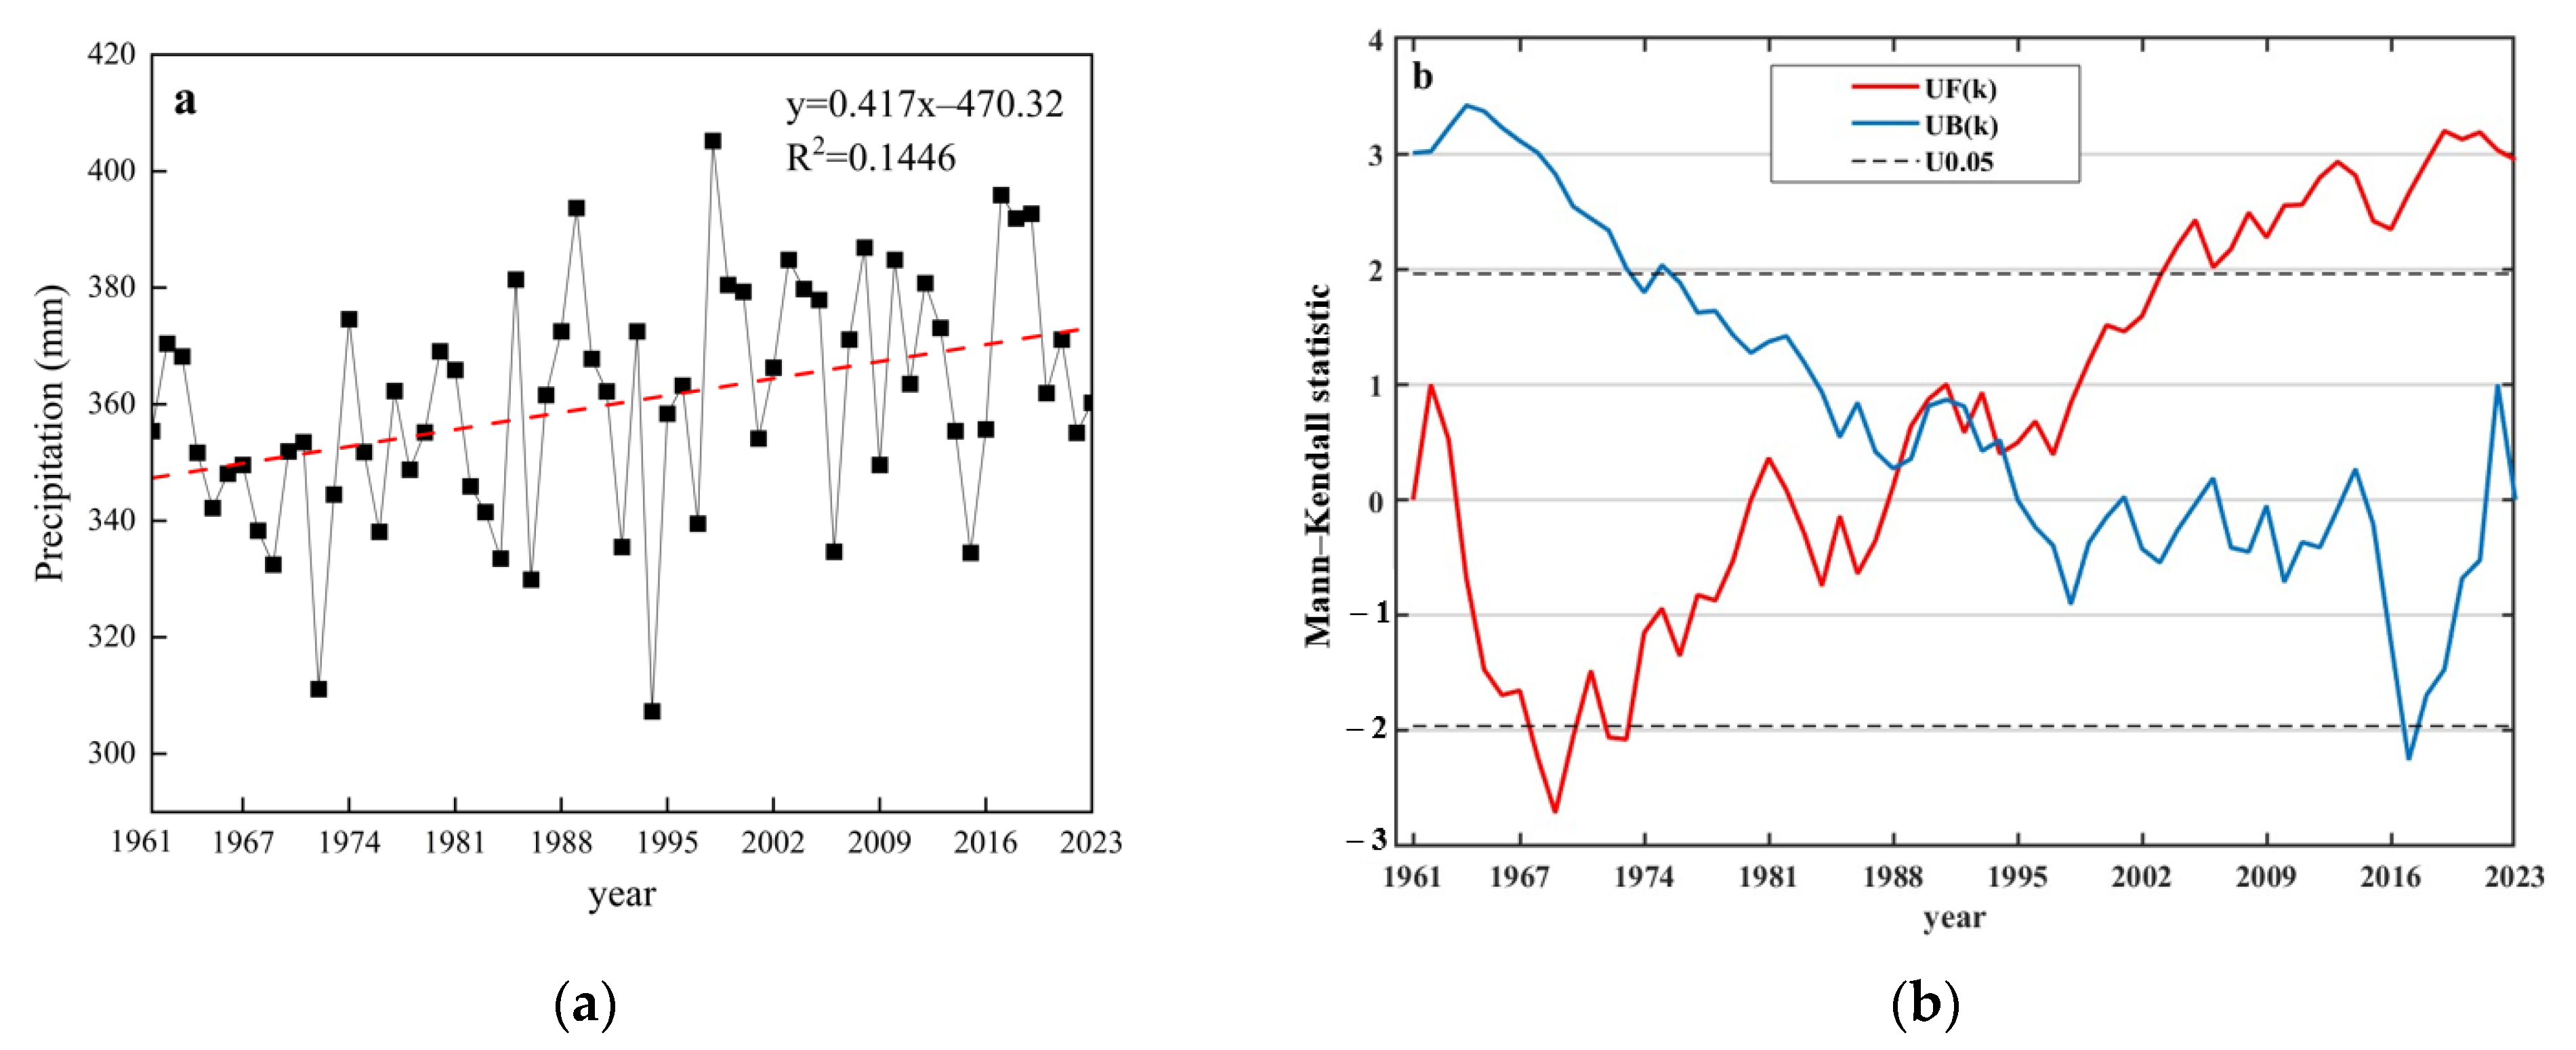
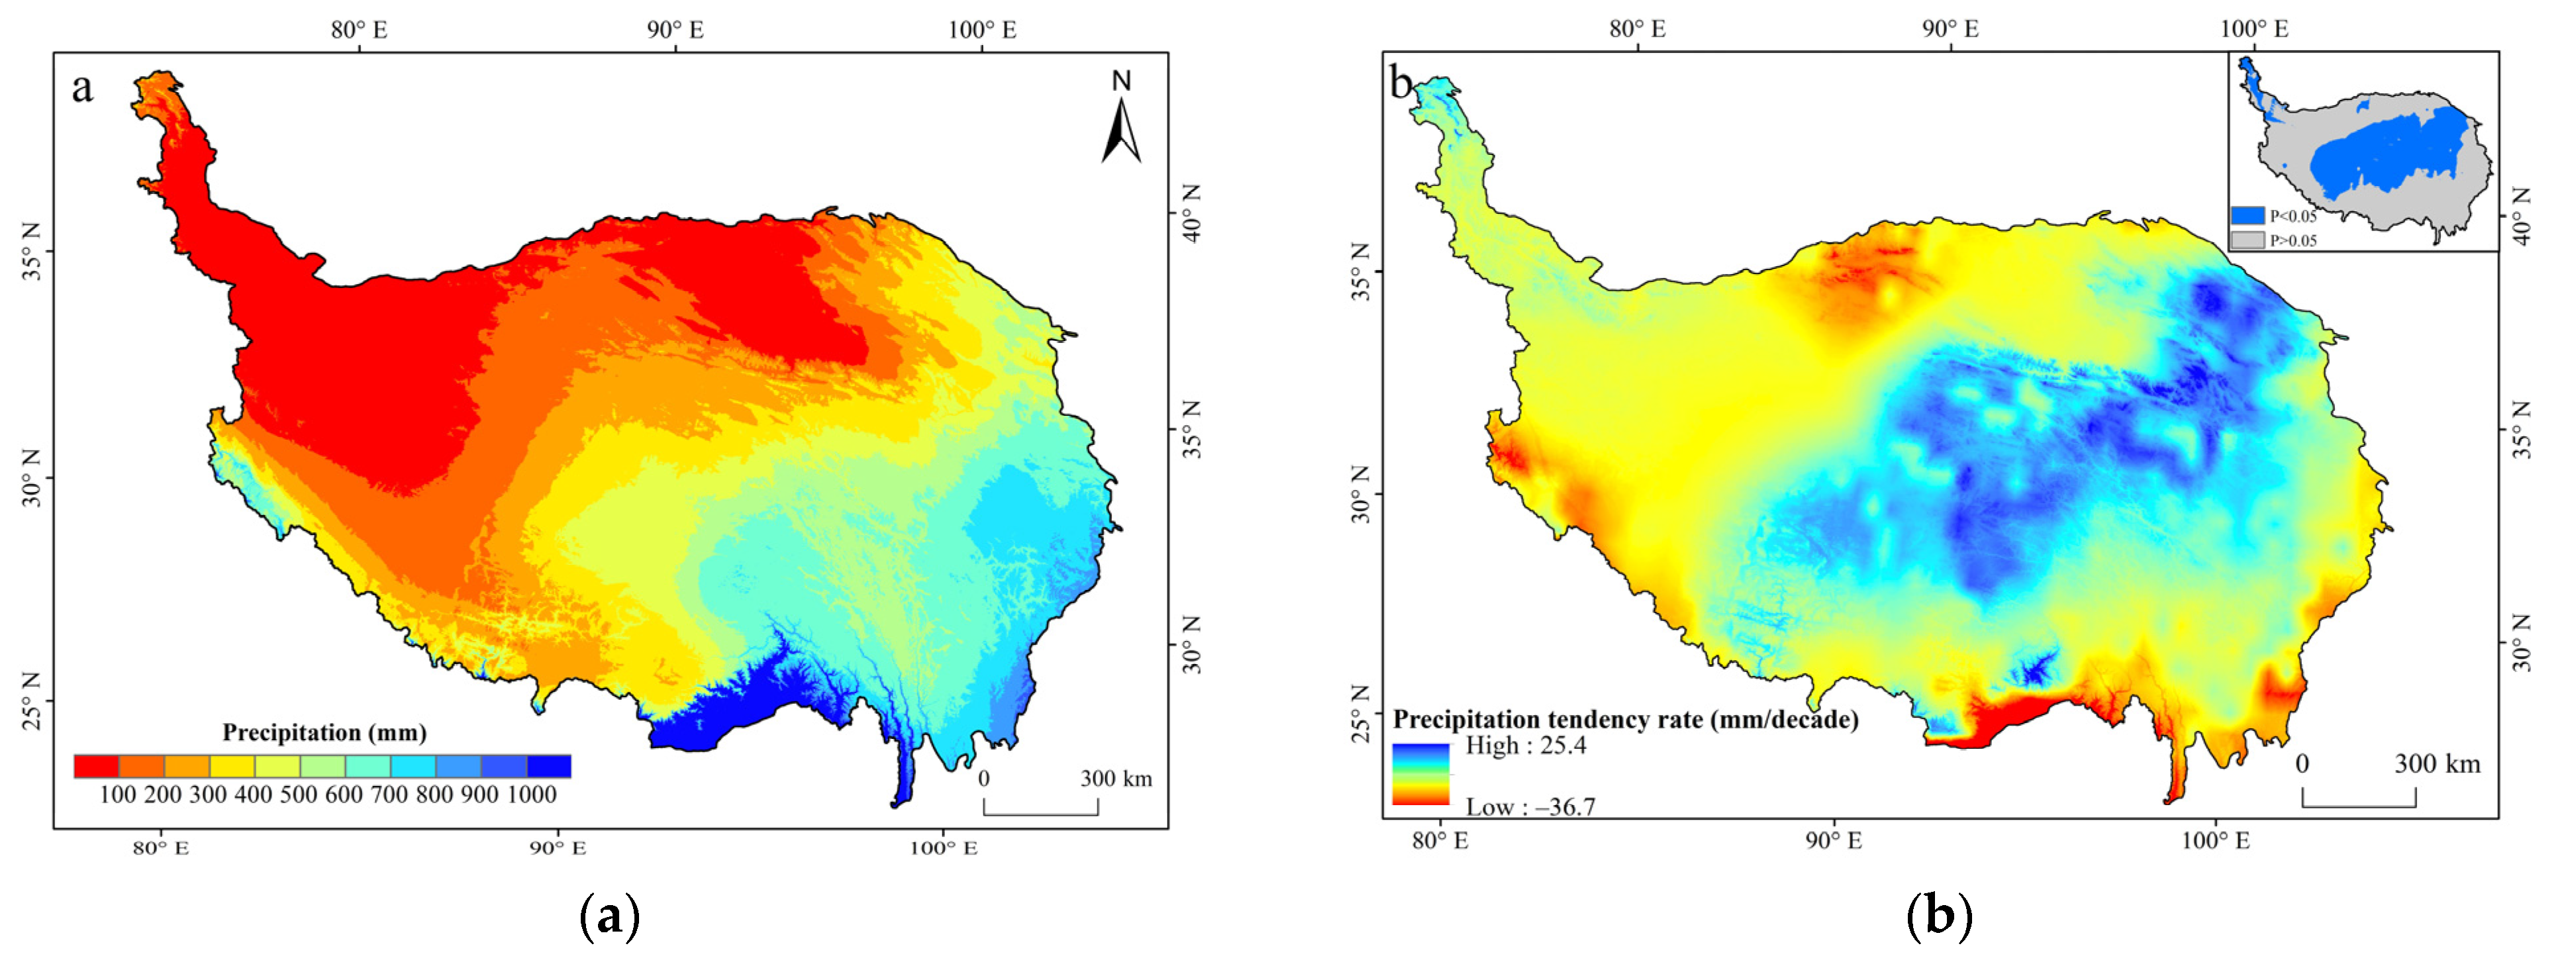
3.1.1. Long-Term Mean Precipitation and Interannual Variability

The interannual variation of the multi-year average precipitation on the Qinghai–Tibet Plateau from 1961 to 2023 was analyzed, as shown in Figure 3a; the multi-year average of the annual precipitation was 360.3 mm/a, with the highest annual precipitation of 405.2 mm in 1998 and the lowest of 307.3 mm in 1994, and a difference of 97.9 mm between the highest and lowest values. From 1961 to 2023, the annual precipitation exhibited substantial fluctuations, which led to a non-significant trend. The calculated climatic trend rate of the annual precipitation was 4.17 mm per decade, accompanied by a coefficient of determination (R2) of 0.1446, but it was not significant. From the results of the Mann–Kendall Abrupt Change Test for the annual precipitation time series in Figure 3b, at the 0.05 significance level, before 1995, there was a trend of gradual dryness. After 1995, it showed a trend of gradual wetness. The “wetting” of the Qinghai–Tibet Plateau with increasing global warming and humidification is consistent with existing studies of precipitation trends on the Qinghai–Tibet Plateau, based on meteorological station data [40].
The spatial distribution characteristics of the annual precipitation on the Qinghai–Tibet Plateau align with the zonal law of precipitation in the dry and humidity regions [41]. As depicted in Figure 4a, the precipitation exhibits a decreasing trend from the southeast to the northwest. Figure 4b illustrates the climatic tendency rate of the annual precipitation, indicating that it ranges from −36.7 mm to 25.4 mm per decade across the plateau. With the exception of the regions south of the Himalayas and the south–central Altyn–Taghin the southern part of the plateau, the climatic tendency slopes of the annual precipitation in the Qilian Mountains region in the central part of the plateau, the southern plateau of Qinghai Province, and the eastern part of the Qiangtang Plateau show a significant increasing trend (p < 0.05). Statistically, the area with a significance level of p < 0.05 is calculated to be 9.89 × 10⁵ km2, while the area with p > 0.05 is 1.58 × 10⁶ km2, creating a notable disparity in both the spatial distribution and area proportion between the two.

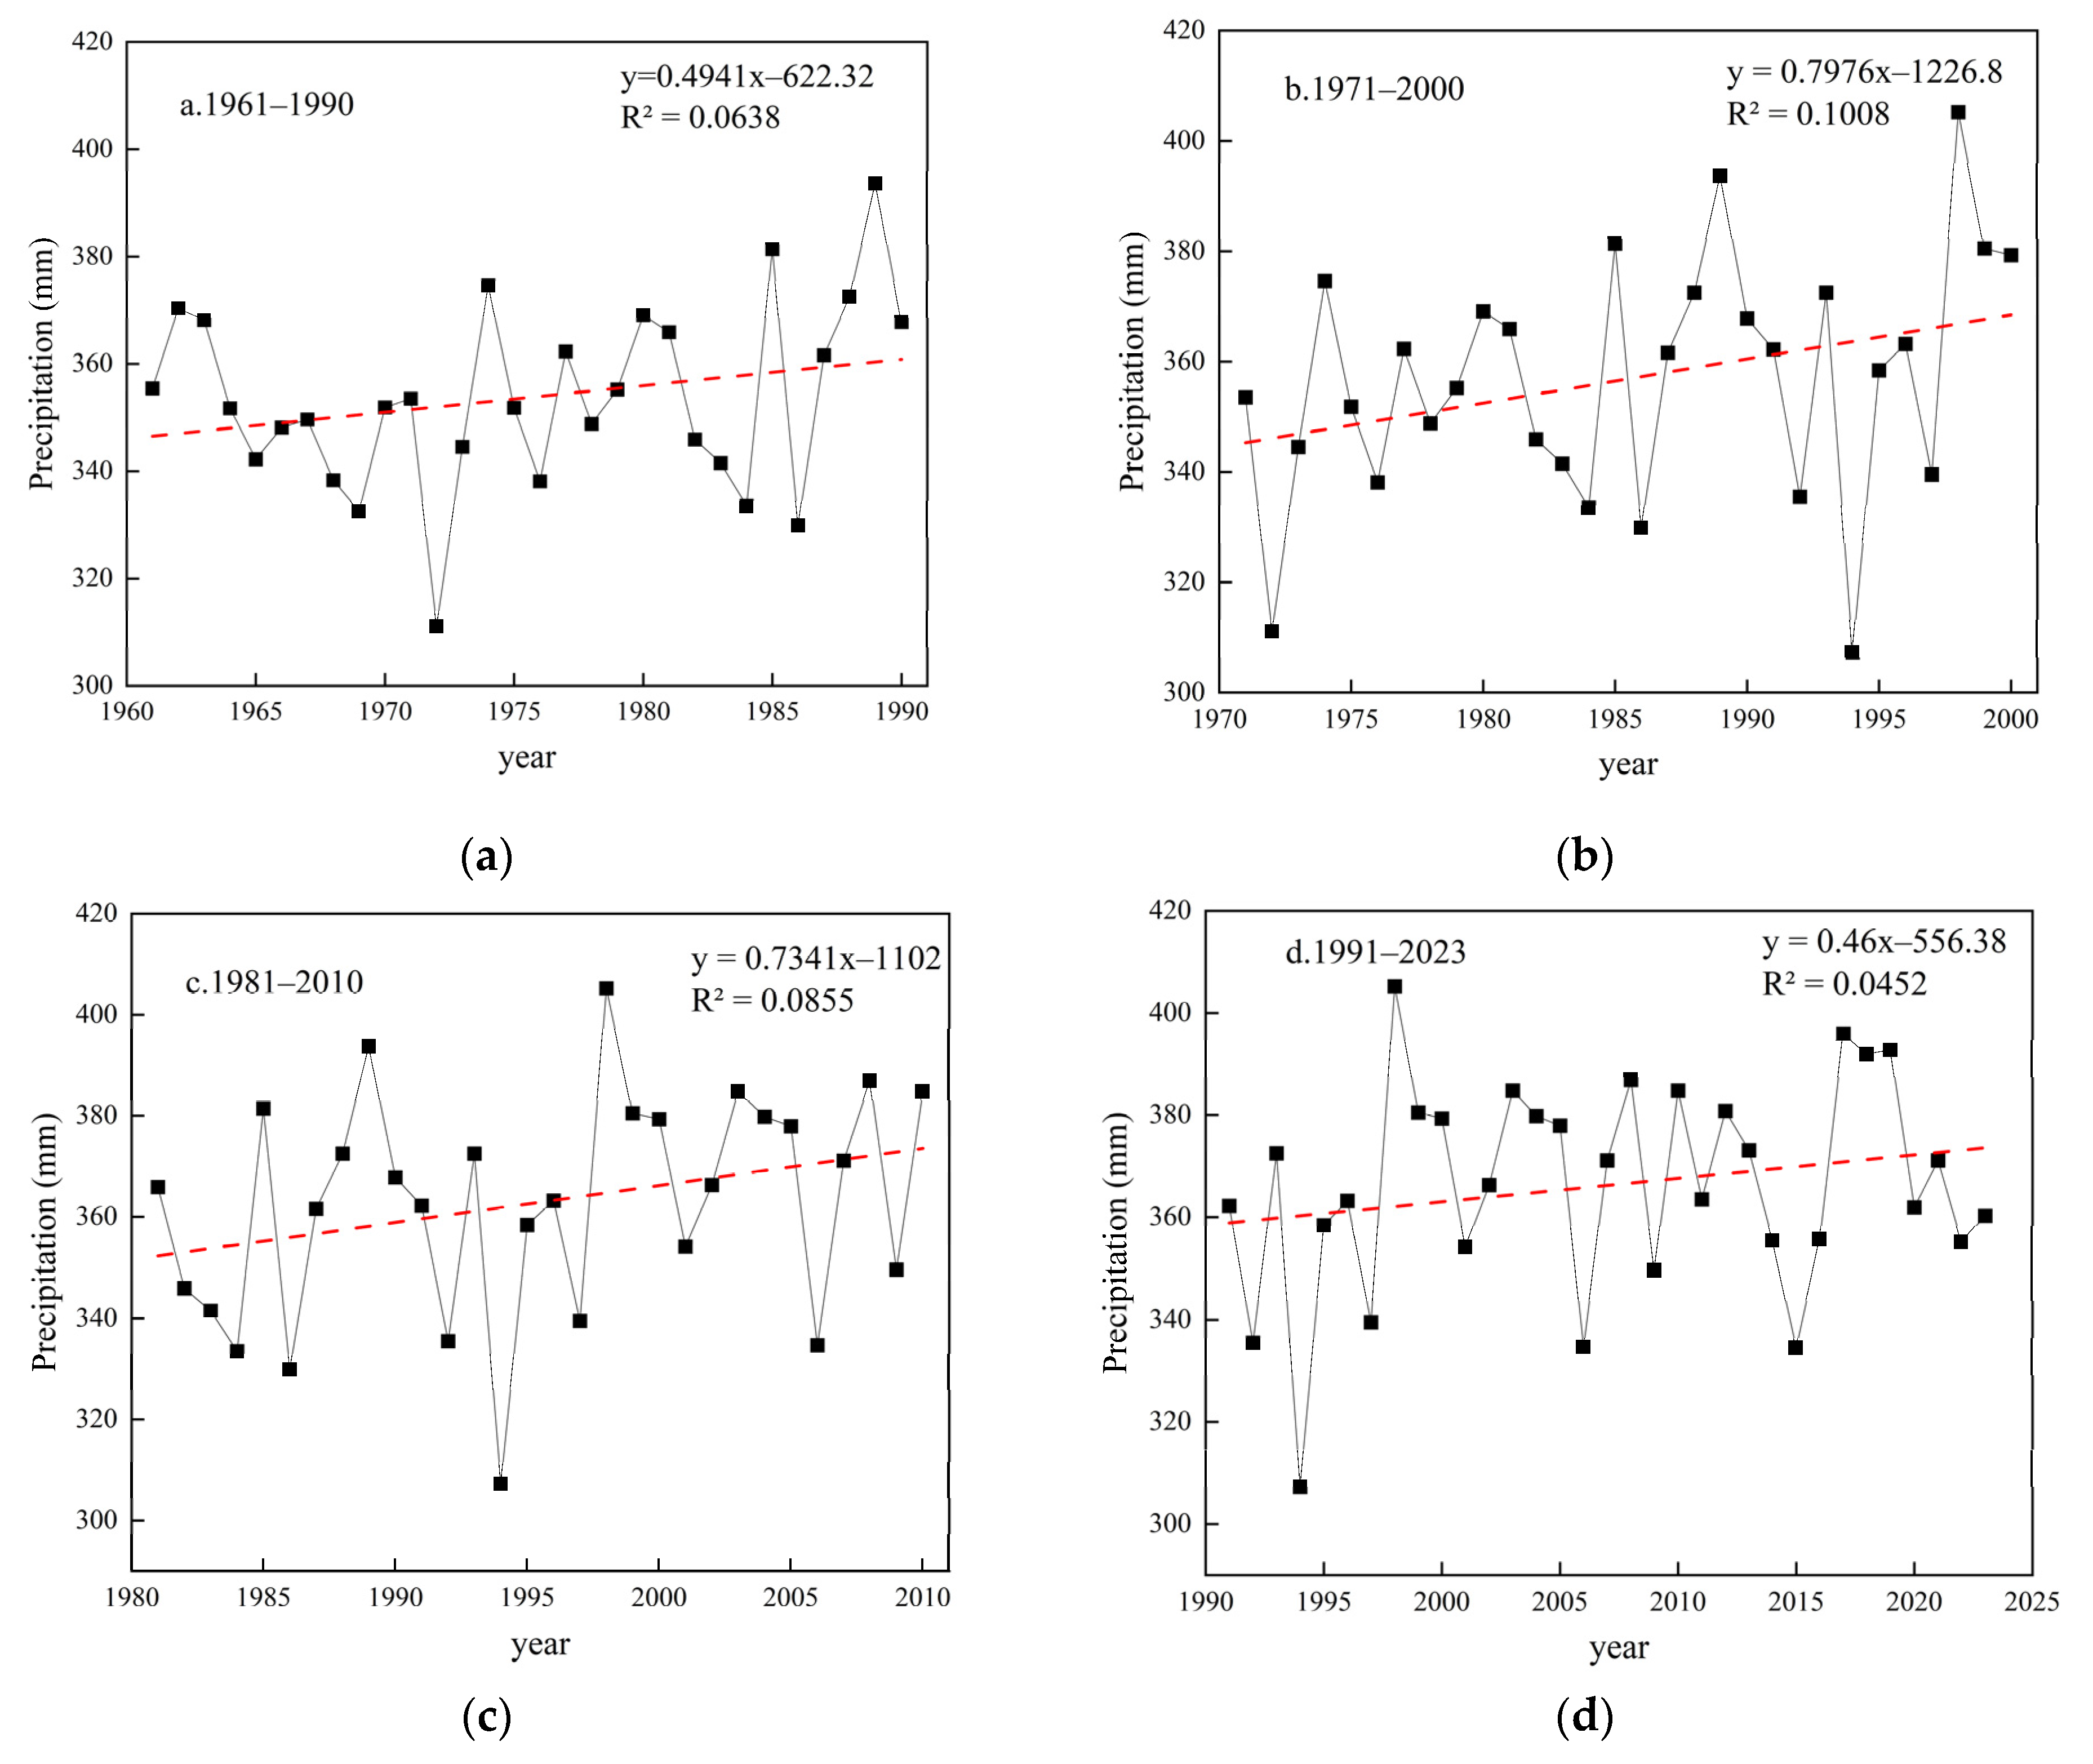
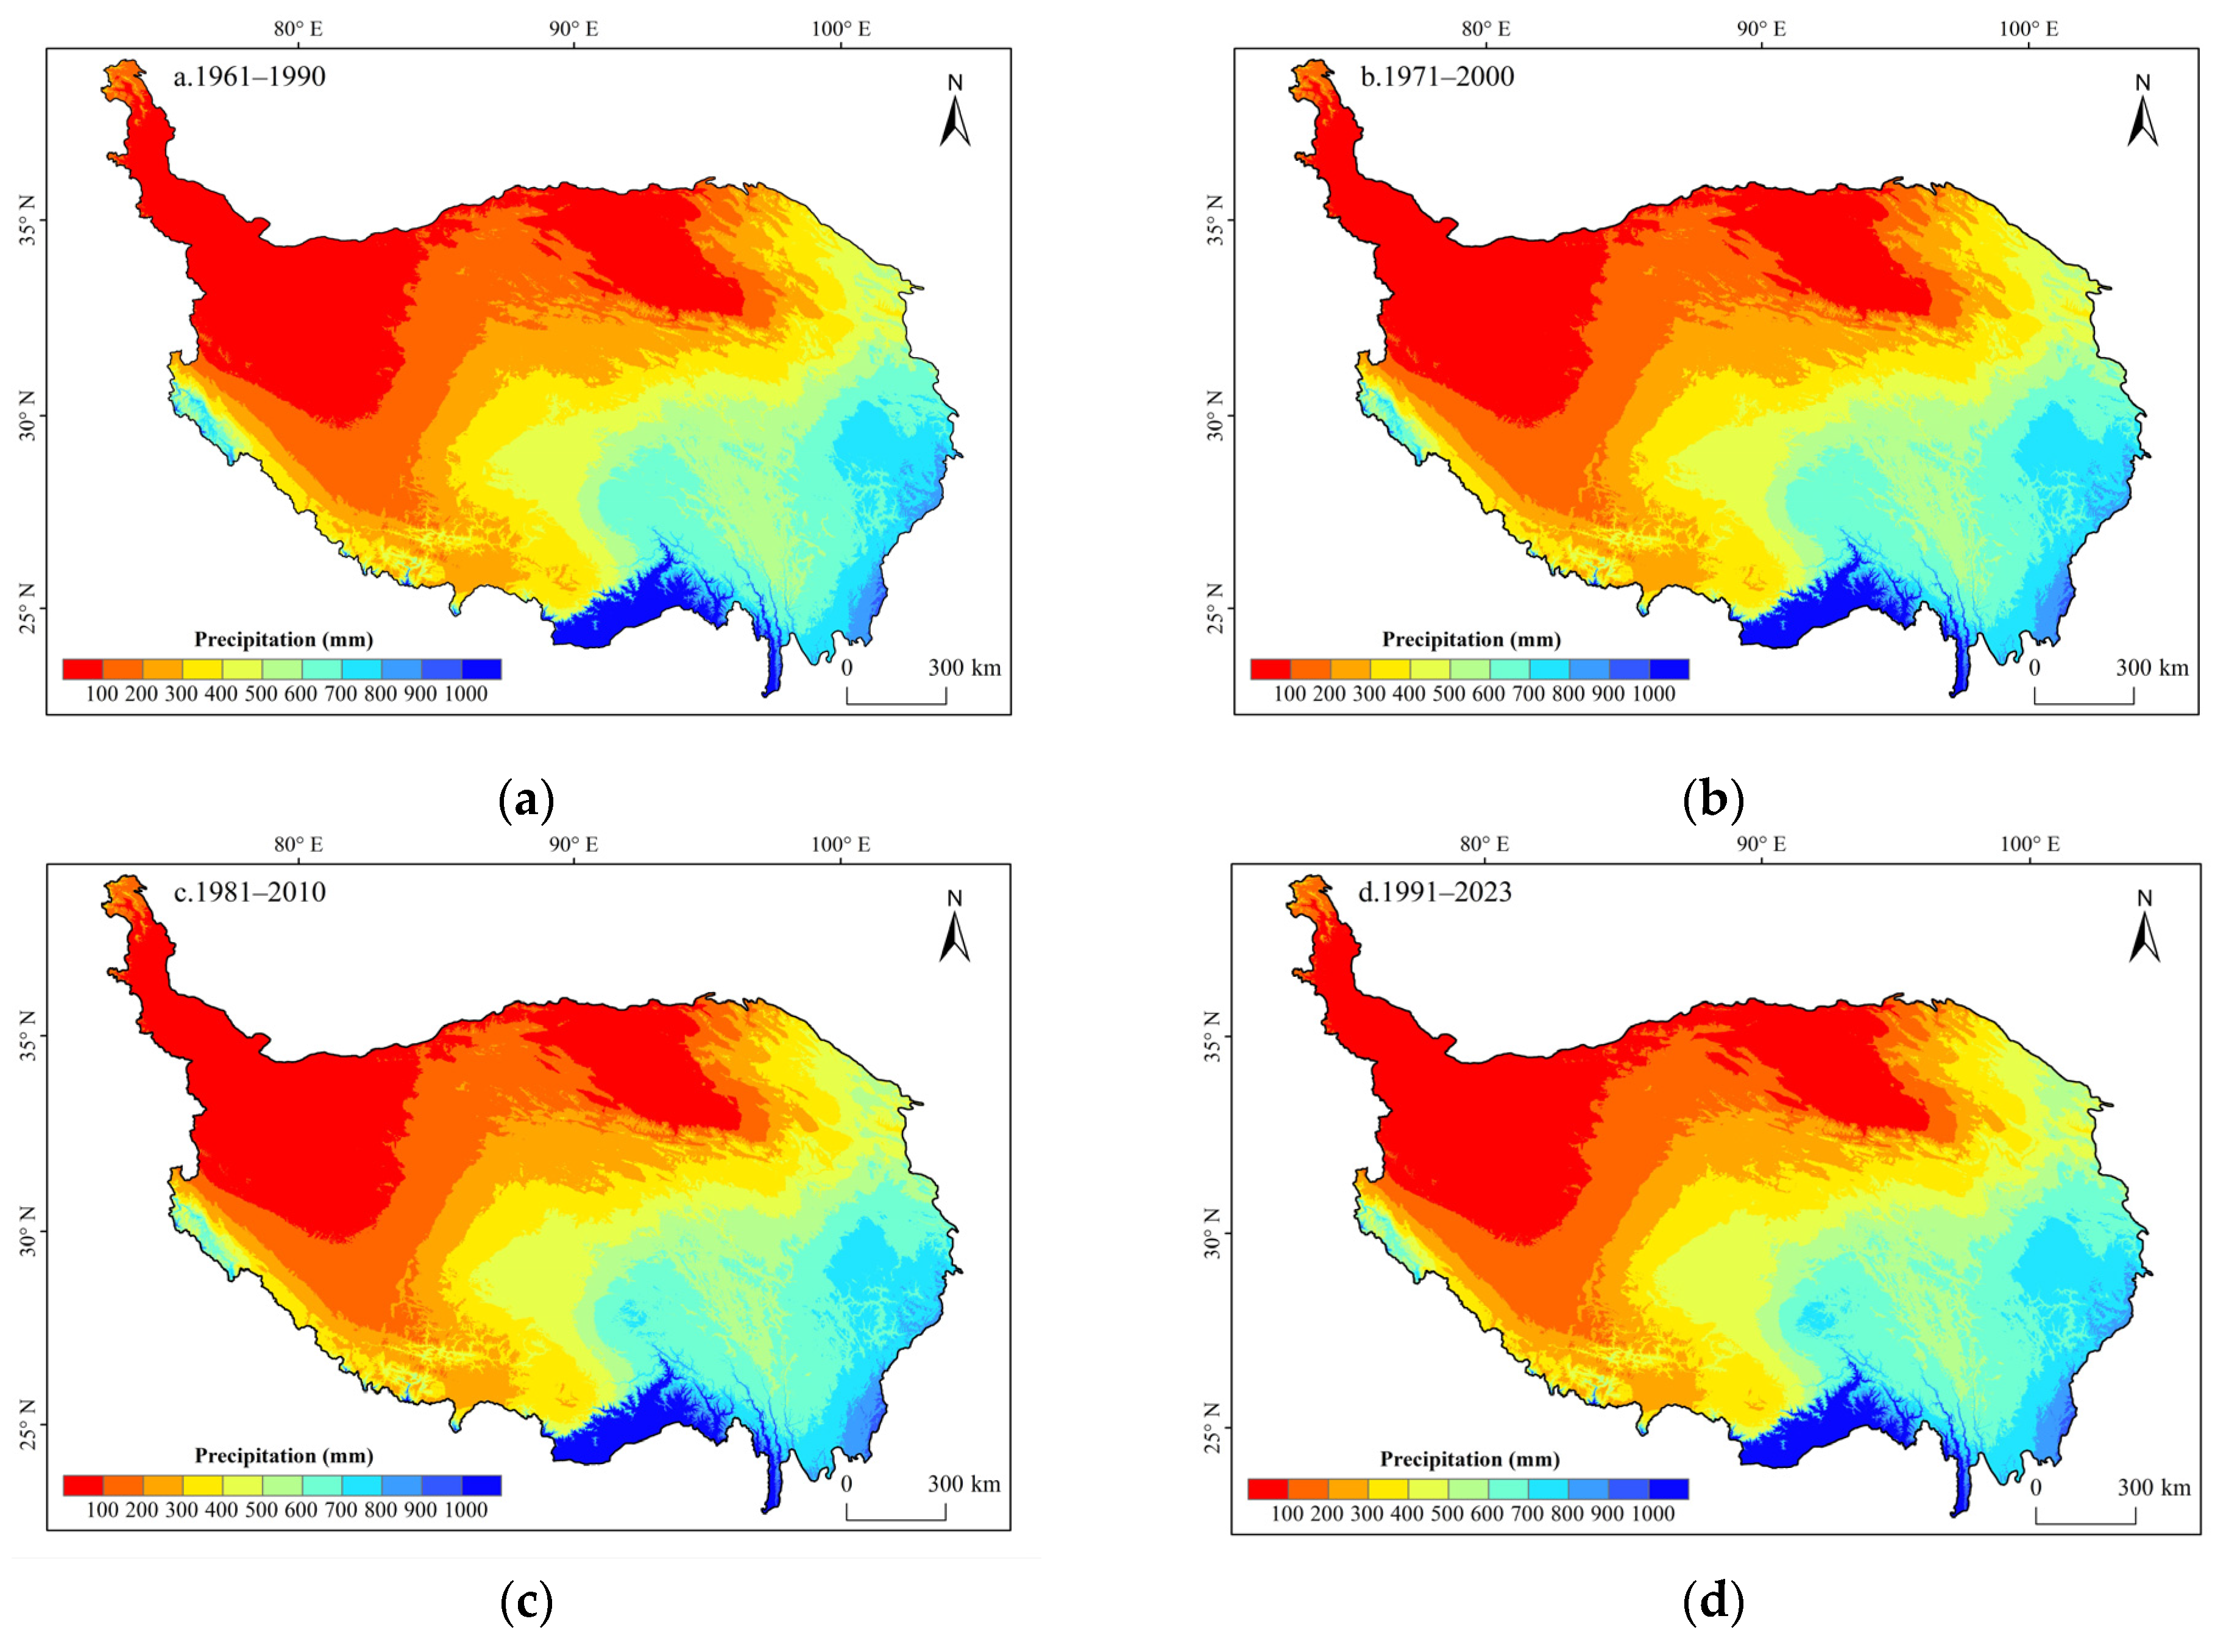
3.1.2. The Spatiotemporal Distribution of Multi-Decadal Average Precipitation for Four Periods

We applied the previously mentioned time division method, namely the moving average method, which divides the time series into different time periods based on certain rules or characteristics in order to better analyze and understand the changing patterns and characteristics of the data at different stages. Therefore, the average annual precipitation in the Qinghai–Tibet Plateau over 63 years was divided into four periods, and the spatial and temporal distribution of the average annual precipitation in each period was analyzed [42]. In terms of temporal changes, as shown in Figure 5, the climatic propensity rate of the annual mean precipitation showed an increasing trend during all four periods, but the results showed variability during the different periods. The climatic tendency rates for the four periods were 4.94 mm/decade (1961–1990), 7.98 mm/decade (1971–2000), 7.34 mm/decade (1981–2010), and 4.60 mm/decade (1991–2023), but none of them had high precipitation significance. The increasing trend in precipitation from 1971 to 2000 is due to the occurrence of two high values of annual precipitation in that period, namely 393.7 mm in 1989 and 405.2 mm in 1998. And the study found that 1998 was the year with the highest precipitation [43,44]. The increasing trend of precipitation from 1991 to 2023 was found to have slowed down compared to the previous period.
In terms of spatial changes, as shown in Figure 6, the annual precipitation during the four time periods shows a gradually decreasing distribution from southeast to northwest. There are differences in the movement characteristics at different spatial scales: the annual precipitation increases along the southern plateau of Qinghai Province, Nianqing Tanggula Mountains, Qilian Mountains, southeastern Hengduan Mountains, and Qaidam Basin, and decreases south of the Himalayas.

3.2. Spatial and Temporal Distribution of Iso-Precipitation Line and Its Centroid over the Qinghai–Tibet Plateau from 1961 to 2023

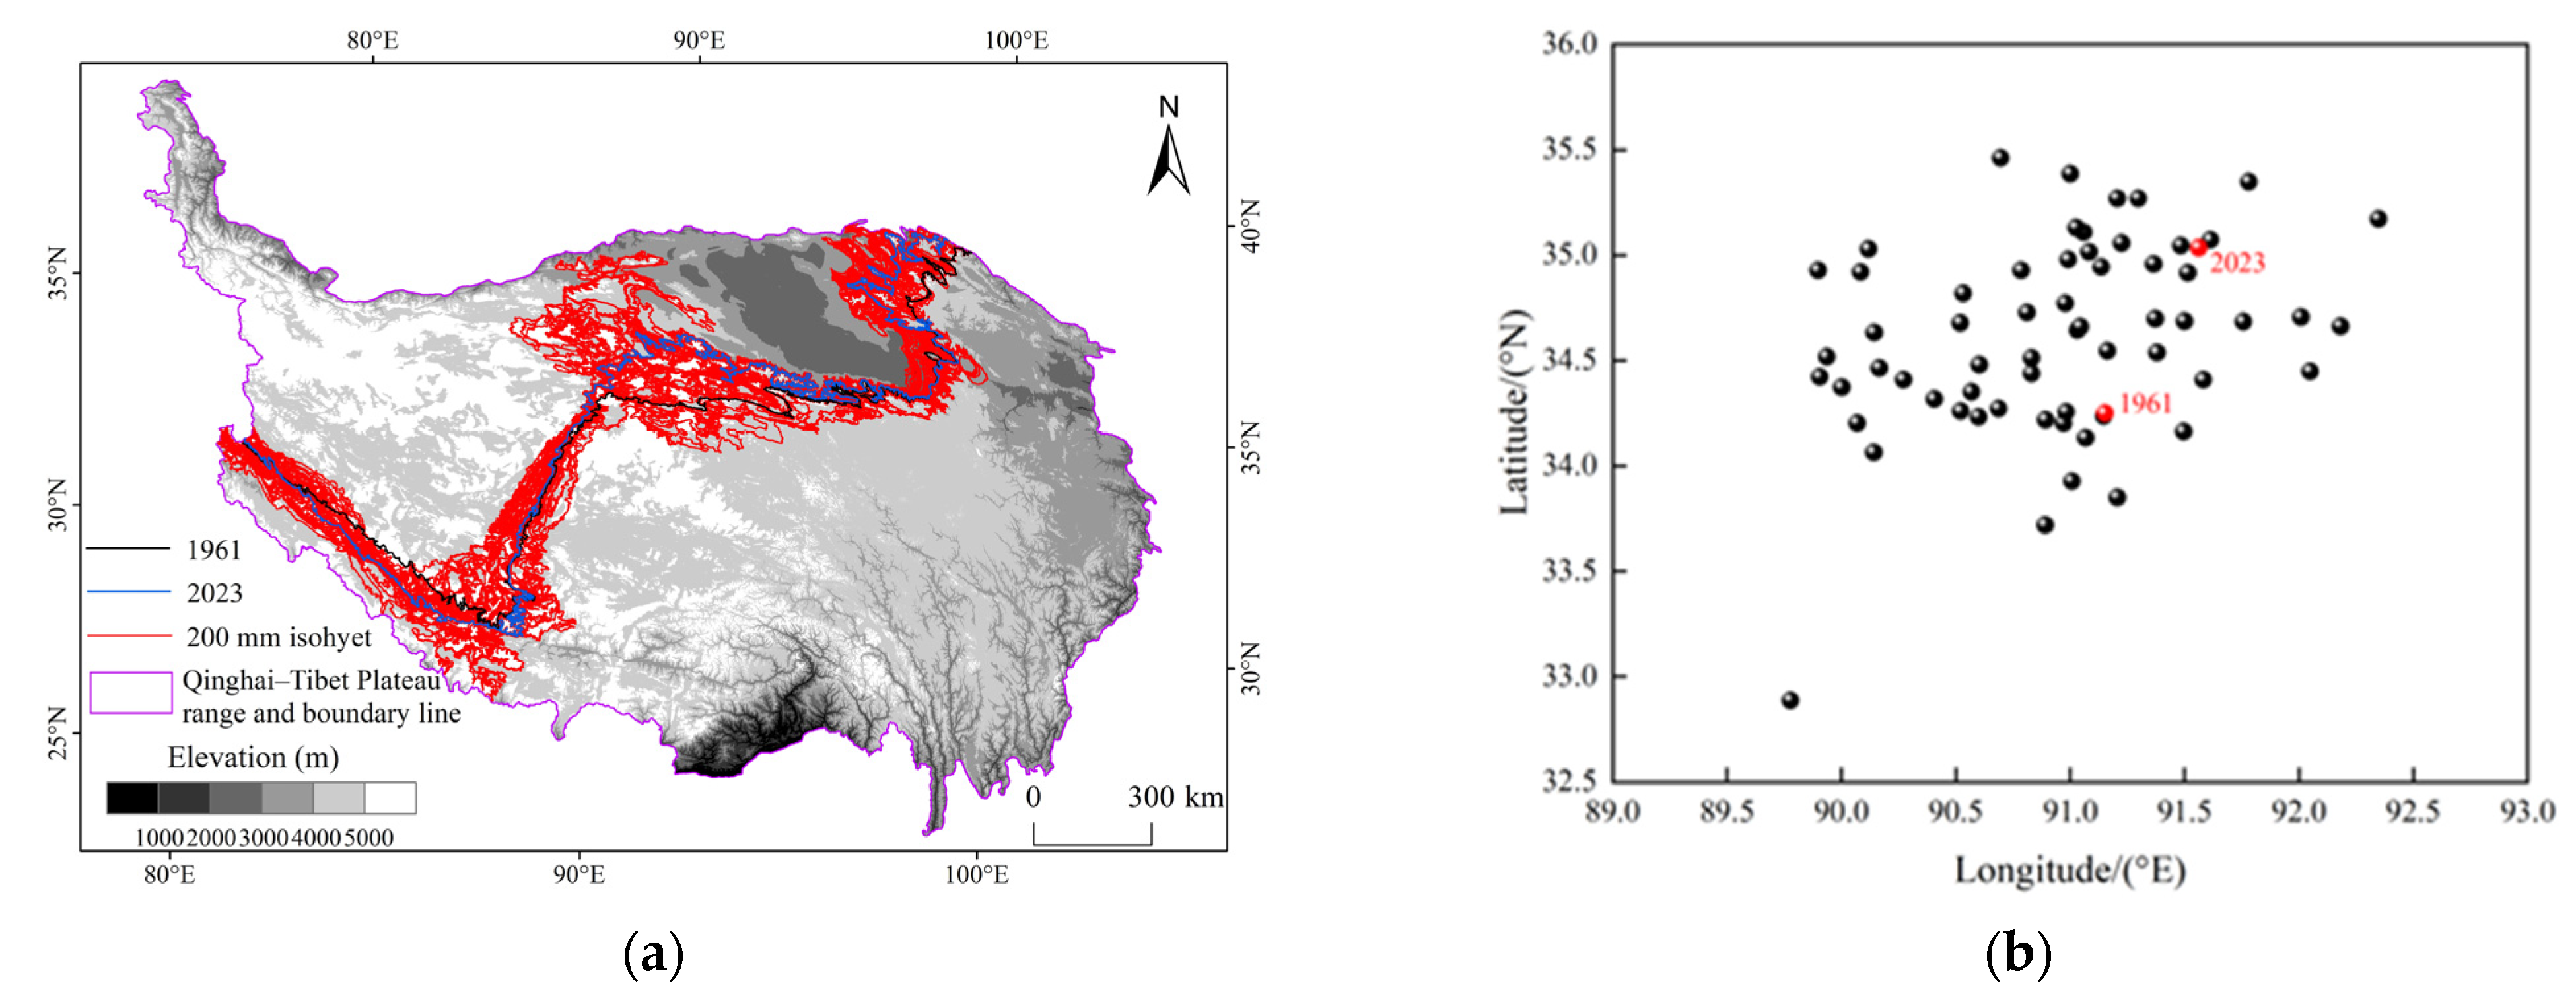
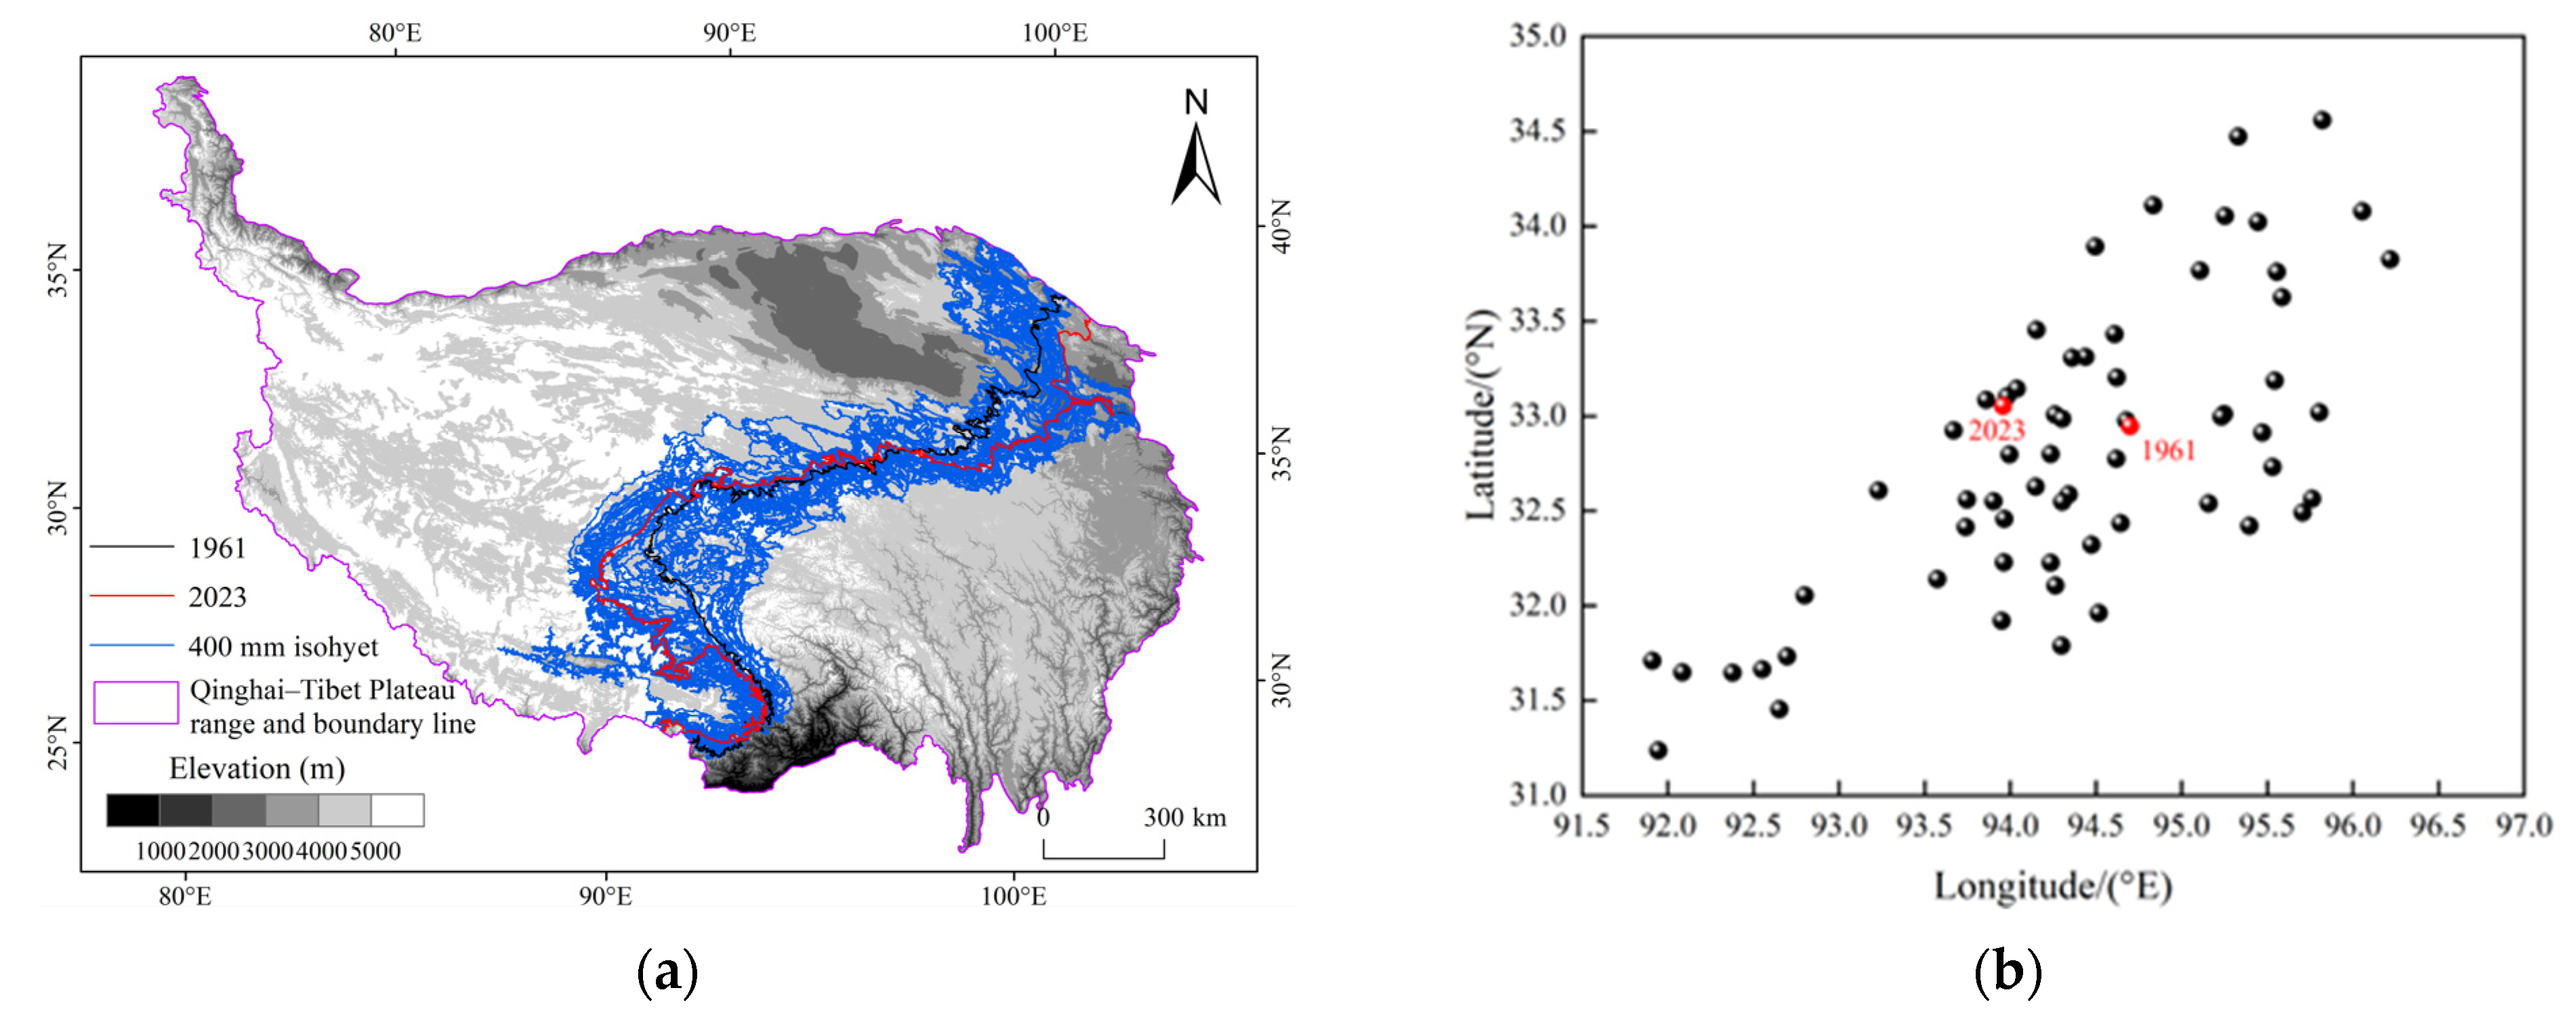
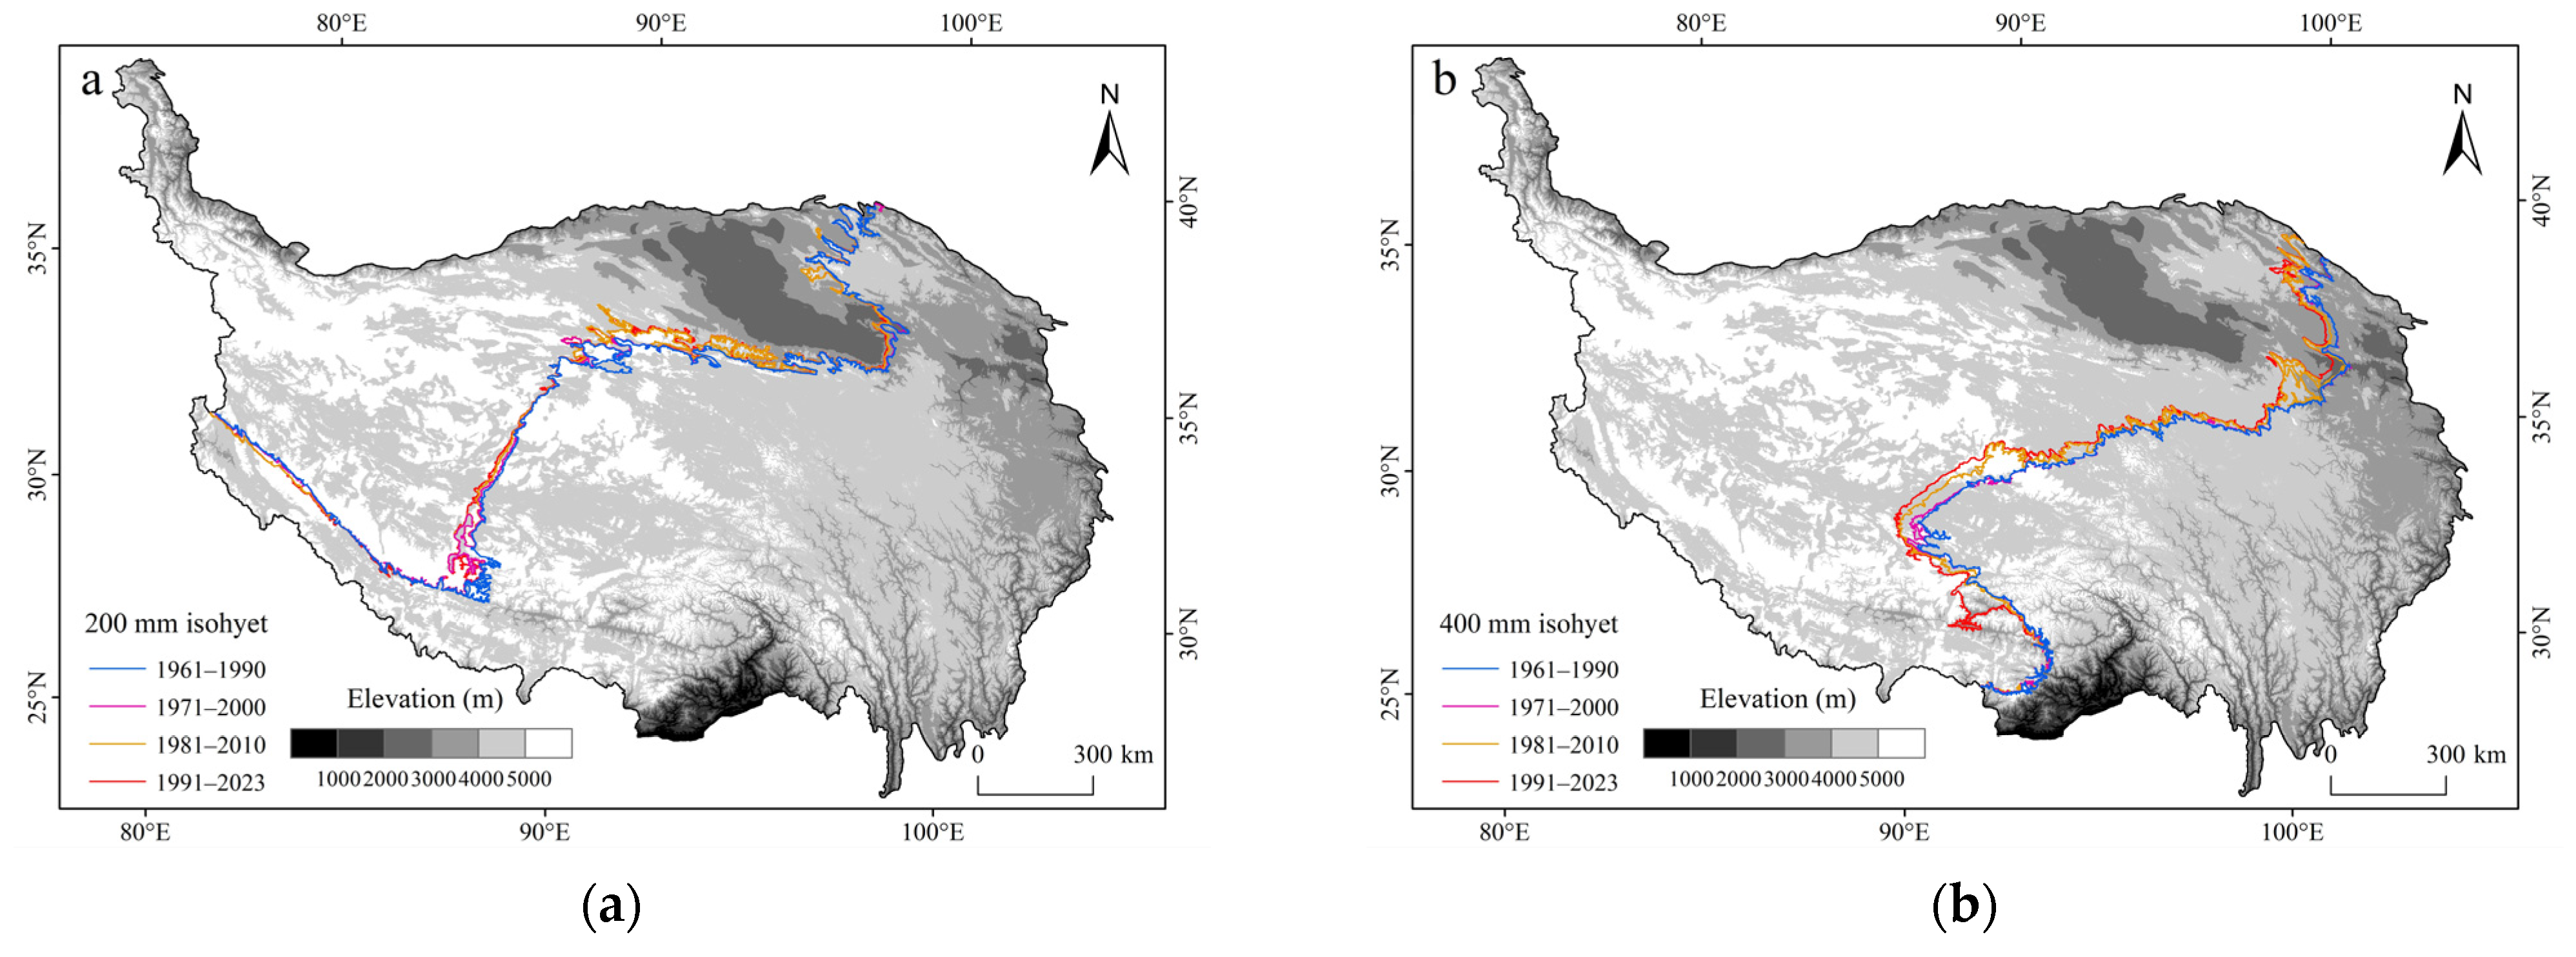
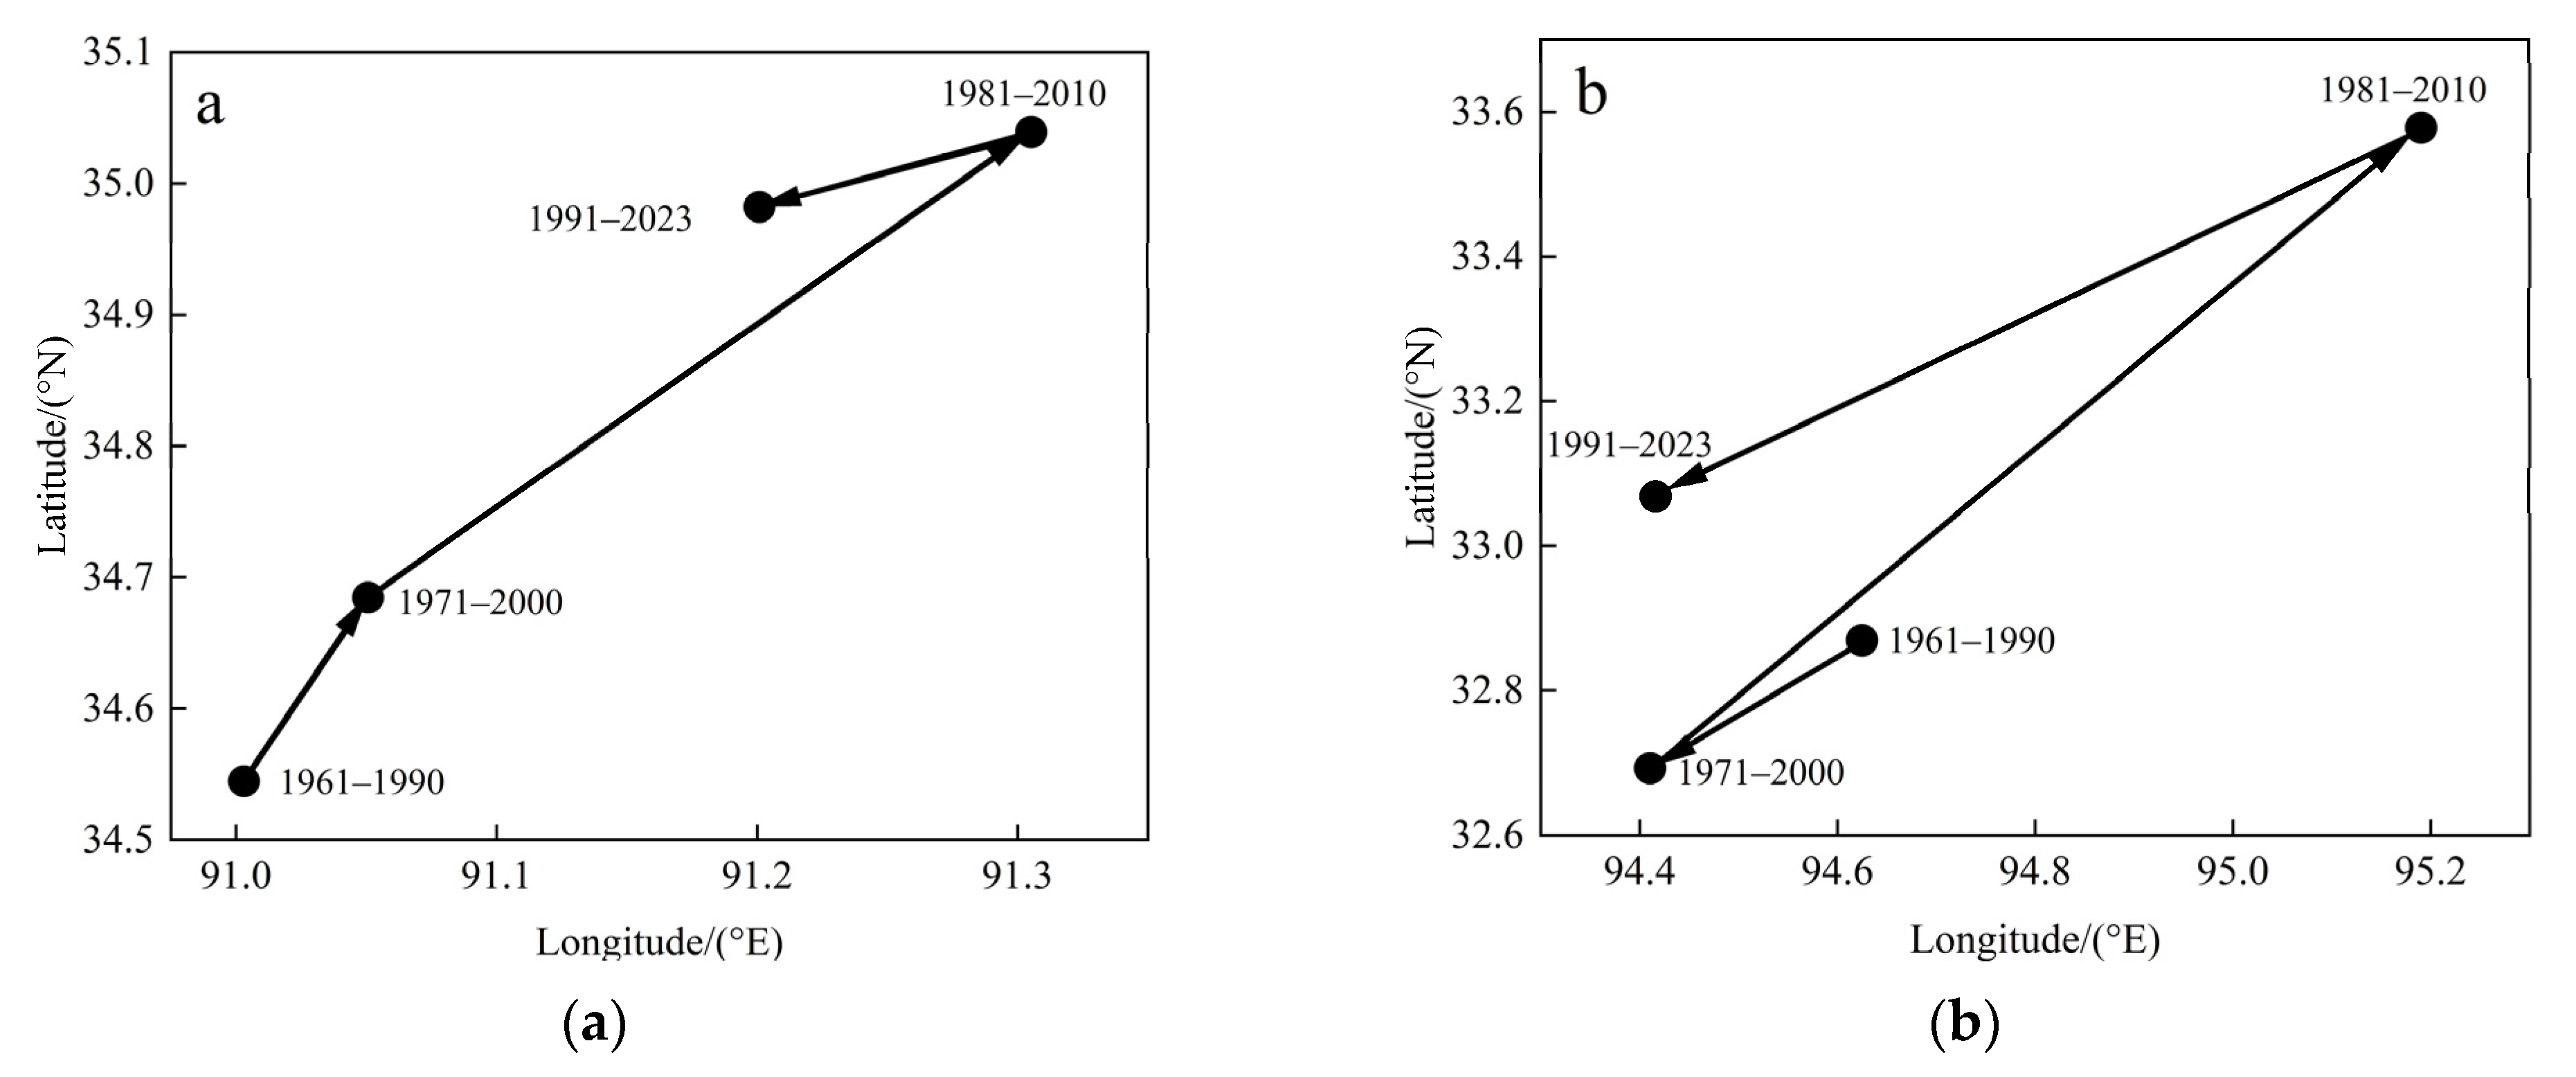
3.2.1. Spatial Distribution of Isohyets and Their Centroids over Multiple Years

① The 200 mm isohyet: Based on idealized theoretical assumptions, this study sets the underlying surface of the study area as uniform and constructs a simplified model by removing the interference of complex factors, such as terrain, vegetation, and soil. The spatial distribution of the 200 mm isohyet on the Qinghai–Tibet Plateau from 1961 to 2023 is shown in Figure 7a. The distribution of the centroid and the migration paths of the 63-year trend are analyzed, and it is found that the average location of the centroid of the 200 mm isohyet is 91°14′54″ E, 34°55′8″ N. In the north–south direction, the centroid migrates between 32°53′13″ N and 35°27′39″ N, with a north–south difference of 2°34′26″, or about 286 km. In the east–west direction, the centroid migrates between 89°46′40″ E and 92°2′57″ E, with a difference of 2°16′12″ from east to west, which is about 209 km. The migration path of the centroid from 1961 to 2023 is characterized in the form of vectors, as shown in Figure 7b, and the results show that, compared with the location of the centroid in 1961 (91°9′7″ E, 34°14′59″ N), the centroid in 2023 has migrated northward by 46′48″, or about 87 km, and eastward by 24′39″, or about 38 km. In regard to the conversion of the latitude and longitude to the distance, 1° latitude ≈ 111.32 km and 1° longitude ≈ 111.32 km ×cos latitude [45].
Based on the spatial distribution of the 200 mm isohyet and its centroid change, it can be seen that in the southern part of Qiangtang Plateau it is migrating from south to north, while around the perimeter of Qaidam Basin, it shows a contraction. In the eastern part of the basin, it is moving to the west, while in the western part of the basin, it migrates to the east, but in the western part, the shift is greater than in the east. In summary, the 200 mm isohyet is migrating northward and eastward.
② The 400 mm isohyet: By analyzing the spatial distribution of the 400 mm isohyet (Figure 7), it is found that the interannual weighted average location of the 400 mm line from 1961 to 2023 is 94°46′1″ E, 33°21′8″ N. From Figure 8a, it can be seen that the spatial position of the 400 mm line in regard to latitude varies between 31°14′9″ N and 34°33′6″ N, with a difference between the highest and the lowest point of 3°18′57″, which is about 369 km; the spatial position of the 400 mm line in regard to longitude varies between 91°54′36″ E and 96°13′3″ E, with a difference between the highest and the lowest point of 4°18′26″, which is about 402 km. The migration path of the centroid for the 400 mm line from 1961 to 2023 is characterized in the form of vectors, as shown in Figure 8b, and the results show that compared with the location of the centroid in 1961 (94°41′56″ E, 32°56′42″ N), the centroid in 2023 has migrated northward by 6′27″, or about 12 km, and westward by 44′26″, or about 69 km.
Based on the spatial distribution of the 400 mm isohyet and its centroid change, it can be seen that in the eastern part of the Qiangtang Plateau in the western section it migrates from east to west. In the southern part of the Qinghai Plateau in the middle section, it moves from south to north. In the eastern section, the western part of the Hehuang Valley, it moves from east to west. In summary, the 400 mm line is migrating northward and westward.

3.2.2. Temporal and Spatial Distribution of Isohyets During Four Periods

The spatial distribution of the 200 mm and 400 mm isohyet over the Qinghai–Tibet Plateau during four time periods is shown in Figure 9. From the figure, it can be seen that both the 200 mm and 400 mm isohyet in the four time periods show a trend of moving from southeast to northwest, with the degree of migration varying at different stages.
In order to further quantify the extent of the spatial migration of the 200 mm and 400 mm isohyets, their centers of the centroid were further investigated over the four time periods, as shown in Figure 9. And based on the idealized theoretical assumptions adopted in this study, the underlying surface of the research area is set as a homogeneous condition.
Figure 10a shows the spatial migration path of the centroid of the 200 mm isohyet. The centroid for the four periods first shifted northward in the north–south direction by 8′23″, or about 16 km, and then continued to move northward by 21′16″, or about 39 km, and then finally shifted southward by 3′25″, or about 6 km, which is a total of a 49 km shift to the north. The centroid first moved eastward in the east–west direction by 2′52″, or about 4 km, then continued to move eastward by 15′16″, or about 23 km, and finally moved westward by 6′15″, or about 10 km, for an overall shift of 11′53″, or about 17 km, to the east.
Figure 10b shows the spatial migration path of the centroid of the 400 mm isohyet. The centroid for the four periods first shifted southward in the north–south direction by 10′36″ for about 20 km, then shifted northward by 53′8″ for about 99 km, and then shifted southward by 30′35″ for about 57 km, which is a 22 km shift to the north, in general. The centroid in the east–west direction shifted first by 12′52″ to the west, about 20 km, then 46′47″ to the east, about 73 km, and finally 46′26″ to the west, about 72 km, for an overall shift of 12′31″ to the west, about 19 km.

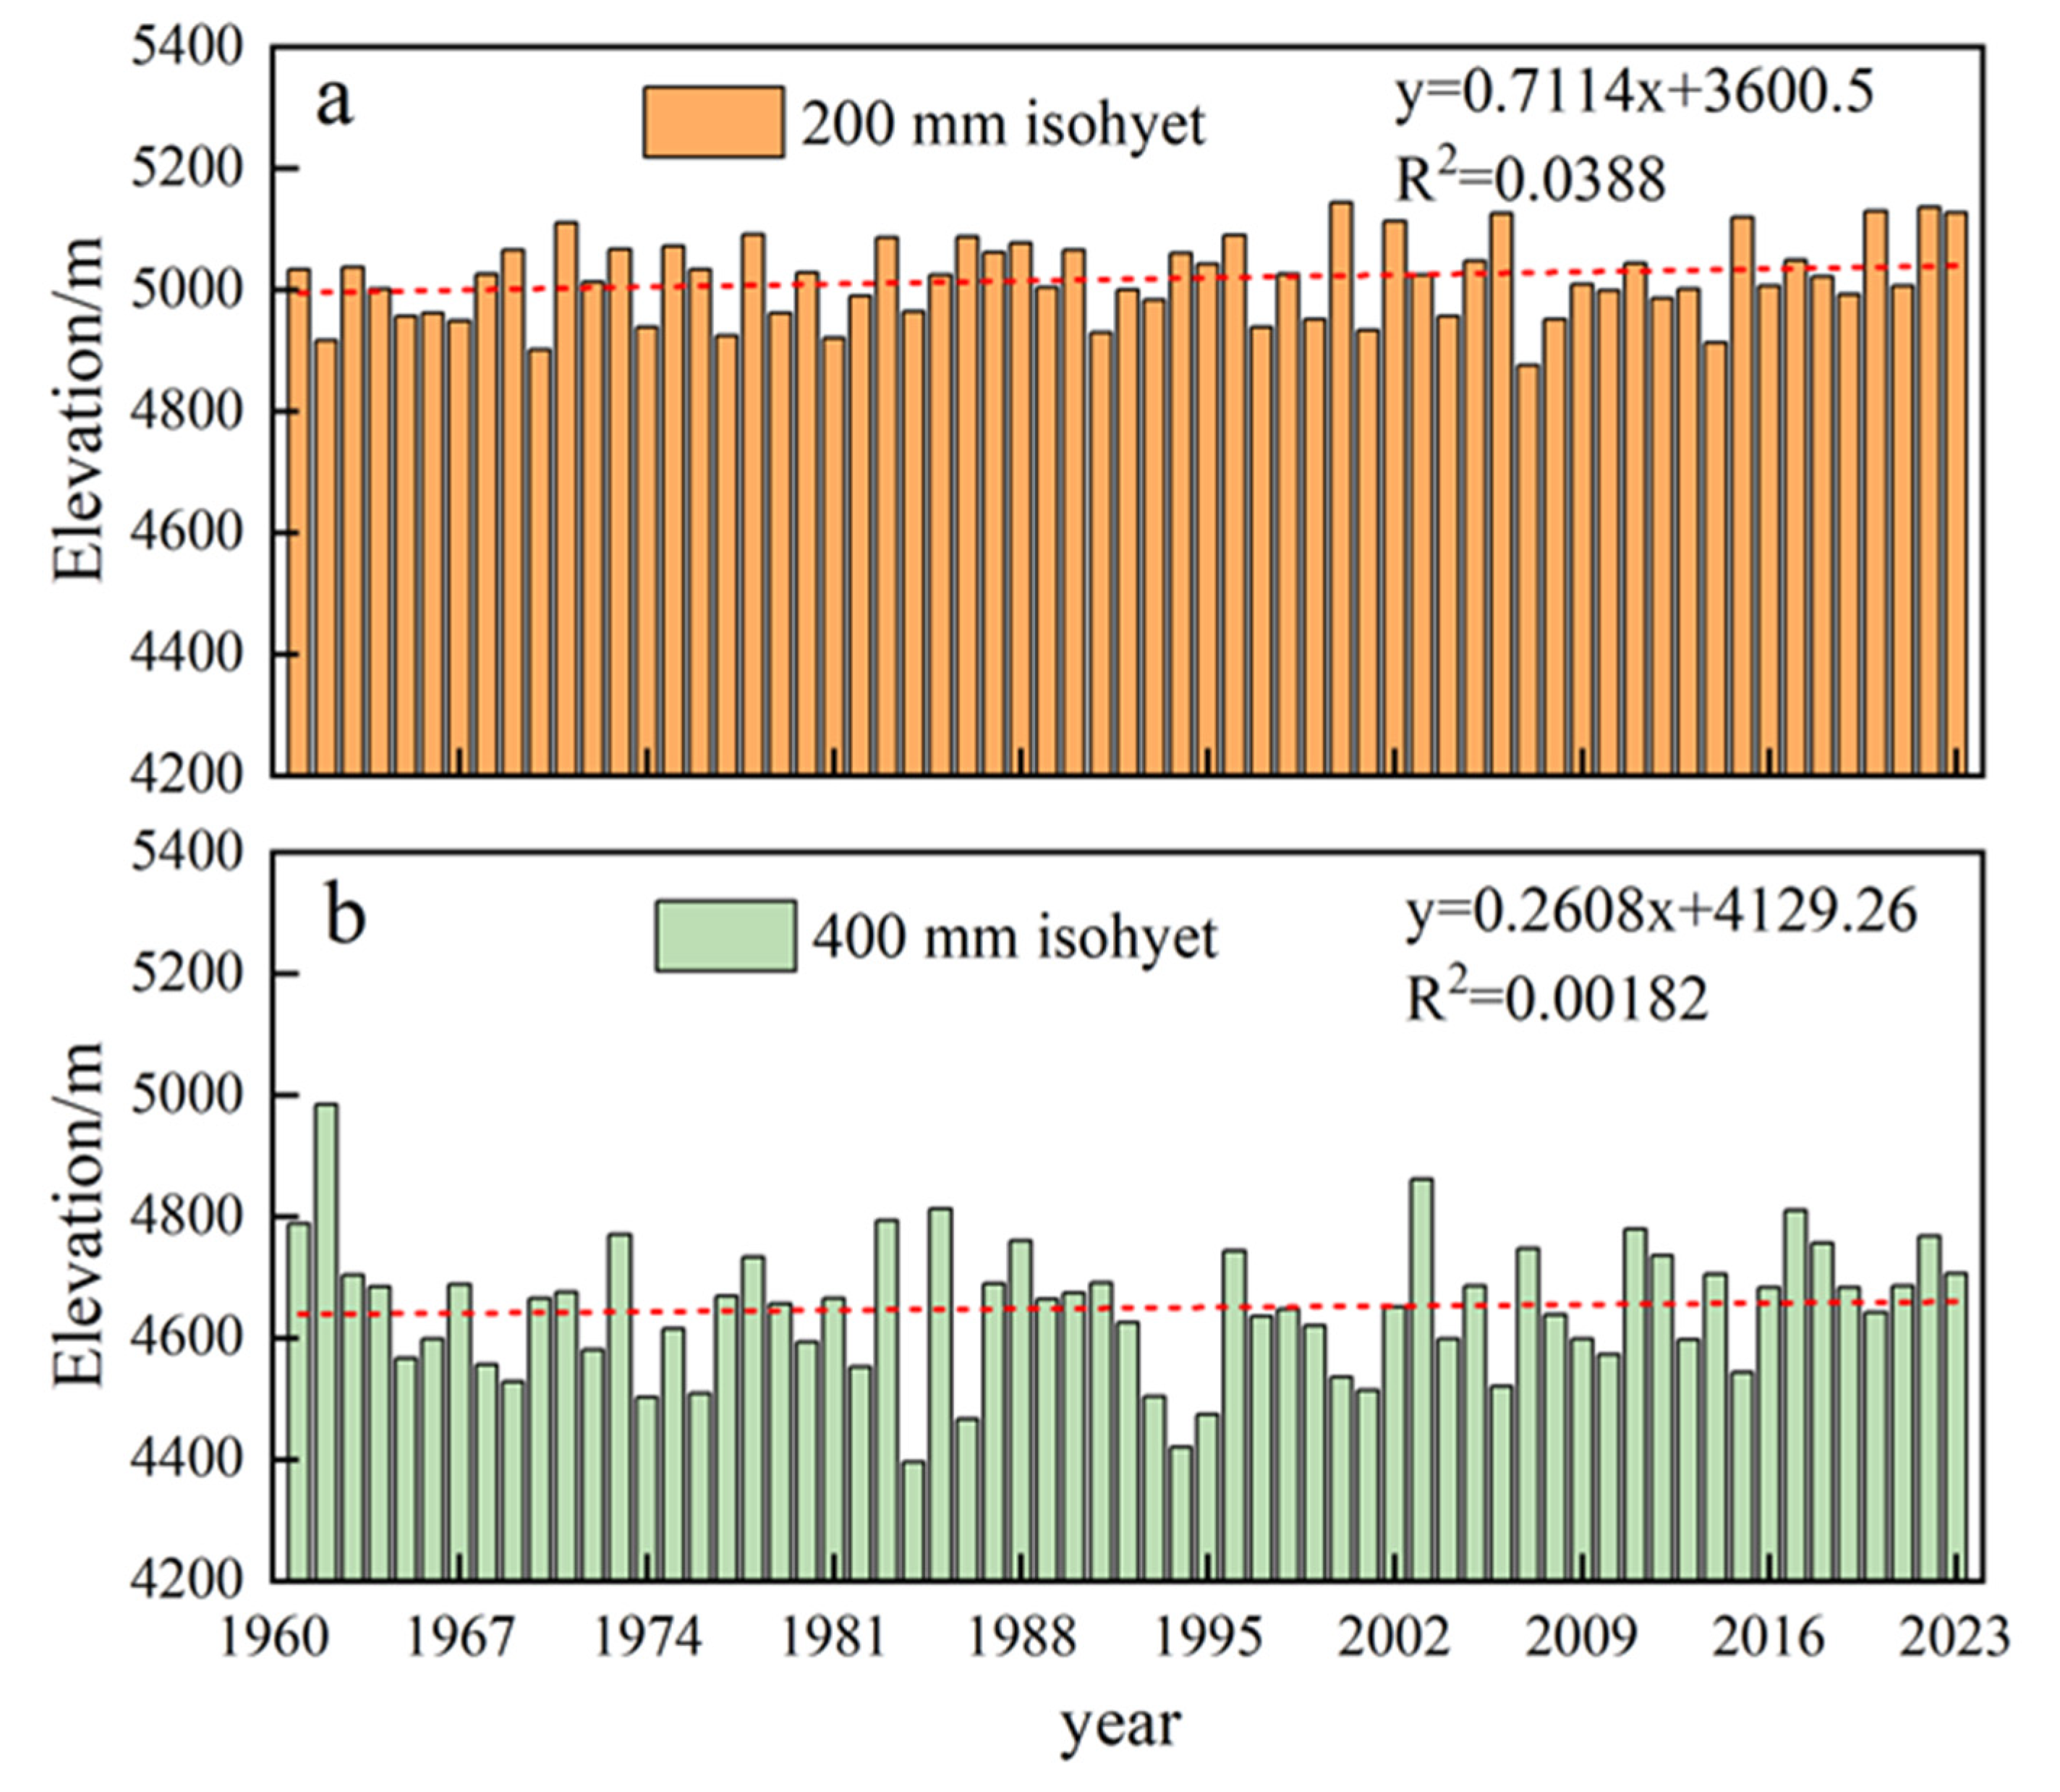
3.3. The Variation of Precipitation Lines, Such as 200 mm and 400 mm, in the Vertical Gradient

The results of analyzing the mean elevation change in the isopach line from the viewpoint of the vertical gradient are shown in Figure 11. The average elevation of the 200 mm isohyet on the Qinghai–Tibet Plateau during the period from 1961 to 2023 ranged from 4876 to 5144 m, with a mean value of 5018 m. The overall trend was upward, with an increase rate of 7.11 m/decade (but with low significance). The elevation of the 400 mm isohyet ranges from 4396 to 4985 m, with a mean value of 4650 m, which is 368 m lower than the average elevation of the 200 mm isohyet, and it also shows an upward trend in the interannual changes, but the upward trend is less steep than that of the average elevation of the 200 mm isohyet, with an upward trend rate of 2.61 m/10a (the significance of the trend is low).

4. Discussion

4.1. The Impact of Climate Warming on Moisture Transport over the Qinghai–Tibet Plateau

Over the past 60 years, the average annual precipitation on the Qinghai–Tibet Plateau has shown a significant increasing trend, at a rate of 5.05 mm/decade. This is basically consistent with previous research results [44] (6.59 mm/decade). The Qinghai–Tibet Plateau is known as the “water tower of Asia”. The sources of its water vapor mainly include the westerly wind, the East Asian monsoon, the South Asian monsoon, and the plateau monsoon [46]. An intensification of the westerly wind circulation usually results in an increase in precipitation in the north of the plateau and a decrease in the south [47,48]. The South Asian monsoon brings summer precipitation to the south and east–central parts of the plateau. The East Asian monsoon affects precipitation in the east of the plateau by intensifying the transport of water vapor. The uplift of the plateau has intensified the thermal differences between land and sea, which, combined with its own thermal system, has formed an independent plateau monsoon system, which is manifested in a significant difference in winter and summer air pressure. In recent years, warming has caused precipitation on the plateau to increase, the water cycle to accelerate, and moisture transport to intensify, which has significantly affected the water replenishment of the “Asian Water Tower”. And under the mechanism of the temporal and spatial interaction between the westerly wind belt and the Indian monsoon, this change has gradually manifested as an increase in water gain in the inner flow basin and a loss of water in the outer flow basin. In particular, under the influence of the accelerated melting of glaciers and the uneven temporal and spatial distribution of precipitation, the interannual runoff fluctuations of some rivers have increased, which may have an adverse impact on the utilization of water resources in downstream regions and countries [12]. Meanwhile, the southeastern edge of the Tibetan Plateau and the surrounding southwestern China (Sichuan, Chongqing, Yunnan, Guizhou, etc.) have experienced a decrease in precipitation and frequent droughts in recent decades, gradually developing a warmer and drier climate. Although the moisture transport to some areas of the Qinghai–Tibet Plateau has increased, the contribution of moisture from areas controlled by the westerly wind belt has decreased, while the moisture input from the East Indian Ocean and the West Pacific Ocean has increased. Due to the circulation configuration and topography in the southwestern region, the convergence of moisture has weakened, resulting in a decrease in precipitation. This difference in moisture transport, namely “decreasing in the west and increasing in the east,” has exacerbated the regional water shortage [49]. Although an increase in water resource replenishment is beneficial for alleviating drought, it may also lead to an increase in river flow, resulting in an increase in extreme precipitation events during the flood season and exacerbating the risk of flooding in downstream areas [50,51]. Therefore, in the future, more attention should be paid to the characteristics of water resource changes in different regions, and reasonable disaster prevention and mitigation strategies should be formulated to cope with the challenges of possible climate change.

4.2. The Influence of Changes in the Precipitation Patterns on the Plateau’s Water Cycle and Ecosystem Evolution

In the study of climate zoning and changes in arid and humid climates, isohyets serve as an intuitive and effective tool for visualizing the spatial distribution of precipitation, essentially revealing the dynamic variations in regional wet and dry patterns. Based on the analysis of a 63-year-long time series and variations across four periods, the 200 mm isohyet has shown a northeastward shift, while the 400 mm isohyet has exhibited a northwestward shift, a trend consistent with projections based on CMIP6 data simulations [52]. The Sixth Assessment Report by the IPCC indicates that global warming has altered precipitation patterns, particularly increasing precipitation and shifting precipitation belts toward higher latitudes in mid- and high-latitude regions [2]. Studies [53] have analyzed climate changes in global semi-arid regions, highlighting that global warming has driven the migration of precipitation belts toward higher elevations. From an altitudinal perspective, both the 200 mm and 400 mm isohyets have shown an upward trend, indicating a reduction in aridity and an expansion of the wet zone at higher altitudes. This upward shift in the vegetation boundary indicates the occurrence of a “greening” process in the plateau’s ecosystem, which may improve soil moisture conditions, promote the development of plateau agriculture and animal husbandry, and enhance ecosystem stability. Moreover, the increase in vegetation cover could alter surface albedo, thereby influencing the local climate. From 2000 to 2020, the total area of lakes larger than 1 km2 in Qinghai Province increased from 12,153.57 km2 to 14,374.56 km2 [54]. Satellite remote sensing in September 2024 recorded that the water surface area of Qinghai Lake reached 4650.08 km2, reflecting a 0.6% year-on-year increase [55]. However, the expansion of lakes has gradually submerged surrounding grasslands, disrupting the ecological balance. Lake water intrusion has also caused soil salinization and could trigger soil erosion and other geological hazards, posing a threat to surrounding infrastructure. Therefore, further research is needed to understand the underlying mechanisms and future trends in regard to how the spatial migration and upward shift of isohyets on the Qinghai–Tibet Plateau will affect regional water cycles, ecosystem evolution, and downstream flood risks.

4.3. The Impact of Shifts in Isopluvial Lines on Agricultural Production

Cultivated land on the Qinghai–Qinghai–Tibet Plateau is predominantly subject to a single-cropping system, primarily consisting of dryland or irrigated fields. Paddy fields account for only 9.4% of the cultivated land in Tibet, and there are no paddy fields in Qinghai [56]. This study finds that the precipitation increase is more pronounced in the central and eastern regions of the Qinghai–Tibet Plateau, whereas the increase is relatively smaller in the northwestern region. Consequently, the 400 mm isohyet has shifted horizontally toward the northwest. The eastern region, characterized by more abundant precipitation, benefits from enhanced moisture availability, which supports crop growth and leads to increased yields. For instance, the barley yield per hectare in the agricultural and pastoral regions of Qinghai and Gansu exhibited a decreasing trend of −0.22 t/ha during 1991–2000 and −0.14 t/ha during 2001–2010, followed by a significant recovery to 0.85 t/ha during 2011–2020 [57]. Approximately 82% of the cultivated land on the Qinghai–Tibet Plateau is concentrated in river valley areas, at altitudes between 2400 m and 4400 m [56]. The vertical shift in precipitation zones is expected to alter the existing hydrothermal balance of cultivated land, potentially creating new arable zones at higher elevations and raising the upper limit of cultivable land.
However, the upward movement in the farming belt is not only affected by changes in precipitation, but also by rising temperatures. In recent years, the temperature on the Tibetan Plateau has continued to rise, resulting in an extension of the plant growth season and more favorable thermal conditions for crop growth [58]. As temperatures rise, the low temperature constraints in some high-altitude areas are broken, making them gradually suitable for agricultural production, thus promoting the expansion of the farming belt to higher altitudes [59]. However, higher temperatures may also increase water evaporation, which affects the soil moisture balance and creates new challenges for agricultural production. Overall, the synergistic mechanism of rising temperatures and changing precipitation has jointly contributed to the formation of new suitable farming areas in the high-altitude areas of the Qinghai–Tibet Plateau, and may lead to a transformation of the land use. For example, in the Huang Shui Valley and the Yarlung Zangbo River Valley area, grasslands are more likely to be converted into cropland [60].

5. Conclusions

Based on the analysis of the temporal and spatial variation characteristics of the multi-year average precipitation from 1961 to 2023, this paper portrays the segmentation and trend of spatial changes in the 200 mm and 400 mm isohyets on the Qinghai–Tibet Plateau, and reveals the spatial and temporal patterns of regional precipitation changes. Based on the above analysis, the following conclusions are drawn: (1) The precipitation on the Qinghai–Tibet Plateau from 1961 to 2023 shows a significant increasing trend, with a climatic propensity rate of 4.17 mm/decade. Annual precipitation changed abruptly in 1988, and, since then, precipitation has changed from less to more. Annual precipitation on the plateau shows a spatial trend of a gradual decrease from southeast to northwest. The climatic tendency rate of annual precipitation ranges from −36.7 to 25.4 mm/10 a, increasing in some areas, such as the southern plateau of Qinghai Provinceand decreasing in the regions south of the Himalayas and the south–central Altyn−Tagh. During the four periods, the climatic tendency rate of the annual precipitation showed an increasing trend during all the periods, but with differences in the rate of change, among which the annual precipitation from 1971 to 2000 showed the most significant increasing trend, with a rate of 7.98 mm/decade.
(2) Between 1961 and 2023, the 200 mm isohyet migrated between 32°53′13″ N~35°27′39″ N in the north–south direction, with a span of 2°34′26″, and moved between 89°46′40″ E~92°2′57″ E in the east–west direction, with a span of 2°16′12″. The 400 mm isohyet migrated between 31°14′9″ N~34°33′6″ N in the north–south direction, spanning 3°18′57″, and between 91°54′36″ E~96°13′3″ E in the east–west direction, spanning 4°18′26″. In terms of spatial distribution, the 200 mm isohyet migrates northward in the southern part of the Qiangtang Plateau, shrinks around the Qaidam Basin, and migrates more in the western part of the basin than in the eastern part, with the overall direction of migration being northward and eastward. The 400 mm isohyet migrates to the east of the Qiangtang Plateau, to the west in regard to the western part of the Hehuang Valley, the southern plateau of Qinghai Province is moving northward, with the overall migration direction being to the north and west.
(3) When viewed during four periods, the 200 mm and 400 mm isohyets show a south–east to north–west trend over the four periods. After analyzing the migration path of the centroid, it is found that the centroid of the 200 mm isohyet shifted about 16 km northward and 4 km eastward from 1961 to 1990 to 1971 to 2000, about 39 km northward and 23 km eastward from 1981 to 2010, and finally about 6 km southward and 10 km westward from 1991 to 2023. The overall northward shift is about 49 km and eastward shift is about 17 km, with an overall northeastward trend. The centroid of the 400 mm isopach line shifted about 20 km southward and 20 km westward from the 1961–1990 to the 1971–2000 period, about 99 km northward and 73 km eastward during the 1981–2010 period, and finally about 57 km southward and 72 km westward during the 1991–2023 period, with an overall northward shift of about 22 km and a westward shift of about 19 km. The overall trend is moving northwestward.
(4) On the whole, the 200 mm and 400 mm isohyets on the Qinghai–Tibet Plateau migrate to higher elevations, while moving northward overall during 1961–2023, with the 200 mm isohyet moving northeastward horizontally, and migrating to higher elevations on the vertical gradient, at a rate of 7.11 m/decade. The 400 mm isohyet moves horizontally to the northwest and migrates upward in the vertical gradient, at a rate of 2.61 m/decade.
(5) By using the analysis of the migration range of equal precipitation lines and the migration path of their centroids, combined with latitude, longitude, and altitude gradients, the spatial pattern evolution was accurately depicted. However, the time series from 1961 to 2023 is relatively long, resulting in strong fluctuation of the precipitation and, thus, poor significance. In the future, we will further focus on the analysis of vertical gradients, systematically exploring the influence laws of slope and aspect changes on the precipitation process, and describing the spatial distribution characteristics of precipitation in regard to different slopes (gentle slopes, steep slopes) and aspects (sunlit slopes, shady slopes).

Author Contributions

X.L. conducted the research, analyzed the data, and wrote the paper; R.L. processed the data; W.M. guided the research and carried out extensive updating of the manuscript; Y.M. conceived the research and provided project support; Q.Z. and Z.Z. helped process the data. All authors have read and agreed to the published version of the manuscript.

Funding

This research was funded by the Second Qinghai–Tibet Plateau Scientific Expedition and Research Program (STEP), grant number 2019QZKK0606.

Institutional Review Board Statement

Not applicable.

Informed Consent Statement

Not applicable.

Data Availability Statement

All data and materials are available upon request.

Conflicts of Interest

The authors declare that there are no conflicts of interest.

References

  1. Zhao, C.; Wang, Y.; Ding, Y.; Ye, B.; Yao, S. Spatiotemporal variations in temperature and precipitation in Northwest China over the past 50 years. Plateau Meteorol. 2011, 30, 385–390. [Google Scholar]
  2. Fan, X.; Qin, Y.; Gao, X. Interpretation of the Main Conclusions and Suggestions of IPCC AR6 Working Group I Report. Environ. Prot. 2021, 49, 44–48. [Google Scholar]
  3. Trenberth, K.E.; Dai, A.; Rasmussen, R.M.; Parsons, D.B. The changing character of precipitation. Bull. Am. Meteorol. Soc. 2003, 84, 1205–1218. [Google Scholar] [CrossRef]
  4. Duan, K.; Yao, T.; Wang, N.; Tian, L.; Xu, B. The difference in precipitation variability between the north and south Qinghai-Tibet Plateaus. J. Glaciol. Geocryol. 2008, 30, 726–732. [Google Scholar]
  5. Shi, P.; Kong, F. Research on Related Factors to Decadal Accumulated Heavy Rainfall Spatio-temporal Patterns Change in China During 1951–2010. Sci. Geogr. Sin. 2016, 36, 1457–1465. [Google Scholar]
  6. Hou, A.Y.; Kakar, R.K.; Neeck, S.; Azarbarzin, A.A.; Kummerow, C.D.; Kojima, M.; Iguchi, T. The global precipitation measurement mission. Bull. Am. Meteorol. Soc. 2014, 95, 701–722. [Google Scholar] [CrossRef]
  7. Blacutt, L.A.; Herdies, D.L.; de Gonçalves, L.G.G.; Vila, D.A.; Andrade, M. Precipitation comparison for the CFSR, MERRA, TRMM3B42 and Combined Scheme datasets in Bolivia. Atmos. Res. 2015, 163, 117–131. [Google Scholar] [CrossRef]
  8. Chen, D.; Zhang, X.; Xu, B.; Zhang, Y.; Yao, T.; Guo, Z.; Cui, P.; Chen, F.; Zhang, R.; Fan, J.; et al. Assessment of past, present and future environmental changes on the Qinghai-Tibet Plateau. Chin. Sci. Bull. 2015, 60, 3025–3035. (In Chinese) [Google Scholar]
  9. Yao, T.; Thompson, L.; Yang, W. Different glacier status with atmospheric circulations in Qinghai-Tibet Plateau and surroundings. Nat. Clim. Change 2012, 2, 663–667. [Google Scholar] [CrossRef]
  10. Yao, T. A comprehensive study of Water-Ecosystem-Human activities reveals unbalancing Asian Water Tower and accompanying potential risks. Chin. Sci. Bull. 2019, 64, 2761–2762. [Google Scholar] [CrossRef]
  11. Zhang, Q.; Wang, G.; Li, T.; Wu, W.; Zhang, K.; Feng, A.; Shen, Z. Water circulation and water resources of Asia’s water tower. The past and future. Chin. Sci. Bull. 2023, 68, 4982–4994. (In Chinese) [Google Scholar] [CrossRef]
  12. Yao, T.; Bolch, T.; Chen, D.; Gao, J.; Immerzeel, W.; Piao, S.; Wu, F.; Thompson, L.; Wada, Y.; Wang, L.; et al. The imbalance of the Asian water tower. Nat. Rev. Earth Environ. 2022, 3, 618–632. [Google Scholar] [CrossRef]
  13. Bouregaa, T.; Fenni, M. Assessment of inter-seasonal temperature and precipitation changes under global warming over Setif high plains region, vulnerability and adaptation. World J. Sci. Technol. Sustain. Dev. 2014, 11, 304–314. [Google Scholar] [CrossRef]
  14. Perdiguer-Lopez, R.; Berne, V.J.L.; Garrido-Villen, N. GNSS-retrieved precipitable water vapour in the Atlantic coast of France and Spain with GPT3 model. Acta Geod. Et Geophys. 2023, 58, 575–600. [Google Scholar] [CrossRef]
  15. Phasamak, W.; Soisuvarn, S.; Rangsanseri, Y. Empirical Model for Total Precipitable Water Retrieval from Ground-based GNSS Observations in Thailand. J. Mob. Multimed. 2020, 16, 161–180. [Google Scholar] [CrossRef]
  16. Shinohara, M.; Inatsu, M. Stochastic Precipitation Model Using Large Ensemble Data: Regular Papers. J. Disaster Res. 2023, 18, 868–876. [Google Scholar] [CrossRef]
  17. Qi, W.; Zhang, B.; Pang, Y.; Zhao, F.; Zhang, S. TRMM-data- based spatial and seasonal patterns of precipitation in the Qinghai-Tibet Plateau. Sci. Geogr. Sin. 2013, 33, 999–1005. [Google Scholar]
  18. Lu, H.; Shao, Q.; Liu, J.; Wang, J.; Chen, Z. Temporo-spatial distribution of summer precipitation over Qinghai-Tibet plateau during the Last 44 year. Acta Geogr. Sin. 2007, 62, 945–958. [Google Scholar]
  19. Chen, J. Interpretation Skills of Isotherm Maps and Isoprecipitation Maps. Questions and Research. 2014, pp. 60–63. Available online: https://kns.cnki.net/kcms2/article/abstract?v=ygxn0A4FGUHRccwi0vFPuu40l7PiXa-nFeVTeS2z-UuMChOQ5mefjhoO9pNeIsa3kTvs8tCt2s6CNnrQ8X7X2HnTukequwCdVDNJ4ZKyMebR0DflzhYL4DQpXLOHJS6CcBTv-3VwCB1ce-30-pF3hmgCUIKsBJGJ9uPlifqP5YZNvoHMf2HKtg==&uniplatform=NZKPT&language=CHS (accessed on 6 June 2025).
  20. Che, Y.; Guan, X.; Wang, S.; Wu, R. Spatial analysis of annual precipitation lines of 800 mm in the eastern monsoon of China. Plateau Meteorl. 2020, 39, 997–1006. [Google Scholar]
  21. Ma, C.; Ma, W.; Wang, Z.; Liu, W.; Zhang, Y.; Ma, M. Migration and its in ducements of 400 mm precipitation contour in the mainland China from 1951 to 2012 year. J. Henan Polytech Nic Univ. (Nat. Sci.) 2016, 35, 520–525. [Google Scholar]
  22. Gao, Y.; Xu, J.; Zhang, M.; Jiang, F. Advances in the study of the 400 mm isohyet migrations and wetness and dryness changes on the Chinese mainland. Adv. Earth Sci. 2020, 35, 1101–1112. [Google Scholar]
  23. Liu, J. Study on Spatial and Temporal Variation of the Bound Ary and Area of the Semi-Arid Region in Northern China over the Past 60 Years. Master’s Thesis, Northwest University, Xi’an, China, 2019. [Google Scholar]
  24. Zheng, D.; Yao, T. Research progress on formation and evolution of Qinghai-Tibet Plateau and its environmental and resource effects. Chin. Basic Sci. 2004, 6, 15–21. (In Chinese) [Google Scholar]
  25. Chen, F.; Wang, Y.; Zhen, X.; Song, J. The environmental impacts and response strategies in the Qinghai-Tibet Plateau under the global changes. China Tibetol. 2021, 4, 21–28. (In Chinese) [Google Scholar]
  26. Zhang, C.; Liao, Y.; Duan, J.; Song, Y.; Huang, D.; Wang, S. The progresses of dry-wet climate divisional research in China. Clim. Change Res. 2016, 12, 261–267. [Google Scholar]
  27. Wang, H.; Yan, D.; Qin, D.; Wang, J. A study of the spatial shift of 400 mm-rainfall contours in the yellow river ba sin during recent 50 years. Adv. Earth Sci. 2005, 20, 649–655. [Google Scholar]
  28. Zhang, Y.; Li, B.; Zheng, D. A discussion on the boundary and area of the Qinghai-Tibet Plateau in China. Geogr. Res. 2002, 21, 1–10. [Google Scholar]
  29. Gong, C.; Dong, X.; Wei, C.; Ouyang, X.; Wu, H. Precipitation Division of the Qinghai-Tibet Plateau from 1978 to 2018 and Spatio-temporal Evolution Characteristics of Each Zone. J. Water Resour. Water Eng. 2022, 33, 96–108. [Google Scholar]
  30. Huang, Y. Temporal-Spatial Characteristics of Precipitation over the Qinghai-Tibet Plateau. Master’s Thesis, Hunan Normal University, Changsha, China, 2007. [Google Scholar]
  31. Xu, X.; Dong, L.; Zhao, Y.; Wang, Y. Effect of the Asian Water Tower over the Qinghai-Tibet Plateau and the characteristics of atmospheric water circulation. Chin. Sci. Bull. 2019, 64, 2830–2841. (In Chinese) [Google Scholar]
  32. Gao, J.; Yao, T.; Delmotte, V.M.; Steen-Larsen, H.C.; Wang, W. Collapsing glaciers threaten Asia’s water supplies. Nature 2019, 565, 19–21. [Google Scholar] [CrossRef]
  33. Di, Y.; Zhang, Y.; Zeng, H.; Tang, Z. Effects of changed Asian water tower on Qinghai-Tibet Plateau ecosystem: A review. Bull. Chin. Acad. Sci. 2019, 34, 1322–1331. [Google Scholar]
  34. Zhao, Z.; Zhang, Y.; Liu, L.; Liu, F.; Zhang, H. Advances in research on wetlands of the Qinghai-Tibet Plateau. Prog. Geogr. 2014, 33, 1218–1230. [Google Scholar]
  35. Du, D.; Liu, C.; Hu, Z.; Ma, Y. The impact of “Asian Water Tower” change on the geopolitical environment around China. World Reg. Stud. 2020, 29, 223–231. [Google Scholar]
  36. Peng, S.; Ding, Y.; Liu, W.; Li, Z. 1 km monthly temperature and precipitation dataset for China from 1901 to 2017. Earth Syst. Sci. Data 2019, 11, 1931–1946. [Google Scholar] [CrossRef]
  37. Wei, F. Modern Climate Statistical Diagnosis and Prediction Techniques; Meteorological Publishing House: Beijing, China, 2007. [Google Scholar]
  38. Xu, J. Quantitative Geography, 2nd ed.; Higher Education Press: Beijing, China, 2014. [Google Scholar]
  39. Yuan, Z.; Yan, D.; Yang, Z.; Yin, J.; Yuan, Y. Research on temporal and spatial change of 400 mm and 800 mm rainfall contours of China in 1961–2000. Adv. Water Sci. 2014, 25, 494–502. [Google Scholar]
  40. Ma, W.; Liu, F.; Zhou, Q.; Chen, Q.; Liu, F.; Chen, Y. Characteristics of extreme precipitation over the Qinghai-Tibet Plateau from 1961 to 2017. J. Nat. Resour. 2020, 35, 3039–3050. [Google Scholar] [CrossRef]
  41. An, Y.; Guo, Z. Discriminating the law of geographical differentiation based on the idea of scale. Teach. Ref. Middle Sch. Geogr. 2015, 16, 41–42. [Google Scholar]
  42. Gao, J.; Sun, Y.; Qiao, W. Analysis of the temporal and spatial variation patterns of precipitation in Lanxi Bridge Reservoir from 1963 to 2021. Water Resour. Sci. Cold Reg. Eng. 2024, 7, 55–58. [Google Scholar]
  43. Hu, W.; Yao, J.; He, Q.; Chen, J. Elevation-Dependent Trends in Precipitation Observed over and around the Qinghai-Tibet Plateau from 1971 to 2017. Water 2021, 13, 2848. [Google Scholar] [CrossRef]
  44. Ji, Q.; Yang, J.; Chen, H. Comprehensive analysis of the precipitation changes over the Qinghai-Tibet Plateau during 1961–2015. J. Glaciol. Geocryol. 2018, 40, 1090–1099. [Google Scholar]
  45. Li, Z.; Li, J. Quickly calculate the distance between two points and measurement error based on latitude and longitude. Geomat. Spat. Inf. Technol. 2013, 36, 235–237. [Google Scholar]
  46. Ye, L.; Wang, W.; Hu, Y.; Zhang, Z.; Li, Y. Water vapor sources and their contributions to precipitation change in the Qinghai-Tibet Plateau. Adv. Water Sci. 2024, 35, 890–899. [Google Scholar]
  47. Chen, F.; Xie, T.; Yang, Y.; Chen, S.; Chen, F.; Huang, W.; Chen, J. Discussion of the “warming and wetting” trend and its future variation in the drylands of Northwest China under global warming. Sci. China Earth Sci. 2023, 66, 1241–1257. [Google Scholar] [CrossRef]
  48. Li, Y.; Wu, D.; Yuan, Z.; Chen, L.; Chen, X.; Zhou, A. Holocene summer monsoon varation and environmental reponse in the drainage basin of lake Bande in the inner Tibetan Plateau. Quatemary Sci. 2022, 42, 1328–1348. [Google Scholar]
  49. Tang, Q.; Liu, Y.; Zhang, C.; Su, F.; Li, Y.; Gao, Y.; Li, W.; Chen, D. Research progress on moisture source change of precipitation over the Tibetan Plateau and its surrounding areas. Trans. Atmos. Sci. 2020, 43, 1002–1009. [Google Scholar]
  50. Li, Y. Study on the Correlation Between Drought and Snow Disaster and Monsoon Circulation on the Qinghai-Tibet Plateau. Master’s Thesis, Qinghai Normal University, Xining, China, 2020. [Google Scholar]
  51. Yang, Y.; Hu, Z.; Lu, F.; Cai, Y.; Yu, H.; Guo, H.; Fu, C.; Fan, W.; Wu, D. Progress of recent 60 years climate change and its environmental impacts on the Qinghai-Xizang plateau. Plateau Meteorol. 2022, 41, 1–10. [Google Scholar]
  52. Chen, R.; Duan, K.; Shang, W.; Shi, P.; Meng, Y. Characteristics of Precipitation Change over the Qinghai-Xizang Plateau from 1961 to 2099 based on CMIP6 Models. Plateau Meteorol. 2023, 42, 294–304. [Google Scholar]
  53. Huang, J.; Ji, M.; Xie, Y.; Wang, S.; He, Y.; Ran, J. Global semi-arid climate change over last 60 years. Clim. Dyn. 2016, 46, 1131–1150. [Google Scholar] [CrossRef]
  54. Zhang, H.; Yao, X.; Xiao, J.; Wang, Y.; Sha, T.; Zhang, C. A dataset of boundaries data of the lakes (≥1.0 km2) in Qinghai Province in 2020. Sci. Data Bank 2023, 8, 315–327. [Google Scholar]
  55. Qinghai Provincial Water Resources Department. 2023 Qinghai Provincial Water Resources Bulletin; Qinghai Provincial Water Resources Department: Xining, China, 2023. [Google Scholar]
  56. Zhang, Y.; Liu, L.; Wang, Z.; Bai, W.; Ding, M.; Wang, X.; Yan, J.; Xu, E.; Wu, X.; Zhang, B.; et al. Spatial and temporal characteristics of land use and cover changes in the Qinghai-Tibet Plateau. Chin. Sci. Bull. 2019, 64, 2865–2875. [Google Scholar]
  57. Ma, W. Evaluation of impact of climate change on Highland barley cultivation in Qinghai-Tibet Plateau. Ph.D. Thesis, Qinghai Normal University, Xining, China, 2022. [Google Scholar]
  58. Cao, X.; Zhou, B.; Zhou, H.; Qiao, B.; Yan, Y.; Zhao, T.; Chen, Q.; Zhao, H.; Yu, H. Research progress on the impact of climate change on vegetation ecosystem in the Tibetan Plateau. J. Arid. Meteorol. 2022, 40, 1068–1080. [Google Scholar]
  59. Ma, W.; Wang, J. Changes in the altitude of barley cultivation in the context of climate change—A case study of Menyuan County. Qinghai Environ. 2024, 34, 129–133. [Google Scholar]
  60. Liang, Y.; Song, W. Integrating potential ecosystem services losses into ecological risk assessment of land use changes: A case study on the Qinghai-Tibet Plateau. J. Environ. Manag. 2022, 318, 115607. [Google Scholar] [CrossRef] [PubMed]
Figure 1. Study area description; revision no. GS (2024)0650.
Atmosphere 16 00698 g001
Figure 2. Analysis roadmap.
Atmosphere 16 00698 g002
Figure 3. Temporal variation of annual precipitation on the Qinghai–Tibet Plateau for (a) interannual variation of the 63-year annual mean precipitation time series, and (b) the Mann–Kendall test of the annual mean precipitation time series.
Atmosphere 16 00698 g003
Figure 4. Spatial distribution of annual precipitation and its climatic trend rate on the Qinghai–Tibet Plateau ((a) annual precipitation; (b) climatic trend rate).
Atmosphere 16 00698 g004
Figure 5. Interannual variation of the multi-year mean precipitation over the Qinghai–Tibet Plateau during different periods from 1961 to 2023 ((a) 1961–1990; (b) 1971–2000; (c) 1981–2010; (d) 1991–2023).
Atmosphere 16 00698 g005
Figure 6. Spatial distribution of multi-year precipitation over the Qinghai–Tibet Plateau from 1961 to 2023 ((a) 1961–1990; (b) 1971–2000; (c) 1981–2010; (d) 1991–2023).
Atmosphere 16 00698 g006
Figure 7. Spatial distribution of the 200 mm isohyet and its centroid over the Qinghai–Tibet Plateau: (a) 200 mm isohyet; and (b) centroid of the 200 mm isohyet.
Atmosphere 16 00698 g007
Figure 8. Interannual and latitudinal–longitudinal distribution of the 400 mm isohyet over the Qinghai–Tibet Plateau: (a) 400 mm isohyet; and (b) centroid of the 400 mm isohyet.
Atmosphere 16 00698 g008
Figure 9. Spatial distribution of the 200 mm and 400 mm precipitation contours over the Qinghai–Tibet Plateau: (a) 200 mm isohyet; and (b) 400 mm isohyet.
Atmosphere 16 00698 g009
Figure 10. Inter-decadal spatial centroid shifts in the 200 mm and 400 mm isohyets over the Qinghai–Tibet Plateau: (a) 200 mm isohyet; and (b) 400 mm isohyet.
Atmosphere 16 00698 g010
Figure 11. The average altitude trend of precipitation lines such as 200 mm and 400 mm: (a) 200 mm isohyet; and (b) 400 mm isohyet.
Atmosphere 16 00698 g011
Disclaimer/Publisher’s Note: The statements, opinions and data contained in all publications are solely those of the individual author(s) and contributor(s) and not of MDPI and/or the editor(s). MDPI and/or the editor(s) disclaim responsibility for any injury to people or property resulting from any ideas, methods, instructions or products referred to in the content.

