1. Introduction
Urbanization has significantly transformed societies, offering numerous opportunities but also intensifying challenges related to climate change and sustainable development. The rapid expansion and densification of urban areas, driven by exponential population growth, have intensified environmental stressors [
1]. By 2050, nearly 68% of the global population is projected to reside in urban areas, with most of this growth occurring in developing regions [
2]. In Portugal, urbanization mirrors this global trend, with 68% of the population already living in urban areas, a figure expected to reach 75% by mid-century [
3].
Although urban areas occupy only 2% of the Earth’s surface, they are responsible for 70–90% of global greenhouse gas (GHG) emissions, making them critical drivers of climate change [
4,
5,
6]. Urban environments are particularly vulnerable to climate impacts, including rising temperatures and extreme weather events. Among these, the urban heat island (UHI) effect—a phenomenon where urban areas experience higher temperatures than surrounding rural regions—exacerbates thermal discomfort and degrades environmental and human health [
7,
8].
As described by Oke’s energy balance model [
9], population growth, intensive urban development, and changes in land use disturb the urban energy balance, further amplifying these challenges. In Almada, Portugal, for instance, susceptibility to excessive heat is projected to rise significantly, becoming a major risk factor for all parishes due to increasing temperature-related climate parameters [
10]. These conditions highlight the urgent need for localized adaptation strategies and measures to enhance urban climatic resilience, particularly in areas where vulnerable populations are at risk.
Thermal environments influence more than just physical health; they directly affect comfort, productivity, cognitive performance, mental well-being and overall quality of life. The heat stress in urban areas can contribute to psychological distress and reduce mental resilience and well-being. While extensive research has focused on thermal comfort in residential and office buildings [
11,
12,
13], educational settings—particularly outdoor spaces—remain less explored, despite their critical role in supporting learning, social interaction, and recreational activities [
14]. This gap is especially concerning as educational institutions often serve as gathering points for vulnerable populations, such as students and staff, whose thermal comfort directly impacts their cognitive and physical performance [
14,
15].
The main avenue of the NOVA—School of Science and Technology (FCT NOVA) university campus serves as a compelling case to study. This central thoroughfare, connecting key academic and social spaces, experiences high pedestrian traffic but suffers from low aspect ratios, limited shading, and significant global radiation exposure. These conditions contribute to thermal stress, limiting the usability of the space and adversely affecting the well-being of the academic community. Addressing these issues requires a comprehensive understanding of how urban morphology interacts with microclimatic variables, including air temperature, humidity, wind velocity, and global radiation [
16,
17,
18,
19].
Recent advancements in biometeorology have demonstrated the value of human-centric indices, such as the physiologically equivalent temperature (PET) and its modified version (mPET), in assessing outdoor thermal comfort [
20,
21,
22,
23,
24]. Unlike other indices, PET and mPET account for human energy balance, offering thermo-physiological insights critical for localized interventions [
25]. Despite these advancements, studies focusing on high-footfall spaces like university campuses—where academic, social, physical, and mental well-being converge—remain limited, particularly in Portugal. This research is essential to bridge this gap, offering both theoretical and practical contributions to climate-resilient urban planning and design through an interdisciplinary approach. Moreover, it emphasizes the importance of communicating results effectively to non-climatic experts, ensuring broader understanding and applicability.
This study focuses on addressing these gaps by investigating the ‘in situ’ human thermal comfort conditions along the main avenue of the FCT NOVA university campus. In addition to singular variable assessments, using human thermo-physiological analysis through the application of PET and mPET indices, this research aims to accomplish the following:
- I.
Identify and assess the microclimate risk factors across key Points Of Interest on the avenue.
- II.
Propose targeted, nature-based solutions to improve thermal comfort and enhance the resilience of the campus community during periods of climatic stress.
In contrast to most outdoor thermal comfort studies that focus exclusively on diurnal conditions, this research incorporates nocturnal field measurements, enabling a more comprehensive temporal assessment of microclimatic thermal stress. This is particularly relevant for evaluating heat retention and nocturnal discomfort in educational environments with extended evening/nighttime use.
By integrating an interdisciplinary approach—applying a dual-index approach, supported by detailed Sky View Factor (SVF) analysis—and combining localized ‘in situ’ data with records from the regional World Meteorological Organization (WMO) station, to identify critical zones of discomfort, this study delivers original and actionable insights.
The dual data sources not only allowed for cross-calibration and enhanced the reliability of human thermal comfort assessments but also enabled a more refined and site-specific understanding of microclimatic conditions on the university campus—supporting urban planners, decision-makers, and other stakeholders in developing targeted, climate-resilient interventions. The findings will contribute to improving outdoor thermal comfort, fostering well-being, and promoting sustainable urban development in educational contexts.
2. Materials and Methods
This study adopts a quantitative field-based methodology to evaluate outdoor human thermal comfort along the main avenue of the NOVA FCT campus. The approach integrates microclimatic measurements and bioclimatic index calculations to assess spatial and temporal variations in thermal stress levels. The methodology was selected to capture real-world thermal conditions during peak summer periods, using high-resolution environmental data collected ‘in situ’. The application of PET and mPET indices enables a physiologically relevant analysis of thermal comfort, while spatial indicators such as the Sky View Factor (SVF) help characterize urban form and radiation exposure. This section details the study area, data collection procedures, measurement instruments, computational tools, and analytical methods employed.
2.1. Study Area
This study was conducted between the last days of July and the first days of August, during the summer of 2024, on the Main Campus of NOVA FCT, specifically within the main avenue of the campus (
Figure 1).
The NOVA FCT campus (latitude: 38°39′40.23″ N; longitude: 9°12′18.87″ W) is located on the south bank of the River Tagus, in the parish of Caparica, in the municipality of Almada, which is part of the Lisbon Metropolitan Area. It is a region of climatic transition, characterized by a Mediterranean climate with a strong Atlantic influence. The geography and proximity of the Atlantic Ocean, the Arrábida mountain range, and the Tagus River estuary influence the temperature. Thus, the region has a sub-humid Mediterranean climate, with warm or mild winters (where average minimum temperatures are >6 °C) and significant coastal (advection) fogs, especially during the summer, which occur mainly in the morning and sometimes persist throughout the day [
26].
The region has an average annual temperature of approximately 17 °C and an annual rainfall of 585 mm, concentrated mainly between December and February, with around 90 rainy days per year. July and August are the hottest and driest months. Almada is a generally windy area, with predominant NW winds and frequent SW, NE, and N winds. The region also benefits from high solar exposure, averaging around 3000 h of sunlight annually [
26].
The Köppen–Geiger climate classification identifies this specific weather pattern as belonging to the ‘
Csa’ category. Therefore, it corresponds to a ‘temperate climate with hot, dry summers’, defined by a climate with temperatures in the coldest month between 0 °C and 18 °C and, in the hottest month, equal to or greater than 22 °C [
27].
The ‘Csa’ type classification criteria are as follows:
C—Temperate climate (Thot > 10 °C and 0 °C < Tcold < 18 °C);
s—Dry summer (Psdry < 40 mm and Psdry < 1/3 Pwwet);
a—Hot summer (Thot ≥ 22 °C).
Whereby Thot = temperature of the hottest month; Tcold = temperature of the coldest month; Psdry = precipitation in the driest month of summer; and Pwwet = precipitation in the wettest month of winter
The main avenue of the NOVA FCT campus was selected as the study area due to its distinct characteristics, including a low aspect ratio and diverse urban morphology, which influence local microclimatic conditions. This open layout increases pedestrian-level exposure to radiation fluxes, making it an ideal location to conduct an ‘in situ’ analysis of microclimatic parameters and thermo-physiological thresholds. The
Points of Interest (POIs) were strategically established to capture the spatial variability across the campus, encompassing areas with varying exposure to global radiation, wind patterns, and surface materials. This methodological approach ensures a nuanced understanding of how microclimatic conditions differ, including within different sub-areas of urban canyons [
25,
28].
2.2. Measurement Day (MD) Selection
To further ensure robust data collection, the
measurement days (MD1 to MD7) were scheduled between the last days of July and the first days of August, aligning with stable summer weather characterized by high solar radiation and minimal precipitation. These dates were deliberately chosen to capture conditions during the peak of summer, a period associated with extreme heat events. Notably, 2024 has been confirmed as the warmest year on record, with global temperatures reaching approximately 1.55 °C above pre-industrial levels [
29].
This period, supported by data from the Portela meteorological station (Nº 08536) ), offered optimal conditions for consistent and reliable observations while also enabling comparison with the variables collected ‘in situ’. This ensured that the chosen days captured a full spectrum of climatic and microclimatic conditions, which ranged between extreme heat stress levels (e.g., MD2 and MD3, where maximum temperatures exceeded 30.0 °C) to milder conditions (e.g., MD4 to MD7, with average temperatures around 23.0 °C). By including both extreme and moderate human thermo-physiological conditions, the datasets enable a more comprehensive assessment of outdoor human thermal comfort conditions and inform the identification of effective heat mitigation measures.
In addition to temperature variations, wind velocity was considered a crucial factor in the selection of measurement days, as it plays a significant role in modulating thermal comfort [
30,
31]. Including days with contrasting wind conditions (e.g., MD7—higher wind speed; MD2—lower wind speed) allows for a more detailed analysis of wind flow as a mitigating factor in thermal stress, considering its dual role in dissipating heat through convective cooling and enhancing evaporative cooling efficiency [
32,
33,
34]. However, its influence on PET and mPET varies depending on local microclimatic characteristics, including shading and vertical/horizontal surface properties at each POI. This approach provided a solid basis for identifying days with representative microclimatic variations (typical and extreme conditions) across the POIs.
Additionally, the selection aimed to ensure temporal continuity and representativeness by scheduling measurement days consecutively or within short intervals, preventing isolated observations. Data collection was conducted across key times of the day—morning, midday, afternoon, and nighttime—to capture diurnal and nocturnal variations in thermal exposure. Furthermore, the diverse microclimatic characteristics of the POIs, including differences in shading, surface materials, and wind exposure, were considered to enhance the spatial specificity of the analysis during both the nocturnal and diurnal periods.
The following
Table 1 provides a concise overview of the selection criteria for the measurement days.
2.3. Point of Interest (POI) Specification
The purpose of establishing the six POIs was to designate a specific analysis point within the main avenue to assess pedestrian thermal comfort thresholds in that area. The idea of setting up POIs was inspired by studies that examined microclimatic patterns at specific/predefined locations within outdoor areas [
7,
14,
34,
35] (
Table 2).
Figure 2 shows the overall layout of the six designated POIs, which would register (both diurnal and nocturnal) sequential microclimatic conditions. Additionally, this strategic placement allowed for evenly distributed meteorological measurements across the site.
To facilitate a detailed analysis of thermal comfort variations, the POIs were divided into two distinct groups based on their exposure to global radiation and shading characteristics (
Table 3):
2.4. Sky View Factor (SVF) Measurement
Single-point SVF measurements were conducted at each POI to capture the variation in radiation flux exposure within the assessed urban canyon at FCT main avenue. These measurements employed a calibrated height of 1.1 m, representative of pedestrian-level conditions, to provide a fisheye perspective of the sky. The SVF captures the proportion of visible sky at a given location, serving as a proxy for radiation fluxes and shading conditions. Often processed in software, such as RayMan Pro (Version 3.1 Beta) [
36], this parameter ranged from 0 (indicates strong obstruction by buildings or vegetation) to 1 (represents complete sky exposure, e.g., an open field) and significantly influences short- and long-wave radiation exchanges. It is a key input for thermal comfort indices (such as PET and mPET).
This approach aligns with methodologies exemplified in studies, such as Lin et al. [
37], which highlights the significance of SVF in analyzing microclimatic variations and human thermal comfort. This method allowed for a detailed assessment of the prominent variations in global radiation across the POIs, reflecting the differing shading conditions and urban geometries within the FCT campus canyon. The images obtained using a fisheye lens camera are included in the Results Section.
2.5. On-Site Singular Variable Collection
In this study, four different types of meteorological measurements ‘in situ’ were taken: wind speed (v), air temperature (T
a), relative humidity (RH), and global radiation (G
rad). These variables were selected due to their importance in assessing the physiological impact on the human biometeorological system, based on the collected environmental conditions [
38,
39]. These variables give a more concrete understanding of how they relate to human thermoregulation dynamics and interact with the human body [
21].
A portable meteorological instrument—KESTREL 5400 HS with LiNK©—was used to measure climatic variables (see
Appendix A). While this heat stress tracker does have some limitations regarding detailed radiation flux measurements [
40,
41], it is widely recognized for its usefulness in ‘in situ’ and mobile monitoring of human thermo-physiological stress. The measurements were taken at a height of 1.1 m, equivalent to the center of gravity of the human body for standing humans [
42,
43].
To ensure a comprehensive assessment of microclimatic conditions, the singular microclimatic variables measurements were conducted during four distinct time intervals: at dawn, in the morning, in the afternoon, and late at night. These intervals were chosen to capture the diurnal and nocturnal variations in climatic parameters and to assess factors such as global radiation intensity, heat retention, and nighttime cooling effects. The following table (
Table 4) summarizes the time periods and their corresponding justifications.
The morning period (10:00–12:00) was selected instead of earlier hours (e.g., 07:00–09:00) to better represent rising thermal stress after sunrise, as early morning temperatures are often below the PET threshold for physiological discomfort. Similarly, the afternoon interval (14:00–16:00) reflects the typical peak in thermal stress in Mediterranean climates [
39]. These periods were also aligned with typical user activity patterns on campus, ensuring that results reflect real exposure scenarios.
Based on an analysis period of 10 min (in which measurements were recorded every minute for 8 min, followed by 2 min to move and prepare at the subsequent location of interest), it was possible to take measurements at six POIs, consisting of one cycle between the POIs for every hour. This temporal resolution allowed for direct hourly comparison with data from the Portela meteorological station, ensuring alignment and validation of localized in situ measurements.
This evaluation of the study site was repeated 8 times (one time = one cycle) to record the diurnal and nocturnal microclimatic oscillations on the main avenue of the campus. A total of 10,752 measurements were recorded, evenly distributed over 7 visits during the months of July and August.
This distribution method was based upon similar studies [
14,
28,
34,
35] and was designed to (i) obtain an overall climatic assessment of the site; (ii) allow for an acceptable sample of measurements, and (iii) allow the data collected on each field visit to be further processed.
2.6. Adaptation of Wind Velocity (V)
For data obtained from the WMO meteorological station, the V values were adapted to a height of 1.1 m (V
1.1), which represents the average center of gravity of a standing human body [
42,
43]. This adaptation was critical for accurately reflecting the wind conditions experienced by pedestrians and their influence on thermal comfort. In contrast, ‘in situ’ measurements were already recorded at pedestrian level.
2.7. Representation and Communication
To obtain a fixed reference and validate the data collected ‘in situ’ needed for this study, meteorological records were obtained from the World Meteorological Organization (WMO) weather station in Portela, Lisbon, with index Nº 08536. This external dataset was essential to identify representative days within the summer period for a comprehensive analysis of typical seasonal conditions. By utilizing WMO data, this study aligns with established methods in environmental climatology to ensure robust comparisons between localized microclimatic measurements and broader regional trends [
44].
Additionally, the collection of meteorological variables, including cloud cover (octas) and mean radiant temperature (T
mrt), informed the analysis by providing a detailed understanding of radiation fluxes, which is an essential factor in ‘human-centered’ studies on thermal comfort. In particular, ‘
bottom-up’ analytical approaches have identified these variables as key determinants of urban thermal comfort levels [
35,
45,
46,
47,
48,
49]. Cloud cover significantly modulates solar radiation, influencing surface temperatures, heat retention, and human thermal comfort. T
mrt accounts for the combined effects of short and longwave radiation from surrounding surfaces and plays a crucial role in heat exchange between the human body and the environment, significantly influencing perceived thermal stress, particularly in sun-exposed areas. Its inclusion enhances the accuracy of thermal comfort assessments, particularly concerning microclimatic variations across the POIs.
2.8. Climate-Tourism/Transfer-Information Scheme (CTIS)
To aid in the communication of findings, the
Climate-Tourism/Transfer-Information Scheme (CTIS) model was adapted as a primary visualization tool. The CTIS model is a widely recognized approach in environmental and human biometeorology, used to represent complex thermal and climatic conditions in an accessible format [
50]. This tool integrates human biometeorological parameters, such as PET and mPET, into graphical representations that facilitate interpretation by both climate experts and non-specialist audiences, including urban planners, architects, engineers, and policymakers.
In this study, the CTIS model was employed to illustrate variations in thermal comfort across diurnal and nocturnal periods, as well as differences between shaded and sun-exposed POIs. By categorizing PET and mPET values into easily interpretable thresholds of thermal stress, the CTIS model ensures that results are communicable to stakeholders without extensive climatological expertise. This approach is critical for bridging the gap between scientific research and practical applications, particularly in the context of urban environmental planning and climate adaptation strategies [
44].
The CTIS methodology has been demonstrated in previous studies to be an effective medium for correlating climatic variability with urban design and tourism planning [
34,
50]. Its application here highlights not only the importance of translating scientific insights into actionable guidelines for enhancing thermal comfort and mitigating heat stress in urban environments but also underscores the need for effective interdisciplinary communication to ensure that these insights are accessible and actionable across diverse sectors.
2.9. Human Thermo-Physiological Analysis
This study examined the human body’s energy balance within an urban context to assess the thermal environment’s impact on campus users. This biometeorological approach evaluates how the human body perceives a combination of atmospheric elements by utilizing thermo-physiological indexes, specifically the PET and mPET.
As mentioned earlier, the PET is a thermal index based on the Munich energy-balance model for individuals (MEMI), designed to assess the effect of the thermal environment on the human body by examining the heat balance between them [
51]. Therefore, this index was chosen for this study due to its wide application in the field and its adaptability for both indoor and outdoor settings [
32,
34,
52,
53,
54]. It uses Celsius (°C) as the measurement unit, which simplifies collaboration and interdisciplinary understanding with other professionals, including those directly responsible for shaping the urban fabric through climate-resilient planning and design [
55,
56]. Additionally, the PET index relies on readily available data—T
a, RH, V, and G
rad—which aligns with the MEMI model, making it well suited for assessing thermal comfort in urban climate studies.
As for the mPET index, it was selected for this study because of (1) its advanced thermoregulation model, which includes multiple body segments, along with (2) an enhanced clothing model that provides a more precise representation of human bio-heat transfer [
20]. Compared to PET’s simpler two-node model, mPET is more effective in assessing heat exchange between the body’s inner and outer layers. According to some studies [
20,
57], unlike PET outcomes, research shows that mPET reports fewer “extreme heat stress” instances and indicates a higher likelihood of comfortable (or “no thermal stress”) conditions.
Following a methodological approach similar to those used in studies by Alcoforado et al. [
58] and Nouri and Costa [
35], meteorological data from field measurements were analyzed to quantify pedestrian thermal comfort by identifying PET and mPET values. Similar to other studies [
34,
36,
59,
60,
61], the data were processed using the RayMan Pro model [
36] to calculate the PET index [
33] and the more recent mPET index [
20]. The RayMan Pro model has been widely validated in outdoor thermal comfort studies and is recognized for its ability to simulate complex urban environments using site-specific inputs such as SVF, radiation fluxes, and urban morphology [
33,
36,
60]. Numerous peer-reviewed studies have confirmed the model’s reliability for PET calculations in both Mediterranean and other climate zones [
55,
58]. One key advantage of RayMan is its relatively low data requirement while offering high accuracy for human-biometeorological assessments. However, it has limitations, such as its static human profile assumptions (e.g., fixed activity level and metabolic rate), which may not reflect all real-world behavioral adaptations. Despite this, its strong balance between precision, transparency, and usability makes RayMan Pro a preferred tool for fine-scale outdoor comfort assessment, particularly in academic and urban design applications.
The RayMan model was calibrated using the default “standardized man” profile, which represents a height of 1.75 m, a weight of 75 kg, an age of 35, clothing insulation (clo) of 0.90, and an internal heat production of 80 watts [
21,
33,
60].
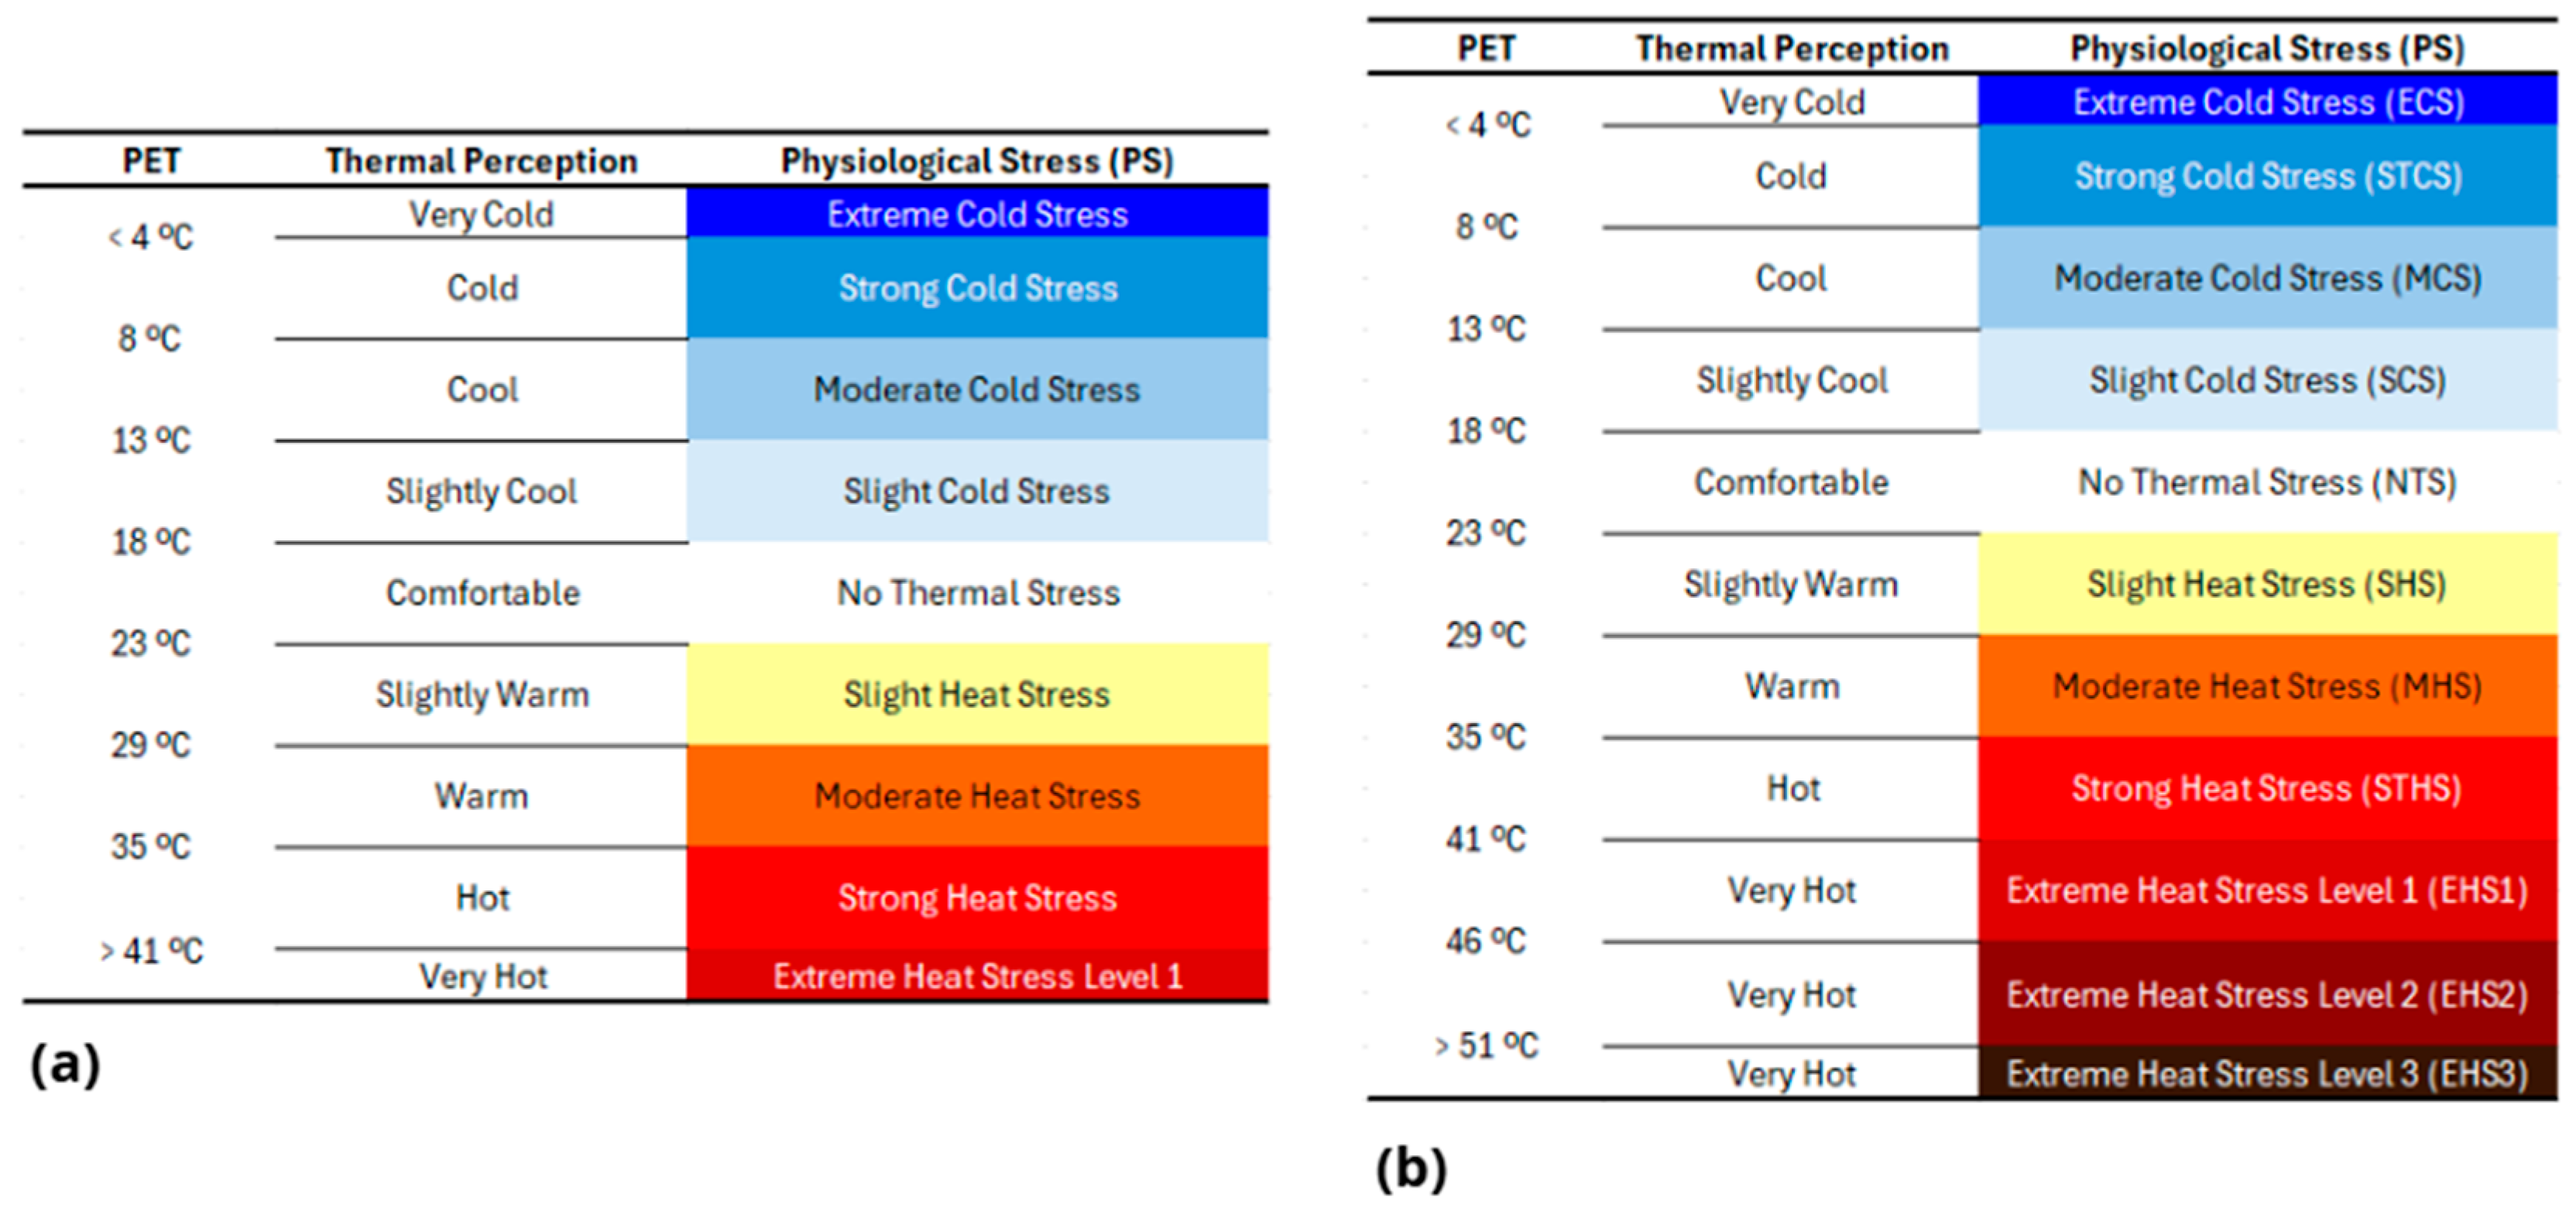
Additionally, a comparative chart was utilized to determine the level of
physiological stress (PS). This allowed the results to be compared to various levels of human thermal perception and PS, as presented in
Figure 3.
The expected increase in global temperatures and, specifically, urban heat stress presents critical challenges for understanding and managing human thermal comfort. Nonetheless, recent climate projections based on
Representative Concentration Pathways (RCPs)—notably RCP 8.5 [
62], a scenario associated with severe global warming outcomes—suggest that PET values may rise substantially, often surpassing current extreme stress categories. Studies such as Matzarakis and Amelung [
48] estimate PET increases in Mediterranean climates of up to 15 °C by the century’s end, with Lisbon facing potential PET increases between 10 °C and 12.5 °C. Consequently, the highest “
Extreme Heat Stress” (EHS) classification within the PET scale, previously capped at a PET of 41 °C, may no longer accurately represent conditions in such future climates.
To accommodate the PET and mPET results, and similar to other studies [
34,
35,
45,
46], two new categories were added beyond the original EHS grade, with each physiological threshold increasing by approximately 5 °C within the existing grading system. As outlined in
Figure 3b, the PS grades were extended to include these additional categories above a PET value of 41 °C.
This extension not only aligns with anticipated temperature increases but also provides a more nuanced understanding of human thermoregulatory responses under intensified heat conditions. Expanding PS classes also opens new avenues for urban climate adaptation strategies, enabling local planners and policymakers to better anticipate and mitigate future thermal risks [
49,
63,
64,
65]. Such efforts will be instrumental in enhancing the accuracy of thermal comfort indices as part of integrated measures for climate-resilient adaptation.
3. Results
The findings of this study indicated clear variations in the PET and mPET indices depending on exposure to global radiation and the type of shading present. The data were categorized into POIs with consistent shade (natural or artificial) and those exposed to direct solar radiation, allowing a comparative analysis during both diurnal and nocturnal periods.
3.1. Microclimatic Parameters in POIs
The quantitative analysis of microclimatic parameters at the selected POIs on the NOVA FCT campus provides insight into the thermal conditions experienced during the study period. The Ta, V, Tmrt, and the derived thermal indexes, PET and mPET, were measured and analyzed across different days in July and August to capture diverse thermal and environmental conditions.
3.1.1. Singular Microclimatic Variables
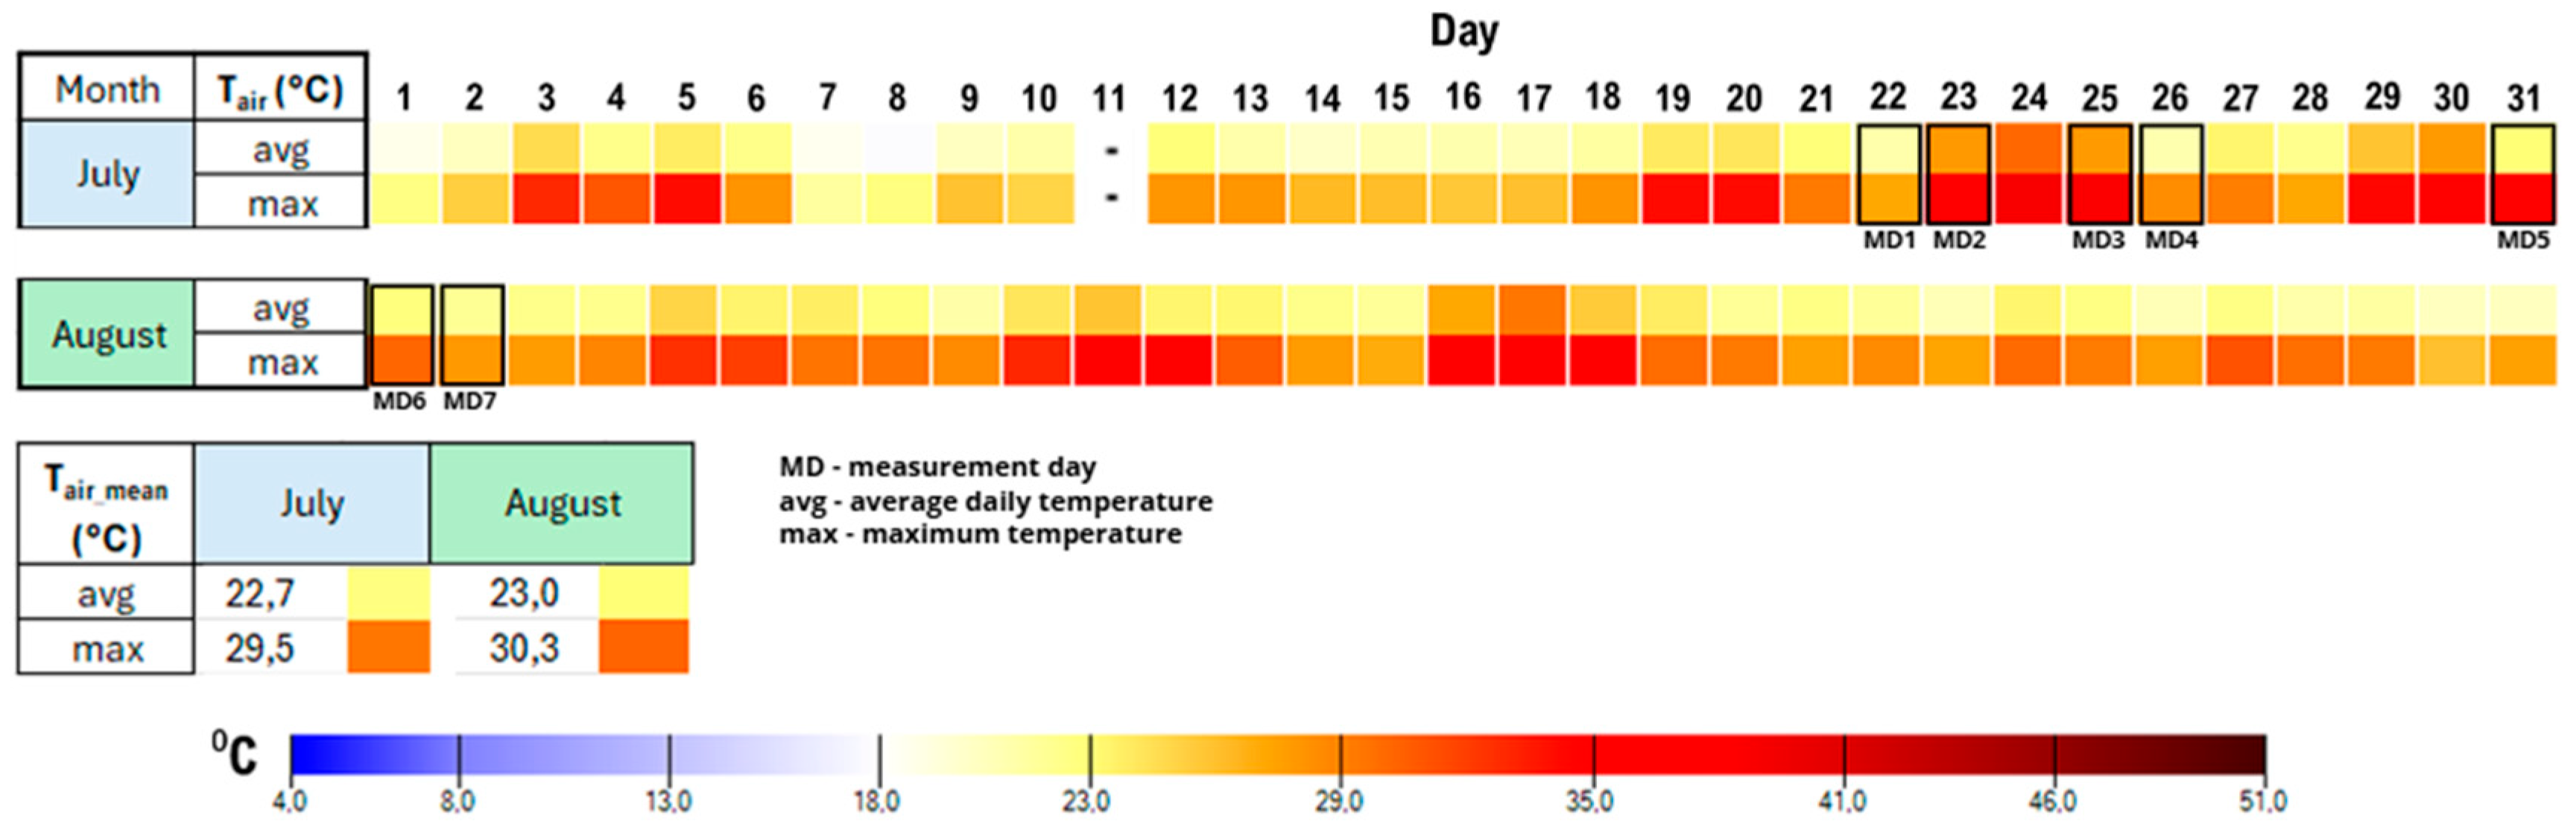
The average and maximum T
a (=T
air) values were analyzed for July and August, as shown in
Figure 4. A significant variation is observed on the measurement days (MD1 to MD7), with average daily values of 22.7 °C in July and 23.0 °C in August, and average maximums of 29.5 °C and 30.3 °C, respectively.
Measurement days such as MD2 and MD3 in July represented days with elevated temperatures (exceeding 30.0 °C) where EHS conditions are more likely to occur. On these measurement days, the recorded average daily temperature was 27.7 °C and 28.0 °C, respectively. These extremes typically occur between 10:00 and 15:00, aligning with the critical period for outdoor thermal discomfort at each POI, with thermal peaks observed from late morning to early afternoon.
In contrast, the inclusion of days with slightly lower average temperatures (MD1, MD4, MD5, MD6, and MD7) exhibited average temperatures closer to 23.0 °C, providing a basis for comparison and a better understanding of thermal relief conditions during days that presented lower extreme heat conditions.
Additionally, the measurement days were chosen to capture diverse wind conditions, which directly influence heat dissipation and reflect their role in thermal comfort.
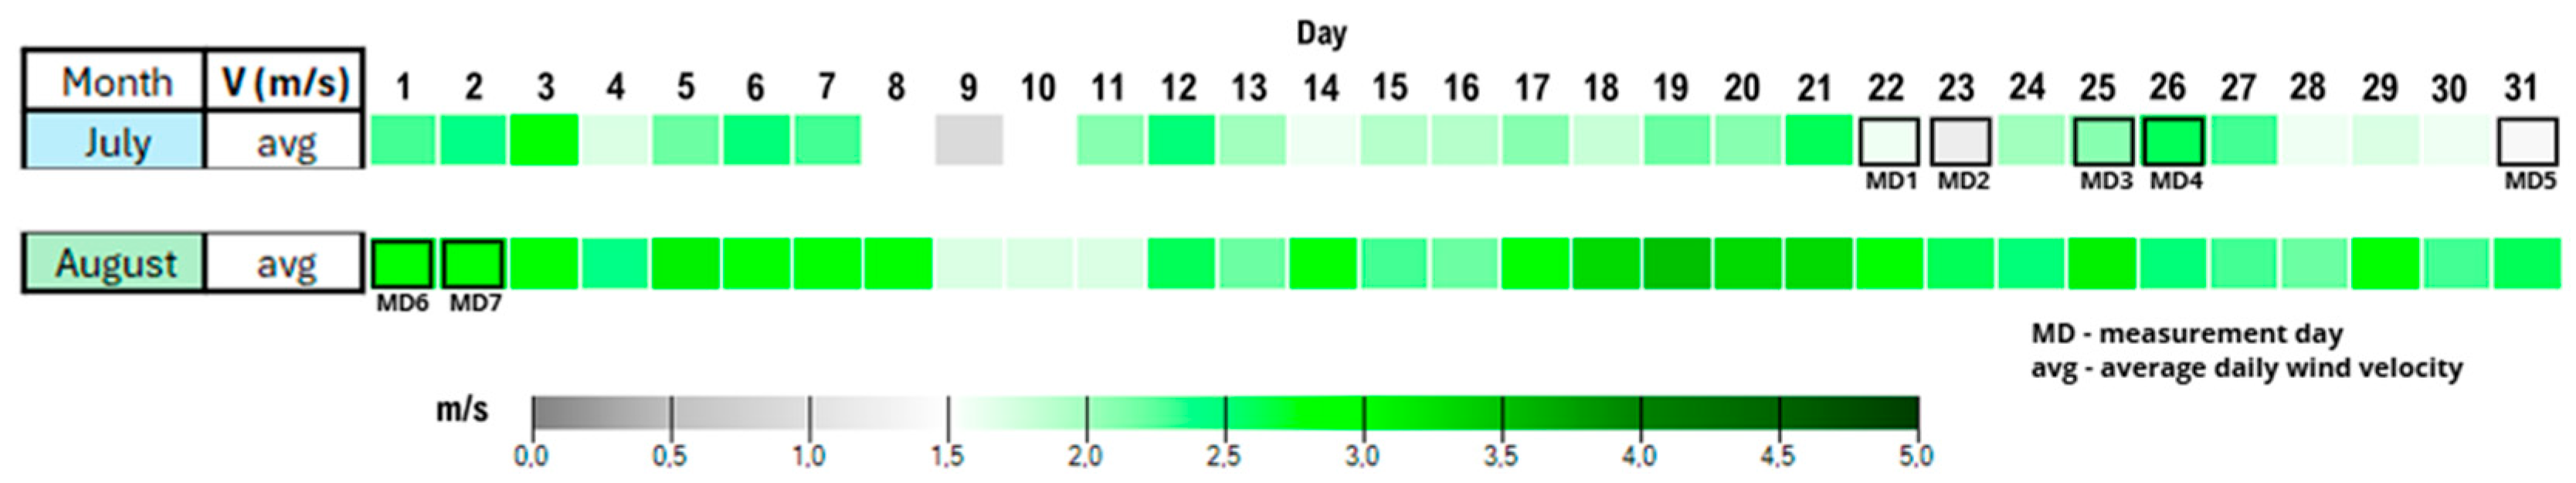
The average adapted wind velocity (V
1.1) values (
Figure 5) exhibit less variability in July, with stronger winds recorded on MD3 and MD4 (2.1 and 2.6 m/s, respectively). In August, values are generally higher, ranging from 1.7 to 3.5 m/s during the entire month. On measurement days MD6 and MD7, the recorded value of V
1.1 was 2.8 m/s and 3.0 m/s, respectively.
Days with high wind velocity, such as MD6 and MD7, recorded V1.1 ranging between 2.1 and 3.0 m/s, which contributed to enhanced convective cooling during the hottest hours of the day. On the other hand, days with low wind velocity, including MD1 and MD2, were characterized by average reduced V1.1 (<2.0 m/s), intensifying thermal stress due to limited airflow, particularly in areas with higher exposure to global radiation.
By including days with contrasting wind velocities during the summer months, this study captures the influence of wind flow as a critical mitigating factor in thermal stress.
3.1.2. Mean Radiant Temperature (Tmrt) and Sky View Factor (SVF) Analysis Across POIs
The SVF values for each POI, analyzed alongside the sun path trajectory (
Figure 6), provide critical insights into shading duration and its impact on T
mrt. These values represent the proportion of visible sky at each POI, directly affecting exposure to global radiation dynamics and, consequently, the observed T
mrt patterns. POIs with a high SVF experience prolonged solar exposure, leading to elevated T
mrt (
Figure 7), while those with a lower SVF benefit from extended shading, resulting in reduced T
mrt.
Table 5 below summarizes key values across POIs.
These findings demonstrate the critical role of the SVF in determining shading duration and Tmrt. The SVF directly influences the Tmrt at each POI, with higher SVF values correlating with greater solar exposure and elevated Tmrt, and lower SVF values corresponding to increased shading and reduced Tmrt. Within the context of a university campus—where outdoor spaces are used for a variety of daily activities such as walking between classes, leisure, and physical exercise—these findings underscore the importance of shading as a fundamental bioclimatic and urban design measure to mitigate heat stress and enhance outdoor human thermal comfort, particularly in educational environments with high solar exposure.
3.1.3. EBM Indices
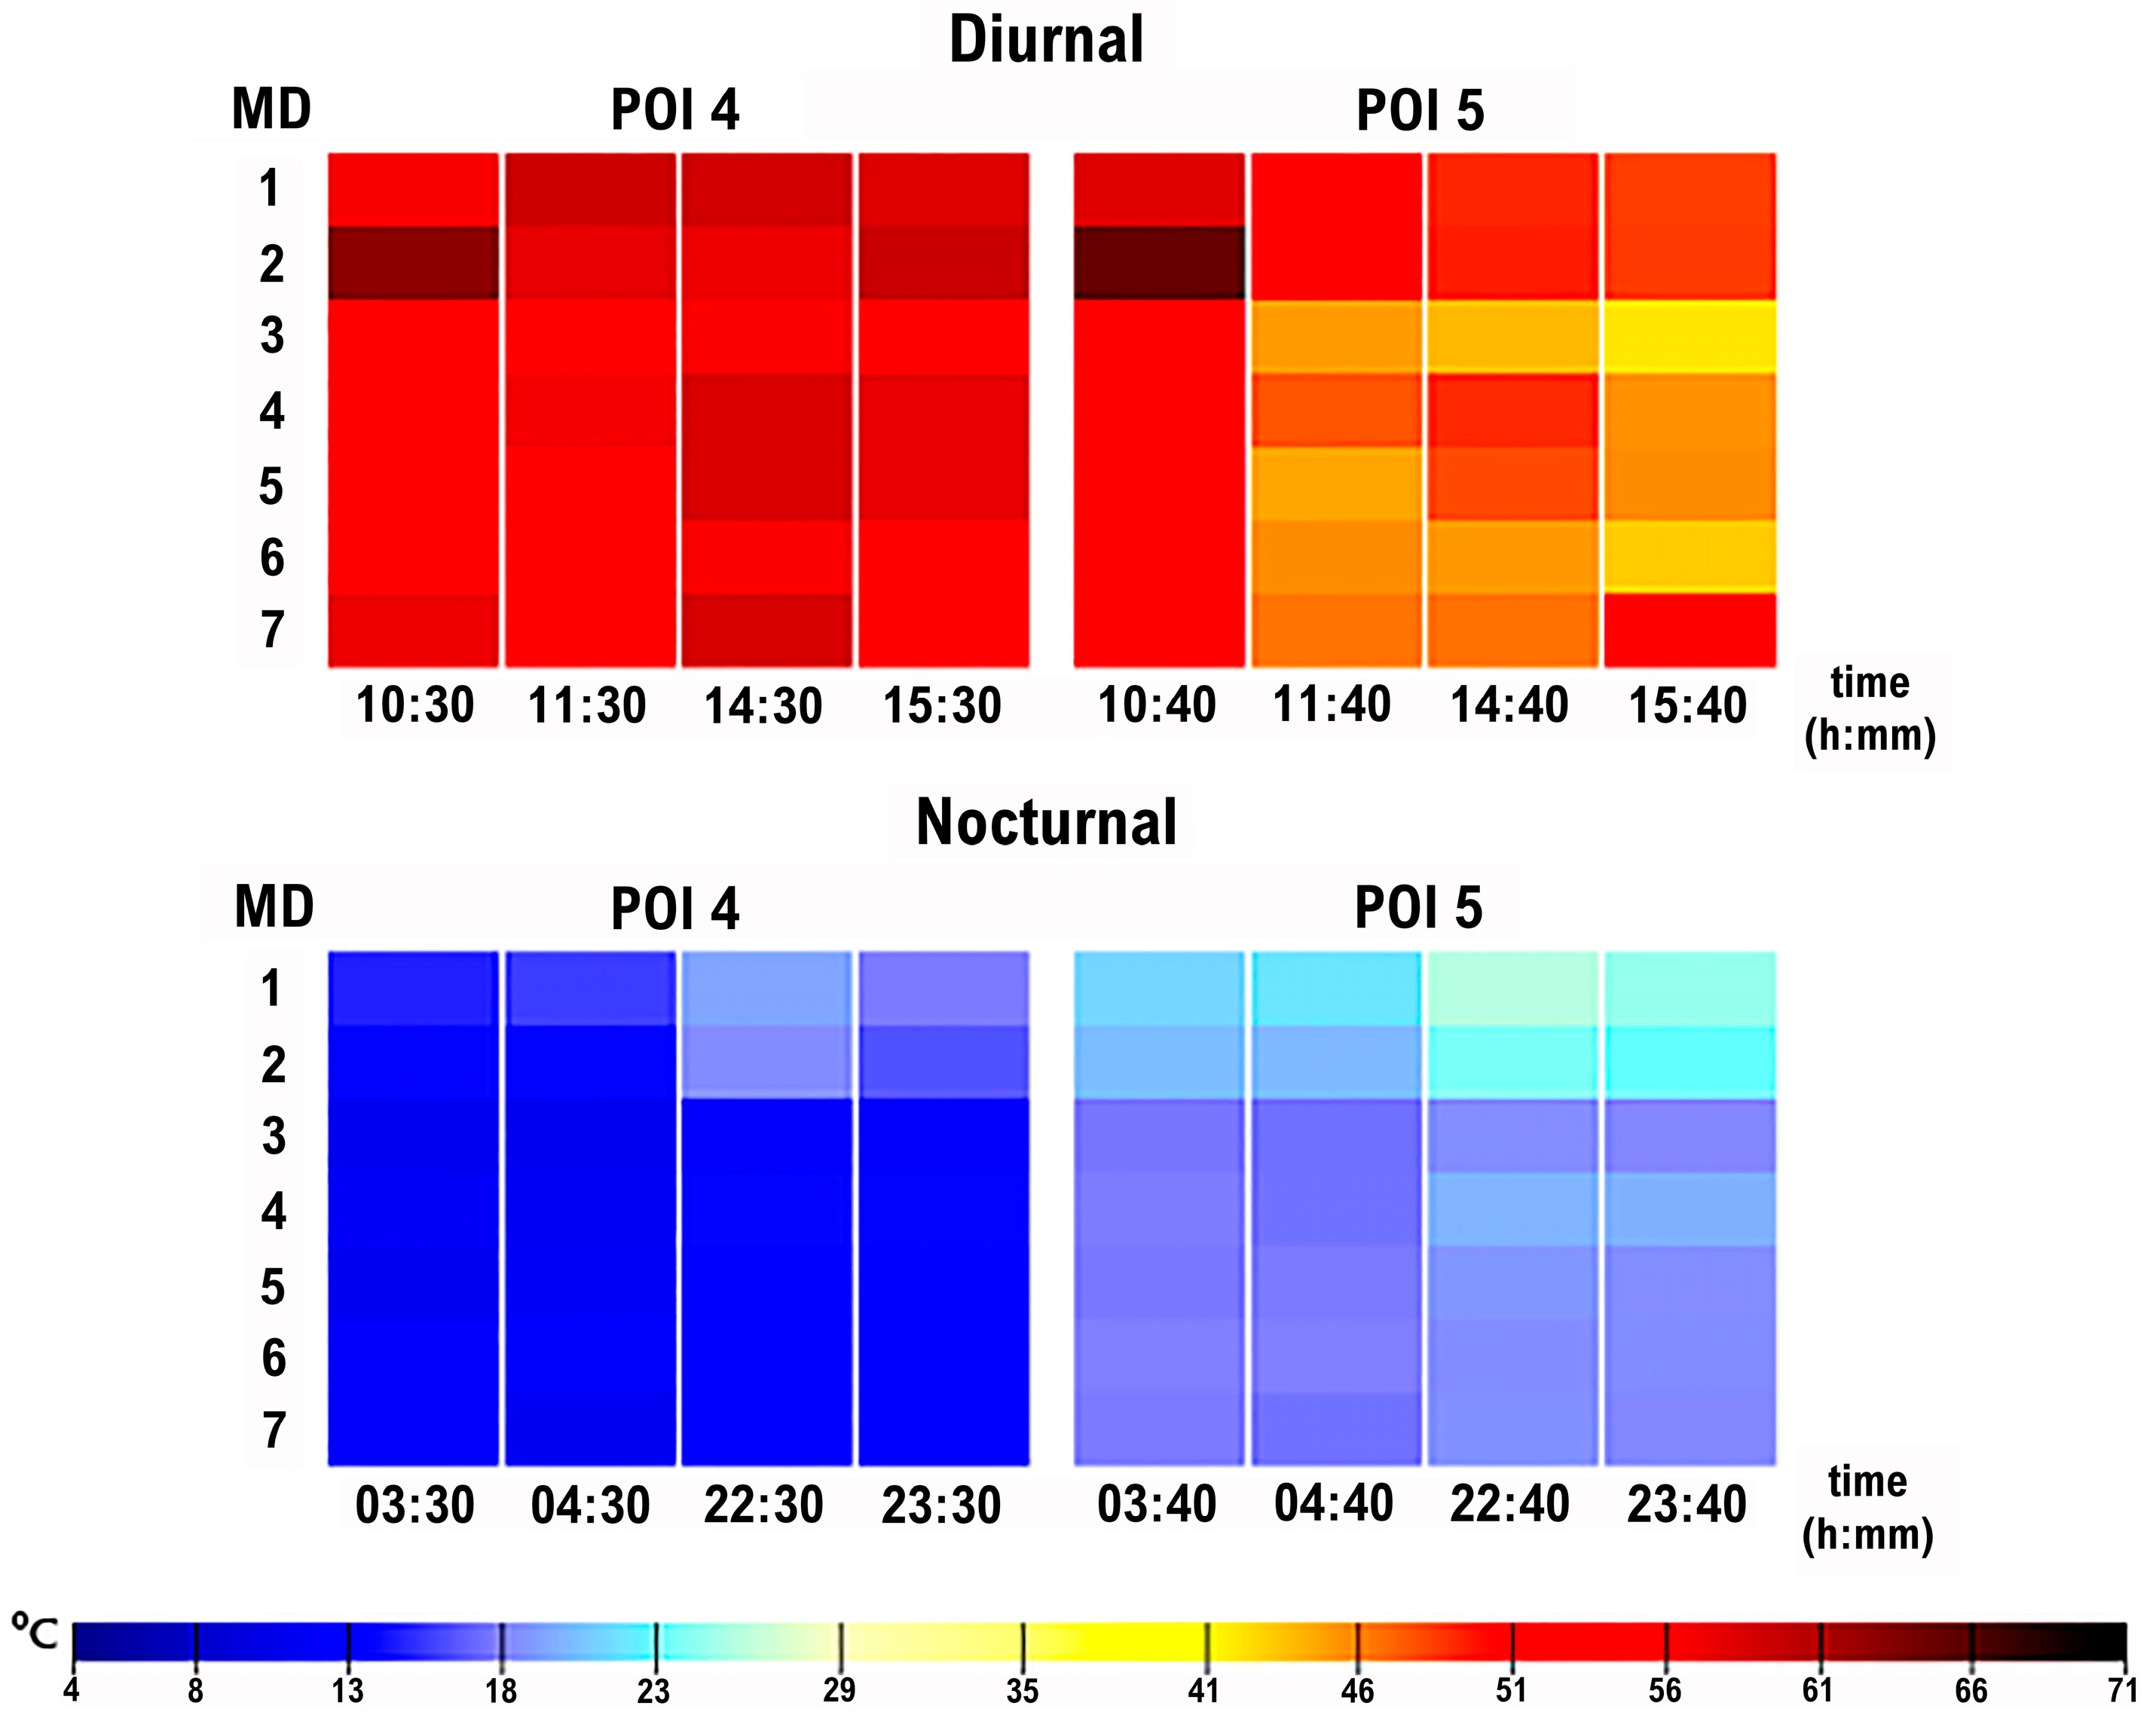
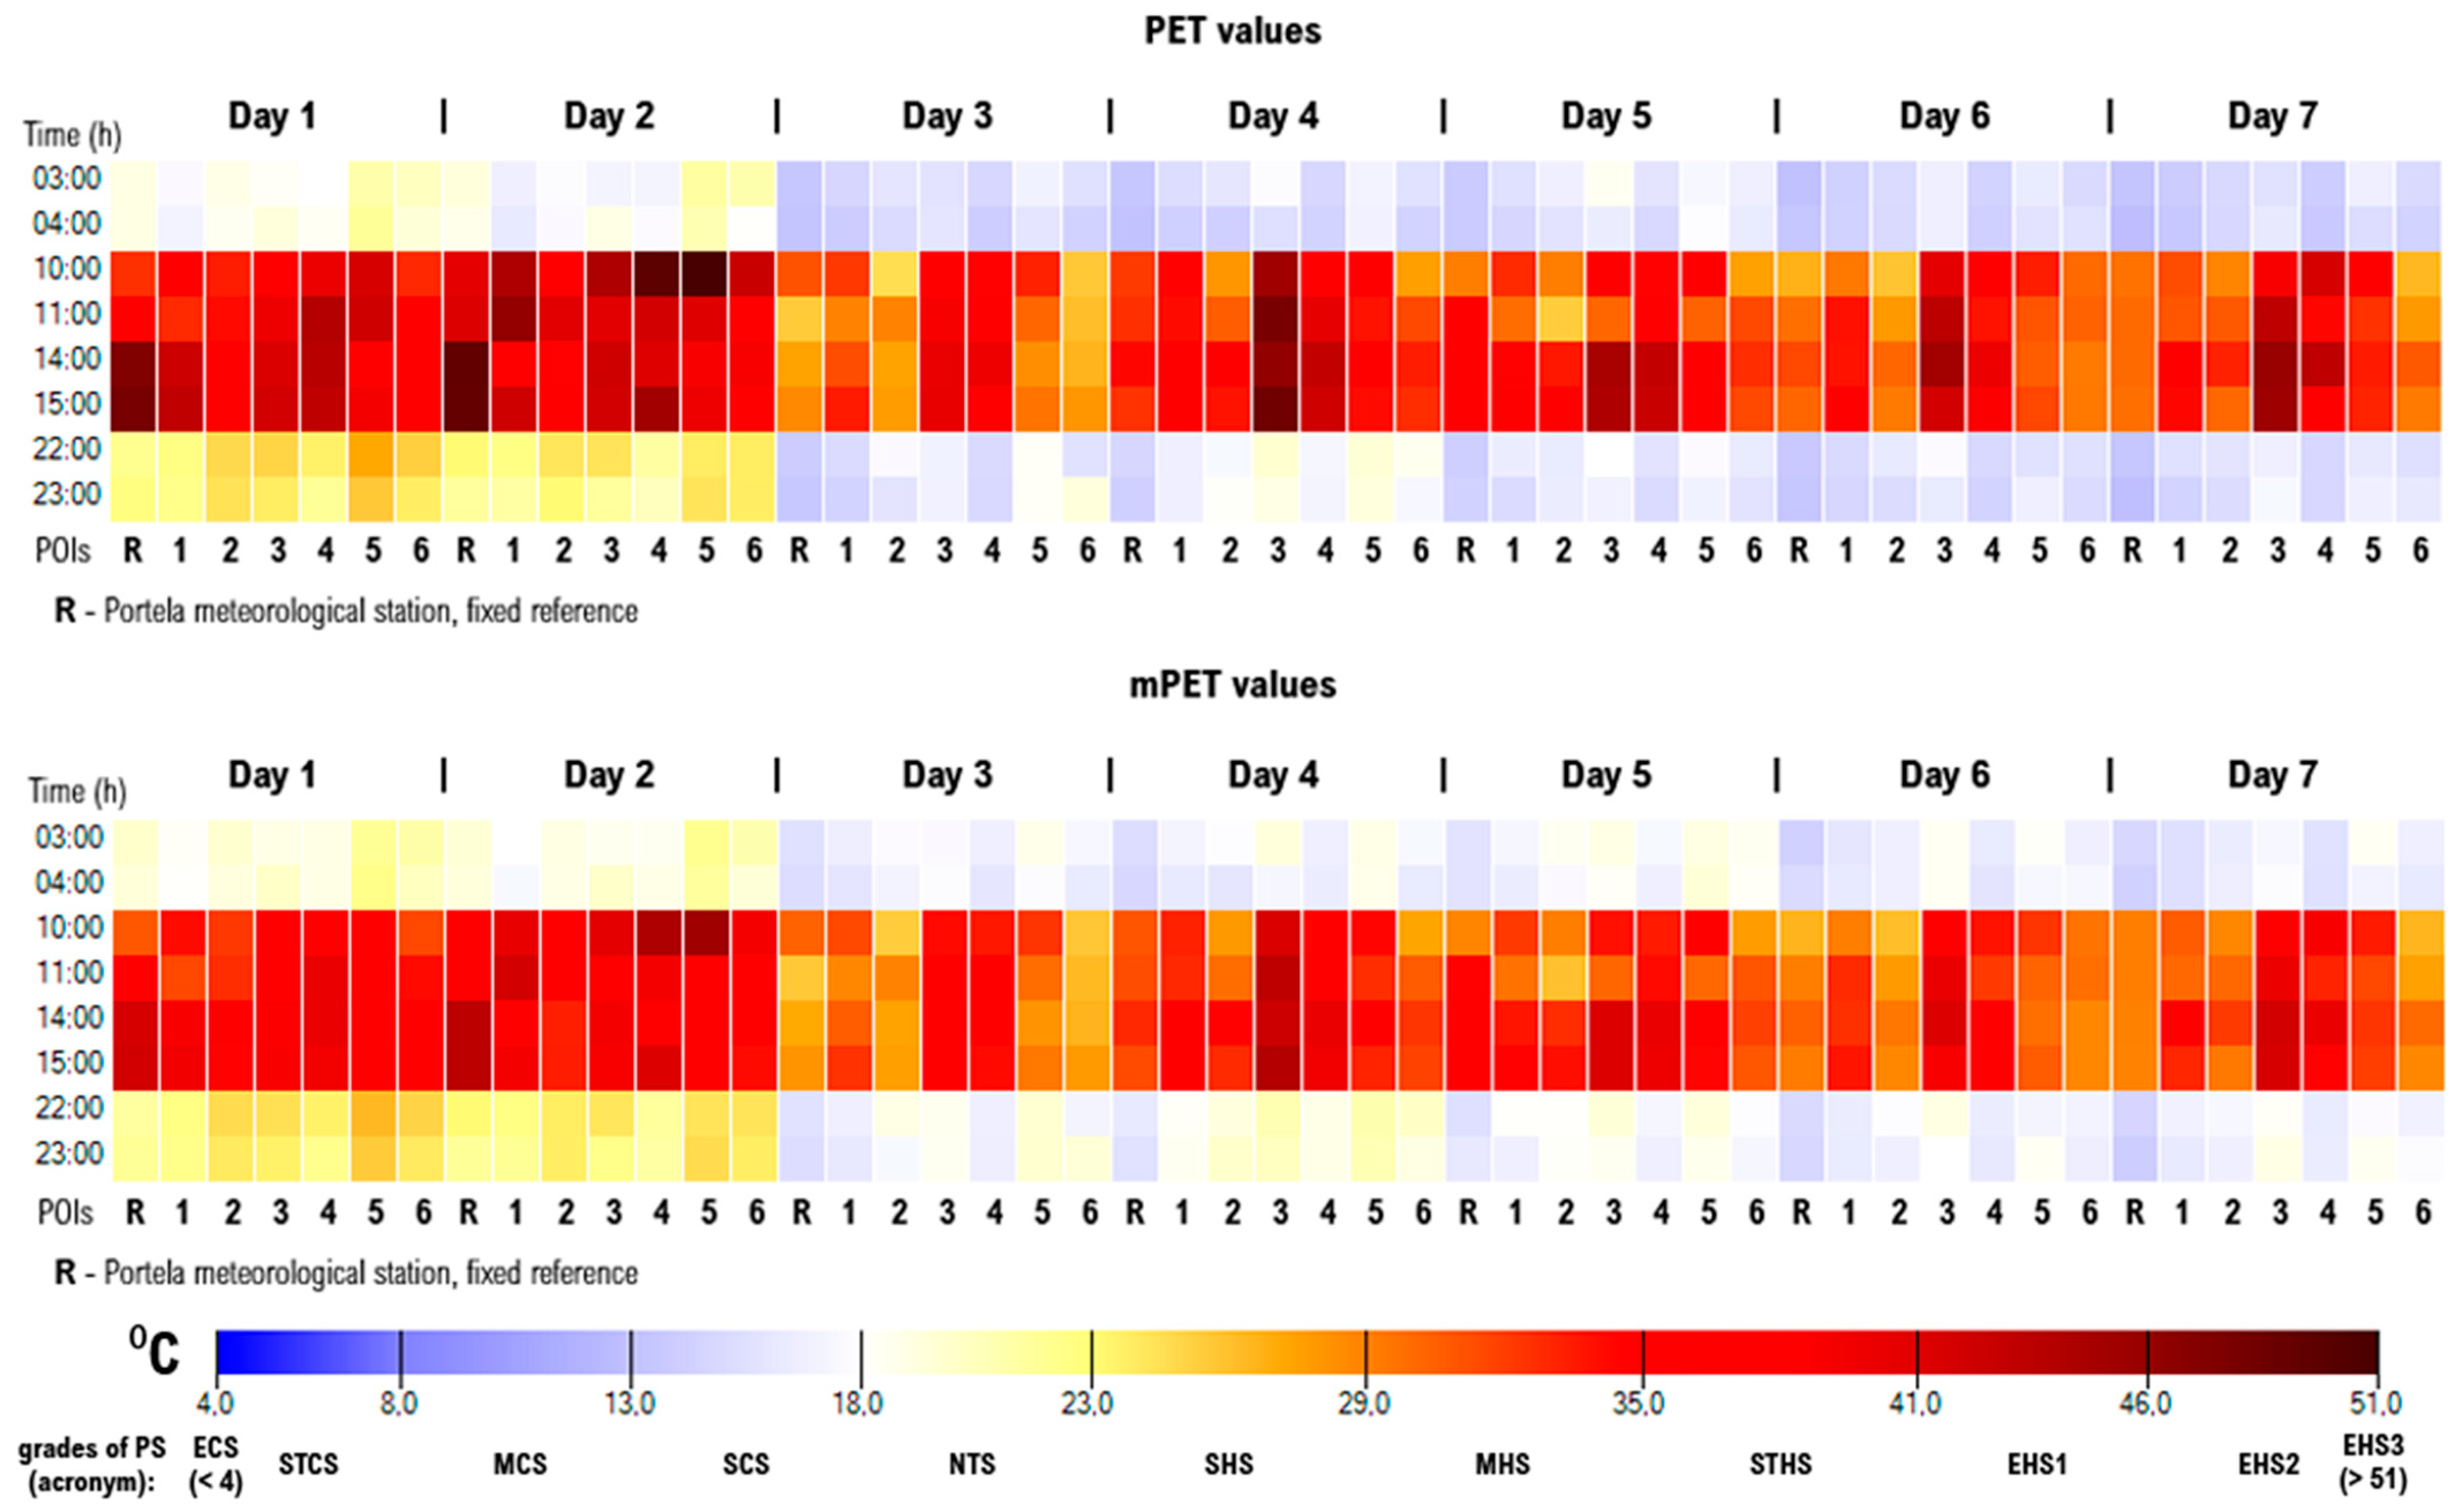
Figure 8 represents a comparison of PET and mPET mean values for the seven measurement days at different times of the day (diurnal and nocturnal times) across the six POIs along with a fixed reference station (
R, Portela meteorological station).
Figure 9 (see
Appendix B-
Figure A1), which represents the variation between PET and mPET values obtained and the reference station (
R) on MD2 and MD6, serves as a valuable complement to the previous heatmaps of average PET and mPET values (
Figure 8). Positive values suggest greater human thermal stress at the POI compared to the reference, while negative values indicate improved comfort. By focusing on deviations from a fixed reference, this graph highlights the influence of local microclimatic conditions—including shading, wind exposure, and urban geometry—at each POI and allows for a more precise spatial comparison.
During daytime hours (10:00–15:00), G2 POIs, particularly POI 3 and POI 4, consistently showed the highest PET and mPET values, resulting in critical levels of PS and EHS. PET values in POI 3 often exceeded 41 °C, with deviations reaching +12 to +16 °C compared to the reference station, while mPET values ranged between +10 and +13 °C. POI 4 exhibited slightly lower deviations (+6 to +13 °C for PET and +4 to +11 °C for mPET), while POI 1 showed moderate deviations (+3 to +7 °C for PET and +2 to +6 °C for mPET). These results confirm the dominant role of direct solar radiation in driving heat stress, with peak deviations occurring at 11:00 and 14:00, coinciding with the highest solar angles.
In contrast, POIs with extensive shading, i.e., locations with >8 h of shade (G1 POIs), experienced significantly lower PET and mPET values, demonstrating the cooling effect of vegetation and urban morphology. PET deviations at these locations ranged from −10 to −15 °C (POI 2) and −9 to −14 °C (POI 6), while mPET deviations were between −6 and −10 °C and −6 and −9 °C, respectively. These cooling effects were particularly evident on MD1 and MD2 in the afternoon (14:00–15:00) and on MD5 at 11:00, reinforcing the importance of shading as a mitigation strategy.
Overall, PET and mPET trends align; however, PET values exhibited more significant oscillations (
Figure 9), particularly shifting from neutral to higher thermal conditions. This highlights its greater sensitivity to direct solar exposure and its enhanced responsiveness to microclimatic variations—making it a valuable indicator for identifying localized thermal stress hotspots in campus environments.
At night (03:00–04:00 and 22:00–23:00), thermal stress was significantly reduced across all POIs due to the absence of solar radiation and the decreased air temperature. PET values ranged between 18 and 23 °C in several POIs (e.g., POI 2 and POI 3), indicating NTS, while others (e.g., POI 5 and POI 6) showed slightly higher values (23 to 29 °C), corresponding to SHS. mPET values followed a similar pattern, generally between 13 and 23 °C, corresponding to a PS between SCS and NTS.
However, heat retention effects were evident in POIs with a low SVF, where nocturnal PET and mPET values were slightly elevated. In particular, POI 5 and POI 6 showed positive deviations in PET (2 to 3 °C) and mPET (1 to 3 °C) during MD1 and MD2 at 03:00–04:00. On other nights, residual heat storage resulted in small positive deviations (1 to 5 °C PET and 0 to 5 °C mPET) across all POIs (see
Appendix B).
3.2. Impact of Local Microclimate on Human Thermal Comfort
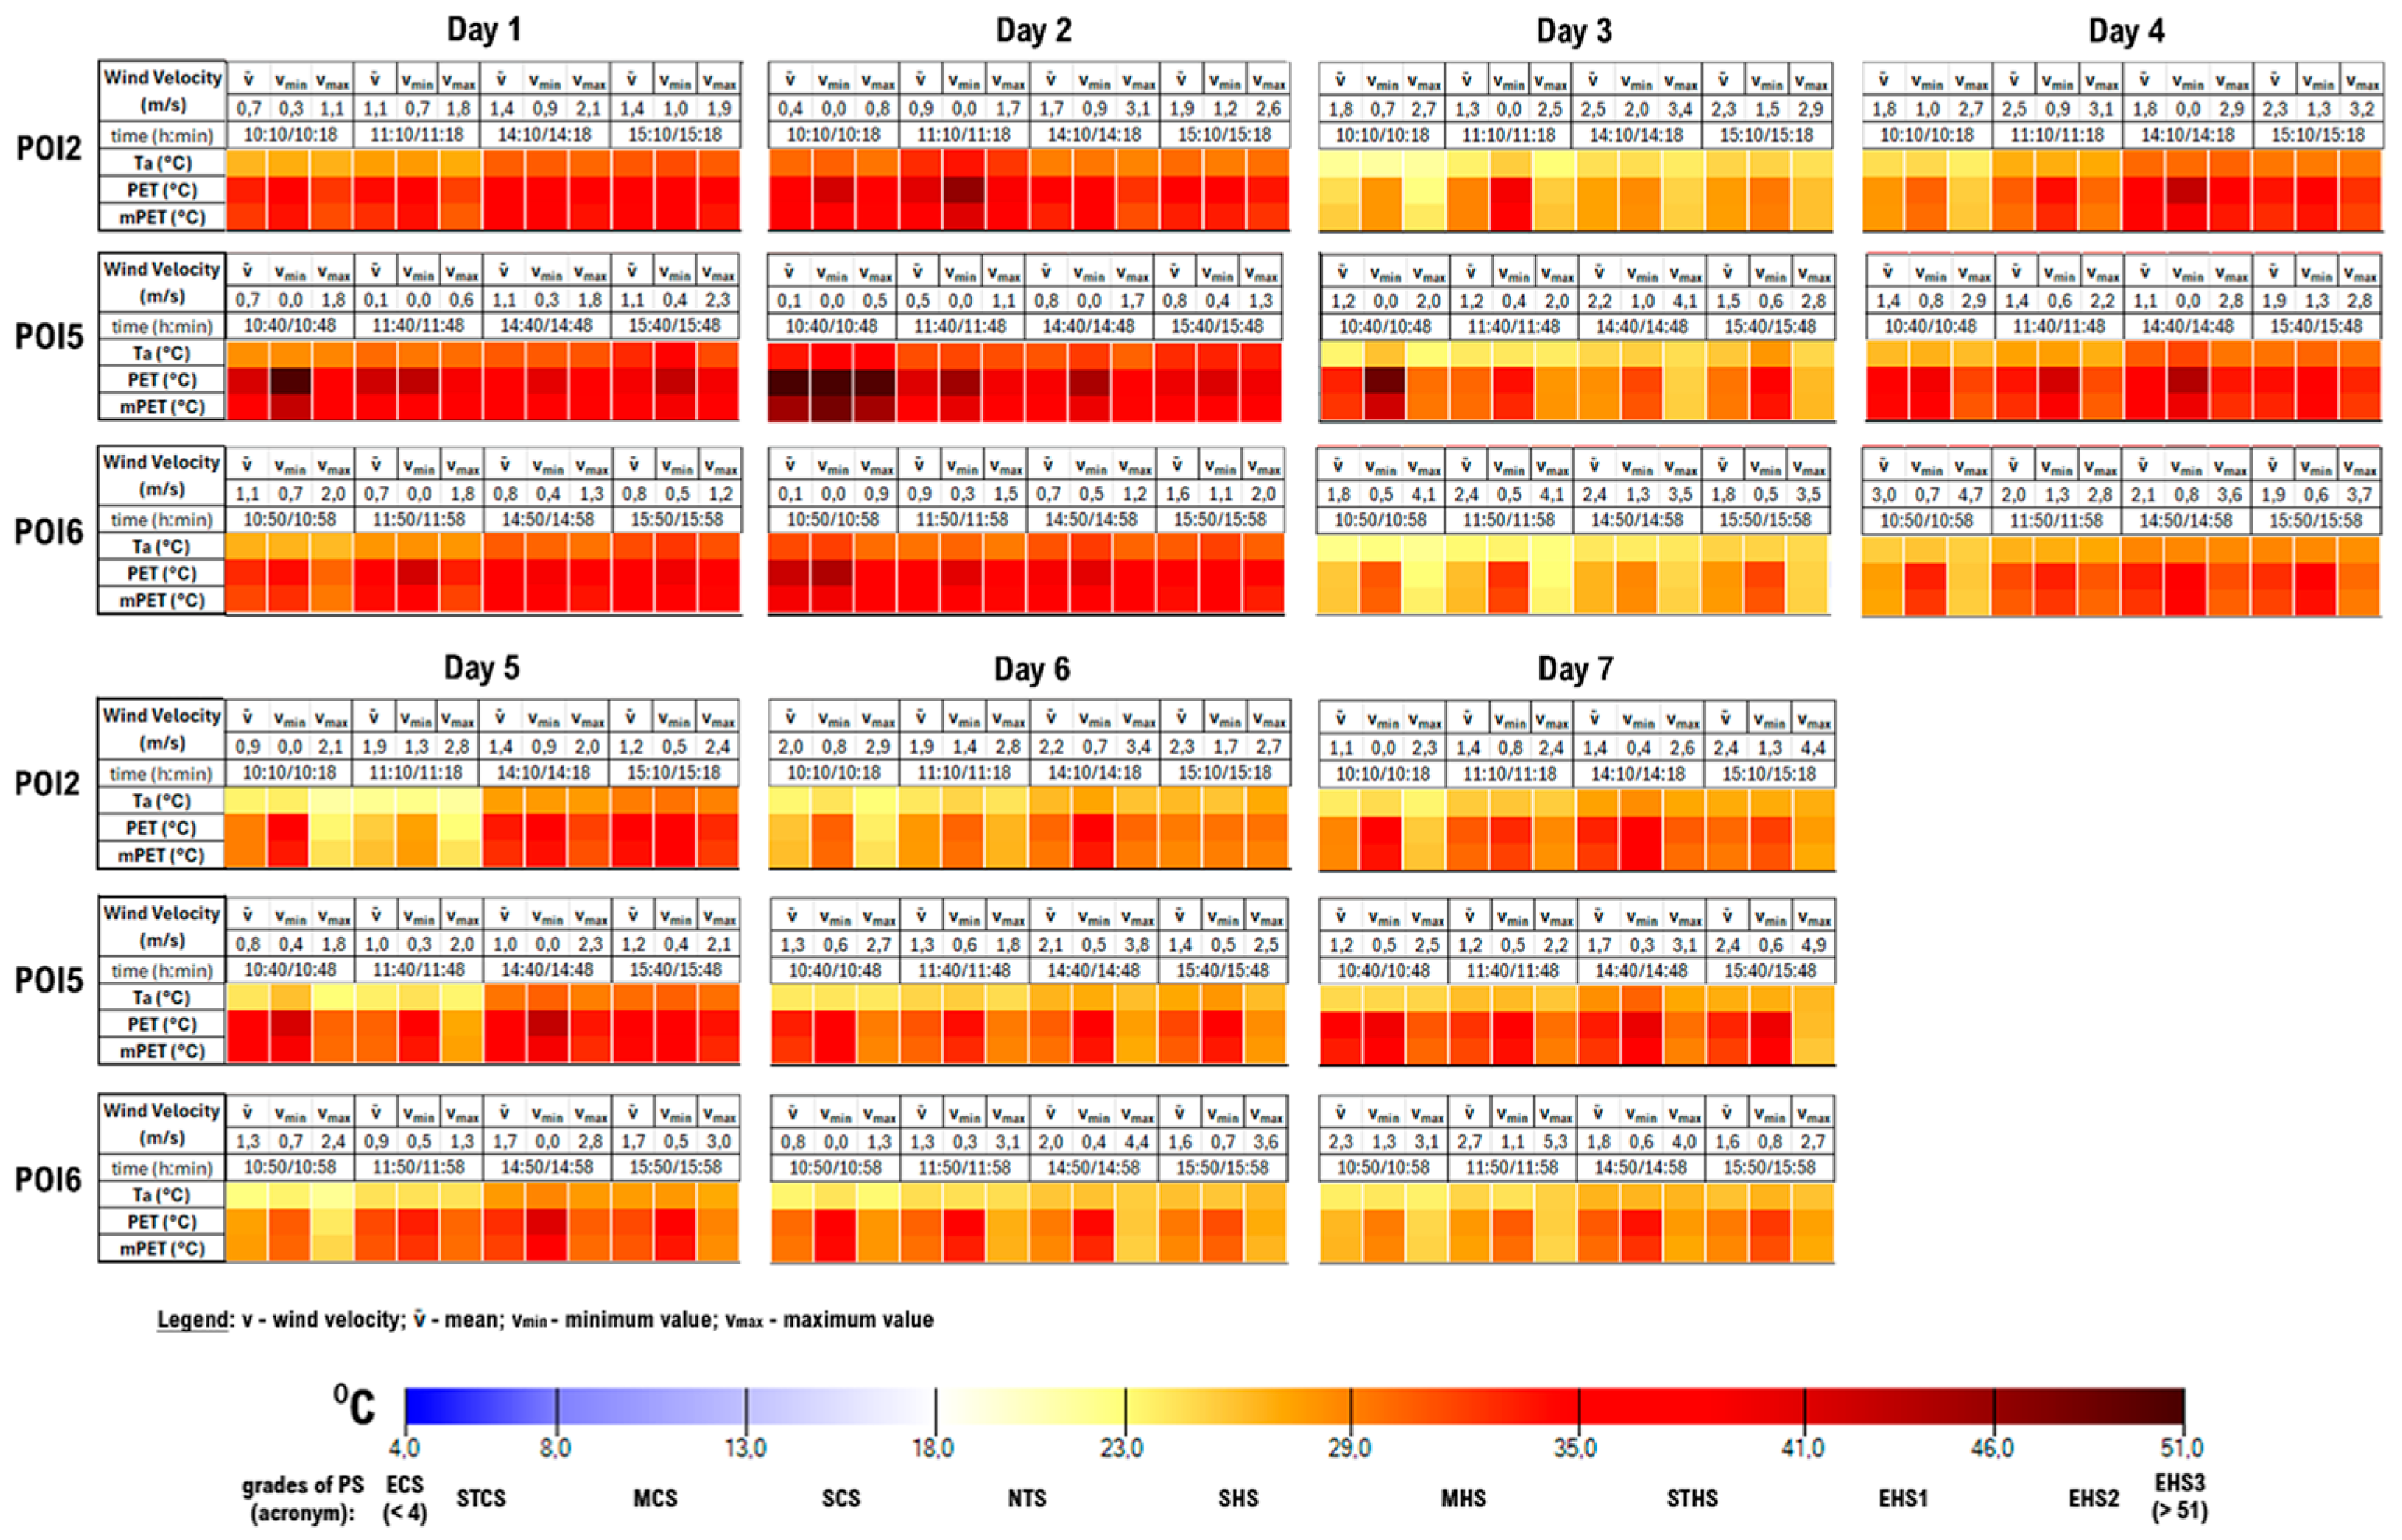
Appendix C (1 to 4) shows the results of T
a, PET, and mPET indices concerning V (average, minimum, and maximum) at different POIs during both diurnal and nocturnal periods. These figures provide detailed insights into the human thermal comfort conditions influenced by global radiation, shading, and wind variability. The PET and mPET values are accompanied by their respective stress grades, based on thresholds for cold stress (ECS, MCS, and SCS) and heat stress (SHS, MHS, STHS, and EHS1 to EHS3). The following observations are detailed to effectively compare the POIs based on their PET and mPET values and the corresponding PS grades.
3.2.1. Effect of Wind Speed
Wind speed effect is clearly observed (see
Figure A2), for example, in G1—POI5 on MD3, at 10:40, for a V
1.1 min value of 0.0 m/s and a T
a of 25.9 °C, the PET value is 48.6 °C, and the mPET value is 42.1 °C, corresponding to a PS of EHS2 and EHS1, respectively. Meanwhile, for a V
1.1 max of 2.0 m/s and a T
a of 23.1 °C, the PET value is 29.8 °C, and the mPET value is 29.5 °C, corresponding to a PS of MHS. These findings emphasize that even a slight increase in wind speed can substantially reduce thermal stress.
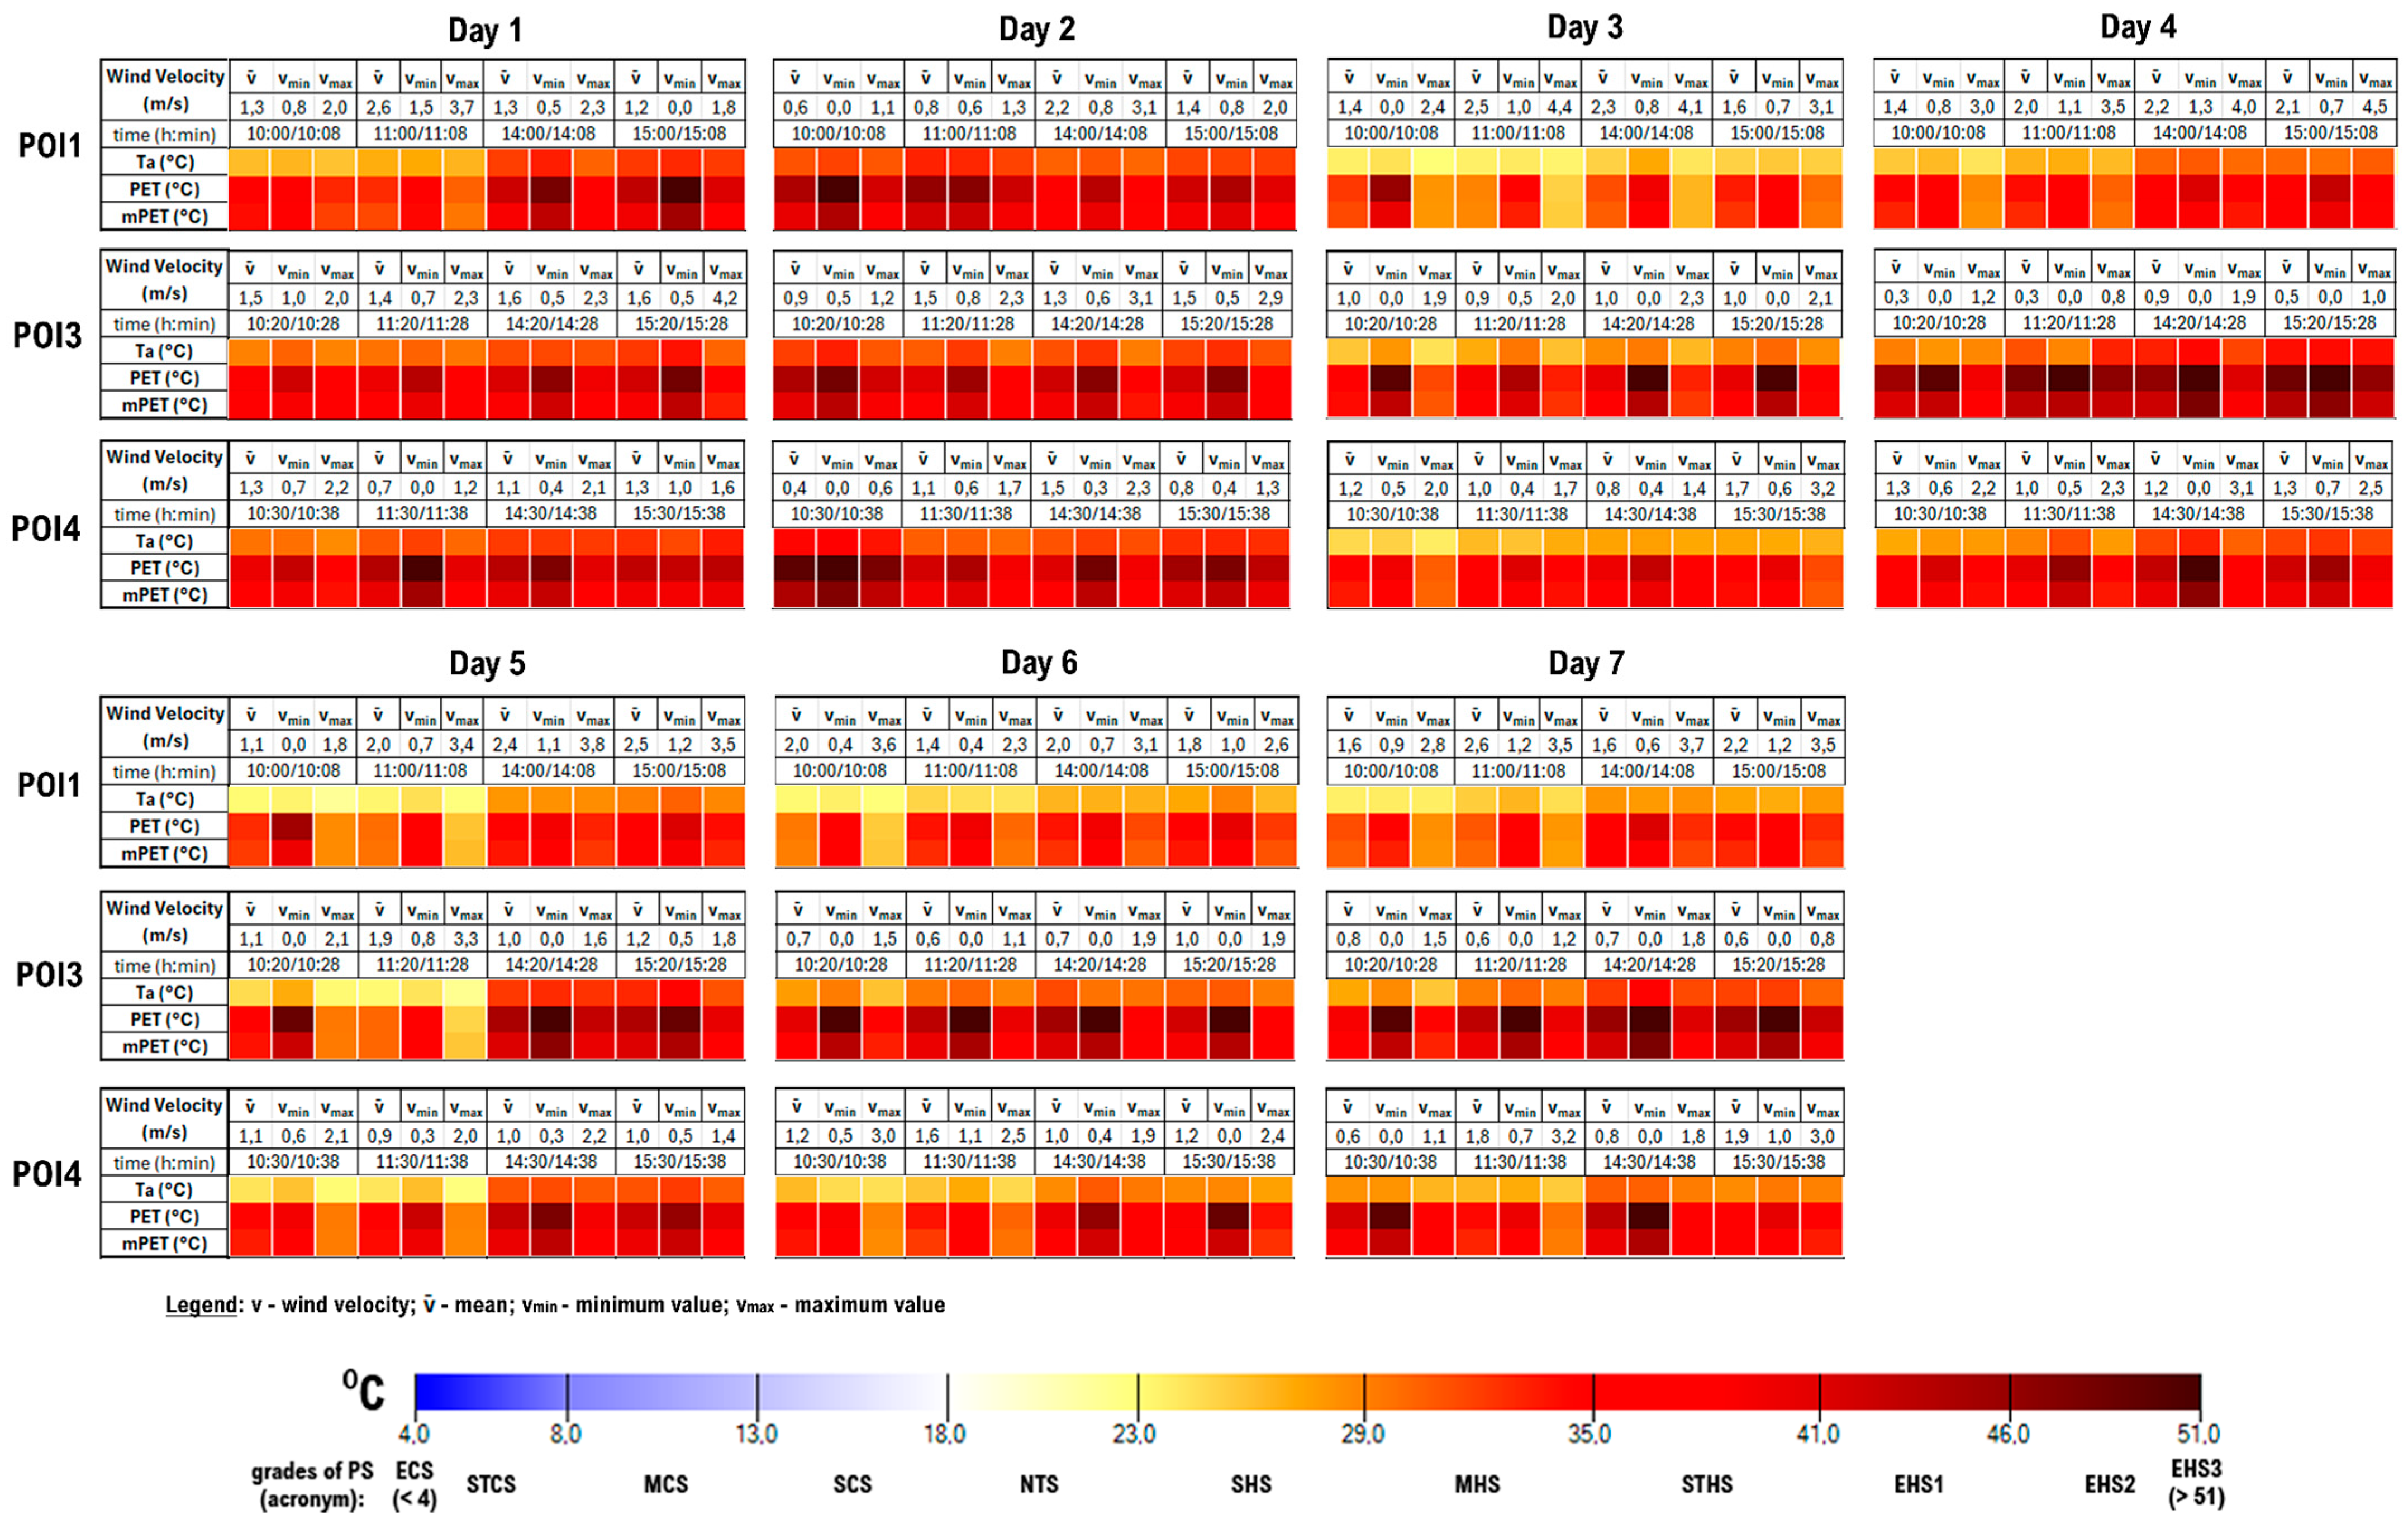
A similar pattern is evident in G2 (see
Figure A3). Specifically, at POI1 on MD5, at 10:00, for a V
1.1 min value of 0.0 m/s and a T
a of 23.5 °C, the PET value is 45.2 °C, and the mPET value is 39.7 °C, corresponding to a PS of EHS1 and STHS, respectively. Meanwhile, for a V
1.1 max of 1.8 m/s and a T
a of 21.9 °C, the PET value is 28.5 °C, and the mPET value is 28.5 °C, indicating SHS for both indices.
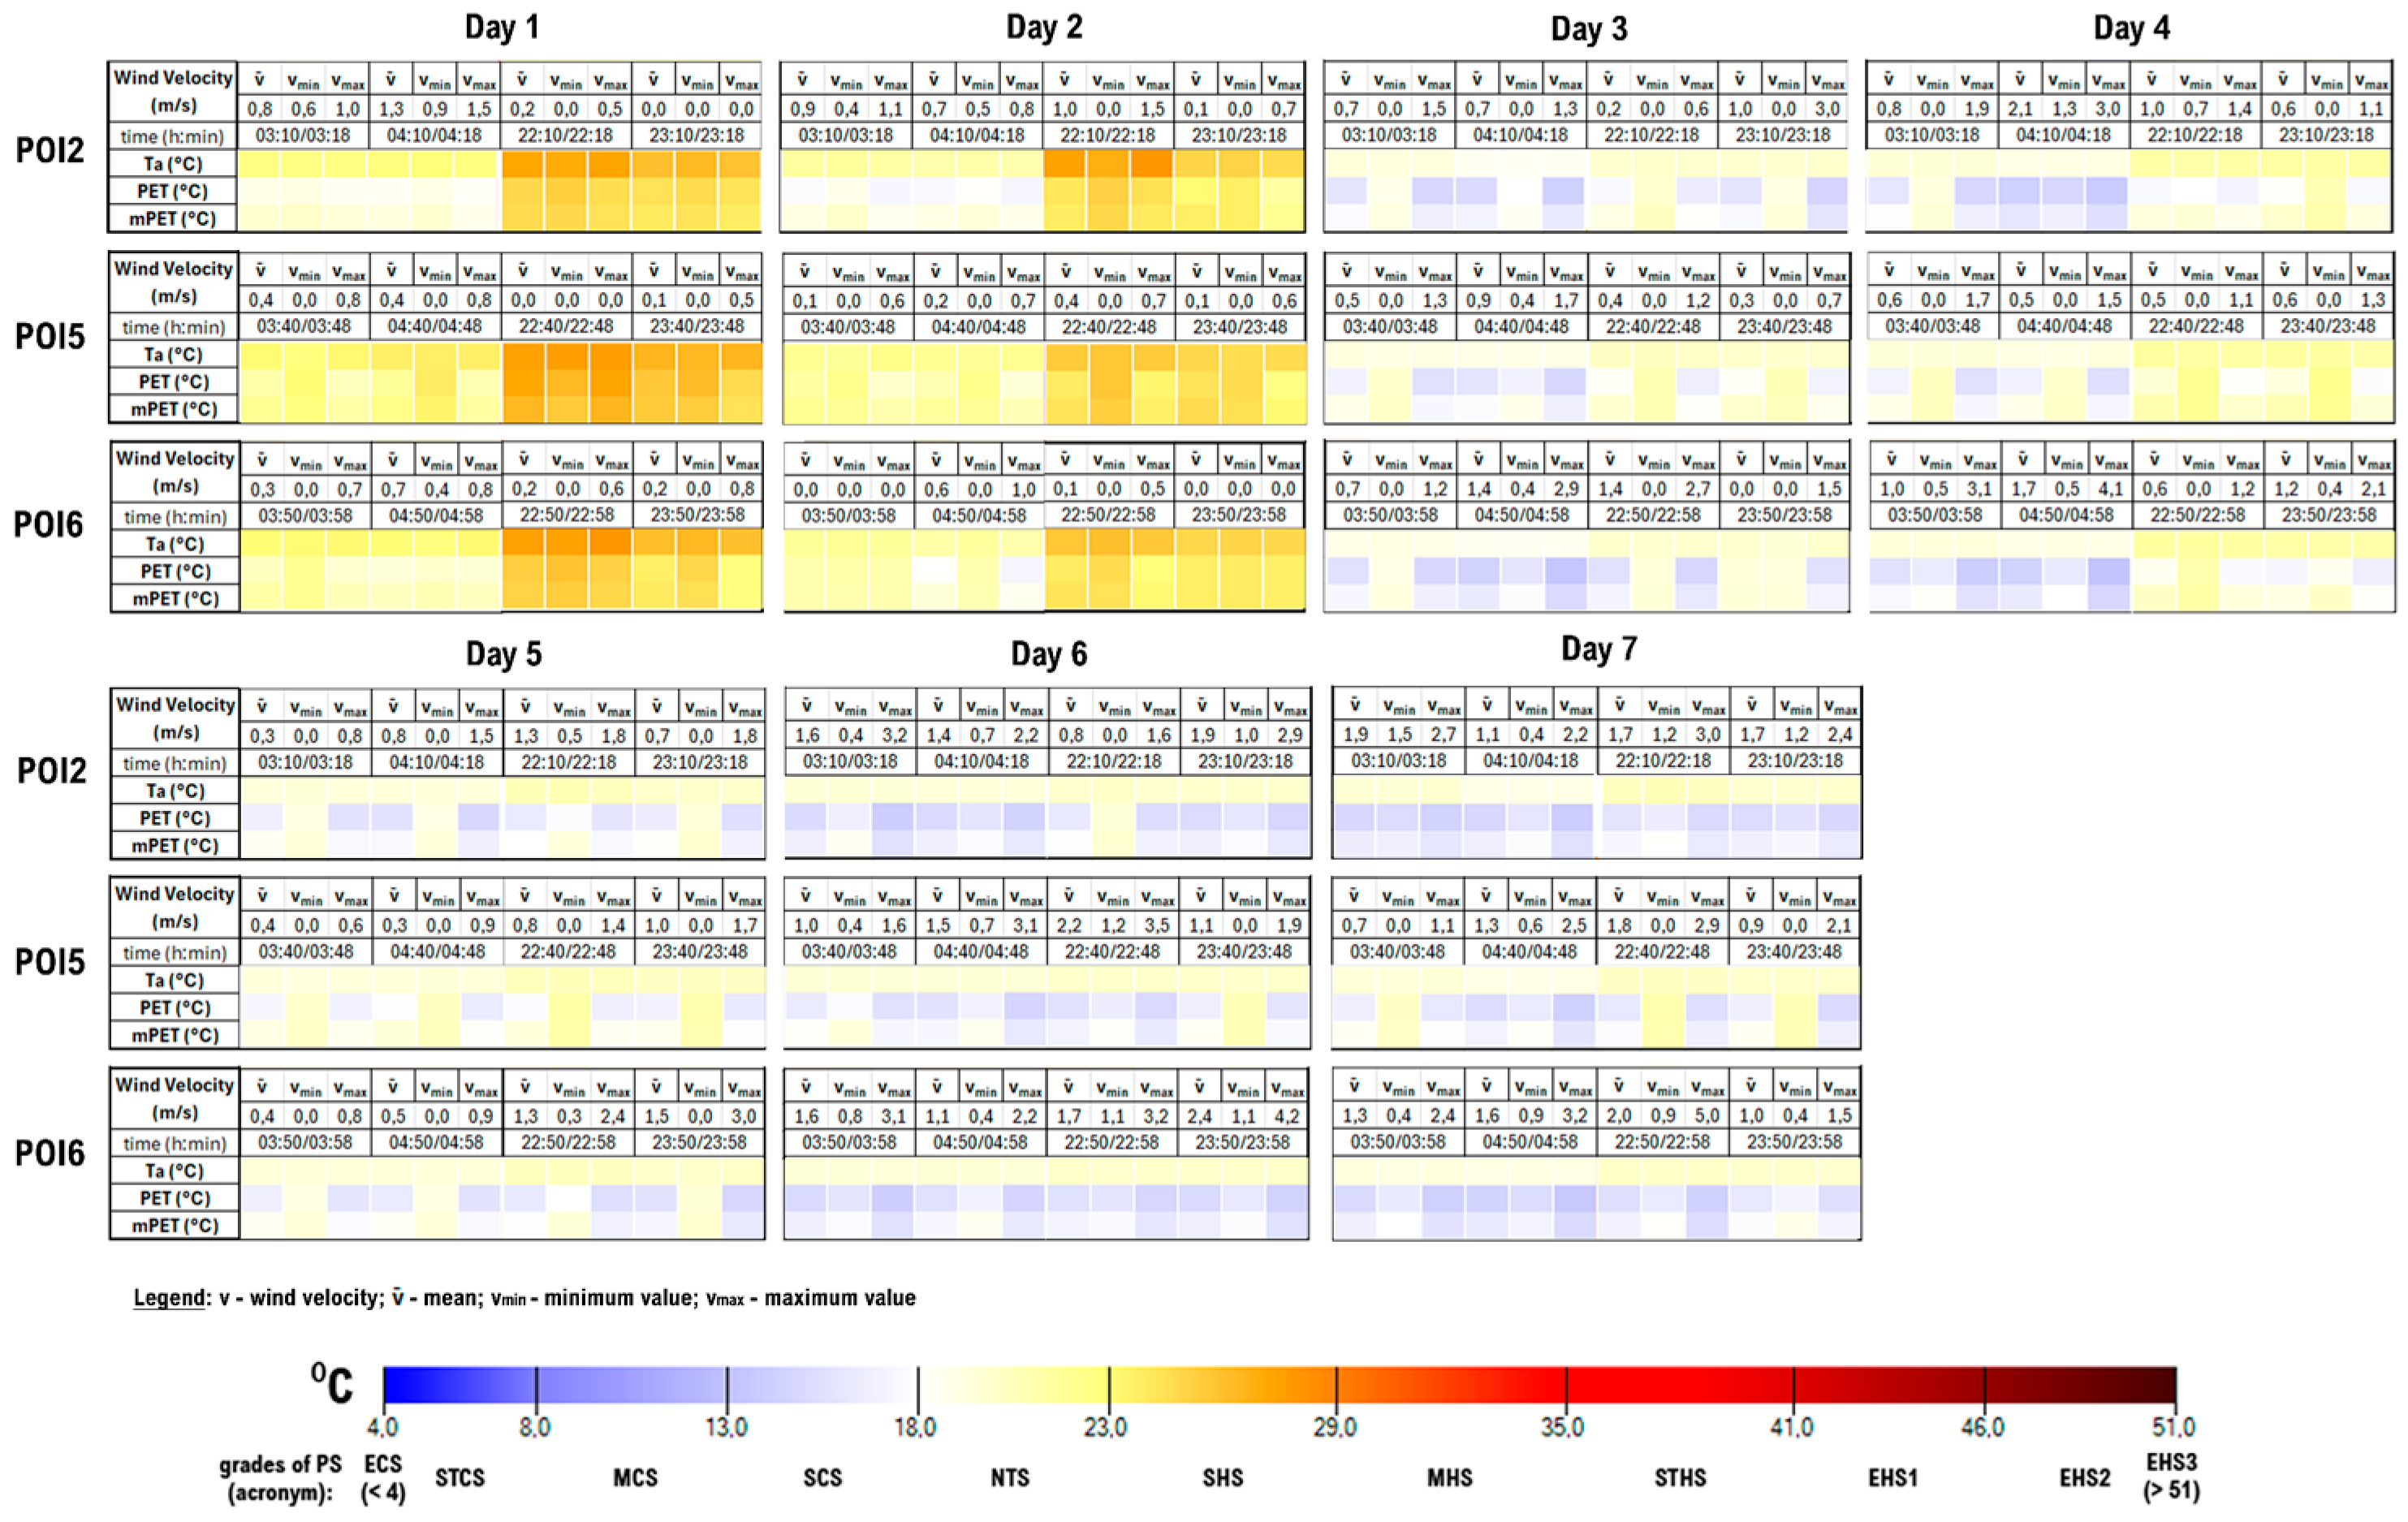
During MD6 at 03:00 (see
Figure A4), POI 6 with an V
mean of 1.6 m/s, showed PET values of 15 °C and mPET of 17 °C, corresponding to SCS. However, POI 3, with limited ventilation (V
mean of 0.4 m/s), exhibited slightly higher nocturnal PET values of 17 °C and mPET values of 18 °C (PS of NTS), suggesting the persistence of residual heat stress in areas with poor airflow.
3.2.2. Comparison Among POIs
Group G1
A daily comparative analysis of MD1 and MD2 (see
Figure A2 reveals elevated PET and mPET values due to high T
a values and a relatively low V
mean (<1.5 m/s). POI 2 showed PET averages ranging from 35 to 41 °C and mPET values between 32 and 38 °C, indicating STHS. Similar trends were observed at POI 6, with PET values between 36 and 43 °C and mPET values of 32–40 °C, reaching EHS1 on MD2. As shown in
Appendix C.1, POI 5 exhibited the highest thermal stress, with PET values peaking at 53 °C (EHS3) and mPET values at 45 °C, influenced by the absence of ventilation and heat retention by built surfaces.
From MD3 to MD7, thermal stress levels decreased across all G1 POIs due to milder weather conditions. POI 2 and POI 6 recorded PET and mPET averages indicative of MHS, while POI 5 maintained higher stress levels (PET values: 29–38 °C; mPET values: 28–35 °C). These results underscore the importance of natural tree shade (POI 2) in mitigating thermal stress, even in calm air conditions.
At night (see
Figure A4 PET and mPET values across G1 POIs were significantly lower. For example, on MD1 and MD2, PET and mPET values at POI 2 averaged 18–19 °C, corresponding to NTS. By MD3 to MD7, nighttime PET values across all POIs ranged between 15 and 18 °C, indicative of SCS.
Group G2
On the hottest measurement days (MD1, MD2, and MD4), POI 1 and POI 3 experienced significant heat stress (see
Appendix C.2). PET values at POI 1 ranged from 33 to 46 °C, with mPET values reaching 41 °C, corresponding to MHS to EHS1. POI 3 recorded the highest overall thermal stress, with PET values peaking at 56 °C and mPET values at 48 °C during MD4 (see
Figure A3), corresponding to EHS3 and EHS2, respectively. POI4 also exhibited high values, with PET averages between 37 and 50 °C and mPET values between 36 and 44 °C, reflecting PS from STHS to varying levels of EHS.
As shown in
Figure A3, on the remaining days, thermal stress declined across G2 POIs. POI 1 ranged from MHS to STHS, with the PET averaging 29–37 °C and mPET 29–35 °C, while POI 4 reached EHS1 levels, with the PET averaging 34–43 °C and mPET 32–40 °C. However, POI 3 maintained elevated thermal stress levels (STHS to EHS1), attributed to its reflective surfaces.
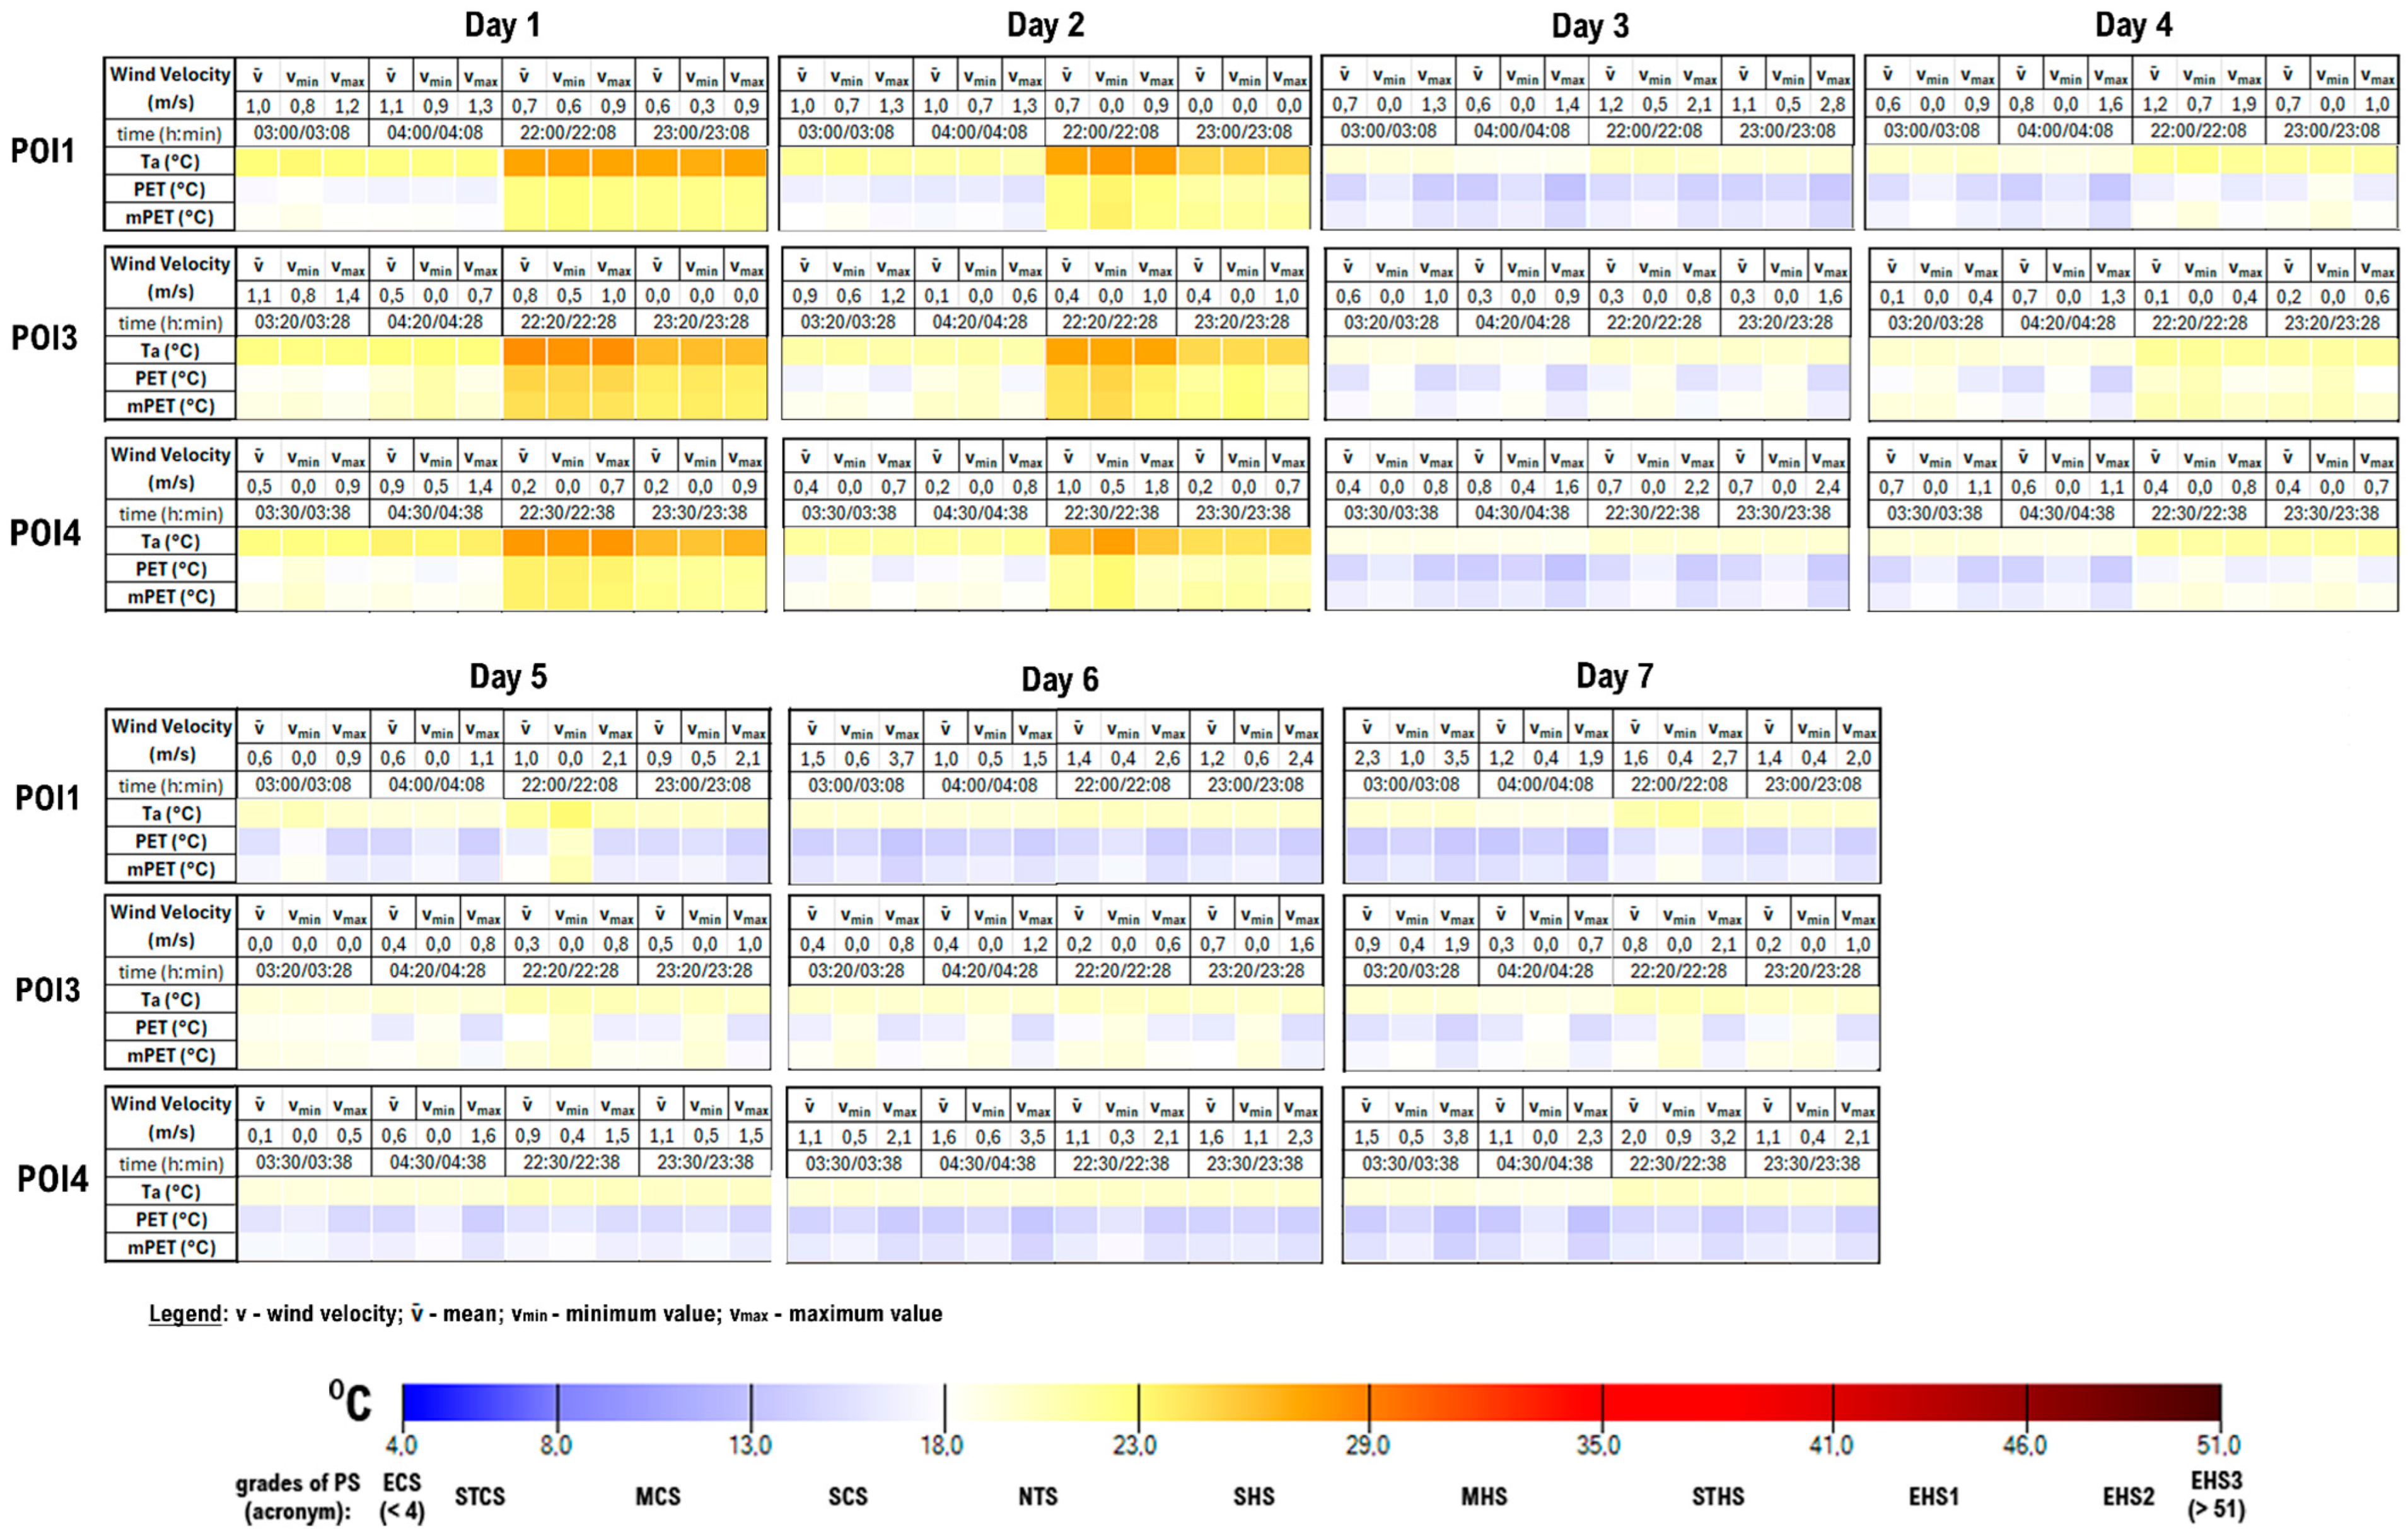
During the nocturnal period, thermal stress across G2 POIs diminished significantly, as shown in
Figure A5. On MD1 and MD2, PET and mPET values at POI 1 averaged 17–22 °C, corresponding to NTS, while POI 3 showed slightly higher values of 22–25 °C, influenced by heat retention from nearby reflective walls. From MD3 to MD7, nighttime PET values ranged from 14 to 20 °C, indicative of SCS to NTS. POI 4 recorded similar trends, with PET and mPET values consistently lower due to reduced heat retention.
3.2.3. Comparison Between G1 and G2
A comparative analysis of POIs in G1 and G2 reveals distinct thermal patterns influenced by surface materials, shading, and urban morphology. The diurnal and nocturnal thermal stress variations are summarized in
Table 6.
4. Discussion
4.1. Quantification of Human Thermo-Physiological Risk Factors
The results highlight clear spatial variations in PET and mPET values across the studied POIs, confirming the strong influence of urban morphology and microclimatic conditions on pedestrian thermal comfort. During diurnal periods, the highest PET values were observed in POIs with extensive solar exposure (e.g., POI 3 and POI 4), reaching up to 56 °C in extreme cases, while shaded locations (e.g., POI 2 and POI 6) exhibited significantly lower values (as low as 29 °C). This represents a 27 °C difference in thermal stress within the same hour, clearly demonstrating the critical influence of local microclimatic conditions. These findings align with previous studies in Mediterranean climates [
34,
55,
61] that emphasize not only the critical role of shading in mitigating heat stress but also its broader implications for human thermal comfort, health, and daily functioning—particularly in campus environments where outdoor and indoor activities are closely connected. The observed thermal contrasts further highlight the need for targeted shading and vegetation measures to improve thermal conditions and protect the well-being of campus users, especially in high-footfall areas of the university campus.
Moreover, the differentiation between PET and mPET values highlights the importance of incorporating adaptive clothing and metabolic factors into urban thermal comfort assessments [
20].
4.2. ‘In Situ’ Effects of Urban Morphology
This study confirms the critical role of the SVF in shaping outdoor thermal environments on the university campus. As observed, POIs with a high SVF (e.g., POI 1 and POI 4) experienced prolonged solar exposure, leading to elevated T
mrt values (>60 °C). Conversely, locations with a lower SVF (e.g., POI 2 and POI 6) exhibited reduced thermal stress due to enhanced shading. These results support findings by Lin et al. [
17] and Matzarakis and Amelung [
48], who demonstrated the effectiveness of a reduced SVF in moderating pedestrian thermal environments.
Another critical factor is the impact of surface materials on heat retention and radiation. Detommaso et al. [
66] found that cool materials, such as reflective pavements and roofs, can lower air temperature by nearly 1 °C. However, they also observed that these materials increase T
mrt near building facades due to their high surface albedo, intensifying localized heat stress. This phenomenon may explain the elevated T
mrt values recorded at G2 POIs at the NOVA FCT campus. The specific role of built structures in providing consistent shading (e.g., POI 6) suggests that urban geometry plays a crucial role in modifying microclimatic conditions, a trend also observed in the study by Ali-Toudert and Mayer [
67].
4.3. ‘In Situ’ Effects of Urban Vegetation
Tree shading was found to be one of the most effective strategies for thermal stress reduction. POI 2, which benefits from dense tree canopies, showed an average PET reduction of 10 °C compared to fully exposed areas, in line with the cooling effects of evapotranspiration documented by Detommaso et al. [
66], Johansson et al. [
68], and Shashua-Bar et al. [
24]. Thus, the shading effect of trees can significantly enhance human thermal comfort during the diurnal hours [
69]. However, the mixed-shade condition of POI 5 resulted in fluctuating PET and mPET values, highlighting the need for strategically placed vegetation to ensure continuous shading. This supports findings by Nouri et al. [
49], emphasizing the need for integrated urban green planning to optimize pedestrian comfort. The study by de Quadros and Mizgier [
70] highlights that less fragmented green spaces provide stronger cooling benefits, reinforcing the importance of coherent, well-planned vegetation coverage at the NOVA FCT campus to maximize human thermal comfort.
4.4. Day and Night Thermal Dynamics
The results underscore significant differences between daytime overheating and nighttime cooling. Sun-exposed POIs (e.g., POI 3 and POI 4) exhibited substantial heat retention, with nocturnal PET values remaining 3–5 °C higher than shaded locations (POI 2 and POI 6). Notably, at night, residual heat retention in high-SVF POIs contributed to elevated PET values, reinforcing previous research on urban heat storage effects [
58,
71].
The impact of wind speed was particularly notable, as low-wind conditions in POIs with dense urban materials exacerbated nighttime heat retention. These findings align with Nouri et al. [
34] and Theeuwes et al. [
71], who highlighted the urban heat storage effect in built environments. The role of wind as a mitigating factor was further emphasized in areas with moderate airflow, where convective cooling helped dissipate retained heat.
4.5. Wind Speed Key Role
Wind speed plays a crucial role in further reducing thermal stress, particularly in shaded areas, where higher wind velocities contribute to significant decreases in both PET and mPET values, enhancing overall thermal comfort [
33]. This effect is clearly observed (see
Figure A2), for example, in G1—POI5 on MD3, at 10:40, for a V
1.1 min value of 0.0 m/s and a T
a of 25.9 °C, the PET value is 48.6 °C, and the mPET value is 42.1 °C, corresponding to a PS of EHS2 and EHS1, respectively. Meanwhile, for a V
1.1 max of 2.0 m/s and a T
a of 23.1 °C, the PET value is 29.8 °C, and the mPET value is 29.5 °C, corresponding to a PS of MHS. These results highlight how even a moderate increase in wind velocity can significantly alleviate thermal stress [
34].
A similar pattern is evident in G2 (see
Figure A3), specifically at POI1 on MD5, at 10:00, for a V
1.1 min value of 0.0 m/s and a T
a of 23.5 °C, the PET value is 45.2 °C, and the mPET value is 39.7 °C, corresponding to a PS of EHS1 and STHS, respectively. Meanwhile, for a V
1.1 max of 1.8 m/s and a T
a of 21.9 °C, the PET value is 28.5 °C, and the mPET value is 28.5 °C, indicating SHS for both indices.
These examples clearly demonstrate the impact of wind velocity in moderating thermal stress, especially in areas where shading is present or when solar exposure intensifies thermal discomfort [
36]. The reduction in PET and mPET values with higher wind speeds highlights the importance of airflow as a mitigating factor in outdoor environments, providing much-needed thermal relief even under challenging climatic conditions [
72].
Wind speed remains a crucial factor in nocturnal human thermal comfort, influencing heat dissipation and reducing residual thermal stress caused by heat retention in built-up areas. During nighttime hours, lower wind velocities often lead to prolonged heat retention, particularly in hardscape-dominated locations such as POI 5 (see
Figure A4). In contrast, areas with higher wind exposure experience a more rapid decrease in PET and mPET values, improving overall comfort [
36].
For example, during MD6 at 03:00 (see
Figure A4), POI 6—a shaded location with moderate ventilation (V
mean of 1.6 m/s)—recorded PET values of 15 °C and an mPET of 17 °C, corresponding to SCS. However, POI 3, with limited ventilation (V
mean of 0.4 m/s), exhibited slightly higher nocturnal PET values of 17 °C and an mPET value of 18 °C (PS of NTS), suggesting the persistence of residual heat stress in areas with poor airflow. This supports findings by Nouri et al. [
34], which emphasizes the importance of wind corridors in mitigating urban heat stress.
Moreover, the moderating role of wind also aligns with insights from the studies of [
7,
58], who identified wind as a critical factor in mitigating thermal stress in urban settings, particularly during nocturnal periods. The results confirm that higher wind speeds significantly reduce PET and mPET values, especially in exposed areas, enhancing convective and evaporative cooling. Additionally, increased nocturnal ventilation can enhance heat dissipation and mitigate residual thermal stress, with POIs experiencing moderate wind exposure exhibiting better cooling effects compared to enclosed spaces with lower ventilation.
Additionally, a study by Oke [
73] highlights that efficient nocturnal ventilation plays a crucial role in reducing heat retention in urban environments by enhancing convective cooling and dispersing accumulated heat. While Matzarakis et al. [
60] primarily focus on radiation fluxes and thermal comfort modeling, their findings also acknowledge the influence of wind speed in modifying nocturnal cooling conditions.
4.6. Future Worsening of Thermal Stress in Urban Areas
Given the projected increase in extreme heat events under climate change scenarios (e.g., RCP 8.5), extreme heat events are expected to become more frequent and intense. This study’s findings suggest that PET values in exposed urban areas could exceed 60 °C in the coming decades, surpassing current heat stress classifications. Matzarakis and Amelung [
48] predict that Mediterranean urban areas will experience PET increases of up to 15 °C by 2100, significantly exacerbating human thermal discomfort outdoors. This means that even currently shaded zones (e.g., POI 2 and POI 6) may experience PET values above 40 °C, reinforcing the urgent need to implement adaptive design strategies—intensify existing shading, expand green cover, and explore adaptive architectural interventions.
Notably, PET values reached up to 29 °C during nocturnal hours at specific POIs (e.g., POI 5 and POI 6), a striking observation that suggests the persistence of thermal stress even after sunset. This phenomenon reflects a reduced capacity for nocturnal heat dissipation—particularly in areas with limited vegetation or dense built surfaces—and aligns with the growing frequency of tropical nights in urban areas [
74]. Such conditions are emblematic of climate change trends, where nocturnal thermal discomfort is becoming more common, compromising recovery periods, and increasing cumulative heat exposure, especially in educational campuses where users engage in late evening activities, study, or sport.
In response to these extreme values, this study adopted the PET stress grading system by introducing additional thresholds to classify “Extreme Heat Stress” (EHS) into subcategories:
EHS1 (45–50 °C)—Severe physiological stress, with risks of dehydration and heat exhaustion;
EHS2 (50–55 °C)—Critical heat exposure, where prolonged exposure may lead to heat stroke;
EHS3 (>55 °C)—Life-threatening conditions, with a significant risk of heat-related mortality.
These new levels provide a more nuanced understanding of thermal stress at elevated PET values, offering a more detailed framework for assessing human thermal perception and physiological impacts. For example, in POI 3, PET values frequently exceeded 45 °C, reaching as high as 56 °C, a range that, without these additional classifications, would have been grouped under a single category, potentially underrepresenting the severity of the thermal stress.
By refining the stress grade system, this study not only aligns with anticipated climatic trends but also enhances the accuracy of thermal stress assessments [
48]. This refinement is critical for supporting urban climate adaptation strategies, enabling urban planners and designers to prioritize interventions in areas identified as high-risk zones of severe heat stress [
63]. The extended stress grades also facilitate better communication of risks to stakeholders, including urban planners and policymakers [
49,
56], by highlighting the escalating severity of human thermal stress and providing a more detailed risk framework to address the worsening impact of urban heat islands under climate change.
4.7. Implications for Urban Planning and Thermal Comfort Improvements at NOVA FCT Campus
The findings of this study provide crucial local and ‘in situ’ insights for enhancing human thermal comfort conditions within the NOVA FCT campus. The integration of tree canopies, particularly in pedestrian zones with high footfall, could significantly reduce PET and mPET values and improve overall thermal perception. For instance, shaded POIs such as POI 2 showed PET reductions of up to 20 °C compared to sun-exposed areas like POI 3 during peak diurnal periods, corresponding to physiological stress improvements of two or more PS categories (e.g., from EHS3 to MHS). This aligns with previous findings, such as Matzarakis et al. [
75], who emphasized the importance of managing thermal stress in public and active outdoor environments, particularly under high global radiation scenarios. Additionally, modifying built structures to include reflective or insulated facades could help mitigate heat retention effects observed in locations like POI 3, where T
mrt exceeded 62 °C and PET reached extreme values of up to 56 °C. Similar interventions have been recommended in previous urban biometeorological studies [
63] and are consistent with Gündoğdu et al. [
14], who reported that urban materials influence nocturnal thermal environments. While concerns have been raised about potential adverse outcomes of reflective surfaces (e.g., glare, increased UV exposure, or pedestrian discomfort) [
76], evidence suggests that, when thoughtfully integrated, these materials can reduce urban heat storage and improve outdoor thermal comfort conditions [
77]. Their effectiveness is particularly notable when complemented by other public space design (PSD) measures to reduce global radiation and enhance nocturnal cooling capacity.
However, thermal comfort on university campuses extends beyond spatial interventions alone. Outdoor areas in academic settings support a wide range of activities—from walking between classes and socializing to leisure and sport—and are closely connected to indoor environments, particularly in naturally ventilated buildings. As highlighted by Nouri and Matzarakis [
19], peripatetic behaviors and transitions between indoor and outdoor settings shape human exposure patterns and can intensify cumulative thermal stress, especially during periods of elevated temperatures. Although indoor conditions were not directly analyzed in this study, the high PET values recorded at night in areas like POI 5 (up to 29 °C) suggest persistent heat loads that may extend into indoor spaces. Such sustained exposure can disrupt sleep cycles, impair concentration, and diminish psychological well-being—phenomena increasingly observed in the context of climate change [
78]. Therefore, heat mitigation on campus must adopt a holistic approach—one that accounts for both physiological and psychological dimensions of thermal stress. In addition to physical measures, user behavior plays a key role in mitigating heat stress exposure. Institutions should promote behavior adaptations—encouraging the use of shaded paths or providing access to water and cooling zones—and communication strategies—such as real-time alerts and awareness campaigns—which are essential to inform and protect users, as emphasized by Heidenreich and Thieken [
79]. Together, these low-cost integrated actions can be deployed immediately and effectively support the physical measures proposed, enhancing resilience and promoting a healthier, more thermally adaptive campus environment.
Expanding the PS classification system in urban planning assessments would allow for a more nuanced evaluation of human thermal stress under extreme heat conditions. Moreover, strategic urban design solutions, such as increasing shaded walkways, optimizing wind corridors, and integrating water features, should be prioritized to enhance pedestrian thermal comfort on campus.
Among the shaded locations, natural shading and permeable surfaces, as observed at POI 2, provide the most effective cooling. For campus development, efforts should focus on integrating these elements to create microclimates in high-traffic zones like the FCT main avenue, parking areas, and near academic buildings. This aligns with the bioclimatic urban design principles, as emphasized by authors such as Alcoforado et al. [
58], Santamouris [
72], Nouri et al. [
77], and Oke et al. [
80] who advocate for urban greening as a key climate adaptation strategy.
4.8. Recommendations for Urban Planning and Climate Resilience
The recommendations in this study are directly based on the heat risk identification across the POIs, as detailed in
Table 7. To enhance human outdoor thermal comfort at the NOVA FCT campus and similar urban settings, the following (
Table 8) targeted measures are proposed:
This research reinforces the importance of integrating human biometeorological assessments into urban planning to mitigate climate-induced heat stress. This study’s findings align with global efforts to develop climate-resilient cities, emphasizing the need for interdisciplinary collaboration between urban designers, climatologists, and policymakers. By implementing adaptive measures based on this study’s insights, the NOVA FCT campus can serve as a model for sustainable urban climate adaptation strategies—particularly in higher education environments, where the typo-morphological characteristics of built spaces heighten exposure risks and underscore the need for integrated planning, design, and interdisciplinary communication.
4.9. Study Limitations and Future Research Directions
While this study provides valuable insights into outdoor thermal comfort conditions across the NOVA FCT campus, certain limitations should be acknowledged—many of which also present meaningful opportunities for future research, building directly upon the foundations established here:
Limited temporal coverage: Measurements were conducted over a short summer period, focusing specifically on extreme heat exposure scenarios. This timeframe was chosen based on meteorological stability, ensuring that the collected data accurately reflected representative summer microclimatic patterns without interference from transient weather anomalies. Although this was an intentional choice—given that 2024 has been marked by historically elevated global temperatures—future studies should consider long-term monitoring across different seasons (including winter months) to assess year-round thermal comfort dynamics and variability.
Fixed measurement locations: While six POIs provided a comprehensive spatial assessment, expanding the number and distribution of measurement locations could capture greater microclimatic variability and expand the study of the FCT campus in other high-use campus zones and not only the main avenue.
Absence of subjective thermal perception data (qualitative measurement): This study relied exclusively on objective thermal indices (PET and mPET), which, while effective, do not fully capture perceived thermal comfort. Integrate subjective thermal perception surveys or participatory mapping methods to complement quantitative results and offer a more holistic understanding of human comfort levels—how individuals perceive, interpret, and adapt to different microclimates across the campus.
Temporal contextualization of extreme heat conditions: While 2024 was strategically selected due to its exceptionally high temperature thresholds, future research could benefit from comparative assessments across multiple years to place this study`s findings within a broader climatological context. This would not only help validate the results under varying environmental conditions but also strengthen the predictive and adaptive relevance of the proposed thermal comfort strategies and measures;
Limited consideration of demographic variability and extrapolation potential: This study employed PET and mPET indices based on a standardized reference individual and did not differentiate thermal comfort responses by sex, age, or physiological sensitivity. While this approach aligns with the methodological norms of outdoor microclimate assessments, it does not capture potentially significant variations in thermal perception between, for example, younger students and older staff members. Furthermore, this study was tailored to a specific university campus context, which may limit direct extrapolation of the results to other urban environments or vulnerable user groups (e.g., children or the elderly). Future research should explore adaptive modeling for different population profiles and test the scalability of proposed interventions in diverse urban typologies.
The limitations identified here highlight key directions for future interdisciplinary inquiry, particularly in the areas of long-term monitoring, participatory comfort assessment, and scalable campus-wide climate resilience planning. The methodology and findings presented in this study thus serve as both a reference point and a springboard for the deeper exploration of microclimate-aware urban design in higher education contexts.
By addressing these areas, future research can further bridge the gap between human thermal comfort assessment and actionable urban planning strategies, ensuring that climate-adaptive design principles are not only conceptualized but also effectively integrated into campus development frameworks. This is especially relevant not only in the present, as educational institutions increasingly recognize their role in modeling sustainability, but also in the context of accelerating climate change, where campuses must become living laboratories for resilience and innovation.
Through the lessons learned from the NOVA FCT campus, this research offers pathways that can inform broader urban resilience efforts, contributing to the development of climate-ready public spaces that support community well-being under both current and future thermal stress conditions.
5. Concluding Remarks
This study provides a comprehensive assessment of thermo-physiological risk factors affecting pedestrian thermal comfort at the NOVA FCT campus, using PET and mPET indices to analyze microclimatic variability.
The results revealed significant spatial and temporal variability in thermal stress levels, with PET values exceeding 56 °C in sun-exposed areas (e.g., POI 3 and POI 4) and dropping to as low as 29 °C in shaded zones (e.g., POI 2 and POI 6) with differences reaching up to 27 °C. These findings highlight significant thermal stress variations influenced by urban morphology, shading conditions, and wind conditions, underscoring the urgent need for adaptive and evidence-based urban design to mitigate intensifying heat stress in educational environments.
The specificity of the campus setting adds a unique layer to this analysis: different user groups (students, professors, and researchers) navigate outdoor spaces daily, exposing them to thermal conditions that vary across POIs. Ensuring thermally comfortable microclimates in these spaces is not merely a matter of well-being but one of academic functionality and spatial quality.
Rather than focusing on altering urban geometry—which poses significant design, economic, and planning challenges—this study demonstrates that targeted interventions in the spaces between buildings—where academic and social life unfolds—offer an effective and practical path to mitigate heat stress and improve human thermal comfort.
The study results confirm that urban shading (both natural and built) plays a crucial role in reducing heat thermal stress, with tree canopies exhibiting superior cooling effects due to evapotranspiration. Additionally, areas with higher wind speeds improve convective and evaporative cooling, lowering human thermal stress in these exposed areas. Enhanced airflow zones (with average wind speeds above 2.0 m/s) contributed to a 3–8 °C reduction in PET/mPET, particularly where tree shading was already present. In total, comfort improved by an estimated 30–60% in shaded and ventilated POIs, based on the PET/mPET scale thresholds. These reductions are significant, suggesting that combinations of vegetation and airflow interventions are especially effective.
Climate-resilient planning and design must also ensure the incorporation of ventilation corridors and strategic shading solutions to optimize pedestrian thermal comfort.
Based on the observed PET and mPET variations, the most effective interventions for improving thermal comfort were classified as follows:
- I.
Tree canopy shading—PET reduction up to 27 °C between G1 and G2 POIs;
- II.
Architectural shading—built shading elements, PET reduction 12–15 °C;
- III.
Wind corridor enhancement—wind velocities above 2.0 m/s experienced a noticeable 3–8 °C PET/mPET reduction;
- IV.
Use of permeable or vegetated surfaces—up to 5 °C PET reduction;
- V.
Minimizing reflective façades—to avoid increased Tmrt.
Moreover, the results reinforce the importance of extending the PS classifications to account for the growing frequency and intensity of extreme heat events, aligning with projected climate change scenarios. The refined PS grading system introduced in this research offers a more precise framework for assessing human thermal stress risk under escalating urban heat challenges, providing valuable guidance for climate-responsive urban planning and ensuring resilience, sustainability, and user well-being on the NOVA FCT campus. Planning must be anticipatory rather than reactive, integrating flexible, modular designs that can evolve under future stress conditions.
Finally, a crucial dimension emerging from this research is the importance of communicating thermal risks to campus users and stakeholders. By translating complex thermal data into accessible insights and visual strategies, institutions can foster awareness, encourage behavioral adaptation, and drive interdisciplinary collaboration toward sustainable transformation.
Through the lessons learned from the NOVA FCT campus, this research contributes to the broader discourse on urban climate resilience, offering scalable strategies and measures that can support healthier, more adaptable, and thermally inclusive public spaces in the face of global warming.
Author Contributions
P.T.M.: conceptualization, investigation, methodology, data gathering, formal analysis, software, writing, editing, and visualization; A.S.N.: conceptualization, methodology, supervision, writing, review, editing, and funding acquisition; A.M.: supervision, review, and editing. All authors have read and agreed to the published version of the manuscript.
Institutional Review Board Statement
Not applicable.
Informed Consent Statement
Not applicable.
Data Availability Statement
All the data and materials used in this research are presented in the figures and tables. Further information is available from the corresponding author upon reasonable request.
Acknowledgments
We would like to express our sincere gratitude to Elif Nur Sarı for her invaluable support during the early and final stages of this study. Her guidance, generosity in sharing knowledge, and expertise in the subject matter and analytical tools were fundamental to the development of this research. Her contribution played a crucial role in shaping the foundation upon which this work was built. During the preparation of this work, the authors used ChatGPT/ DeepL in order to improve language. After using this tool, the authors reviewed and edited the content as needed and took full responsibility for the content of the publication.
Conflicts of Interest
The authors declare no conflicts of interest.
Abbreviations
CTIS—climate-Tourism/Transfer-Information Scheme; EBM—energy balance model; FCT—Faculdade de Ciências e Tecnologia; GHG—greenhouse gases; Grad—global radiation; MD—measurement days; MEMI—Munich energy-balance model for individuals; PET—physiologically equivalent temperature; mPET—modified physiologically equivalent temperature; PMV—predicted mean vote; POI—Point of Interest; PS—physiological stress; RCP—representative concentration pathway; SVF—Sky View Factor; Tmrt—mean radiant temperature; UHI—Urban Heat Island Effect; and WMO—World Meteorological Organization. PET—physiologically equivalent temperature (°C); mPET—modified physiologically equivalent temperature (°C); Ta—air temperature (°C); v—wind velocity (m/s); RH—relative humidity (%); Grad—global radiation (°C); and Tmrt—mean radiant temperature (°C).
Appendix A
Table A1.
Measuring equipment specifications—Equipment Model: KESTREL 5400 HS with LiNK©.
Table A1.
Measuring equipment specifications—Equipment Model: KESTREL 5400 HS with LiNK©.
| Equipment Model | Measurement | Value
Output | Accuracy | Resolution |
|---|
| KESTREL 5400 HS© | v | m/s | ±3% (of displayed reading) | 0.1 m/s |
| Ta | °C | ±0.5 | 0.1 °C |
| RH | % | ±2% | 0.1% |
| Grad | °C | ±1.4 | 0.1 °C |
Appendix B
Figure A1.
Variations in PET and mPET values relative to the reference station (R) across the six POIs for the seven days of measurement (MD1–MD7) at specific times of the day. Positive and negative differences indicate increased or reduced thermal stress compared to the reference conditions.
Figure A1.
Variations in PET and mPET values relative to the reference station (R) across the six POIs for the seven days of measurement (MD1–MD7) at specific times of the day. Positive and negative differences indicate increased or reduced thermal stress compared to the reference conditions.
Appendix C
Appendix C.1
Figure A2.
Ambient temperature (Ta) values and PET and mPET indices, depending on the wind speed (V) value (average, minimum, and maximum speed) on each measurement day for each POI G1—diurnal hours.
Figure A2.
Ambient temperature (Ta) values and PET and mPET indices, depending on the wind speed (V) value (average, minimum, and maximum speed) on each measurement day for each POI G1—diurnal hours.
Appendix C.2
Figure A3.
Ambient temperature (Ta) values and PET and mPET indices, depending on the wind speed (V) value (average, minimum, and maximum speed) on each measurement day for each POI G2—diurnal hours.
Figure A3.
Ambient temperature (Ta) values and PET and mPET indices, depending on the wind speed (V) value (average, minimum, and maximum speed) on each measurement day for each POI G2—diurnal hours.
Appendix C.3
Figure A4.
Ambient temperature (Ta) values and PET and mPET indices, depending on the wind speed (V) value (average, minimum, and maximum speed) on each measurement day for each POI G1—nocturnal hours.
Figure A4.
Ambient temperature (Ta) values and PET and mPET indices, depending on the wind speed (V) value (average, minimum, and maximum speed) on each measurement day for each POI G1—nocturnal hours.
Appendix C.4
Figure A5.
Ambient temperature (Ta) values and PET and mPET indices, depending on the wind speed (V) value (average, minimum, and maximum speed) on each measurement day for each POI G2—nocturnal hours.
Figure A5.
Ambient temperature (Ta) values and PET and mPET indices, depending on the wind speed (V) value (average, minimum, and maximum speed) on each measurement day for each POI G2—nocturnal hours.
References
- Vardoulakis, E.; Karamanis, D.; Fotiadi, A.; Mihalakakou, G. The urban heat island effect in a small Mediterranean city of high summer temperatures and cooling energy demands. Sol. Energy 2013, 94, 128–144. [Google Scholar] [CrossRef]
- Moreno, E.; Arimah, B.; Otieno, R.O.; Mbeche-Smith, U.; Klen-Amin, A.; Kamiya, M. From Habitat II to Habitat III: Twenty Years of Urban Development. In Urbanization and Development: Emerging Futures. (World Cities Report); Naudin, T., Ed.; UN-Habitat: Nairobi, Kenya, 2016; pp. 1–10. [Google Scholar]
- Carvalho, D.; Martins, H.; Marta-Almeida, M.; Rocha, A.; Borrego, C. Urban resilience to future urban heat waves under a climate change scenario: A case study for Porto urban area (Portugal). Urban. Clim. 2017, 19, 1–27. [Google Scholar] [CrossRef]
- Sodiq, A.; Baloch, A.A.B.; Khan, S.A.; Sezer, N.; Mahmoud, S.; Jama, M.; Abdelaal, A. Towards modern sustainable cities: Review of sustainability principles and trends. J. Clean. Prod. 2019, 227, 972–1001. [Google Scholar] [CrossRef]
- Habitat III. The New Urban Agenda. Available online: http://Habitat3.Org/the-New-Urban-Agenda/ (accessed on 24 June 2024).
- Mukim, M.; Roberts, M. (Eds.) Thriving: Making Cities Green, Resilient, and Inclusive in a Changing Climate; World Bank Publications: Washington, DC, USA, 2023. [Google Scholar] [CrossRef]
- Alcoforado, M.J. Lisbon Heat Island-Statistical Study (2004–2012). Finisterra 2014, 98, 61–80. [Google Scholar] [CrossRef]
- Emmanuel, R.; Krüger, E. Urban heat island and its impact on climate change resilience in a shrinking city: The case of Glasgow, UK. Build. Environ. 2012, 53, 137–149. [Google Scholar] [CrossRef]
- Oke, T.R. Street Design and Urban Canopy Layer Climate. In Energy and Buildings; Elsevier BV: Amsterdam, The Netherlands, 1988; Volume 11. [Google Scholar]
- Barroso, S.; Lopes, A.; Gomes, H.; Telha, J.; Carapau, J.T.; Pina, I.; Correia, J.; Costa, L. Impactes e Vulnerabilidades Climáticas. In Plano Municipal de Identificação de Riscos e de Vulnerabilidades-PMAAC–AML; CEDRU—Centro de Estudos de Desenvolvimento Regional e Urbano (Lisboa): Almada, Portugal, 2019; pp. 93–107. [Google Scholar]
- Kaushik, A.; Arif, M.; Tumula, P.; Ebohon, O.J. Effect of thermal comfort on occupant productivity in office buildings: Response surface analysis. Build. Environ. 2020, 180, 107021. [Google Scholar] [CrossRef]
- Li, G.; Liu, C.; He, Y. The effect of thermal discomfort on human well-being, psychological response and performance. Build. Environ. 2021, 27, 960–970. [Google Scholar] [CrossRef]
- Rupp, R.F.; Vásquez, N.G.; Lamberts, R. A review of human thermal comfort in the built environment. In Energy and Buildings; Elsevier Ltd.: Amsterdam, The Netherlands, 2015; Volume 105, pp. 178–205. [Google Scholar] [CrossRef]
- Gündoğdu, B.; Nouri, A.S.; Afacan, Y.; Matzarakis, A. Investigating the impacts of shaded outdoor spaces on thermal adaptation and cognitive performance of university students in classroom environments. Int. J. Biometeorol. 2023, 67, 1941–1955. [Google Scholar] [CrossRef]
- Taleghani, M.; Sailor, D.J.; Tenpierik, M.; van den Dobbelsteen, A. Thermal assessment of heat mitigation strategies: The case of Portland State University, Oregon, USA. Build. Environ. 2014, 73, 138–150. [Google Scholar] [CrossRef]
- Höppe, P. Different aspects of assessing indoor and outdoor thermal comfort. Energy Build. 2002, 34, 661–665. [Google Scholar] [CrossRef]
- Lin, T.-P.; Matzarakis, A.; Hwang, R.-L. Shading effect on long-term outdoor thermal comfort. Build. Environ. 2010, 45, 213–221. [Google Scholar] [CrossRef]
- Nikolopoulou, M.; Baker, N.; Steemers, K. Thermal Comfort in Outdoor Urban Spaces: Understanding the Human Parameter. Sol. Energy 2001, 70, 227–235. [Google Scholar] [CrossRef]
- Nouri, A.S.; Matzarakis, A. The Maturing Interdisciplinary Relationship between Human Biometeorological Aspects and Local Adaptation Processes: An Encompassing Overview. Climate 2019, 7, 134. [Google Scholar] [CrossRef]
- Chen, Y.C.; Matzarakis, A. Modified physiologically equivalent temperature—Basics and applications for western European climate. Theor. Appl. Climatol. 2018, 132, 1275–1289. [Google Scholar] [CrossRef]
- Höppe, P. The physiological equivalent temperature–a universal index for the biometeorological assessment of the thermal environment. Int. J. Biometeorol. 1999, 43, 71–75. [Google Scholar] [CrossRef]
- Achour-Younsi, S.; Kharrat, F. Outdoor Thermal Comfort: Impact of the Geometry of an Urban Street Canyon in a Mediterranean Subtropical Climate–Case Study Tunis, Tunisia. Procedia-Soc. Behav. Sci. 2016, 216, 689–700. [Google Scholar] [CrossRef]
- Salata, F.; Golasi, I.; de Lieto Vollaro, R.; de Lieto Vollaro, A. Outdoor thermal comfort in the Mediterranean area. A transversal study in Rome, Italy. Build. Environ. 2016, 96, 46–61. [Google Scholar] [CrossRef]
- Shashua-Bar, L.; Pearlmutter, D.; Erell, E. The cooling efficiency of urban landscape strategies in a hot dry climate. Landsc. Urban. Plann. 2009, 92, 179–186. [Google Scholar] [CrossRef]
- Nouri, A.S.; Rodriguez-Algecíras, J.; Matzarakis, A. Establishing initial urban bioclimatic planning recommendations for Ankara to address existing and future urban thermophysiological risk factors. Urban. Clim. 2023, 49, 101456. [Google Scholar] [CrossRef]
- Câmara Municipal de Almada. Ficha Técnica Concepção e Desenvolvimento; Freitas, C., Ataíde, D., Rodrigues, E., Estevens, M., Castro, M., Lopes, N., Silva, P., Dionísio, S., Sousa, C., Cleto, J., et al., Eds.; AGENEAL: Almada, Portugal, 2011. [Google Scholar]
- Peel, M.C.; Finlayson, B.L.; Mcmahon, T.A. Updated world map of the Köppen-Geiger climate classification. Hydrol. Earth Syst. Sci. 2007, 11, 1633–1644. [Google Scholar] [CrossRef]
- Lopes, H.S.; Remoaldo, P.C.; Vidal, D.G.; Ribeiro, V.; Silva, L.T.; Martín-Vide, J. Sustainable Placemaking and Thermal Comfort Conditions in Urban Spaces: The Case Study of Avenida dos Aliados and Praça da Liberdade (Porto, Portugal). Urban. Sci. 2025, 9, 24. [Google Scholar] [CrossRef]
- World Meteorological Organization. Wmo Confirms 2024 as Warmest Year on Record at About 1.55 °C Above Pre-Industrial Level. Available online: https://Wmo.Int/News/Media-Centre/Wmo-Confirms-2024-Warmest-Year-Record-about-155degc-above-Pre-Industrial-Level (accessed on 10 January 2025).
- Roshan, G.; Moghbel, M.; Attia, S. Evaluating the wind cooling potential on outdoor thermal comfort in selected Iranian climate types. J. Therm. Biol. 2020, 92, 102600. [Google Scholar] [CrossRef]
- Song, C.; Duan, G.; Wang, D.; Liu, Y.; Du, H.; Chen, G. Study on the influence of air velocity on human thermal comfort under non-uniform thermal environment. Build. Environ. 2021, 196, 107808. [Google Scholar] [CrossRef]
- de Freitas, C.R.; Grigorieva, E.A. A comprehensive catalogue and classification of human thermal climate indices. Int. J. Biometeorol. 2015, 59, 109–120. [Google Scholar] [CrossRef]
- Mayer, H.; Höppe, P. Theoretical and Applied Climatology Thermal Comfort of Man in Different Urban Environments. In Theoretical and Applied Climatology; Springer: Berlin/Heidelberg, Germany, 1987; Volume 38. [Google Scholar]
- Nouri, A.S.; Lopes, A.; Costa, J.P.; Matzarakis, A. Confronting potential future augmentations of the physiologically equivalent temperature through public space design: The case of Rossio, Lisbon. Sustain. Cities Soc. 2018, 37, 7–25. [Google Scholar] [CrossRef]
- Nouri, A.S.; Costa, J.P. Addressing thermophysiological thresholds and psychological aspects during hot and dry mediterranean summers through public space design: The case of Rossio. Build. Environ. 2017, 118, 67–90. [Google Scholar] [CrossRef]
- Fröhlich, D.; Gangwisch, M.; Matzarakis, A. Effect of radiation and wind on thermal comfort in urban environments-Application of the RayMan and SkyHelios model. Urban. Clim. 2019, 27, 1–7. [Google Scholar] [CrossRef]
- Lin, T.-P.; Tsai, K.-T.; Hwang, R.-L.; Matzarakis, A. Quantification of the effect of thermal indices and sky view factor on park attendance. Landsc. Urban. Plann. 2012, 107, 137–146. [Google Scholar] [CrossRef]
- Krüger, E.L.; Minella, F.O.; Matzarakis, A. Comparison of different methods of estimating the mean radiant temperature in outdoor thermal comfort studies. Int. J. Biometeorol. 2014, 58, 1727–1737. [Google Scholar] [CrossRef]
- Nastos, P.T.; Polychroni, I.D. Modeling and in situ measurements of biometeorological conditions in microenvironments within the Athens University Campus, Greece. Int. J. Biometeorol. 2016, 60, 1463–1479. [Google Scholar] [CrossRef]
- Cooper, E.; Grundstein, A.; Rosen, A.; Miles, J.; Ko, J.; Curry, P. An evaluation of portable wet bulb globe temperature monitor accuracy. J. Athl. Train. 2017, 52, 1161–1167. [Google Scholar] [CrossRef]
- d’Ambrosio Alfano, F.R.; Dell’Isola, M.; Ficco, G.; Palella, B.I.; Riccio, G. Small globes and pocket heat stress meters for WBGT and PHS evaluations. A critical analysis under controlled conditions. Build. Environ. 2022, 226, 109781. [Google Scholar] [CrossRef]
- ISO 7726:1998; Ergonomics of the Thermal Environment-Instruments for Measuring Physical Quantities. International Organization for Standardization (ISO): Geneva, Switzerland, 1998. Available online: https://standards.iteh.ai/catalog/standards/sist/99f92eea-d1b3-48b4-8a3c- (accessed on 2 May 2024).
- Kuttler, W. Stadklima. In Handbuch der Umweltveränderungen und Ökotoxologie; Guderian, R., Ed.; Spinger: Berlin/Heidelberg, Germany, 2000; Volume 1B, pp. 420–470. [Google Scholar]
- Nouri, A.S.; Charalampopoulos, I.; Matzarakis, A. The application of the physiologically equivalent temperature to determine impacts of locally defined extreme heat events within vulnerable dwellings during the 2020 summer in Ankara. Sustain. Cities Soc. 2022, 81, 103833. [Google Scholar] [CrossRef]
- Hwang, R.-L.; Lin, T.-P. Thermal Comfort Requirements for Occupants of Semi-Outdoor and Outdoor Environments in Hot-Humid Regions. Archit. Sci. Rev. 2007, 50, 357–364. [Google Scholar] [CrossRef]
- Lin, T.-P. Thermal perception, adaptation and attendance in a public square in hot and humid regions. Build. Environ. 2009, 44, 2017–2026. [Google Scholar] [CrossRef]
- Lopes, H.S.; Remoaldo, P.C.; Ribeiro, V.; Martín-Vide, J.; Ribeiro, I. Clothing and Outdoor Thermal Comfort (OTC) in tourist environments: A case study from Porto (Portugal). Int. J. Biometeorol. 2024, 68, 2333–2355. [Google Scholar] [CrossRef]
- Matzarakis, A.; Amelung, B. Physiological Equivalent Temperature as Indicator for Impacts of Climate Change on Thermal Comfort of Humans. In Seasonal Forecasts, Climatic Change and Human Health; Thomson, M.C., Ed.; Springer International Publishing: Berlin/Heidelberg, Germany, 2008; Volume 30, pp. 161–172. [Google Scholar] [CrossRef]
- Santos Nouri, A.; Afacan, Y.; Çalışkan, O.; Lin, T.P.; Matzarakis, A. Approaching environmental human thermophysiological thresholds for the case of Ankara, Turkey. Theor. Appl. Climatol. 2020, 143, 533–555. [Google Scholar] [CrossRef] [PubMed]
- Matzarakis, A. Transfer of climate data for tourism applications-The Climate-Tourism/Transfer-Information-Scheme. Sustain. Environ. Res. 2014, 24, 273–280. [Google Scholar]
- Höppe, P. Die Energiebilanz des Menschen. In Wissenschaftliche Mitteilungen; Meteorologisches Institut München: Munich, Germany, 1984; Volume 49, p. 173. [Google Scholar]
- Ahan, M.M.; Nouri, A.S.; Matzarakis, A. Investigating the Relationship of Outdoor Heat Stress upon Indoor Thermal Comfort and Qualitative Sleep Evaluation: The Case of Ankara. Atmosphere 2023, 14, 1407. [Google Scholar] [CrossRef]
- de Freitas, C.R.; Grigorieva, E.A. A comparison and appraisal of a comprehensive range of human thermal climate indices. Int. J. Biometeorol. 2017, 61, 487–512. [Google Scholar] [CrossRef]
- Staiger, H.; Laschewski, G.; Matzarakis, A. Selection of Appropriate Thermal Indices for Applications in Human Biometeorological Studies. Atmosphere 2019, 10, 18. [Google Scholar] [CrossRef]
- Matzarakis, A.; Mayer, H.; Iziomon, M.G. Applications of a universal thermal index: Physiological equivalent temperature. Int. J. Biometeorol. 1999, 43, 76–84. [Google Scholar] [CrossRef] [PubMed]
- Matzarakis, A.; Fröhlich, D.; Ketterer, C.; Martinelli, L. Urban Bioclimate and Micro-Climate: How to Construct Cities in the Era of Climate Change. In Climate Change and Sustainable Heritage; Hofbauer, C., Kandjani, E.M., Meuwissen, J., Eds.; Cambridge Scholars Publishing: Newcastle upon Tyne, UK, 2018; pp. 38–61. [Google Scholar]
- Lin, T.-P.; Yang, S.-R.; Chen, Y.-C.; Matzarakis, A. The potential of a modified physiologically equivalent temperature (mPET) based on local thermal comfort perception in hot and humid regions. Theor. Appl. Climatol. 2019, 135, 873–876. [Google Scholar] [CrossRef]
- Alcoforado, M.-J.; Andrade, H.; Lopes, A.; Vasconcelos, J. Application of Climatic Guidelines to Urban Planning. The example of Lisbon (Portugal). Landsc. Urban. Plann. 2009, 90, 56–65. [Google Scholar] [CrossRef]
- Johansson, E. Influence of urban geometry on outdoor thermal comfort in a hot dry climate: A study in Fez, Morocco. Build. Environ. 2006, 41, 1326–1338. [Google Scholar] [CrossRef]
- Matzarakis, A.; Rutz, F.; Mayer, H. Modelling radiation fluxes in simple and complex environments-application of the RayMan model. Int. J. Biometeorol. 2007, 51, 323–334. [Google Scholar] [CrossRef]
- Nouri, A.S.; Charalampopoulos, I.; Matzarakis, A. Beyond singular climatic variables—Identifying the dynamics of wholesome thermo-physiological factors for existing/future human thermal comfort during hot dry mediterranean summers. Int. J. Environ. Res. Public. Health. 2018, 15, 2362. [Google Scholar] [CrossRef]
- Contribution of Working Group I to the Fifth Assessment Report of the Intergovernmental Panel on Climate Change. In IPCC: Climate Change 2013: The Physical Science Basis; Stocker, T.F., Qin, D., Plattner, G.-K., Tignor, M., Allen, S.K., Boschung, J., Nauels, A., Xia, Y., Bex, V., Midgley, P.M., Eds.; Cambridge University Press: Cambridge, UK; New York, NY, USA, 2013; 1535p. [Google Scholar]
- Rodríguez Algeciras, J.A.; Matzarakis, A. Quantification of thermal bioclimate for the management of urban design in Mediterranean climate of Barcelona, Spain. Int. J. Biometeorol. 2016, 60, 1261–1270. [Google Scholar] [CrossRef]
- Costa, J.P. Urbanismo e Adaptação as Alterações Climáticas-As Frentes de Água; Livros Horizonte: Lisboa, Portugal, 2013. [Google Scholar]
- Hanna, E.G.; Tait, P.W. Limitations to Thermoregulation and Acclimatization Challenge Human Adaptation to Global Warming. Int. J. Environ. Res. Public. Health. 2015, 12, 8034–8074. [Google Scholar] [CrossRef]
- Detommaso, M.; Gagliano, A.; Marletta, L.; Nocera, F. Sustainable urban greening and cooling strategies for thermal comfort at pedestrian level. Sustainability 2021, 13, 3138. [Google Scholar] [CrossRef]
- Ali-Toudert, F.; Mayer, H. Effects of Street Design on Outdoor Thermal Comfort. Landsc. Environ. Soc. 2006, 45, 45–55. [Google Scholar]
- Johansson, E.; Yahia, M.W.; Arroyo, I.; Bengs, C. Outdoor thermal comfort in public space in warm-humid Guayaquil, Ecuador. Int. J. Biometeorol. 2018, 62, 387–399. [Google Scholar] [CrossRef] [PubMed]
- Wollschläger, N.; Zinck, F.; Schlink, U. Sustainable Urban Development for Heat Adaptation of Small and Medium Sized Communities. Land 2022, 11, 1385. [Google Scholar] [CrossRef]
- de Quadros, B.M.; Mizgier, M.G.O. Urban green infrastructures to improve pedestrian thermal comfort: A systematic review. In Urban Forestry and Urban Greening; Elsevier GmbH: Munich, Germany, 2023; Volume 88. [Google Scholar] [CrossRef]
- Theeuwes, N.E.; Steeneveld, G.J.; Ronda, R.J.; Heusinkveld, B.G.; van Hove, L.W.A.; Holtslag, A.A.M. Seasonal dependence of the urban heat island on the street canyon aspect ratio. Q. J. R. Meteorol. Soc. 2014, 140, 2197–2210. [Google Scholar] [CrossRef]
- Santamouris, M. Cooling the cities-A review of reflective and green roof mitigation technologies to fight heat island and improve comfort in urban environments. Sol. Energy 2014, 103, 682–703. [Google Scholar] [CrossRef]
- Oke, T.R. Boundary Layer Climates, 2nd ed.; Routledge: Oxfordshire, UK, 1987. [Google Scholar]
- Yavașlı, D.D.; Erlat, E. Tropical nights in the Mediterranean: A spatiotemporal analysis of trends from 1950 to 2022. Int. J. Climatol. 2024, 44, 1472–1488. [Google Scholar] [CrossRef]
- Matzarakis, A.; Fröhlich, D.; Bermon, S.; Adami, P.E. Quantifying thermal stress for sport events-The case of the Olympic Games 2020 in Tokyo. Atmosphere 2018, 9, 479. [Google Scholar] [CrossRef]
- Yang, J.; Wang, Z.; Kaloush, K. Unintended Consequences—A Research Synthesis Examining the Use of Reflective Pavements to Mitigate the Urban Heat Island Effect; Arizona State University National Center for Excellence for SMARTInnovations: Tempe, AZ, USA, 2013. [Google Scholar]
- Nouri, A.S.; Costa, J.P.; Santamouris, M.; Matzarakis, A. Approaches to Outdoor Thermal Comfort Thresholds through Public Space Design: A review. Atmosphere 2018, 9, 108. [Google Scholar] [CrossRef]
- Lan, L.; Tsuzuki, K.; Liu, Y.; Lian, Z. Thermal environment and sleep quality: A review. Energy Build. 2017, 149, 101–113. [Google Scholar] [CrossRef]
- Heidenreich, A.; Thieken, A.H. Individual heat adaptation: Analyzing risk communication, warnings, heat risk perception, and protective behavior in three German cities. Risk Anal. 2024, 44, 1788–1808. [Google Scholar] [CrossRef]
- Oke, T.R.; Mills, G.; Christen, A.; Voogt, J.A. Urban Climates; Cambridge University Press: Cambridge, UK, 2017; 526p. [Google Scholar]
Figure 1.
Geographical setting of the FCT NOVA campus.
Figure 1.
Geographical setting of the FCT NOVA campus.
Figure 2.
(a) Map of the NOVA FCT campus highlighting (in red) the main avenue. (b) Establishing specific Points of Interest (POIs) around the campus main avenue.
Figure 2.
(a) Map of the NOVA FCT campus highlighting (in red) the main avenue. (b) Establishing specific Points of Interest (POIs) around the campus main avenue.
Figure 3.
(
a) Ranges of the physiologically equivalent temperature (PET) for different grades of thermal perception and physiological stress (PS) on human beings; internal heat production: 80 W, heat transfer resistance of the clothing: 0.9 clo (source: adapted from Matzarakis et al. [
55]). (
b) Applied grade extension of physiological stress (PS) on human beings to accompany increased physiologically equivalent temperature (PET) values beyond 41 °C [
49].
Figure 4.
The average (avg) and maximum (max) outdoor temperature (Tair) recorded for each of the days in July and August (source: WMO—weather station in Portela, Lisbon, with index Nº 08536).
Figure 4.
The average (avg) and maximum (max) outdoor temperature (Tair) recorded for each of the days in July and August (source: WMO—weather station in Portela, Lisbon, with index Nº 08536).
Figure 5.
The average adapted wind velocity (V1.1) recorded for each of the days in July and August (source: WMO—weather station in Portela, Lisbon, with index Nº 08536).
Figure 5.
The average adapted wind velocity (V1.1) recorded for each of the days in July and August (source: WMO—weather station in Portela, Lisbon, with index Nº 08536).
Figure 6.
Sky View Factor (SVF) of each POI and the corresponding sun’s path (indicated by the red line), respectively.
Figure 6.
Sky View Factor (SVF) of each POI and the corresponding sun’s path (indicated by the red line), respectively.
Figure 7.
Comparison of the Tmrt values recorded between POI 4 (higher SVF value) and POI 5 (lower SVF value) over the measurement days (MD1–MD7) in both the diurnal and nocturnal periods.
Figure 7.
Comparison of the Tmrt values recorded between POI 4 (higher SVF value) and POI 5 (lower SVF value) over the measurement days (MD1–MD7) in both the diurnal and nocturnal periods.
Figure 8.
Heatmap of PET and mPET values across seven days of measurement (MD1-MD7) at various times of the day (03:00–23:00) for the six Points of Interest (POIs 1 to 6) and the fixed reference station (R).
Figure 8.
Heatmap of PET and mPET values across seven days of measurement (MD1-MD7) at various times of the day (03:00–23:00) for the six Points of Interest (POIs 1 to 6) and the fixed reference station (R).
Figure 9.
Variations in PET and mPET values relative to the reference station (R) across the six POIs for the second and the sixth day of measurement (MD2 and MD6) at specific times of the day. Positive and negative differences indicate increased or reduced thermal stress compared to the reference conditions.
Table 1.
Selection criteria of measurement days (MD1 to MD7).
Table 1.
Selection criteria of measurement days (MD1 to MD7).
| Criteria | Description |
|---|
Representation of
Thermal Conditions | Selection of days covering a spectrum of thermal scenarios: from extreme heat stress (high maximum temperatures) to milder stress conditions. |
| Temporal Continuity | Days were scheduled consecutively or within short intervals to ensure continuous and representative data collection, avoiding isolated observations. |
Diurnal and
Nocturnal Variations | Measurements captured variations at key times of day: morning, midday, afternoon, and nighttime. |
| Microclimatic Specificity | Selected days accounted for the diversity of POIs, including variations in shading, surface materials, wind exposure, and levels of pedestrian activity (areas with higher footfall). |
Validation with
Station Data | Full analysis of July and August meteorological data ensured that the chosen days represented typical summer conditions for the region, supporting representativeness. |
Table 2.
Description and justification of selected POIs.
Table 2.
Description and justification of selected POIs.
| POI | Description | Justification |
|---|
| 1 | Outdoor area with
constant sun exposure. | Tests the effect of prolonged global radiation on thermal comfort in areas with limited shadow from buildings or vegetation. |
| 2 | Outdoor area shaded by natural elements (tree/vegetation). | Examines the impact of vegetative shading on thermal comfort and radiation fluxes. |
| 3 | Permanently
sun-exposed area near a white-walled building (Building I) and sidewalk. | Assesses the combined effects of global radiation, building materials, and surface reflectivity on all
microclimatic variables. |
| 4 | Central passage zone
frequently used by the community. | Analyzes the thermal comfort impact of prolonged
exposure to global radiation in a busy pedestrian area without significant shading. |
| 5 | Shaded area near POI 4 with tree cover. | Investigates the contrasting impact of tree shading on thermal comfort in the same environment as POI 4, highlighting differences in microclimatic conditions. |
| 6 | Pedestrian crossing point at the entrance/exit of Building VII, constantly shaded. | Explores the effects of constant shading on microclimatic variables, focusing on radiation flux reduction and its influence on thermal comfort. |
Table 3.
Group classification of POIs.
Table 3.
Group classification of POIs.
| Group | POIs | Characteristics |
|---|
G1—Shaded
Locations | 2, 5, and 6 | Significant shading from trees or buildings; represent
areas with reduced direct solar radiation exposure. |
| G2—Sun-Exposed Locations | 1, 3, and 4 | Minimal shading, high solar exposure; represent areas with maximum thermal stress potential. |
Table 4.
Temporal framework for microclimatic measurements and justifications.
Table 4.
Temporal framework for microclimatic measurements and justifications.
| Time Period | Period | Time Interval (Hour) | Justification |
|---|
| Nocturnal 1 | At Dawn | 03:00–05:00 | Captures the influence of nocturnal cooling and potential early-morning cold fronts. |
| Diurnal 1 | Morning | 10:00–12:00 | Records the effects of increasing solar radiation as the sun rises to its midday position. |
| Diurnal 2 | Afternoon | 14:00–16:00 | Focuses on the hottest part of the day, with peak solar radiation and heat accumulation. |
| Nocturnal 2 | Late Night | 22:00–00:00 | Captures nighttime cooling dynamics and the dissipation of heat stored during the day. |
Table 5.
Summary of SVF, sun exposure, Ta, and Tmrt values per POI.
Table 5.
Summary of SVF, sun exposure, Ta, and Tmrt values per POI.
| POI | SVF | Sun Exposure
Duration | Tmrt (°C)—Diurnal | Ta (°C)—
Diurnal | Tmrt (°C)—
Nocturnal | Ta (°C)—
Nocturnal |
|---|
| 1 | 0.965 | 14 h of full
exposure | 50–61 °C (MD1-MD7) | 23–33 °C | 11–19 °C | 19–27 °C |
| 2 | 0.448 | 4 h (10 h of shading, especially during critical periods: 10:00–14:00;
15:00–19:00) | 40–51 °C | 22–33 °C | 15–23 °C | 19–27 °C |
| 3 | 0.556 | 9 h of sun exposure (08:00–17:00) | 51–62 °C (MD4 highest) | 23–34 °C | 14–23 °C | 19–28 °C |
| 4 | 0.900 | 13 h of full
exposure | 53–63 °C | 24–34 °C | 11–19 °C | 19–28 °C |
| 5 | 0.162 | Permanent shaded
(except 10:40 h) | 42–65 °C (peak at 10:40 h) | 23–34 °C | 17–25 °C | 19–28 °C |
| 6 | 0.417 | 5 h (9 h of shading: 08:00–17:00) | 41–50 °C | 22–32 °C | 15–23 °C | 18–27 °C |
Table 6.
Diurnal and nocturnal thermal comparison between POIs.
Table 6.
Diurnal and nocturnal thermal comparison between POIs.
| POIs Compared | Diurnal (10:00 h–15:00 h) | Nocturnal (03:00 h–04:00 h; 22:00 h–23:00 h) |
|---|
| POI 1 vs. POI 2 | POI 1 exhibited higher PET (33–46 °C) and mPET (32–41 °C), classified as MHS to EHS1, due to asphalt heat absorption. POI 2 benefits from tree shade, which reduces thermal stress (STHS). | POI 1 retained some heat, with PET averaging 17–22 °C and mPET 18–23 °C (NTS to SHS). POI 2 achieved NTS (PET and mPET: 18–19 °C), highlighting the cooling effect of permeable ground. |
| POI 3 vs. POI 6 | POI 3 recorded the highest thermal stress due to prolonged solar exposure and reflective surfaces, with PET 39–49 °C and mPET 36–44 °C (STHS to EHS2). POI 6, benefiting from built shading, showed lower PET (26–33 °C) and mPET (26–32 °C), corresponding to SHS to MHS. | POI 3 retained more heat, with PET and mPET values of 22–25 °C (SHS). POI 6 cooled more effectively, obtaining NTS (PET 18–21 °C and mPET 20–21 °C). |
| POI 4 vs. POI 5 | POI 4 experienced significant thermal stress (PET: 37–50 °C, mPET: 36–44 °C, STHS to EHS2), exacerbated by solar exposure and limited ventilation. POI 5, benefiting from mixed shade, had lower PET (29–38 °C) and mPET (28–35 °C), reducing thermal stress to MHS–STHS. | POI 4 retained more heat, with PET values of 21–24 °C and mPET values of 22–24 °C (SHS). POI 5 showed slightly lower values, with PET averaging 21–22 °C and mPET around 22 °C (NTS to SHS). |
Table 7.
Summary of risk factors identified, their occurrence (POIs), their influence on human thermal stress, and the observed impact.
Table 7.
Summary of risk factors identified, their occurrence (POIs), their influence on human thermal stress, and the observed impact.
| Risk Factor | POIs | Influence Upon
Human Thermal Stress | Observed Impact
(ΔPET/mPET/Tmrt) |
|---|
| High Ta | 1, 2, 3, 4, 5, 6 | Contributes to elevated PET and mPET values, increasing thermal stress, especially during midday on MD1 and MD2. | PET up to 56 °C in exposed POIs (e.g., POI 3) |
| Low Vmean/Vmin | 3, 5 | Reduces natural cooling, exacerbating heat retention and increasing thermal stress. | ΔPET up to +6 °C compared to better ventilated POIs |
Lack of
natural
ventilation | 3, 5 | Leads to heat retention, causing high PET and mPET values, particularly in areas with built surfaces and limited airflow. | mPET above 30 °C in shaded but poorly ventilated zones |
| Absence of shading or sun-exposed areas | 1, 3, 4 | Direct solar exposure results in extreme PET and mPET values, contributing to STHS and EHS during the daytime. | ΔPET up to +27 °C between sun-exposed and shaded POIs |
Heat retention by built
surfaces
(hardscape and asphalt) | 3, 4, 5 | Increases nocturnal PET and mPET values due to thermal inertia, prolonging thermal stress into evening and early morning hours. | Nocturnal PET up to 29 °C (POI 5) |
| Reflective wall surfaces | 3 | Causes localized heat retention and elevated PET and mPET values,
especially during MD1 and MD2. | Tmrt up to 68 °C near reflective building walls |
Lack of
permeable ground | 1, 3, 4, 5 | Reduces evaporative cooling, contributing to higher diurnal and nocturnal thermal stress. | ΔPET up to +5 °C compared to greener areas |
| Presence of tree shading | 2 | Provides natural cooling, reducing PET, mPET, and nocturnal Tmrt values. Helps surfaces cool faster after sunset, lowering heat retention and reducing thermal stress during the day and night. | ΔPET up to −20 °C vs. sun-exposed POIs; nocturnal Tmrt up to −15 °C |
Table 8.
Summary of heat-related risk factors, respective observed impacts, and campus-based heat-resilient strategies and measures.
Table 8.
Summary of heat-related risk factors, respective observed impacts, and campus-based heat-resilient strategies and measures.
| Risk Factor | Observed Impact | Heat-Resilient Strategies and Measures |
|---|
| High PET and mPET values in sun-exposed locations (e.g., POI 3) | Extreme heat stress reaching
56 °C | Increase tree cover and optimize shading infrastructure (e.g., pergolas); incorporate cool materials (high-albedo or phase-change) to reduce heat absorption |
| Limited wind flow | Reduced convective cooling, increasing heat retention | Design ventilation corridors and improve airflow through spatial reconfiguration and open-space planning |
| High SVF areas retaining excessive heat | Elevated diurnal and nocturnal thermal stress | Introduce cool pavements and reflective materials, increase vegetative shading, and reduce surface exposure |
| Insufficient adaptation to future climate change | PET values projected to exceed 60 °C under RCP 8.5 | Implement climate-adaptive urban planning policies, foster interdisciplinary collaboration, and develop a campus-specific resilience framework |
| Lack of nocturnal cooling in built environments | Heat retention prolongs thermal discomfort | Utilize permeable surfaces, cool roofing, and water elements to enhance cooling; promote nocturnal radiative cooling |
| Low public awareness of microclimatic risk | Reduced community resilience and engagement | Develop communication campaigns and interactive thermal comfort maps to raise awareness and support behavioral adaptation among campus users |
| Disclaimer/Publisher’s Note: The statements, opinions and data contained in all publications are solely those of the individual author(s) and contributor(s) and not of MDPI and/or the editor(s). MDPI and/or the editor(s) disclaim responsibility for any injury to people or property resulting from any ideas, methods, instructions or products referred to in the content. |
© 2025 by the authors. Licensee MDPI, Basel, Switzerland. This article is an open access article distributed under the terms and conditions of the Creative Commons Attribution (CC BY) license (https://creativecommons.org/licenses/by/4.0/).


