Article

Convection-Permitting Ability in Simulating an Extratropical Cyclone Case over Southeastern South America

by
Matheus Henrique de Oliveira Araújo Magalhães
1,
Michelle Simões Reboita
2,*,
Rosmeri Porfírio da Rocha
1,
Thales Chile Baldoni
2,
Geraldo Deniro Gomes
1 and
Enrique Vieira Mattos
2
1
Departamento de Ciências Atmosféricas, Universidade de São Paulo (USP), Rua do Matão 1226, São Paulo 05508-090, SP, Brazil
2
Instituto de Recursos Naturais, Universidade Federal de Itajubá (UNIFEI), Av. BPS, 1303, Itajubá 37500-903, MG, Brazil
*
Author to whom correspondence should be addressed.
Atmosphere 2025, 16(6), 675; https://doi.org/10.3390/atmos16060675
Submission received: 22 April 2025 / Revised: 7 May 2025 / Accepted: 30 May 2025 / Published: 2 June 2025
(This article belongs to the Special Issue Weather and Climate Extremes: Past, Current and Future)

Abstract

Between 14 and 16 June 2023, an extratropical cyclone affected the south-southeastern coast of Brazil, causing significant damage and loss of life. In the state of Rio Grande do Sul, Civil Defense authorities reported at least 16 fatalities. Although numerical models can simulate the general characteristics of extratropical cyclones, they often struggle to accurately represent the intensity and timing of strong winds and heavy precipitation. One approach to improving such simulations is the use of convective-permitting models (CPMs), in which convection is explicitly resolved. In this context, the main objective of this study is to assess the performance of the Weather Research and Forecasting (WRF) model in CP mode, nested in the ERA5 reanalysis, in representing both the synoptic and mesoscale structures of the cyclone, as well as its associated strong winds and precipitation. The WRF-CP successfully simulated the cyclone’s track, though with some discrepancies in the cyclone location during the first 12 h. Comparisons with radar-based precipitation estimates indicated that the WRF-CP captured the location of the observed precipitation bands. During the cyclone’s occlusion phase—when precipitation was particularly intense—hourly simulated precipitation and 10 m wind (speed, zonal, and meridional components) were evaluated against observations from meteorological stations. WRF-CP demonstrated strong skill in simulating both the timing and intensity of precipitation, with correlation coefficients exceeding 0.4 and biases below 0.5 mm h−1. Some limitations were observed in the simulation of 10 m wind speed, which tended to be overestimated. However, the model performed well in simulating the wind components, particularly the zonal component, as indicated by predominantly high correlation values (most above 0.4), suggesting a good representation of wind direction, which is a function of the zonal and meridional components. Overall, the simulation highlights the potential of WRF-CP for studying extreme weather events, including the small-scale structures embedded within synoptic-scale cyclones responsible for producing adverse weather.

1. Introduction

Extratropical cyclones in the southwestern South Atlantic Ocean are responsible for abrupt weather changes such as intense rainfall, strong winds, temperature drops, and high sea waves. These weather changes often result in extreme events that affect not only maritime activities but also densely populated coastal areas of Southern and southeastern Brazil [1,2,3,4,5,6,7].
There is growing interest in forecasting extreme events across various time scales, from weather to climate. While global and regional numerical models have great skill in capturing the location and intensity of synoptic-scale cyclones, they still face limitations in accurately resolving the timing, intensity, and location of mesoscale phenomena, particularly during extreme weather events [8]. This limitation is largely due to the coarse horizontal resolution and reliance on cumulus parameterization schemes, which introduce substantial uncertainties in representing convective processes.
In the context of regional modeling, one approach to improving the representation of extreme precipitation such as that associated with cyclone events is the use of convection-permitting models (CPMs)—also known as kilometer-scale models—which employ refined horizontal (<4 km) and vertical grids, allowing for the explicit resolution of deep convection and eliminating the need for cumulus parameterization schemes, a major source of error in traditional simulations [9,10,11,12,13]. At this point, it is important to distinguish the use of CPMs from conventional weather forecasting practices. The CP modeling uses the regional models for simulating areas generally bigger than in the weather forecast, and the lateral boundary conditions are driven by data with a horizontal resolution of ~25 km, not needing nesting in several grids until reaching the CP scale [14,15].
CPMs have significantly enhanced the simulation of mesoscale structures, such as convective clusters and squall lines, thereby improving the realism of high-impact weather event forecasts, particularly in regions with complex topography (e.g., the study of [16]) and land–ocean contrasts (e.g., the study of [17]). Consequently, these models improve the representation of daily extreme rainfall [10,12,18] and sub-hourly scales [19].
As CPMs are now well-established and widely accepted within the atmospheric science community, current research is no longer focused on comparing CPMs to coarser-resolution models but rather on evaluating their ability to realistically capture fine-scale processes—especially the diurnal cycle of precipitation, temperature, wind, boundary layer dynamics, and representation of the mesoscale convective systems [12,20,21,22,23].
In the case of meso to synoptic scale cyclones, CPMs can contribute to the development of mesoscale structures, such as convective clusters and squall lines that produce strong winds and heavy rainfall along their trajectory. Ref. [24] demonstrated that CP-mode simulations effectively reproduced refined-scale structures in the case of Medicanes in the Mediterranean Sea. Ref. [25] evaluated different physical processes in a Medicane that occurred in November 2014 using kilometer-scale ocean–atmosphere coupled modeling. For instance, by isolating the influence of the surface parameters on the surface fluxes at sea, the authors showed the impact of the cold pools on the surface processes. Recently, the Geophysical Fluid Dynamics Laboratory (GFDL) introduced the 6.5 km version of the System for High-resolution prediction on Earth-to-Local Domains (SHiELD; [8]), and one highlight is that the model predicts considerably finer-scale convective systems associated with large-scale frontal systems and extratropical cyclones. The model also represents the mesoscale scattered cumulus clouds associated with post-frontal systems and the complex structures in marine stratocumulus clouds.
The use of CPMs allows for a deeper understanding of mesoscale structures embedded within extratropical cyclones and the impact of these systems on the diurnal cycle of key variables, such as precipitation and wind. Despite these capabilities, the application of CPMs to assess their performance remains underexplored in certain regions, particularly over the southwestern South Atlantic Ocean. To help fill this gap, the extratropical cyclone of 14 June 2023 presents a valuable case study. This system formed off the southeastern coast of Brazil and followed an anomalous southwestward path toward the continent, bringing heavy rainfall and strong winds to the southeastern and Southern Brazilian coasts [7]. According to a report published on 27 June 2023, by the Civil Defense of Rio Grande do Sul (RS), the cyclone had already claimed 16 lives, mainly due to the heavy rainfall. A total of 59 municipalities had declared a state of emergency or calamity, and more than 4000 people were left homeless [26].
Building on the previous context, the goal of this study is to evaluate the performance of the Weather Research and Forecasting (WRF) model, configured in CP mode, in simulating the synoptic and mesoscale characteristics of the extratropical cyclone that occurred in June 2023. Specifically, we assess the model’s ability to reproduce the timing, spatial distribution, and intensity of the associated precipitation and wind fields, as well as to capture the mesoscale structures embedded within the cyclone.

2. Materials and Methods

2.1. Study Area and Data

The study area encompasses the southwestern South Atlantic Ocean and Southern and southeastern Brazil, as shown in Figure 1.
Different datasets are used in this study as follows:
Reanalysis: The ERA5 [27], produced by the European Centre for Medium-Range Weather Forecasts (ECMWF), provides near-surface and isobaric-level variables to drive the WRF-CP simulations. These data are available with a horizontal resolution of 0.25° × 0.25° of latitude by longitude, hourly frequency, and 37 vertical levels extending from 1000 to 1 hPa. The data are available at https://cds.climate.copernicus.eu/datasets/ (accessed on 15 June 2024).
Precipitation Gridded Dataset: The Multi-Source Weather (MSWX [28]) dataset provides high-resolution global precipitation data by merging multiple observational sources (gauge stations, remote sensing, and ERA5 reanalysis). It features a spatial resolution of 0.1° × 0.1°, 3 hourly frequency, covers the period from 1979 to the present, and is available at https://www.gloh2o.org/mswx/ (accessed on 15 January 2025).
Meteorological Stations: Hourly precipitation data from 43 stations and 10 m wind speed and direction from 38 stations were obtained from automatic meteorological stations (Material Supplementary S1), operated by the Brazilian National Institute of Meteorology (INMET; https://bdmep.inmet.gov.br/—accessed on 20 February 2025). Using wind speed and direction, we calculated the zonal and meridional wind components, which are evaluated in this study.
Radar Estimates: During the cyclone period, we obtained weather radar estimates from São Paulo (SP) state; precipitation along the coast of RS was not recorded by the radar network due to coverage limitations. To estimate precipitation using weather radar, reflectivity data from the São Roque (SP) radar was utilized. This radar operates in the S-band (10 cm wavelength) with single-polarization and is located in the municipality of São Roque, SP, at location 23.6020° S and 47.0943° W (Figure 1), an elevation of 1147.54 m. It performs scans at 15 different elevation angles, ranging from 0.5° to 18.0°, with a maximum range of 240 km and a temporal resolution of 10 min. Plan Position Indicator (PPI) reflectivity data was converted into Constant Altitude Plan Position Indicator (CAPPI) data with a horizontal spatial resolution of 1 km. The CAPPI reflectivity at a 3 km altitude was used as a reference to estimate precipitation. Radar reflectivity was converted to precipitation intensity (mm h−1) using the Marshall–Palmer Z-R relationship [29], which was adapted for the study region [30]:
Z = a Rb
where a and b are constants related to the drop size distribution. These values were experimentally determined during the CHUVA Project, with a = 337 and b = 1.38. Here, Z represents reflectivity (mm6 m−3), and R is the precipitation rate (mm h−1). Radar-derived precipitation was accumulated over a 3 h period for the 1200 UTC and 1800 UTC time slots. For example, the precipitation at 1200 UTC corresponds to the sum of the precipitation accumulated at 1000, 1100, and 1200 UTC.

2.2. WRF Model and Experimental Design

In this study, the Weather Research and Forecasting Model (WRF [31]) was used in the CP mode. WRF has a dynamic core called ARW, which solves the non-hydrostatic Euler equations for a fully compressible atmosphere, with terrain-following vertical coordinates and a time-split integration scheme. The static variables (e.g., topography, land use) used are the default ones provided in the WRF setups. ERA5 atmospheric variables at 37 pressure levels (wind, geopotential height, air temperature, and specific humidity) and near-surface variables (mean sea level pressure—MSLP, soil moisture, etc.), as well as sea surface temperature (SST), provided the initial and boundary conditions for the numerical simulation. Since ERA5 already features a refined grid resolution, it allows for a smoother transition to the convection-permitting horizontal resolution [14], eliminating the need for excessive nestings.
The model was integrated from 0000 UTC on 13 June to 2300 UTC on 17 June 2023, over the domain covering 35.0–21.0° S and 58.0–38.0° W (Figure 1), with a horizontal resolution of 4 km (convection-permitting scale) and 45 vertical levels. Physical processes occurring at subgrid scales can be resolved in the WRF using various parameterization schemes. For simulations in CP mode, the cloud microphysics scheme is of particular interest, as it explicitly resolves the water phases in the atmosphere as a grid-scale process. For this physical process, WRF offers more than 10 options. We used the Thompson microphysics scheme based on the strong performance reported by [32] in simulating synoptic-scale cyclones, as well as its ability to capture a subtropical transition over the SAO, as demonstrated by [33]. The other parameterization schemes used in the WRF simulation include the following: the RRTM scheme for shortwave and longwave radiation [34]; the Noah-MP land surface model for representing land–atmosphere interactions [35]; the Monin–Obukhov (Janjic) scheme for surface layer physics [36]; and the Bougeault and Lacarrere (BouLac) scheme for planetary boundary layer physics [37], all following the configuration used by [32]. The Thompson, RRTM, and Noah-MP parameterizations were also employed by [14] in a successful long-term (2000–2020) convection-permitting simulation with 4 km grid spacing, covering the entire South American continent and adjacent oceans.

2.3. Analyses

We begin the results by presenting the performance of WRF-CP in simulating the main synoptic features (MSLP and precipitation) of the extratropical cyclone. The simulated cyclone’s track and central pressure were compared with ERA5 reanalysis. The central coordinates of the cyclone in both WRF-CP and ERA5 were determined by analyzing the MSLP field using the closed isobar method. Specifically, cyclogenesis was identified when the first closed isobar appears, and cyclolysis occurs when the isobar becomes open. The cyclone studied has a lifespan that extends beyond the simulation period. However, the simulation was carried out for the initial time steps of the cyclone, as our interest lies in the system’s behavior near the coast rather than in the open ocean. Using the geographical coordinates of the cyclone, we calculated its travel distance with the Haversine equation [38].
Daily spatial patterns of simulated precipitation were subjectively compared with MSWX data, where daily precipitation was accumulated from 0000 UTC to 2100 UTC. Embedded mesoscale structures in the cyclone are identified by comparing the simulated spatial precipitation field accumulated at 3 h with radar-based estimates. Next, we compared the performance of WRF-CP with weather radar estimates; but, due to the absence of data on the southern coast of Brazil, this evaluation was limited to southeast Brazil.
We also present the hourly evolution of precipitation and 10 m wind intensity, along with its zonal and meridional components, for selected locations in Southern Brazil, as indicated in Figure 1 and Supplementary Material S1. For this analysis, WRF-CP time series were constructed using the nearest grid point to each meteorological station. To assess the model’s performance in representing near-surface cyclone circulation and associated precipitation, we applied three statistical metrics: temporal Pearson correlation coefficient (r), bias, and root mean square error (RMSE).
The r indicates the strength and signal of the linear relationship between two datasets in this case, simulated and observed values. It ranges from −1 to +1, where +1 indicates a perfect positive linear correlation, −1 a perfect negative linear correlation, and 0 indicates no linear correlation. In model evaluation, higher positive values of r suggest that the simulation accurately captures the temporal variability and pattern of the observed data, although it does not necessarily reflect the magnitude of the values. Although the interpretation of r varies across scientific disciplines, a value of 0.4 is commonly considered indicative of a moderate correlation [39,40]. Therefore, in this study, we adopt 0.4 as the threshold to indicate moderate agreement between simulated and observed values.
To assess the magnitude of discrepancies between simulated and observed values, bias—also referred to as mean error—was used to quantify systematic over- or underestimations, indicating whether a simulation consistently overpredicts or underpredicts observations. For hourly wind intensity, the definition of an acceptable bias depends on the context of the study (e.g., wind energy forecasting, aviation, etc.). Wind energy applications typically require higher precision, as biases exceeding ±1.0 m s−1 can significantly affect power output estimates. In contrast, weather and climate studies may tolerate biases of up to ±2.0 m s−1, particularly in complex terrain (e.g., the studies of [41,42]). It is also important to note that meteorological instruments used to measure wind speed have an inherent uncertainty of approximately ±0.5 m s−1 (which depends on the used sensor [43]); therefore, model bias should ideally be comparable to or only slightly exceed the observational error. Rainfall sensors also have uncertainties, which depend on the sensor type and brand. In general, uncertainties range from 0.1 to 0.2 mm h−1 [44]. Based on these considerations, we expect that our simulation should not exhibit wind speed biases greater than ±2.0 m s−1 and that precipitation biases should be kept as low as possible.
Bias should be analyzed alongside other error metrics, such as the RMSE, because positive and negative deviations can offset each other, potentially masking significant discrepancies between time series. RMSE measures the magnitude of the errors by computing the square root of the average of the squared differences between simulated and observed values. Because errors are squared before averaging, RMSE gives greater weight to larger deviations. Lower RMSE values indicate better model performance [45,46].

3. Results

3.1. Synoptic Features

The synoptic scale refers to a broad overview of atmospheric systems, typically characterized by horizontal dimensions on the order of 103 km and an average lifetime of approximately three days [47]. Hence, an extratropical cyclone is a typical synoptic system.
The genesis of the simulated cyclone occurs westward compared to ERA5 (Figure 2a; Supplementary Material S2). However, from 1200 UTC on June 15 onward, the cyclone follows a similar trajectory in both simulation and ERA5. Due to the westward genesis and the stationarity of the simulated cyclone between June 14 and 15, the total travel distance is reduced by 23% (difference of −436.0 km) in WRF-CP (1457.5 km) compared to ERA5 (1893.3 km). This also results in a lower mean speed of the cyclone in the simulation (6.1 m s−1) relative to ERA5 (8.0 m s−1), as the cyclone’s lifetime is the same in both datasets (66 h). At cyclogenesis, WRF-CP simulates a system that is 2 hPa weaker than in ERA5 (Figure 2b). The MSLP difference between simulation and ERA5 decreases over time but increases again at the final time step, with the simulated cyclone being 6 hPa stronger.
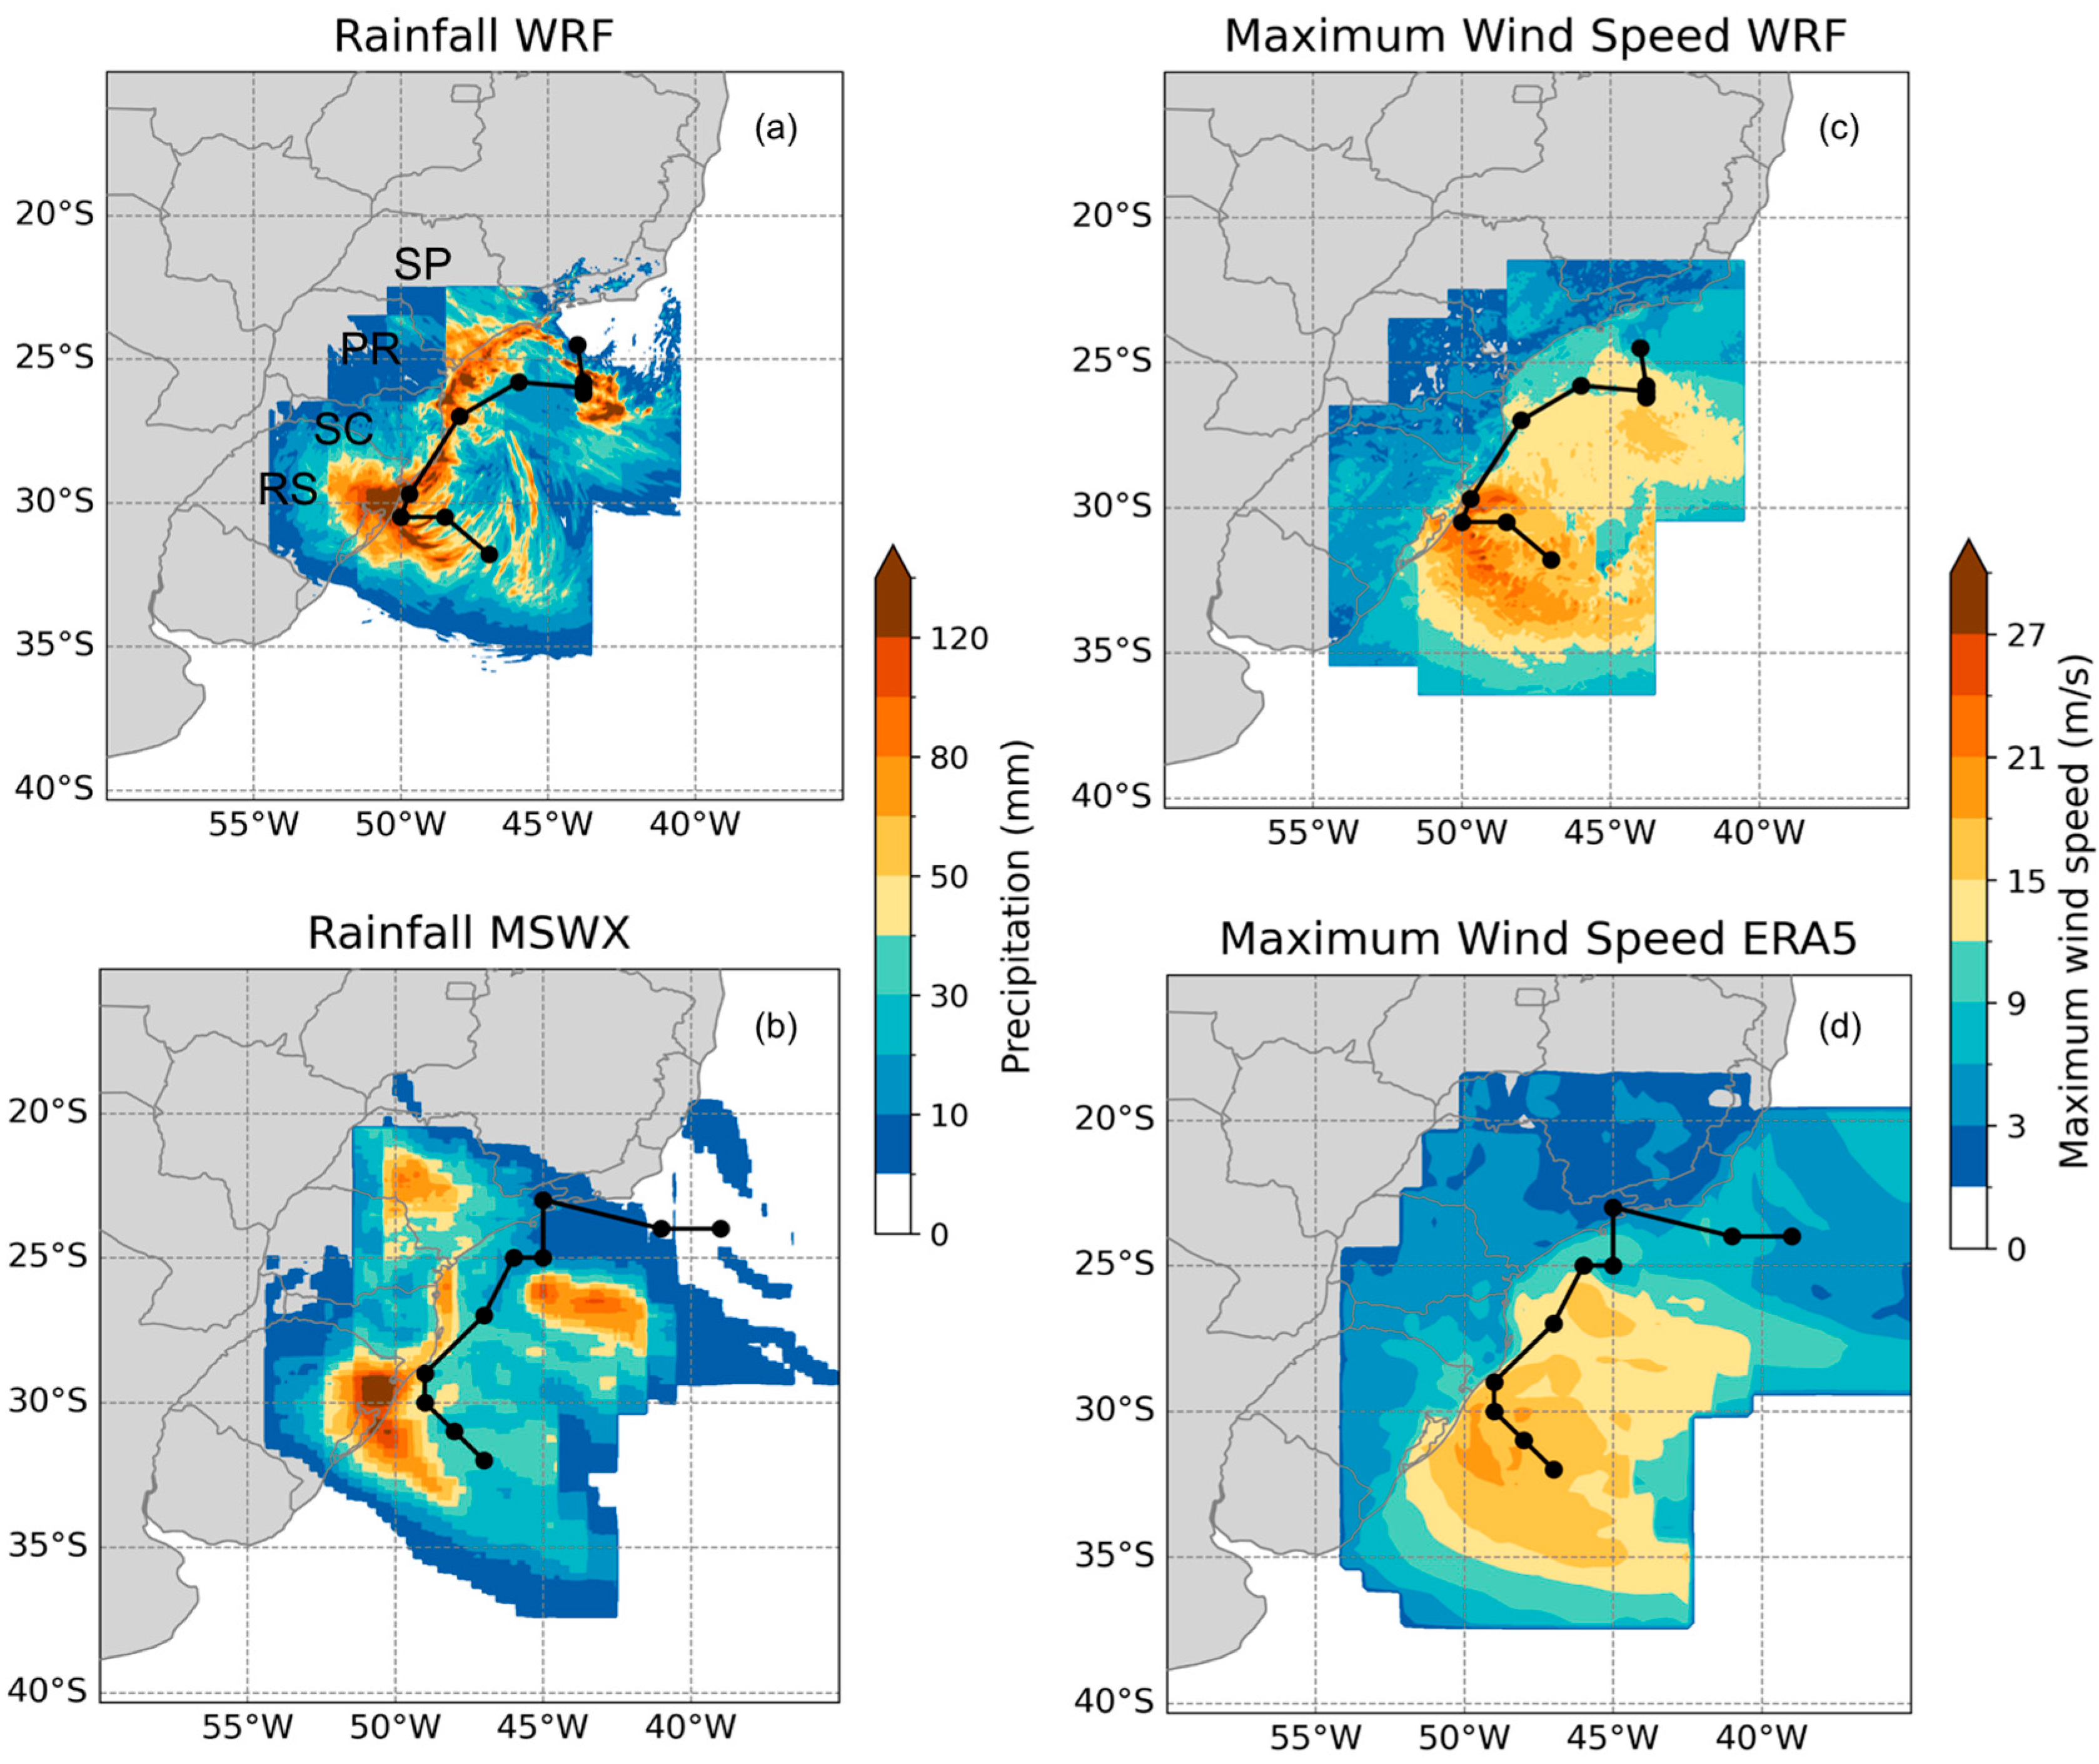
Figure 3 presents the accumulated precipitation (Figure 3a,b) and the maximum 10 m wind speed within a 5° box around the simulated and observed cyclone center, following its track (Figure 3c,d). This provides a comprehensive overview of the regions with higher precipitation amounts and areas experiencing intense winds.
On June 14, higher precipitation volumes were concentrated southeast of the simulated cyclone and in the eastern part of the SP state (Figure 3a). This period exhibits the greatest differences between simulation and MSWX, which also shows two cores of maximum precipitation, but one around 27° S over the ocean and another in the mid-east of the SP state (Figure 3b). Despite these initial differences, on June 15, both datasets depict a rainfall core (~120 mm) over the northeastern RS state.
The precipitation spatial pattern described by MSWX (Figure 3b) was also captured in PERSIANN satellite estimates reported by [7]. However, PERSIANN underestimated the accumulated precipitation, mainly in RS (rainfall core did not exceed 70 mm), compared with MSWX and in situ measurements. This underestimation reflects a common issue with satellite-based datasets, which rely solely on remote sensing and are subject to great uncertainties [48,49].
The most intense 10 m wind speeds in both WRF-CP and ERA5 occur south of 25° S, with a core along the coast of the RS state. In this region, the simulated winds reach nearly 27 m s−1 (Figure 3c), while, in ERA5, they do not exceed 21 m s−1 (Figure 3d).
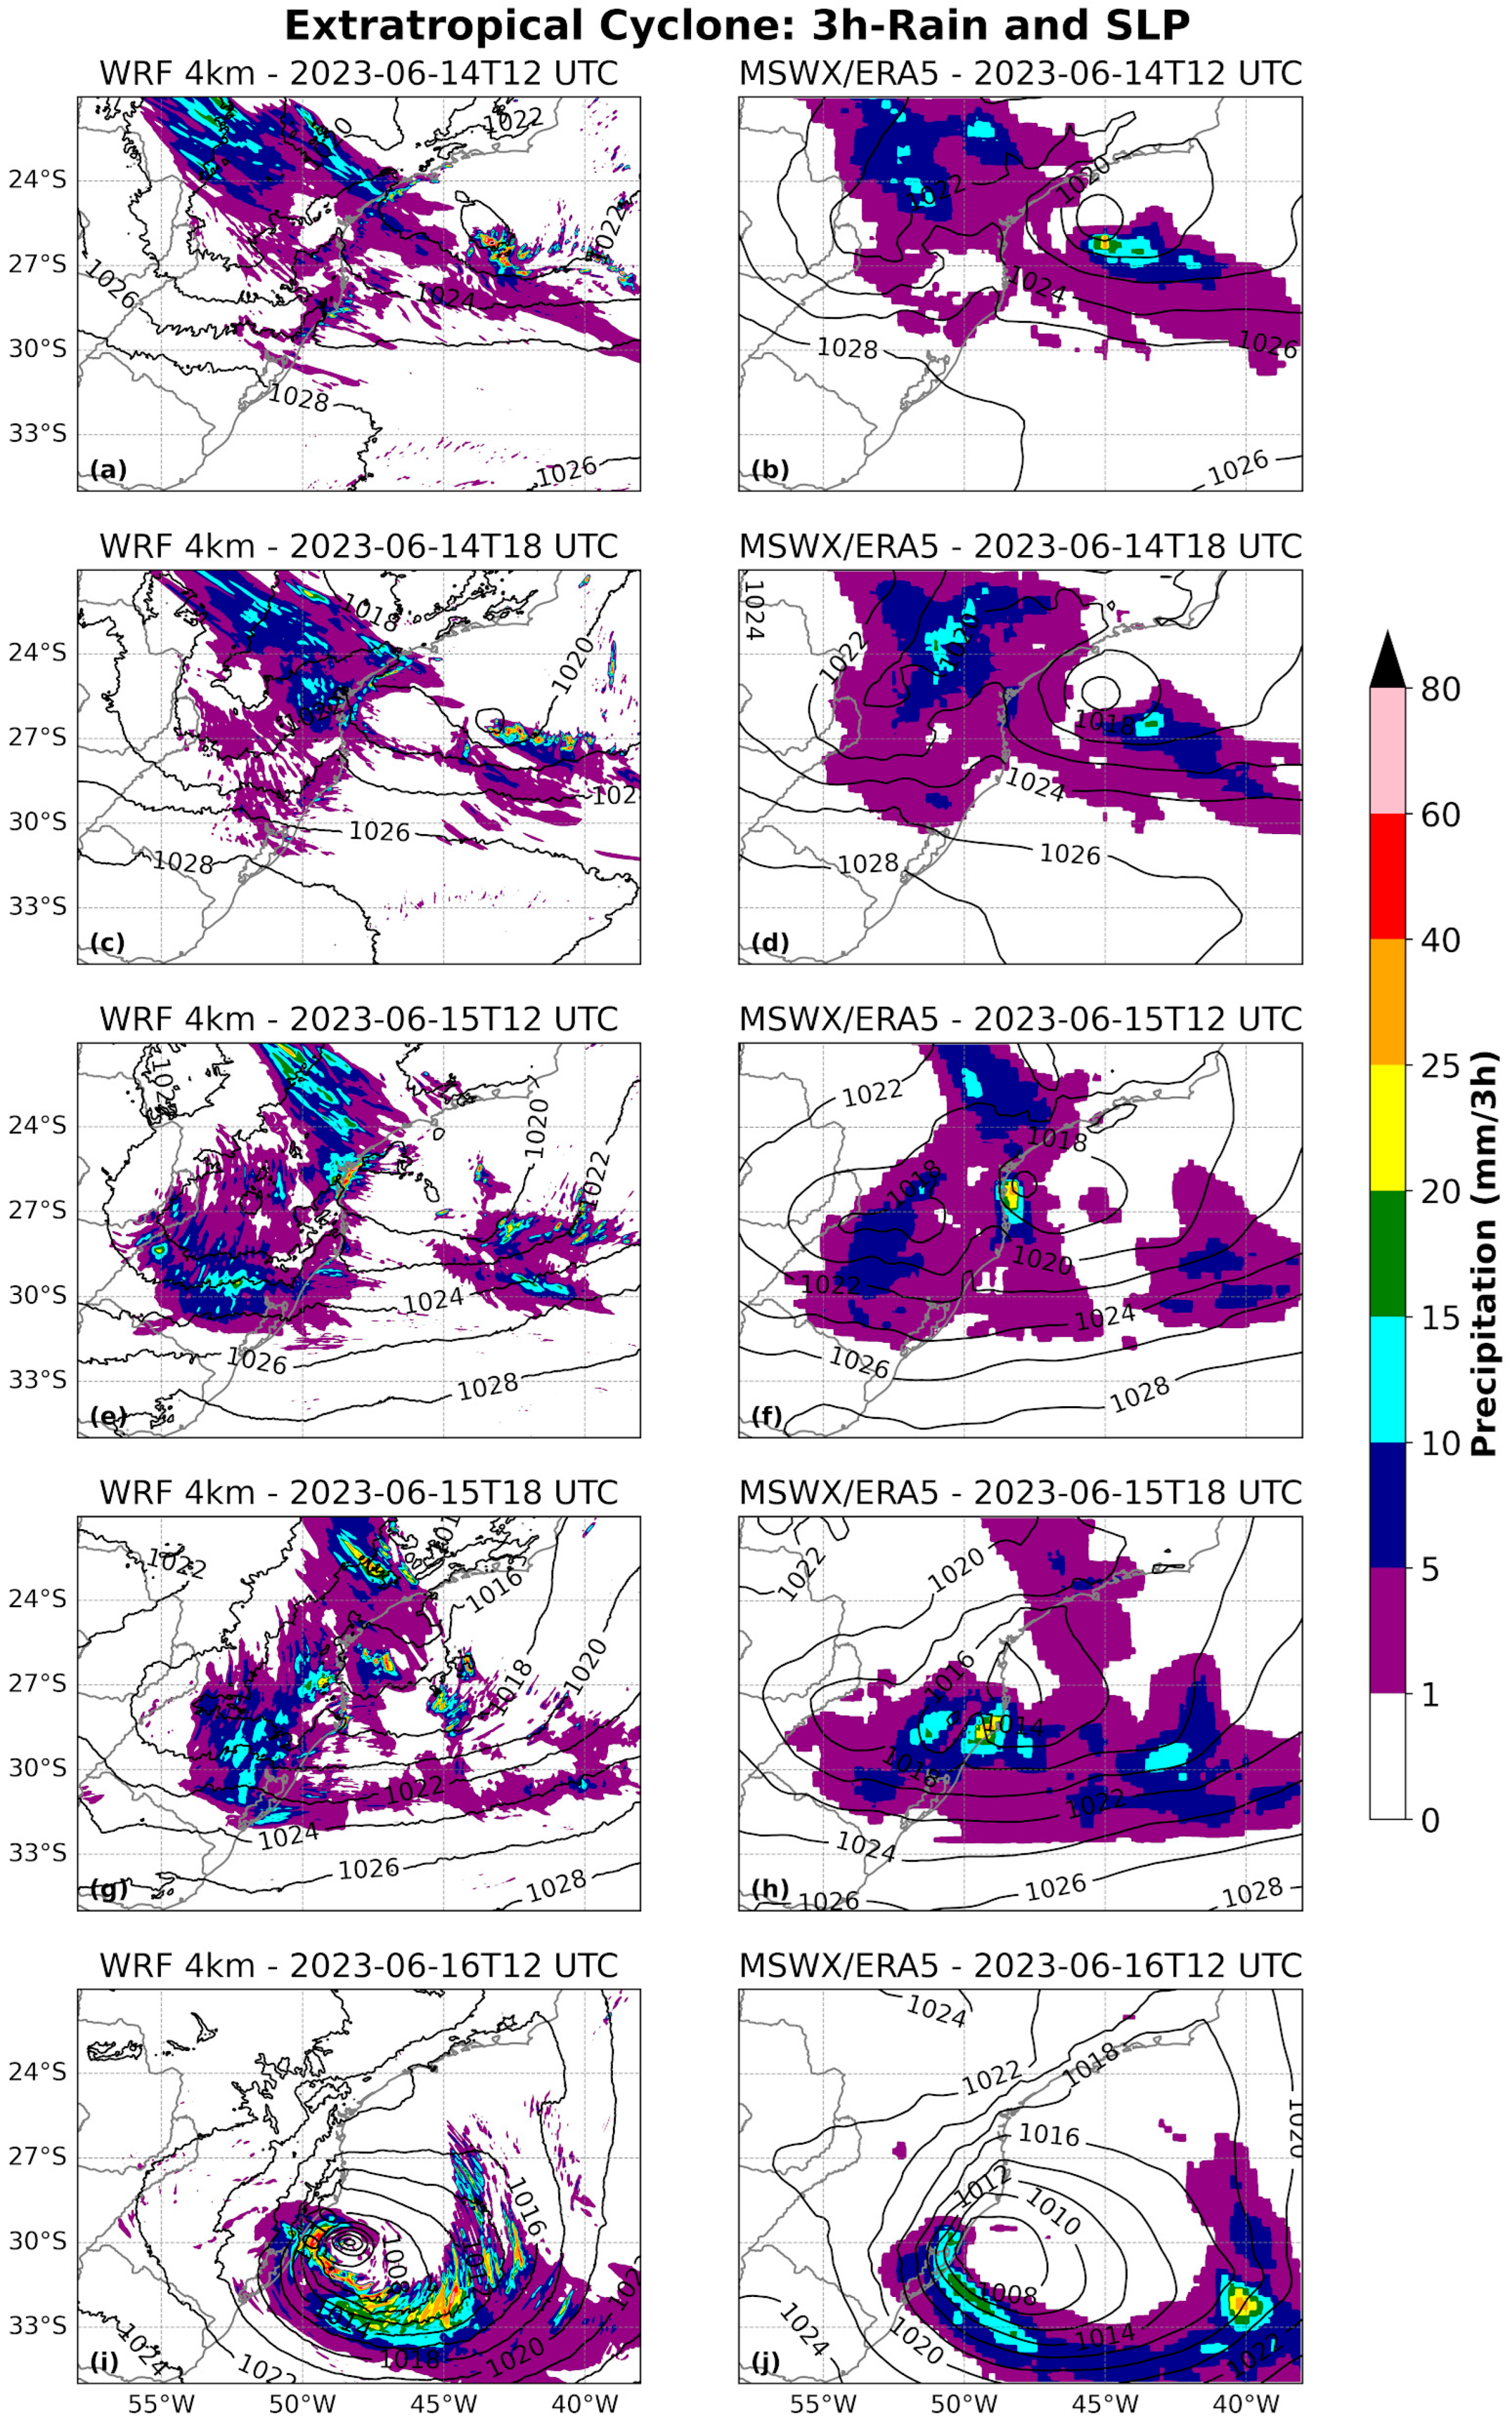
We also evaluate the performance of WRF-CP in reproducing the 3 h accumulated precipitation compared to MSWX and MSLP compared to ERA5 (Figure 4). WRF-CP is able to simulate the spatial distribution of continental and oceanic precipitation during the cyclone lifecycle. Over the continent, rainfall over SP and Paraná states is associated with the cold front linked to the cyclone, while, in RS, it is related to the cyclone’s occlusion stage (Figure 4a–j), as also described in [7]. Over the ocean, precipitation predominantly occurs southeast or south of the cyclone center, and WRF-CP generally captures this pattern well, albeit with some differences in intensity. From 1800 UTC on June 15 onward, rainfall becomes more organized within the occluded and warm front sectors of the cyclone (Figure 4g–j). The more intense rainfall simulated over the ocean and extending into eastern RS is likely due to the model’s ability to resolve finer-scale precipitation structures, which are smoothed in MSWX due to its coarser resolution (0.1 degrees), as also noted along the cyclone track in Figure 3.
Regarding the MSLP field, some differences are observed between WRF-CP and ERA5. For example, at 1800 UTC on June 14, WRF-CP depicts the closed MSLP contours slightly displaced southeastward compared to ERA5 (Figure 4c,d). Additionally, from June 16 onward, WRF-CP simulates a more intense cyclone with a deeper central pressure than ERA5, as previously noted in Figure 2.
Despite the reported differences, WRF-CP shows great skill in reproducing the synoptic-scale precipitation and pressure features associated with the cyclone. In particular, we highlight 1200 UTC on June 16 (Figure 4g–j), when the cyclone, in its occluded phase, explains the intense rainfall and 10 m wind speeds (see Section 3.3) that contributed to damage in RS.

3.2. Mesoscale Features

Mesoscale features play a crucial role in modulating more intense precipitation and winds in specific sectors of cyclones. Advancements in high-resolution numerical modeling and remote sensing of the atmosphere (satellite and radar) have improved the detection and understanding of the mesoscale features [50]. In addition, remote-sensing data can be used to validate the high-resolution simulations. Therefore, this section is dedicated to presenting a comparison between WRF-CP and radar data and addressing some mesoscale structures embedded in the simulated cyclone.
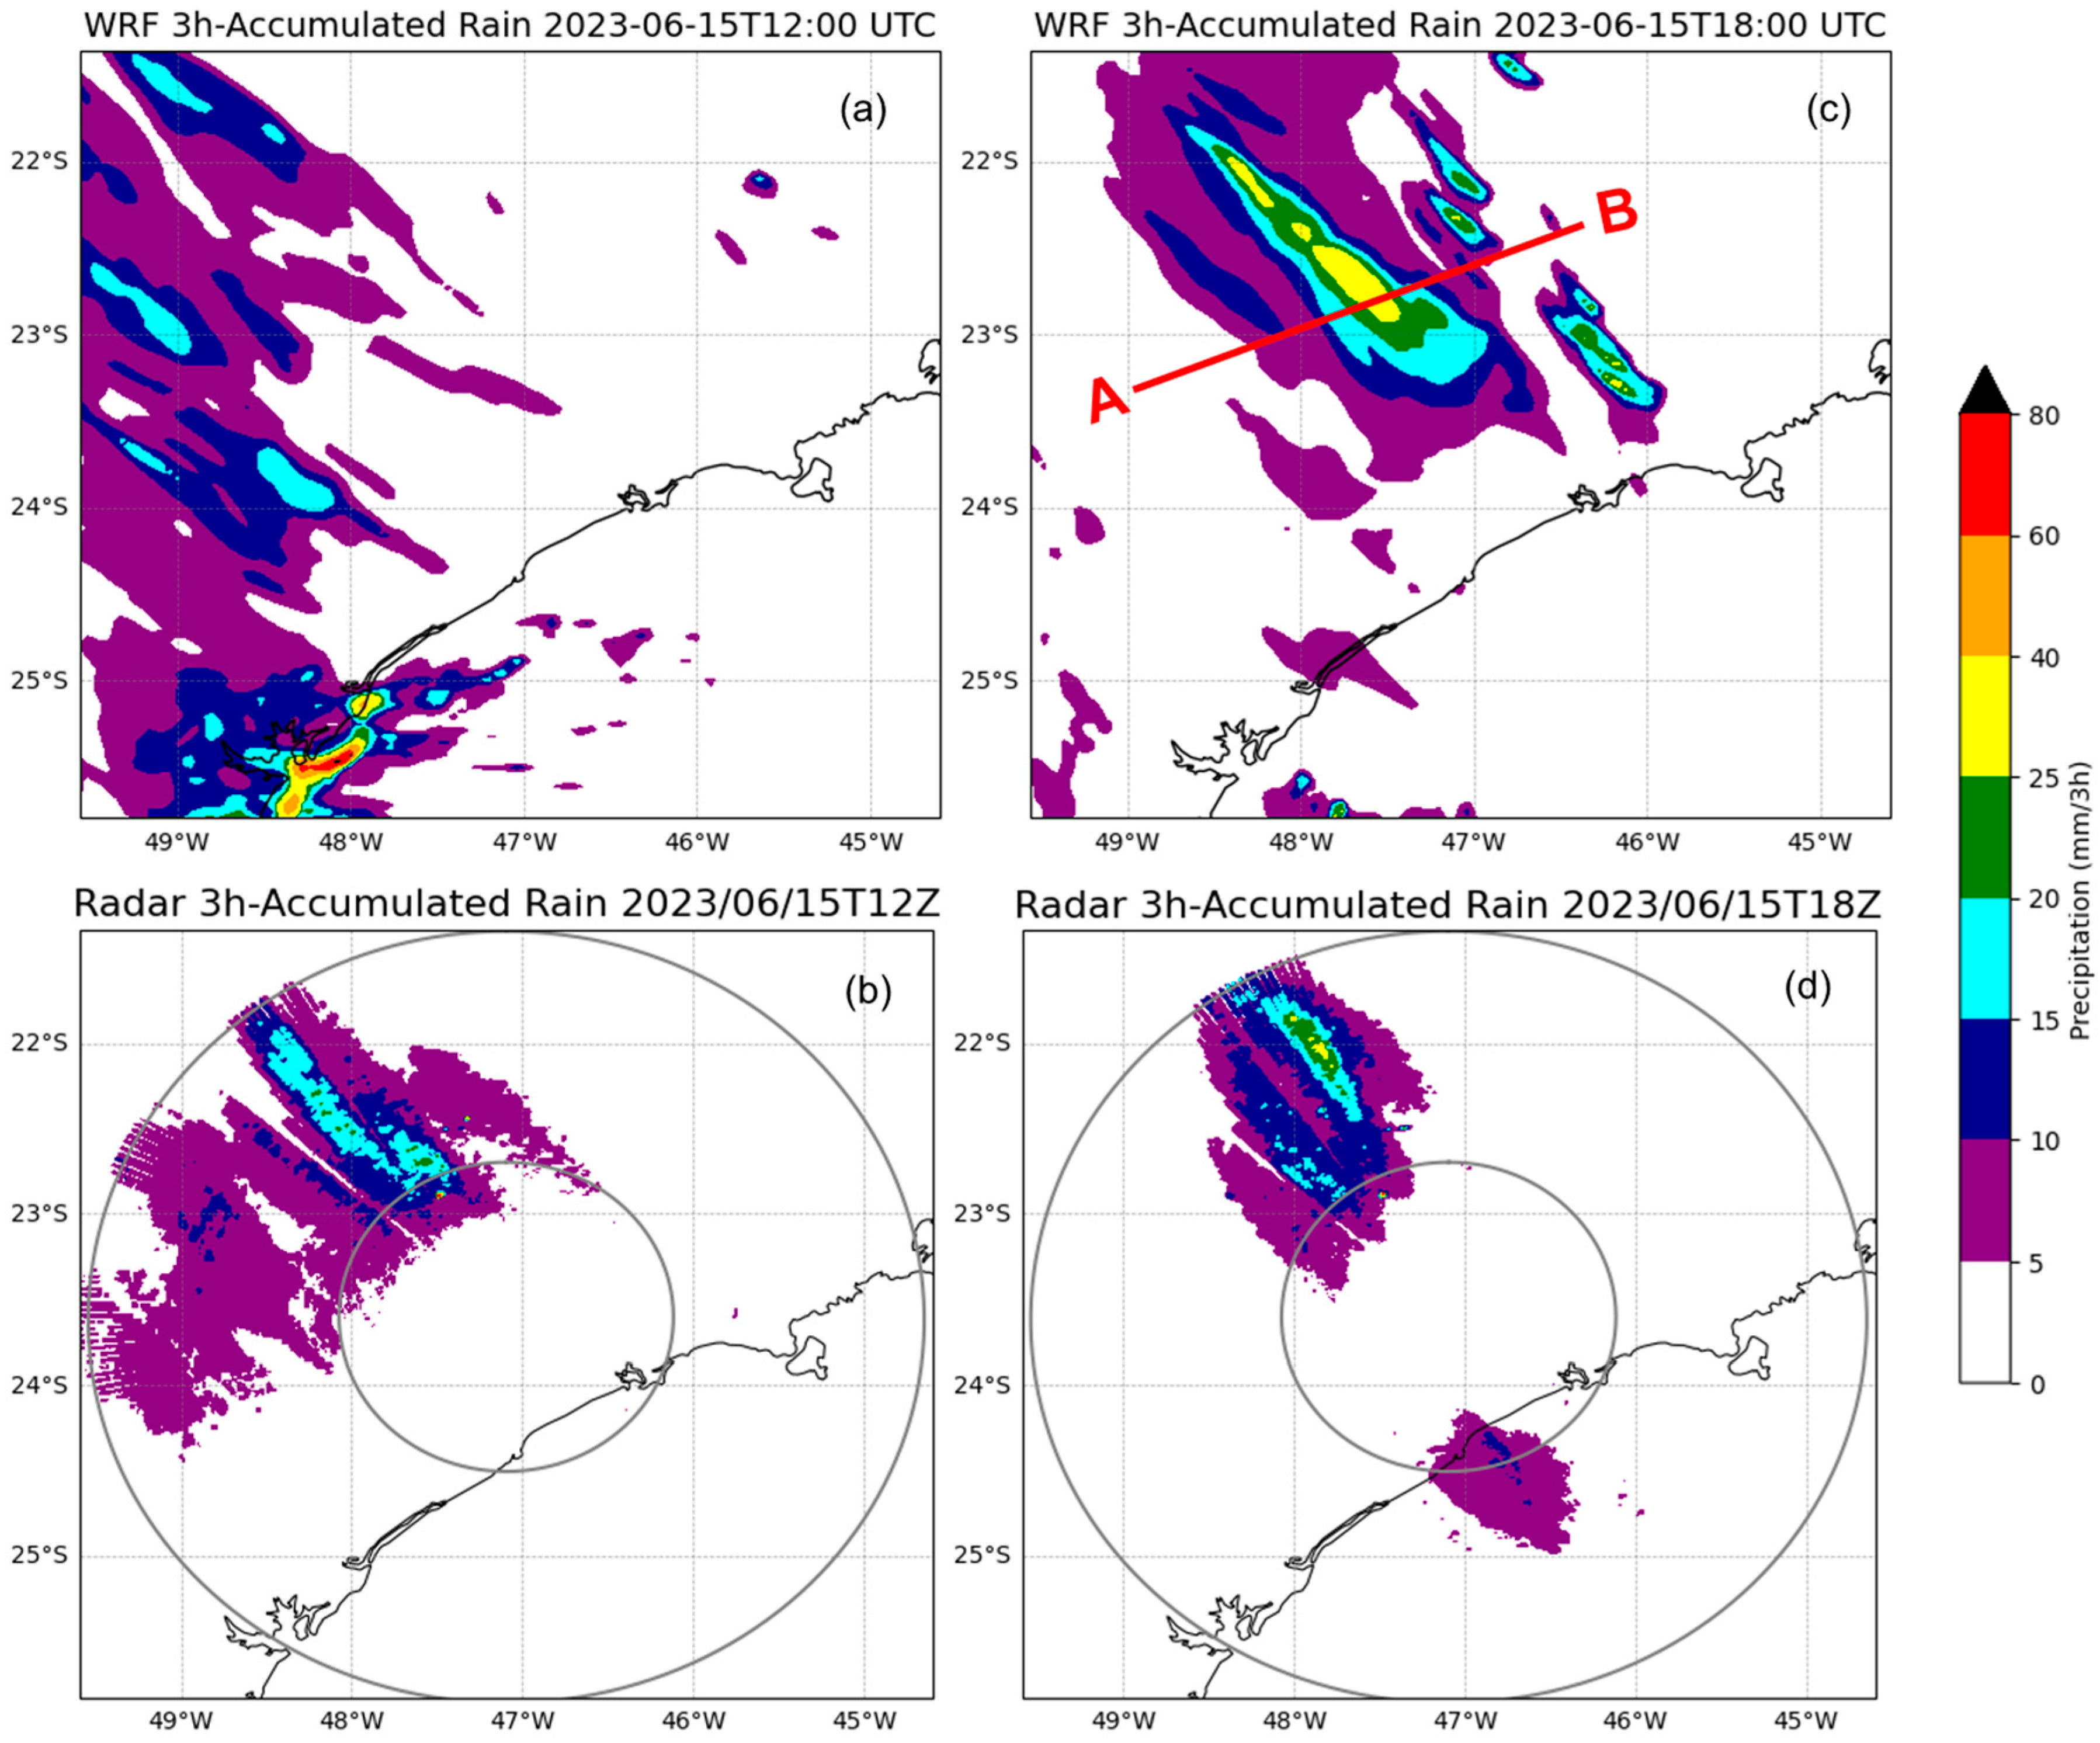
Due to limited radar coverage in Brazil, for this case study, observations are available only over the southeastern part of the country. Therefore, we focused on the precipitation associated with the cold front that was over the continent on June 15. Two time steps on June 15 were selected: 1200 and 1800 UTC. At 1200 UTC, the WRF-CP simulated a broader area of precipitation located to the west compared to the radar, and it also produced a core of heavy precipitation along the coast, south of 25° S and near 48° W, which was not detected by the radar (Figure 4a,b). However, at 1800 UTC, the model performed better, as it reproduced the precipitation band oriented from northwest to southeast, although with a larger extent. Additionally, the model simulated rainfall near the coast, but this was displaced approximately 0.5° southward relative to the radar observations (Figure 5c,d).
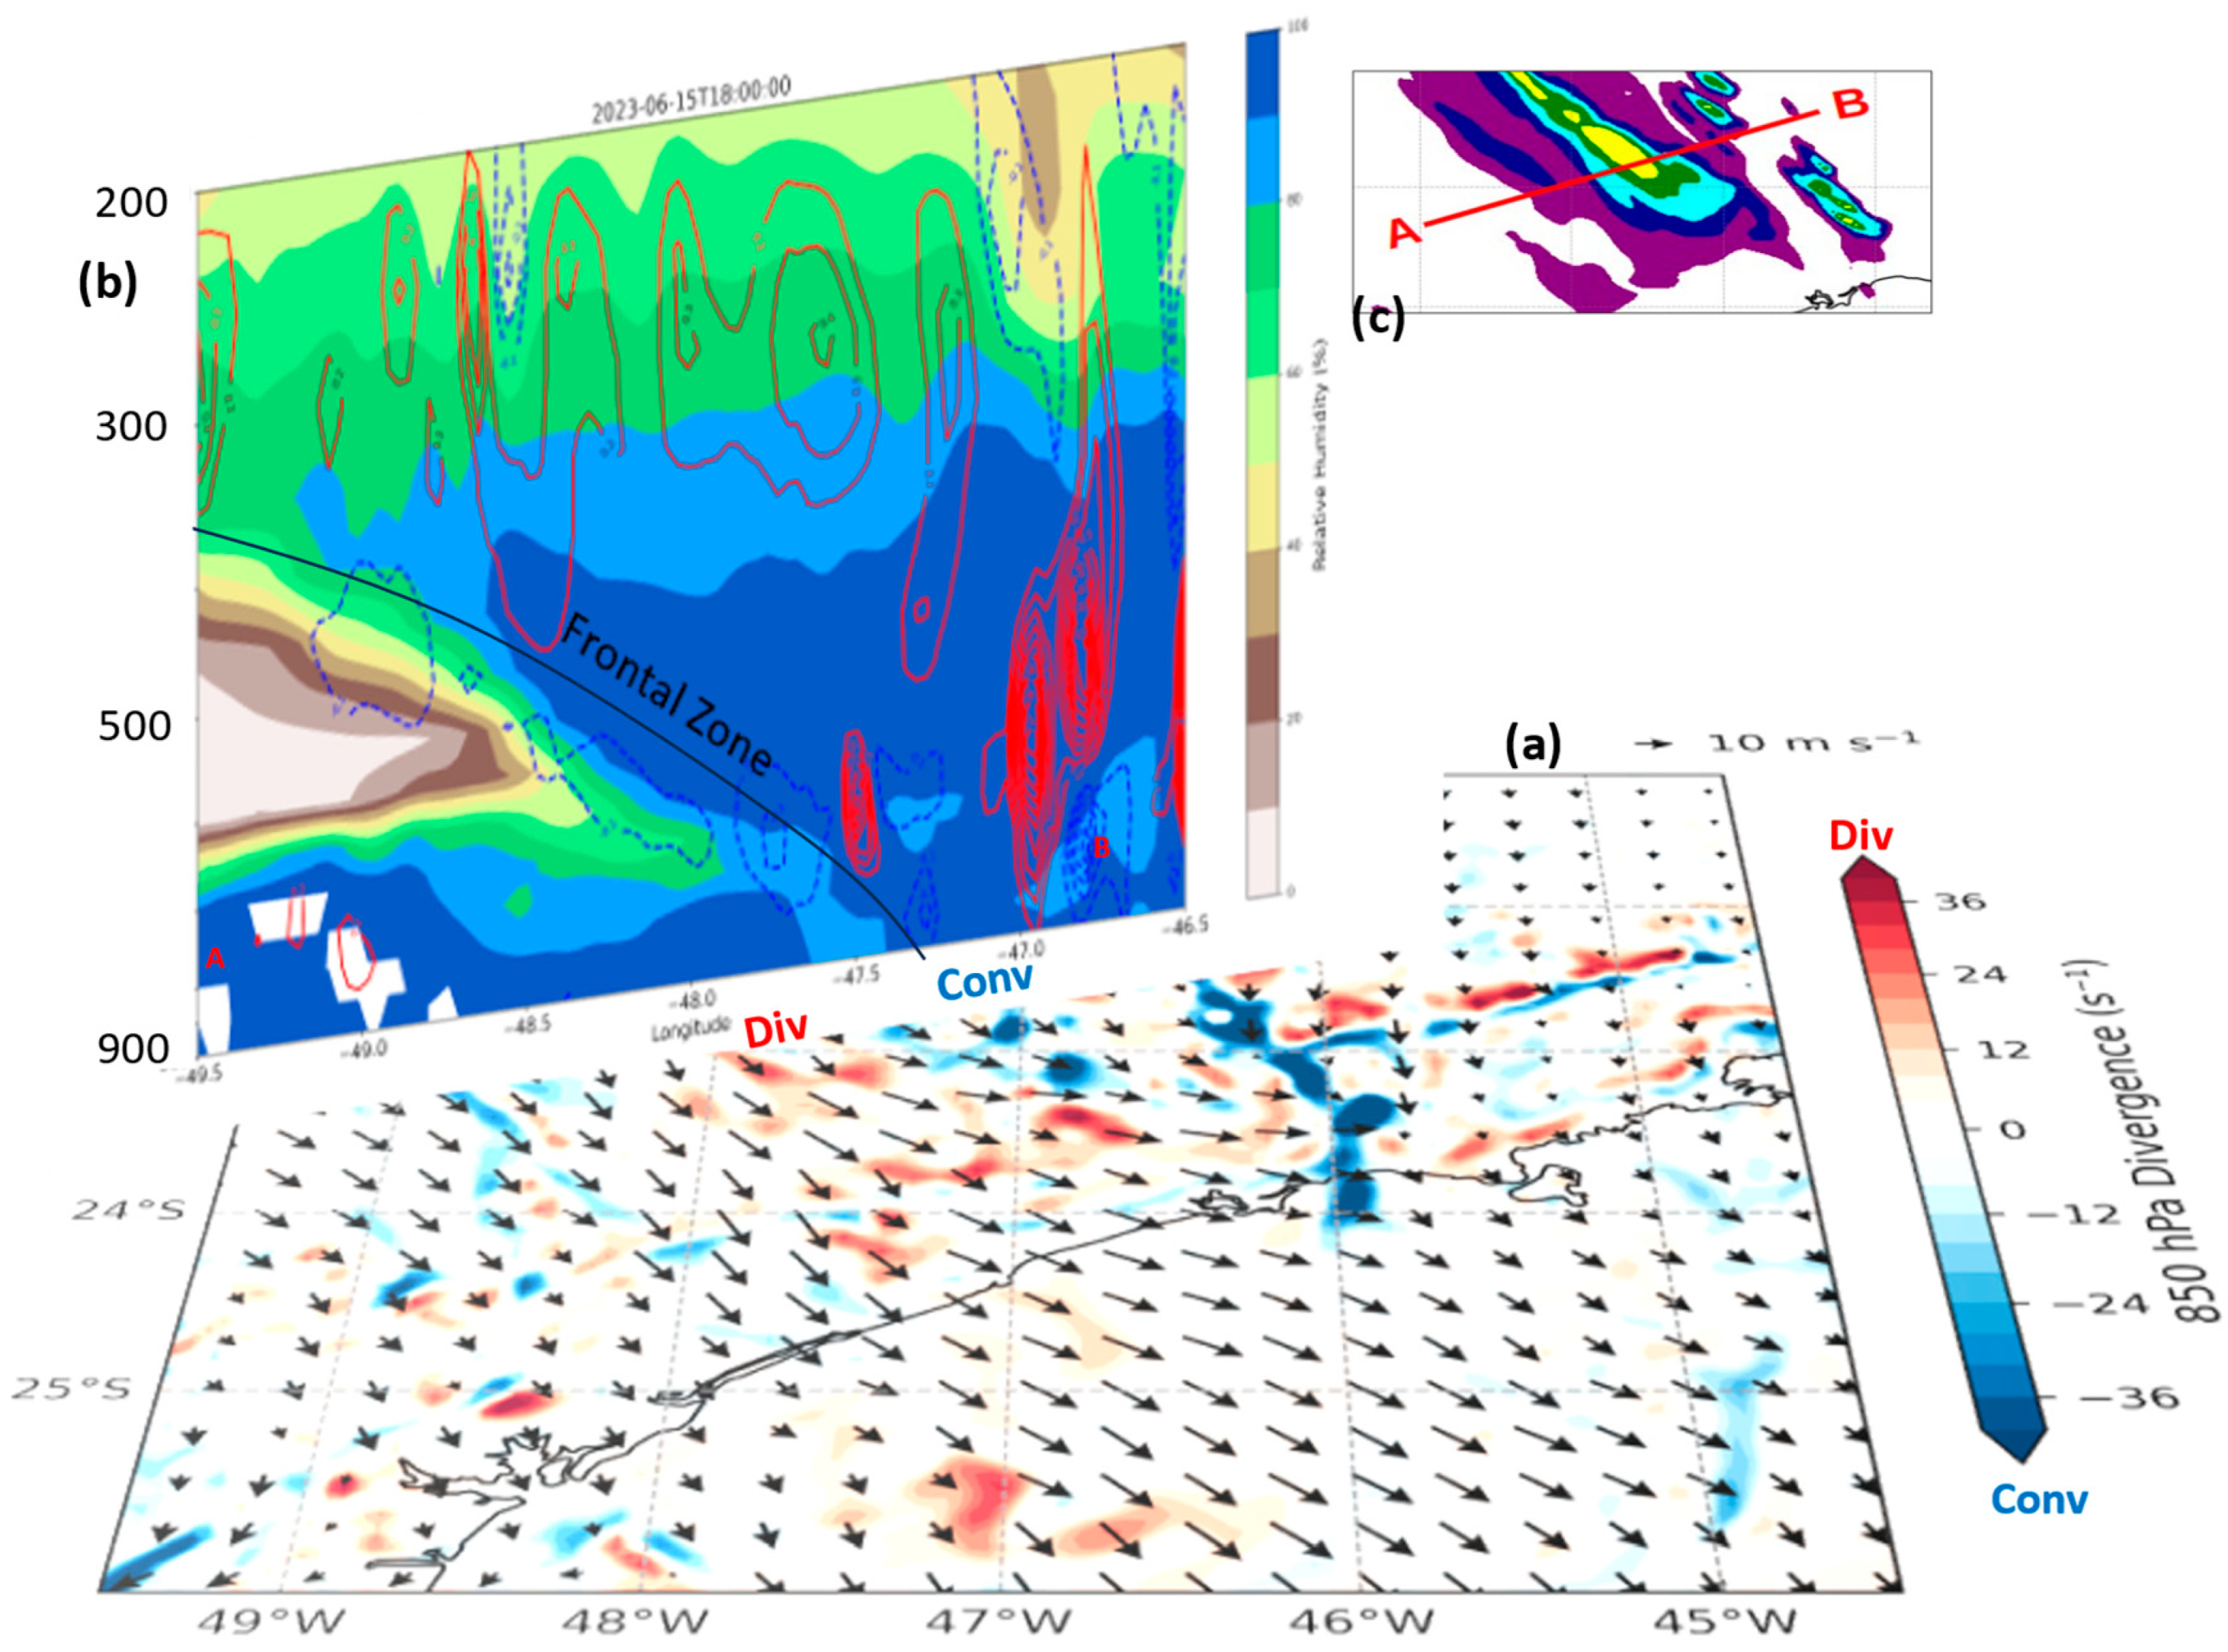
The precipitation band shown in Figure 5b is associated with a cold front and is discussed here. At 1800 UTC on June 15, the advance of cold air over the SP state characterizes a well-defined frontal zone (Figure 6). At the 850 hPa level (Figure 6a), there is a clear pattern of divergence over regions experiencing subsidence west of the cold front and convergence in areas associated with upward motions (Figure 6b). The strongest upward motions are concentrated ahead of the northwest–southeast-oriented cold front, highlighting the classic sloped ascent of warm, moist air over the denser cold air mass. This described pattern aligns with conceptual models of precipitation bands [51].
The cold side of the front is characterized by dry air between 700 and 400 hPa (Figure 6b), indicative of mid-tropospheric subsidence commonly observed in post-frontal regions [52,53]. Therefore, the precipitation is, in great part, associated with the near-surface frontal slope (Figure 6b), which is also the region with a huge amount of rainfall (yellow area in Figure 6c).
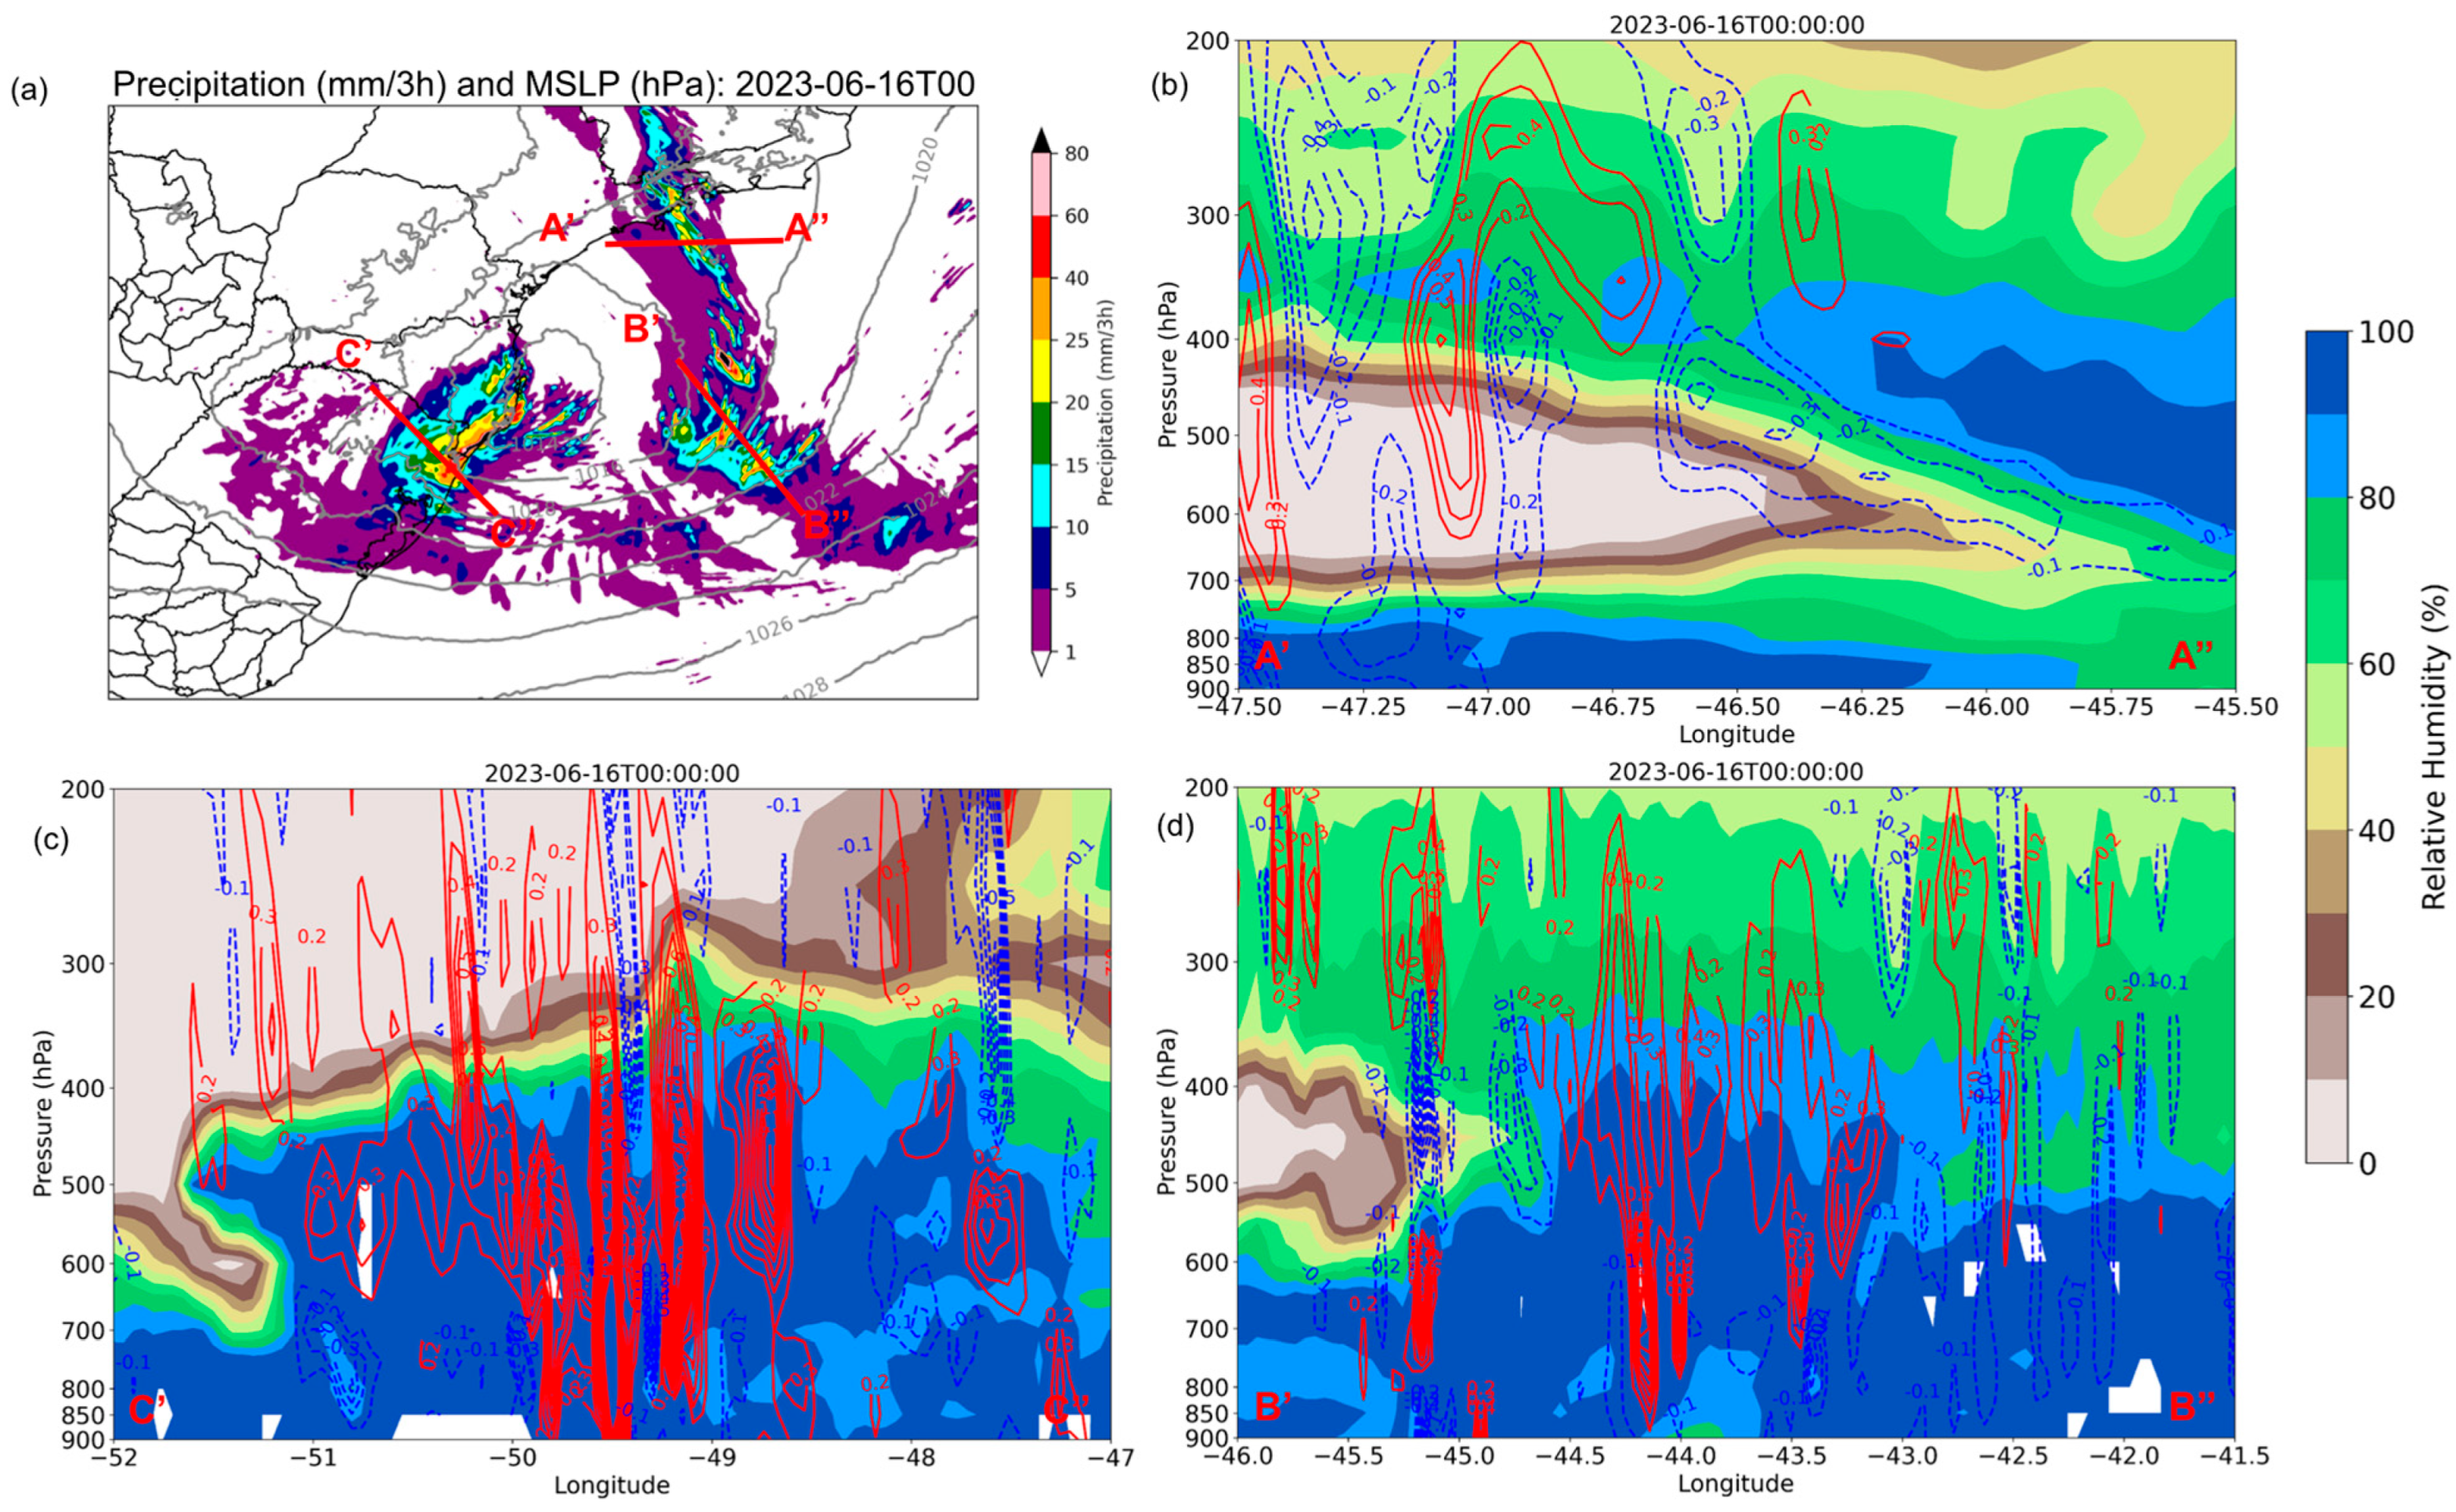
The literature on mesoscale structures embedded in extratropical cyclones is limited, largely due to the need for high-resolution observations and/or simulations, which are often unavailable. In order to contribute to this topic, an analysis of the frontal zones associated with the extratropical cyclone at 0000 UTC on June 16 (Figure 7 and Figure 8) is presented.
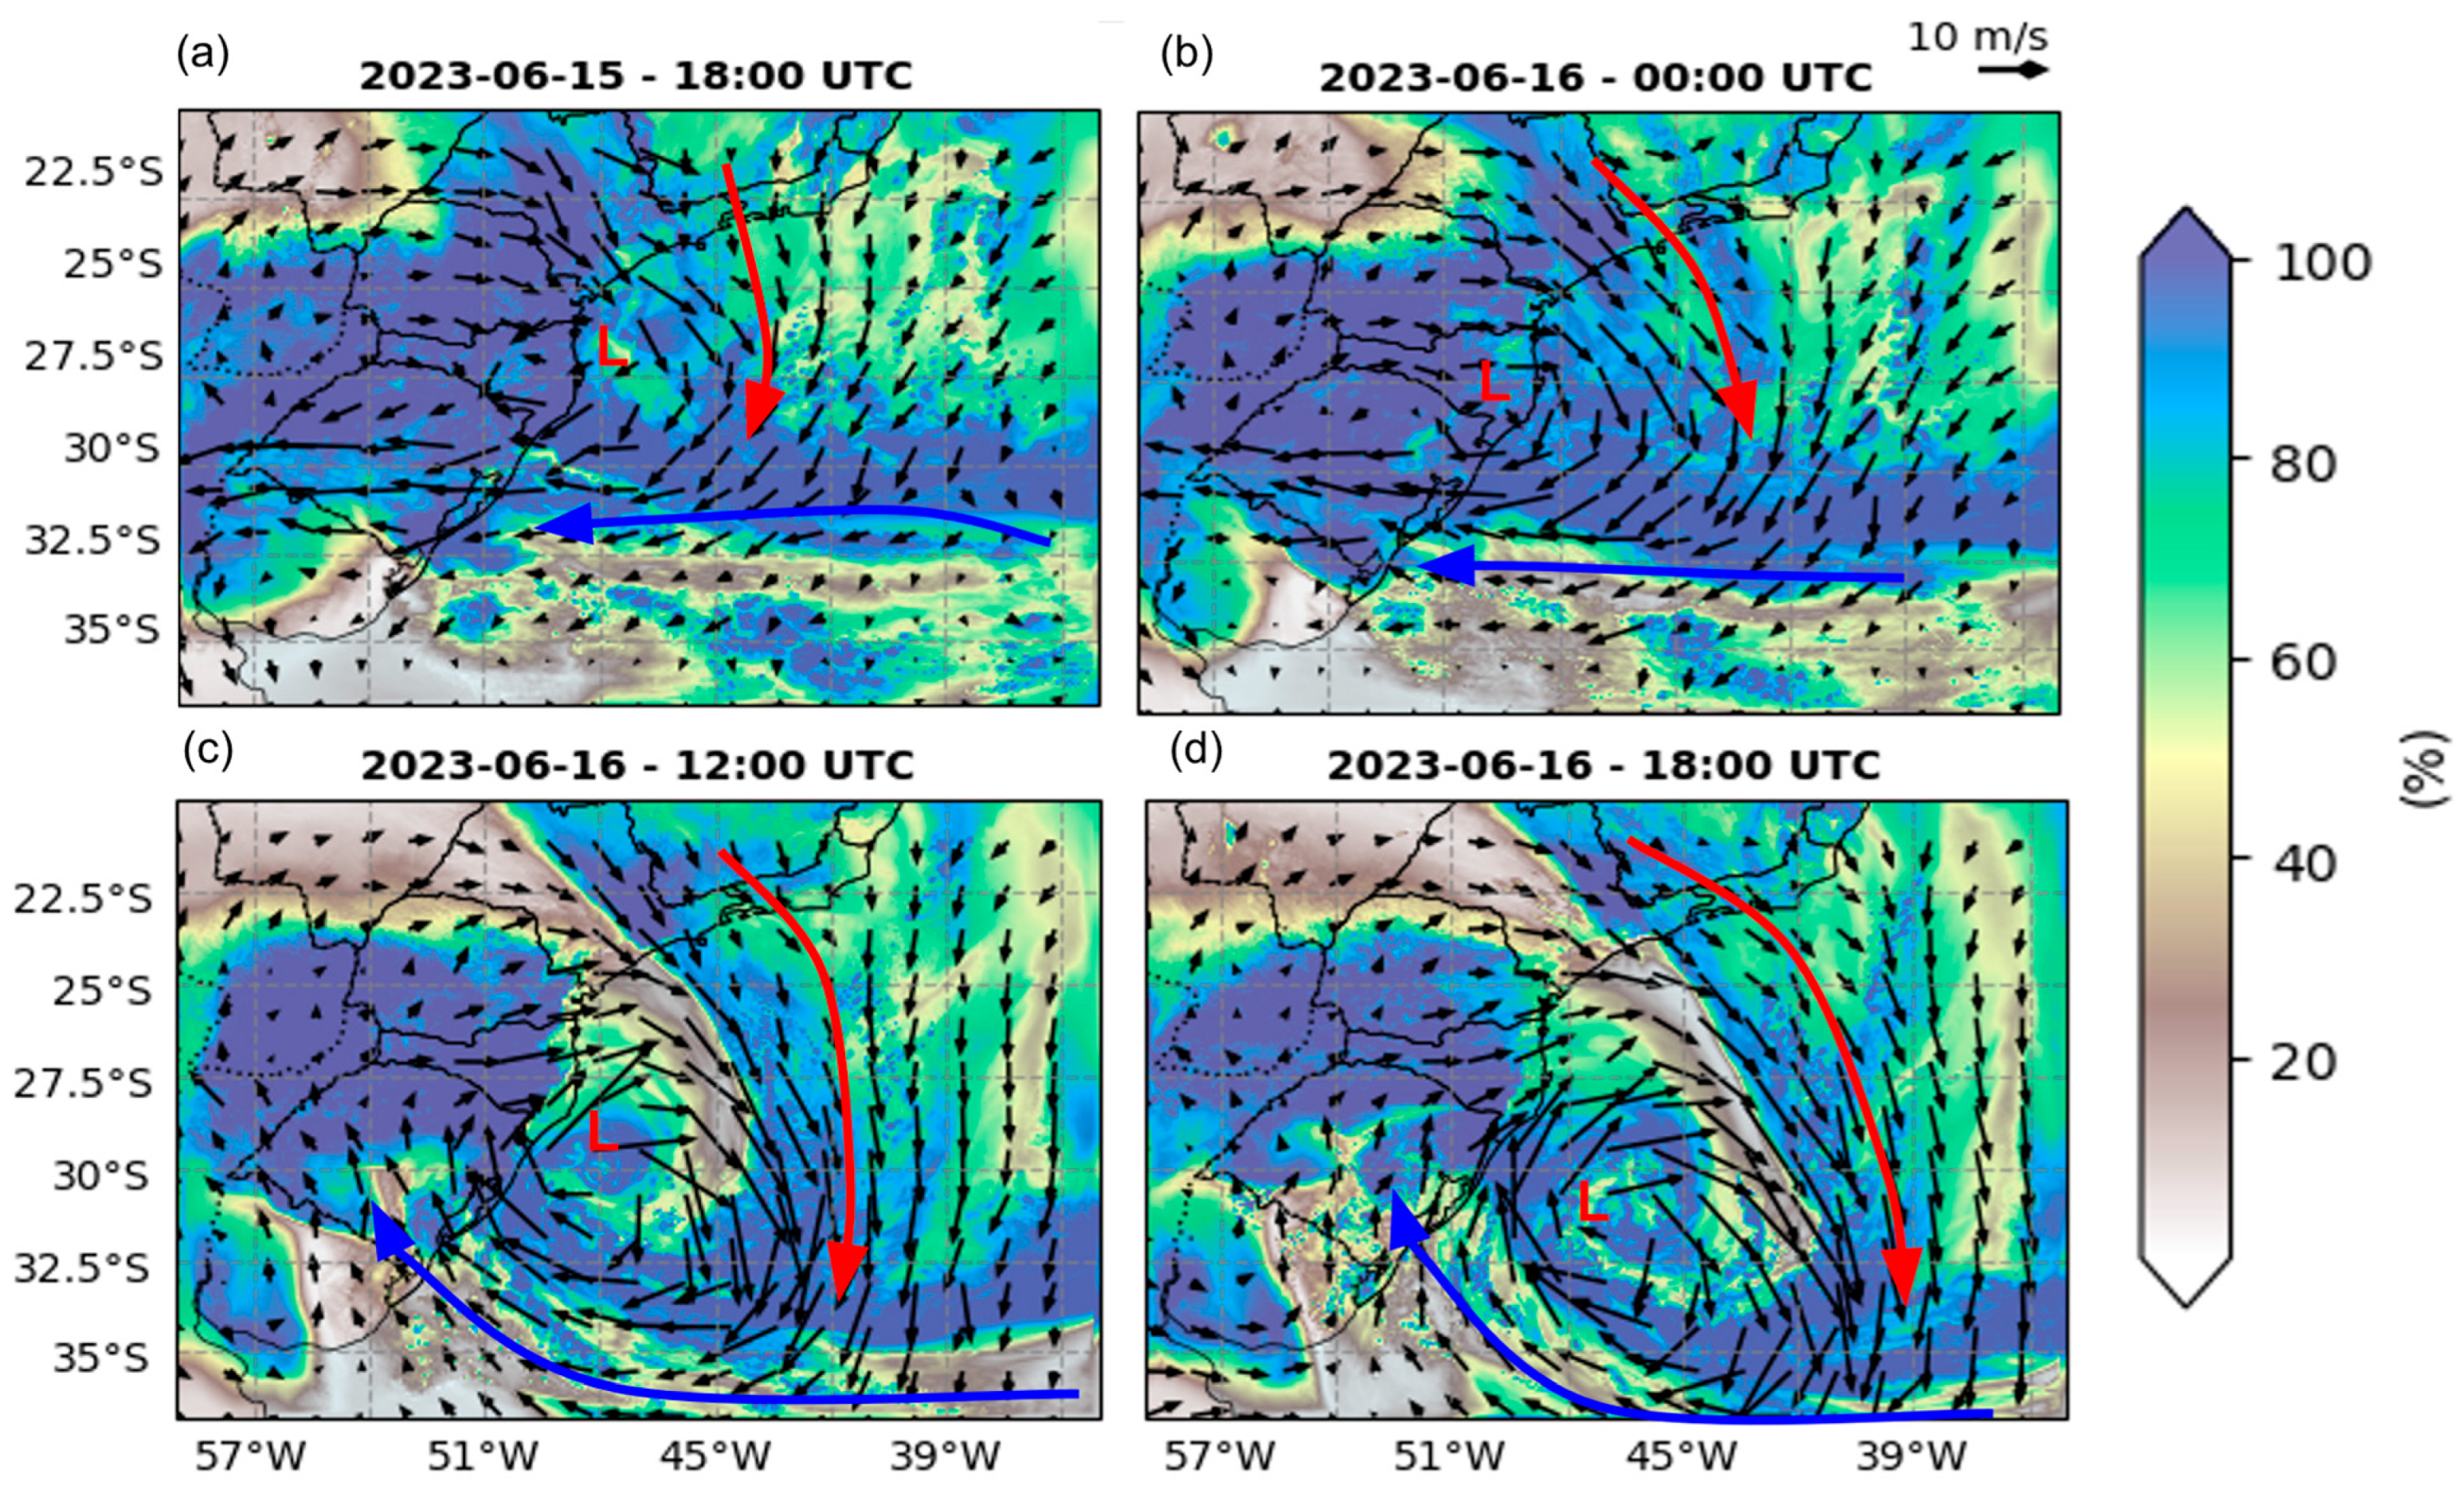
We begin with a broader perspective on the airflow, i.e., the conveyor belts (Figure 7), since they play a key role in modulating mesoscale precipitation and cloud processes within extratropical cyclones due to their thermodynamic properties [52,54,55,56,57]. The two primary conveyor belts are the warm conveyor belt (WCB), which flows parallel to the cold front and ascends upon encountering the warm front, and the cold conveyor belt (CCB), which moves parallel to the warm front and extends toward the occluded front [54,58]. Note in Figure 7 that the CWB is important for transporting warm and moist air to the warm front, while the CCB transports dry air to the occluded region of the cyclone. In this way, one can expect cloud organization and precipitation in those areas. Indeed, Figure 8a shows precipitation in those zones.
The combination of the thermodynamic (temperature and humidity) and dynamic processes (convergence at low levels) helps to develop ascent movement in the frontal zones, leading to precipitation organization (Figure 8). To clarify it, three vertical cross-sections are depicted in Figure 8, each one representing a different frontal type within the cyclone: cold, warm, and occluded. The vertical cross-section of the cold front (Figure 8b) is characterized by a dry region on the left side, corresponding to the cold air sector, where subsidence predominates, although some localized upward motions are still present. In the warm front sector (Figure 8c), moist air dominates up to approximately 400 hPa, and in this sector, upward motion predominates. This described pattern resembles that shown in Figure 16 of [59]. The most interesting cross-section is that of the occluded front (Figure 8c), which exhibits a well-defined vertical gradient of humidity with a west-to-east positive slope. The occluded front also features the most intense upward motions, likely influenced by the cold and dry advection of the CCB (Figure 7), which results in a huge amount of precipitation. Other studies, such as [60], also report a cloudy characteristic of the occlusion sector of cyclones.
These strong vertical motions in the frontal zones are crucial in organizing precipitation. In the case of the studied cyclone, its unusual southwestward displacement—rather than the more typical southeastward movement—positioned the occlusion region over the northeastern RS state, which explains the extreme precipitation and intense winds observed on June 15 and 16 (see next section). It is important to highlight that Southern and southeastern Brazil is a cyclogenetic region; however, cyclones in this area rarely cause significant damage, as they tend to intensify away from the coast. Such high-impact cases occur when cyclones develop characteristics that deviate from the climatological pattern, as observed in this study, where the occlusion—typically expected to occur over the open ocean—took place over the continent.

3.3. Local Weather Associated with the Cyclone

In this section, we discuss the weather conditions —precipitation and 10 m wind—reported by several meteorological stations and simulated by WRF-CP from June 13 to 16 (Figure 9, Figure 10 and Figure 11). June 16 was the most critical day in RS, as the occluded part of the cyclone brought heavy rainfall and strong winds to the northeastern region of the state, as also shown in Figure 3 and Figure 4i,j. Therefore, this analysis is conducted using hourly data, allowing for the examination of high-frequency temporal variability and the fine-scale structure of the cyclone’s occluded sector.
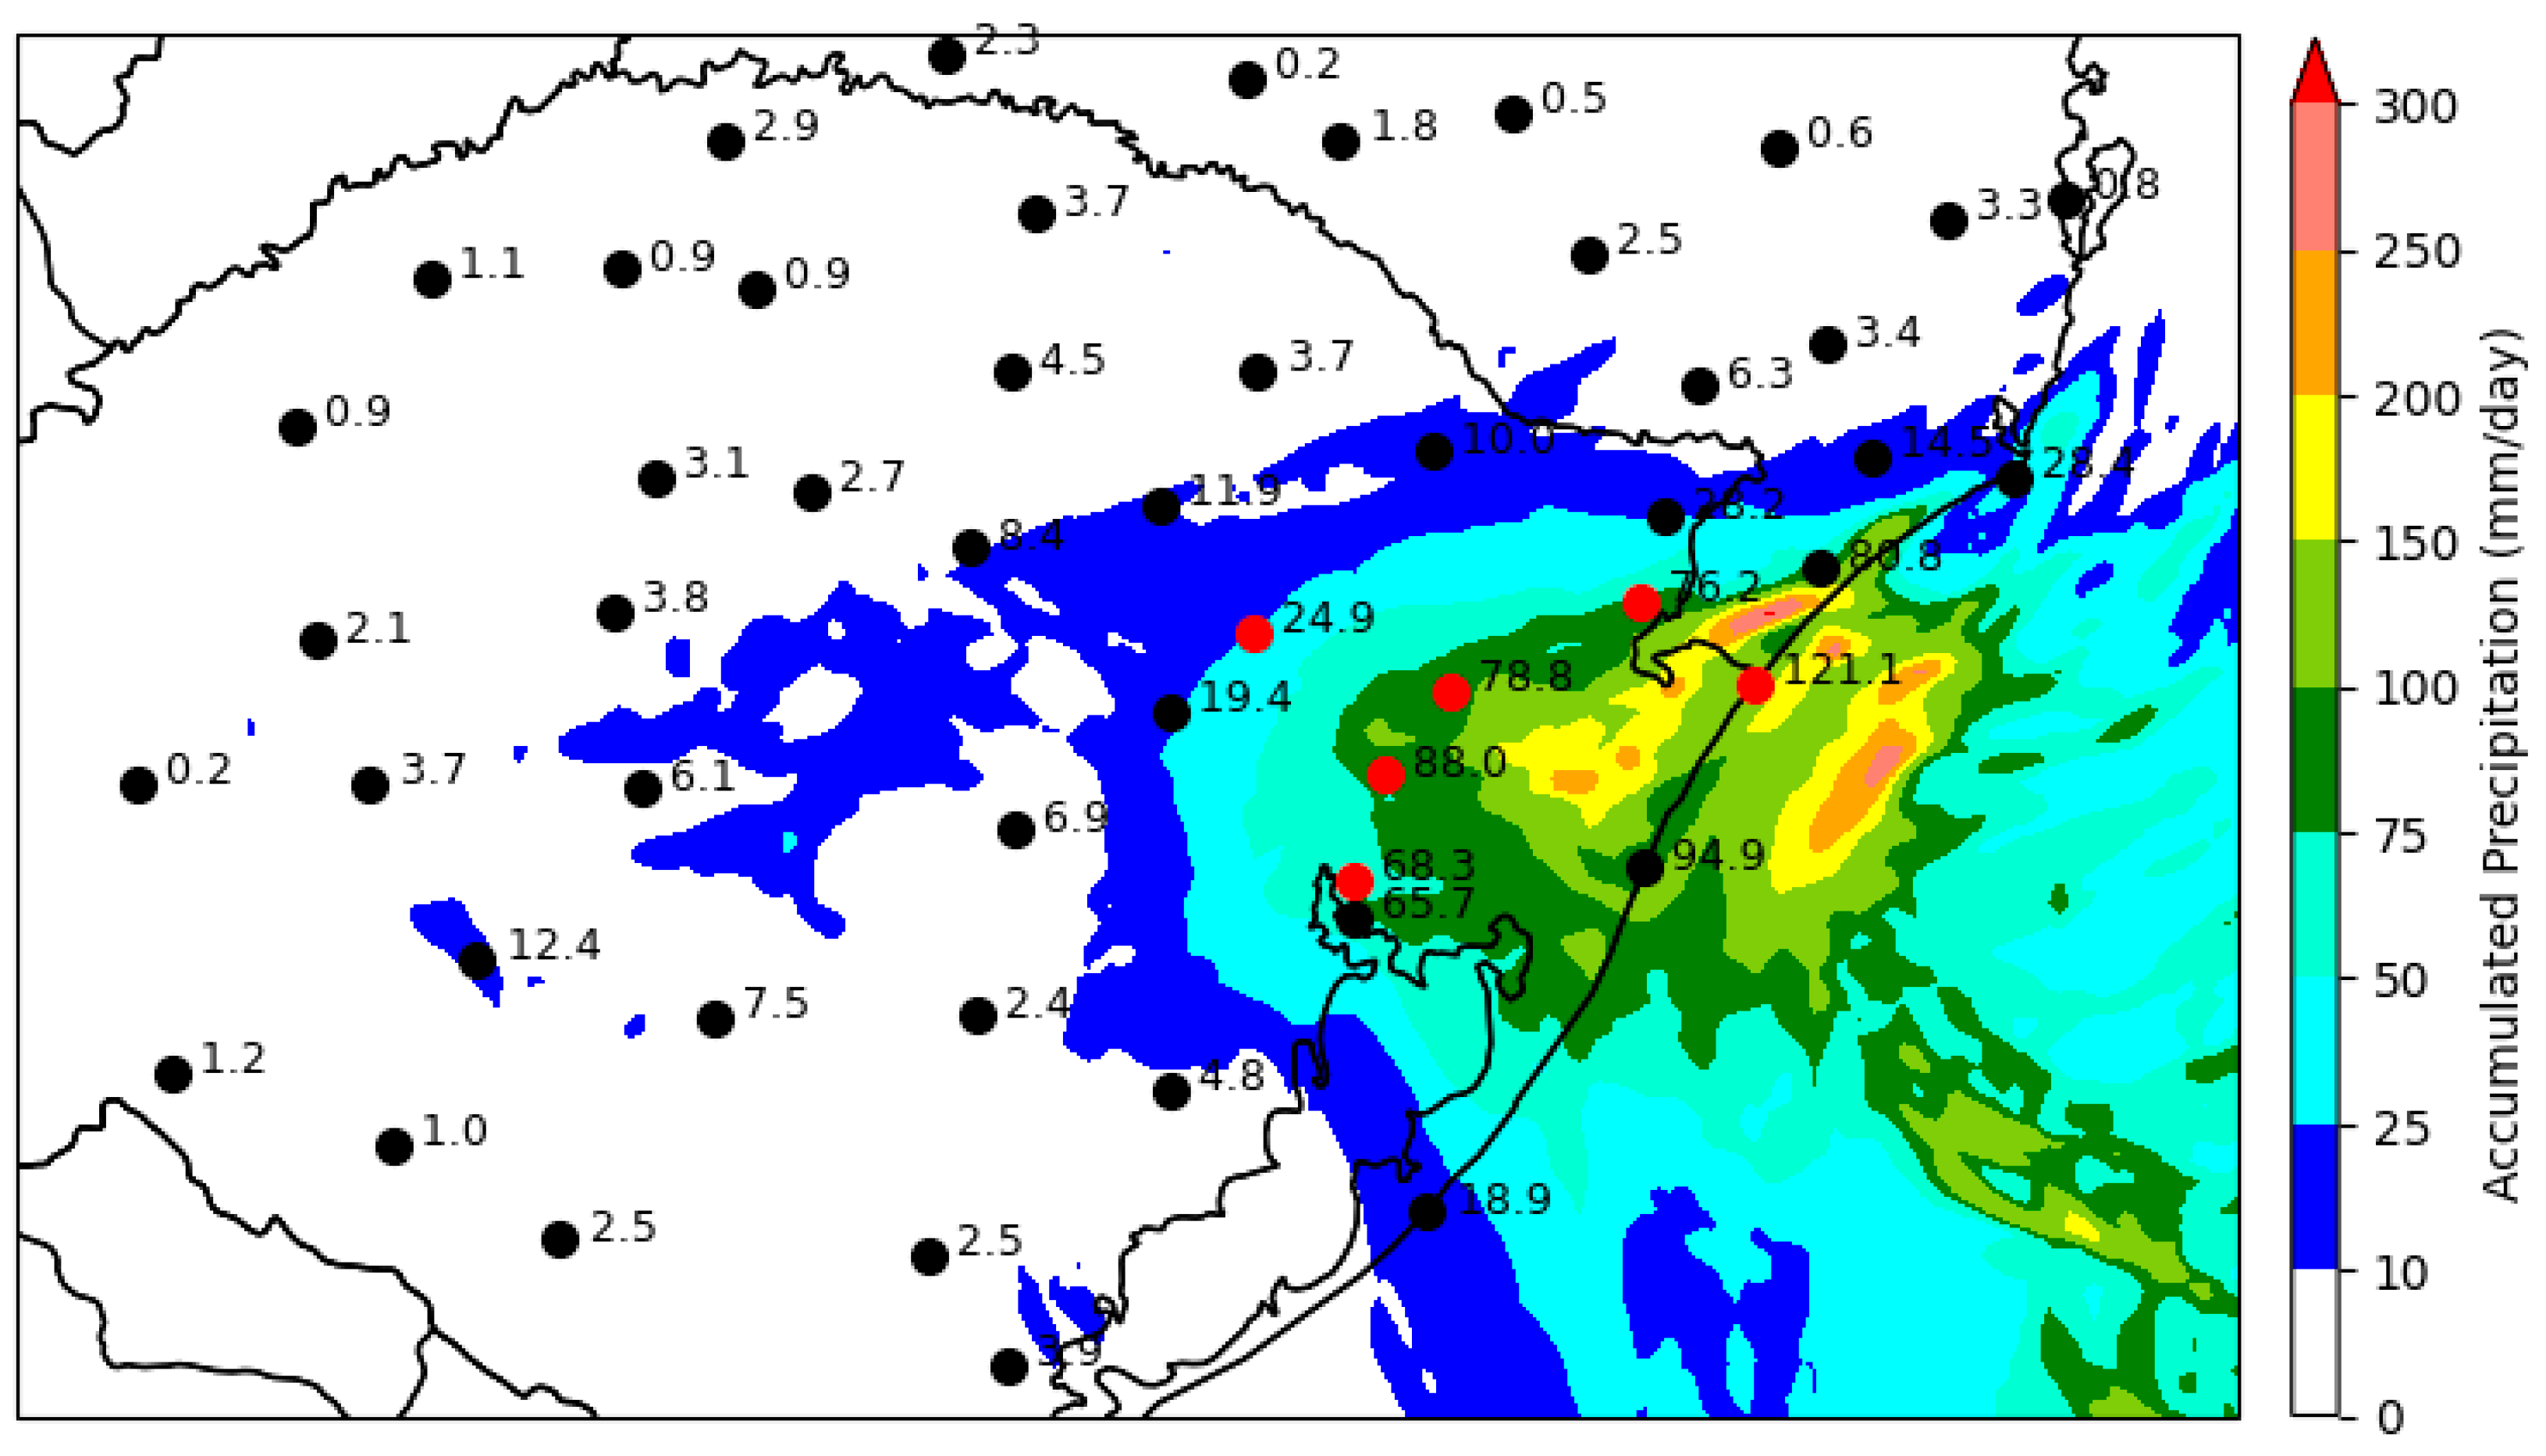
Figure 9 presents observations (point-based) at 43 locations across the RS and SC states, along with simulated precipitation (shaded). The model successfully captures the west-to-east precipitation gradient and correctly locates the region of maximum rainfall, although it tends to overestimate precipitation in some areas near the coast.
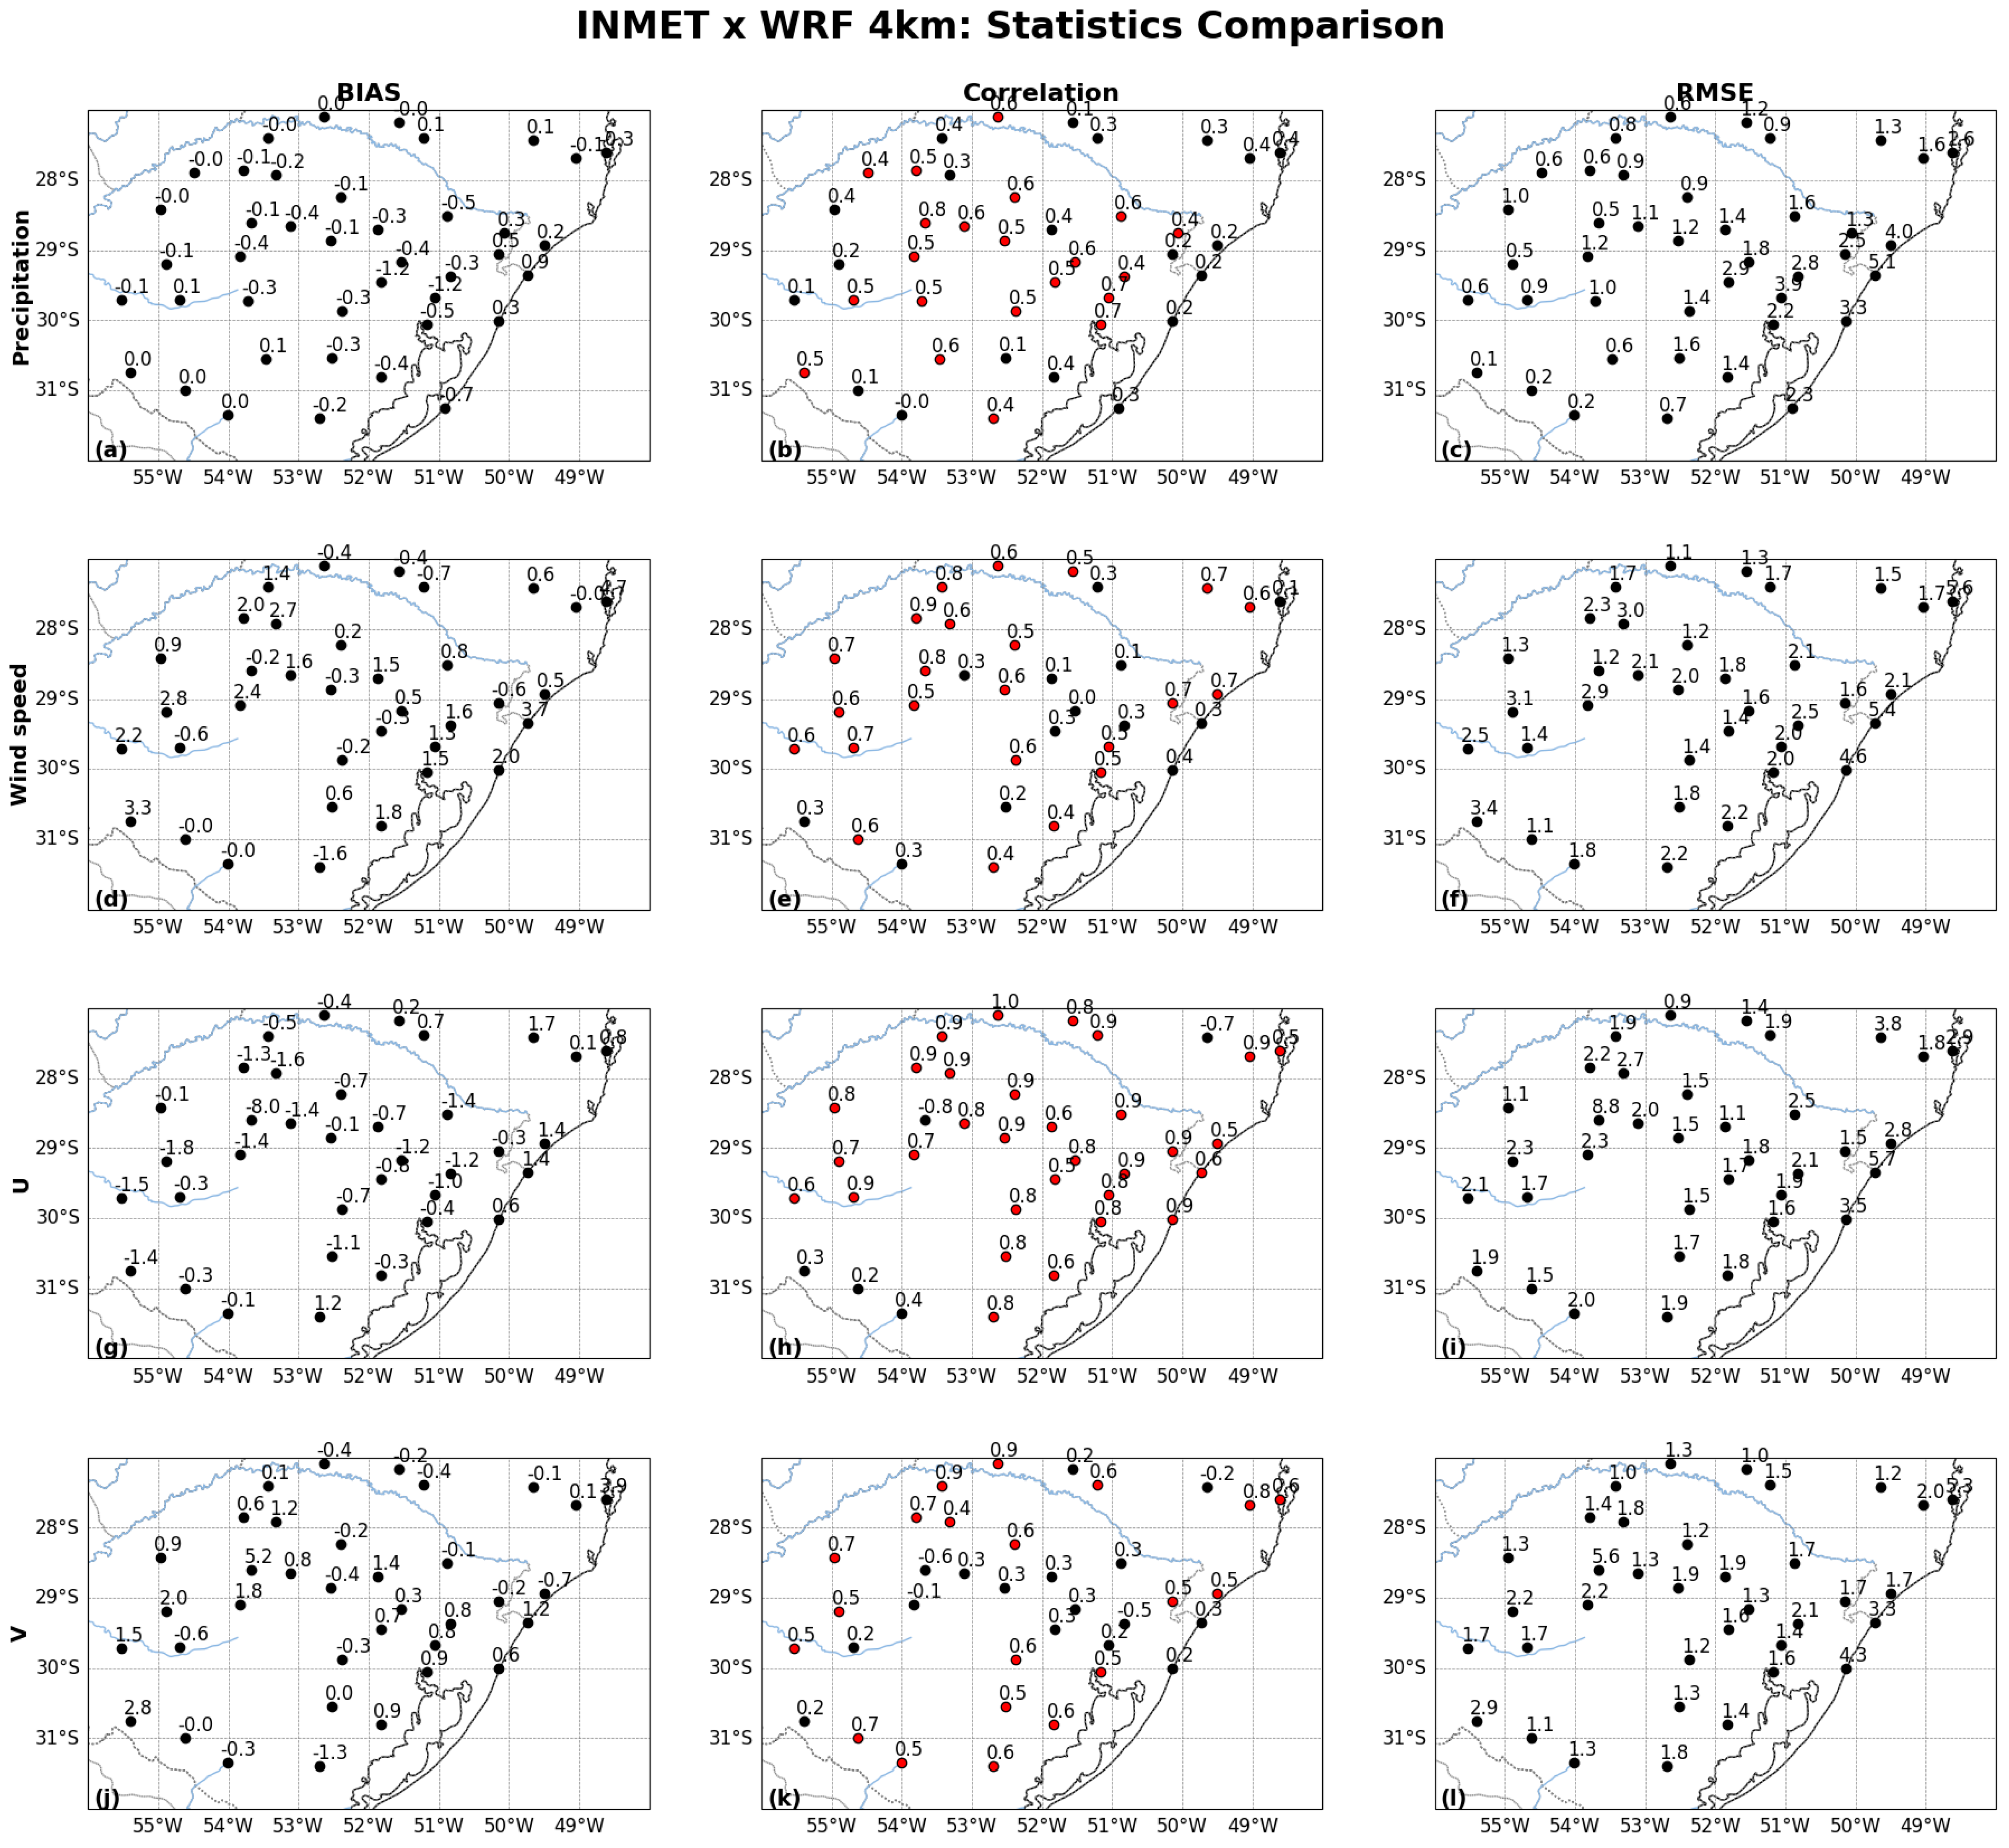
To provide a more detailed assessment of WRF-CP performance during the simulation period (June 13–16), we present time series for six locations (red points in Figure 9) within the area most affected by the cyclone’s occlusion on June 16 (Figure 10), along with three statistical metrics—bias, temporal correlation, and RMSE—for 43 sites with precipitation records and 38 sites with wind component data (Figure 11).
Figure 10 shows that, while the model has limited skill in capturing the intensity of the 10 m wind, generally overestimating it, it performs well in simulating the wind components, particularly the zonal component, indicating that wind direction is well represented by the simulation. Another strength of the model is its ability to capture the timing of precipitation in the hourly time series. WRF-CP accurately simulates the highest precipitation amounts between June 15 and 16, consistent with observations from the meteorological stations (Figure 10).
For hourly precipitation, the simulation captures the high-frequency variability of precipitation intensity at approximately half of the stations, as indicated by Pearson correlation coefficients exceeding 0.4 at about 51% of the sites (Figure 11b). However, the simulation’s performance varies across the region; for example, in Torres and Cambará do Sul, both located in the northeastern sector of RS, near the coast and close to the complex topography of Serra do Mar, the simulation produces a second peak of intense rainfall that was not observed (Figure 10f4). This implies a higher bias (0.9 and 0.5 mm h−1) and RMSE (5.1 and 2.5 mm h−1) and a weak temporal correlation (0.2) (Figure 11). Considering all stations shown in Figure 11, negative precipitation biases predominate in 23 stations, while 18 stations exhibit positive biases, mostly within the range of 0.2 to 1.0 mm h−1 (Figure 11a). RMSE values (Figure 11c) generally remain below 1.5 mm h−1 at most locations, suggesting that the simulation adequately reproduces hourly precipitation peaks (both maximum and minimum), with a few exceptions—particularly near coastal areas (as seen in Figure 9) and along frontal boundaries, where errors tend to be higher.
The simulation tends to overestimate 10 m wind intensity across most stations, as reflected by the predominance of positive biases (Figure 11d). Pearson correlation values (Figure 11e) indicate agreement with observation at ~61% of the stations, where correlation coefficients exceed 0.4. This suggests that, while the model captures the general temporal evolution of wind speed, it performs less accurately in simulating wind intensity. RMSE values (Figure 11f) mostly range from 1.0 to 2.5 m s−1, reflecting moderate to substantial deviations from observed wind intensity peaks—particularly in the northeastern region of RS, where the cyclone had a stronger impact due to the occlusion, which induced rapid changes in wind intensity.
The time evolution of the zonal wind component (east–west wind) is better captured than that of total wind intensity, with biases generally ranging between -0.5 to 0.5 m s−1, although some stations show a slight tendency toward overestimation (Figure 11g). Correlation coefficients (Figure 11h) are higher for the zonal component than for total wind intensity, with over 84% of stations showing correlations above 0.4. This reflects that the model effectively reproduces the temporal evolution of the directionality of east–west winds. RMSE values (Figure 11i) are mostly below 2.0 m s−1, further confirming the great model’s skill in simulating the zonal wind component.
The meridional wind component (north–south wind) also presents relatively low biases across most stations (Figure 11j), though both positive and negative values are scattered throughout the domain. Correlation coefficients (Figure 11k) are lower than those for the zonal component, with ~55% of stations exceeding the 0.4 threshold, reflecting moderate agreement between simulation and local observations. RMSE values for the meridional component (Figure 11l) are also generally below 2.0 m s−1, suggesting that, despite some under- or overestimations, the model captures the temporal variability of the meridional wind component reasonably well, as indicated in Figure 10 by the rapid shifts between northerly and southerly winds across most stations.

4. Discussion and Conclusions

This study assessed the performance of the WRF model in CP mode in simulating an extratropical cyclone that developed off the southeastern coast of Brazil on 14 June 2023, and followed an atypical southwestward trajectory. On June 16, the cyclone caused several damages in the northeastern region of RS due to its unusual occlusion over the continent. By comparing the simulation with ERA5 reanalysis, radar data, gridded precipitation estimates, and ground-based meteorological observations, we evaluated the model’s ability to reproduce the cyclone’s synoptic and mesoscale features, as well as its local impacts in terms of precipitation and wind.
Synoptic Features: One key strength of the WRF-CP simulation is its ability to reproduce two rare features of the studied cyclone: (1) its southwestward movement and (2) its occlusion over the continent, which led to extreme rainfall in northeastern RS. Cyclones in eastern South America typically move east–southeast, with occlusion occurring over the ocean. The model also successfully captured the along-track 10 m wind intensity and precipitation, closely matching reference datasets (ERA5 reanalysis and MSWX). Some differences in the intensity of these variables may be attributed to the coarser resolution of the reanalysis data compared to WRF-CP, which could limit its ability to resolve localized features associated with the cyclone. Additionally, discrepancies may also be related to the model’s response to local terrain and land–sea temperature gradients.
Mesoscale Features: Radar’s limited information allowed comparison at only two time steps of the simulation. Despite this limitation, we observed that, at 1800 UTC on June 15, the WRF-CP reproduced the precipitation band, oriented from northwest to southeast, over the SP state, which was associated with a cold front. Additionally, the conceptual model of precipitation linked to frontal structures in extratropical cyclones was well captured by WRF-CP. Specifically, the horizontal humidity gradient was well represented in the cold front, while in the warm front, upward motions were dominant across the entire front, with the most intense upward motions occurring in the occluded front. Furthermore, low-level convergence coincided with upward motions in all three types of fronts. Our analysis also confirmed that the occluded front is a region with the highest volume of precipitation in extratropical cyclones. The identification of frontal zones highlights the value of CPMs in resolving fine-scale dynamical features, as demonstrated in studies such as [24] and [8], which similarly found that CPMs enhance the depiction of mesoscale convective features and frontal dynamics in mid-latitude cyclones.
Local Weather Impacts: The comparison with local stations was performed using hourly data to evaluate the high-frequency time variability and mesoscale features associated with the cyclone’s occlusion. In general, WRF-CP reproduced the spatial and temporal distribution of precipitation and wind across meteorological stations (43 for precipitation and 38 for wind), with correlation coefficients exceeding 0.4 at more than half of the precipitation time series analyzed and at more than two-thirds of the zonal wind time series. However, the model consistently overestimated 10 m wind intensity and occasionally displaced precipitation maxima. These biases were more pronounced at stations such as Cambará do Sul and Torres, likely due to the complex local terrain of the Serra of Mar combined with land–sea processes due to the proximity of the coast. Overall, the zonal wind component was better represented than the wind intensity, indicating that wind direction is more reliably simulated than wind intensity.
We suggest that potential sources of model bias include the following:
Terrain Complexity: Stations like Cambará do Sul and Torres, where model performance was poorer, are located in areas of complex topography (e.g., Serra do Mar and coastal region), which are known to challenge even high-resolution models. Orographic lifting, local circulations, and sheltering effects may not be fully captured, even at 4 km resolution.
Physics Parameterizations: While the Thompson microphysics scheme and BouLac PBL were chosen based on previous success (e.g., the study of [33]), uncertainties remain regarding the suitability of these schemes for different regions and seasons. Refs. [10,14] emphasize that microphysical assumptions and turbulence closures can strongly influence convective development and wind intensities in CPMs; hence, other sensitivity experiments need to be performed to strengthen this topic.
Boundary Conditions and Model Spin-Up: Although ERA5 provides relatively high-resolution forcing data, the limited simulation window (starting June 13) may affect the model’s ability to fully equilibrate mesoscale features prior to cyclone maturation. This could explain discrepancies during the early genesis phase.
Despite the identified biases, WRF-CP demonstrated strong skill in simulating key characteristics of the cyclone and its impacts. Its ability to represent synoptic and mesoscale features, as well as accurately capture the timing and location of high-impact weather events, supports its use. Finally, we emphasize that this study contributes to the limited body of research on convection-permitting simulations over South America and surrounding oceans, particularly for synoptic-scale cyclones. Since there are no other studies on the same topic over the South Atlantic Ocean using WRF in CP mode for comparison, we suggest that future work could explore sensitivity analyses using different cyclone events with the same physical parameterizations and ensemble simulations, considering different physical parameterizations, to assess the robustness of the present findings.

Supplementary Materials

The following supporting information can be downloaded at https://www.mdpi.com/article/10.3390/atmos16060675/s1, Supplementary Material S1: Locations (latitude and longitude) of the automatic meteorological stations used in this study. An ‘X’ indicates the availability of precipitation and/or wind component data at each station; Supplementary Material S2: Geographical coordinates, MSLP (hPa), and travelling distance (km) at 6-h intervals for the cyclone center simulated and registered in ERA5. Note: the simulated cyclone has a shorter lifetime compared to the observed one because the simulation was performed only for the days that the cyclone was close to the coast. Therefore, in the table the ERA5 tracking is also limited to the period of simulation.

Author Contributions

Conceptualization, M.H.d.O.A.M., M.S.R. and R.P.d.R.; methodology, M.H.d.O.A.M., M.S.R., R.P.d.R., G.D.G. and E.V.M.; software, M.H.d.O.A.M., M.S.R., R.P.d.R., T.C.B., G.D.G. and E.V.M.; formal analysis, M.H.d.O.A.M., M.S.R., R.P.d.R. and T.C.B.; writing—original draft preparation, M.H.d.O.A.M. and M.S.R.; writing—review and editing, M.H.d.O.A.M., M.S.R. and R.P.d.R. All authors have read and agreed to the published version of the manuscript.

Funding

The authors thank Conselho Nacional de Desenvolvimento Científico e Tecnológico (CNPq—grants #305349/2022-8), Fundação de Amparo à Pesquisa do Estado de Minas Gerais (FAPEMIG), and Fundação de Amparo à Pesquisa do Estado de São Paulo (FAPESP), processes 2023/12074 and 2022/05476, for the financial support.

Institutional Review Board Statement

Not applicable.

Informed Consent Statement

Not applicable.

Data Availability Statement

The data presented in this study are openly available in different repositories: ERA5 reanalysis: https://cds.climate.copernicus.eu/datasets/ (accessed on 15 June 2024). Multi-Source Weather: https://www.gloh2o.org/mswx/ (accessed on 15 January 2025). Brazilian National Institute of Meteorology: https://bdmep.inmet.gov.br/ (accessed on 20 February 2025.

Acknowledgments

The authors thank all the meteorological centers that provided the data used in this study.

Conflicts of Interest

The authors declare no conflicts of interest.

References

  1. Innocentini, V.; Neto, E.D.S.C. A case study of the 9 August 1988 South Atlantic storm: Numerical simulations of the wave activity. Weather Forecast. 1996, 11, 78–88. [Google Scholar] [CrossRef]
  2. da Rocha, R.P.; Sugahara, S.; da Silveira, R.B. Sea waves generated by extratropical cyclones in the South Atlantic Ocean: Hindcast and validation against altimeter data. Weather Forecast. 2004, 19, 398–410. [Google Scholar] [CrossRef]
  3. Brasiliense, C.S.; Dereczynski, C.P.; Satyamurty, P.; Chou, S.C.; da Silva Santos, V.R.; Calado, R.N. Synoptic analysis of an intense rainfall event in Paraíba do Sul river basin in southeast Brazil. Meteorol. Appl. 2018, 25, 66–77. [Google Scholar] [CrossRef]
  4. Reboita, M.S.; da Rocha, R.P.; Oliveira, D.M.d. Key Features and Adverse Weather of the Named Subtropical Cyclones over the Southwestern South Atlantic Ocean. Atmosphere 2019, 10, 6. [Google Scholar] [CrossRef]
  5. Cardoso, A.A.; da Rocha, R.P.; Crespo, N.M. Synoptic Climatology of Subtropical Cyclone Impacts on Near-Surface Winds Over the South Atlantic Basin. Earth Space Sci. 2022, 9, e2022EA002482. [Google Scholar] [CrossRef]
  6. Gramcianinov, C.B.; de Camargo, R.; Campos, R.M.; Guedes Soares, C.; da Silva Dias, P.L. Impact of extratropical cyclone intensity and speed on the extreme wave trends in the Atlantic Ocean. Clim. Dyn. 2023, 60, 1447–1466. [Google Scholar] [CrossRef]
  7. Bartolomei, F.; Reboita, M.S.; da Rocha, R.P. Ciclones extratropicais causadores de eventos extremos no sul do Brasil no inverno de 2023. Terrae Didat. 2024, 20, e024003. [Google Scholar] [CrossRef]
  8. Zhou, L.; Harris, L.; Chen, J.H.; Gao, K.; Cheng, K.Y.; Tong, M.; Kaltenbaugh, A.; Morin, M.; Mouallem, J.; Chilutti, L.; et al. Bridging the gap between global weather prediction and global storm-resolving simulation: Introducing the GFDL 6.5-km SHiELD. J. Adv. Model. Earth Syst. 2024, 16, e2024MS004430. [Google Scholar] [CrossRef]
  9. Prein, A.F.; Gobiet, A.; Suklitsch, M.; Truhetz, H.; Awan, N.K.; Keuler, K.; Georgievski, G. Added value of convection permitting seasonal simulations. Clim. Dyn. 2013, 41, 2655–2677. [Google Scholar] [CrossRef]
  10. Prein, A.F.; Langhans, W.; Fosser, G.; Ferrone, A.; Ban, N.; Goergen, K.; Keller, M.; Tölle, M.; Gutjahr, O.; Feser, F.; et al. A review on regional convection-permitting climate modeling: Demonstrations, prospects, and challenges. Rev. Geophys. 2015, 53, 323–361. [Google Scholar] [CrossRef]
  11. Lucas-Picher, P.; Argüeso, D.; Brisson, E.; Tramblay, Y.; Berg, P.; Lemonsu, A.; Kotlarski, S.; Caillaud, C. Convection-permitting modeling with regional climate models: Latest developments and next steps. Wiley Interdiscip. Rev. Clim. Change 2021, 12, e731. [Google Scholar] [CrossRef]
  12. Prein, A.F.; Liu, C.; Ikeda, K.; Bullock, R.; Rasmussen, R.M.; Holland, G.J.; Clark, M. Simulating North American mesoscale convective systems with a convection-permitting climate model. Clim. Dyn. 2020, 55, 95–110. [Google Scholar] [CrossRef]
  13. Leutwyler, D.; Lüthi, D.; Ban, N.; Fuhrer, O.; Schär, C. Evaluation of the convection-resolving climate modeling approach on continental scales. J. Geophys. Res. Atmos. 2017, 122, 5237–5258. [Google Scholar] [CrossRef]
  14. Dominguez, F.; Rasmussen, R.; Liu, C.; Ikeda, K.; Prein, A.; Varble, A.; Arias, P.A.; Bacmeister, J.; Bettolli, M.L.; Callaghan, P.; et al. Advancing South American Water and Climate Science through Multidecadal Convection-Permitting Modeling. Bull. Am. Meteorol. Soc. 2024, 105, E32–E44. [Google Scholar] [CrossRef]
  15. Torma, C.Z.; Giorgi, F. Convection Permitting Regional Climate Modelling Over the Carpathian Region. Earth Syst. Environ. 2024, 1–16. [Google Scholar] [CrossRef]
  16. Rosales, A.G.; Junquas, C.; da Rocha, R.P.; Condom, T.; Espinoza, J.C. Valley–mountain circulation associated with the diurnal cycle of precipitation in the tropical Andes (Santa River basin, Peru). Atmosphere 2022, 13, 344. [Google Scholar] [CrossRef]
  17. Expósito, F.J.; González, A.; Pérez, J.C.; Díaz, J.P.; Taima, D. High-resolution future projections of temperature and precipitation in the Canary Islands. J. Clim. 2015, 28, 7846–7856. [Google Scholar] [CrossRef]
  18. Coppola, E.; Stocchi, P.; Pichelli, E.; Torres-Alavez, J.A.; Glazer, R.; Giuliani, G.; Sante, F.D.; Nogherotto, R.; Giorgi, F. Non-Hydrostatic RegCM4 (RegCM4-NH): Model description and case studies over multiple domains. Geosci. Model Dev. 2021, 14, 7705–7723. [Google Scholar] [CrossRef]
  19. Meredith, E.P.; Ulbrich, U.; Rust, H.W. Subhourly rainfall in a convection-permitting model. Environ. Res. Lett. 2020, 15, 034031. [Google Scholar] [CrossRef]
  20. Hwang, Y.; Ma, X.; Agyeman, R.Y.; Li, Y. Climatological features of future MCSs over the Canadian Prairies using convection-permitting climate models. Atmos. Res. 2023, 293, 106922. [Google Scholar] [CrossRef]
  21. Akinsanola, A.A.; Jung, C.; Wang, J.; Kotamarthi, V.R. Evaluation of precipitation across the contiguous United States, Alaska, and Puerto Rico in multi-decadal convection-permitting simulations. Sci. Rep. 2024, 14, 1238. [Google Scholar] [CrossRef]
  22. Song, J.; Song, F.; Feng, Z.; Leung, L.R.; Li, C.; Wu, L. Realistic precipitation diurnal cycle in global convection-permitting models by resolving mesoscale convective systems. Geophys. Res. Lett. 2024, 51, e2024GL109945. [Google Scholar] [CrossRef]
  23. Short, E.; Lane, T.P. Objectively Assessing Characteristics of Mesoscale Convective Organization in an Operational Convection-Permitting Model. Mon. Weather Rev. 2023, 151, 2819–2841. [Google Scholar] [CrossRef]
  24. Cioni, G.; Cerrai, D.; Klocke, D. Investigating the predictability of a Mediterranean tropical-like cyclone using a storm-resolving model. Q. J. R. Meteorol. Soc. 2018, 144, 1598–1610. [Google Scholar] [CrossRef]
  25. Bouin, M.N.; Lebeaupin Brossier, C. Surface processes in the 7 November 2014 medicane from air–sea coupled high-resolution numerical modelling. Atmos. Chem. Phys. 2019, 20, 6861–6881. [Google Scholar] [CrossRef]
  26. Defesa Civil. Ciclone No RS—Medidas Emergenciais; Governo do Estado do Rio Grande do Sul; 2023. Available online: https://estado.rs.gov.br/upload/arquivos/2023-06-28-govrs-ciclone-medidas.pdf (accessed on 27 November 2024).
  27. Hersbach, H.; Bell, B.; Berrisford, P.; Hirahara, S.; Horányi, A.; Muñoz-Sabater, J.; Nicolas, J.; Peubey, C.; Radu, R.; Schepers, D.; et al. The ERA5 global reanalysis. Q. J. R. Meteorol. Soc. 2020, 146, 1999–2049. [Google Scholar] [CrossRef]
  28. Beck, H.E.; Van Dijk, A.I.J.M.; Larraondo, P.R.; McVicar, T.R.; Pan, M.; Dutra, E.; Miralles, D.G. MSWX: Global 3-hourly 0.1° bias-corrected meteorological data including near real-time updates and forecast ensembles. Bull. Am. Meteorol. Soc. 2022, 103, E710–E732. [Google Scholar] [CrossRef]
  29. Marshall, J.S.; Palmer, W.M.K. The distribution of raindrops with size. J. Atmos. Sci. 1948, 5, 165–166. [Google Scholar] [CrossRef]
  30. Lopez, A.S.V.; Ribeiro, B.Z.; Morales, C.A.R.; dos Santos, D.M.B.; Enoré, D.P.; Vendrasco, E.P.; de Freitas, E.D.; Nascimento, E.L.; Schild, G.; Saraiva, I.; et al. Diretrizes para a Implementação do Nowcasting No Brasil; Instituto Nacional de Pesquisas Espaciais: São José, Brazil, 2024; 227p. [Google Scholar]
  31. Skamarock, W.C.; Klemp, J.B.; Dudhia, J.; Gill, D.O.; Barker, D.M.; Duda, M.G.; Huang, X.; Wang, W.; Powers, J.G. A Description of the Advanced Research WRF Version 3; National Center for Atmospheric Research: Boulder, CO, USA, 2008; 126p. [Google Scholar]
  32. Conrado, E.T.C. Estudo das Parametrizações de Microfísica de Nuvens na Simulação de Ciclones Subtropicais. Undergraduate Thesis, DCA-IAG-USP, Rua do Matão, São Paulo, Brazil, 2021. [Google Scholar]
  33. Reboita, M.S.; Gozzo, L.F.; Crespo, N.M.; Custodio, M.D.S.; Lucyrio, V.; de Jesus, E.M.; da Rocha, R.P. From a Shapiro–Keyser extratropical cyclone to the subtropical cyclone Raoni: An unusual winter synoptic situation over the South Atlantic Ocean. Q. J. R. Meteorol. Soc. 2022, 148, 2991–3009. [Google Scholar] [CrossRef]
  34. Iacono, M.J.; Delamere, J.S.; Mlawer, E.J.; Shephard, M.W.; Clough, S.A.; Collins, W.D. Radiative forcing by long-lived greenhouse gases: Calculations with the AER radiative transfer models. J. Geophys. Res. Atmos. 2008, 113, D13103. [Google Scholar] [CrossRef]
  35. Hong, S.Y.; Noh, Y.; Dudhia, J. A new vertical diffusion package with an explicit treatment of entrainment processes. Mon. Weather Rev. 2006, 134, 2318–2341. [Google Scholar] [CrossRef]
  36. Janjic, Z.I. The surface layer in the NCEP eta model. In Proceedings of the 11th Conference on Numerical Weather Prediction, Norfolk, VA, USA, 19–23 August 1996; American Meteorology Society: Boston, MA, USA, 1996; pp. 354–355. [Google Scholar]
  37. Bougeault, P.; Lacarrere, P. Parameterization of orography-induced turbulence in a mesobeta-scale model. Mon. Weather Rev. 1989, 117, 1872–1890. [Google Scholar] [CrossRef]
  38. Maria, E.; Budiman, E.; Taruk, M. Measure distance locating nearest public facilities using Haversine and Euclidean Methods. J. Phys. Conf. Ser. 2020, 1450, 012080. [Google Scholar] [CrossRef]
  39. Akoglu, H. User’s guide to correlation coefficients. Turk. J. Emerg. Med. 2018, 18, 91–93. [Google Scholar] [CrossRef]
  40. Di, Y.; Li, R. Correlation analysis of AQI characteristics and meteorological conditions in heating season. In IOP Conference Series: Earth and Environmental Science; IOP Publishing: Bristol, UK, 2019; p. 022067. [Google Scholar]
  41. Zhang, H.; Pu, Z.; Zhang, X. Examination of errors in near-surface temperature and wind from WRF numerical simulations in regions of complex terrain. Weather Forecast. 2013, 28, 893–914. [Google Scholar] [CrossRef]
  42. Xue, W.; Yu, H.; Tang, S.; Huang, W. Relationships between Terrain Features and Forecasting Errors of Surface Wind Speeds in a Mesoscale Numerical Weather Prediction Model. Adv. Atmos. Sci. 2024, 41, 1161–1170. [Google Scholar] [CrossRef]
  43. Vaisala. Wind Sens. 2025. Available online: https://www.vaisala.com/en/products/weather-environmental-sensors/wind (accessed on 20 April 2025).
  44. Vaisala. Precipitation Sensors. 2025. Available online: https://www.vaisala.com/en/products/weather-environmental-sensors/precipitation (accessed on 20 April 2025).
  45. Willmott, C.J. On the validation of models. Phys. Geogr. 1981, 2, 184–194. [Google Scholar] [CrossRef]
  46. Cao, H.X.; Hanan, J.S.; Yan, L.; Liu, Y.X.; Yue, Y.B.; Zhu, D.W.; Lu, J.F.; Sun, J.Y.; Shi, C.L.; Ge, D.K.; et al. Comparison of crop model validation methods. J. Integr. Agric. 2012, 11, 1274–1285. [Google Scholar] [CrossRef]
  47. Bluestein, H.B. Synoptic-Dynamic Meteorology in Midlatitudes Vol. 2.: Observations and Theory of Weather Systems; Oxford University Press: New York, NY, USA, 1992. [Google Scholar]
  48. Povey, A.C.; Grainger, R.G. Known and unknown unknowns: Uncertainty estimation in satellite remote sensing. Atmos. Meas. Tech. 2015, 8, 4699–4718. [Google Scholar] [CrossRef]
  49. Khojand, K.; Shaghaghian, M.R.; Ghadampour, Z.; Sabzevari, T. Validity, reliability and certainty of PERSIANN and TRMM satellite-derived daily precipitation data in arid and semiarid climates. Acta Geophys. 2022, 70, 1745–1767. [Google Scholar] [CrossRef]
  50. Wernli, H.; Gray, S.L. The importance of diabatic processes for the dynamics of synoptic-scale extratropical weather systems—A review. Weather Clim. Dyn. 2024, 5, 1299–1408. [Google Scholar] [CrossRef]
  51. Bechini, R.; Chandrasekar, V. An enhanced optical flow technique for radar nowcasting of precipitation and winds. J. Atmos. Ocean. Technol. 2017, 34, 2637–2658. [Google Scholar] [CrossRef]
  52. Keyser, D. Atmospheric fronts: An observational perspective. In Mesoscale Meteorology and Forecasting; Ray, P.S., Ed.; American Meteorological Society: Boston, MA, USA, 1986. [Google Scholar] [CrossRef]
  53. Wang, S.; Fu, G.; Pang, H. Structure analyses of the explosive extratropical cyclone: A case study over the Northwestern Pacific in March 2007. J. Ocean Univ. China 2017, 16, 933–944. [Google Scholar] [CrossRef]
  54. Browning, K.A. Conceptual models of precipitation systems. Weather Forecast. 1986, 1, 23–41. [Google Scholar] [CrossRef]
  55. Saarikivi, P.; Puhakka, T. The structure and evolution of a wintertime occluded front. Tellus A 1990, 42, 122–139. Available online: https://onlinelibrary.wiley.com (accessed on 29 May 2025). [CrossRef]
  56. Stewart, R.E. Extratropical Cyclones: Their Mesoscale Structure, Precipitation and Role in the Transport of Water. In Radiation and Water in the Climate System; Raschke, E., Ed.; Nato ASI Series; Springer: Berlin/Heidelberg, Germany, 1986; Volume 45. [Google Scholar] [CrossRef]
  57. Szeto, K.K.; Stewart, R.E. Effects of melting on frontogenesis. J. Atmos. Sci. 1997, 54, 689–702. [Google Scholar] [CrossRef]
  58. Cotton, W.R.; Bryan, G.; van den Heever, S.C. The mesoscale structure of extratropical cyclones and middle and high clouds. In Storm and Cloud Dynamics; Cotton, W.R., Bryan, G., van den Heever, S.C., Eds.; Academic Press Inc.: San Diego, CA, USA, 1992; pp. 714–787. [Google Scholar]
  59. Clark, M.R. Mesoscale cyclonic storms associated with tornadoes and localised wind damage in frontal rainbands. Weather 2024, 79, 108–123. [Google Scholar] [CrossRef]
  60. Market, P.S.; Moore, J.T. Mesoscale evolution of a continental occluded cyclone. Mon. Weather. Rev. 1998, 126, 1793–1811. [Google Scholar] [CrossRef]
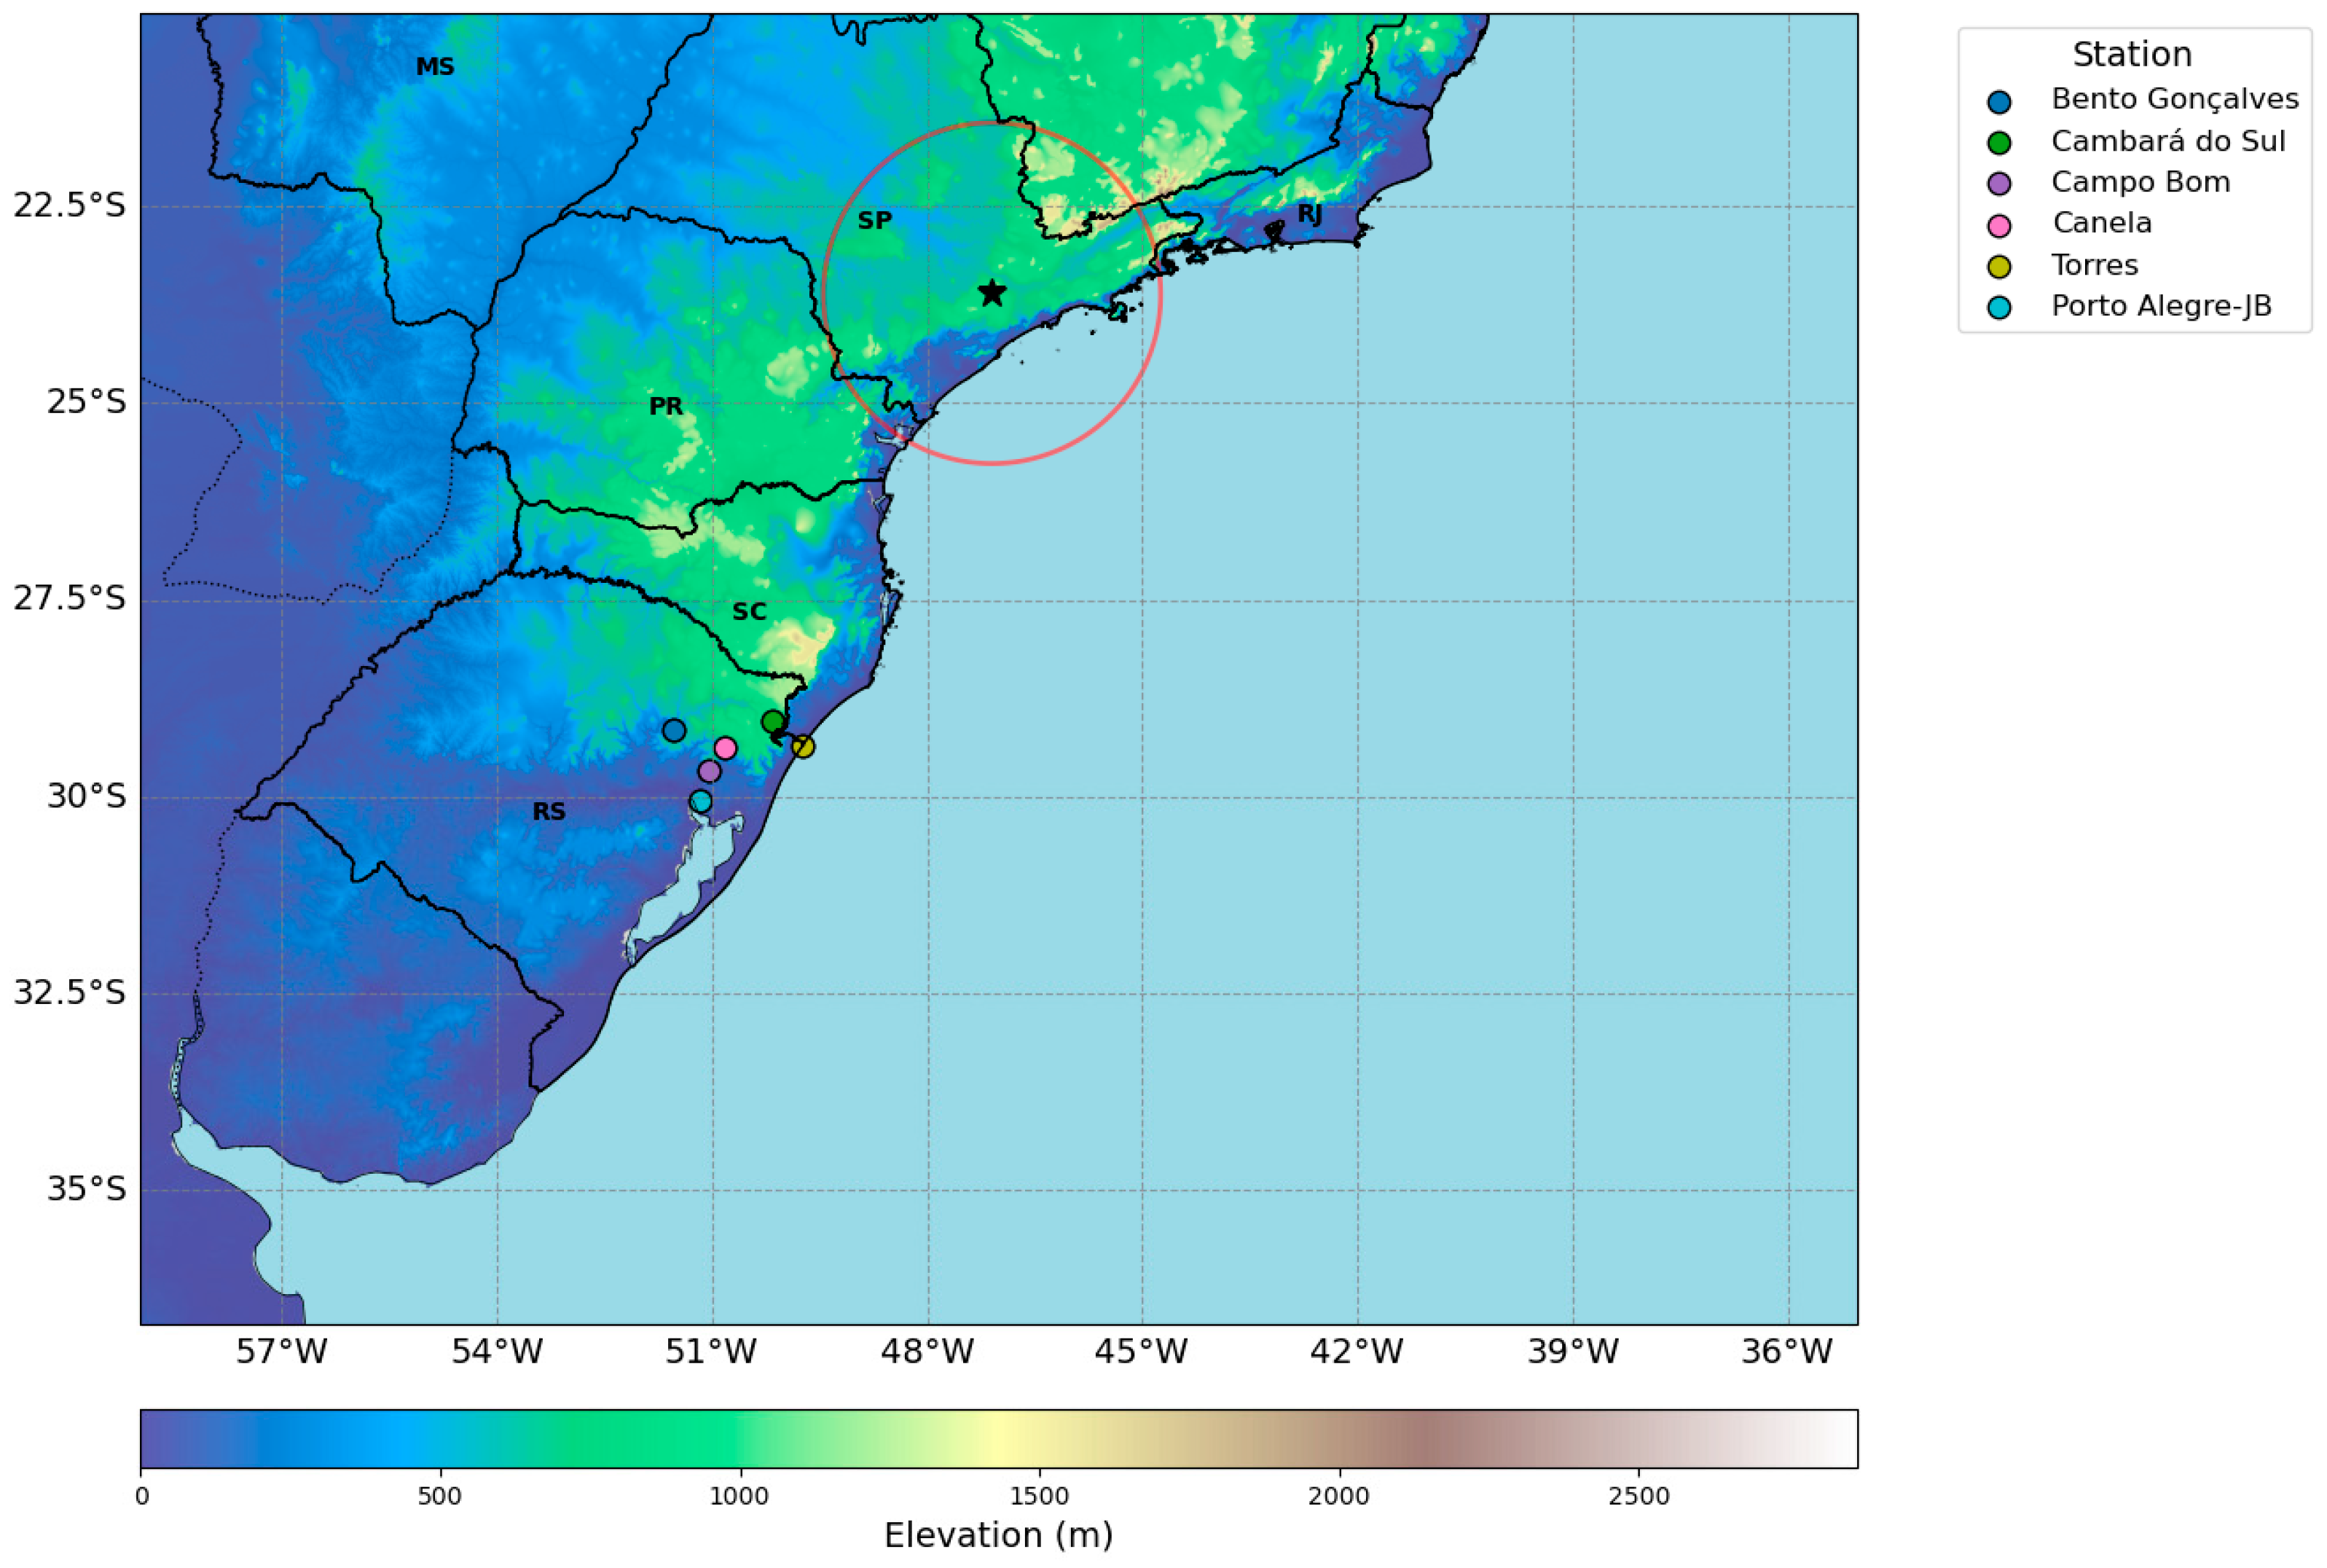
Figure 1. Simulation domain, topography (in meters), radar location (black star), and coverage radius, along with the locations of six automatic meteorological stations from INMET used to illustrate the time series in the cyclone occlusion region. The initials refer to the respective state names: RS—Rio Grande do Sul, SC—Santa Catarina, PR—Paraná, SP—São Paulo, RJ—Rio de Janeiro, and MS—Mato Grosso do Sul.
Atmosphere 16 00675 g001
Figure 2. (a) Cyclone tracking (continuous lines) showing the positions at 0000 UTC of each day (e.g., 00T14), the distance traveled (d; in km), and the mean velocity (v; m s−1), and (b) MSLP (hPa) at the cyclone center from ERA5 (blue) and the simulation (red). In (a), the acronyms of the Brazilian states are also indicated.
Atmosphere 16 00675 g002
Figure 3. Accumulated precipitation (mm) for (a) WRF and (b) MSWX, and maximum 10 m wind intensity (m s−1) for (c) WRF and (d) ERA5 along the simulated cyclone track. The markers on the black line indicate the cyclone position every 6 h, starting at 0000 UTC on June 14 (north position) and ending at 1800 UTC on June 16 (in some time steps, the markers overlap). In (b,d), the track corresponds to ERA5. In (a), the acronyms of the Brazilian states are shown: SP for São Paulo, PR for Paraná, SC for Santa Catarina, and RS for Rio Grande do Sul.
Atmosphere 16 00675 g003
Figure 4. Three-hour accumulated precipitation (mm/3 h; shaded) and MSLP at: 14-06-2023 at 1200 UTC from (a) WRF-CP, (b) MSWX and ERA5; 14-06-2023 at 1800 UTC from (c) WRF-CP, (d) MSWX and ERA5; 15-06-2023 at 1200 UTC from (e) WRF-CP, (f) MSWX and ERA5; 15-06-2023 at 1800 UTC from (g) WRF-CP, (h) MSWX and ERA5; 16-06-2023 at 1200 UTC from (i) WRF-CP, (j) MSWX and ERA5. The accumulated precipitation is calculated by summing the precipitation over the preceding three hours; for example, the 1200 UTC value represents accumulation between 0900 and 1200 UTC, 1800 UTC corresponds to 1500–1800 UTC, and so on.
Atmosphere 16 00675 g004
Figure 5. Three-hour accumulated precipitation (mm 3 h−1) from WRF-CP and radar estimates on June 15 at (a,b) 1200 UTC and (c,d) 1800 UTC over southeastern Brazil. In (b,d), the circles indicate distances of 100 km and 250 km from the radar location, and, in (c), the red lines indicate the sections selected for the vertical cross-sections.
Atmosphere 16 00675 g005
Figure 6. (a) Wind divergence (×10−5 s−1; shaded) and wind intensity and direction (arrows) at 850 hPa. Conv indicates convergence while div, divergence, at 1800 UTC on 15 June 2023. (b) Vertical cross-section of relative humidity (%, shaded) and vertical velocity (lines; m s−1). Blue lines indicate subsidence, and red lines indicate ascendant movement. The black line indicates the frontal zone. (c) Zoom on the precipitation field indicates the coordinates of the vertical cross-section.
Atmosphere 16 00675 g006
Figure 7. Relative humidity (%, shaded) and low-level winds (m s−1; black arrows) simulated by WRF-CP at: (a) 15-06-2023 at 0000 UTC, (b) 16-06-2023 at 0000 UTC, (c) 16-06-2023 at 1200 UTC, (d) 16-06-2023 at 1800 UTC. L indicates the cyclone center, the red arrow indicates the path of the warm conveyor belt, and blue indicates the path of the cold conveyor belt.
Atmosphere 16 00675 g007
Figure 8. (a) Three-hourly accumulated precipitation (mm 3 h−1) and indication of the points used in the vertical cross-sections. Relative humidity (%, shaded) and vertical velocity (m s−1) for three vertical cross-sections: (b) cold front, (c) warm front, and (d) occluded front at 0000 UTC on 26 June 2023.
Atmosphere 16 00675 g008
Figure 9. Total precipitation (mm/day) during the cyclone’s occlusion on 16 June 2023, as measured by INMET meteorological stations (values at points) and simulated by WRF-CP (shaded). This day was the day when the RS state was most affected by the cyclone. Red points indicate the locations of the stations selected for hourly time series analysis in Figure 10.
Atmosphere 16 00675 g009
Figure 10. Time series of hourly variables (10-m wind intensity, zonal wind speed, meridional wind speed and precipitation) from June 13th to 16th, 2023 as measured by INMET meteorological stations (blue line) and simulated by WRF-CP (red line) for the stations: (a1a4) Bento Gonçalves; (b1b4) Cambará do Sul; (c1c4) Campo Bom; (d1d4) Canela (e1e4) Porto Alegre-JB; (f1f4) Torres.
Atmosphere 16 00675 g010
Figure 11. Statistical metrics calculated between observations and simulations for the hourly time series from 13 to 16 June 2023 for: (ac) bias, correlation and RMSE for precipitation (mm h−1); (df) bias, correlation and RMSE for wind speed (m s−1); (gi) bias, correlation and RMSE for zonal wind (m s−1); (jl)bias, correlation and RMSE for meridional wind (m s−1).For correlations, values higher than 0.4 are highlighted in red.
Atmosphere 16 00675 g011
Disclaimer/Publisher’s Note: The statements, opinions and data contained in all publications are solely those of the individual author(s) and contributor(s) and not of MDPI and/or the editor(s). MDPI and/or the editor(s) disclaim responsibility for any injury to people or property resulting from any ideas, methods, instructions or products referred to in the content.