Article

Spatiotemporal Variations and Health Assessment of Heavy Metals and Polycyclic Aromatic Hydrocarbons (PAHs) in Ambient Fine Particles (PM1.1) of a Typical Copper-Processing Area, China

Graduate School of Science and Engineering, Saitama University, Saitama 338-8570, Japan
*
Authors to whom correspondence should be addressed.
Atmosphere 2025, 16(6), 674; https://doi.org/10.3390/atmos16060674
Submission received: 11 May 2025 / Revised: 26 May 2025 / Accepted: 27 May 2025 / Published: 1 June 2025
(This article belongs to the Section Air Quality and Health)

Abstract

:
This study investigates the concentrations, health risks, and potential sources of heavy metal elements and polycyclic aromatic hydrocarbons (PAHs) in PM1.1 particles in Zhuji, a major copper-processing city in China. The ratios of heavy metals (summer: 0.906; winter: 0.619) and PAHs (>0.750 in both seasons) in PM1.1/PM2.0 suggest significant accumulation in ultrafine particles. In winter, heavy metal concentrations in PM1.1 reached up to 448 ng/m3, and PAH concentrations were 13.4 ng/m3—over ten times higher than in summer. Health risk assessments revealed that hazard index (HI) values exceeded 1.00 for five age groups (excluding infants) during winter, indicating chronic exposure risks. Incremental lifetime cancer risk (ILCR) values surpassed the upper acceptable limit (1.0 × 10⁻⁴) for four age groups, with Cr, As, Cd, and Pb as major contributors. PAH-related ILCRs were also elevated in winter, with benzo[a]pyrene (BaP) identified as the most potent carcinogen. Enrichment factor (EF) and principal component analysis (PCA) indicated that industrial activities and traffic emissions were the dominant anthropogenic sources of heavy metals. Diagnostic ratio analysis further showed that PAHs mainly originated from vehicle and coal combustion. These findings provide critical insights into pollution patterns in industrial cities and underscore the importance of targeted mitigation strategies.

1. Introduction

Zhuji City, located in north-central Zhejiang Province, China, is one of the country’s major copper-processing hubs. Since 2020, it has maintained a population of over 1 million and experienced rapid economic growth [1,2]. The city’s annual copper-processing volume has reached approximately 350,000 tons, accounting for about 5% of China’s total output. Copper mining and smelting activities are known to increase environmental concentrations of heavy metals, thereby elevating the risk of exposure for populations living in and around such industrial areas [3]. Heavy metals, such as lead (Pb), zinc (Zn), cadmium (Cd), mercury (Hg), and chromium (Cr), are generally defined as metals and metalloids with densities greater than 5 g/cm3. Metalloids such as arsenic (As) are often included in this category due to their similar environmental behavior and chemical persistence [4]. Heavy metal pollution is typically covert, persistent, and irreversible [5].
The Zhuji region has encountered several significant environmental issues related to heavy metal contamination. For example, Sun reported that Pb, As, Cu, Zn, and Ni in mining-affected soils may originate from common sources [6]. In general, heavy metals have attracted considerable attention due to their detection frequency and toxicity [7,8]. These non-biodegradable elements are recognized as harmful components of atmospheric particulate matter and can adversely impact human health through inhalation, ingestion, and dermal contact [9,10]. Long-term or high-level exposure to such elements has been linked to cardiovascular diseases, cancer, neurological disorders, and other serious health effects [6,9,10,11,12]. Moreover, the presence of heavy metals in ambient particles can serve as useful indicators for identifying pollution sources [5,13]. Similar cases of metal contamination near copper mining and smelting facilities have been documented in regions such as Chile, the United States (e.g., Anaconda and Tacoma), and Sweden. A 2008 study on arsenic speciation in PM2.5 near a copper smelter revealed significantly elevated levels of toxic elements in the urban atmosphere. Arsenic contamination arises from both natural and anthropogenic sources, and is commonly found in rocks, soils, water bodies, and atmospheric dust [14,15].
In addition to heavy metals, PAHs are also of growing concern among airborne toxic pollutants. PAHs have been identified as potential carcinogens and mutagens, posing considerable threats to human health [16,17,18]. The United States Environmental Protection Agency (USEPA) has classified 16 PAHs as priority pollutants under the “Consent Decree,” including seven known or suspected carcinogens: benz[a]anthracene(BaA), BaP, benzo[b]fluoranthene (BbF), benzo[k]fluoranthene(BkF), chrysene(Chy), dibenz[a,h]anthracene, and indeno [1,2,3-cd]pyrene[17]. The World Health Organization (WHO) set a guideline concentration for BaP at 1 ng/m3, while China's national air quality standard is 2.5 ng/m3 [16,19]. PAH exposure is associated with a variety of adverse health effects, including respiratory and cardiovascular diseases, reduced lung function, myocardial infarction, asthma, immune system dysfunction, and increased cancer risk [18,20,21]. Major emission sources of PAHs include vehicle exhaust, fossil fuel combustion, industrial operations, and residential heating. The toxicity of PAHs depends on factors such as molecular structure, particle size, chemical composition, and regional meteorological conditions.
Despite the established hazards associated with toxic elements and PAHs, few studies have comprehensively assessed their concentrations, sources, and health risks in fine particulate matter in copper mining and processing regions like Zhuji. Given the city’s rapid industrialization and role as a key copper smelting center, it is crucial to investigate the pollution profile and associated health implications in its urban environment. Under specific meteorological conditions, emissions from industrial facilities, including copper smelters, may be transported and dispersed across urban areas, potentially affecting the health of residents.
Therefore, this study focuses on the concentrations, health risks, and sources of heavy metals and PAHs in fine particulate matter—specifically PM1.1—in the residential areas of Zhuji City. The research objectives are fourfold: (1) to collect ambient particulate matter samples in five size fractions during both summer and winter; (2) to quantify heavy metal concentrations using inductively coupled plasma–mass spectrometry (ICP-MS) and PAH concentrations using gas chromatography–mass spectrometry (GC-MS); (3) to evaluate the non-carcinogenic and carcinogenic health risks of these pollutants; (4) to explore the potential sources of heavy metals and PAHs in PM1.1, including the role of long-range atmospheric transport. This study aims to provide a detailed understanding of the current state and characteristics of air pollution in Zhuji, and to offer scientific insights for balancing industrial development and environmental health protection in similar rapidly developing industrial regions.

2. Materials and Methods

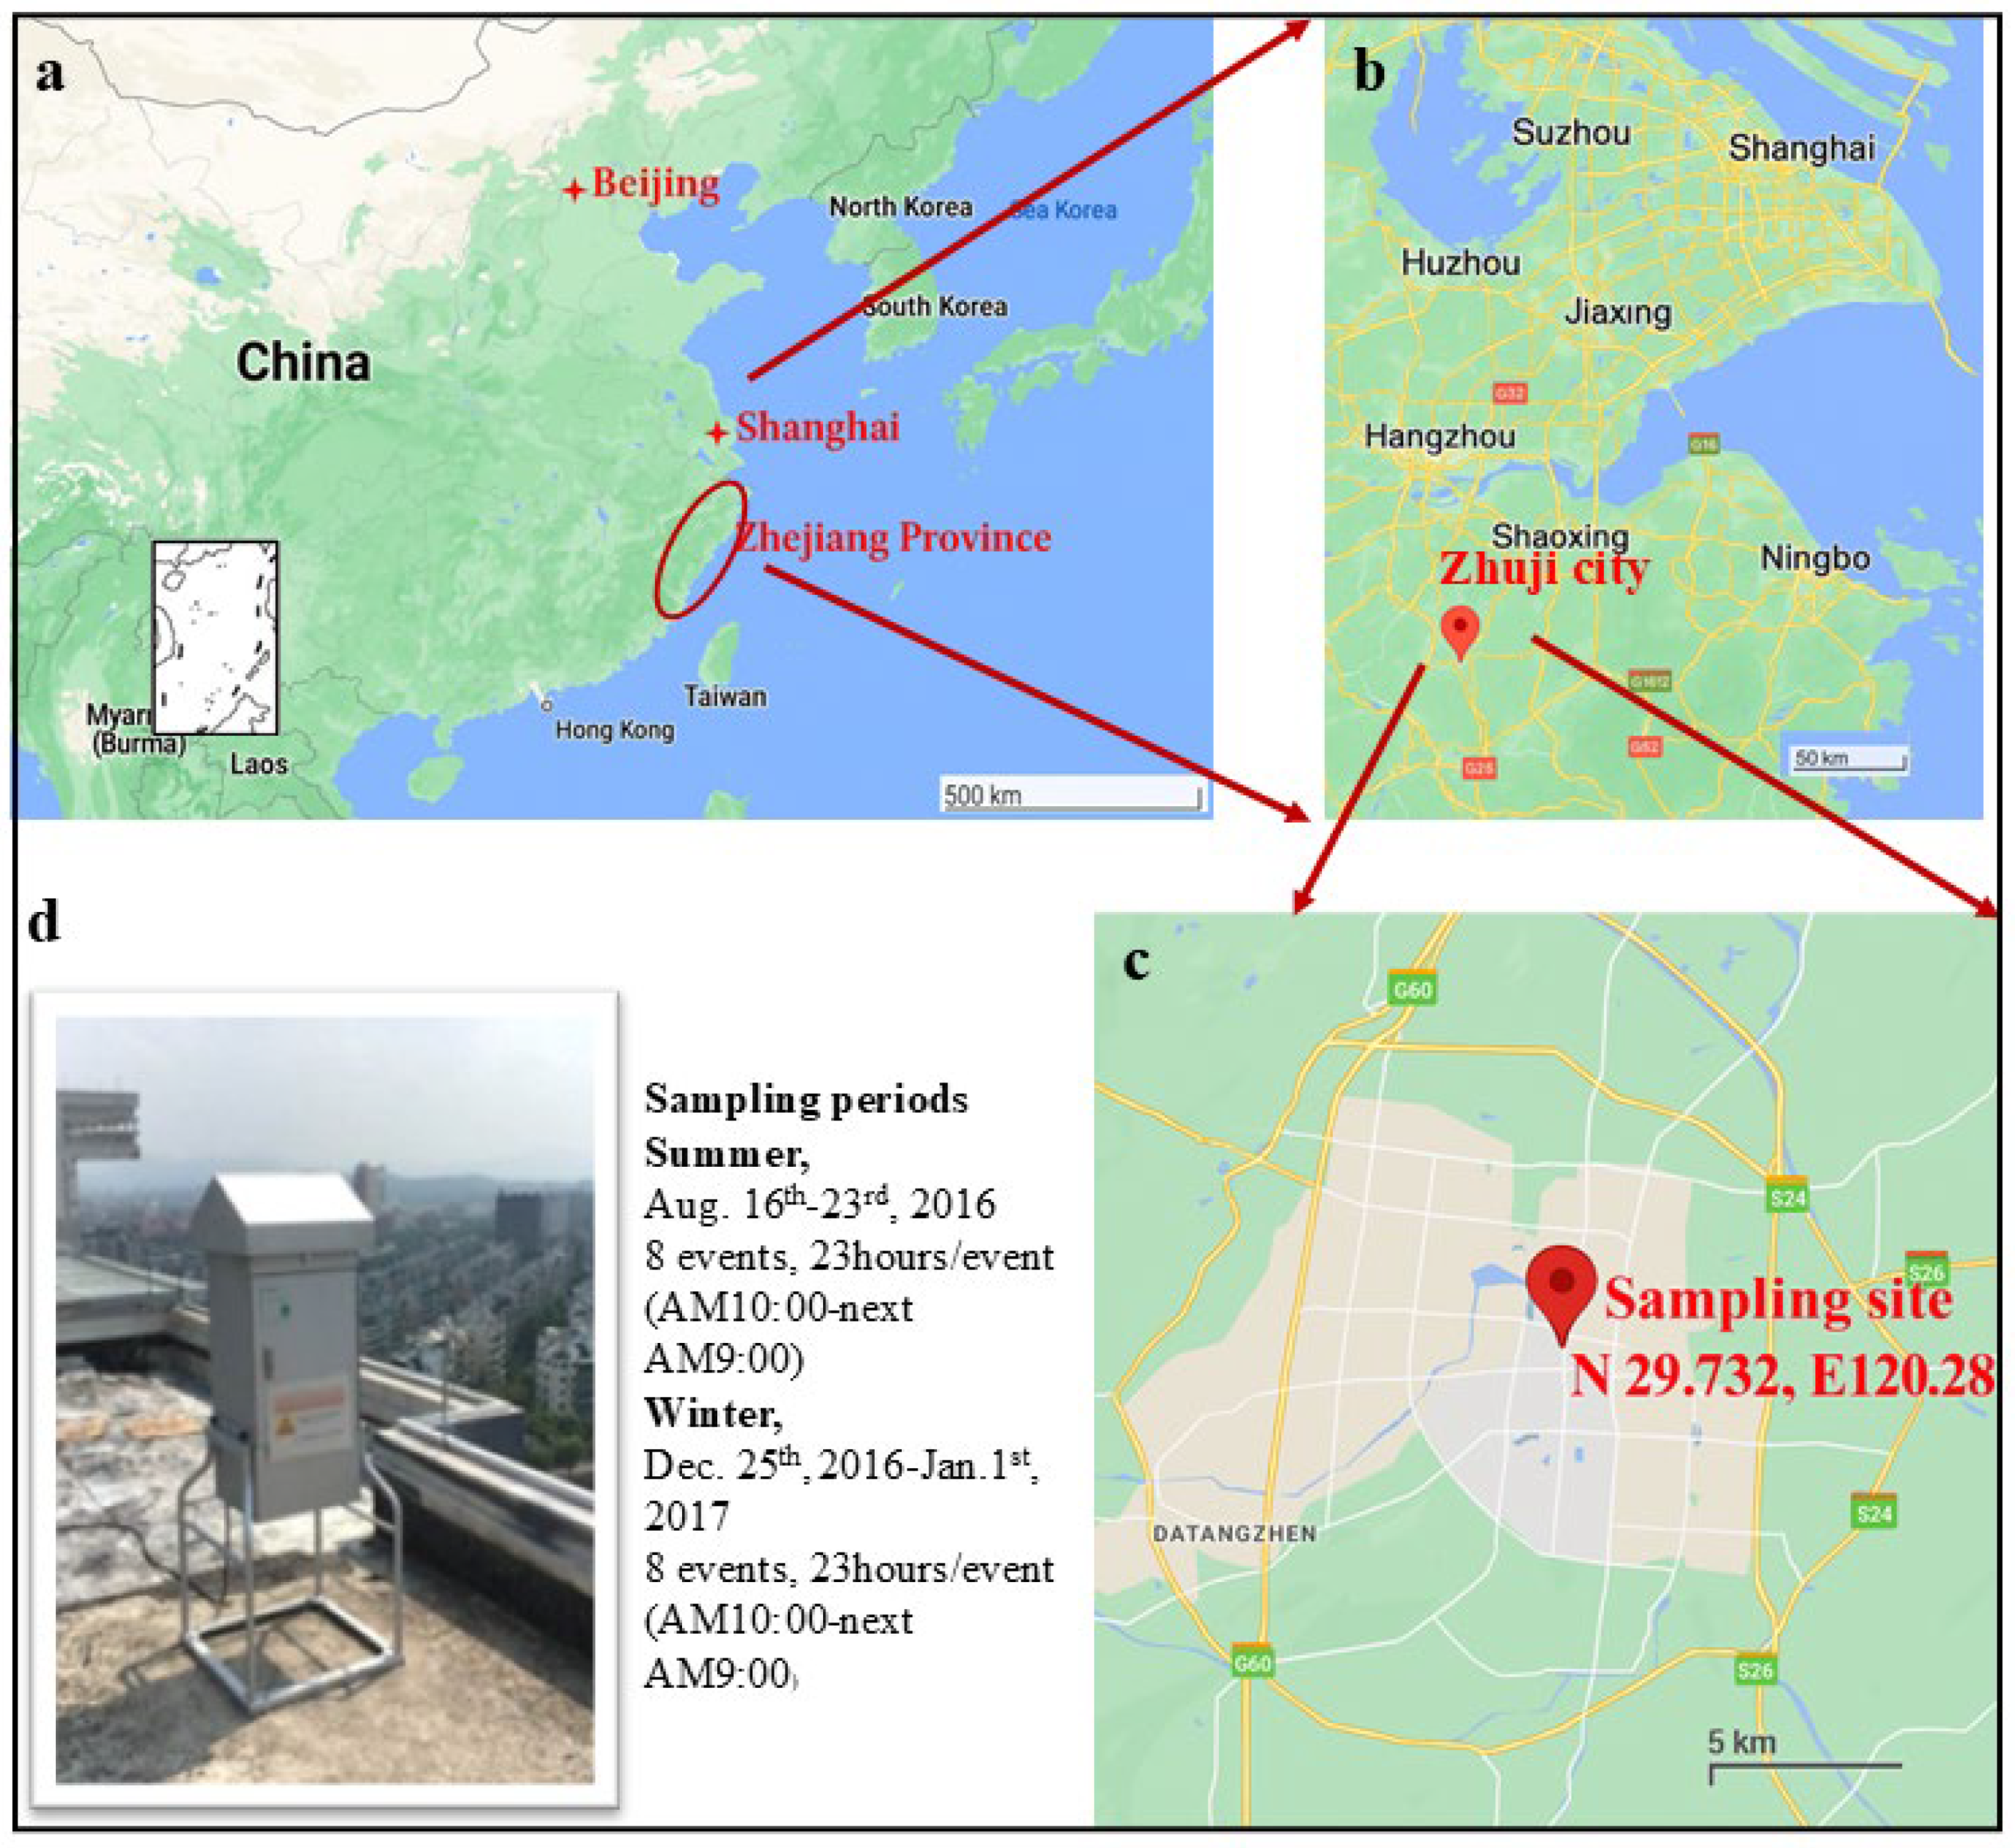
2.1. Ambient Partilce Sampling Site and Sampling Campaigns

Ambient fine particulate matter was collected on the rooftop of a residential building located near a major arterial road in central Zhuji City (N 29.372, E 120.238; elevation approximately 55 m), as shown in Figure 1. An Andersen high-volume air sampler (AHV-600, Shibata Co., Tokyo, Japan), equipped with a Tissuquartz filter (AHQ-6300, TIS-SUQUARTZ-2500QAT-UP, Tokyo Dylec, Japan), was used to collect airborne particles, which were classified into five aerodynamic diameter ranges [22]: PM1.1 (<1.1 μm), PM1.1–2.0 (1.1–2.0 μm), PM2.0–3.3 (2.0–3.3 μm), PM3.3–7.0 (3.3–7.0 μm), and coarse particles (>7.0 μm). The sampling procedure followed the methods described in our previous studies [5,16,23].
Sampling was conducted in two distinct seasons: (1) Summer: eight consecutive 23-hour sampling sessions from 16th August to 23rd August 2016; and (2) Winter: eight consecutive 23 h sessions from 25th December 2016 to 1st January 2017. Meteorological data during the sampling periods were obtained from the Tianqihoubao website [24]. During summer, the average maximum and minimum temperatures were 36.5 °C and 27.8 °C, respectively, with a mean relative humidity of 63% (Figure 2a and Table S1). In contrast, during winter, the average maximum and minimum temperatures were 11.8 °C and 8.0 °C, respectively, with a mean relative humidity of 84%.

2.2. Measurement of Heavy Metal Elements and PAHs in Ambient Particles

Elemental species in particulate matter were analyzed using inductively coupled plasma–mass spectrometry (ICP-MS, Model 7700, Agilent Technologies, Santa Clara, CA, USA), following procedures described in our previous studies [9,23]. The suitable mounts AHV filters were extracted using 8 ml acid mixture solution (5.0 ml nitric acid (HNO3), 1.0 ml hydrogen peroxide (H2O2), 2.0 ml hydrofluoric acid (HF)) in a polytetrafluoroethylene (PTFE) vessel with high-pressure acid digestion (105 °C, 30 min; 170 °C, 2 h). Finally, the samples were filled to 10 ml with 2% HNO3. The analyzed elements included iron (Fe), Cr, Mn, Ni, Cu, Zn, As, Cd, and Pb. Each sample was analyzed in triplicate. The details of chemicals are as follows: HNO3, Wako 1st grade, Fujifilm, Japan; H2O2, super special grade, Fujifilm, Japan; HF, Guaranteed Reagent, Fujifilm, Japan; ICP multi-element standard solution IV, Merck, USA. Each sample was analyzed in triplicate.
Polycyclic aromatic hydrocarbons (PAHs) were extracted and quantified using gas chromatography–mass spectrometry analysis, following the method reported by Wang [16]. PAHs were extracted using dichloromethane (guaranteed reagent, Fijifilm, Tokyo, Japan), and subsequently subjected to solvent exchange and concentrated in Hexane (guaranteed reagent, Fijifilm, Japan). The standard was used Sigma-Aldrich EPA 16 PAHs mixture (Sigma-Aldrich, 4S8743, St. Louis, MO, USA). The extract solution with an internal standard was used in a volume of up to 0.1 mL and measured by GC-MS (GC-MS, Model Agilent 5973N, Agilent Technologies. Inc., Santa Clara, CA, USA). The GC-MS analyses were performed on an InertCap 17 (GL Sciences, Tokyo, Japan) column using an HP6890 GC interfaced into an HP5973 MS detector. The target PAH compounds included naphthalene (NAP), acenaphthylene (ACY), acenaphthene (ACE), fluorene (Flu), phenanthrene (Phe), anthracene (Ant), fluoranthene (FLN), pyrene (Pyr), BaA, Chy, BbF, BkF, BaP, benzo[ghi]perylene (BghiP), indeno [1,2,3-cd]pyrene (IndP), and dibenz[a,h]anthracene (DBahA). Each sample was analyzed in triplicate.

2.3. Health Risk Assessment of Heavy Metal Elements and PAHs

In this study, the human health risks associated with heavy metal elements and PAHs in PM1.1 were assessed based on inhalation exposure, with a focus on both non-carcinogenic and carcinogenic risks. Non-carcinogenic risks were evaluated for heavy metals including Cr, Ni, Cu, Zn, As, Cd, Pb, and Mn, while carcinogenic risks were assessed for Cr, Ni, As, Cd, and Pb, as well as PAHs. The health risk assessment methodology followed the guidelines of the USEPA [5,25,26].

2.3.1. Non-Carcinogenic Risks of Heavy Metal Elements

The non-carcinogenic risks via inhalation exposure were calculated using the following equation:
EC = (Ch × ET × EF × ED)/BW × AT,
HQe = EC/(Rfc × 1000 μg/mg),
HI = ⅀HQe,
The exposure concentration (EC) was calculated using Equation (1), with parameter definitions for Ch, InhR, ED, ET, EF, BW, and AT provided in Table 1. Table 2 lists the inhalation reference concentrations (RfC) for each target element. The hazard quotient for each element (HQₑ) represents the non-carcinogenic risk from inhalation exposure to a single element. The hazard index (HI), defined as the sum of all HQₑ values, is used to evaluate the overall non-carcinogenic health risk posed by the mixture of elements. An HQₑ or HI value exceeding 1.00 indicates a potential for adverse health effects and warrants further attention, whereas a value below 1.00 suggests that non-carcinogenic risks are unlikely to occur [5,17,25].

2.3.2. Carcinogenic Risks of Heavy Metal Elements

The carcinogenic risks associated with heavy metal elements (Cr, Ni, As, Cd, and Pb) were calculated using the following equation:
LEC = Ce*InhR*EF*ED*ET/(BW*ATn)
ILCRe = LEC*IUR
The details of Ce, InhR, ED, ET, EF, BW, and ATn can be found in Table 2. The inhalation unit risk (IUR) shown in Table S3 concerns the inhalation unit risk of exposure to each element. The incremental lifetime cancer risk (ILCRe) posed by an element is represented as the number of cases of specific types of cancer among a certain number of residents. According to the publication by USEPA, acceptable ILCRe values are in the range of 1.0 × 10⁻⁶ to 1.0 × 10⁻⁴. When the ILCR is below 1.0 × 10⁻⁶, it is considered not to pose any significant carcinogenic risk; when this value is over 1.0 × 10⁻⁴, it is considered as very dangerous [18,23,27].

2.3.3. Carcinogenic Risks of PAHs

The carcinogenic risks associated with PAHs were calculated using the following equation:
LADDi = CA*InhR*ET*EF*ED/(BW*ATn)
ILCRPAHs = 1-e(-ICRF*LADDi)
The definitions of CA, InhR, ET, EF, ED, BW, and ATₙ are provided in Table 1. Here, CA represents the ambient concentration of benzo[a]pyrene (BaP), which was converted into the BaP toxic equivalent concentration using toxic equivalency factors (TEFs). The TEF values for each PAH were as follows: Flu, 0.001; Phe, 0.001; FLN, 0.001; Pyr, 0.001; BaA, 0.1; Chy, 0.01; BbF, 0.1; BkF, 0.1; BaP, 1.0; BghiP, 0.01; IndP, 0.1; and DBahA, 1.0 [23]. The inhalation cancer risk factor (ICRF) for BaP was set at 3.9 (mg/kg/day)⁻1 [16,18,19]. ILCRₚₐₕₛ represents the estimated number of cancer cases attributable to PAH exposure via inhalation in a given population.

2.4. Assessment of Potential Sources of Heavy Metal Elements and PAHs

The potential sources of toxic elements were identified using enrichment factor (EF) analysis and principal component analysis (PCA). EFs are commonly employed to distinguish between natural and anthropogenic sources of elements and to assess the degree of human influence on elemental concentrations [5,10,25,28]. In this study, Fe element was selected as the reference crustal element for calculating the EF of each target element. The calculation methods and interpretation criteria followed those outlined in previous studies [5,28].
PCA was used to reduce the dimensionality of the dataset while preserving the majority of its variance. Variables exhibiting similar behaviors were grouped into principal components (factors), each representing a potential source or group of sources and explaining a significant portion of the total variance in the dataset [10].
For PAHs, diagnostic ratio analysis was used to identify potential anthropogenic sources. Several commonly used diagnostic ratios were applied as Table 3.
In addition, the Hybrid Single-Particle Lagrangian Integrated Trajectory (HYSPLIT) model was employed to analyze long-range transport pathways. Backward air mass trajectories were generated using meteorological data from the Global Data Assimilation System (GDAS) via the NOAA Air Resources Laboratory web server. Trajectories were calculated at 24-hour intervals, tracing air masses 192 hours backward in time. The arrival height was set at 50 m above ground level, corresponding to the elevation of one of the ambient particulate monitoring sites in Zhuji.

2.5. Quality Assurance, Quality Control (QA/QC), and Statistical Analysis

Descriptive statistics were calculated by using Origin 2021 software (Originlab corporation, New York, NY, USA) and Excel 2013 (Microsoft corporation, Redmond, WA, USA). A statistical analysis was conducted, including a Pearson correlation coefficient (PCC) analysis, and two significance levels of 0.05 and 0.001 were used in the statistics.

3. Results and Discussion

3.1. Variation of Particle Matter (PM), Heavy Metal Elements, and PAHs in PM1.1 and PM2.0

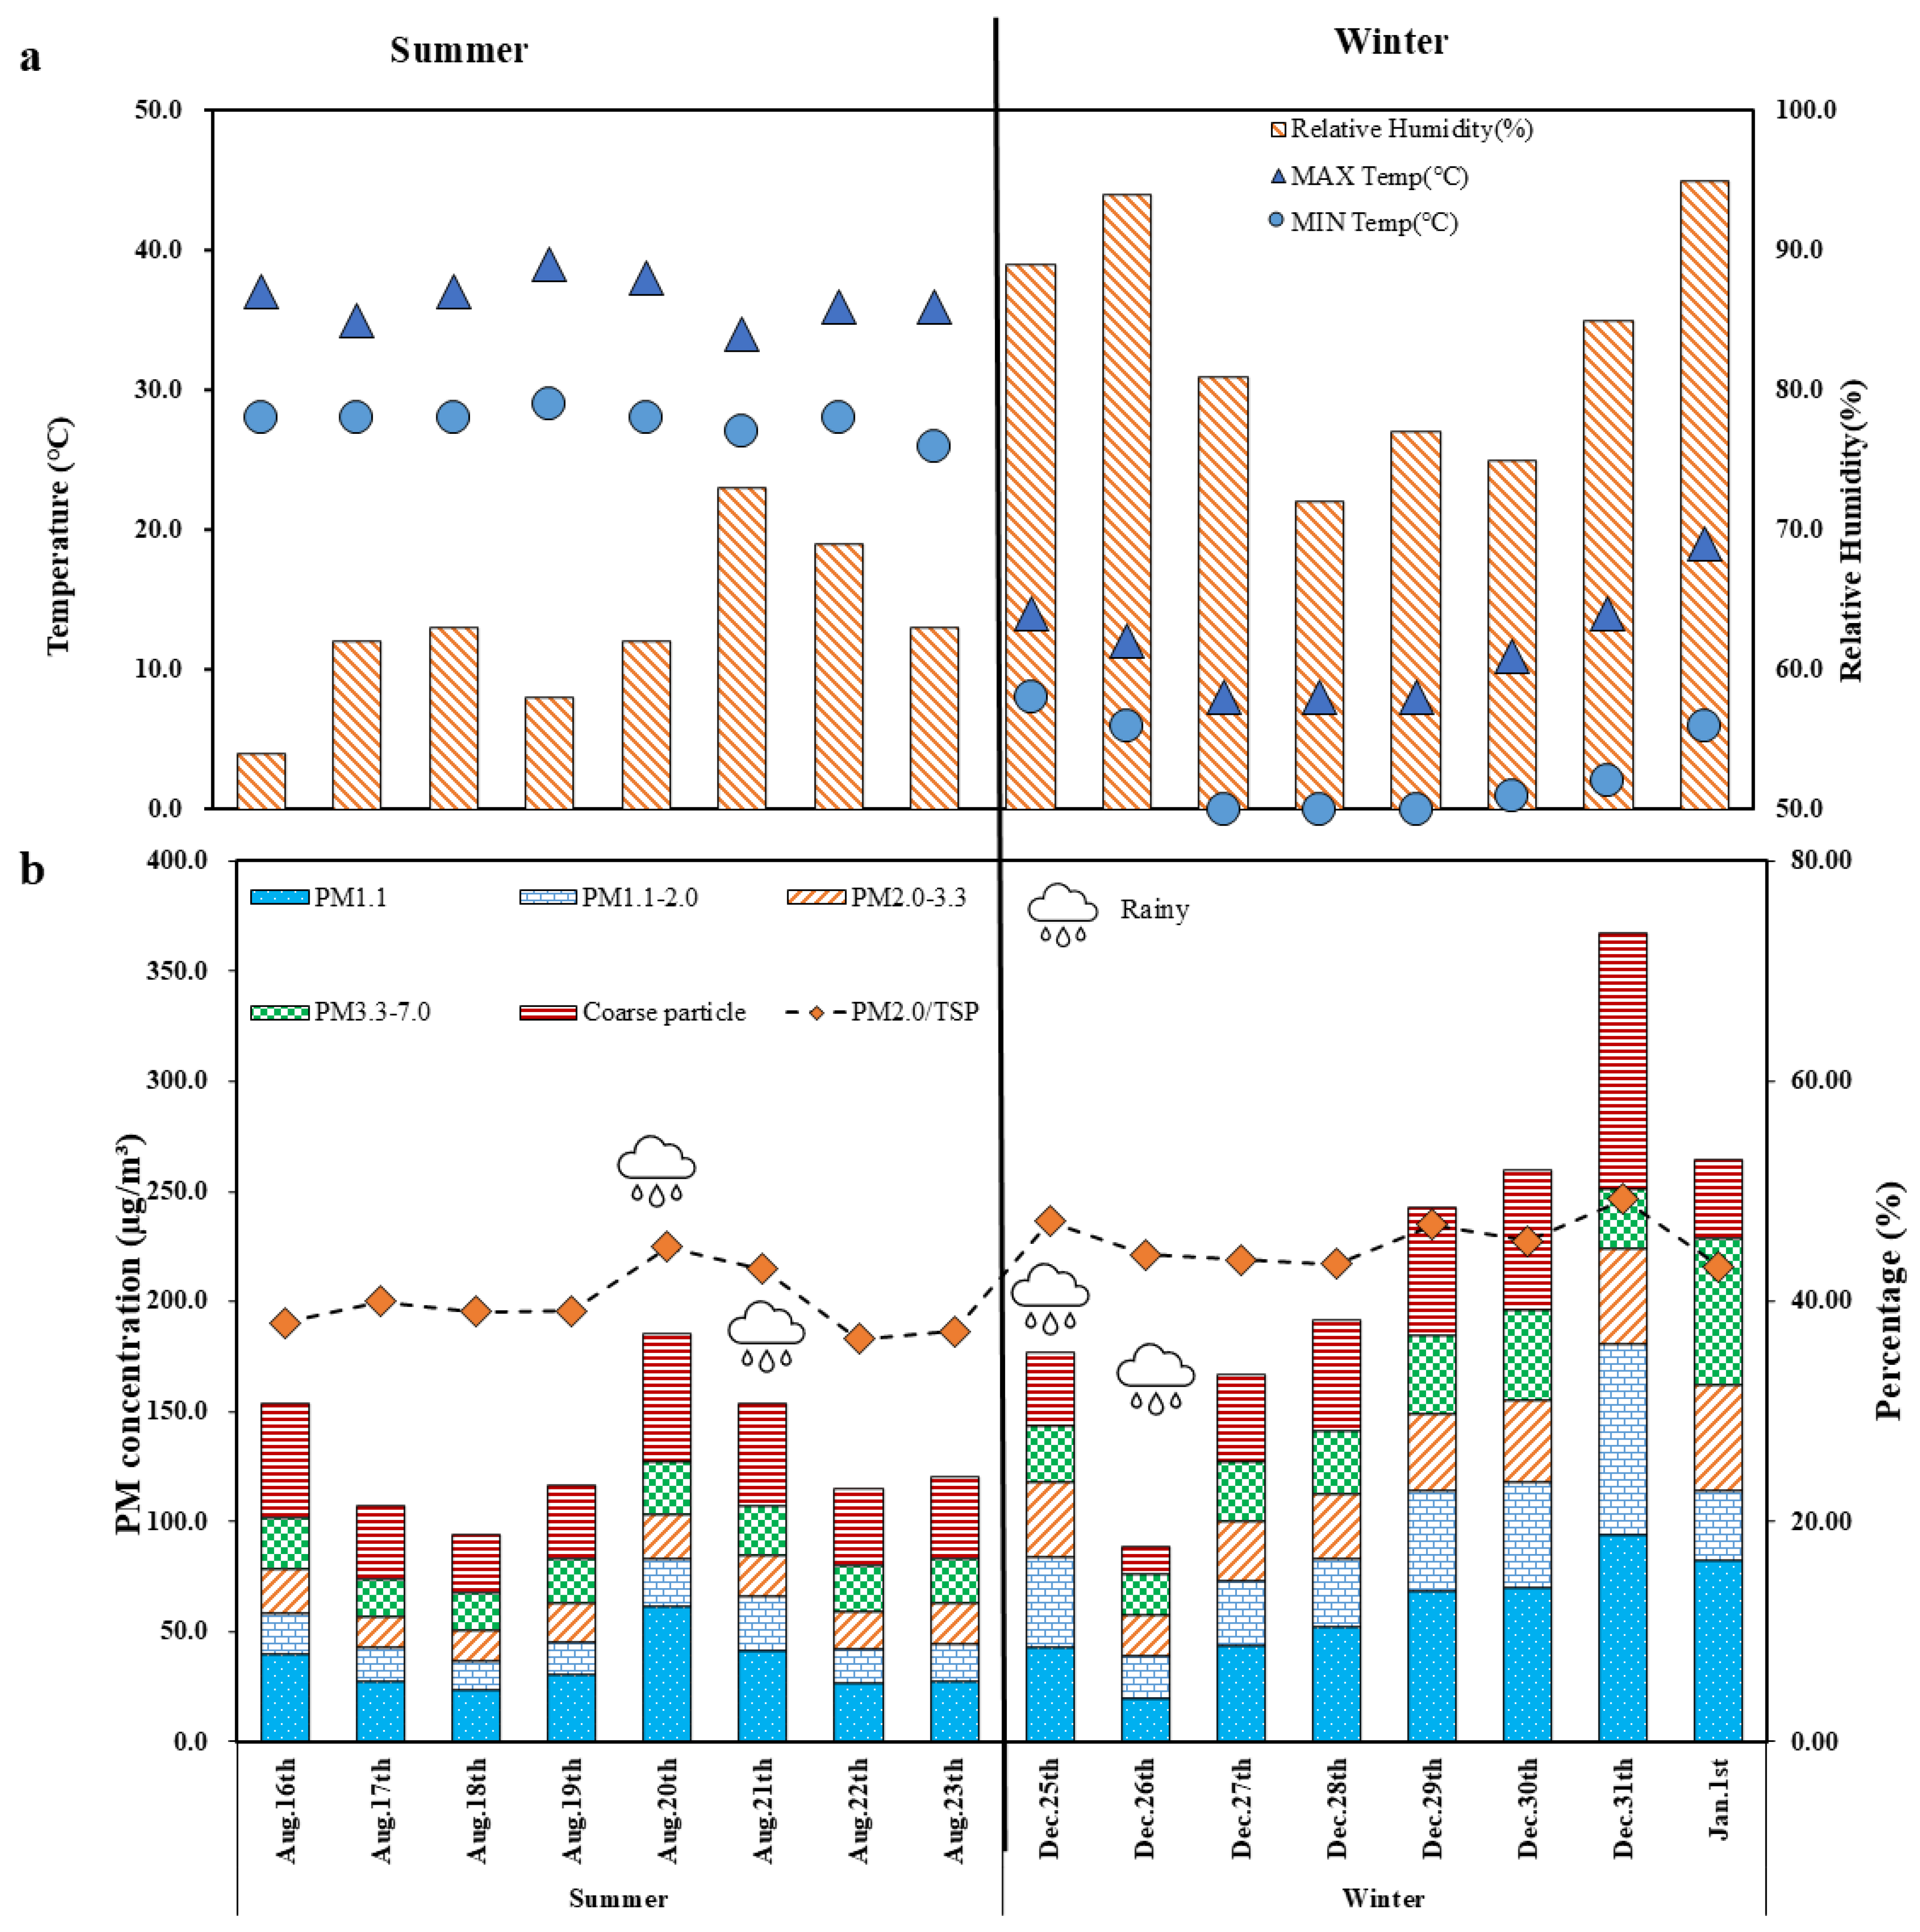
3.1.1. PM in PM1.1 and PM2.0

Generally, atmospheric fine particles (such as PM1.1 and PM1.0) have received more attention due to their association with increased in pneumonia hospitalizations and complex chemical compositions [29]. In this study, mass concentrations of ambient particles during summer and winter are shown in Figure 2b and Table S1. It could be found that mass concentrations of PM2.0 (PM1.1 + PM1.1–2.0) were about 52.53µg/m3 (36.88–83.35 µg/m3) during summer, while they were about 100.74 µg/m3 (39.05–180.92 µg/m3) during winter. Meanwhile, Table 4 shows that the ratio of PM2.0/TSP (total suspended particles) were about 40.1% (37.3–44.9%) in summer and 45.8% (43.4–49.3%) in winter, indicating that these fine particles accounted for main proportion of TSP. In PM2.0, PM1.1 accounted for 66.4% (61.4–74.2%) in summer and 58.7% (50.2–72.5%) in winter. PCC results between PM1.1 and other four particle sizes were 0.81 (PM1.1-PM1.1–2.0, p < 0.05), 0.88 (PM1.1-PM2.0–3.3, p < 0.05), 0.88 (PM1.1-PM3.3–7.0, p < 0.05), and 0.78 (PM1.1-coarse particles, p < 0.05), indicating a strong association between PM1.1 and other size fractions, especially for PM2.0. PCC result between PM1.1 and temperature was about −0.52 (p < 0.05), which indicated that the generation of these particle could get the negative effect from temperature. Coincidentally, Table 4 also shows several studies focused on the size distribution of ambient particles. It is obvious to find that PM1.0/PM2.5 was over 0.50 in the sampling sites in Algeria, Korea, India, Vietnam, and China, indicating that PM1.0 is the main component of PM2.5 [29,30,31,32,33,34]. This mass distribution of PM1.1 and PM2.0 in this mining industrial city could be considered consistent with that in other megacities. Moreover, particles have many complex chemical compounds, such as ionic, metal, and organic compounds [23,27,33]. Herein, heavy elements and PAHs with a potentially healthy effect are as the target ingredient to analyze their size distributions and variations.

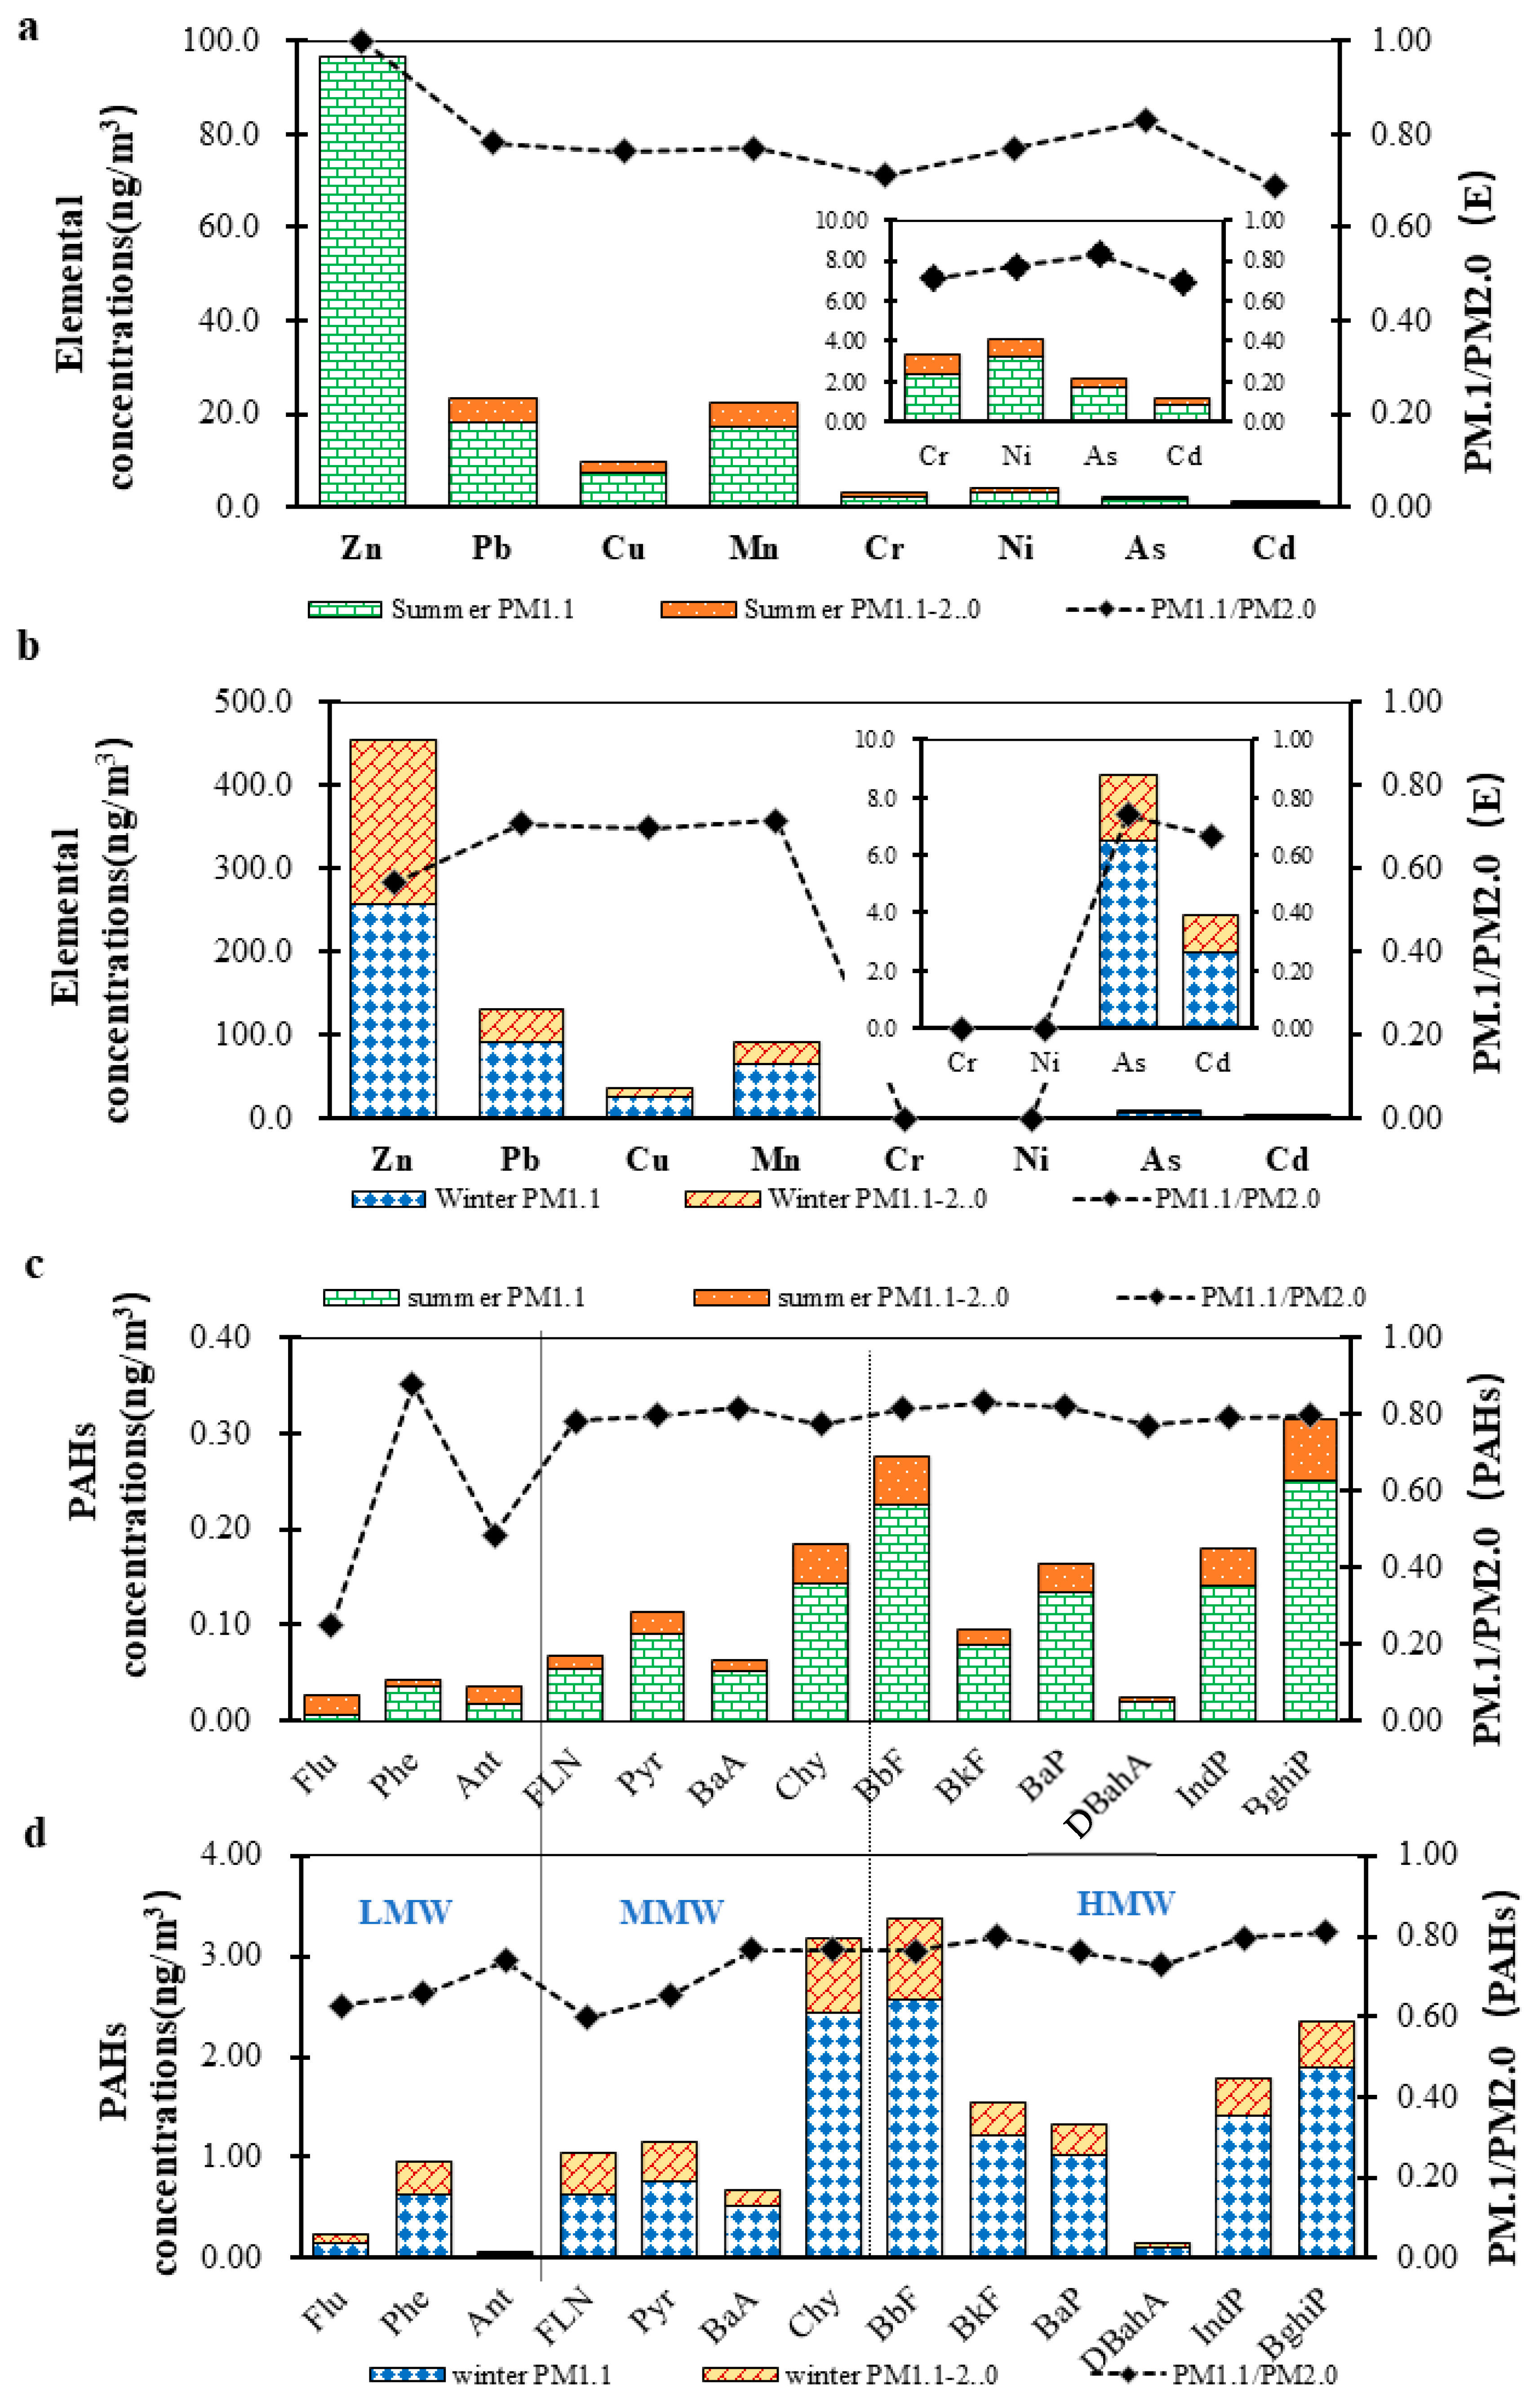
3.1.2. Heavy Metal Elements (HMEs)

Size distribution of HMEs, including Cr, Mn, Ni, Cu, Zn, As, Cd, and Pb, are displayed in Figure 3a,b and Tables S2 and S3. It shows that the mass concentrations of heavy metal elements in PM2.0 were about 162.8 ng/m3 in summer and 724.7 ng/m3 in winter, whereas the mass concentrations of HMEs in PM1.1 were about 147.6 ng/m3 in summer and 448.4 ng/m3 in winter, with higher enrichment of each HME in PM1.1. In summer, about 90.6% of HMEs were found to be in PM1.1, in the order of Zn > 50 ng/m3 > Pb > Mn > 10 ng/m3 > Cu > Ni > Cr > As > Cd. In winter, about 61.9% of HMEs were found to be in PM1.1, with major contributions from the Zn, Pb, and Mn components (Zn > 200 ng/m3 > Fe > 150 ng/m3> Pb >Mn > 50 ng/m3 > Cu). These elements (except for Cr and Ni) increased several times in winter, especially Pb, Mn, and Zn. In summer, 90.6% of the heavy metals within the PM2.0 size range were concentrated in particles smaller than 1.1 um, while in winter, this proportion was 61.9%. These values are notably higher than the corresponding PM1.1/PM2.0 mass ratios, indicating a preferential enrichment of heavy metals in finer particles.
Regarding each element in Figure 3a,b, it was found that Zn had the largest concentration in both summer (PM1.1, 96.4 ng/m3) and winter (PM1.1, 256.1 ng/m3; PM1.1–2.0, 197.5 ng/m3). Compared with the heavy metal contents in PM2.5 of Ningbo City, which is located in the Yangtze River Delta, with over 8 million people [35], it was found that the concentrations of Pb, Mn, As, and Cd in PM2.0 of Zhuji in winter were higher, whereas they were lower than those in summer. There is no doubt that the heavy metal elements accumulated more in PM1.1 than other sizes in both summer and winter. According to the atmospheric studies on Shanghai and Beijing area, it was also observed that the elemental contents in ambient particles were mainly associated with fine aerosol particles [27,34]. Analogical studies have reported that many areas have a higher mean concentration of metals in winter than in summer, such as in China, India, South Africa, and Italy [13,36,37].

3.1.3. PAHs

As shown in the results above, particulate matter and the majority of heavy metal elements were observed to accumulate predominantly in the PM1.1 size fraction [17,21]. Due to their widespread presence and well-documented health risks, PAHs were analyzed to evaluate their size distribution, potential anthropogenic sources, and associated health risks.
Figure 3c,d and Table S4 shows that Chy, BbF, BghiP, and IndP had higher concentrations than other kinds of PAHs during summer and winter. The TPAHs in PM2.0 (17.81 ng/m3) in winter were about ten times higher than in summer (1.59 ng/m3). Over 75% of PAHs were accumulated in PM1.1 during both summer and winter. It should be noted that the average concentration of BaP in PM1.1 was about 1.01 ng/m3, which was over the WHO standard (1 ng/m3) [16,33]. Similarly to the HMEs, the amounts and proportions of PAHs were more obviously enriched in PM1.1. This PAH enrichment phenomenon in PM1.1 was also found in a study of 12 sites in China [38]. Moreover, PAH enrichment in PM1.1 of Shanghai was found during spring, summer, and winter [16]. Lao et al. reported that PAHs were greater in PM1.8 than in particles over 1.8 µm [39]. It was evident that particles, toxic elements, and PAHs accumulated more in winter, and were more dominant in PM1.1.
The predominance of BaP and BghiP in fine particles during winter further emphasizes the potential for enhanced toxicological impacts due to their carcinogenic nature and higher alveolar deposition efficiency. These findings underscore the significant influence of seasonal atmospheric dynamics and anthropogenic activities on PAH profiles and associated health risks.

3.2. Health Risk Assessment of HMEs and PAHs in PM1.1

HMEs and PAHs in the atmosphere have been identified as compounds posing potential health risks through inhalation, ingestion, and dermal exposure routes [23,27]. Herein, Cr, Ni, Cu, Zn, As, Cd, Pb, and Mn as typical HMEs group were evaluated for non-carcinogenic risks via inhalation route. Simultaneously, HMEs (Cr, Ni, As, Cd, and Pb) and the PAH group (BaPeq) were assessed for carcinogenic risks [7,13,39].

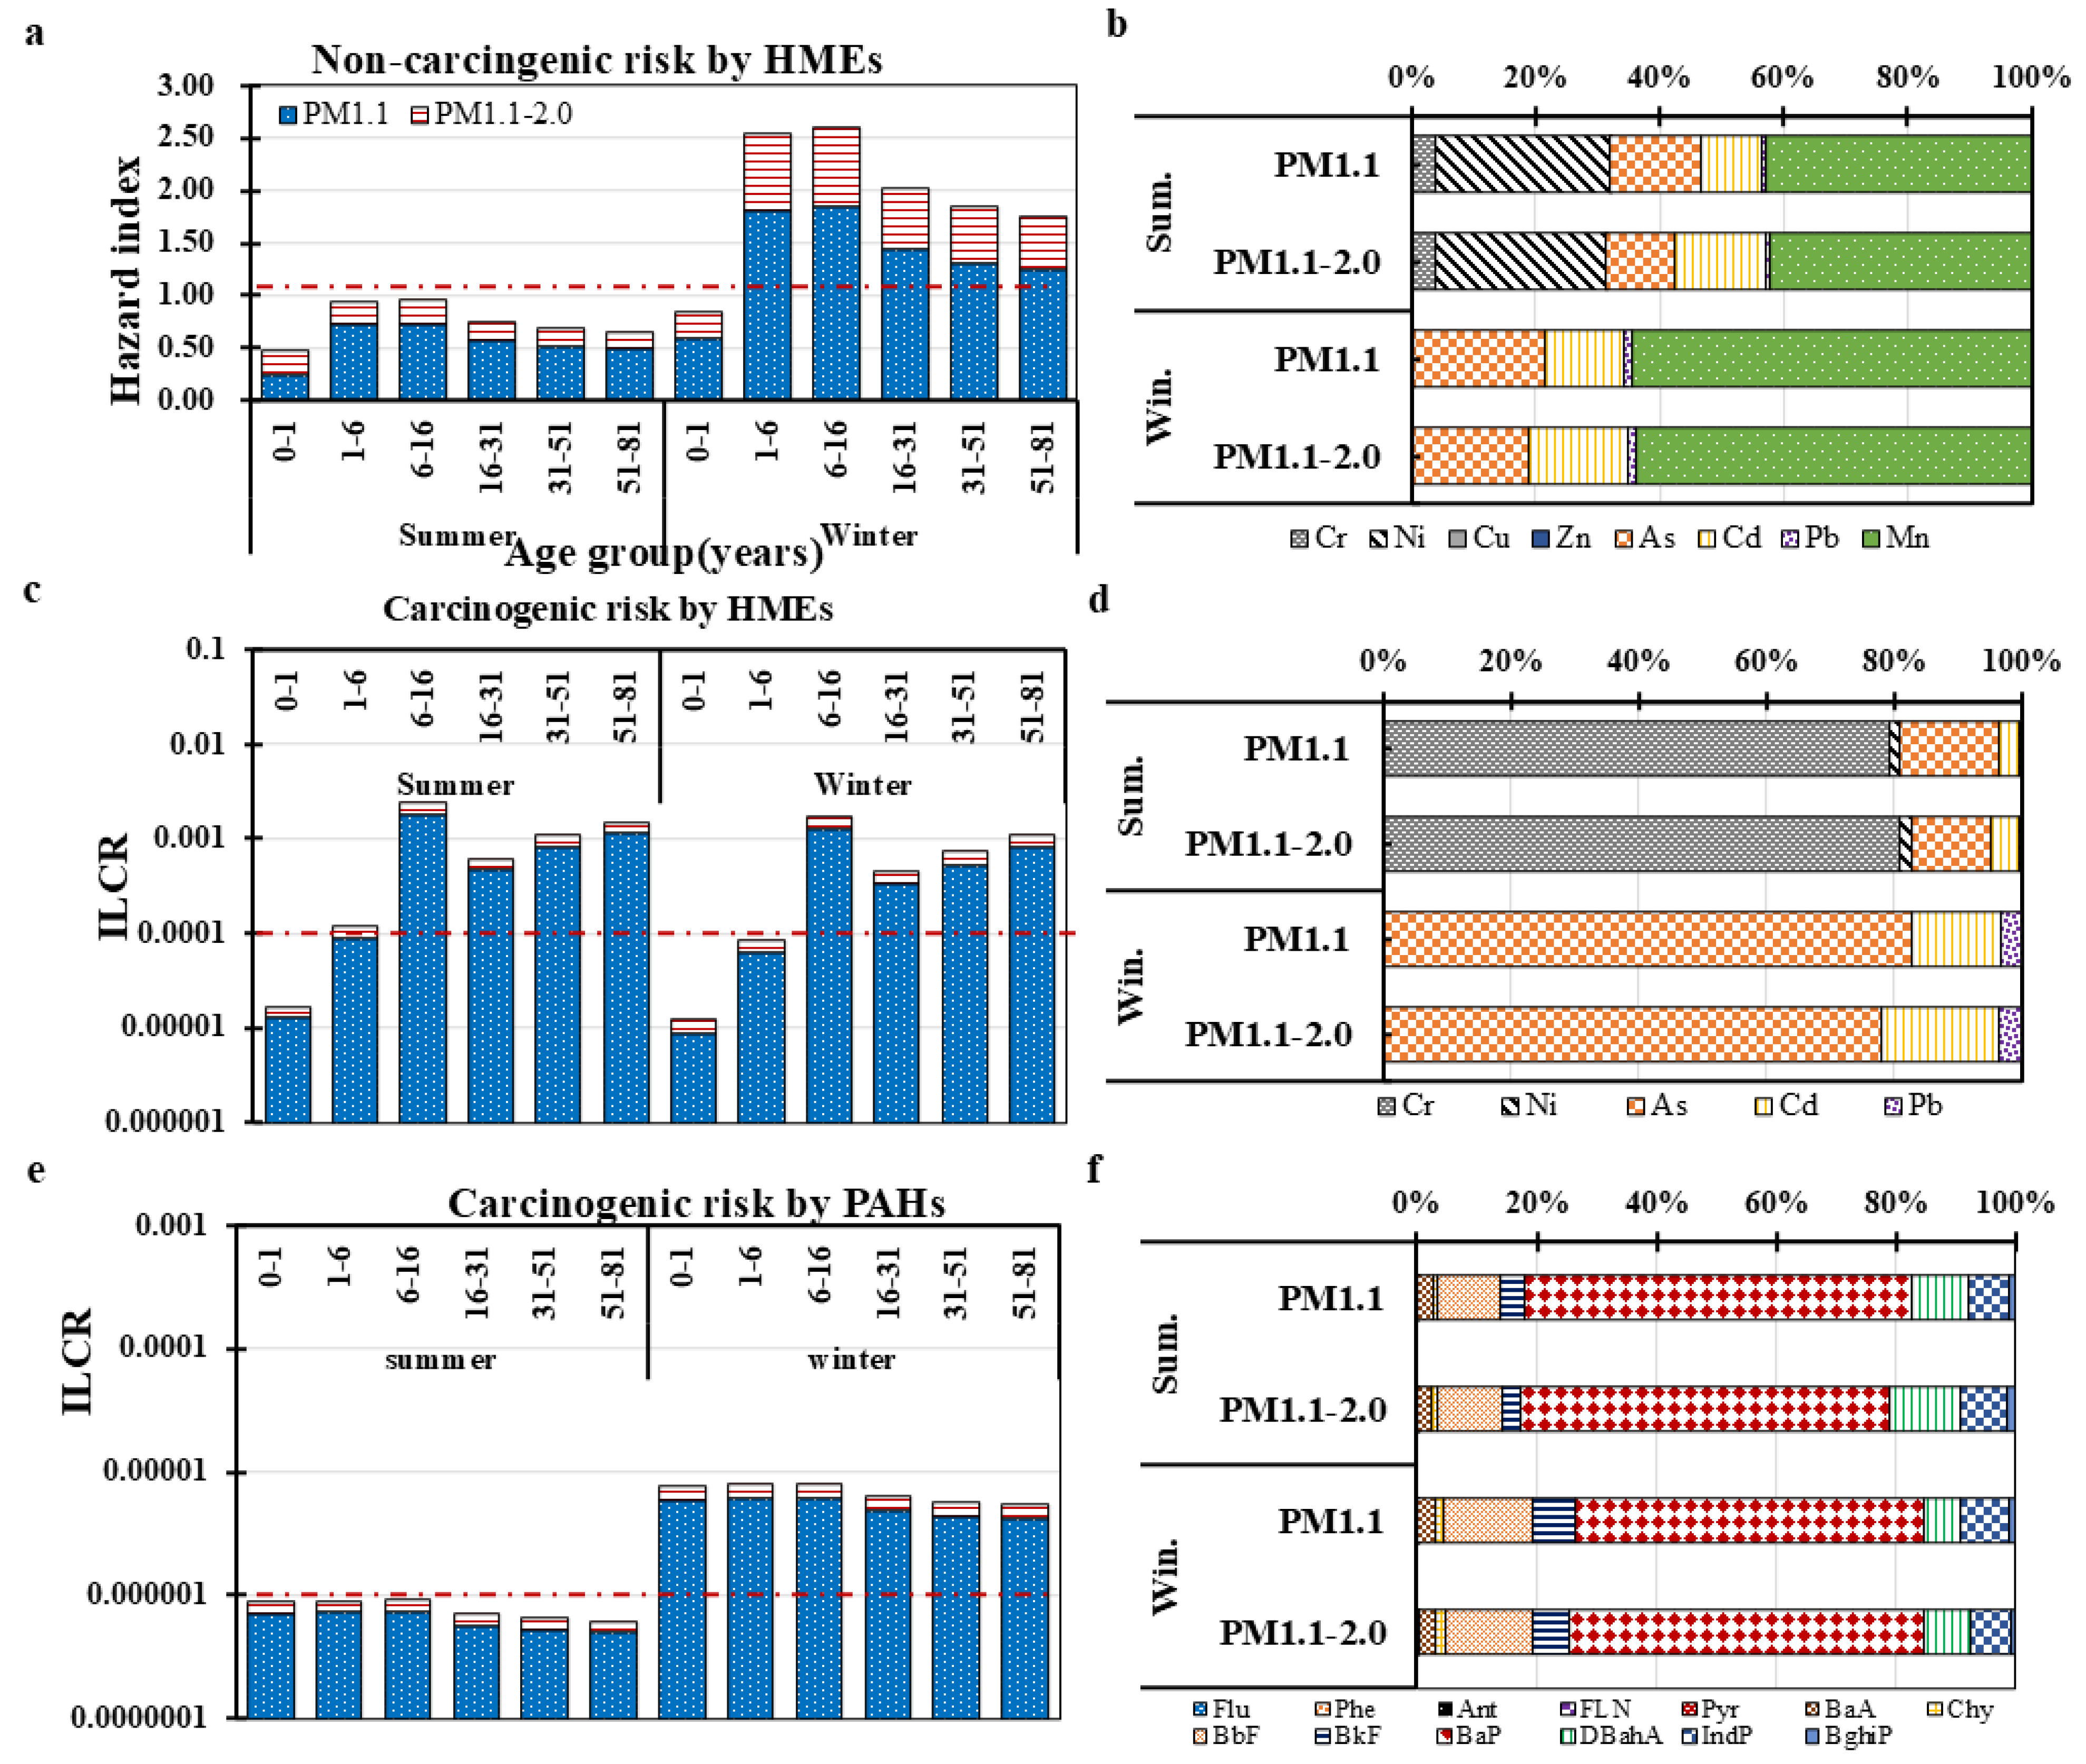
3.2.1. Non-Carcinogenic Risk Assessment of HMEs

The HI values for six age groups, evaluated based on toxic elements in PM1.1, are presented in Figure 4a,b and Table S5. It is easy to find that the HI values of these total six age groups during summer were below 1.00, indicating no significant risk of chronic effects from these toxic elements. For HMEs in winter, the HI values exceeded 1.0 in all age groups except the 0–1 age group, with the following values: 1.85 for the 6–16 age group, 1.82 for the 1–6 age group, 1.44 for the 16–31 age group, 1.32 for the 31–51 age group, and 1.25 for the 51–81 age group. This indicates that these HME element in PM1.0 could have severe health effects on the residents of these age groups, especially for children (the 1–6 age group) and adolescents (the 6–16 age group). Figure 4b also shows that the HQ values of Mn and Ni in summer were notably high, contributing 43.0% and 28.0% of the total HI, respectively. In winter, the contributions followed the order Mn (approximately 39.0%) >> As > Cd > Pb. Notably, the HQ values of Mn exceeded 1.00 in the 1–6 and 6–16 age groups during winter, indicating that Mn posed the highest non-carcinogenic risk.

3.2.2. Carcinogenic Risk Assessment of HMEs and PAHs

ILCR posed by the inhalation route of HMEs (Cr, Ni, As, Cd, and Pb) and PAHs was evaluated among the six age groups, and the results are shown in Figure 4c–f and Tables S6 and S7. Figure 4c shows that the ILCRₑ values for all six age groups exceeded 1.0 × 10⁻⁶ during both summer and winter. For the four age groups of 6–16, 16–31, 31–51, and 51–81 years, the ILCRₑ values surpassed the acceptable threshold of 1.0 × 10⁻⁴ in both seasons, indicating a significantly elevated carcinogenic risk associated with these elements. In contrast, the 0–1 and 1–6 age groups had ILCRₑ values within the acceptable range (between 1.0 × 10⁻⁶ and 1.0 × 10⁻⁴). Figure 4d further indicates that the ILCRₑ values for individual elements were all above 1.0 × 10⁻⁶, following the order Cr > As > Cd > Ni. These results highlight the substantial carcinogenic risks posed by these HMEs.
For PAHs, the ILCRPAHs values among each of the six age groups, as shown in Figure 4e,f were over 1.0 × 10⁻⁶ during winter, whereas they were below 1.0 × 10⁻⁶ during summer. During winter, the ILCRPAHs values of the six age groups were between 1.0 × 10⁻⁶ and 1.0 × 10⁻⁵, indicating that several people out of millions might develop cancer via the inhalation of PAHs during their lifetime. Regarding each PAH, the ILCR values of BaP among the six age groups were over 1.0 during winter. BaP could be considered the most significant carcinogenic PAH. In addition, BkF, BbF, IndP, and BkF, all of which belong to the so-called COMB PAH group [7,8,11,17,40], made a great contribution to ILCR. Furthermore, due to these HMEs and PAHs coexisting in fine particles, the potential health risk might be more severe than that calculated here.

3.3. Assessment of Potential Sources of HMEs and PAHs in PM1.1

3.3.1. Assessment of Potential Sources of HMEs

The crustal enrichment factor (EF) is commonly used to distinguish whether an element originates from natural or anthropogenic sources [5,28,35,41]. As shown in Table 2, the EF values of elements in PM1.1 were ranked as follows: Cd > 1000 > Zn > Pb > 100 > As > Cu > Ni > 10 during summer, and Cd > Pb > 1000 > Zn > As > Cu > 100 > Mn > 10 during winter. These high EF values, particularly in winter, suggest that the listed elements likely originate from anthropogenic sources. To further identify potential emission sources, PCA analysis was conducted using the toxic elements as input variables. The loadings and the percentage of variance explained for each component are also presented in Table 5. In summer, three principal components accounted for 93.3% of the total variance in PM1.1. Factor 1 (F1) explained 54.4% of the variance and was mainly influenced by Cu, Zn, As, Cd, and Pb. The EF values of Zn, Cd, and Pb exceeded 50, indicating strong enrichment from anthropogenic sources. PCCs (Table 6) showed significant correlations among these elements (e.g., Cu–Zn: 0.61, As–Zn: 0.93, Cu–Cd: 0.76, Cu–Pb: 0.67, Cd–Pb: 0.62; all p < 0.05), suggesting a common source. As and Pb are commonly associated with coal combustion used in steel and metallurgical industries [25,36], while Cd is a typical byproduct of metallurgical processes [28,36]. Cu and Zn are primarily attributed to traffic-related emissions, such as diesel exhaust, brake wear, and tire abrasion [28,36]. Therefore, F1 likely represents industrial sources, including steel production and vehicular emissions. Factor 2 (F2), accounting for 25.0% of the total variance, was characterized by high loadings of Cr and Ni. A strong correlation between Cr and Ni (r = 0.88, p < 0.05) suggests a shared source, likely emissions from stainless steel manufacturing [10,36]. Factor 3 (F3), which explained 13.8% of the variance, was dominated by Mn, a known indicator of coal combustion [12,35,42], thus suggesting coal combustion as its primary source.
In winter, only two principal components were identified, explaining 93.7% of the total variance. F1, accounting for 82.0%, was influenced by Cu, Zn, As, Cd, and Pb, with strong correlations (e.g., Cu–Zn: 0.81, Cu–Cd: 0.75, Cu–Pb: 0.80; all p < 0.05) and high EF values for these elements. These results indicate that F1 also represents industrial sources, similarly to summer. F2, contributing 11.7% of the variance, was likely associated with coal combustion. Overall, the sources of heavy metal elements in PM1.1 were relatively consistent across seasons, mainly stemming from industrial activities and transportation. The absence of Cr and Ni in PM1.1 during winter suggests they may be linked to seasonal or short-term industrial activities.

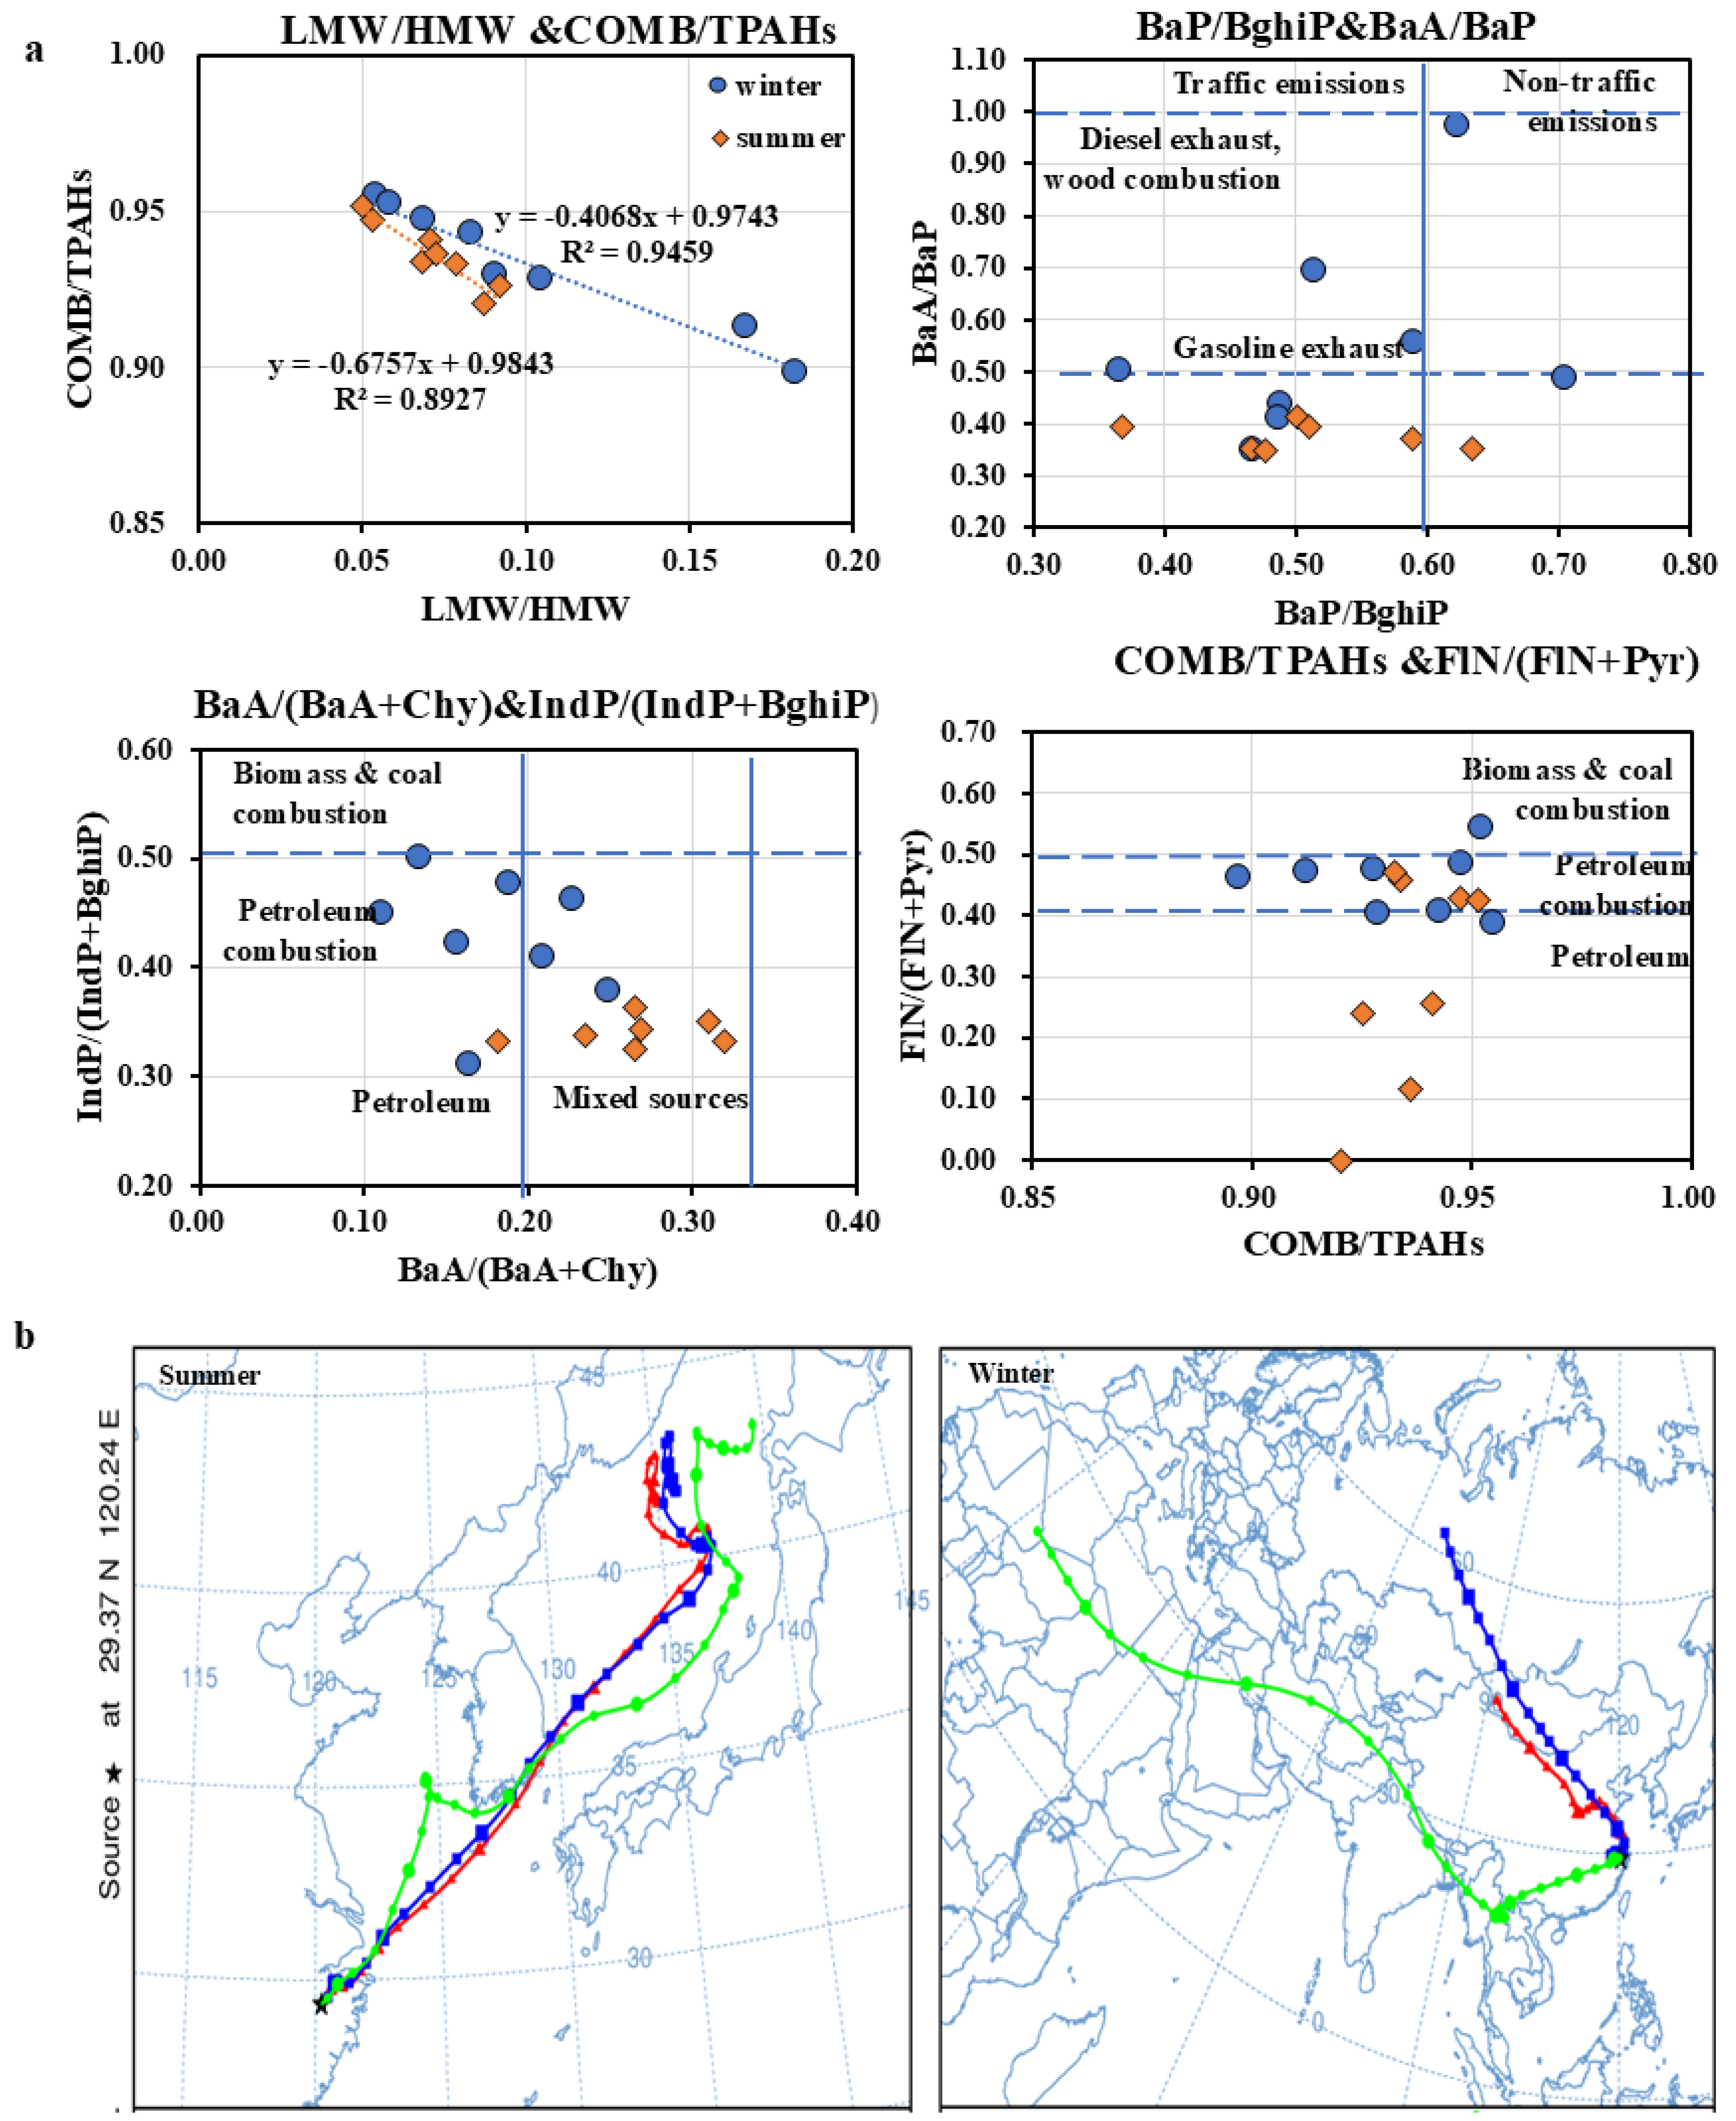
3.3.2. Assessment of Potential Sources of PAHs

Based on molecular weights, these 13 identified PAHs can be categorized into three groups: low-molecular-weight (LMW) PAHs, consisting of 2–3-ring compounds such as Flu, Phe, Ant; medium-molecular-weight (MMW) PAHs, composed of 4-ring compounds, including FLN, Pyr, BaA, and Chy; and HMW PAHs, which are typically particle-bound compounds, such as BbF, BkF, BaP, DBahA, IndP, and BghiP [5,39]. Figure 3c,d shows that in summer, approximately 58.4% of LMW, 78.8% of MMW, and 80.7% of HMW PAHs were associated with PM1.1. In winter, the proportions were 65.7% (LMW), 71.6% (MMW), and 78.4% (HMW), respectively. MMW and HMW PAHs were more concentrated in PM1.1, particularly during the winter season. To further identify PAH sources in PM1.1, several diagnostic ratios were employed: combustion-PAHs(COMB)/TPAHs, FLN/(FLN + Pyr), BaA/BaP, BaP/BghiP, BaA/(BaA + Chy), and IndP/(IndP + BghiP)[5,29]. The LMW/HMW ratio is commonly used to distinguish between petrogenic and pyrogenic sources [17,40]. COMB PAHs, including FLN, Pyr, BaA, Chy, BbF, BkF, BaP, IndP, and BghiP, are typically associated with combustion processes such as coal, petroleum, and diesel burning [18].
As shown in Figure 5a, the LMW/HMW ratios in PM1.1 were low (0.05–0.09 in summer; 0.05–0.17 in winter), while COMB/TPAHs ratios were high (0.92–0.95 in summer; 0.90–0.96 in winter), indicating that combustion processes were the dominant source of PAHs. Additionally, the BaP/BghiP ratio in summer was consistently below 0.60, and the BaA/BaP ratio was below 0.50, suggesting a predominant contribution from traffic-related petroleum combustion. In winter, higher values of IndP/(IndP + BghiP) and FLN/(FLN + Pyr) suggested the influence of both traffic emissions and coal combustion.
To assess long-range transport, backward air mass trajectories during the sampling periods are presented in Figure 5b. In summer, air masses originated from the northeastern marine region, likely affected by emissions from busy shipping activity in the Yellow Sea. In winter, air masses predominantly arrived from northwestern inland regions, where coal combustion is prevalent. These pollutants may have reached Zhuji via long-range atmospheric transport [5,13,21]. Overall, combustion activities—including vehicle emissions, industrial fuel combustion, and coal burning—were the dominant sources of PAHs in PM1.1 during both summer and winter.

4. Conclusions

To the best of our knowledge, this is the first systematic investigation of atmospheric pollution in Zhuji, a representative city with intensive copper-processing industries in China. This study concentrates on the seasonal variations (summer and winter), source apportionment, and health risk assessment of heavy metals and PAHs in ambient PM1.1. The main findings are summarized as follows:
Heavy metals and PAHs showed higher accumulation in PM1.1 than in larger particle fractions. PM1.1/PM2.0 ratios (summer: 0.664; winter: 0.587) indicate that PM1.1 dominates the fine particle fraction. Seasonal variation was pronounced, with winter concentrations of heavy metals and PAHs being 3.04 and 10.6 times higher, respectively, than in summer.
Non-carcinogenic risk was observed in all age groups except infants during winter, with Mn showing the highest risk. ILCR values for four age groups (6–16, 16–31, 31–51, 51–81) exceeded 1.0 × 10⁻⁴, indicating a high lifetime cancer risk from exposure to Cr, Ni, As, Cd, and Pb.
PAHs in winter also posed carcinogenic risks, with ILCR values exceeding 1.0 × 10⁻⁶ for all age groups. BaP was identified as the most critical carcinogen, along with BkF, BbF, and IndP.
Source apportionment analysis revealed that heavy metals predominantly originated from steel production and vehicle emissions. PAHs were mainly derived from combustion sources, especially traffic and coal combustion. Backward trajectory analysis further supported the influence of long-range transport during winter.
Overall, these findings underscore the urgent need for implementing effective emission control measures and enhancing environmental monitoring in industrial cities such as Zhuji. Although some limitations exist in this study, we hope that the insights provided help raise awareness of the environmental challenges faced by small- and medium-sized industrial cities and promote further research. Future work may include approaches such as social survey-based investigations to better understand the health impacts of air pollution on local residents.

Supplementary Materials

The following supporting information can be downloaded at: https://www.mdpi.com/article/10.3390/atmos16060674/s1, Table S1. Meteorological factors and particle concentrations of each sampling case during summer and winter. Table S2. Mass concentrations of each toxic element in PM1.1 and PM1.1–2.0 during each summer sampling period. Table S3. Mass concentrations of each toxic element in PM1.1 and PM1.1–2.0 during each winter sampling period. Table S4. Mass concentrations of each PAH in PM1.1 during each sampling period. Table S5. HQ values of 6 age groups for each toxic element in PM1.1. Table S6. ILCR values of 6 age groups for each toxic element in PM1.1. Table S7. ILCR value of 6 age groups for each PAH in PM1.1.

Author Contributions

Conceptualization, W.W. and J.R.; methodology, W.W. and J.R.; software, W.W. and J.R.; validation, W.W.; formal analysis, J.R.; investigation, W.W., J.R. and Q.W.; resources, Q.W.; data curation, W.W. and J.R.; writing—original draft preparation, W.W.; writing—review and editing, W.W., J.R. and Q.W.; visualization, W.W.; supervision, Q.W.; project administration, Q.W., W.W.; funding acquisition, Q.W. and W.W. All authors have read and agreed to the published version of the manuscript.

Funding

This study was partially supported by Basic Research (B) (No. 18H03384), Grant-in-Aid for Early-Career Scientists (No. 24K20941, 22K18040) of Japanese Ministry of Education, Culture, Sports, Science and Technology (MEXT).

Institutional Review Board Statement

Not applicable.

Informed Consent Statement

Not applicable.

Data Availability Statement

The original contributions presented in this study are included in the article/Supplementary Materials. Further inquiries can be directed to the corresponding author(s).

Acknowledgments

We would like to express gratitude to LU lab, Shanghai University, who helped with our sampling work.

Conflicts of Interest

The authors declare no conflicts of interest.

Abbreviations

The following abbreviations are used in this manuscript:
ACEAcenaphthene
ACYAcenaphthylene
ATAveraging Time
AntAnthracene
AsArsenic
BWBody Weight
BaABenzo[a]anthracene
BaPBenzo[a]pyrene
BaPeqBenzo[a]pyrene equivalent concentration
BbFBenzo[b]fluoranthene
BghiPBenzo[ghi]perylene
BkFBenzo[k]fluoranthene
CAConcentration of Ambient pollutant
CdCadmium
ChyChrysene
CrChromium
CuCopper
DBahADibenz[a,h]anthracene
EDExposure Duration
EFEnrichment Factor
EF (exposure)Exposure Frequency
ETExposure Time
FLNFluoranthene
FeIron
FluFluorene
GC-MSGas Chromatography–Mass Spectrometry
HIHazard Index
HQHazard Quotient
HYSPLITHybrid Single-Particle Lagrangian Integrated Trajectory
ICP-MSInductively Coupled Plasma–Mass Spectrometry
ICRFInhalation Cancer Risk Factor
ILCRIncremental Lifetime Cancer Risk
IndPIndeno [1,2,3-cd]pyrene
InhRInhalation Rate
MnManganese
NAPNaphthalene
NiNickel
PAHsPolycyclic Aromatic Hydrocarbons
PCAPrincipal Component Analysis
PMParticulate Matter
PM1.1Particulate Matter with aerodynamic diameter less than 1.1 μm
PM2.0Particulate Matter with aerodynamic diameter less than 2.0 μm
PbLead
PhePhenanthrene
PyrPyrene
RfCReference Concentration
TEFToxic Equivalency Factor
TSPTotal Suspended Particles
USEPAUnited States Environmental Protection Agency
ZnZinc

References

  1. Government, Z. Zhuji Government Portal. Available online: https://www.zhuji.gov.cn/art/2022/3/31/art_1370457_10845821.html (accessed on 20 March 2022).
  2. Wikipedia. Zhuji. Available online: https://en.wikipedia.org/wiki/Zhuji (accessed on 20 March 2022).
  3. Wesu Ndilila, A.C.C.; McGregor, L.A.; Kalin, R.M.; Hinwood, A.L. Environmental and toenail metals concentrations in copper mining and nonmining communities in Zambia. Int. J. Hyg. Environ. Health 2014, 217, 62–69. [Google Scholar] [CrossRef] [PubMed]
  4. Chen, S. Heavy metal Pollution in China: Origin, Pattern and Control. Environ. Sci. Pollut. Res. 2003, 10, 192–198. [Google Scholar] [CrossRef]
  5. Wang, Q.; Wang, W. Size characteristics and health risks of inorganic species in PM(1.1) and PM(2.0) of Shanghai, China, in spring, 2017. Environ. Sci. Pollut. Res. Int. 2020, 27, 14690–14701. [Google Scholar] [CrossRef]
  6. Sun, H.; Li, J.; Mao, X. Heavy Metals’ Spatial Distribution Characteristics in a Copper Mining Area of Zhejiang Province. J. Geogr. Inf. Syst. 2012, 4, 46–54. [Google Scholar] [CrossRef]
  7. Hu, X.; Zhang, Y.; Ding, Z.; Wang, T.; Lian, H.; Sun, Y.; Wu, J. Bioaccessibility and health risk of arsenic and heavy metals (Cd, Co, Cr, Cu, Ni, Pb, Zn and Mn) in TSP and PM2.5 in Nanjing, China. Atmos. Environ. 2012, 57, 146–152. [Google Scholar] [CrossRef]
  8. Soleimani, M.; Amini, N.; Sadeghian, B.; Wang, D.; Fang, L. Heavy metals and their source identification in particulate matter (PM(2.5)) in Isfahan City, Iran. J. Environ. Sci. 2018, 72, 166–175. [Google Scholar] [CrossRef]
  9. Wang, K.; Wang, W.; Li, L.; Li, J.; Wei, L.; Chi, W.; Hong, L.; Zhao, Q.; Jiang, J. Seasonal concentration distribution of PM1.0 and PM2.5 and a risk assessment of bound trace metals in Harbin, China: Effect of the species distribution of heavy metals and heat supply. Sci. Rep. 2020, 10, 8160. [Google Scholar] [CrossRef]
  10. Wu, Y.; Lu, B.; Zhu, X.; Wang, A.; Yang, M.; Gu, S.; Wang, X.; Leng, P.; Zierold, K.M.; Li, X.; et al. Seasonal Variations, Source Apportionment, and Health Risk Assessment of Heavy Metals in PM2.5 in Ningbo, China. Aerosol Air Qual. Res. 2019, 19, 2083–2092. [Google Scholar] [CrossRef]
  11. Talbi, A.; Kerchich, Y.; Kerbachi, R.; Boughedaoui, M. Assessment of annual air pollution levels with PM1, PM2.5, PM10 and associated heavy metals in Algiers, Algeria. Environ. Pollut. 2018, 232, 252–263. [Google Scholar] [CrossRef]
  12. Zhao, X.L.; Jiang, G.G.; Song, Z.L.; Touseef, B.; Zhao, X.Y.; Huang, Y.Y.; Guo, M.; Bharti, B. Concentrations of heavy metals in PM2.5 and health risk assessment around Chinese New Year in Dalian, China. Open Geosci. 2021, 13, 1366–1374. [Google Scholar] [CrossRef]
  13. Jiang, N.; Guo, Y.; Wang, Q.; Kang, P.; Zhang, R.; Tang, X. Chemical Composition Characteristics of PM2.5 in Three Cities in Henan, Central China. Aerosol Air Qual. Res. 2017, 17, 2367–2380. [Google Scholar] [CrossRef]
  14. Pradosh Roy, A.S. Metabolism and toxicity of arsenic: A carcinogen. Curr. Sci. 2002, 82, 38–45. [Google Scholar]
  15. Badal Kumar Mandal, K.T.S. Arsenic round the world: A review. Talanta 2002, 58, 201–235. [Google Scholar] [CrossRef]
  16. Wang, W.; Wang, Q.; Nakajima, D.; Lu, S.; Xiao, K.; Chowdhury, T.; Suzuki, M.; Liu, F. Industrial Source Contributions and Health Risk Assessment of Fine Particle-Bound Polycyclic Aromatic Hydrocarbons (PAHs) during Spring and Late Summer in the Baoshan Area, Shanghai. Processes 2021, 9, 2016. [Google Scholar] [CrossRef]
  17. Aslam, R.; Sharif, F.; Baqar, M.; Shahzad, L. Source identification and risk assessment of polycyclic aromatic hydrocarbons (PAHs) in air and dust samples of Lahore City. Sci. Rep. 2022, 12, 2459. [Google Scholar] [CrossRef]
  18. Bulejko, P.; Adamec, V.; Schullerova, B.; Skeril, R. Levels, sources, and health risk assessment of polycyclic aromatic hydrocarbons in Brno, Czech Republic: A 5-year study. Environ. Sci. Pollut. Res. Int. 2016, 23, 20462–20473. [Google Scholar] [CrossRef]
  19. Agudelo-Castaneda, D.M.; Teixeira, E.C.; Schneider, I.L.; Lara, S.R.; Silva, L.F.O. Exposure to polycyclic aromatic hydrocarbons in atmospheric PM(1.0) of urban environments: Carcinogenic and mutagenic respiratory health risk by age groups. Environ. Pollut. 2017, 224, 158–170. [Google Scholar] [CrossRef]
  20. ChooChuay, C.; Pongpiachan, S.; Tipmanee, D.; Deelaman, W.; Iadtem, N.; Suttinun, O.; Wang, Q.; Xing, L.; Li, G.; Han, Y.; et al. Effects of Agricultural Waste Burning on PM2.5-Bound Polycyclic Aromatic Hydrocarbons, Carbonaceous Compositions, and Water-Soluble Ionic Species in the Ambient Air of Chiang-Mai, Thailand. Polycycl. Aromat. Compd. 2020, 42, 749–770. [Google Scholar] [CrossRef]
  21. Jiang, N.; Duan, S.; Yu, X.; Zhang, R.; Wang, K. Comparative major components and health risks of toxic elements and polycyclic aromatic hydrocarbons of PM2.5 in winter and summer in Zhengzhou: Based on three-year data. Atmos. Res. 2018, 213, 173–184. [Google Scholar] [CrossRef]
  22. USEPA. Exposure Factors Handbook; USEPA: Washington, DC, USA, 2011.
  23. Nisbet, I.C.T.; LAGoy, P.K. Toxic Equivalency Factors(TEFs) for Polycyclic Aromatic Hydrocarbons(PAHs). Regul. Toxicol. Pharmacol. 1992, 16, 290–300. [Google Scholar] [CrossRef]
  24. Tianqihoubao. Tianqihoubao Zhuji. Available online: http://www.tianqihoubao.com/lishi/zhuji.html (accessed on 1 March 2017).
  25. Zhang, R.; Jing, J.; Tao, J.; Hsu, S.C.; Wang, G.; Cao, J.; Lee, C.S.L.; Zhu, L.; Chen, Z.; Zhao, Y.; et al. Chemical characterization and source apportionment of PM2.5 in Beijing: Seasonal perspective. Atmos. Chem. Phys. 2013, 13, 7053–7074. [Google Scholar] [CrossRef]
  26. Ravindra, K.; Sokhi, R.; Vangrieken, R. Atmospheric polycyclic aromatic hydrocarbons: Source attribution, emission factors and regulation. Atmos. Environ. 2008, 42, 2895–2921. [Google Scholar] [CrossRef]
  27. Fan, C.C.; Scott, A.J. Industrial Agglomeration and Development: A Survey of Spatial Economic Issues in East Asia and a Statistical Analysis of Chinese Regions. Econ. Geogr. 2009, 79, 295–319. [Google Scholar] [CrossRef]
  28. Wang, W.; Zhang, W.; Dong, S.; Yonemachi, S.; Lu, S.; Wang, Q. Characterization, Pollution Sources, and Health Risk of Ionic and Elemental Constituents in PM2.5 of Wuhan, Central China. Atmosphere 2020, 11, 760. [Google Scholar] [CrossRef]
  29. Katsoyiannis, A.; Terzi, E.; Cai, Q.Y. On the use of PAH molecular diagnostic ratios in sewage sludge for the understanding of the PAH sources. Is this use appropriate? Chemosphere 2007, 69, 1337–1339. [Google Scholar] [CrossRef] [PubMed]
  30. Cheng Kang Li, R.M.K. The use of polycyclic aromatic hydrocarbons as source signatures in receptor modeling. Atmos. Environ. 1993, 27, 523–532. [Google Scholar]
  31. Kappos, A.D.; Bruckmann, P.; Eikmann, T.; Englert, N.; Heinrich, U.; Höppe, P.; Koch, E.; Krause, G.H.M.; Kreyling, W.G.; Rauchfuss, K.; et al. Health effects of particles in ambient air. Int. J. Hyg. Environ. Health 2004, 207, 399–407. [Google Scholar] [CrossRef] [PubMed]
  32. Hien, P.D.; Bac, V.T.; Thinh, N.T.H.; Anh, H.L.; Thang, D.D.; Nghia, N.T. A Comparison Study of Chemical Compositions and Sources of PM1.0 and PM2.5 in Hanoi. Aerosol Air Qual. Res. 2021, 21, 210056. [Google Scholar] [CrossRef]
  33. Ministry of Ecology and Environment of People’s Republic of China. Ambient Air Quality Standards. 2016. Available online: https://english.mee.gov.cn/Resources/standards/Air_Environment/quality_standard1/201605/t20160511_337502.shtml (accessed on 8 May 2023).
  34. Deshmukh, D.K.; Deb, M.K.; Ying, I.T.; Mkoma, S.L. Water Soluble Ions in PM2.5 and PM1 Aerosols in Durg City, Chhattisgarh, India. Aerosol Air Qual. Res. 2011, 11, 696–708. [Google Scholar] [CrossRef]
  35. Chen, C.; Zhang, H.; Li, H.; Wu, N.; Zhang, Q. Chemical characteristics and source apportionment of ambient PM1.0 and PM2.5 in a polluted city in North China plain. Atmos. Environ. 2020, 242, 117867. [Google Scholar] [CrossRef]
  36. Zhang, N.; Cao, J.; Xu, H.; Zhu, C. Elemental compositions of PM2.5 and TSP in Lijiang, southeastern edge of Tibetan Plateau during pre-monsoon period. Particuology 2013, 11, 63–69. [Google Scholar] [CrossRef]
  37. Morakinyo, O.M.; Mukhola, M.S.; Mokgobu, M.I. Health Risk Analysis of Elemental Components of an Industrially Emitted Respirable Particulate Matter in an Urban Area. Int. J. Environ. Res. Public Health 2021, 18, 3653. [Google Scholar] [CrossRef]
  38. Yu, Q.; Ding, X.; He, Q.; Yang, W.; Zhu, M.; Li, S.; Zhang, R.; Shen, R.; Zhang, Y.; Bi, X.; et al. Nationwide increase of polycyclic aromatic hydrocarbons in ultrafine particles during winter over China revealed by size-segregated measurements. Atmos. Chem. Phys. 2020, 20, 14581–14595. [Google Scholar] [CrossRef]
  39. Lao, J.Y.; Wang, S.Q.; Chen, Y.Q.; Bao, L.J.; Lam, P.K.S.; Zeng, E.Y. Dermal exposure to particle-bound polycyclic aromatic hydrocarbons from barbecue fume as impacted by physicochemical conditions. Environ. Pollut. 2020, 260, 114080. [Google Scholar] [CrossRef] [PubMed]
  40. Hamid, N.; Syed, J.H.; Junaid, M.; Mahmood, A.; Li, J.; Zhang, G.; Malik, R.N. Elucidating the urban levels, sources and health risks of polycyclic aromatic hydrocarbons (PAHs) in Pakistan: Implications for changing energy demand. Sci. Total Environ. 2018, 619–620, 165–175. [Google Scholar] [CrossRef]
  41. Gao, P.; Lei, T.; Jia, L.; Song, Y.; Lin, N.; Du, Y.; Feng, Y.; Zhang, Z.; Cui, F. Exposure and health risk assessment of PM(2.5)-bound trace metals during winter in university campus in Northeast China. Sci. Total Environ. 2017, 576, 628–636. [Google Scholar] [CrossRef]
  42. Luo, L.; Bai, X.; Liu, S.; Wu, B.; Liu, W.; Lv, Y.; Guo, Z.; Lin, S.; Zhao, S.; Hao, Y.; et al. Fine particulate matter (PM(2.5)/PM(1.0)) in Beijing, China: Variations and chemical compositions as well as sources. J. Environ. Sci. China 2022, 121, 187–198. [Google Scholar] [CrossRef]
Figure 1. (ac) Geographic location of Zhuji City and the sampling site (Geographic location of the sampling sites (base map: Google Maps, modified by authors)); (d) Field setup and sampling conditions during the monitoring campaign.
Atmosphere 16 00674 g001
Figure 2. (a) Daily meteorological parameters (temperature, humidity); (b) PM concentration profiles during summer and winter campaigns.
Atmosphere 16 00674 g002
Figure 3. (a,b) Mass concentrations of each heavy metal in PM1.1 and their PM1.1/PM2.0 values during summer and winter; (c,d) Mass concentrations of PAHs in PM1.1 and their PM1.1/PM2.0 values during summer and winter.
Atmosphere 16 00674 g003
Figure 4. (a) Hazard quotient (HQ) values across six age groups for HMEs in PM1.1; (b) Contribution of individual elements to HI; (c) Incremental lifetime cancer risk (ILCR) across age groups for HMEs; (d) Elemental contributions to ILCR; (e) ILCR across age groups for PAHs; (f) PAH-specific contributions to ILCR.
Atmosphere 16 00674 g004
Figure 5. (a) Diagnostic ratios of PAHs in PM1.1 during summer and winter. The vertical solid line indicates a key threshold on the horizontal axis, while the horizontal dashed line indicates a key threshold on the vertical axis. (b) Backward air mass trajectories showing long-range transport pathways. The trajectories were calculated using the NOAA HYSPLIT model and are based on GDAS meteorological data. Trajectories end at 01:00 UTC on 24 August 2016 (left) and 01:00 UTC on 1 January 2017 (right), with the arrival point at sampling site (29.72° N, 120.23° E). Air mass paths are shown for three arrival altitudes above ground level (AGL): 1000 m (red triangles), 500 m (blue squares), and 50 m (green circles). Each trajectory covers a 192-hour simulation period.
Atmosphere 16 00674 g005
Table 1. Factors of non-carcinogenic risk and carcinogenic risk calculation for 6 age categories.
ParameterDefinitionValues for Age Categories (Years)References
Infant (0–1)Young ChildrenChildren (6–16)Adult1 (16–31)Adult2 (31–51)Adult3 (51–81)
(1–6)
C(e)Mean concentration in airborne particle (mg/m3)C (element)[5,25,26]
CA(PAHs)Converted BaP toxic equivalent (TEQ BaP) by the toxic equivalency factors (mg/m3)CA
InhRInhalation rate (m3/day)5.4913.6161615
EDExposure duration (year)0.53.51123.54166
EFExposure frequency (days/year)350350350350350350
ETExposure time (hours/day)1.51.53333
BWBody weight (kg)8.814.5436571.270
ATAverage time (h)ED*ET*365
AtnAverage time for carcinogens (h)70*24*365
Table 2. Recommended values of reference doses and inhalation unit risk of elemental content [25].
CrNiCuZnAsCdPbMn
RfC (mg/m3)0.00010.0000140.0004020.3012 × 10−500.003250
IUR (ug/m3.day)−10.0120.00026 0.004301.2 × 10−5
Table 3. Commonly used PAH diagnostic ratios and corresponding source implications for source apportionment.
Diagnostic RatiosValuePotential SourceReferences
LMW/HMW<1pyrogenic sources[16,20]
Low (high)-molecular-weight (L/HMW)>1petrogenic sources
COMB/TPAHs~1dominance of combustion-derived PAHs (COMB) [26]
BaP/BghiP<0.6non-traffic emissions[29]
>0.6traffic-related sources
IndP/(IndP + BghiP)<0.2petrogenic sources[29]
0.2–0.5petroleum combustion
>0.5biomass or coal combustion
BaA/BaP~0.5gasoline exhaust[30]
~1.0diesel exhaust
FLN/(FLN + PYR)<0.4petrogenic sources[18]
0.4–0.5fossil fuel combustion
>0.5biomass or coal combustion
Table 4. Summary of PM1.1/PM2.5(PM1.1/PM2.0) of several areas all over the world.
Sampling CitySampling SeasonPM1.0/PM2.5PM1.1/PM2.0Sampling PeriodsLiterature
Zhuji (China)Summer0.401 (PM2.0/TSP)0.664August 2016This study
Winter0.458 (PM2.0/TSP)0.587December 2016This study
Shanghai (China)Spring 0.21 (PM1.1/TSP)21 March–11 April 2017[5]
Beijing (China)Winter 0.5526 December 2018–11 January 2019[28]
Durg (India) Annual0.48 July 2009–June 2010[35]
Algiers (Algeria)Annual0.566 1 January–30 September 2015; 4 March–30 November 2016[11]
Harbin (China)Heat supply periods0.832 November 2014–February 2015[9]
No heat supply 0.769 February 2015–October 2015[9]
Hanoi (Vietnam) 0.676 November 2015–June 2016[32]
Handan (China)Winter0.75 November 2015[36]
Beijing (China)Annual0.533 2013–2017[19]
Incheon (Korea)Summer0.807 August, 2022[35]
Winter0.677 21 November–11 December 2022
Table 5. EF values of each element and PCA loading factors for toxic elements in PM1.1 during summer and winter sampling periods.
Summer PM1.1Winter PM1.1
ElementEFsF1F2F3EFsF1 F2
Cr6.610.030.65−0.03---
Mn5.690.10−0.290.7619.770.270.82
Ni17.120.000.640.10---
Cu66.280.33−0.22−0.48211.50.35−0.32
Zn364.60.440.090.08892.50.40−0.13
As92.580.420.020.24316.30.400.24
Cd2238.50.36−0.14−0.316727.00.38−0.36
Pb273.00.430.070.021267.40.41−0.11
% of variance---54.425.013.8---82.011.7
% of cumulative---54.479.493.3---82.093.7
Source steel industry activities; vehicle emissionsstainless steel manufacturecoal combustion; road particles steel industry activities; vehicle emissionscoal combustion
Table 6. PCC results between each element in PM1.1.
CrMnCoNiCuZnAsCdPbFe
Summer PM1.1Cr1.000−0.421−0.0760.884−0.2330.1730.108−0.1370.1900.124
Mn−0.4211.000−0.013−0.292−0.1350.2160.3790.0020.1560.122
Co−0.076−0.0131.0000.1410.4170.2740.0180.0090.2750.141
Ni0.884−0.2920.1411.000−0.3580.1810.014−0.1820.053−0.062
Cu−0.233−0.1350.417−0.3581.0000.6080.4850.7570.6730.680
Zn0.1730.2160.2740.1810.6081.0000.9250.7290.9210.880
As0.1080.3790.0180.0140.4850.9251.0000.6390.9260.928
Cd−0.1370.0020.009−0.1820.7570.7290.6391.0000.6230.624
Pb0.1900.1560.2750.0530.6730.9210.9260.6231.0000.977
Fe0.1240.1220.141−0.0620.6800.8800.9280.6240.9771.000
Winter PM1.1Cr----------
Mn-1.0000.172-0.3670.5410.7700.3400.5700.733
Co-0.1721.000-0.5040.6990.5050.8100.7600.578
Ni----------
Cu-0.3670.504-1.0000.8070.7020.7520.7980.410
Zn-0.5410.699-0.8071.0000.8700.8970.9660.621
As-0.7700.505-0.7020.8701.0000.8160.9060.755
Cd-0.3400.810-0.7520.8970.8161.0000.9560.669
Pb-0.5700.760-0.7980.9660.9060.9561.0000.742
Fe-0.7330.578-0.4100.6210.7550.6690.7421.000
Bold font, p < 0.05.
Disclaimer/Publisher’s Note: The statements, opinions and data contained in all publications are solely those of the individual author(s) and contributor(s) and not of MDPI and/or the editor(s). MDPI and/or the editor(s) disclaim responsibility for any injury to people or property resulting from any ideas, methods, instructions or products referred to in the content.

