Article

Reconstructing and Projecting 2012-like Drought in Serbia Using the Max Planck Institute Grand Ensemble

Institute for Meteorology, Faculty of Physics, University of Belgrade, 11000 Belgrade, Serbia
*
Author to whom correspondence should be addressed.
Atmosphere 2025, 16(6), 668; https://doi.org/10.3390/atmos16060668
Submission received: 30 April 2025 / Revised: 22 May 2025 / Accepted: 27 May 2025 / Published: 1 June 2025

Abstract

:
Droughts are among the most impactful climate extremes in Serbia, with significant socio-economic consequences, particularly in agriculture. The summer of 2012 was one of the most extreme drought events in Serbia’s history, characterized by record-breaking temperatures and prolonged precipitation deficits. In this study, we investigate the meteorological aspects of the 2012 drought, its progression, and its potential recurrence under future climate conditions. Using the high-resolution gridded observational dataset (EOBS) and Single-Model Initial-Condition Large Ensemble (SMILE) simulations from CMIP6—the Max Planck Institute Earth System Model version 1.2 (MPI-ESM 1.2) Grand Ensemble, we analyze precipitation deficits and assess the ability of MPI-GE CMIP6 to reproduce the observed event. We identify analogue events in MPI-GE CMIP6 that resemble the 2012 drought and examine their occurrence across historical and future climate scenarios (SSP1-2.6, SSP2-4.5, and SSP5-8.5). Our results indicate that MPI-GE CMIP6 effectively captures precipitation deficit extremes and that events comparable to the 2012 drought become more frequent and severe under higher greenhouse gas concentration scenarios. This study underscores the importance of a large ensemble in understanding the full distribution of extreme drought events and provides Serbia-specific insights, which is valuable for regional climate adaptation planning.

1. Introduction

Droughts have become one of the most impactful hazards in recent decades, affecting numerous areas and a wide range of sectors across the globe [1,2,3]. According to the Sixth Assessment Report of the IPCC [4], drought, as an extreme climate event, does not have one universal definition; rather, it can be classified in different types (meteorological, agricultural or soil moisture, ecological or socioeconomic, hydrological), and one type can propagate from another [5,6]. Meteorological drought, typically defined using precipitation deficits, often progresses towards agricultural and hydrological drought, initiating a cascade of effects that manifest as reduced soil moisture, crop failure, or low streamflow. The main contributors to changes in precipitation deficit are atmospheric dynamics (synoptic processes, large-scale circulation patterns, global ocean–atmosphere coupled patterns), land–atmosphere feedback, and thermodynamic processes. Under warming conditions, increased potential evapotranspiration (PET) can amplify water deficits, even if precipitation remains near average [7], thereby intensifying drought impacts. As a result, compound events with high temperatures and low precipitation co-occurring are recognized as critical for understanding drought severity. Therefore, indices such as Standardized Precipitation Index (SPI) [8], Standardized Precipitation Evapotranspiration Index (SPEI) [9], or Palmer Drought Severity Index (PDSI) [10] are often being used for studying drought [11,12,13].
During the 21st century, Europe has experienced a series of extremely hot and dry summers. In Central and Eastern Europe, five exceptionally hot summers occurred within the decade 2001–2010 [14]. The summer of 2018 serves as an example of concurrent extreme heat and drought events in Europe, particularly affecting central and northern regions [15]. Since the 1980s, these compound hot–dry events have become more frequent, especially over Southeastern Europe, with longer and more intense episodes largely driven by rising temperatures [16]. Recent studies show that large-scale and intense droughts have become increasingly frequent across Europe [17,18]. Although droughts show strong spatial and temporal variability across Europe, Spinoni et al. [12] showed that Mediterranean countries and the Baltic region saw more extreme and frequent droughts in the 1990s and 2000s, with the most severe droughts affecting Eastern Europe and the Mediterranean region.
In Serbia, these regional patterns are clearly reflected. A notable increase in warm and dry summer days has been observed [19], with these conditions strongly intertwining with the occurrence and severity of droughts, as high temperatures intensify atmospheric evaporative demand, further exacerbating precipitation deficits. In their recent work, Djurdjević et al. [20] analyzed high-resolution gridded observational data to assess recent drought trends over Serbia, identifying a significant drying trend, particularly in the summer months. In recent decades, Serbia has experienced several severe droughts [20], among which the 2012 event was one of the most extreme in terms of both intensity and socio-economic impact. The summer of 2012 was the second hottest recorded in Serbia since 1951, in relation to the reference period 1991–2020, surpassed only by the summer of 2024 [21]. Although this summer was marked by long-lasting high air temperatures and a very small amount of precipitation, leading to an extreme drought, it is important to note that the drought conditions already began in autumn 2011. After a severe winter cold wave in February followed by anomalously warm and wet spring conditions, the drought intensified and culminated during the summer. The year 2012 thus represents one of the warmest and driest years on record in Serbia, but, at the same time, it exemplifies the complex nature of diverse extreme events happening within the same year.
The Serbian Chamber of Commerce [22] estimated total losses in agriculture production of around USD 2 billion. The combination of low rainfall in June and July, along with prolonged periods of high temperatures, severely impacted corn plants, as well as soybeans and sunflowers. It is worth noting that Serbia has the lowest irrigated area in Europe, with less than 5 percent of agricultural land equipped with irrigation systems. This highlights the importance of investigating drought conditions in Serbia, as the agricultural sector heavily relies on natural rainfall [23] and is particularly vulnerable to drought events. Understanding and addressing the risks of 2012-like droughts in the future is crucial for safeguarding agricultural productivity and ensuring food security in the region.
Multi-model ensembles (MME), such as CMIP or CORDEX, are commonly used for studying how climate extremes may change in the future [24,25,26]. Projections of future climate suggest that the likelihood and severity of co-occurring exceptionally hot and dry conditions will increase in different parts of the world [15,27]. Specifically, for Europe, it is identified that such climate conditions will extend northward [28] and are expected to intensify both the severity and frequency of droughts. Even under lower emissions pathways, CMIP6 projections confirm that Europe is expected to experience an increase in the magnitude and extent of drying [29]. With substantial regional variations and high uncertainty in precipitation responses [4], projections highlight the urgent need to better understand and characterize future drought risk under changing climate conditions, especially in vulnerable regions such as South America, the Mediterranean, and southern Africa [27]. According to Spinoni et al. [30], observations and multi-model ensemble mean projections consistently indicate a rising trend in the duration, intensity, and spatial extent of droughts, particularly in Southern and Central Europe.
While global and continental-scale studies provide valuable insights, regional- and country-level assessments are important for identifying local vulnerabilities and informing and supporting evidence-based decision-making. In the context of Serbia and the Balkans, climate projections indicate that the Mediterranean region and the Balkans exhibit the similar trend of a strong increase in the frequency of summer droughts [30].
When analyzing dynamically driven climate phenomena, such as extreme droughts, the traditional approach of using MME mean or median captures inter-model uncertainty, but can obscure important regional details. Events influenced by atmospheric circulation may be misrepresented, as individual models may simulate circulation patterns that differ qualitatively from the MME mean [31], further complicating the interpretation of future climate impacts. Taking the mean or median across models that show contradictory signals may smooth out the most severe signals of extremes, potentially underestimating the true risk.
To address the limitations of MMEs and to better understand future changes in drought events in Serbia, the present study uses a Single-Model Initial-Condition Large Ensemble (SMILE). Unlike the traditional MMEs, which sample structural model uncertainty across different climate models but often rely on a single realization per model, SMILEs offer multiple realizations from the same model with slightly perturbed initial conditions [32].
To date, assessments of future drought risks in Serbia have been limited. Most previous studies rely on MMEs and drought indices (SPI, SPEI). The Digital Climate Atlas of Serbia [33] provides projections of drought conditions based primarily on SPEI using output from EURO-CORDEX simulations. Similarly, Kržič et al. [34] analyzed changes in drought frequency and severity using SPI and SPEI indices on monthly timescales based on regional climate model outputs under Special Report on Emissions Scenarios (SRES). While these studies highlight the increasing risk of drought, they rely on aggregated indicators and do not explore insights into drought development and the dynamic meteorological conditions that can lead to diverse drought outcomes. However, a study by Sippel and Otto [35] used a large number of ensemble members for two decades, 1960–1970 and 2000–2010, to study the dry conditions of 2012 and then applied probabilistic event attribution to show that climate change has increased the likelihood of extreme hydro-meteorological events in Southeast Europe. While [35] analyzed seasonal dryness trends across Southeast Europe, our approach complements this by reconstructing the 2012 Serbian drought at a high temporal resolution.
The use of a SMILE is particularly well suited to Serbia for several reasons. Serbia is a climate transition zone [20], frequently influenced by competing Mediterranean and continental signals. This allows for a robust estimation of internal climate variability and rare-event statistics, which is critical when investigating extremes. The high exposure and sensitivity of its agricultural sector make future drought risk a matter of national importance. Traditional MME means may mask key dynamics and the severity of compound events such as drought, especially when these are modulated by large-scale circulation patterns and local thermodynamics. Moreover, it was shown that the analysis of compound events demands a much larger sample size than what is typically required for studying single-variable extremes [36]. Using a SMILE, we can gain insight not only into the likelihood of severe droughts, but also into the range of meteorological conditions under which similar drought impacts could occur. SMILEs are appropriate for studying low-probability high-impact extremes and event attributions, especially where consistent forcing and a high temporal resolution are required [36,37,38]. Previous studies have demonstrated the value of SMILEs for studying extreme climate events in a changing climate in various regions and contexts, e.g., precipitation and wind extremes over Portugal [36], windstorm characteristics over the US [39], cold extremes and heavy rainfall over Northwest Russia and the Iberian Peninsula [40], and extreme temperatures over North America [41].
Building on recent high-resolution observational studies of Serbian drought trends [20,42,43], this study draws inspiration from the methodology developed by van der Wiel et al. [38], who applied a physical storyline approach to investigate future European drought events similar to 2018 based on large ensemble (LE) of climate model simulation outputs. We used the MPI Grand Ensemble (MPI-GE) from CMIP6, a LE with 50 members per scenario and high-frequency output for multiple emission scenarios (SSP1-2.6, SSP2-4.5 and SSP5-8.5). Rather than focusing only on long-term drought trends, this study adopts an event-based perspective, analyzing the development and drivers of droughts similar to the 2012 extreme example under varying future conditions. Precipitation deficit has been calculated according to [38,44], defined as the difference between potential evapotranspiration and precipitation, and is used in this study to capture drought event evolution on daily timescales.
This study aims to analyze plausible future drought scenarios for Serbia using SMILE output to explore event likelihoods and drivers under changing climate conditions and contribute to informing adaptation strategies for the agricultural sector and more robust assessments of climate extremes at the national level.

2. Materials and Methods

2.1. Study Area and Data
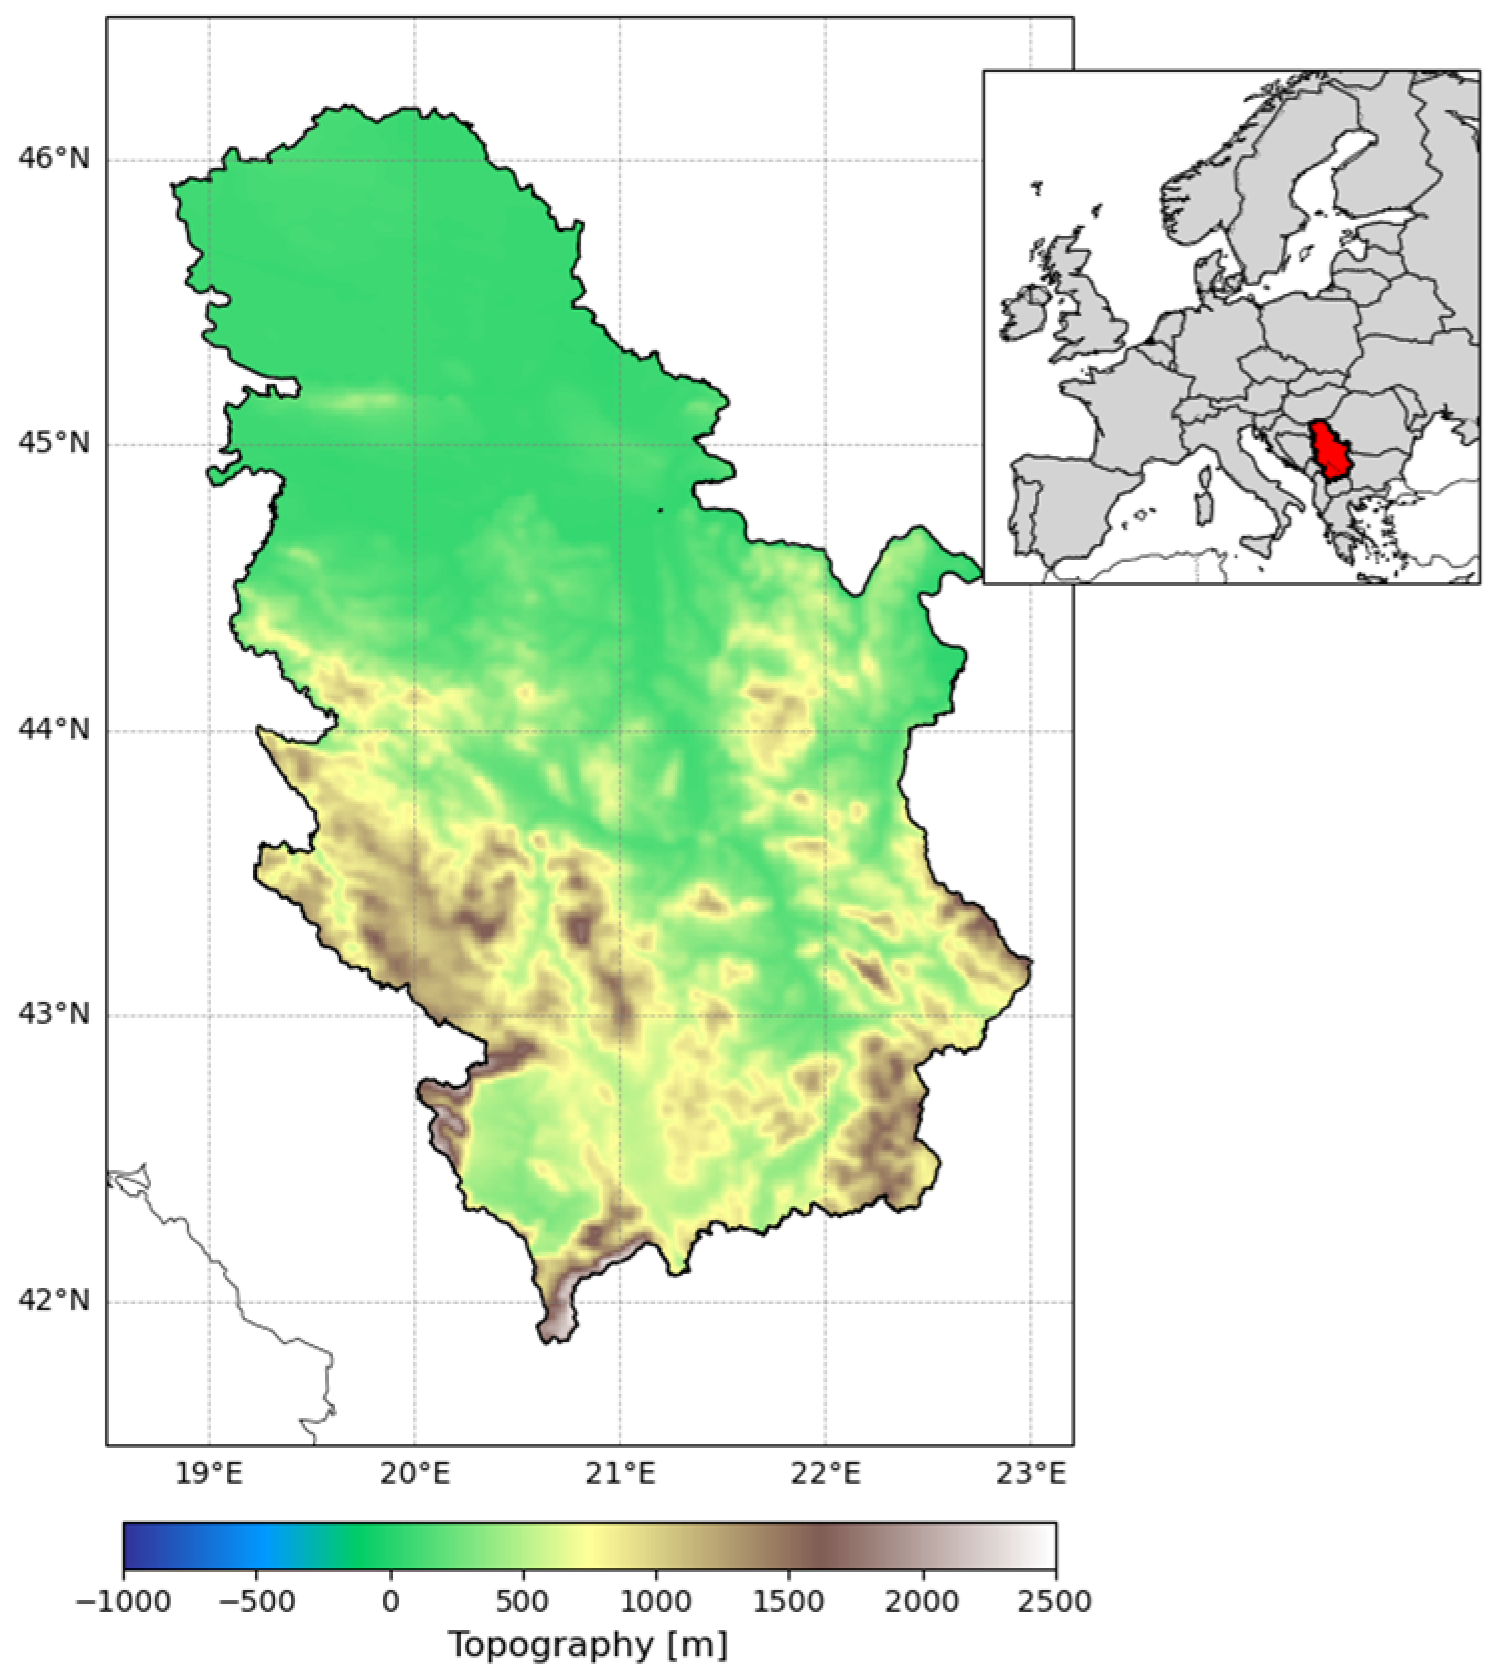
2.1.1. Study Area

The study area is Serbia, situated in the western part of the Balkan Peninsula, at the intersection of central and southern Europe, bounded by 41.7–46.3° N and 18.7–23° E, shown in Figure 1. The country’s climate is highly influenced by its complex topography and geographical position, and is generally categorized in three main climate types: continental, moderate continental, and modified Mediterranean climate [45]. The southern regions of Serbia are influenced by the Mediterranean, which contributes to warmer and drier conditions compared to the northern parts of the country. In Serbia’s climate, the highest precipitation levels typically occur in June [19], with values spanning from 550 to 600 mm to over 1100 mm [46]. In terms of temperature, Serbia’s lowland areas have a mean annual temperature between 11 and 12 °C, while the mountainous regions are cooler, with mean annual temperatures below 8 °C [47]. The range of recorded absolute minimum and maximum air temperatures in Serbia spans from −39.5 °C to 44.9 °C.
Despite the observations and climate projections both indicating decrease in precipitation in the southern parts, no statistically significant long-term trend in total annual precipitation has been observed at the national scale. The warmest month is July, when mean air temperatures reach their annual peak [19] and climate projections for the future predict a further increase in air temperature in Serbia [48].

2.1.2. Data

The EOBS [49] dataset (version 27.0e) was used for describing and analyzing the observed event. EOBS provides high-quality high-resolution gridded climate data derived from an interpolation of observations from weather stations across Europe. It serves as one of the most important datasets for climate monitoring and analysis in the region. The dataset was created by interpolating the most comprehensive collection of station data across Europe, and represents a dataset with an ensemble mean providing a “best guess” value and the standard error calculated as the difference between the 5th and 95th percentile across the ensemble [49]. The dataset provides a horizontal resolution of 0.1 degrees (approximately 10 km) for variables including mean, minimum, and maximum temperature, precipitation sum, sea level pressure, relative humidity, wind speed, and global radiation. This high spatial resolution enables detailed analysis suitable for regional-scale climate studies, such as those focused on Serbia. For the purpose of this study, daily mean, daily maximum, and daily minimum temperature values, as well as daily precipitation, were downloaded for the time period 1950–2020.
To assess drought characteristics under different climate conditions and to place the 2012 event in a broader climatic context, we employed a Single-Model Initial-Condition Large Ensemble (SMILE). SMILEs offer a robust way to sample the internal climate variability by providing multiple ensemble members from a single-climate model. Each of the simulations within large ensemble has slightly different initial conditions, but identical model physics and external forcings [32]. This structure allows for each member to evolve differently due to internal variability alone, providing a robust sampling of the range of possible climate outcomes under a given scenario. Large ensemble sizes provided by SMILEs are essential for identifying and understanding very rare and extreme compound events.
Specifically, we used a SMILE developed by the Max Planck Institute (MPI) Grand Ensemble (GE) [50], which is a part of the CMIP6 database. MPI-GE CMIP6 provides daily data, with at least 30 realizations for both the historical (1850–2014) and future (2015–2100) periods, with a horizontal resolution of 1.8 degrees (approximately 200 km). Before generating the ensemble, a quasi-stationary 1000-year-long control simulation was run using preindustrial conditions. Then, for a given scenario, each simulation of MPI-GE is initialized from a different starting points of a quasi-stationary one-member preindustrial simulation, with different states being approximately 25 years apart in time. More details and the model setup, as well as the model evaluation and comparison to its previous version, can be found in the paper by Olonscheck et al. [50].
An important advantage of the MPI-GE CMIP6 configuration over its earlier version, MPI-GE CMIP5 [51], which already had good agreement with observations [52,53], is the availability of daily output, and with this enhancement, it enables the investigation and analysis of sub-seasonal variability and identification of short-term extremes [50]. In this study, we used all available years, from 1850 to 2100, and 50 realizations for each of the emission scenarios SSP1-2.6, SSP2-4.5, and SSP5-8.5. The three SSP scenarios used in this study represent different future socio-economic and emissions pathways [54]:
-
SSP1-2.6 assumes strong mitigation and sustainability efforts, leading to low radiative forcing by 2100;
-
SSP2-4.5 represents an intermediate pathway with moderate emissions and adaptation challenges, achieving a forcing level of 4.5 W m−2;
-
SSP5-8.5 corresponds to high fossil fuel use and minimal mitigation, resulting in high-end emissions and radiative forcing of 8.5 W m−2 in 2100.
The daily variables used in our analysis include minimum temperature, daily maximum temperature, daily mean temperature, and total precipitation, downloaded from the Earth System Grid Federation (ESGF) archive.
Prior to analysis, MPI-GE CMIP6 data were interpolated from their native resolution to the EOBS grid using nearest-neighbour remapping via Climate Data Operators (CDO). Bilinear interpolation was also tested and produced comparable results, confirming the robustness of the chosen approach. The aim was to achieve spatial comparability with observations and allow for consistent field-averaging, which was performed over the Serbian domain.

2.2. Methods

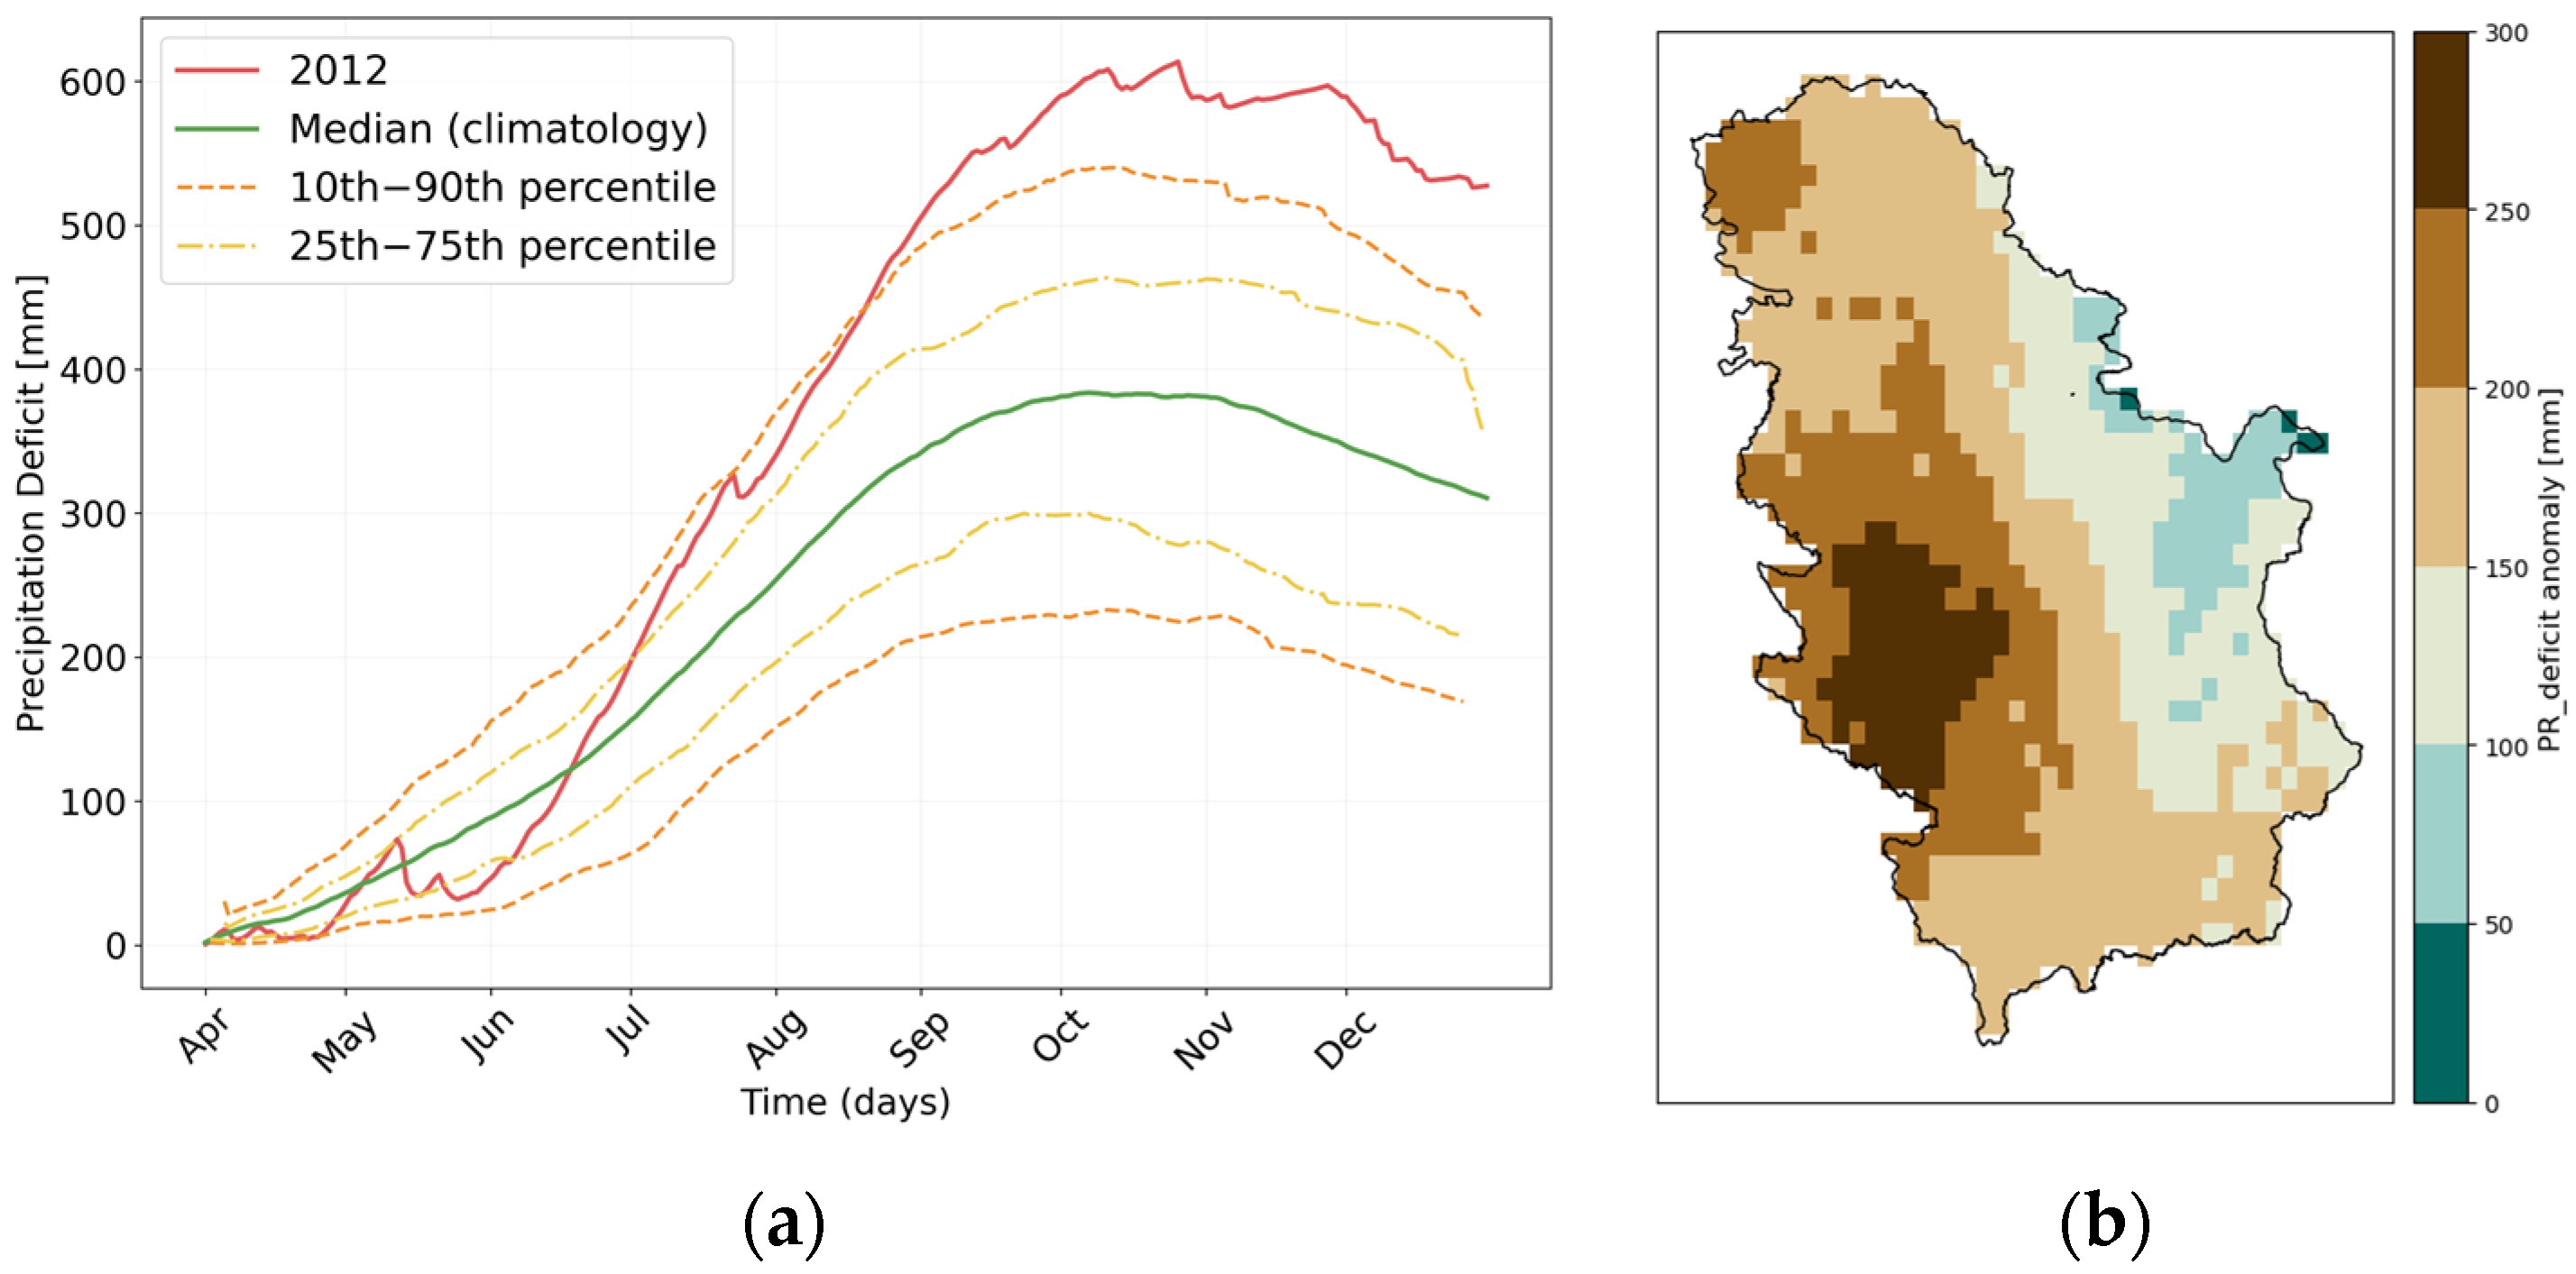
2.2.1. Drought Metrics Based on Precipitation Deficit

In this study, we investigated the case of extreme drought that happened in Serbia in 2012. We considered this event as a meteorological drought, but, over time, it propagated into an agricultural drought. We described the drought of 2012 as it happened and unfolded over time using observational data (EOBS). The variable that is being used for the analysis is precipitation deficit (PR_deficit) anomaly. PR_deficit is a convenient drought indicator, also proposed by IPCC for analyzing and monitoring meteorological drought. It provides a direct way to track when and how the atmosphere is consistently demanding more water than is being provided by precipitation, making it suitable for examining a drought event’s evolution on daily timescales, which is difficult to capture with standardized indices like SPI or SPEI that rely on monthly aggregation and normalization assumptions.
Precipitation deficit was calculated based on the daily cumulative difference between daily potential evapotranspiration (PET) and precipitation (PR), with the focus on growing season (April–October). The reason for focusing on growing season is because, during this time, PR_deficit can directly impact yield and food security, making it relevant to agriculture and human systems. PR_deficit of the day d is calculated as follows:
PR _ deficit d = i = 1 d PET i PR i
PR_deficit was calculated as the difference between daily PET and daily precipitation (PR), as shown in (1), such that positive PR_deficit values indicate days when atmospheric water demand exceeds water supply. Cumulative PR_deficit values were obtained by summing daily PR_deficit from April to December. The longer a drought lasts and the more severe it is, the greater the precipitation deficit. After calculating daily precipitation deficit values for each grid point, the results were spatially averaged across all grid points within Serbia, yielding a country-average time series for each realization.
To estimate daily potential evapotranspiration values, we applied the Hargreaves equation [55], as shown in (2), a temperature-based method that requires only maximum and minimum air temperatures and extraterrestrial radiation. The Hargreaves equation is defined as follows:
PET = 0.0023 · R a · T m a x T m i n · T m e a n + 17.8
where Ra is extraterrestrial radiation which is a function of latitude, and Tmax, Tmin, and Tmean are the daily maximum, minimum, and mean air temperature, respectively. This approach is widely used in climate studies [56,57,58] due to its simplicity and relatively low input data requirements, making it suitable for large-scale gridded observational datasets such as EOBS. Potential evapotranspiration was calculated by using the Python library pyet, version 1.2.2 [59], and requires only temperature data and the location’s latitude as input.
To assess the suitability of the MPI-GE CMIP6 for analyzing the 2012 drought in Serbia, we evaluated model performance in reproducing the seasonal cycle of precipitation deficit. Anomalies were computed relative to the respective climatologies: for EOBS, the climatology was calculated over the 1950–2020 period, and for MPI-GE CMIP6, the model climatology was computed over the historical period 1850–2014 to avoid the influence of strong future warming on the baseline. For both datasets, we applied a 10-day running mean followed by a percentile calculation (10th, 25th, 50th, 75th, and 90th percentiles) over the full time period. The anomaly-based approach allows for internally consistent comparisons across datasets with different climatological baselines and reduces the impact of systematic model biases in absolute values.
The three quantitative metrics we used in this study for describing the drought are proposed by van der Wiel et al. [38], characterizing the intensity, evolution, and temporal structure of the drought. Metric 1 (M1) represents the mean value of the cumulative precipitation deficit anomaly over August–October; metric 2 (M2) is the slope of a linear regression of the cumulative precipitation deficit anomaly from June to August; and metric 3 (M3) is the temporal correlation (Pearson’s r) of the cumulative precipitation deficit anomaly time series April–October. For the quantitative analysis of the drought’s evolution and structure, PR_deficit allowed us to calculate the three metrics (M1, M2, and M3)

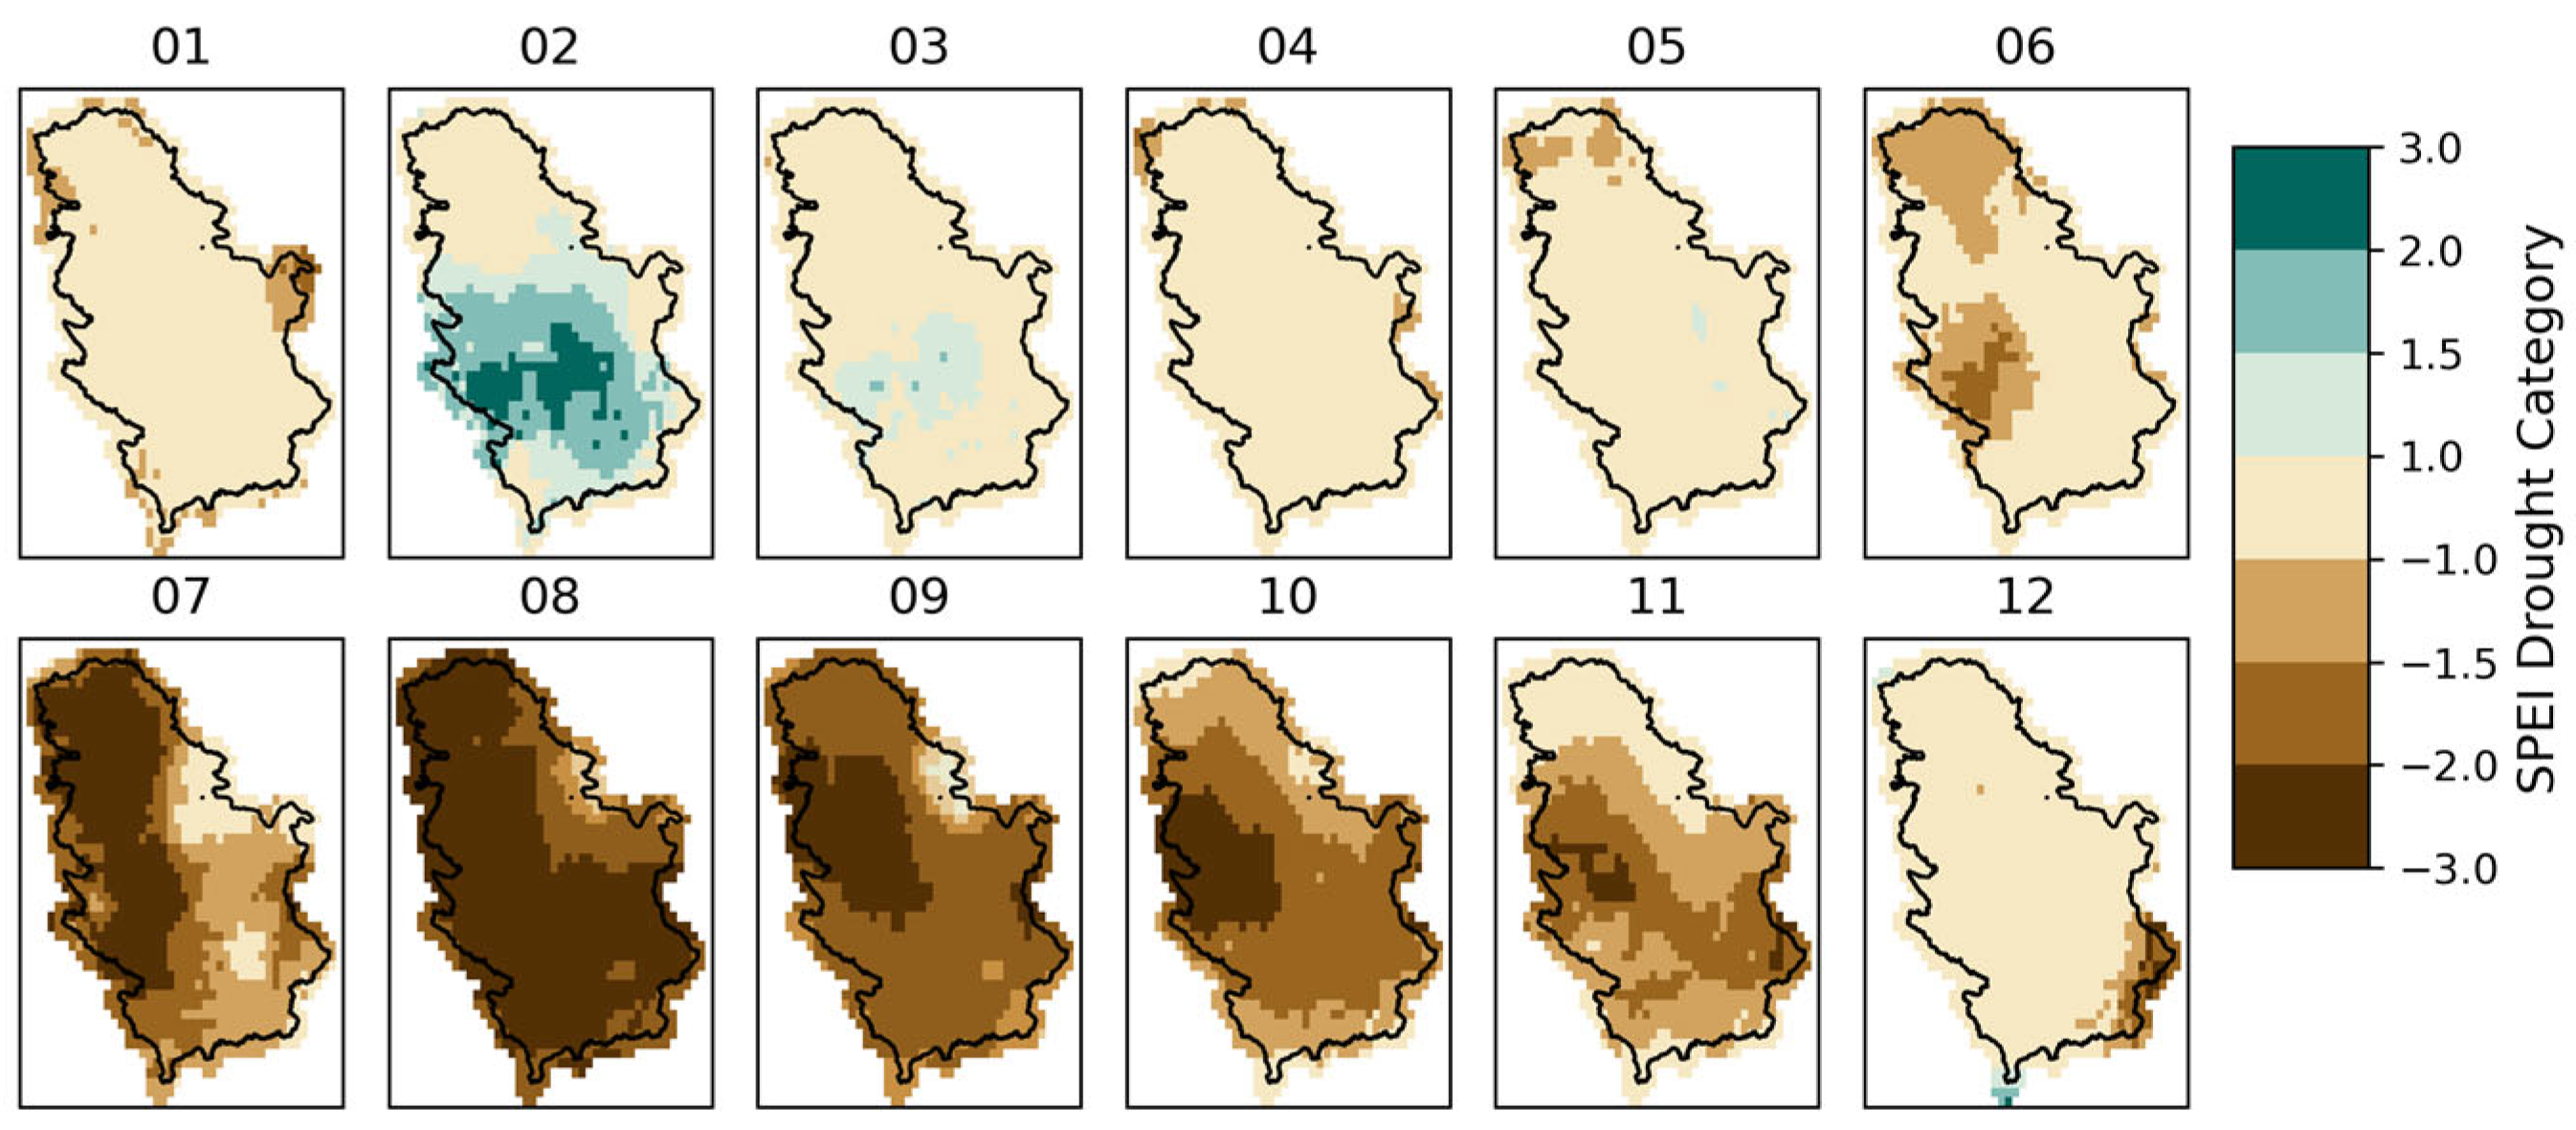
2.2.2. The Standardized Precipitation Evapotranspiration Index (SPEI)

To complement the precipitation deficit analysis and investigate the monthly development of the 2012 drought, we calculated the three-month and six-month Standardized Precipitation Evapotranspiration Index (SPEI-3 and SPEI-6). SPEI integrates both precipitation and PET anomalies to assess meteorological drought intensity [9]. SPEI was computed using daily precipitation and PET data aggregated to monthly totals. The SPEI values were standardized by fitting the monthly precipitation—PET differences to a Gamma distribution, with a climatological reference period 1961–1990. Monthly SPEI-3 values were calculated for each grid point over Serbia for 2012, providing a continuous picture of drought development across the year. A detailed description of the methodology used for SPEI calculation is provided in the Supplementary Materials. SPEI was calculated using the Python library climate_indices [60]. To support the interpretation of SPEI values, we have included Table 1, in which the commonly used classification of drought severity based on SPEI thresholds is summarized. In accordance with the standard classification thresholds [61], extreme drought (ED) is present if the SPEI-3 value was less than or equal to −2.0.

2.2.3. Analogue Selection Process and Criteria

To explore how a drought event similar to that of 2012 could manifest under different climate conditions, we apply a method [38] of selecting simulated analogues from a LE of climate model simulations. This approach involves identifying events within the MPI-GE CMIP6 that exhibit similar precipitation deficit characteristics to the observed event, based on defined quantitative metrics. Analogues were identified based on the cumulative precipitation deficit metrics. First the three metrics, (M1) mean value of cumulative precipitation deficit anomaly, (M2) slope of a linear regression of cumulative precipitation deficit anomaly, and (M3) temporal correlation of the cumulative precipitation deficit anomaly time series (all of which are described in more detail in Section 2.2.1), are calculated for Serbia, as spatially averaged values, from observed conditions in 2012 (E-OBS dataset). Then, for each year and ensemble member in the model dataset, we calculated the values of the same three metrics over both the historical period (1850–2014) and future projections (2015–2100) and for all three scenarios: SSP1-2.6, SSP2-4.5, and SSP5-8.5. Finally, the analogue selection procedure is applied based on the similarity estimate between observed 2012 drought and different simulated events from the model ensemble. The similarity was quantified using a distance-based scoring system, which is based on the difference between the metric calculated from observational data and the same one from the model results. These analogues allow us to construct plausible versions of the 2012 drought unfolding in alternative climate states, which are, in our case, those characterized by higher global mean temperatures under various SSP scenarios.
To further investigate the individual characteristics of drought analogues, for each of the three defined metrics, the ten most similar events were selected. Selection was performed by calculating the absolute difference between corresponding metric values from the observational and model dataset and ranking them. Then, a composite mean was calculated as the average of the ten selected analogue events, which gives us three composites, one for each metric. These composites offer insights into the typical patterns associated with 2012-like drought characteristics under varying climate conditions. By separately analyzing these composites, we can assess how each dimension, depicted by the three different metrics, of the 2012 drought manifests in the model simulations and how it may evolve in future scenarios.

3. Results

3.1. Reconstruction of the 2012 Drought in Historical Data

The year 2012 was marked by different extreme climate and weather conditions in Serbia. During the winter season, the cold wave lasted about 2.5 weeks (from January 29 to February 15) [62], making February as the coldest month on record according to most meteorological stations in Serbia, and showing temperatures below −20 degrees Celsius, with intensive snow at the same time. The cold wave was followed by greater than average spring temperatures and very wet conditions in May. Although spring months (April–June) had above-normal rainfall, a significant deficit is evident during the summer (July–September), with values falling below the 10th percentile (Figure 2a). It was shortly interrupted by cooling and precipitation at the end of July (Figure 2a), but drought was again recorded in August and September due to stable, dry, and warm conditions along with increased water consumption. The summer and autumn were extremely warm (Figure 2b), with heat waves in September and October [62]. Summer temperatures were persistently above the 90th percentile (Figure 2b), making 2012 one of the hottest summers on record in the country. The entire country faced persisting severe drought conditions throughout the whole summer, continuing in the autumn. Following slightly wet conditions in February, Serbia experienced increasingly severe drought from July, peaking in August and persisting until November. During July–September, values of SPEI-3 were below −1.5 (severe drought) across the whole country, with values going below −2 (extreme drought) in the western part of the country (Figure 3).
To complement the drought assessment and provide a longer-term context, we also calculated monthly SPEI-3 and SPEI-6 values for August over the 1950–2020 period using EOBS data. August was selected due to its climatological relevance in Serbia and because it exhibits one of the strongest and most consistent negative trends in SPEI, as identified by Djurdjević et al. [20]. Both SPEI-3 and SPEI-6 for August values show a tendency toward more negative values in recent decades. These time series are presented in Supplementary Figure S1.
The cumulative PR_deficit during the 2012 drought consistently exceeded the 90th percentile of the climatological distribution from August onwards (Figure 4a). After a period of above-average rainfall in May, drought conditions developed and intensified more rapidly than in typical years, with deficits sharply increasing from June onwards, which is in accordance with the SPEI-3 calculations.

3.2. How Well Does MPI-GE Reproduce the Observed Climatology?

The ensemble median of PR_deficit (Figure 5a) slightly underestimates cumulative deficits during peak summer months, indicating that model underestimates severe drought buildup. After removing the climatological mean bias, the variability in the MPI-GE CMIP6 ensemble closely resembles that of the observational data of the PR_deficit anomaly (Figure 5b). Observations (green) and the model ensemble (purple) median of the PR_deficit anomaly show good agreement throughout most of the growing season. Model variability is larger than observed variability, which is realistic since large ensemble (LE) samples a much wider range of possible outcomes.

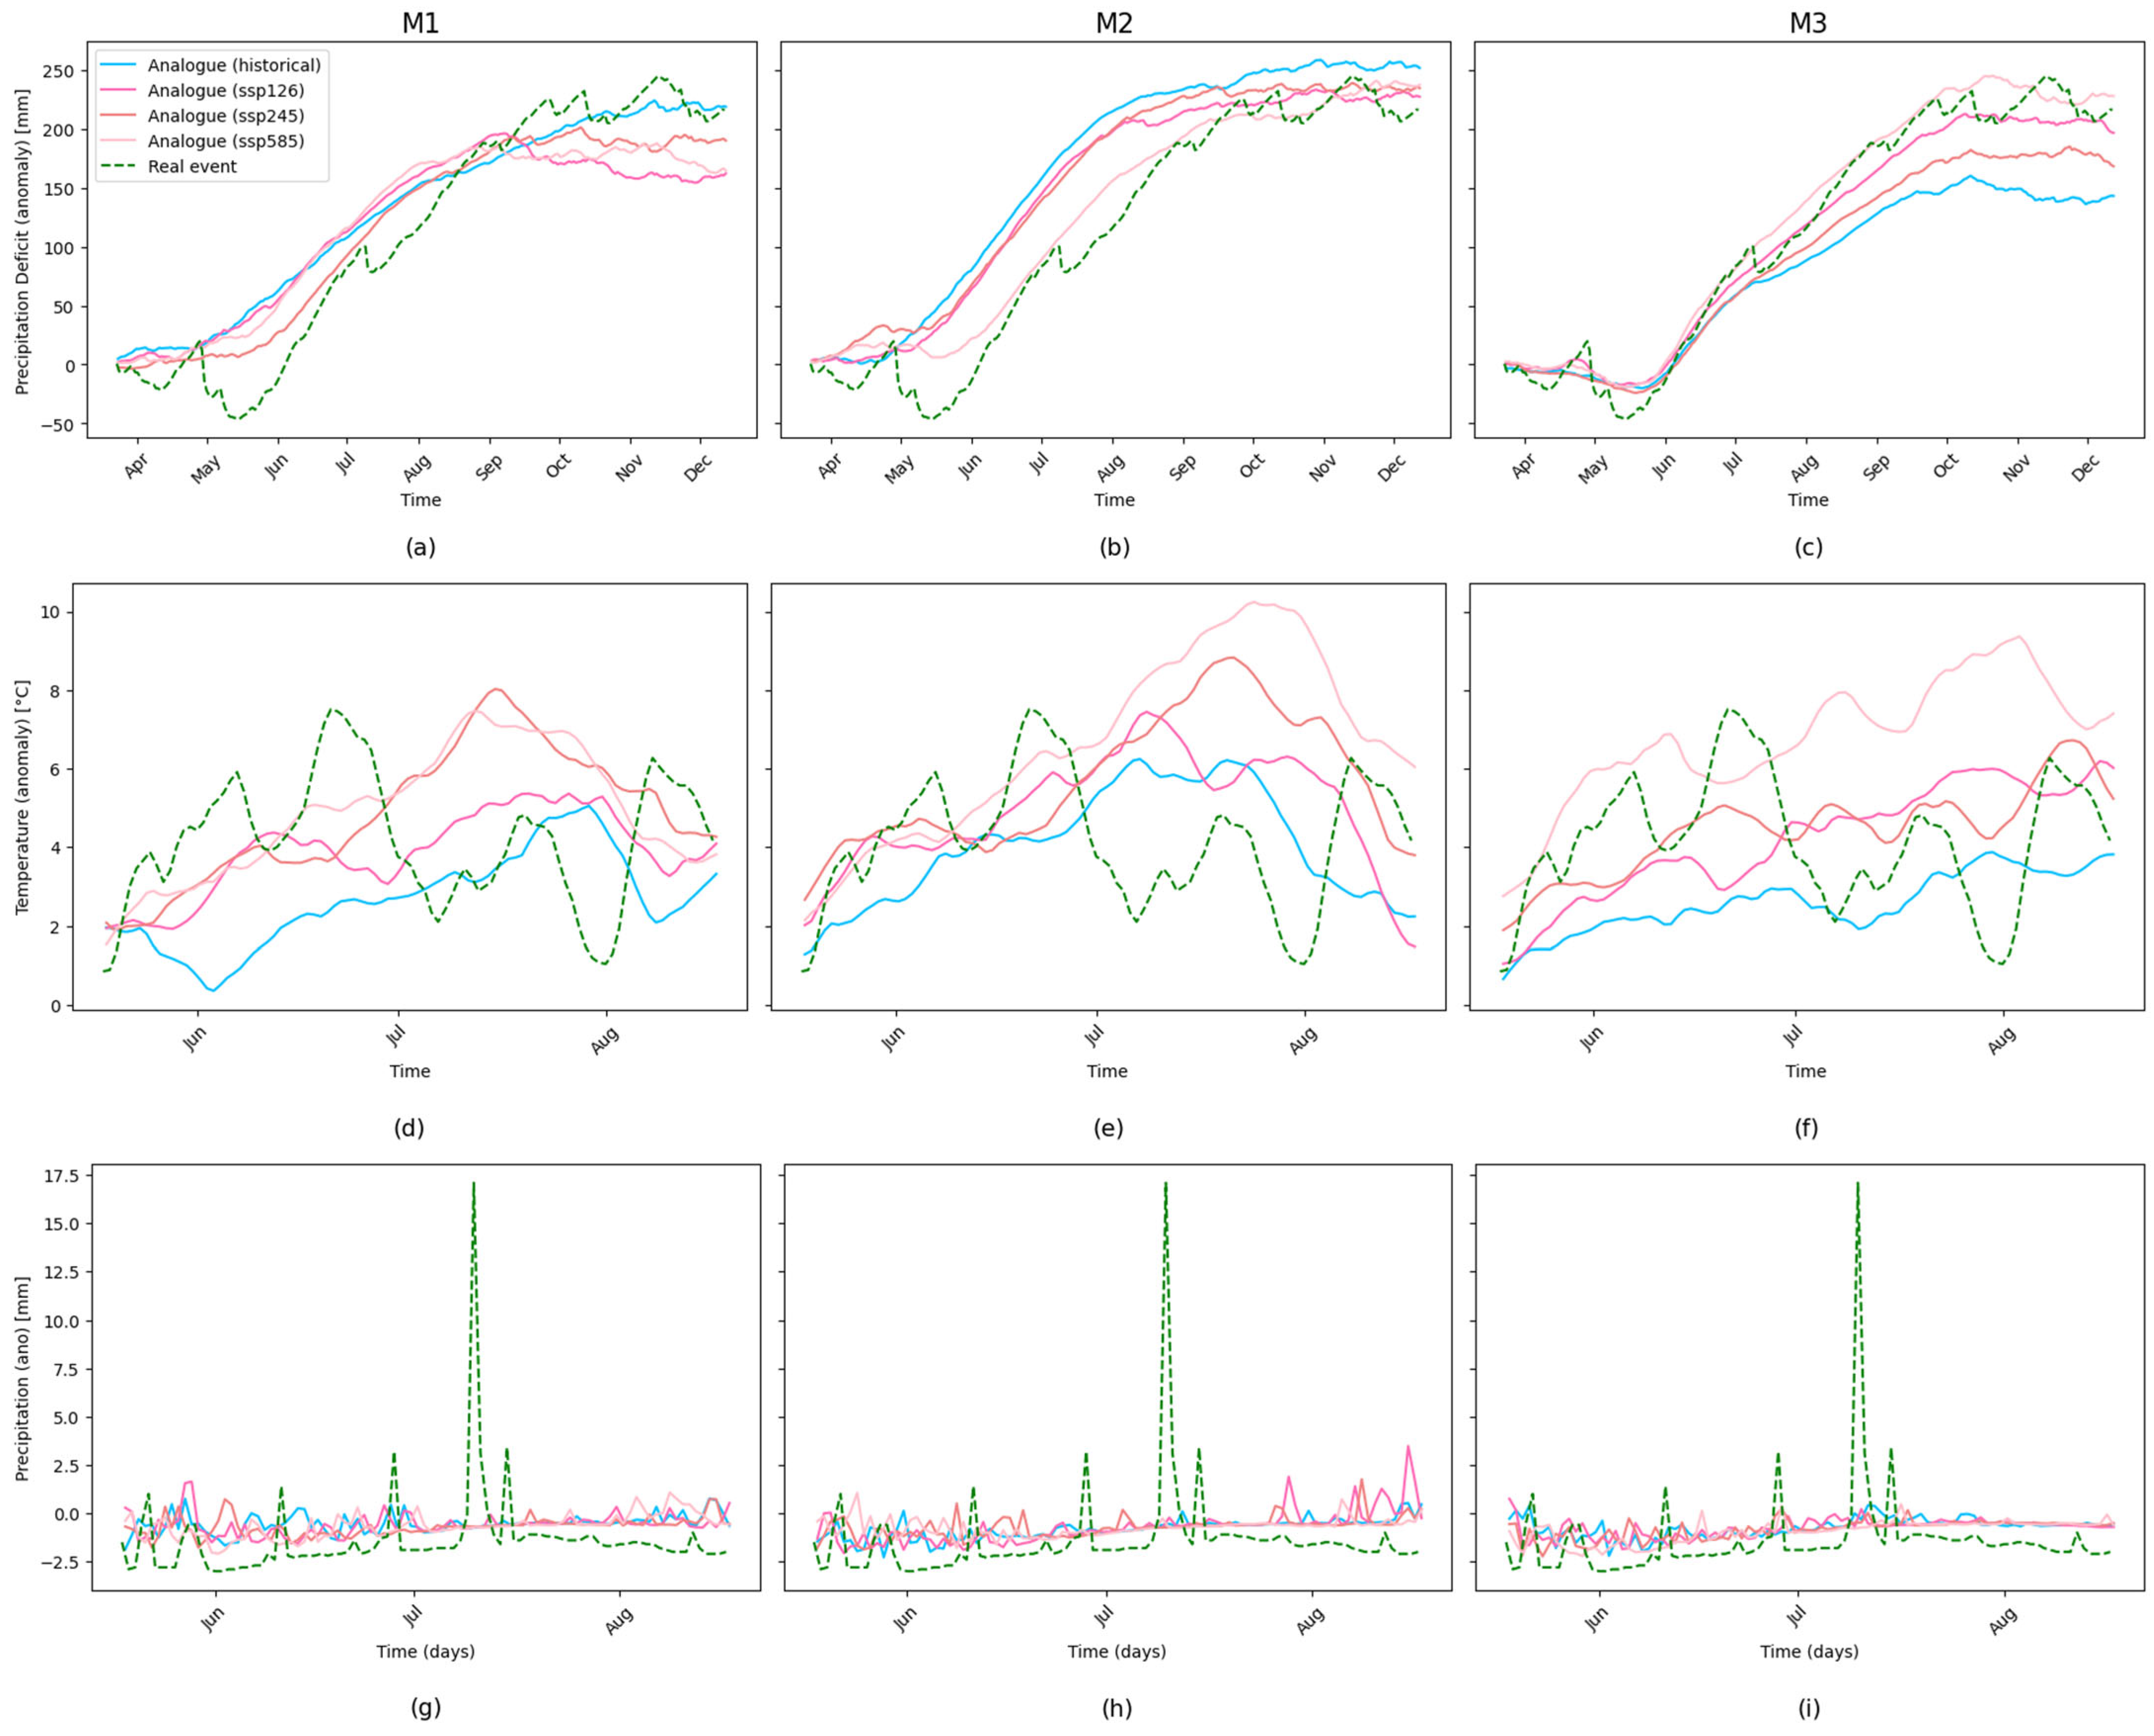
3.3. Detection of Analogous Drought Events in the Large Ensemble

To investigate how 2012-like drought events could evolve under different climate conditions, we selected analogue events based on three cumulative PR_deficit metrics (M1, M2, and M3) and constructed composite means for each climate state (historical, SSP1-2.6, SSP2-4.5, SSP5-8.5). We specifically identified events whose structure and evolution most closely matched the observed 2012 drought.
Analogues were selected separately for each metric and scenario from the MPI-GE CMIP6 ensemble, based on the closest match to the 2012 event. Figure 6 illustrates how the intensity and seasonal progression of 2012-like drought events evolve under different levels of global warming. During the historical period (Figure 6, first row), the composites captured the seasonal progression of the 2012 drought, but analogues selected based on temporal correlation (M3) tend to underestimate the sharp evolution observed in the real event. Temperature differences (Figure 7f) contribute to the mismatch between observed and simulated historical droughts. The dry end of the summer and autumn is amplified in the results of higher-emissions scenarios. Analysis of the temperature evolution for analogue events shows that historical analogues (1850–2014) exhibit lower mean temperatures during the summer season compared to the observed 2012 event and the increasing tendency towards higher temperatures in future analogue drought events (Figure 7d–f). According to M3, this likely results in lower potential evapotranspiration (PET) and, thus, a reduced cumulative precipitation deficit for historical analogues (Figure 7c). In contrast, under higher-emissions scenarios, increased temperatures drive greater PET, contributing to a larger precipitation deficit—particularly evident in the SSP5-8.5 scenario (Figure 7c).
We find that lower-emissions scenarios (SSP1-2.6, SSP2-4.5) generally capture the shape of drought development (based on M2, the slope of precipitation deficit between June and August or how fast the drought worsens during summer), but not the absolute deficit levels. In these scenarios, precipitation deficits tend to start from higher initial values compared to the observed 2012 event, reflecting the absence of an anomalously wet spring like that recorded in May 2012. As a result, although the rate of drought intensification is reproduced, the simulated droughts develop earlier relative to observations. Only under the high-emissions SSP5-8.5 scenario did model analogues replicate both the slope and the absolute deficit evolution, suggesting that increasing spring dryness under strong warming conditions facilitates the emergence of drought structures more closely resembling the observed 2012 event. Among three metrics, M2 shows higher ensemble spread across all scenarios (Figure 6, second column), suggesting that the analogue selection based on M2 captures a broader range of meteorological realizations and showing how similar slopes can emerge from different conditions before and after the June–August period.

3.4. Changes in Precipitation Deficit Metrics Across Scenarios

The histogram analysis presented in Figure 8 reveals an increase in the frequency of severe deficit anomalies evident under higher emission scenarios. In the historical period, the August–October mean precipitation deficits anomalies are centred around small values, with some years being wetter, some drier, but most near 0 to a moderate deficit (Figure 8a,b). The shift in the distribution is toward higher (more positive) values and more pronounced in higher-emission scenarios (especially SSP5-8.5) (Figure 8a,b), meaning larger and more frequent precipitation deficits. SSP5-8.5 shows the most extreme drying, with a broad and right-shifted distribution, which indicates not only stronger drying, but also greater variability (some years with extreme deficits). The histogram of the temporal correlation of cumulative precipitation deficit anomalies between the observed 2012 drought and its analogues (Figure 8c) indicates a growing resemblance under future scenarios. This suggests that drought events projected with MPI-GE for the coming decades are increasingly similar in timing and severity to the 2012 extreme.

4. Discussion and Conclusions

This study analyzes the future risk of summer droughts in Serbia based on analogues of the 2012 event using output from the MPI-GE CMIP6. Our aim was to investigate the future occurrence and development of droughts similar to the extreme summer of 2012 in Serbia. The approach proposed by van der Wiel et al. [38] for the 2018 drought in Rhine basin is demonstrated to be useful and replicable for other regional drought events. The ensemble captures the magnitude of the observed extreme event, and the analogue selection successfully identifies events close to the observed 2012 values, confirming the robustness of the event matching method. The results show that droughts similar to 2012 are expected to become more frequent and intense under continued warming, particularly under higher-emissions scenarios (SSP5-8.5).
Our findings are consistent with previous studies that identified Serbia and the broader Mediterranean region as drought hotspots under climate change [30]. The results are aligned with the conclusions about the drought of 2012 from Sippel and Otto [35] for Southeast Europe and Cindrić et al. [13], who conducted an analysis for Croatia. Compared to previous analyses based on drought indices, such as SPEI and SPI [20,34,42], this event-based approach captures the meteorological development of droughts and allows for a more detailed exploration of variability within and between events. The use of SMILE enables a robust estimation of internal climate variability and highlights the potential for drought events to occur under a range of meteorological conditions.
The intensification of droughts is primarily driven by higher temperatures, which increase evaporative demand even when precipitation deficits are moderate. This amplifying effect of temperature is critical for understanding future drought severity, as compound hot and dry events exert greater stress on ecosystems, agriculture, and water resources [63]. Internal climate variability remains substantial, especially at regional scales, but the shift towards a drier, hotter climate background significantly elevates the risk of extreme drought years.
There are some limitations to this study. One limitation of this study is that MPI-GE CMIP6 shows known deficiencies in underestimating precipitation variability [50]. Analysis of daily precipitation anomalies (Figure 7g–i) shows that MPI-GE analogues fail to reproduce the high daily precipitation variability observed during the 2012 event. While the analogues match the drought characteristics well, they underestimate the occurrence of short, intense precipitation episodes. This might be partly due to the relatively coarse horizontal resolution of MPI-GE (~1.8°), which limits its ability to resolve small-scale convective processes critical for representing short-duration precipitation extremes. Another potential limitation is that this study is based on a single climate model (MPI-GE CMIP6), and while large ensembles provide valuable insights into internal variability, structural model uncertainties are not addressed. Future work could extend this approach by using multiple SMILEs, when available with sufficient ensemble sizes, common scenario coverage, and temporal resolution, to, as discussed by Deser et al. [37], better distinguish between uncertainties arising from internal climate variability and structural model differences. We highlight the need for multi-model large ensembles (MMLEs), particularly in the form of high-resolution regional climate model (RCM) ensembles. RCM-based MMLEs, with their finer horizontal resolution, have the potential to better represent the local processes and characteristics that influence extreme events. Additionally, the use of the Hargreaves method for estimating PET, while widely used for large-scale studies, may underestimate evapotranspiration under extreme heat conditions compared to more complex formulations such as Penman–Monteith.
The findings of this study have important implications for Serbia, where the agricultural sector is highly sensitive to rainfall variability and where irrigation infrastructure remains limited. Future drought risk management must account for an increased probability of extreme events similar to or more severe than 2012. There is a high need for proactive adaptation strategies, including improvements in drought early warning systems, irrigation expansion, and changes in agricultural practices. Testing adaptation strategies under physically plausible future drought scenarios would provide valuable information for national resilience planning; therefore, the results obtained in this study can be used for impact modelling.

Supplementary Materials

The following supporting information can be downloaded at: https://www.mdpi.com/article/10.3390/atmos16060668/s1, Figure S1: Time series of spatially averaged monthly SPEI values over Serbia for August, calculated using EOBS data for the period 1950–2020. Both (a) SPEI-3 and (b) SPEI-6 are shown; Methodology for Computing the Standardized Precipitation Evapotranspiration Index. Reference [64] is cited in Supplementary Materials.

Author Contributions

Conceptualization, M.T. and V.D.; methodology, M.T.; software, M.T.; validation, M.T., V.D. and I.L.; formal analysis, M.T.; investigation, M.T.; resources, M.T.; data curation, M.T.; writing—original draft preparation, M.T.; writing—review and editing, V.D., I.T. and I.L.; visualization, M.T.; supervision, V.D. and I.T. All authors have read and agreed to the published version of the manuscript.

Funding

This research was supported by the Science Fund of the Republic of Serbia, No. 7389, Project “Extreme weather events in Serbia—analysis, modelling and impacts”—EXTREMES.

Institutional Review Board Statement

Not applicable.

Informed Consent Statement

Not applicable.

Data Availability Statement

The data presented in this study will be made available by the authors on request.

Acknowledgments

We acknowledge the EOBS dataset from the EU-FP6 project UERRA and the Copernicus Climate Change Service. We acknowledge the Earth System Grid Federation (ESGF) and the Deutsches Klimarechenzentrum (DKRZ) node for providing access to the MPI-ESM1-2-LR Grand Ensemble data used in this study. We would like to thank the Max Planck Institute for Meteorology, which enabled free software CDO version 2.0.4 (The Climate Data Operators) for the processing of climate data and the developers of the pyet Python package for providing an open-source implementation of reference evapotranspiration methods used in this study. The authors would like to dedicate this paper to the students and teachers who stood against the corruption and the collapse of the educational system in Serbia during the academic 2024–2025 year. We would also like to thank all the taxpayers in Serbia for supporting science and education. A tiny fraction of tax revenue is distributed to us by the Ministry of Science, Technological Development and Innovation of the Republic of Serbia. The authors are very grateful to the anonymous reviewers for their constructive suggestions that led to the improvement of the paper.

Conflicts of Interest

The authors declare no conflicts of interest. The funders had no role in the design of the study; in the collection, analyses, or interpretation of data; in the writing of the manuscript; or in the decision to publish the results.

Abbreviations

The following abbreviations are used in this manuscript:
LElarge ensemble
PETpotential evapotranspiration
SPIStandardized Precipitation Index
SPEIStandardized Precipitation Evapotranspiration Index
PDSIPalmer Drought Severity Index
MMEmulti-model ensemble
SMILESingle-Model Initial-Condition Large Ensemble
SRESSpecial Report on Emissions Scenarios
MPI-GEMax Planck Institute Grand Ensemble
CDOClimate Data Operators
PR_deficitprecipitation deficit
SPEI3three-month Standardized Precipitation Evapotranspiration Index
MMLEmulti-model large ensemble
RCMregional climate model

References

  1. Blauhut, V.; Gudmundsson, L.; Stahl, K. Towards Pan-European Drought Risk Maps: Quantifying the Link between Drought Indices and Reported Drought Impacts. Environ. Res. Lett. 2015, 10, 014008. [Google Scholar] [CrossRef]
  2. Deng, L.; Peng, C.; Kim, D.-G.; Li, J.; Liu, Y.; Hai, X.; Liu, Q.; Huang, C.; Shangguan, Z.; Kuzyakov, Y. Drought Effects on Soil Carbon and Nitrogen Dynamics in Global Natural Ecosystems. Earth-Sci. Rev. 2021, 214, 103501. [Google Scholar] [CrossRef]
  3. Qiu, J.; Shen, Z.; Xie, H. Drought Impacts on Hydrology and Water Quality under Climate Change. Sci. Total Environ. 2023, 858, 159854. [Google Scholar] [CrossRef] [PubMed]
  4. Intergovernmental Panel on Climate Change (IPCC). Climate Change 2021—The Physical Science Basis: Working Group I Contribution to the Sixth Assessment Report of the Intergovernmental Panel on Climate Change, 1st ed.; Cambridge University Press: Cambridge, UK, 2023; ISBN 978-1-009-15789-6. [Google Scholar]
  5. Van Loon, A.F. Hydrological Drought Explained. Wiley Interdiscip. Rev. Water 2015, 2, 359–392. [Google Scholar] [CrossRef]
  6. Wang, W.; Ertsen, M.W.; Svoboda, M.D.; Hafeez, M. Propagation of Drought: From Meteorological Drought to Agricultural and Hydrological Drought. Adv. Meteorol. 2016, 2016, 1–5. [Google Scholar] [CrossRef]
  7. Vicente-Serrano, S.M.; Peña-Angulo, D.; Beguería, S.; Domínguez-Castro, F.; Tomás-Burguera, M.; Noguera, I.; Gimeno-Sotelo, L.; El Kenawy, A. Global Drought Trends and Future Projections. Philos. Trans. R. Soc. Math. Phys. Eng. Sci. 2022, 380, 20210285. [Google Scholar] [CrossRef] [PubMed]
  8. McKee, T.B.; Doesken, N.J.; Kleist, J. The Relationship of Drought Frequency and Duration to Time Scales. In Proceedings of the 8th Conference on Applied Climatology, Anaheim, CA, USA, 17–22 January 1993; American Meteor Society: Anaheim, CA, USA, 1993; pp. 179–184. [Google Scholar]
  9. Vicente-Serrano, S.M.; Beguería, S.; López-Moreno, J.I. A Multiscalar Drought Index Sensitive to Global Warming: The Standardized Precipitation Evapotranspiration Index. J. Clim. 2010, 23, 1696–1718. [Google Scholar] [CrossRef]
  10. Palmer, W.C. Meteorological Drought; Weather Bureau Research Paper 45; U.S. Department of Commerce: Washington, DC, USA, 1965; p. 58.
  11. Seneviratne, S.I. Climate Science: Historical Drought Trends Revisited. Nature 2012, 491, 338–339. [Google Scholar] [CrossRef]
  12. Spinoni, J.; Naumann, G.; Vogt, J.V.; Barbosa, P. The Biggest Drought Events in Europe from 1950 to 2012. J. Hydrol. Reg. Stud. 2015, 3, 509–524. [Google Scholar] [CrossRef]
  13. Cindrić, K.; Telišman Prtenjak, M.; Herceg-Bulić, I.; Mihajlović, D.; Pasarić, Z. Analysis of the Extraordinary 2011/2012 Drought in Croatia. Theor. Appl. Climatol. 2016, 123, 503–522. [Google Scholar] [CrossRef]
  14. Twardosz, R.; Kossowska-Cezak, U. Exceptionally Hot Summers in Central and Eastern Europe (1951–2010). Theor. Appl. Climatol. 2013, 112, 617–628. [Google Scholar] [CrossRef]
  15. Zscheischler, J.; Fischer, E.M. The Record-Breaking Compound Hot and Dry 2018 Growing Season in Germany. Weather Clim. Extrem. 2020, 29, 100270. [Google Scholar] [CrossRef]
  16. Manning, C.; Widmann, M.; Bevacqua, E.; Van Loon, A.F.; Maraun, D.; Vrac, M. Increased Probability of Compound Long-Duration Dry and Hot Events in Europe during Summer (1950–2013). Environ. Res. Lett. 2019, 14, 094006. [Google Scholar] [CrossRef]
  17. Hanel, M.; Rakovec, O.; Markonis, Y.; Máca, P.; Samaniego, L.; Kyselý, J.; Kumar, R. Revisiting the Recent European Droughts from a Long-Term Perspective. Sci. Rep. 2018, 8, 9499. [Google Scholar] [CrossRef] [PubMed]
  18. Caloiero, T.; Caroletti, G.N.; Coscarelli, R. IMERG-Based Meteorological Drought Analysis over Italy. Climate 2021, 9, 65. [Google Scholar] [CrossRef]
  19. Arsenović, P.; Tošić, I.; Unkašević, M. Trends in Combined Climate Indices in Serbia from 1961 to 2010. Meteorol. Atmos. Phys. 2015, 127, 489–498. [Google Scholar] [CrossRef]
  20. Djurdjević, V.; Stosic, B.; Tošić, M.; Lazić, I.; Putniković, S.; Stošić, T.; Tošić, I. Analysis of recent trends and spatiotemporal changes of droughts over Serbia using high-resolution gridded data. Atmos. Res. 2024, 304, 107376. [Google Scholar] [CrossRef]
  21. RHMZ. Sezonski Bilten za SRBIJU: Leto 2024. Godine; Republic Hydrometeorological Service of Serbia: Belgrade, Serbia, 2024; p. 19.
  22. US Foreign Agricultural Service. Drought Driven Declines in Serbian Crops Increased Food Prices; U.S. Department of Agriculture, Foreign Agricultural Service: Washington, DC, USA, 2012. Available online: https://apps.fas.usda.gov/newgainapi/api/report/downloadreportbyfilename?filename=Drought%20Driven%20Declines%20in%20Serbian%20Crops%20Increased%20Food%20Prices%20_Belgrade_Serbia_8-15-2012.pdf (accessed on 27 April 2025).
  23. Trajković, S.; Gocić, M.; Misic, D.; Milanovic, M. Spatio-Temporal Distribution of Hydrological and Meteorological Droughts in the South Morava Basin. In Natural Risk Management and Engineering; Gocić, M., Aronica, G.T., Stavroulakis, G.E., Trajković, S., Eds.; Springer Tracts in Civil Engineering; Springer International Publishing: Cham, Switzerland, 2020; pp. 225–242. ISBN 978-3-030-39390-8. [Google Scholar]
  24. Kim, Y.-H.; Min, S.-K.; Zhang, X.; Sillmann, J.; Sandstad, M. Evaluation of the CMIP6 Multi-Model Ensemble for Climate Extreme Indices. Weather Clim. Extrem. 2020, 29, 100269. [Google Scholar] [CrossRef]
  25. Vogel, M.M.; Hauser, M.; Seneviratne, S.I. Projected Changes in Hot, Dry and Wet Extreme Events’ Clusters in CMIP6 Multi-Model Ensemble. Environ. Res. Lett. 2020, 15, 094021. [Google Scholar] [CrossRef]
  26. Soares, P.M.M.; Careto, J.A.M.; Russo, A.; Lima, D.C.A. The Future of Iberian Droughts: A Deeper Analysis Based on Multi-Scenario and a Multi-Model Ensemble Approach. Nat. Hazards 2023, 117, 2001–2028. [Google Scholar] [CrossRef]
  27. De Luca, P.; Donat, M.G. Projected Changes in Hot, Dry, and Compound Hot-Dry Extremes Over Global Land Regions. Geophys. Res. Lett. 2023, 50, e2022GL102493. [Google Scholar] [CrossRef]
  28. Felsche, E.; Böhnisch, A.; Poschlod, B.; Ludwig, R. European Hot and Dry Summers Are Projected to Become More Frequent and Expand Northwards. Commun. Earth Environ. 2024, 5, 410. [Google Scholar] [CrossRef]
  29. Cook, B.I.; Mankin, J.S.; Marvel, K.; Williams, A.P.; Smerdon, J.E.; Anchukaitis, K.J. Twenty-First Century Drought Projections in the CMIP6 Forcing Scenarios. Earths Future 2020, 8, e2019EF001461. [Google Scholar] [CrossRef]
  30. Spinoni, J.; Vogt, J.V.; Naumann, G.; Barbosa, P.; Dosio, A. Will Drought Events Become More Frequent and Severe in Europe? Int. J. Climatol. 2018, 38, 1718–1736. [Google Scholar] [CrossRef]
  31. Zappa, G.; Shepherd, T.G. Storylines of Atmospheric Circulation Change for European Regional Climate Impact Assessment. J. Clim. 2017, 30, 6561–6577. [Google Scholar] [CrossRef]
  32. Maher, N.; Milinski, S.; Ludwig, R. Large Ensemble Climate Model Simulations: Introduction, Overview, and Future Prospects for Utilising Multiple Types of Large Ensemble. Earth Syst. Dyn. 2021, 12, 401–418. [Google Scholar] [CrossRef]
  33. Map—Digital Climate Atlas of Serbia. Available online: https://atlas-klime.eko.gov.rs/eng/map?dataType=mod&visualization=vre&variableUuid=d06081ce-1b51-4296-b8f8-c7eeba3fc26b&area=serbia (accessed on 27 April 2025).
  34. Kržič, A.; Djurdjević, V.; Tošić, I. Future Changes in Drought Characteristics in Serbia. In Proceedings of the DailyMeteo.Org/2014 Conference, Belgrade, Serbia, 26–27 June 2014; Bajat, B., Kilibarda, M., Eds.; Faculty of Civil Engineering, University of Belgrade: Belgrade, Serbia, 2014; ISBN 978-86-7518-169-9. [Google Scholar]
  35. Sippel, S.; Otto, F.E.L. Beyond Climatological Extremes—Assessing How the Odds of Hydrometeorological Extreme Events in South-East Europe Change in a Warming Climate. Clim. Change 2014, 125, 381–398. [Google Scholar] [CrossRef]
  36. Bevacqua, E.; Suarez-Gutierrez, L.; Jézéquel, A.; Lehner, F.; Vrac, M.; Yiou, P.; Zscheischler, J. Advancing Research on Compound Weather and Climate Events via Large Ensemble Model Simulations. Nat. Commun. 2023, 14, 2145. [Google Scholar] [CrossRef]
  37. Deser, C.; Lehner, F.; Rodgers, K.B.; Ault, T.; Delworth, T.L.; DiNezio, P.N.; Fiore, A.; Frankignoul, C.; Fyfe, J.C.; Horton, D.E.; et al. Publisher Correction: Insights from Earth System Model Initial-Condition Large Ensembles and Future Prospects. Nat. Clim. Change 2020, 10, 791. [Google Scholar] [CrossRef]
  38. van der Wiel, K.; Lenderink, G.; de Vries, H. Physical Storylines of Future European Drought Events like 2018 Based on Ensemble Climate Modelling. Weather Clim. Extrem. 2021, 33, 100350. [Google Scholar] [CrossRef]
  39. Coburn, J.; Barthelmie, R.J.; Pryor, S.C. Changing Windstorm Characteristics over the US Northeast in a Single Model Large Ensemble. Environ. Res. Lett. 2024, 19, 114045. [Google Scholar] [CrossRef]
  40. Sippel, S.; Mitchell, D.; Black, M.T.; Dittus, A.J.; Harrington, L.; Schaller, N.; Otto, F.E.L. Combining Large Model Ensembles with Extreme Value Statistics to Improve Attribution Statements of Rare Events. Weather Clim. Extrem. 2015, 9, 25–35. [Google Scholar] [CrossRef]
  41. Thompson, V.; Kennedy-Asser, A.T.; Vosper, E.; Lo, Y.T.E.; Huntingford, C.; Andrews, O.; Collins, M.; Hegerl, G.C.; Mitchell, D. The 2021 Western North America Heat Wave among the Most Extreme Events Ever Recorded Globally. Sci. Adv. 2022, 8, eabm6860. [Google Scholar] [CrossRef]
  42. Filipović, L.; Putniković, S.; Stosic, B.; Stosic, T.; Djurdjević, V.; Tošić, I. Analysis of Spatio-Temporal Characteristics of Drought in Serbia from 1961 to 2020 Using SPI and SPEI. Int. J. Climatol. 2025, e8803. [Google Scholar] [CrossRef]
  43. Amiri, M.A.; Gocic, M. Analysis of Temporal and Spatial Variations of Drought over Serbia by Investigating the Applicability of Precipitation-Based Drought Indices. Theor. Appl. Climatol. 2023, 154, 261–274. [Google Scholar] [CrossRef]
  44. Philip, S.Y.; Kew, S.F.; Van Der Wiel, K.; Wanders, N.; Jan Van Oldenborgh, G. Regional Differentiation in Climate Change Induced Drought Trends in the Netherlands. Environ. Res. Lett. 2020, 15, 094081. [Google Scholar] [CrossRef]
  45. Bajat, B.; Blagojević, D.; Kilibarda, M.; Luković, J.; Tošić, I. Spatial Analysis of the Temperature Trends in Serbia during the Period 1961–2010. Theor. Appl. Climatol. 2015, 121, 289–301. [Google Scholar] [CrossRef]
  46. Milovanović, B.; Stanojević, G.; Radovanović, M. Climate of Serbia. In The Geography of Serbia; Manić, E., Nikitović, V., Djurović, P., Eds.; World Regional Geography Book Series; Springer International Publishing: Cham, Switzerland, 2022; pp. 57–68. ISBN 978-3-030-74700-8. [Google Scholar]
  47. Vujadinović Mandić, M.; Vuković Vimić, A.; Ranković-Vasić, Z.; Đurović, D.; Ćosić, M.; Sotonica, D.; Nikolić, D.; Đurđević, V. Observed Changes in Climate Conditions and Weather-Related Risks in Fruit and Grape Production in Serbia. Atmosphere 2022, 13, 948. [Google Scholar] [CrossRef]
  48. Rankovic-Vasic, Z.; Vukovic-Vimic, A.; Vujadinovic-Mandic, M. Priority Measures of Adaptation to Climate Change in the Viticulture Sector in Serbia. Zb. Matice Srp. Za Prir. Nauk. 2024, 67–79. [Google Scholar] [CrossRef]
  49. Cornes, R.C.; Van Der Schrier, G.; Van Den Besselaar, E.J.M.; Jones, P.D. An Ensemble Version of the E-OBS Temperature and Precipitation Data Sets. J. Geophys. Res. Atmos. 2018, 123, 9391–9409. [Google Scholar] [CrossRef]
  50. Olonscheck, D.; Suarez-Gutierrez, L.; Milinski, S.; Beobide-Arsuaga, G.; Baehr, J.; Fröb, F.; Ilyina, T.; Kadow, C.; Krieger, D.; Li, H.; et al. The New Max Planck Institute Grand Ensemble with CMIP6 Forcing and High-Frequency Model Output. J. Adv. Model. Earth Syst. 2023, 15, e2023MS003790. [Google Scholar] [CrossRef]
  51. Maher, N.; Milinski, S.; Suarez-Gutierrez, L.; Botzet, M.; Dobrynin, M.; Kornblueh, L.; Kröger, J.; Takano, Y.; Ghosh, R.; Hedemann, C.; et al. The Max Planck Institute Grand Ensemble: Enabling the Exploration of Climate System Variability. J. Adv. Model. Earth Syst. 2019, 11, 2050–2069. [Google Scholar] [CrossRef]
  52. Suarez-Gutierrez, L.; Milinski, S.; Maher, N. Exploiting Large Ensembles for a Better yet Simpler Climate Model Evaluation. Clim. Dyn. 2021, 57, 2557–2580. [Google Scholar] [CrossRef]
  53. Wood, R.R.; Lehner, F.; Pendergrass, A.G.; Schlunegger, S. Changes in Precipitation Variability across Time Scales in Multiple Global Climate Model Large Ensembles. Environ. Res. Lett. 2021, 16, 084022. [Google Scholar] [CrossRef]
  54. O’Neill, B.C.; Tebaldi, C.; Van Vuuren, D.P.; Eyring, V.; Friedlingstein, P.; Hurtt, G.; Knutti, R.; Kriegler, E.; Lamarque, J.-F.; Lowe, J.; et al. The Scenario Model Intercomparison Project (ScenarioMIP) for CMIP6. Geosci. Model. Dev. 2016, 9, 3461–3482. [Google Scholar] [CrossRef]
  55. Hargreaves, G.H.; Samani, Z.A. Reference Crop Evapotranspiration from Temperature. Appl. Eng. Agric. 1985, 1, 96–99. [Google Scholar] [CrossRef]
  56. Stagge, J.H.; Kingston, D.G.; Tallaksen, L.M.; Hannah, D.M. Observed Drought Indices Show Increasing Divergence across Europe. Sci. Rep. 2017, 7, 14045. [Google Scholar] [CrossRef]
  57. Haied, N.; Foufou, A.; Chaab, S.; Azlaoui, M.; Khadri, S.; Benzahia, K.; Benzahia, I. Drought Assessment and Monitoring Using Meteorological Indices in a Semi-Arid Region. Energy Procedia 2017, 119, 518–529. [Google Scholar] [CrossRef]
  58. Song, Y.H.; Chung, E.-S.; Shahid, S. Global Future Potential Evapotranspiration Signal Using Penman-Monteith and Hargreaves-Samani Method by Latitudes Based on CMIP6. Atmos. Res. 2024, 304, 107367. [Google Scholar] [CrossRef]
  59. Vremec, M.; Collenteur, R.A.; Birk, S. Technical Note: Improved Handling of Potential Evapotranspiration in Hydrological Studies with PyEt. Hydrol. Earth Syst. Sci. Discuss. 2023; preprint. [Google Scholar] [CrossRef]
  60. Adams, J. Climate_indices, an Open Source Python Library Providing Reference Implementations of Commonly Used Climate Indices. 2017. Available online: https://github.com/monocongo/climate_indices (accessed on 27 April 2025).
  61. Potop, V.; Boroneanţ, C.; Možný, M.; Štěpánek, P.; Skalák, P. Observed Spatiotemporal Characteristics of Drought on Various Time Scales over the Czech Republic. Theor. Appl. Climatol. 2014, 115, 563–581. [Google Scholar] [CrossRef]
  62. RHMZ. Bilten RHMZ; Online; RHMZ: Belgrade, Serbia, 2010; pp. 119–135.
  63. Dell’Oro, M.; Mataruga, M.; Sass-Klaassen, U.; Fonti, P. Climate Change Threatens on Endangered Relict Serbian Spruce. Dendrochronologia 2020, 59, 125651. [Google Scholar] [CrossRef]
  64. Thom, H.C.S. A Note on the Gamma Distribution. Mon. Weather. Rev. 1958, 86, 117–122. [Google Scholar] [CrossRef]
Figure 1. Map of Serbia with its topographical characteristics and the position of Serbia in Europe.
Atmosphere 16 00668 g001
Figure 2. (a) Monthly precipitation and (b) monthly mean temperature in 2012 (red line) compared to the 1950–2020 climatology over Serbia. The green line shows the climatological median, while the shaded areas represent the interquartile range from the 25th to 75th percentile (light brown) and from the 10th to 90th percentile (darker brown).
Atmosphere 16 00668 g002
Figure 3. Monthly evolution of the SPEI-3 index over Serbia for the year 2012. Each panel corresponds to one month (from January to December), showing spatial variations in drought intensity based on the SPEI-3 values. Positive values (green shades) indicate wetter than average conditions, while negative values (brown shades) represent drier than average conditions.
Atmosphere 16 00668 g003
Figure 4. (a) Daily precipitation deficit during April–December 2012 compared to the percentiles (10th, 25th, 50th, 75th, and 90th) of the 1950–2020 climatological distribution. (b) Spatial distribution of the mean precipitation deficit anomaly observed for August–October 2012.
Atmosphere 16 00668 g004
Figure 5. Daily cumulative (a) precipitation deficit and (b) daily precipitation deficit anomalies (from April onwards) relative to the 1950–2020 climatology for EOBS and the 1850–2014 climatology for MPI-GE, smoothed using a 10-day running mean. The solid green (purple) line indicates the EOBS (MPI-GE) median. Areas shaded in beige represent the 25th–75th and 10th–90th percentile ranges for observations (EOBS), while the model ensemble (MPI-GE) percentile ranges are shown with lilac lines.
Atmosphere 16 00668 g005
Figure 6. Cumulative precipitation deficit anomalies for analogue events to the 2012 drought, selected based on three metrics (M1: August–October intensity, M2: June–August slope, M3: April–October temporal correlation). Rows correspond to different climate states (historical, SSP1-2.6, SSP2-4.5, SSP5-8.5), and columns correspond to selection based on each metric. Thin lilac lines represent the ten chosen individual analogue events; thick purple lines show their composite mean. The solid pink line indicates the observed 2012 event.
Atmosphere 16 00668 g006
Figure 7. Temporal evolution of precipitation deficit anomalies for April–December (first row, (ac)) and summer 2m air temperature anomalies (second row, (df)) and daily precipitation anomalies (third row, (gi)), for real event (green dashed line) and analogue events from the MPI-GE across different SSP scenarios and three metrics. Lines are smoothed using a 10-day running mean for 2m temperature. Different colours represent different scenarios (historical, SSP1-2.6, SSP2-4.5, SSP5-8.5).
Atmosphere 16 00668 g007
Figure 8. Probability density distributions of metric 1 (a), metric 2 (b), and metric 3 (c) under historical and future scenarios (SSP1-2.6, SSP2-4.5, SSP5-8.5) based on MPI-GE output. Solid lines represent density estimations for each scenario. The distribution for observed events is shown in the background as a shaded area.
Atmosphere 16 00668 g008
Table 1. SPEI category classification [61].
CategorySPEI Threshold
Extreme drought (ED)SPEI ≤ −2.0
Severe drought (SD)−2.0 < SPEI ≤ −1.5
Moderate drought (MD)−1.5 < SPEI ≤ −1.0
Near normal (NN)−1.0 < SPEI < 1.0
Moderately wet (MW)1.0 ≤ SPEI < 1.5
Severely wet (SW)1.5 ≤ SPEI < 2.0
Extremely wet (EW)SPEI ≥ 2.0
Disclaimer/Publisher’s Note: The statements, opinions and data contained in all publications are solely those of the individual author(s) and contributor(s) and not of MDPI and/or the editor(s). MDPI and/or the editor(s) disclaim responsibility for any injury to people or property resulting from any ideas, methods, instructions or products referred to in the content.

