Abstract
Midlatitude westerly and East Asian summer monsoon (EASM) are crucial circulation systems in the upper and lower troposphere of East Asia that significantly influence mid-summer precipitation pattern. However, their synergistic effect on mid-summer precipitation in North China (NC) remains unclear. In this study, the concurrent variations of mid-summer westerly and EASM are categorized into two configurations: strong westerly–strong EASM (SS) and weak westerly–weak EASM (WW). At the synoptic timescale, the SS configuration significantly enhances precipitation in NC, whereas the WW configuration suppresses mid-summer rainfall. The underlying mechanism is that the SS pattern stimulates an anomalous quasi-barotropic cyclone–anticyclone pair over the Mongolian Plateau–Yellow Sea region. Two anomalous water vapor channels (westerly-driven and EASM-driven water vapor transport) are established in the southern and western peripheries of this cyclone–anticyclone pair, ensuring abundant moisture supply over NC. Meanwhile, frequently occurring westerly jet cores in northern NC form a jet entrance region, favoring strong upper-level divergent pumping and deep accents in its southern flank. This synergy between strong westerlies and EASM enhances both the moisture transports and ascending movements, thereby increasing precipitation over NC. Conversely, the atmospheric circulation associated with the WW pattern exhibits opposite characteristics, resulting in decreased NC rainfall. Our findings elucidate the synoptic-scale influences of westerly–monsoon synergy on mid-summer rainfall, through regulating moisture transports and westerly jet-induced dynamic uplift, potentially improving predictive capabilities for mid-summer precipitation forecasting.
1. Introduction
Situated in the boundary zone of the semiarid and humid regions, North China (NC) is highly sensitive to climate change. The mid-summer period (from mid-to-late July to early August) in NC marks the third stage of the East Asian summer monsoon (EASM) seasonal progression and accounts for approximately 65% of its annual precipitation amount, making it pivotal as the primary rainy period. NC is among China’s three major economic zones and most populated regions. Mid-summer rainfall in NC is characterized by high intensity and extremely uneven distribution, which exerts a profound influence on the economy and society [1,2]. Therefore, a comprehensive understanding of the variation features of mid-summer precipitation in NC is crucial for climate prediction and disaster prevention.
Substantial efforts have been devoted to elucidating the mechanisms governing the formation and variations of summer precipitation in NC. According to the early monsoon theory, the EASM system undergoes a distinct seasonal evolution that can be categorized into three principal stages. In late-spring, the EASM first establishes over the tropical South China Sea, marking the commencement of pre-flood season in South China. By mid-June, the monsoon progresses northward, with the primary rain belt (known as Meiyu/Baiu) located to the Yangtze River Valley. In mid-summer, the EASM undergoes its second northward advancement, establishing primary rainy season in NC and Northeast China. In other words, the rain belt in NC results from the northward advancement of the tropical monsoon [3,4,5]. However, other scholars have argued that NC’s rainy season is dominated by the subtropical monsoon rather than being a direct result of the northward advancement of tropical monsoon [6,7,8]. Despite the ongoing debate on the formation mechanisms of NC precipitation, it is widely acknowledged that the EASM predominantly controls mid-summer rainfall across various time scales. At the interannual scale, strong southerlies associated with EASM facilitate northward water vapor transport, typically resulting in increased rainfall in NC. Conversely, weaker EASM tends to produce increased precipitation over southern China and decreased rainfall over NC [9,10]. At decadal and long-term time scales, the documented weakening of the EASM since the 1970s has contributed to a southward displacement of the monsoonal rain belt, consequently inducing severe and persistent drought conditions throughout NC [11,12,13].
In addition to the EASM’s well-known influence on rainfall in NC, the midlatitude westerlies play an equally crucial role. The seasonal evolution of atmospheric circulation and summer rainfall patterns across eastern China are significantly modulated by the seasonal migration and intensity of the East Asian westerly jet [14,15,16,17]. Several investigations have emphasized the predominant role of midlatitude westerly jet in determining the rainfall distributions and the seasonal transitions in NC. Molnar et al. [18] proposed that, unlike the South Asian monsoon rainfall, EASM rainfall exhibits stronger associations with frontal systems and jet stream. The seasonal migration of the westerlies away from the northern edge of Tibetan Plateau marks the transition from Meiyu season to mid-summer. Chiang et al. [19] further introduced the “jet transition hypothesis”, arguing that the seasonal progression of EASM rainfall is regulated by changes in the meridional position of the westerlies relative to the Tibetan Plateau. Furthermore, variations in summer precipitation in NC are intricately linked to both the location and intensity of the East Asian westerly jet stream. A southward shift of the westerly jet can lead to significant negative rainfall anomaly across NC [20,21,22,23]. Wang et al. [17] identified an asymmetric impact of the westerly jet position on mid-summer rainfall: when the location of the jet north (south) of its median position, the southward displacement is associated with increased (decreased) rainfall anomalies over NC. Apart from the influence of the westerly location, westerly jet intensity also significantly modulates summertime rainfall patterns [20,24,25,26]. Strong westerlies north of the jet region increase precipitation in the northern part of Northeast China, and weakened westerlies within the jet region increase precipitation in NC [27]. Zhu et al. [28] proposed that weakened zonal winds in the southern subtropics over East Asia dynamically induced drought conditions in NC. Huang et al. [25] found that a configuration of strong subtropical jet with weak polar jet is associated with increased summer rainfall over NC.
Previous studies have mainly focused on the individual effects of EASM or the westerlies on NC mid-summer precipitation. However, the formation of East Asian rain belts results from the interaction between the East Asian planetary frontal activities and the Asian monsoon system [29,30,31]. Particularly, during peak mid-summer, NC resides in the critical confluence zone of the westerlies and EASM. Their interactions and joint effects generate complex precipitation patterns across the region. Recent attention has been paid to the combined effects of the westerly and the Asian monsoon on precipitation anomalies. Qian et al. [32] identified an interaction line between the southerly and westerly flows from Northwest China to Northeast China. This interaction line exhibits year-to-year and decadal variations, influencing dry–wet oscillations near the monsoon’s northernmost marginal active zone. Chen et al. [33] demonstrated that the synergistic interaction of the westerly and EASM can induce a barotropic cyclonic anomaly over Mongolia, which modulates the interannual summer precipitation patterns across the monsoon boundary zone. Song et al. [34] and Wang et al. [35] explored the interannual or decadal effects, respectively, of the westerly and monsoon interplays on the precipitation in southeastern Tibetan Plateau. In addition, large-scale or regional topography is also known to modulate precipitation patterns by altering westerly flows, moisture transport, and cloud processes [36,37,38,39]. Typically, the Tibetan Plateau (TP) can strengthen and induce meridional shifts of the westerly jet, modulate EASM evolution, and determine NC precipitation variations through dynamical and thermo-dynamical forcing [40,41,42,43].
Most existing studies have focused on investigating the interannual-to-multidecadal effect of the westerly–monsoon interaction on precipitation across East Asia [33,34,35]. However, there remains a paucity of understanding the synoptic-scale influences of westerly–monsoon interplay on mid-summer rainfall, which is crucial for understanding the precipitation dynamics and changes.
This study aims to characterize NC precipitation patterns under different configurations of the westerlies and EASM and to examine their synergistic impacts at the synoptic timescale. Our findings provide a new perspective on the climatic effects of westerly–monsoon interactions and novel insights for enhancing the monitoring and prediction capabilities for the rainy season in NC.
2. Data and Definitions
2.1. Data
(1) Precipitation data. Gridded daily precipitation dataset (V2.0) (http://data.cma.cn/, accessed on 1 August 2021) from 1961–2020 is derived from the China National Meteorological Science Data Center, with a spatial resolution of 0.5° × 0.5°. Two other precipitation datasets are used for validation: 1951–2007 Asian Precipitation-Highly Resolved Observational Data Integration Towards Evaluation of Water Resources (APHRODITE) daily precipitation dataset [44], with a spatial resolution of 0.5° × 0.5°, and the 1979–2018 Climate Prediction Center (CPC) daily precipitation dataset [45], with a spatial resolution of 0.5° × 0.5°.
(2) Atmospheric circulation data. Daily and 6-hourly data for the period 1961–2020 are obtained from the National Center for Environmental Prediction (NCEP) and National Center for Atmospheric Research (NCAR) reanalysis dataset [46]. Variables include zonal wind, meridional wind, geopotential height, vertical velocity, and specific humidity. This dataset covers 17 vertical layers from 1000 hPa to 100 hPa, with a horizontal resolution of 2.5° × 2.5°. The 6-hourly data are used to identify the westerly jet core.
2.2. Definitions
(1) Mid-summer. The daily precipitation and atmospheric circulation data are processed into pentad-mean data (each month consisted of 6 pentads), with each year divided into 72 pentads. The mid-summer period is defined as the 40th–45th pentad of each year, i.e., from July 16 to August 15. The definition of mid-summer is consistent with Zhao et al. [47]. The total sample size of mid-summer precipitation in this study is 360 pentads. Based on the 360 pentads data, we conducted composite analysis to investigate the westerly-EASM synergy. Composite anomalies are tested via two-tailed t-tests to assess significance.
(2) Frequency of the westerly jet core. Following Ren et al. [48], the frequency of the westerly jet core in mid-summer is determined using 6-hourly zonal wind field data and an event-based method [49]. Specifically, a westerly jet core event is defined when the zonal wind speed at a grid point at a given time is greater than or equal to 20 m·s−1 and is the maximum among the surrounding 9 grid points. The frequency of the jet core over a given period is defined as the number of jet core occurrences at the grid point divided by the total number of 6-hourly observations for the given period (expressed as a percentage).
3. Basic Climatic Characteristics of Mid-Summer Circulation and Precipitation in East Asia
Before exploring the synergetic effect of the westerly and EASM, we first examine the climatological features of the mid-summer circulation over East Asia. The upper tropospheric westerlies and lower tropospheric EASM exhibit pronounced seasonal variations. As shown in Figure 1a, from winter to summer, the East Asian subtropical westerlies undergo a systematic deceleration accompanied by a progressive northward migration. During mid-summer (the 40th–45th pentad), the subtropical westerlies diminish to 20–30 m·s−1, with the westerly axis reaching its northernmost position at approximately 44° N. Regarding the seasonal variation in EASM, southerlies initially establish around 25° N over the Jiangnan region and experience substantial intensification around pentad 27, concurrent with a distinct northward progression. By mid-summer, the EASM reaches its northernmost extent over NC, coinciding temporally with the abrupt northward displacement of the midlatitude westerlies. Therefore, in this study, mid-summer is identified as a critical period for examining the synergy between the westerly and EASM over NC.
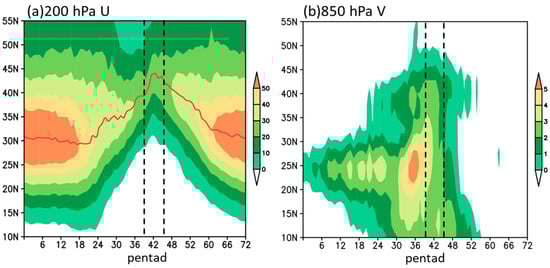
Figure 1.
Time-latitude distributions of the 1961–2020 mean 200 hPa zonal wind (a) and 850 hPa meridional wind (b) averaged for 110–122.5° E (unit: m·s−1, only positive values are shown). The black dashed lines indicate mid-summer period; the red solid line in (a) indicates the position of the westerly jet axis.
In mid-summer, the subtropical westerly jet is characterized by a zonally elongated band stretching across extratropical Asia (Figure 2a), with the jet axis located at 45° N. Two major westerly centers are discernible along the jet stream, located over Xinjiang and North-Northeast China, respectively. The former exhibits strong zonal wind speeds exceeding 32 m·s−1, stretching from 70–110° E; whereas the latter, spanning from 110° E to 140° E, displays comparatively weaker wind intensities exceeding 23 m·s−1. Based on the definition provided in Section 2.2, the spatial distribution of the occurrence frequency of the 200 hPa westerly jet core during mid-summer is determined. Consistent with the zonal wind, the frequency distribution of the jet core exhibits a quasi-zonal extension, with centers located in northern Xinjiang, NC, and Northeast China. Notably, the frequency of jet core occurrences over NC exceeds 1.6%, indicating that, despite having less frequent jet cores compared to northern Xinjiang, this region can be recognized as a key area characterized with active westerly disturbances.
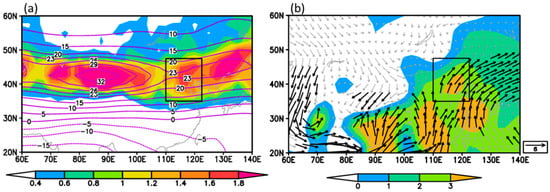
Figure 2.
Climatological-mean (1961–2020) characteristics of mid-summer circulation fields over East Asia. (a) Occurrence frequency percentage of 200 hPa westerly jet core (shaded, unit: %) and zonal wind speed (contours, unit: m·s−1); (b) 850 hPa wind vectors (unit: m·s−1, black vectors indicate speeds larger than 3 m·s−1) and meridional wind speed (shaded, unit: m·s−1). Black rectangles indicate the key area of westerly–monsoon interaction.
In the lower troposphere at 850 hPa, strong southwesterly winds prevail over eastern China during mid-summer, indicating the extensive establishment of the summer monsoon over northern and northeastern China. The northern boundary of the southwesterly wind exceeding 4 m·s−1 reaches northern NC at 45° N, with several meridional wind centers exceeding 3 m·s−1 observed across central NC, as well as in southwestern and southeastern China. Considering the spatial coincidence between westerly jet core frequencies and prevailing southerly flows, we designate their intersection zone (35–47.5° N, 110–122.5° E) as the key region for westerly–monsoon interaction (indicated by the black rectangular box in Figure 2). Additionally, the designated area corresponds with the main geographic region of NC; consequently, the term “NC region” in this study also refers to this key area. This paper primarily examines the synergistic effects of westerly–monsoon within this designated region on precipitation patterns.
Precipitation patterns across Eastern China exhibit pronounced seasonal evolution characteristics. Figure 3a shows the time-latitude cross section of precipitation along 110–122.5° E. The East Asian monsoonal rainfall initially establishes in Jiangnan between 24 and 30° N. Following the onset of the South China Sea monsoon around pentad 27, the rain belt is split into two branches: northern and southern branches. The northern branch intensifies rapidly and undergoes an abrupt northward migration after pentad 36. During pentad 40–45, NC and Northeast China (north of 35° N) enter the main flood period, with precipitation rate exceeding 4 mm·d−1. Figure 3b shows the climatological mean precipitation rate in mid-summer. The precipitation rate across NC increases from northwest to southeast, with peak rainfall centered in southern Hebei, Shandong, and southern Liaoning provinces. The regional average precipitation rate attains 3.9 mm·d−1, with peak rainfall intensities exceeding 5 mm·d−1 in southeastern NC. Figure 3c shows the inter-pentad variability in precipitation rate anomalies averaged over NC. Extreme pentad precipitation events can be identified using a criterion of precipitation rate anomalies exceeding the 99th percentiles. Under this classification, five extreme pentad precipitation events are selected in our study (marked by red circle in Figure 3c), including pentad 41 of 1962, pentad 44 of 1963, pentad 44 of 1984, pentad 43 of 1996, and pentad 41 of 2012.
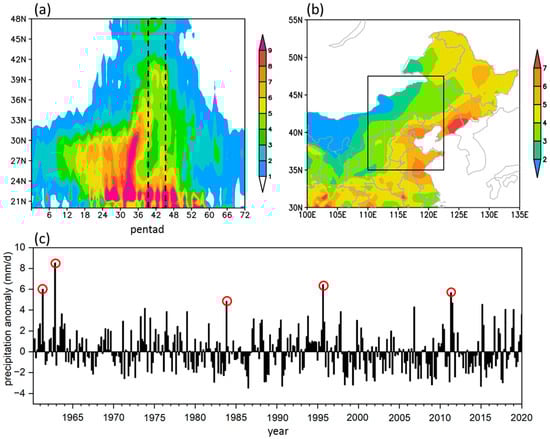
Figure 3.
(a) Time-latitude distribution of the 1961–2020 mean pentad precipitation rate averaged for 110–122.5° E (unit: mm·d−1); (b) The 1961–2020 mean precipitation rate during mid-summer (unit: mm·d−1); (c) Pentad (40th–45th pentad in each year) precipitation rate anomalies averaged for NC in mid-summer from 1961–2020 (unit: mm·d−1). The dotted lines in (a) indicate 40th–45th pentad. The black rectangle in (b) indicates NC region. The red circles in (c) indicate the pentad extreme precipitation cases.
4. Synergistic Effect of Midlatitude Westerly and EASM on Rainfall in NC
4.1. Precipitation Patterns Under Two Westerly–Monsoon Configurations
To explore the synergistic effect of midlatitude westerlies and EASM, we identified different concurrent configurations of these circulation systems. In each year, the mid-summer period is defined as the 40th–45th pentad, totaling 360 pentads spanning from 1961–2020. The pentad mean westerly index (WI) is obtained by averaging the 200 hPa zonal wind within the NC domain and was standardized. Similarly, the pentad mean monsoon index (MI) is calculated using the 850 hPa meridional wind. Figure 4 presents the pentad intensity index for WI versus MI, and the correlation coefficient between them is −0.19. Following Zhang and Chen [50], two in-phase configurations are identified using ±0.5 standard deviations as follows: (1) strong westerly and EASM configuration (WI ≥ 0.5 and MI ≥ 0.5, denoted as SS) and (2) weak westerly and EASM configuration (WI ≤ −0.5 and MI ≤ −0.5, denoted as WW). There are 20 and 27 pentads corresponding to SS and WW configurations during the mid-summer period of 1961–2020.
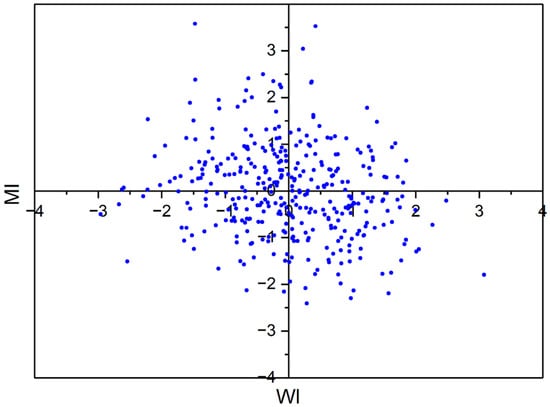
Figure 4.
Pentad indices for the WI versus MI in mid-summer during 1961–2020.
The spatial distribution of the composite mid-summer rainfall anomalies over NC under different configurations of WI-MI is presented in Figure 5. Under the SS configuration (Figure 5a), pronounced positive precipitation anomalies are evident across NC, Northeast China, and eastern parts of Northwest China, while negative precipitation anomalies are observed throughout Southern China south of 35° N. The maximum positive rainfall anomaly center is located in eastern Hebei and eastern Inner Mongolia, where precipitation rate anomalies exceed 4 mm·d−1 and rainfall anomaly percentages surpass 80% (Figure S1a). Conversely, under the WW configuration (Figure 5b), negative precipitation anomalies predominate across NC. The negative anomaly center is situated in the southwest of NC, with precipitation rate anomalies exceeding −3.5 mm·d−1 and rainfall anomaly percentages ranging from −60% to −40% (Figure S1b).
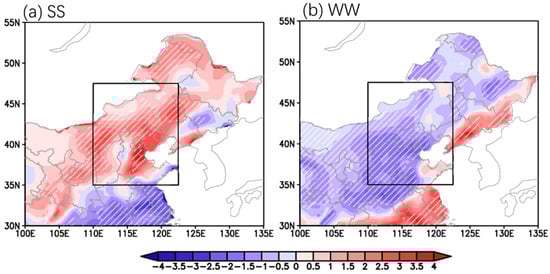
Figure 5.
Mid-summer precipitation rate anomalies composited for (a) strong WI–strong MI pentads, (b) weak WI–weak MI pentads (unit: mm·d−1, hatched areas indicate passing the two-tailed t test at 10% significant level). The black rectangles indicate NC region.
The preceding analysis demonstrates that at the synoptic scale, concurrent strong westerlies and EASM over their key interaction zone significantly enhance precipitation in NC, whereas concurrent weak westerlies and EASM suppress rainfall across the region. This synergetic effect of westerlies and EASM is further validated using APHRODITE (Figure S2) and CPC (Figure S3) precipitation data. The validation results are consistent with Figure 5, indicating the reliability and robustness of the relationship between westerly–EASM synergy and precipitation pattern.
4.2. Possible Mechanisms
To explore the underlying mechanism for the westerly–EASM synergy on NC rainfall, the lower and upper tropospheric circulation anomalies are composited for the SS and WW configurations. At 850 hPa, the concurrently strong westerly and EASM (SS configuration) induce an anomalous cyclone–anticyclone pair in East Asia, centered over the Mongolian Plateau and Yellow Sea, respectively (Figure 6a). This pronounced cyclone–anticyclone pair persists throughout the troposphere and remains discernible at 200 hPa (Figure 7e), with little shift in position, indicative of a vertical quasi-barotropic structure. This circulation pattern aligns with the findings of Zhao et al. [47], who demonstrated that the northern NC plain heavy precipitation is associated with an anomalous low-pressure system at high latitudes coupled with a northward-extended Western North Pacific subtropical high. The mid-lower tropospheric circulation pattern identified for heavy rainfall events in their study exhibits consistency with our current findings. The cyclone–anticyclone pair is also found to be identical to the circulation pattern associated with Tibetan Plateau springtime sensible heating in Duan et al. [51], indicating circulation anomaly in SS/WW could be linked to TP-forced Rossby waves.
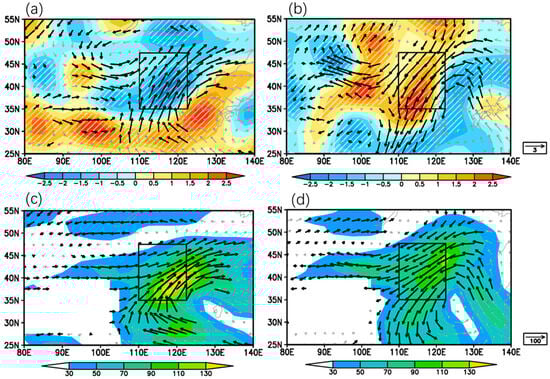
Figure 6.
Lower-tropospheric mid-summer circulation composited for SS (a,c) and WW (b,d) pentads. (a,b) Anomalies of 850 hPa wind (vectors, unit: m·s−1) and 500 hPa vertical velocity (shaded, unit: 0.01 Pa·s−1); (c,d) Anomaly of integrated moisture flux from surface to 700 hPa (vectors, shaded areas indicate the magnitude of moisture flux anomalies, unit: kg(m·s)−1). Black vectors and hatched areas indicate passing the two-tailed t test at 10% significant level. The black rectangles indicate NC region.
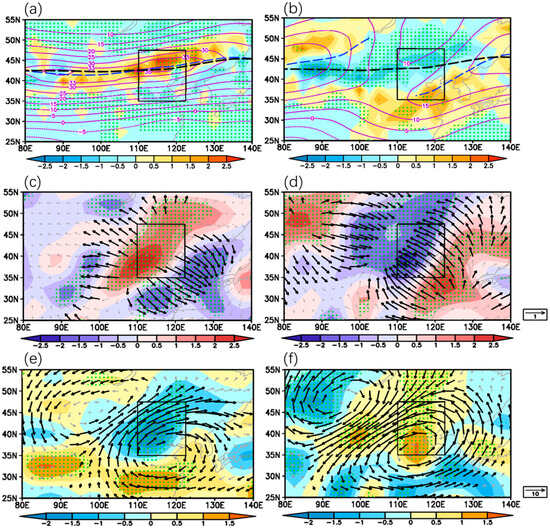
Figure 7.
Upper-tropospheric mid-summer circulation fields composited for SS (a,c,e) and WW (b,d,f) pentads at 200 hPa. (a,b) Frequency anomalies of zonal westerly jet core (shaded, unit: %), zonal wind (purple contours, unit: m·s−1) and jet axis (blue dashed lines; black dashed lines indicate 1961–2020 mean); (c,d) Anomalies of divergent wind (vectors, unit: m·s−1) and divergence (shaded, unit: 10−6 s−1); (e,f) Anomalies of wind (vectors, unit: m·s−1) and vertical velocity (shaded, unit: 0.01 Pa·s−1). Black vectors and dotted areas indicate passing the two-tailed t test at 10% significant level. The black rectangles indicate NC region.
A large supply of water vapor is a prerequisite for rainfall development [52]. Climatologically, summertime water vapor primarily arrives in NC via four water vapor channels: the EASM from the western Pacific, the South Asian summer monsoon from Indian Ocean, cross-equatorial flow between 100° E and 120° E, and the mid-latitude westerlies [53,54]. The anomalous cyclone–anticyclone pair in the lower troposphere contributes to changes in water vapor transport patterns in East Asia. Under the SS configuration, this cyclone–anticyclone pair establishes two anomalous water vapor channels: the westerly-driven water vapor transport along the south periphery of the cyclone and the EASM-driven water vapor transport along the western periphery of the anticyclone (Figure 6c). The latter channel is more pronounced than the former, directing abundant moisture through enhanced southwest water vapor fluxes into NC. These two anomalous water vapor channels amplify the climatological mid-latitude westerly and EASM water vapor fluxes during mid-summer. Furthermore, the conjunction of these two water vapor channels facilitates the formation of a strong water vapor flux center over NC, with intensity exceeding 130 kg(m·s)−1, which favors enhancement of substantial rainfall development.
Meanwhile, circulation anomalies induced by the concurrently weakened westerly and EASM (WW configuration, Figure 6b,d) exhibit completely contrasting features. An anomalous anticyclone–cyclone pair over the Mongolian Plateau and Yellow Sea induces anomalous northeasterly flows and easterly–northeasterly water vapor flux anomalies across NC. These northerly water vapor fluxes over NC weaken the climatological southwesterly water vapor transport patterns and inhibit northward moisture advection toward NC, creating conditions unfavorable for precipitation development.
Additionally, in the SS configuration, enhanced mid-tropospheric accents rate with maximum values exceeding −0.025 Pa·s−1 extend across the entire NC region (Figure 6a), establishing favorable dynamic conditions for abundant rainfall. Conversely, the WW configuration shows opposite characteristics, with anomalous downdrafts exceeding 0.02 Pa·s−1 dominating southern NC, strongly suppressing local precipitation formation.
Notably, under the SS configuration, NC is predominantly characterized by lower-level divergent airflow (weaker wind speeds along the southern periphery of NC compared to central regions) rather than convergent circulation (Figure 6a), a pattern that typically does not favor the development of upward motion. This apparent contradiction raises a critical question: What is the dominant factor contributing to the observed vertical ascent? To elucidate this seemingly paradoxical relationship, we further examine the upper tropospheric circulation patterns in Figure 7.
Under the SS configuration, the zonal wind intensifies significantly across NC and the upstream region at the upper-troposphere. The subtropical westerlies exceeding 30 m·s−1 span the mid-latitudes band of East Asia, with a slight northward (southward) shift of the westerly axis east (west) of 110° E. Notably, a westerly center exceeding 35 m·s−1 resides over northern NC, with an intensity nearly comparable to that of the zonal wind center in 90° E (Figure 7a). Correspondingly, an increased frequency of jet cores is observed along the jet stream, with anomalies exceeding 1% centered over northern NC. The strengthened westerlies and frequent occurrence of jet cores establish a distinctive jet entrance in northern NC. According to synoptic meteorological principles, strong westerlies promote upper-level divergence along the southern flank of the jet entrance region due to the anticyclonic shear of the zonal wind. As shown in Figure 7c, a significant anomalous divergence center exceeding 2.5 × 10⁻⁶ s−1, accompanied by upper-level divergent wind, is observed over southwestern NC. This upper-level divergence serves as a local “pumping-like” process, inducing a secondary circulation characterized by extremely favorable updrafts exceeding −0.02 Pa·s−1 over NC (shaded areas in Figure 7e). These updrafts are further detailed in the cross-section over 110–120° E in Figure 8a. The anomalous secondary circulation of the jet stream manifests with accents in the southern flank of the jet entrance at 35–50° N and descents in the northern flank of the jet entrance north at 55° N. The anomalous accents induced by upper-level divergence extend deeply and broadly throughout the troposphere within 35–50° N, with maximum ascent rates reaching −0.025 Pa·s−1 in the upper-troposphere between 300 and 400 hPa, indicating its association with deep convective precipitation.
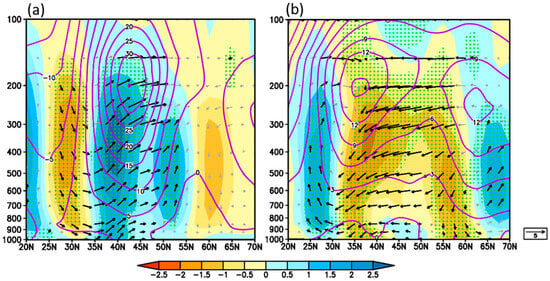
Figure 8.
Composite latitude-height (averaged in 110–120° E) cross-section distribution of meridional and vertical velocity anomalies (shaded for omega, unit: −0.01 Pa s−1; vectors for vertical component scaled by 100, unit: m·s−1) and zonal wind (purple contour, unit: m·s−1) in SS (a) and WW (b) configurations. Black vectors and dotted areas indicate passing the two-tailed t test at 10% significant level.
In contrast, under the WW configuration, the intensity of the subtropical westerly jet weakens along the climatological westerly zonal wind belt (Figure 7b). Notably, the westerly jet axis exhibits a distinctive discontinuous pattern, breaking at approximately 110° E into eastern and western segments. The western segment spans the Xinjiang-Baikal Lake region, while the eastern segment extends from the Huanghuai region to northeast China, with its center positioned at 140° E. The climatological westerly jet core over northern NC dissipates completely, yielding to a low-intensity zone characterized by reduced zonal winds (10–15 m·s−1). The eastern segment of the jet axis undergoes a pronounced southward displacement towards the Huanghuai region, resulting in diminished occurrences of jet cores north of the axis and increased frequencies to its south. Consequently, NC is positioned on the northern flank of the jet entrance zone, a configuration conducive to upper-level convergence (Figure 7d) and subsidence (Figure 7f). The secondary circulation associated with the jet stream is illustrated in Figure 8b. Pronounced accents dominate the Jiangnan area at 25–30° N due to the southward displacement of the westerly jet, while strong subsidence related to upper-level convergence prevail throughout the entire troposphere over NC. This extensive vertical downward movement significantly suppresses the development of mid-summer rainfall across NC. A notable polar jet center is observed at 65° N in Figure 8b; however, since the primary focus of this study is subtropical westerlies, analysis of polar jets is beyond the scope of the present study.
4.3. Pentad Extreme Precipitation Case
The previous section examined the synergistic effects of the westerlies and EASM on NC precipitation using composite analysis. In this section, we further elucidate this relationship by analyzing pentad-scale extreme precipitation events.
Table 1 presents the regional-mean standardized precipitation rate, WI and MI for five extreme precipitation cases (marked by the red circle in Figure 3c). Among these five cases, two cases (the 44th pentad of 1984; the 41st pentad of 2012) satisfy the criteria for SS configuration, suggesting that the synergistic impact between the westerlies and EASM contribute to extreme rainfall development. It is important to acknowledge that the physical mechanisms underlying extreme precipitation are complex, and multiple factors other than westerly-EASM synergy contribute to the generation of extreme rainfall, including topographic lifting [55] and tropical cyclone activities [56]. Consequently, it is reasonable that the SS configuration cannot account for all extreme precipitation cases. During years characterized by extraordinarily strong EASM (e.g., 1962 and 1963 cases), extreme precipitation occurs even without substantial westerly influence. A plausible explanation for this phenomenon is that extremely intense EASM may independently sustain and enhance low-level jets, thereby facilitating substantial moisture transport and ultimately generating extreme precipitation events.

Table 1.
Standardized precipitation rate, WI and MI averaged over NC region in five pentad extreme precipitation cases.
The extreme precipitation case in 44th pentad of 1984 meets the criteria for the SS configuration and is selected as a typical pentad extreme precipitation case to investigate the westerly–EASM synergy. The rainfall anomaly evolution of this event is presented in Figure 9. At pentad −1, a rain belt appears in the eastern part of Northwest China, with precipitation rates exceeding 6 mm·d−1, while NC experiences relatively minimal rainfall (Figure 9a). By pentad 0, the rain belt drastically intensifies, exhibiting a pronounced northeast-southwest oriented pattern around the Bohai Sea, where pentad mean precipitation exceeds 40 mm·d−1, which is approximately eight times the climatological mean (Figure 9b). Subsequently, this rain belt migrates northeast and significantly weakens at pentad +1 (Figure 9c).
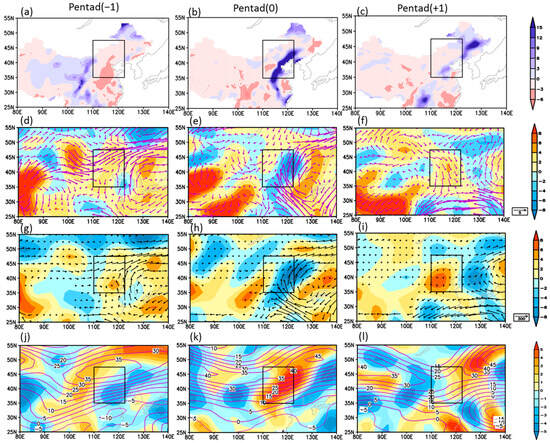
Figure 9.
Precipitation and atmospheric variables during extreme precipitation events in 1984. (Where −1, 0, +1 denote one pentad before, during, and one pentad after the extreme precipitation event). (a–c) Anomalies of precipitation rate (unit: mm·d−1); (d–f) Anomalies of 850 hPa wind (vectors, unit: m·s−1) and vertical velocity (shaded, unit: −0.01 Pa·s−1); (g–i) Anomalies of integrated moisture flux from the surface to 700 hPa (vectors, unit: kg(m·s)−1) and 500 hPa vertical velocity (shaded, unit: −0.01 Pa·s−1); (j–l) 200 hPa zonal wind speed (contours, unit: m·s−1) and divergence anomalies (shaded, unit:10−6 s−1). The black rectangles indicate NC region.
The anomalous circulation pattern reveals that, at pentad −1, an anomalous anticyclone is established over the Japan Sea, with its associated southerly flows prevailing across eastern NC (Figure 9d). Concurrently, a zonal wind center appears over northern NC at 47° N, 110–120° E (Figure 9j). This configuration establishes a westerly-driven water vapor transport channel along 45° N and an EASM-driven water vapor transport channel originating from the northward airflow west of the Japan Sea anticyclone (Figure 9g). During this period, the regional mean WI is 0.28, indicating that westerly intensity remains within normal value and has not yet reached the threshold for a “strong westerly” (WI ≥ 0.5), as defined in our classification criteria. The entrance zone of the westerly and its resultant upper-level divergence are situated in the eastern part of Northwest China rather than over NC (Figure 9j). Consequently, westerly-driven updrafts and precipitation could only develop to the west of NC. Therefore, despite abundant moisture over NC, the midlatitude westerly and EASM are not concurrently strong at pentad −1, and this configuration is unfavorable for precipitation development over NC during this pentad.
At pentad 0, during the peak of the extreme precipitation event, the Japan Sea anticyclone migrates westward to the Yellow Sea and intensifies significantly (Figure 9e). Concurrently, both the EASM and westerly winds strengthen significantly. The anomalous cyclone–anticyclone pair develops prominently over Mongolia and the Yellow Sea. Enhanced southerlies to the west of the Yellow Sea anticyclone facilitate continuous monsoon-driven water vapor transport into NC (Figure 9h), thereby creating favorable moisture conditions for extreme precipitation. Meanwhile, the upper jet core intensifies and shifts eastward, positioning NC in the southern entrance of the jet stream where pronounced upper-level divergence develops (Figure 9k). This upper-level divergence acts as an upper “pumping”, generating vigorous ascending motion in southeastern NC that directly contributes to extreme precipitation formation. At pentad +1, the cyclone–anticyclone pair shifts eastward towards northeast China and the Japan Sea (Figure 9f). Northerlies developing along the western periphery of the cyclone dominate over NC, indicating the weakening of the EASM. In addition, the westerly jet core migrates northeastward along its axis, resulting in reduced westerlies over NC (Figure 9l). Consequently, the resultant subsidence associated with the concurrent weakening of both westerlies and EASM leads to suppressed rainfall across NC.
The above analyses indicate that, consistent with the composite mean precipitation, the selected pentad extreme precipitation event is fundamentally driven by the westerly–monsoon synergy. In this specific case of extreme precipitation, the monsoonal southerlies enhance the northward transport of water vapor. However, at pentad −1, monsoonal southerlies alone are insufficient to trigger extreme precipitation. The upper-level divergence induced by strengthened westerlies plays a critical role in this extreme precipitation formation. At pentad 0, when westerlies and monsoonal southerlies are concurrently strong, their synergistic impact creates an optimal configuration that simultaneously enhances both moisture and dynamic conditions, thereby facilitating extreme rainfall occurrence.
5. Conclusions
In mid-summer, NC serves as a pivotal region where the interaction between the westerly and EASM exerts a significant influence on precipitation patterns. This study examines the synergistic effect of westerly–EASM on mid-summer rainfall across NC at the synoptic scale. Based on a 60-year (1961–2020) NCEP/NCAR reanalysis and high-resolution gridded precipitation data, we identified two distinct configurations of westerly and EASM (strong westerly–strong EASM and weak westerly–weak EASM) and illustrated their synergetic effect. The characteristic precipitation distribution patterns and the underlying physical mechanisms of westerly-monsoon synergy affecting NC precipitation are systematically investigated. The conclusions can be summarized as follows.
(1) In mid-summer, both the EASM and midlatitude westerlies reach their northernmost extent, converging in a defined confluence zone (35–47.5° N, 110–122.5° E) that serves as a critical region for their synergy. To investigate this synergy, two concurrent configuration types are identified using a ± 0.5 standard deviation criterion: strong westerly–strong EASM (SS) and weak westerly–weak EASM (WW). Among the 360 pentads analyzed over the 60-year period, 20 pentads correspond to the SS configuration and 27 pentads to the WW configuration. Composite analysis reveals contrasting effects of SS and WW configurations on mid-summer rainfall across NC. These results suggest that in mid-summer, concurrently strong westerly and EASM lead to enhanced rainfall, whereas concurrently weakened westerly and EASM lead to reduced precipitation.
(2) The underlying mechanism of westerly-monsoon synergistic effects on mid-summer precipitation in NC is proposed (Figure 10). Concurrently strong westerly and EASM stimulate an anomalous quasi-barotropic cyclone–anticyclone pair that extends from the Mongolian Plateau to the Yellow Sea. This anomaly pair establishes two anomalous water vapor channels: the westerly-driven channel along the southern periphery of the cyclonic anomaly and the EASM-driven channel along the western periphery of the anticyclonic anomaly, with the latter exhibiting greater intensity than the former. These dual water vapor channels create favorable moisture conditions for precipitation by directing ample water vapor into NC. Meanwhile, the strengthened westerlies lead to increased frequencies of westerly jet cores and establish a pronounced jet entrance zone over northern NC. Along the southern side of this jet core entrance region, significant upper-level divergence develops, acting as a “pumping effect” that triggers deep vertical accents throughout the troposphere. This upper-level divergence and associated vertical accents provide favorable dynamic conditions for abundant rainfall development. Therefore, in mid-summer, the westerly–EASM synergy enhances both water vapor transport in the lower layers and strengthens dynamic uplift in the upper troposphere, leading to excessive precipitation across NC.
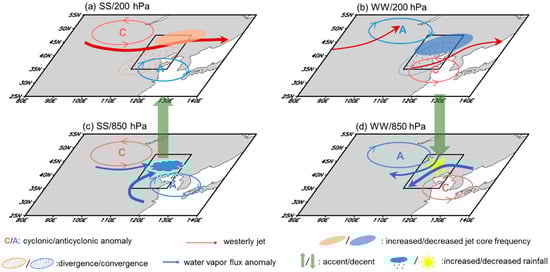
Figure 10.
Schematic diagram of the physical process of the synergistic effect of westerly-EASM on precipitation over NC. The black rectangles indicate NC region.
In contrast, the WW configuration generates substantially reduced water vapor transport into NC through the development of anomalous circulation features between an anticyclone-cyclone pair over eastern China. Furthermore, suppressed westerlies contribute to a distinctive disruption in the East Asian subtropical westerly jet over NC, characterized by a northward displacement of its western section and a southward shift of its eastern section. This southward displacement of the eastern segment of the westerly jet significantly reduces the frequency of jet core occurrences along the northern flank of the jet entrance region where NC is situated, resulting in pronounced upper-level convergence and associated downdrafts.
The combination of suppressed water vapor transport in the lower troposphere and enhanced dynamical subsidence throughout the troposphere, both driven by the westerly-monsoon synergistic effect, creates conditions fundamentally unfavorable for substantial rainfall development.
To further elucidate this mechanism, we analyzed the atmospheric circulation anomalies associated with pentad-scale extreme precipitation events. Among the five extreme precipitation cases examined, two events (the 44th pentad of 1984; the 41st pentad of 2012) satisfy the criteria for the SS configuration. The pentad extreme precipitation case in 1984 serves as a typical case induced by westerly-monsoon synergy. At the period (pentad 0 in Figure 9) when westerlies and monsoonal southerlies are concurrently strong, their synergistic effect enhances both moisture transport and vertical accent, creating exceptionally favorable conditions for extreme rainfall generation. Note that extreme precipitation formation involves complex physical processes, and the SS configuration cannot account for all extreme precipitation cases. More in-depth investigations regarding the westerly–EASM synergy in the formation of extreme precipitation are needed in future studies.
6. Discussion
The present study mainly discussed the WI–MI synergy under their in-phase configurations. We also conduct additional analyses under out-of-phase configurations. Figures S4 and S5 in Supplementary Information present the rainfall patterns and associated circulation features for the weak westerly–strong EASM (WS) and strong westerly–weak EASM (SW) configurations, respectively. Our composite analyses include 39 pentads for the WS configuration (WI ≤ −0.5 and MI ≥ 0.5) and 45 pentads for the SW configuration (WI ≥ 0.5 and MI ≤ −0.5).
The WS composite (Figure S4a) reveals positive rainfall anomalies across most regions of NC. However, compared to the SS configuration, the distribution pattern exhibits a more localized feature, with rainfall center over 3 mm·d−1 shifting to southern NC. At 850 hPa (Figure S4b), the anomalous cyclonic-anticyclonic pair could also be observed extending from Mongolia to the Yellow Sea, exhibiting a more quasi-zonal orientation than in the SS configuration. Notably, this low-level pattern transitions to a meridional anticyclonic–cyclonic dipole over eastern China at 200 hPa (Figure S4d). The weakened westerlies in this configuration diminish the westerly-driven moisture transport channel, and only the anomalous monsoon-driven water vapor transport maintains over NC (Figure S4c). Consequently, compared to the SS configuration, the total anomalous water vapor transport in WS configuration is comparatively weakened and attains the value less than 90 kg (m·s)−1. The reduced westerly intensity also weakens the upper-level divergence (0.5 × 10⁻⁶ s−1 at 200 hPa; Figure S4e), which is insufficient to sustain deep convection. As shown in Figure S4f, vertical motion is confined to layers below 300 hPa, resulting in shallower, more localized precipitation events compared to the SS configuration.
In the SW configuration, most regions of NC experience reduced precipitation, with the most pronounced rainfall decrease centered in southeastern NC (Figure S5a). The negative precipitation anomalies exhibit weaker intensity compared to those in the WW configuration. The associated circulation patterns display an approximate opposite distribution to those of the WS configuration, characterized by a zonally-extended anticyclonic-cyclonic anomaly pair stretching over Mongolia to the Japan Sea at 850 hPa (Figure S5b), and a meridional cyclonic-anticyclonic pair (Figure S5d) over eastern China at 200 hPa. The dominant northerly moisture flux anomalies over NC (Figure S5c) show reduced magnitude relative to the WW case. This configuration generates weak upper-level convergence anomalies (−1 to −0.5 × 10⁻⁶ s−1) over NC (Figure S5e), which are insufficient to produce robust, deep-layer subsidence. Consequently, the induced vertical descent remains confined to relatively shallower atmospheric layers below 300 hPa over NC (Figure S5f), resulting in relatively modest rainfall reduction compared to the WW configuration.
Therefore, under the in-phase configurations when the westerly and EASM are both strong or weak (SS or WW), the synergistic effects of westerly–EASM produce the most pronounced impacts on NC precipitation. In contrast, out-of-phase configurations generate relatively shallow and weak vertical motions, resulting in more limited precipitation enhancement or suppression effects. In the WS configuration, precipitation tends to be more localized. This spatial concentration may be attributed to topographic influences. As NC is characterized with complex terrain, with Taihang Mountains (Mt. Taihang) to the west and Yanshan Mountains (Mt. Yanshan) to the north, the impact of regional topography in precipitation initiation and amplification should not be overlooked. For instance, the extreme rainfall in July 2023, August 1996, July 2016 are reported to be closely linked to steep topographical lifting and moist convergence along the eastern foothills of Mt. Taihang [38,57,58]. Such orographically forced convergence can trigger localized precipitation through moisture convergence mechanisms, even in the absence of strong upper-level jet influences. Anomalous warming over Mongolian Plateau also contributed to the eastward expansion of heavy rainfall in July 2023, through modulating the westward extension and northward shift of Western Pacific Subtropical High [59].
In mid-summer, NC is a distinctive region characterized by the convergence of the westerly and the EASM. Consequently, in this study, NC is designated as the key interactive region for the westerly and EASM. The key domain defined in our study is distinct from that of Chen et al. [33], who selected separate key domains for westerlies and EASM. Particularly, they defined the westerly key domain in central Xinjiang (35–42.5° N, 80–100° E) at the mid-troposphere (500 hPa) and examined how variations in the WI are modulated by the Silk Road pattern. However, our analysis reveals that the interannual correlation coefficient between WI defined in our study and the Silk Road pattern is statistically insignificant (−0.1), suggesting that the variations of the westerlies over NC may operate independent of the Silk Road pattern. The synergistic mechanisms between the westerlies and monsoons can exhibit regional complexity. The synergistic mechanisms and their climatic impacts are sensitive to domain selection. Furthermore, according to the recent studies, both the EASM and East Asian subtropical westerly jet are projected to strengthen under global warming scenarios of 1.5 °C and 2 °C above pre-industrial levels [60,61]. This projected strengthening correlates with enhanced summer-mean precipitation and increased frequency of extreme precipitation days over NC. Further investigation is warranted to investigate the effect of westerly–monsoon interaction on precipitation over NC under different emission scenarios. Moreover, mid-summer precipitation over NC is modulated by other external factors, including tropical Pacific Sea surface temperatures [62], Indian Ocean Sea surface temperatures [63], Atlantic Sea surface temperatures [2], and Arctic Sea ice [64]. The increased occurrence of extreme precipitation events over eastern China has also been linked to anthropogenic forcings [65]. Detailed investigations are required to further elucidate how these external forcings influence rainfall over NC through modulation of the westerly-monsoon synergistic interactions.
Supplementary Materials
The following supporting information can be downloaded at: https://www.mdpi.com/article/10.3390/atmos16060658/s1. Figure S1: Mid-summer precipitation anomalies percentage (unit: %) composited for (a) strong WI–strong MI pentads, (b) weak WI–weak MI pentads; Figure S2: Mid-summer precipitation rate anomalies composited for (a) strong WI–strong MI pentads, (b) weak WI–weak MI pentads (APHRODITE data; unit: mm·d−1, hatched areas indicate passing the two-tailed t test at 10% significant level); Figure S3: Same with Figure S2, but for CPC precipitation dataset; Figure S4: Composite circulation elements under WS configuration. (a) Precipitation anomalies (unit: mm·d−1); (b) 850 hPa wind anomalies (vectors, unit: m·s−1) and 500 hPa vertical velocity anomalies (shaded, unit: 0.01 Pa·s−1); (c) Integrated moisture flux anomalies from the surface to 700 hPa (vectors, shading indicates the absolute value of moisture flux anomalies, unit: kg(m·s)−1); (d) 200 hPa wind anomalies (vectors, unit: m·s−1) and vertical velocity anomalies (shaded, unit: 0.01 Pa·s−1); (e) 200 hPa divergence wind anomalies (unit: m·s−1) and divergence anomalies (10−6s−1); (f) Latitude-height (averaged in 110–120° E) cross-section distribution of meridional and vertical velocity anomalies (shaded for omega, unit: −0.01 Pa s−1; vectors for vertical component scaled by 100, unit: m·s−1). Hatched and dotted areas indicate passing the two-tailed t test at 10% significant level; Figure S5: Same as Figure S4, but for SW configuration.
Author Contributions
K.S. analyzed the data and wrote the original draft. X.L. conceptualized this study and revised the text. X.X. and Y.S. interpreted the results. X.Z. and J.L. collected the data and checked the entire manuscript. A.W. analyzed the supplementary data in the discussion section and checked the revised manuscript. All authors have read and agreed to the published version of the manuscript.
Funding
This research was jointly supported by the National Natural Science Foundation of China (42205037) and the Scientific Research Foundation of Xihang University (2021KY0211). Jiahuimin Liu is supported by the Recovery Summary Foundation of China Meteorological Administration (FPZJ2024-131) and Foundation of Shaanxi Meteorological Observatory Key laboratory of Eco-Environment and Meteorological for the Qinling Mountains and Loess Plateau (2023K-2). Anqi Wang is supported by the Shaanxi Province postdoctoral research funding project (2023BSHEDZZ192), Open Fund of the State Key Laboratory of Loess Science (SKLLQG2312), and National Science and Technology Fundamental Resources Investigation Program of China (2022FY202304).
Institutional Review Board Statement
Not applicable.
Informed Consent Statement
Not applicable.
Data Availability Statement
The NCEP/NCAR data can be obtained from the website of http://www.esrl.noaa.gov/psd/data/gridded/data.ncep.reanalysis.html (accessed on 5 May 2022) and the grid precipitation data can be obtained from the website of http://data.cma.cn/ (accessed on 1 August 2021). APHRODITE precipitation dataset can be downloaded from the website of https://www.chikyu.ac.jp/precip/english/products.html (accessed on 15 July 2022). The CPC dataset is also obtained online from https://psl.noaa.gov/data/gridded/data.cpc.globalprecip.html (accessed on 1 August 2022).
Conflicts of Interest
The authors declare no competing interests.
References
- Yang, J.P.; Ding, Y.J.; Chen, R.S.; Liu, L.Y. Fluctuations of the semiarid zone in China, and consequences for society. Clim. Change 2005, 72, 171–188. [Google Scholar] [CrossRef]
- Liu, X.; Zhu, Z.; Lu, R.; Miao, Z.; Li, W.; Hsu, P. Unprecedented July rainfall in North China in 2021: Combined effect of Atlantic warming and Arctic sea-ice loss. J. Geophys. Res. Atmos. 2023, 128, e2022JD038068. [Google Scholar] [CrossRef]
- Lau, K.M.; Yang, S. Climatology and interannual variability of the Southeast Asian summer monsoon. Adv. Atmos. Sci. 1997, 14, 141–162. [Google Scholar] [CrossRef]
- Webster, P.J.; Magana, V.O.; Palmer, T.N.; Shukla, J.; Tomas, R.A.; Yanai, M.; Yasunari, T. Monsoons: Processes, predictability and the prospects for prediction. J. Geophys. Res. 1998, 107, 14451–14510. [Google Scholar] [CrossRef]
- Wang, B.; Lin, H. Rainy season of the Asian-Pacific summer monsoon. J. Clim. 2002, 15, 386–398. [Google Scholar] [CrossRef]
- Zhu, Q.G.; He, J.H.; Wang, P.X. A study of circulation differences between East-Asian and Indian summer monsoons with their interaction. Adv. Atmos. Sci. 1986, 3, 466–477. [Google Scholar] [CrossRef]
- He, J.H.; Qi, L.; Wei, J.; Chi, Y.Z. Reinvestigations on the East Asian Subtropical Monsoon and Tropical Monsoon. Chin. J. Atmos. Sci. 2007, 31, 1257–1265. (In Chinese) [Google Scholar]
- Zhao, P.; Zhang, R.H.; Liu, J.P.; Zhou, X.J.; He, J.H. Onset of southwesterly wind over eastern China and associated atmospheric circulation and rainfall. Clim. Dyn. 2007, 28, 797–811. [Google Scholar] [CrossRef]
- Li, J.P.; Zeng, Q.C. A unified monsoon index. Geophys. Res. Lett. 2002, 29, 1274. [Google Scholar] [CrossRef]
- Chen, G.; Du, Y.; Wen, Z. Seasonal, Interannual, and Interdecadal Variations of the East Asian Summer Monsoon: A Diurnal-Cycle Perspective. J. Clim. 2021, 11, 4403–4421. [Google Scholar] [CrossRef]
- Ding, Y.H.; Wang, Z.Y.; Sun, Y. Inter-decadal variation of the summer precipitation in East China and its association with decreasing Asian summer monsoon. Part I: Observed evidences. Int. J. Climatol. 2008, 28, 1139–1161. [Google Scholar] [CrossRef]
- Zhao, P.; Yang, S.; Yu, R.C. Long-Term Changes in Rainfall over Eastern China and Large-Scale Atmospheric Circulation Associated with Recent Global Warming. J. Clim. 2010, 23, 1544–1562. [Google Scholar] [CrossRef]
- Huang, R.H.; Liu, Y.; Feng, T. Interdecadal change of summer precipitation over Eastern China around the late-1990s and associated circulation anomalies, internal dynamical causes. Chin. Sci. Bull. 2013, 58, 1339–1349. [Google Scholar] [CrossRef]
- Yeh, T.C.; Tao, S.Y.; Li, M. The abrupt change of circulation over the Northern Hemisphere during June and October. Acta Meteorol. Sin. 1958, 29, 234–246. (In Chinese) [Google Scholar]
- Sampe, T.; Xie, S.P. Large-scale dynamics of the meiyu-baiu rainband: Environmental forcing by the westerly jet. J. Clim. 2010, 23, 113–134. [Google Scholar] [CrossRef]
- Hong, X.W.; Lu, R.Y. The meridional displacement of the summer Asian jet, Silk Road Pattern, and tropical SST anomalies. J. Clim. 2016, 29, 3753–3766. [Google Scholar] [CrossRef]
- Wang, S.X.; Zuo, H.C.; Yin, Y.X.; Wang, J.J.; Ma, X.Y. Asymmetric impact of East Asian jet’s variation on mid-summer rainfall in North China and Yangtze River valley. Clim. Dyn. 2019, 53, 6199–6213. [Google Scholar] [CrossRef]
- Molnar, P.; Boos, W.R.; Battisti, D.S. Orographic controls on climate and paleoclimate of Asia: Thermal and mechanical roles for the Tibetan Plateau. Annu. Rev. Earth Planet. Sci. 2010, 38, 77–102. [Google Scholar] [CrossRef]
- Chiang, J.C.H.; Fung, I.Y.; Wu, C.H.; Cai, Y.J.; Edman, J.P.; Liu, Y.W.; Day, J.A.; Bhattacharya, T.; Mondal, Y.; Labrousse, C.A. Role of seasonal transitions and westerly jets in East Asian paleoclimate. Quat. Sci. Rev. 2015, 108, 111–129. [Google Scholar] [CrossRef]
- Lu, R. Associations among the Components of the East Asian Summer Monsoon System in the Meridional Direction. J. Meteorol. Soc. Jpn. 2004, 82, 155–165. [Google Scholar] [CrossRef]
- Zhang, Y.C.; Guo, L.L. Relationship between the simulated East Asian westerly jet biases and seasonal evolution of rainbelt over eastern China. Chin. Sci. Bull. 2005, 50, 1503–1508. [Google Scholar] [CrossRef]
- Xuan, S.; Zhang, Q.; Sun, S. Anomalous mid-summer rainfall in Yangtze River-Huaihe River valleys and its association with the East Asia Westerly Jet. Adv. Atmos. Sci. 2011, 28, 387–397. [Google Scholar] [CrossRef]
- Wei, W.; Zhang, R.; Yang, S. Relationship between the Asian westerly jet stream and summer rainfall over central Asia and North China: Roles of the Indian monsoon and the South Asian high. J. Clim. 2017, 30, 537–552. [Google Scholar] [CrossRef]
- Li, L.; Zhang, Y.C. Effects of Different Configurations of the East Asian Subtropical and Polar Front Jets on Precipitation during the Mei-Yu Season. J. Clim. 2014, 27, 6660–6672. [Google Scholar] [CrossRef]
- Huang, D.Q.; Zhu, J.; Zhang, Y.C.; Huang, A.N. The different configurations of the East Asian polar front jet and subtropical jet and the associated rainfall anomalies over eastern China in summer. J. Clim. 2014, 27, 8205–8220. [Google Scholar] [CrossRef]
- Wang, S.X.; Zuo, H.C. Effect of the East Asian Westerly Jet’s Intensity on Summer Rainfall in the Yangtze River Valley and Its Mechanism. J. Clim. 2016, 29, 2395–2406. [Google Scholar] [CrossRef]
- Lin, Z.D. Impacts of two types of northward jumps of the East Asian upper-tropospheric jet stream in mid-summer on rainfall in eastern China. Adv. Atmos. Sci. 2013, 30, 1224–1234. [Google Scholar] [CrossRef]
- Zhu, Q.Z.; Liu, Y.Z.; Shao, T.B.; Luo, R.; Tan, Z.Y. Role of the Tibetan Plateau in Northern Drought Induced by Changes in the Subtropical Westerly Jet. J. Clim. 2021, 34, 4955–4969. [Google Scholar] [CrossRef]
- Ding, Y.H.; Murakami, M. Asian Monsoon; China Meteorological Press: Beijing, China, 1994; p. 263. (In Chinese) [Google Scholar]
- Tian, S.F.; Yasunari, T. Climatological aspects and mechanism of spring persistent rains over central China. J. Meteorol. Soc. Jpn. 1998, 76, 57–70. [Google Scholar] [CrossRef]
- Chen, T.J. Research on the phenomena of Meiyu during the past quarter century: An overview. In The East Asian Monsoon; Chang, C.P., Ed.; World Scientific: Singapore, 2004; pp. 1–566. [Google Scholar]
- Qian, W.H.; Ding, T.; Hu, H.R.; Lin, X.; Qin, A.M. An overview of dry-wet climate variability among monsoon-westerly regions and the monsoon northernmost marginal active zone in China. Adv. Atmos. Sci. 2009, 26, 630–641. [Google Scholar] [CrossRef]
- Chen, J.; Huang, W.; Feng, S.; Zhang, Q.; Kuang, X.Y.; Chen, J.H.; Chen, F.H. The modulation of westerlies-monsoon interaction on climate over the monsoon boundary zone in East Asia. Int. J. Climatol. 2021, 41 (Suppl. S1), E3049–E3064. [Google Scholar] [CrossRef]
- Song, C.; Wang, J.; Liu, Y.; Zhang, L.; Ding, Y.; Li, Q.; Shen, X.; Song, Y.; Yan, Y. Toward role of westerly-monsoon interplay in linking interannual variations of late spring precipitation over the southeastern Tibetan Plateau. Atmos. Sci. Lett. 2022, 23, e1074. [Google Scholar] [CrossRef]
- Wang, J.; Liu, Y.; Song, C.; Ding, Y.; Li, Q.; Wu, P.; Xu, Y.; Xu, X. Synergistic impacts of westerlies and monsoon on interdecadal variations of late spring precipitation over the southeastern extension of the Tibetan Plateau. Int. J. Climatol. 2022, 42, 7342–7361. [Google Scholar] [CrossRef]
- Boos, W.R.; Kuang, Z. Dominant control of the South Asian monsoon by orographic insulation versus plateau heating. Nature 2010, 463, 218–222. [Google Scholar] [CrossRef]
- Liao, F.; Hu, Y.M.; Hong, Y.C. Numerical study for the influences of orographic dynamic on cloud and precipitation in North China. Plateau Meteorol. 2009, 28, 115–126. (In Chinese) [Google Scholar] [CrossRef]
- Zhao, Y.; Chen, D.; Li, J.; Chen, D.; Chang, Y.; Li, J.; Qin, R. Enhancement of the summer ex-treme precipitation over North China by interactions between moisture convergence and topographic settings. Clim. Dyn. 2020, 54, 2713–2730. [Google Scholar] [CrossRef]
- Valjarević, A.; Morar, C.; Živković, J.; Niemets, L.; Kićović, D.; Golijanin, J.; Gocić, M.; Bur-sać, N.M.; Stričević, L.; Žiberna, I.; et al. Long Term Monitoring and Connection between Topography and Cloud Cover Distribution in Serbia. Atmosphere 2021, 12, 964. [Google Scholar] [CrossRef]
- Wu, G.; Liu, Y.; Wang, T.; Wan, R.; Liu, X.; Li, W.; Wang, Z.; Zhang, Q.; Duan, A.; Liang, X. The influence of mechanical and thermal forcing by the Tibetan Plateau on Asian climate. J. Hydrometeorol. 2007, 8, 770–789. [Google Scholar] [CrossRef]
- Wang, B.; Bao, Q.; Hoskins, B.; Wu, G.; Liu, Y. Tibetan Plateau warming and precipitation changes in East Asia. Geophys. Res. Lett. 2008, 35, L14702. [Google Scholar] [CrossRef]
- Han, Y.Z.; Jiang, D.B.; Si, D.; Ma, Y.M.; Ma, W.Q. Time-lagged effects of the spring atmos-pheric heat source over the Tibetan Plateau on summer precipitation in Northeast China during 1961–2020: Role of soil moisture. Adv. Atmos. Sci. 2024, 41, 1527–1538. [Google Scholar] [CrossRef]
- Jia, X.; Chen, X.; Dong, W.; Ma, H.; Ge, J.; Qian, Q. Impact of Tibetan Plateau warming amplification on the interannual variations in East Asia summer precipitation. Npj Clim. Atmos. Sci. 2025, 8, 29. [Google Scholar] [CrossRef]
- Yatagai, A.; Kamiguchi, K.; Arakawa, O.; Hamada, A.; Yasutomi, N.; Kitoh, A. APHRODITE constructing a long-term daily gridded precipitation dataset for Asia based on a dense network of rain gauges. Bull. Am. Meteorol. Soc. 2012, 93, 1401–1415. [Google Scholar] [CrossRef]
- Xie, P.P.; Yatagai, A.; Chen, M.Y.; Hayasaka, T.; Fukushima, Y.; Liu, C.M.; Yang, S. A gauge-based analysis of daily precipitation over East Asia. J. Hydrometeorol. 2007, 8, 607–626. [Google Scholar] [CrossRef]
- Kalnay, E.; Kanamitsu, M.; Kistler, R.; Collins, W.; Deaven, D.; Gandin, L.; Iredell, M.; Saha, S.; White, G.; Woollen, J.; et al. The NCEP/NCAR 40-year reanalysis project. Bull. Am. Meteorol. Soc. 1996, 77, 437–471. [Google Scholar] [CrossRef]
- Zhao, Y.; Xu, X.D.; Li, J.; Zhang, R.; Kang, Y.Z.; Huang, W.B.; Xia, Y.; Liu, D.; Sun, X.Y. The large-scale circulation patterns responsible for extreme precipitation over the North China plain in mid-summer. J. Geophys. Res. Atmos. 2019, 124, 12794–12809. [Google Scholar] [CrossRef]
- Ren, X.; Yang, X.; Chu, C. Seasonal Variations of the Synoptic-Scale Transient Eddy Activity and Polar Front Jet over East Asia. J. Clim. 2010, 23, 3222–3233. [Google Scholar] [CrossRef]
- Koch, P.; Wernli, H.; Davies, H.C. An event-based jet-stream climatology and typology. Int. J. Climatol. 2006, 26, 283–301. [Google Scholar] [CrossRef]
- Zhang, Y.C.; Chen, J. Characterizing the Winter Concurrent Variation Patterns of the Subtropical and Polar-Front Jets over East Asia. J. Meteorol. Res. 2017, 31, 160–170. [Google Scholar] [CrossRef]
- Duan, A.; Liu, Y.; Wu, G. Heating status of the Tibetan Plateau from April to June and rainfall and atmospheric circulation anomaly over East Asia in midsummer. Sci. China Earth Sci. 2005, 48, 250–257. [Google Scholar] [CrossRef]
- Freychet, N.; Hsu, H.H.; Chou, C.; Wu, C.H. Asian summer monsoon in CMIP5 projections: A link between the change in extreme precipitation and monsoon dynamics. J. Clim. 2015, 28, 1477–1493. [Google Scholar] [CrossRef]
- Miao, Q.L.; Jiang, Z.H.; Chen, H.S.; Yu, J.H. Modern Climatology, 2nd ed.; China Meteorological Press: Beijing, China, 2018; pp. 87–88. (In Chinese) [Google Scholar]
- Zhu, Q.Z.; Liu, Y.Z. The combined effect of multiple water vapor transport channels can better reflect the variability in summer precipitation over North China. Clim. Dyn. 2023, 61, 5887–5904. [Google Scholar] [CrossRef]
- Xia, R.; Zhang, D.-L.; Fu, S.; Yin, J.; Wang, H. On the anomalous development of a series of heavy rainfall events from central to north China during 19–21 July 2016. Quart. J. Roy. Meteorol. Soc. 2022, 148, 272–293. [Google Scholar] [CrossRef]
- Zhang, Q.; Gu, X.; Li, J.; Shi, P.; Singh, V. The Impact of Tropical Cyclones on Extreme Precipitation over Coastal and Inland Areas of China and Its Association to ENSO. J. Clim. 2018, 31, 1865–1880. [Google Scholar] [CrossRef]
- Xia, R.; Zhang, D. An Observational Analysis of Three Extreme Rainfall Episodes of 19–20 July 2016 along the Taihang Mountains in North China. Mon. Weather Rev. 2019, 147, 4199–4220. [Google Scholar] [CrossRef]
- Bao, X.; Sun, J.; Yin, J.; Gao, X.; Li, F.; Liang, X.; Gu, H.; Xia, R.; Li, M.; Wu, C.; et al. What Caused the Differences between the July 2023 and August 1996 Extreme Rainfall Events in North China under Similar Synoptic Background. J. Meteorol. Res. 2024, 38, 861–879. [Google Scholar] [CrossRef]
- Gao, Y.; Zhang, L.; Zhao, H.; Guo, Z. Impacts of the local temperature anomalies over Mongolian Plateau on heavy rainfall events in north China during July 2023. Weather Clim. Extrem. 2025, 48, 100758. [Google Scholar] [CrossRef]
- Wang, B.; Jin, C.H.; Liu, J. Understanding Future Change of Global Monsoons Projected by CMIP6 Models. J. Clim. 2020, 33, 6471–6489. [Google Scholar] [CrossRef]
- You, Q.L.; Jiang, Z.H.; Xu, Y.; Guo, W.D.; Liu, Y.G.; Cao, J.; Li, W.; Wu, F.Y.; Cai, Z.Y.; Zhu, H.H.; et al. Recent frontiers of climate changes in East Asia at global warming of 1.5 °C and 2 °C. Npj Clim. Atmos. Sci. 2022, 5, 80. [Google Scholar] [CrossRef]
- Yuan, Y.; Gao, H.; Li, W.; Liu, Y.; Chen, L.; Zhou, B.; Ding, Y. The 2016 summer floods in China and associated physical mechanisms: A comparison with 1998. J. Meteorol. Res. 2017, 31, 261–277. [Google Scholar] [CrossRef]
- Gong, D.Y.; Ho, C.H. Shift in the summer rainfall over the Yangtze River valley in the late 1970s. Geophys. Res. Lett. 2002, 29, 1436. [Google Scholar] [CrossRef]
- Guo, D.; Gao, Y.; Bethke, I.; Gong, D.; Johannessen, O.M.; Wang, H. Mechanism on how the spring Arctic sea ice impacts the East Asian summer monsoon. Theor. Appl. Climatol. 2014, 115, 107–119. [Google Scholar] [CrossRef]
- Dong, S.Y.; Sun, Y.; Zhang, X.B. Attributing observed increase in extreme precipitation in China to human influence. Environ. Res. Lett. 2022, 17, 095005. [Google Scholar] [CrossRef]
Disclaimer/Publisher’s Note: The statements, opinions and data contained in all publications are solely those of the individual author(s) and contributor(s) and not of MDPI and/or the editor(s). MDPI and/or the editor(s) disclaim responsibility for any injury to people or property resulting from any ideas, methods, instructions or products referred to in the content. |
© 2025 by the authors. Licensee MDPI, Basel, Switzerland. This article is an open access article distributed under the terms and conditions of the Creative Commons Attribution (CC BY) license (https://creativecommons.org/licenses/by/4.0/).