Article

Analysis of Chemical Composition and Sources of PM10 in the Southern Gateway of Beijing

1
State Key Laboratory of Atmospheric Boundary Layer Physics and Atmospheric Chemistry (LAPC), Institute of Atmospheric Physics (IAP), Chinese Academy of Sciences, Beijing 100029, China
2
College of Earth and Planetary Sciences, University of Chinese Academy of Sciences, Beijing 100049, China
3
State Key Laboratory of Water Environment Simulation, School of Environment, Beijing Normal University, Beijing 100875, China
4
Ulster College, Shaanxi University of Science & Technology, Xi’an 710021, China
*
Author to whom correspondence should be addressed.
Atmosphere 2025, 16(6), 656; https://doi.org/10.3390/atmos16060656
Submission received: 17 April 2025 / Revised: 25 May 2025 / Accepted: 26 May 2025 / Published: 29 May 2025
(This article belongs to the Section Aerosols)

Abstract

:
PM10 samples were collected at an urban site of Zhuozhou, the southern gateway of Beijing, from 28 December 2021 to 29 January 2022, in order to explore the chemical composition, sources and physical and chemical formation processes of prominent components. The results showed that five trace elements (Mn, Cu, As, Zn and Pb) had high enrichment in PM10 and were closely related with anthropogenic combustion and vehicle emissions; organic and element carbon had a high correlation due to the same primary sources and similar evolution; nitrate dominated SNA (sulfate, nitrate, ammonium) and nitrate/sulfate ratios reached 2.35 on the polluted days owing to the significant contribution of motor vehicle emissions. Positive matrix factorization analysis indicated that secondary source, traffic, biomass burning, industry, coal combustion and crustal dust were the main sources of PM10, contributing 32.5%, 20.9%, 15.0%, 13.9%, 9.4% and 8.3%, respectively; backward trajectories and potential source contribution function analysis showed that short-distance airflow was the dominant cluster and accounted for nearly 50% of total trajectories. The Weather Research and Forecasting model with Chemistry, with integrated process rate analysis, showed that dominant gas-phase reactions (heterogeneous reaction) during daytime (nighttime) in presence of ammonia led to a significant enhancement of nitrate in Zhuozhou, contributing 12.6 μg/m3 in episode 1 and 22.9 μg/m3 in episode 2.

1. Introduction

In the past few decades, China has experienced rapid economic development, urbanization, and a significant increase in motor vehicles; along with this comes a series of atmospheric environmental problems, among which particulate matter pollution is the most prominent [1,2,3,4]. Particulate matter includes both fine (aerodynamic equivalent diameter ≤ 2.5 μm (PM2.5)) and coarse (2.5 μm < aerodynamic equivalent diameter ≤ 10 μm) particles, having different impacts on atmospheric visibility and human health [5,6]. The chemical components of fine particles are water soluble inorganic species (sulfate (SO42−), nitrate (NO3) and ammonium (NH4+)) (SNA), carbon components including organic (OC) and element carbon (EC), and other inorganic compounds. Fine particles often originate from anthropogenic combustion and secondary transformation of anthropogenic emission sources [7,8]; while coarse particles generally arise from crustal material (like Fe2+, Ca2+, Mg2+, Al3+) and some vehicle wear products [5,9]. Beijing, as a political center, has suffered from serious air pollution problems in the past decade and has attracted widespread attention from scientists. Some researchers identified that the air mass derived from the southern areas greatly affected the air quality in Beijing [10]. Short-range transport from Baoding and Langfang in Hebei province contributed about 15% of particulate matter and was recognized as the largest external contributor to Beijing [11,12,13]. Therefore, it is necessary to study the composition and sources of particulate matter in the vicinity of southern Beijing.
Baoding City, Hebei province, as one of the “2 + 26” transportation cities, has taken unprecedented measures to control pollutants in accordance with the law, since the formulation of the Scheme of air pollution prevention and control in the Beijing–Tian–Hebei region and surrounding areas in 2017. In order to promote the construction of the Beijing–Tianjin–Hebei ecological environment support zone (https://sthjj.baoding.gov.cn/), many cities within the jurisdiction of Baoding have taken a series of measures to reduce air pollutants, including precise industrial layout, closing small coal-fired boilers to achieve “zero” scattered coal in the main urban area and the northern coal ban zone, strictly controlling motor vehicle emissions, etc. However, Baoding is one of the top three cities in Hebei province for contributions of motor vehicle emissions on national and provincial roads [14]. Moreover, a mixed influence of coal combustion, biomass burning and motor vehicle emissions in winter poses a serious threat to air pollution [10,14,15]. Zhuozhou City is located in the northern part of Baoding, in the triangle area of Beijing, Tianjin, and Hebei, and is the southern gateway of Beijing. To alleviate the impact of the city clusters in the southwest of Beijing on air pollution, Zhuozhou city has actively responded to government measures and set strict air pollutant control targets (annual average concentration of PM10 < 80 μg/m3 in 2021 and <73 μg/m3 in 2022, https://sthjj.baoding.gov.cn/). In view of this, studying the chemical composition, sources and formation of PM10 is of great significance for formulating feasible measures to efficiently reduce PM10.
In this study, daily PM10 samples were collected at an urban site in Zhuozhou City. Two typical air pollution episodes (PM10 > 150 μg/m3) from 28 December 2021 to 29 January 2022 were chosen from which to analyze and compare the chemical composition and characteristics of heavy metals, OC, EC and water soluble ions. Moreover, we identified sources by using a source apportionment receptor model, analyzing the possible source areas of prominent chemical components (i.e., OC and water soluble ions) by using a cluster analysis of backward trajectories and potential source distribution. Finally, we explored the relative importance of physical and chemical processes on SNA during the two typical pollution episodes using the Weather Research and Forecasting model with Chemistry (WRF–Chem) via a process analysis method.

2. Experiments and Methodology

2.1. Sampling Program

The sampling site is located in the Ecology and Environment Bureau of Zhuozhou (115.99° E, 39.48° N), about 2.2 km from the western national highway 107 and 4.3 km from the eastern Beijing–Shenzhen Expressway. There are no obvious industrial emission sources in the surrounding areas. It lies within commercial, educational and residential areas and represents an urban area in Zhuozhou.
Particles were collected by a large flow sampler (Thermo Fisher, Waltham, MA, USA), which was placed on the roof of a three-storey building (~12 m above ground). The measurement was performed between 28 December 2021 and 29 January 2022, with a 24-h filter duration from 11:00 a.m. to 11:00 a.m. the next day. The sampler was equipped with a particle cutter for particles larger than 10 μm. During the process of extracting air, suspended particles in the air were separated by the cutter, and particles with a diameter smaller than 10 μm were collected on a pre-weighed filter. To avoid agglomeration in the settled particles, the sampling airflow was uniform with a flow rate of 100 L min−1. In total, 23 valid samples were obtained. The quartz filters were pre-cleaned at 850 °C in the oven for 4 h to remove organic pollution before sampling and stored at −20 °C after sampling. The blank sample was collected by standing the quartz filter in the sampler for 24-h without air flowing through. Conventional meteorological parameters (air temperature, relative humidity, wind speed and direction) adopt the synchronous data of the Taoyuan site, the National Air Quality Monitoring Station in the Zhuozhou City, which is located about 1.7 km in the southwesterly direction.

2.2. Chemical Analysis

Each quartz filter was cut into three equal fragments for the analysis of metallic elements, OC, EC and water-soluble inorganic ions. The metallic elements were measured by an inductively coupled plasma mass spectrometry (ICP-MS; 7500a, Thermo). The filters were digested with acid solutions and then diluted to deionized water to determine the elements. To ensure the completeness of acid digestion in PM10 metal analysis, a combination of nitric acid, hydrochloric acid and hydrogen peroxide was used to cover different metal components, and microwave digestion parameters were controlled. OC and EC were determined using a thermo-optical carbon analyzer (DRI Model 2001A, Atmoslytic, Calabasas, CA, USA) and the thermal-optical reflectance (TOR) method. The minimum determined limits of total OC and total EC were 0.82 μg C/cm2 and 0.20 μg C/cm2. The water-soluble inorganic ions were analyzed by ion chromatograph (ICS-2100, DIONEX). The filters were extracted and detected with deionized water at least three times to ensure the accuracy of the measurement. For quality assurance and quality control, all reported concentrations in this study were corrected by subtracting the corresponding values by blanks and the relative standard deviations were below 5%. A high degree of accuracy was obtained in the analytical method by establishing the instrument detection limits (IDLs) and the method detection limits (MDLs), and the repeatability error is below 6%.

2.3. Model

2.3.1. Positive Matrix Factorization (PMF) Model

The PMF model is an effective source apportionment receptor model and has been widely used in analyzing atmospheric pollutants [10,16,17,18,19,20]. The goal of the PMF model is to identify the number of factors and species profile of each source, based on an assumption that the measured concentrations of species are linear combinations of contributions from different sources [21]. In this study, a dataset of 23 samples from 28 December to 29 January was analyzed by the PMF model 5.0. The species include 9 elements (Al, Ca, Fe, K, Zn, Mn, Pb, Cu, As), 8 Water-soluble ions (NO3, SO42−, NH4+, Ca2+, Cl, Na+, K+, Mg2+), OC and EC. Some species with abnormal values were excluded to avoid error. The model was run at least 120 times with a different number of factors to minimize the object function Q from the PMF model [21]. Six factors were found to be the optimum for the calculated Q value closest to a theoretical value.

2.3.2. Trajectory and Potential Source Contribution

The 72-h backward trajectories of air mass were calculated by the Hybrid Single Particle Lagrangian Integrated Trajectory (HYSPLIT) model (http://ready.arl.noaa.gov/HYSPLIT.php, accessed on 6 May 2022). The model was run at 1-h intervals during the sampling period and the tracking height varied from 100 to 3000 m above ground level. A total of 600 trajectories was used for cluster analysis.
A potential source contribution function (PSCF) was used to identify the possible source areas of OC, NO3, SO42−, and NH4+ of PM10 at the sampling site based on the results of the HYSPLIT model. The study domain in the range of 96–126° E, 35–55° N was divided into i × j equal grid cells with a horizontal resolution of 0.5° × 0.5°. The average concentrations of corresponding species were considered as the threshold criteria representing the polluted trajectories [19,22]. The PSCF is calculated as follows:
P S C F i j = M i j N i j
in which Nij denotes the total number of endpoints falling into the ijth grid cell and Mij is the number of endpoints from the polluted trajectories exceeding the threshold criterion in the same ijth grid cell. To reduce the PSCF uncertainties for the grid cells with a limited number of points, an arbitrary weight value Wij is multiplied, and Wij is referred to from Chen et al. (2020) [19].

2.3.3. WRF-Chem and Process Analysis

An online coupled regional-scale chemical transport model WRF-Chem version 3.7.1 [23] was applied to explore the mechanism of particle production and accumulation in Zhuozhou. Simulations started on 11 December 2021 and ended on 25 January 2022. The first 3-day simulations were considered as spin-up time. Two-way nested model domains were set up with horizontal resolutions of 81 and 27 km, respectively. The parent domain centered at (110° E, 35° N). Both domains had 18 vertical layers extending from the surface to 100 hPa. The parent domain covered most parts of East Asia, and the inner domain covered most parts of eastern China. The detailed descriptions of physical and chemical parameterization schemes used in the WRF-Chem simulations were given in our previous study [24]. In order to better understand the mechanism of the secondary aerosol production and accumulation, the WRF-Chem used was improved in two aspects in Qu et al. (2019) [24], who added potential sources of nitrous acid, including traffic, biomass burning and soil emissions, and heterogeneous reactions to enhance atmospheric oxidation capacity, and updated the heterogeneous hydrolysis of dinitrogen pentoxide to better simulate nitrate, especially during heavy pollution episodes. The work of Qu et al. (2019) [24] was based on the anthropogenic emissions in 2016; from 2016 to 2022, China formulated stringent air pollutant emission reduction measures to alleviate particulate pollution [25,26,27,28]; thus, the anthropogenic emission amounts from some sectors, such as industry, power plants, and transportation, have greatly changed. In this study, the emissions from industrial and power sectors were cut by a factor of 0.4, and those from transportation increased by a factor of 1.1, based on comparison with previous studies on reduction of pollutants [29,30,31,32,33].
Integrated process rate (IPR) analysis can be used to quantify the separate contributions of chemical and physical processes to local pollutant concentrations. This method has been widely utilized in Eulerian air quality models, such as the Comprehensive Air Quality model with Extensions (CAMx) and the Community Multi-scale Air Quality model (CMAQ), to investigate the impact of an individual process of ozone and particulate formation [34,35,36,37,38,39,40,41,42,43]. For WRF-Chem, some scholars added a process analysis scheme to calculate the contributions of photochemical and physical processes to O3 [44,45,46,47], and some researchers utilized the IPR analysis for aerosols [48,49,50,51,52]. In this study, an improved online IPR scheme in WRF-Chem was used to track contributions of particulate pollutants from eight processes, i.e., emissions (EMIS), advection (ADVC), convection (CONV), turbulent diffusion (DIFF), dry deposition (DRYD), wet scavenging (WETS), gas-phase chemistry (CHEM), and aerosol process (AERC).

3. Results and Discussion

3.1. Chemical Characteristics of PM10
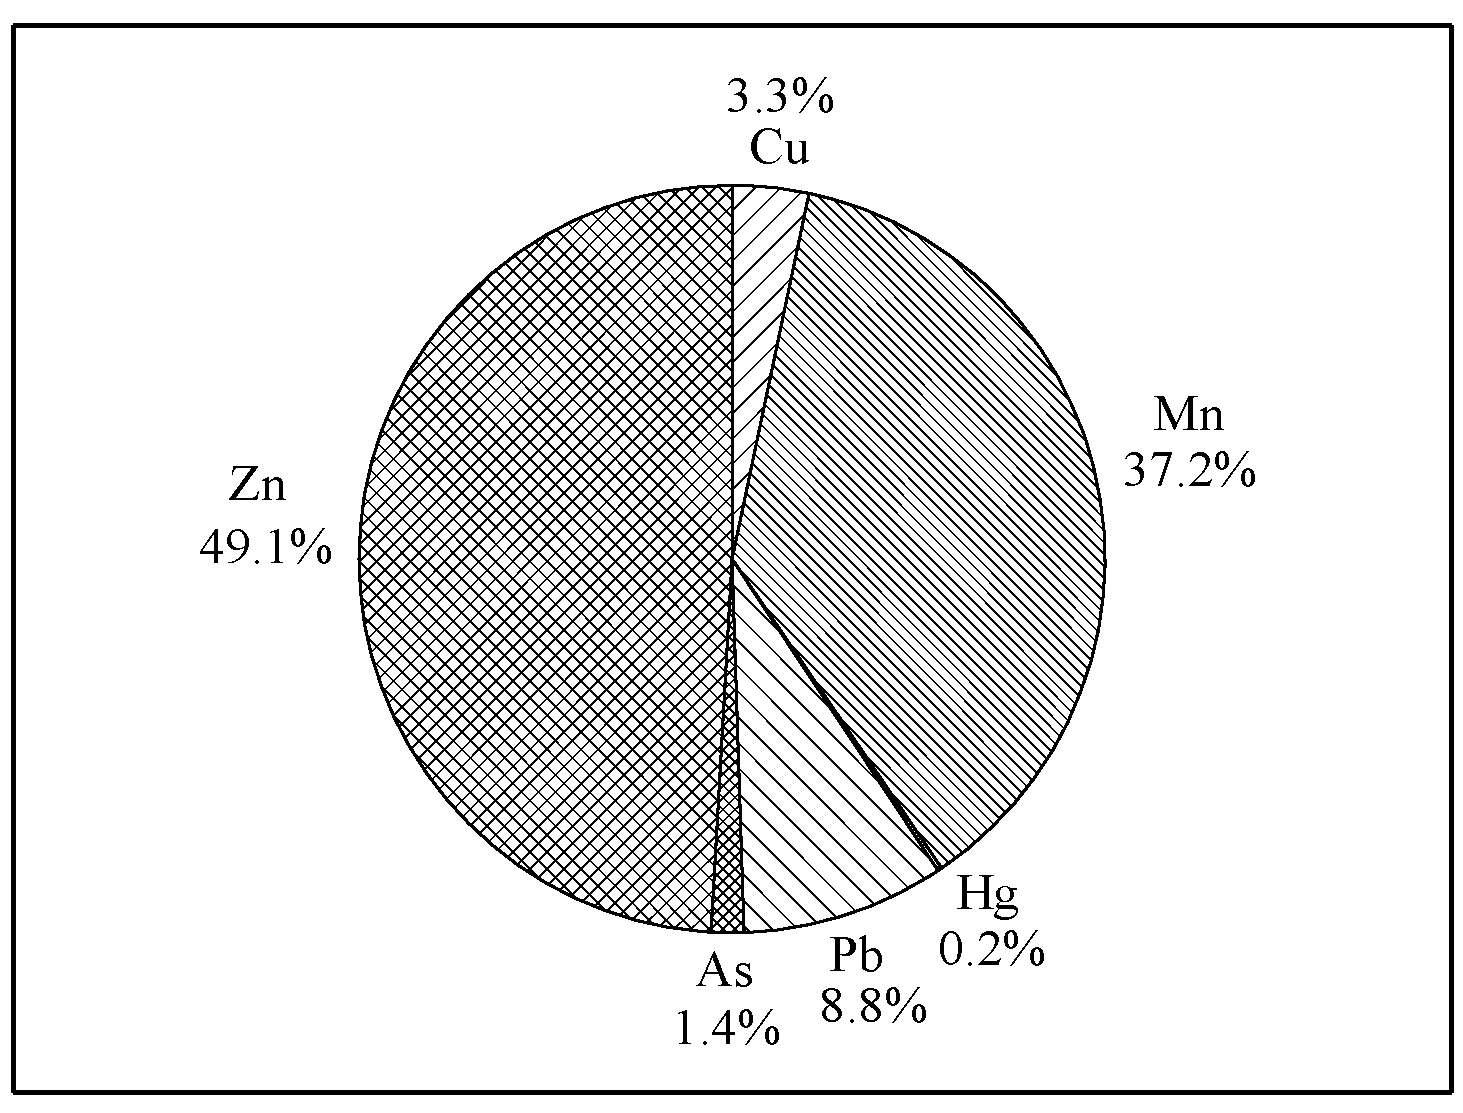
The time series of daily concentrations of PM10 and its chemical components (heavy metals, water soluble ions, OC and EC) are shown in Figure 1a. The mass concentration of PM10 ranged from 36 μg/m3 to 170 μg/m3, with an average of 91.6 μg/m3. According to the National Ambient Air Quality Standards (NAAQS, GB3095-2012) issued in 2012 by the Chinese Ministry of Environmental Protection, a day with daily PM10 mass concentrations exceeding grade II (150 μg/m3) is defined as a polluted day; during the observation period, there were 4 polluted days (P) and 19 non-polluted days (N). In the first two polluted days (14–15 January 2022), OC and EC contributed many mass concentrations of PM10, following by water soluble ions and heavy metals; while in the last two polluted days (24–25 January 2022) water soluble ions played a significant role, indicating that many fine particles are produced in this period. The statistics in Figure 1b show a sharp rise in the mass concentrations of chemical components from non-polluted days to polluted days, and the average mass concentrations of water soluble ions, OC and EC increased by more than two times on the polluted days.

3.1.1. Heavy Metals

Ten elements (i.e., Al, Ca, Fe, K, Zn, Mn, Pb, Cu, As, Hg) were determined during the observation period, and the element concentrations are shown in Table 1. The ten elements are generally divided into two groups. One consisted of crustal elements, which mainly came from sand dust and fugitive dust caused by human activities (e.g., building, greening and urban cleaning). Crustal elements (Al, Ca, Fe, K) were the most abundant elements, accounting for 85.6% of the total detected elemental mass. Compared with adjacent cities, the average concentrations of Al and Fe (2.96 and 2.47 μg/m3) were slightly higher than those in Baoding, Langfang, Beijing and Tianjin, while the average concentrations of Ca and K (2.37 and 0.60 μg/m3) were low [10,53]. The other group was trace elements, generally originating from fuel combustion, industrial metallurgical processes and vehicle emissions, and these have been studied by many researchers [54,55]. As shown in Figure 2, Zn, Mn, Pb and Cu were elements with large abundance, accounting for 49.1%, 37.2%, 8.8% and 3.3% of the total trace elemental mass. According to the guidelines for heavy metals given by [56] and NAAQS (GB3095-2012), the mass concentrations of Mn and As were 3.5 and 3.0 times as high as the reference values. Mn and As were mainly from coal burning [57,58]. There were two large coal-fired power plants in the Zhuozhou City; in addition, the amount of coal used for heating in winter was also large, resulting in high concentrations of Mn and As, and indicating that coal-burning pollution in Zhuozhou during winter is still serious.
Enrichment factors (EFs) are usually used to differentiate the sources of elements, whether due to natural or anthropogenic processes, by comparing the concentration of each element and the reference trace element [60]. Al was selected as the reference trace element in this study, and other reference concentrations of trace elements in crustal were adopted from Wei et al. (1990) [61]. The EFs of nine elements were calculated as shown in Table S1. The mean EF of Ca, Fe, K was less than 5, suggesting that these elements, primarily due to natural processes, have no obvious enrichment in PM10; in contrast, the average EFs of Mn, Cu, As, Zn and Pb were higher than 10, even higher than 2000 for Hg, indicating that these six elements mainly derive from anthropogenic sources and have high enrichment in PM10. Mn, Cu, As and Zn mainly originated from coal combustion, vehicle emissions, steel smelting and waste incineration [62,63,64]; Pb came from vehicle and coal combustion [65]; Hg was related to coal combustion. It is suggested that higher anthropogenic emissions (e.g., coal combustion and transport) had a great impact on PM10 concentrations in Zhuozhou; however, some researchers pointed that the results of EFs probably contained ambiguities in calculating element sources in air [66,67]; thus, other methods (e.g., PMF model) would be combined to identify the sources of elements in the following study.

3.1.2. OC and EC

Concentration Distribution

During the sampling period, the concentrations of OC ranged from 12.03 to 63.57 μg/m3 with an average of 31.30 μg/m3, and those of EC ranged from 2.24 to 18.06 μg/m3 with an average of 7.64 μg/m3. On the polluted days, the mean mass concentrations of OC and EC rose significantly, approximately 2.3 and 2.2 times as high as those on the non-polluted days, illustrating the importance of the carbonaceous species in particulate pollution in Zhuozhou. Figure 3 shows the average concentrations of OC, EC, and water-soluble ions observed in this study and some “2 + 26” air pollution transmission channel cities in Beijing–Tianjin–Hebei from 2015 to 2020 [18,19,20,54,66,68,69]. The mass concentrations of OC in Zhuozhou were higher than those of most monitoring cities except for Handan and Zhengzhou; Zhuozhou had larger EC concentrations than Jinan, Xinxiang, Beijing, and Tianjin, but had similar EC concentrations with Zibo, Zhengzhou, Shijiazhuang, and Baoding. In order to improve the air quality, the Scheme of Air Pollution Prevention and Control in the Beijing-Tianjin-Hebei Region and Surrounding Areas in 2017 (https://www.sohu.com/a/130963994_470091, accessed on 29 March 2017) was implemented, but OC and EC concentrations still maintained a relatively high level, illustrating the severity of the carbonaceous pollution in Zhuozhou.

Sources of OC and EC
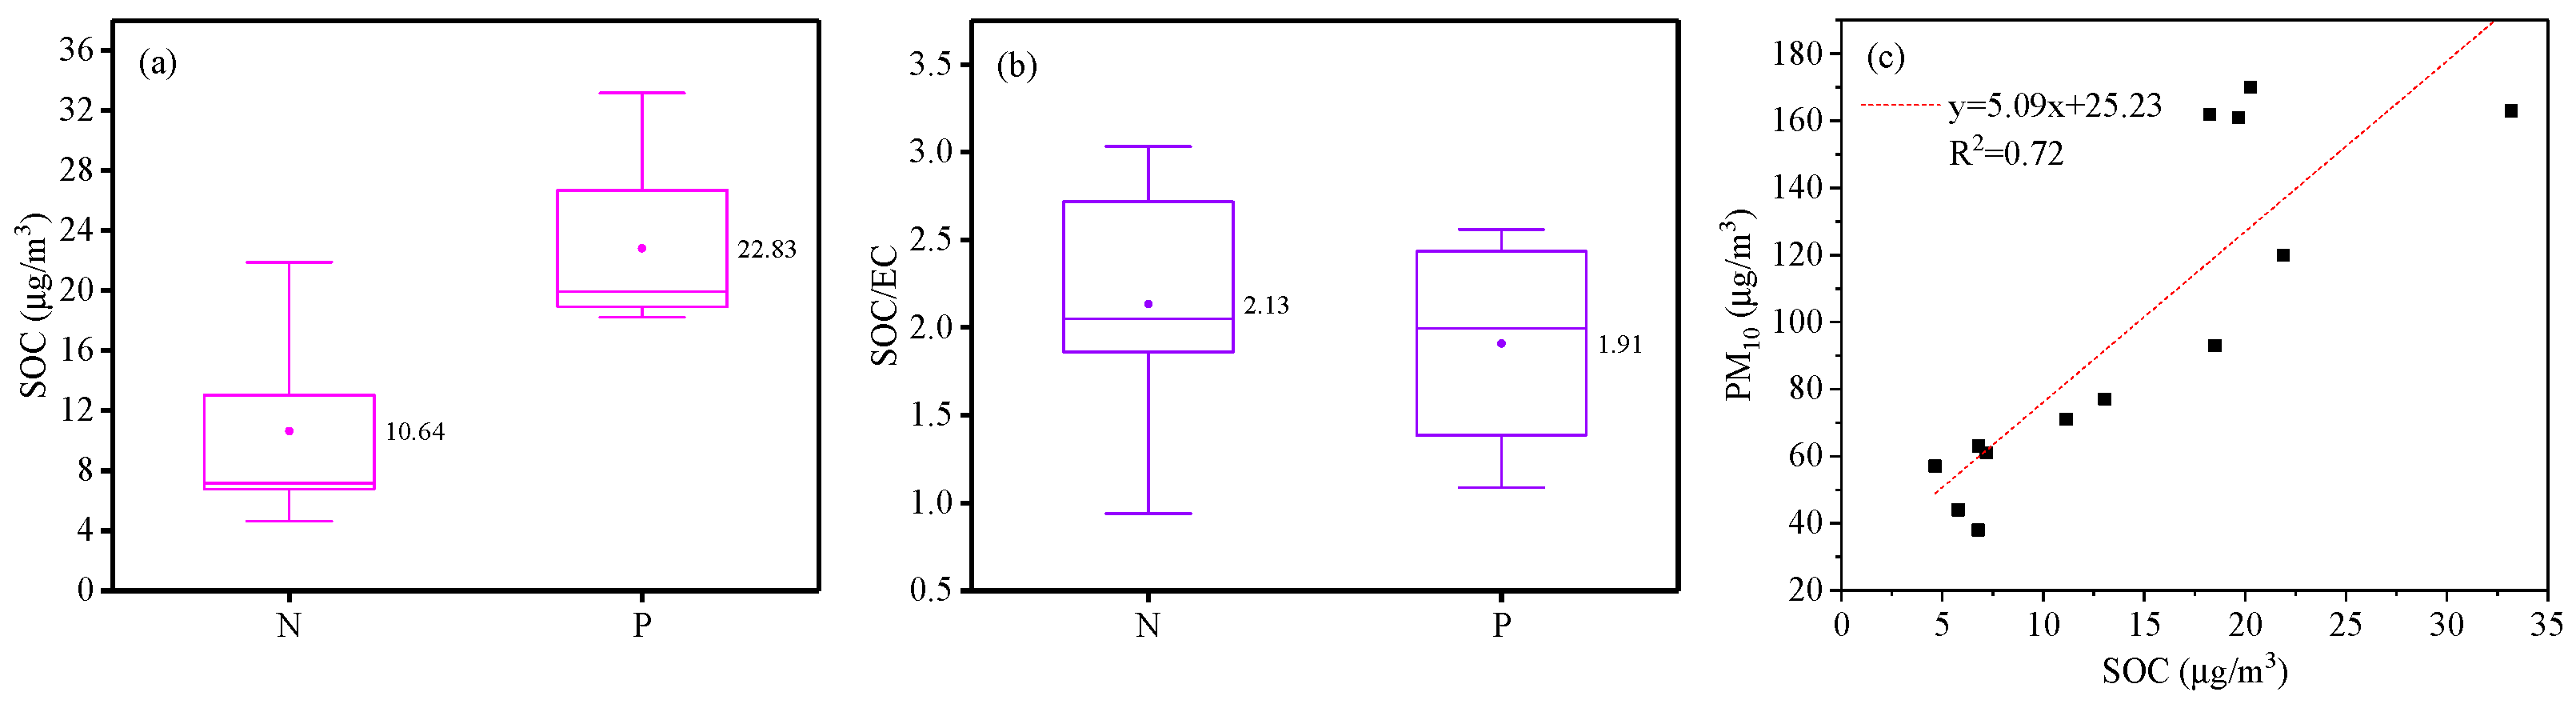
The formation of OC and EC is sophisticated. OC consists of primary organic carbon (POC) directly emitted from emission sources and secondary organic carbon (SOC) produced through the photochemical reaction. Most EC is a primary product of the incomplete combustion of fossil fuels and biomass burning and generally does not react in the atmosphere [70,71]. On average, the concentrations of OC were 4 times as high as those of EC in this study. Correlation analysis showed that there was a relatively high relationship (R2 = 0.82) between OC and EC (Figure S1a), suggesting that OC and EC probably originate from the same primary sources and go through the similar evolution. This results were consistent with [55] (Beijing) and [53] (Tianjian). Further analysis showed that the Pearson’s coefficient of OC/EC and K+ concentrations was 0.62 (Figure S1b), indicating that they have homology with K+ and are possibly related to biomass burning emissions. According to previous research results [72,73], OC and EC came from vehicle, biomass and coal combustion when the OC/EC value was 1.0~4.2, 4.1~14.5 and 0.3~7.6, respectively. During this sampling period, the average OC/EC ratio was 4.09, ranging from 2.34 to 5.38, showing that vehicle, coal and biomass burning were probably important sources of OC and EC in Zhuozhou.

SOC and SOC/EC

Previous studies showed that SOC was probably formed in the atmosphere when the OC/EC ratio was larger than 2.0~2.2 [74]. The SOC concentration was estimated in the following Formula (2) based on the EC-tracer method [75]:
S O C = O C E C O C E C m i n
where the (OC/EC)min was the lowest OC/EC ratio during the sampling period, 2.35 in this study. The average mass concentration of SOC was 14.39 μg/m3, with a fraction of 45.97% of the total mass of OC, indicating an important contribution to particulate matter. This was close to the result (fraction of 45.2%) observed in Tianjin [76]. It should be noted that the OC/EC ratios in emissions from biomass burning and fossil fuel combustion can be different [77], so the used EC tracer method without distinguishing OC and EC sources may overestimate or underestimate SOC to some extent.
As shown in Figure 4a,b, from the non-polluted days to the polluted days, the SOC concentrations increased by 2.2 times, whereas the value of SOC/EC decreased, indicating that the formation rate of secondary pollutants reduces compared with the accumulation rate of primary pollutants. The correlation between PM10 and SOC is also analyzed in Figure 4c. High correlation coefficients (R2 = 0.72) further implied that SOC had a relatively larger impact on PM10 concentrations.

3.1.3. Water-Soluble Ions

Concentration Distribution

The average concentration of SNA (SO42−, NO3 and NH4+) was 7.56 μg/m3, accounting for about 77.77% of the total ion concentration. The mass contribution of NO3 to SNA was 34.64%, exceeding those of SO42− and NH4+ (a fraction of 19.82% and 23.35%). NO3 and SO42− were primarily formed by secondary conversion of nitrogen oxides and sulfur dioxide from vehicle emissions, coal combustion, and industrial process [78]; besides the secondary conversion, the wide use of wet desulfurization in coal-fired power plants resulted in the direct emission of sulfate particles into the atmosphere [79]. There are two coal-fired power plants in Zhuozhou, and the Beijing–Shenzhen Expressway and national highway 107 run through the whole territory. The emissions of sulfur and nitrogen oxides have an important impact on the formation of SNA.
Compared with SNA, the mass concentrations of other water-soluble ions were relatively low, only contributing about 22.1% of the total ion concentration. The order of concentrations from high to low is Ca2+ > Cl > Na+ > K+ > Mg2+. Ca2+ and Mg2+ were mainly from dust storm and construction dust [80,81]. Na+ was probably from sea salt and wind dust [82]. The content of Cl was high, but slightly lower than that of Ca2+. Cl was usually related to anthropogenic emissions, such as biomass burning, coal combustion, and motor vehicle emissions [83]. K+ was an indicator of biomass burning [84]. The correlation between Cl and K+ is analyzed in Figure S2; both had a significant correlation on either non-polluted or polluted days; the Pearson’s coefficient was 0.72 and 0.93, respectively, suggesting that Cl in Zhuozhou mainly originates from biomass combustion.

Nitrogen Oxidation Ratio (NOR) and Sulfur Oxidation Ratio (SOR)

The NOR and SOR were applied to indicate secondary transformation efficiency of nitrogen dioxide (NO2) and sulfur dioxide (SO2) [85,86,87]. The NOR and SOR were calculated using Formulas (3) and (4):
N O R = n [ N O 3 ] n [ N O 3 ] + n [ N O 2 ]
S O R = n [ S O 4 2 ] n [ S O 4 2 ] + n [ S O 2 ]
where the concentrations of NO2, SO2, nitrate and sulfate need to be unified into the same units of molar concentrations. The calculated average NOR and SOR values were 0.12 and 0.20, respectively.
Compared with other “2 + 26” cities, the NOR value in Zhuozhou was closest to that in Tianjin, whereas the SOR value in Zhuozhou was similar to that in Tianjin, Handan and Linfen (Table 2). Previous studies showed that secondary products were formed when the NOR or SOR values > 0.1 [53]; furthermore, higher NOR and SOR values indicated that a larger fraction of nitrate and sulfate was transformed by NO2 and SO2 [86,88]. Although the concentration of NO2 was 2–5 times that of SO2 during the sampling period (Figure S3), the NOR value was lower than the SOR value, due mainly to the different photochemical reaction rates of NO2 and SO2 and removal processes [86,89]. From the non-polluted period to the pollution period, the average SOR value increased from 0.18 to 0.32, nearly doubling, whereas the average NOR value increased from 0.09 to 0.24, nearly tripling (Figure 5), indicating that the secondary conversion of NO2 is more significant during the pollution period.
The correlation coefficient between SOR or NOR values and wind speed was low (r < 0.2), indicating that the secondary conversion of SO2 and NO2 is not mainly affected by wind speed, consistent with the result of Wang; Zhang [87] in Beijing in winter. The SOR had a relatively low correlation with air temperature or relative humidity on the non-polluted days (r < 0.4), but a strong positive correlation with air temperature or relative humidity on polluted days (r = 0.79 and r = 0.97) (Figure S4), indicating that the chemical conversion from SO2 to SO42− is sensitive to ambient meteorological conditions. The NOR showed a low correlation with air temperature on the non-polluted days (r = −0.43), but a better correlation on the polluted days (r = 0.77), similar to the SOR (Figure S4). A good correlation between the NOR and relative humidity on both non-polluted and polluted days (r = 0.67 and r = 0.97) (Figure S4) suggests that the aerosol process (gas-phase process or heterogeneous reactions) plays a major role in the formation of NO3.

Correlation of NH4+, NO3, and SO42−

From Table S2, the Pearson’s coefficient between NH4+ and Cl was 0.34, much lower than 0.93 (between NH4+ and NO3) and 0.72 (between NH4+ and SO42−), indicating that NH4+ is most likely to exist in the form of NH4NO3, (NH4)2SO4 or NH4HSO4.
Previous studies have shown that NH4+ is rich in SO42− and NO3 can be formed by gas-phase oxidation when the NH4+/SO42− ratio is >1.5 [91]. This is different in two pollution episodes (Figure S5). In the first pollution episode, the NH4+/SO42− ratio was generally >1.5, indicating that NO3 is mainly produced by the gas-phase oxidation process; in the second pollution episode, the NH4+/SO42− ratio was <1.5, while the concentrations of NO3, SO42−, NH4+ were significantly higher than those in the first period, indicating that there are more complex processes in this episode besides gas-phase oxidation.
The ratio of NO3/SO42− can be used to reflect the relative importance of the vehicle and stationary sources emitting sulfur dioxide and nitrogen oxides to the atmosphere. Vehicle ownership in China was low two decades ago and the ratio was usually less than 1; with a rapid increase in vehicle numbers and implementation of coal reduction and desulfurization policies, the NO3/SO42− ratios in many cities of China have risen to >1.0, close to or even larger than those in some cities in developed countries [55,92,93,94]. During the sampling period, the average ratio of NO3/SO42− in Zhuozhou city was 1.91 (Figure S5), close to 1.75 in Tianjin in 2016 [53]. The mean NO3/SO42− ratio during the non-polluted days was 1.82, and rose to 2.35 on polluted days, indicating the apparent increase of NO3 caused by motor vehicle emissions.

3.2. Source Identification by PMF Model

The PMF results are illustrated in Figure 6, and the contribution of each sectorial factor is presented in Figure 6b. Factor 1 was characterized by a notably higher loading of NO3, SO42−, NH4+ and was identified as a secondary source [95,96]. Factor 2 was classified as a traffic source, being associated with high loadings of OC, EC, Al, and Fe; OC and EC were the dominant components of gasoline and diesel burning [97]; trace elements (Al, Fe) were emitted from after-treatment devices [98]. The main species of factor 3 were Cl and K+, generally identified as tracers for biomass combustion [84]. Factor 4 showed a high loading of metal elements and was classified as an industry source; As, Cu, Zn, Pb, and Mn were abundant in particles from industrial processes such as refining, metal smelting, and spinning processing [16,17,99], which were the dominant industries in Zhuozhou. Factor 5 was characterized by high loadings of SO42− and EC, commonly originating from coal combustion [100]; large contributions of Na+ may be related to the low calorific value coal used in coal-fired power plants [101]. Factor 6 was represented by high loadings of Ca, Ca2+, and Mg2+, mostly related to a natural source, so this factor was identified as crustal dust.
In brief, the secondary source (which mainly refers to the inorganic aerosol source) was the dominant contributor to PM10, similar to the results in some “2 + 26” cities, e.g., Tianjin, Baoding, Cangzhou, Shijiazhuang, Handan and Jinan, shown in Table S3. The percentage contributions of the other five sources were, in order, traffic (20.9%), biomass burning (15.0%), industry (13.9%), coal combustion (9.4%), and crustal dust (8.3%). As depicted in Table S3, the traffic contribution was relatively large in Zhuozhou compared with other cities, mainly attributed to the high volume of vehicles from the Beijing–Shenzhen Expressway and national highway 107 through this city; moreover, the biomass burning source contributed a considerable proportion of PM10 in Zhuozhou. In order to reduce haze events, the China government has implemented a Burning Gas Instead of Coal policy in some northern cities since 2017. According to this policy, the large amounts of coal used for heating in Zhuozhou has been replaced with clean natural gas, but in some local areas straw and other biomass were used for heating in order to save on living expenses.

3.3. Trajectories and Source Area Distribution of OC and SNA

The backward trajectories of the air masses during the sampling period are shown in Figure 7a. The 72-h transport trajectories were clustered into three clusters in terms of directions and transport pathways. It can be seen that Cluster 1 was the dominant cluster and accounted for nearly 50% of the total trajectories, followed by clusters 2 and 3. Cluster 1 represented the short-distance airflow from middle-southern areas of Hebei province, Beijing, Tianjin, northeastern Hebei province, and northwestern Liaoning province, which had a heavy industrial density and a high population density, producing large emissions of pollutants, and higher values of OC and SNA species were found in Cluster 1. Clusters 2 and 3 illustrated long-distance air transport, mainly originating from Mongolia and passing through Inner Mongolia and northwestern Hebei province before arriving in Zhuozhou.
To understand the regional distribution of the two prominent chemical components (OC and SNA) for Zhuozhou, PSCF analysis was further used to resolve the source areas (Figure 7b–e). The dominant potential source areas of NO3 and NH4+ were similar in southern Hebei province (e.g., Baoding, Shijiazhuang, Xingtai and Handan), eastern Tianjin, northeastern Hebei province (e.g., Tangshan and Qinhuangdao), and northwestern Liaoning province. As mentioned above, the concentrations of NO3 and NH4+ precursors in those areas were high, aggravating the pollution of NO3 and NH4+ there [102]. The high contribution areas of SO42− were found in southern Hebei province, northern Shanxi province and more distant areas, along with Cluster 2, indicating that SO42− is strongly influenced by long-range transport because of its long lift-time [103,104]. The abundant OC was mainly from southern Hebei province with heavy air pollution, and the potential source areas of OC were partly distributed in Mongolia and Inner Mongolia because these regions possibly contributed large amounts of mineral aerosols and carbonaceous components [17].

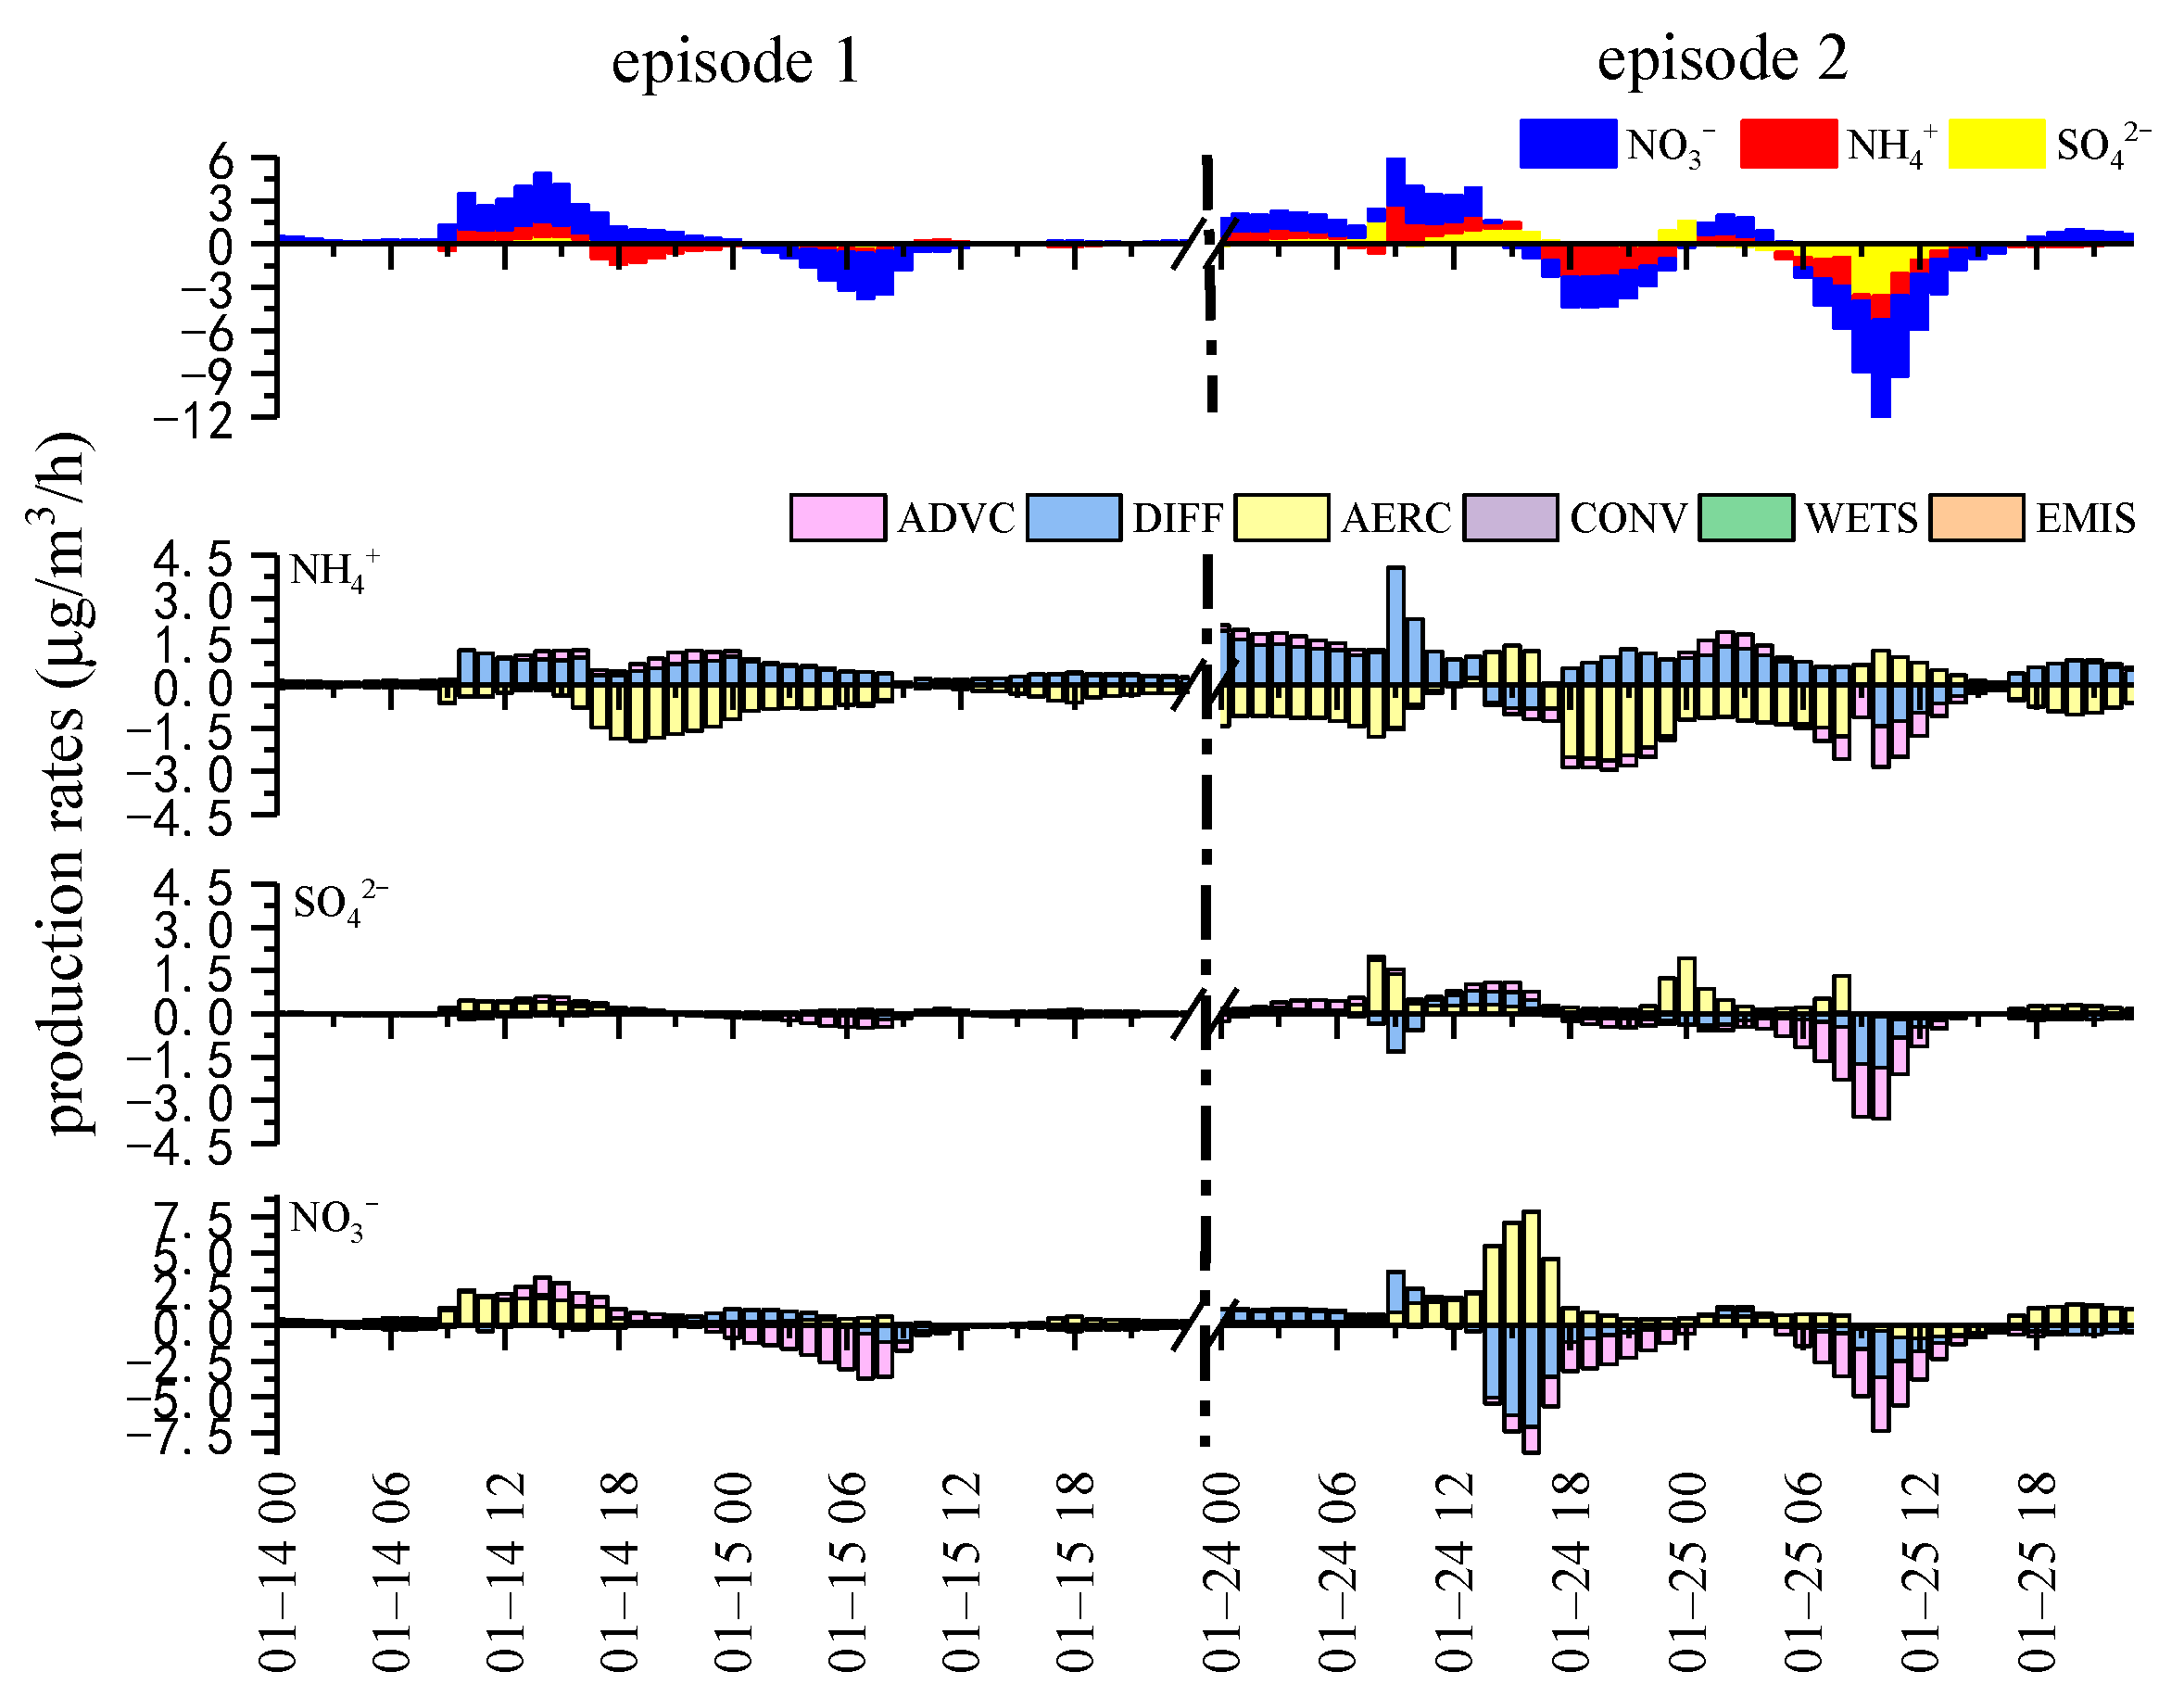
3.4. Progress Analysis of SNA

Based on the above analysis, SNA played a significant role in the formation of PM10 and the mass concentrations and percentages of SNA were apparently higher than those of OC and EC in the second polluted episode (Figure 1), so we analyzed SNA production and accumulation during the two pollution episodes, using WRF-Chem with the IPR analysis method in this section, because PSCF analysis cannot reflect the individual physical and chemical roles in the formation progress of secondary pollutants. The model performance was evaluated as shown in the Supplementary Materials (Table S4). The simulation showed good consistency with the observations. Figure 8 shows the evolution of hourly net production rates of NH4+, SO42−, NO3 and the contributions of each physical/chemical process to their variations. All the results were averaged within a range of 81 × 81 km around Zhuozhou to reflect the average situation of Zhuozhou city and its surrounding areas.
During the two pollution episodes, the increase in SNA concentrations (i.e., a positive production rate) mainly occurred on the first day; a significant increase in SNA (>2 μg/m3/h) occurred between 10:00 and 16:00 in episode 1 and between 0:00 and 15:00 in episode 2 (Figure 8, top panel). Among the three SNA compositions, NO3 made the largest contribution to SNA and the accumulated positive production was 16.8 μg/m3 (10:00–16:00 on 14 January) and 20.7 μg/m3 (0:00–15:00 on 24 January). From the bottom panel of Figure 8, NO3 concentrations in episode 1 were mainly contributed to by the combined effects of aerosol process and advection; the total contribution of the aerosol process was 12.6 μg/m3, about three times that of advection (10:00–16:00 on 14 January). During episode 2, the increase in NO3 was principally caused by the aerosol process, contributing 22.9 μg/m3 (0:00–15:00 on 24 January), much higher than in episode 1. The turbulent diffusion process initially made a small positive contribution, but this rapidly changed to a larger negative contribution from 12:00, resulting in its total contribution being negative during 0:00–15:00 on 24 January. To explain the reason for the NO3 increase caused by aerosol process in the two episodes, we quantified the hourly contributions of three chemical pathways producing HNO3 (Figure 9). Figure 9 showed that gas-phase reactions in the presence of ammonia during daytime were the dominant contributor to NO3 increases in Zhuozhou; many field observations have also reported that this is the main pathway for nitrate formation in winter [19,85,105]. Additionally, the influence of the heterogeneous process during nighttime was significantly larger in episode 2 than in episode 1, and was also an important factor in the formation of NO3 at night. For NH4+ the turbulent diffusion process was found to be the dominant contributor, leading to an increase of 6.71 μg/m3 in episode 1 (10:00–16:00 on 14 January) and 19.7 μg/m3 in episode 2 (0:00–15:00 on 24 January). Aerosol process played an important positive role in the formation of SO42−, contributing 2.39 μg/m3 in episode 1 and 5.58 μg/m3 in episode 2 due to relatively low SO2 emissions.
The uncertainty in model simulations mainly comes from that of the emission inventory, which has been discussed in Chan et al. [106], Chuang et al. [107] and Xie et al. [108]. The uncertainty of used parameterization schemes and parameter settings related to the formation of SNA has been partially discussed in our previous research (e.g., nitrous acid formation, dinitrogen pentoxide heterogeneous reaction) [24,109,110], and this work used the previous parameterization schemes. The deviation of SNA simulations may have an impact on the results of process analysis and, in the future, the uncertainty caused by multiple factors will be quantified and systematically analyzed.

4. Conclusions

Zhuozhou, as the southern gateway of Beijing, is facing severe pressure to control particulate matter. In this study, the composition, sources and formation of PM10 were observed and analyzed by using PMF and trajectory models, and WRF-Chem with IPR analysis.
During the whole observation period, OC and EC and water soluble ions dominated the mass concentrations of PM10 and increased by more than two times from non-polluted days to polluted days (14–15 January 2022, 24–25 January 2022). Crustal elements (Al, Ca, Fe, K) were primarily from natural processes, accounting for 85.6% of the total detected elemental mass. Five trace elements (Mn, Cu, As, Zn, Pb) had high enrichment in PM10 and were identified mainly from anthropogenic sources (e.g., coal combustion, transport and biomass burning). The mass concentrations of Mn and As exceeded the reference values of WHO and NAAQS due to coal-fired power plants and the large amount of coal used for winter heating. Moreover, the average EFs (enrichment factors) of Mn, Cu, As, Zn, Pb and Hg were higher than 10, indicating the higher impact of anthropogenic emissions on PM10 concentrations in Zhuozhou.
OC and EC concentrations were significantly enhanced in the polluted days, approximately 2.3 and 2.2 times higher than those in the non-polluted days. Compared to “2 + 26” air pollution transmission channel cities, Zhuozhou had high mass concentrations of OC and larger mass concentrations of EC than many cities, e.g., Jinan, Xinxiang, Beijing, and Tianjin, indicating that carbonaceous pollution in Zhuozhou is still severe. A high correlation between OC and EC showed the same primary sources and similar evolution. The OC/EC ratio ranged from 2.34 to 5.38, illustrating that traffic, coal and biomass burning are probably important sources of OC and EC in Zhuozhou. The mass concentration of SOC accounted for a relatively large proportion (approximately 45.97%) of OC during the entire observation period, indicating an important contribution to particulate matter. Although the SOC concentrations increased by 2.2 times from the non-polluted days to the polluted days, the SOC/EC ratio decreased from the non-polluted days to the polluted days, indicating that the rate of secondary pollutant formation is lower than that of primary pollutant accumulation during the polluted days.
Water soluble ions had the largest growth in the polluted days, nearly tripling compared with their concentrations in the non-polluted days. The average concentration of SNA was 7.56 μg/m3, accounting for about 77.77% of the total water-soluble ions. NO3 dominated SNA and was approximately twice the concentration of SO42−. Although the concentration of NO2 was 2–5 times that of SO2 during the sampling period, the NOR value was lower than the SOR value. However, from the non-polluted period to the pollution period, the average NOR value increased by nearly 3 times, indicating that the secondary conversion of NO2 is more significant during the pollution period. NOR exhibited a good correlation with relative humidity, showing that the aerosol process plays a major role in the formation of NO3. The mean NO3/SO42− ratio rose to 2.35 in the polluted days, reflecting the significant contribution of motor vehicle emissions.
Six sources were identified by the PMF model. The secondary source was the dominant contributor to PM10, with the largest portion of 32.5%; the other five sources were traffic, biomass burning, industry, coal combustion and crustal dust, contributing 20.9%, 15.0%, 13.9%, 9.4% and 8.3%, respectively. The HYSPLIT and PSCF analysis showed that short-distance airflow was the dominant cluster and accounted for nearly 50% of the total trajectories. The dominant potential source areas of NO3 and NH4+ were similar, in southern Hebei province, eastern Tianjin, northeastern Hebei province and northwestern Liaoning province. SO42− was strongly influenced by the long-range transport due to its long lift-time. The source area of OC was mainly distributed in southern Hebei province with heavy air pollution. In the presence of ammonia, dominant gas-phase reactions during daytime and a noticeable heterogeneous process during nighttime were the primary reasons for the significant enhancement of NO3 in Zhuozhou, contributing 12.6 μg/m3 and 22.9 μg/m3 in episodes 1 and 2, respectively.

Supplementary Materials

The following supporting information can be downloaded at: https://www.mdpi.com/article/10.3390/atmos16060656/s1, Figure S1: Correlations between OC and EC (a), and between OC/EC and K+ (b). Figure S2: Correlations between Cl and K+ in non-polluted (N) and polluted (P) days. Figure S3: Time series of SO2, NO2, and NO2/SO2 ratios during sampling period. Figure S4: Correlations between SOR or NOR values and air temperature (T) or relative humidity (RH) on non-polluted (N) and polluted (P) days. Figure S5: Time series of NO3, SO42−, NH4+ concentrations and the ratios of NO3/SO42− and NH4+/SO42−. Table S1: Average enrichment factors of trace elements. Table S2: Pearson’s coefficients. Table S3: PMF results of PM10/PM2.5 obtained in some studies of “2 + 26” cities. Table S4: WRF-Chem performance metrics.

Author Contributions

Conceptualization, Y.Q. and J.A.; Methodology, Y.Q., X.L., Y.C., H.R. and J.A.; Software, Y.C.; Validation, F.Y.; Formal analysis, J.Y. and H.R.; Investigation, Y.Q. and J.Y.; Resources, X.L.; Data curation, X.L.; Writing—original draft, Y.Q.; Writing—review & editing, J.A.; Visualization, J.Y. and F.Y.; Funding acquisition, J.A. All authors have read and agreed to the published version of the manuscript.

Funding

This work was supported by the Strategic Priority Research Program of the Chinese Academy of Sciences (Grant No. XDB0760300), the National Natural Science Foundation of China (No. 42075108), and the National Key Research and Development Program of China (Nos. 2022YFC3700703, 2022YFC3701203).

Institutional Review Board Statement

Not applicable.

Informed Consent Statement

Not applicable.

Data Availability Statement

The original contributions presented in this study are included in the article/Supplementary Materials. Further inquiries can be directed to the corresponding author.

Conflicts of Interest

The authors declare no conflict of interest.

References

  1. Tan, T.; Hu, M.; Li, M.; Guo, Q.; Wu, Y.; Fang, X.; Gu, F.; Wang, Y.; Wu, Z. New insight into PM2.5 pollution patterns in Beijing based on one-year measurement of chemical compositions. Sci. Total Environ. 2018, 621, 734–743. [Google Scholar] [CrossRef] [PubMed]
  2. Ren, X.L.; Hu, W.; Wu, C.M.; Hu, S.H.; Gao, N.N.; Zhang, C.C.; Yue, L.; Wang, J.X.; Fan, J.S.; Niu, H.Y. Chemical Characteristics and Sources of Atmospheric Aerosols in the Surrounding District of a Heavily Polluted City in the Southern Part of North China. Huanjing Kexue 2022, 43, 1159–1169. [Google Scholar] [CrossRef] [PubMed]
  3. Sun, Y.; Chen, C.; Zhang, Y.; Xu, W.; Zhou, L.; Cheng, X.; Zheng, H.; Ji, D.; Li, J.; Tang, X.; et al. Rapid formation and evolution of an extreme haze episode in Northern China during winter 2015. Sci. Rep. 2016, 6, 27151. [Google Scholar] [CrossRef] [PubMed]
  4. Han, B.; Zhang, R.; Yang, W.; Bai, Z.; Ma, Z.; Zhang, W. Heavy haze episodes in Beijing during January 2013: Inorganic ion chemistry and source analysis using highly time-resolved measurements from an urban site. Sci. Total Environ. 2016, 544, 319–329. [Google Scholar] [CrossRef]
  5. Crilley, L.R.; Lucarelli, F.; Bloss, W.J.; Harrison, R.M.; Beddows, D.C.; Calzolai, G.; Nava, S.; Valli, G.; Bernardoni, V.; Vecchi, R. Source apportionment of fine and coarse particles at a roadside and urban background site in London during the 2012 summer ClearfLo campaign. Environ. Pollut. 2017, 220, 766–778. [Google Scholar] [CrossRef]
  6. Kumar, P.; Zavala-Reyes, J.C.; Kalaiarasan, G.; Abubakar-Waziri, H.; Young, G.; Mudway, I.; Dilliway, C.; Lakhdar, R.; Mumby, S.; Klosowski, M.M.; et al. Characteristics of fine and ultrafine aerosols in the London underground. Sci. Total Environ. 2023, 858, 159315. [Google Scholar] [CrossRef]
  7. Yang, F.; Tan, J.; Zhao, Q.; Du, Z.; He, K.; Ma, Y.; Duan, F.; Chen, G.; Zhao, Q. Characteristics of PM2.5 speciation in representative megacities and across China. Atmos. Chem. Phys. 2011, 11, 5207–5219. [Google Scholar] [CrossRef]
  8. Cheng, N.L.; Li, Y.T.; Cheng, B.F.; Wang, X.; Meng, F.; Wang, Q.; Qiu, Q.H. Comparisons of two serious air pollution episodes in winter and summer in Beijing. J. Environ. Sci. 2018, 69, 141–154. [Google Scholar] [CrossRef]
  9. Saxena, M.; Sharma, A.; Sen, A.; Saxena, P.; Saraswati; Mandal, T.K.; Sharma, S.K.; Sharma, C. Water soluble inorganic species of PM10 and PM2.5 at an urban site of Delhi, India: Seasonal variability and sources. Atmos. Res. 2017, 184, 112–125. [Google Scholar] [CrossRef]
  10. Gao, J.; Wang, K.; Wang, Y.; Liu, S.; Zhu, C.; Hao, J.; Liu, H.; Hua, S.; Tian, H. Temporal-spatial characteristics and source apportionment of PM2.5 as well as its associated chemical species in the Beijing-Tianjin-Hebei region of China. Environ. Pollut. 2018, 233, 714–724. [Google Scholar] [CrossRef]
  11. Lv, L.; Chen, Y.; Han, Y.; Cui, M.; Wei, P.; Zheng, M.; Hu, J. High-time-resolution PM2.5 source apportionment based on multi-model with organic tracers in Beijing during haze episodes. Sci. Total Environ. 2021, 772, 144766. [Google Scholar] [CrossRef] [PubMed]
  12. Chang, X.; Wang, S.; Zhao, B.; Xing, J.; Liu, X.; Wei, L.; Song, Y.; Wu, W.; Cai, S.; Zheng, H.; et al. Contributions of inter-city and regional transport to PM2.5 concentrations in the Beijing-Tianjin-Hebei region and its implications on regional joint air pollution control. Sci. Total Environ. 2019, 660, 1191–1200. [Google Scholar] [CrossRef] [PubMed]
  13. Zhang, H.; Cheng, S.; Wang, X.; Yao, S.; Zhu, F. Continuous monitoring, compositions analysis and the implication of regional transport for submicron and fine aerosols in Beijing, China. Atmos. Environ. 2018, 195, 30–45. [Google Scholar] [CrossRef]
  14. Lu, Y.; Ni, S.; Wang, H.; Zhou, Y.; Du, J.; Meng, C.; Zhao, J. Estimation of vehicle emission based on traffic flow on national and provincial roads in Hebei Province. Acta Sci. Circumstantiae 2020, 40, 4483–4491. [Google Scholar]
  15. Gou, Y.-Y.; Zhang, K.; Li, J.-J.; Lu, W.-L.; Zhu, S.; Li, J.; He, S.-S.; Zheng, Y.; Zhi, M.-K. Variational Trend and Characteristics of Air Pollution in Baoding City. Huan Jing Ke Xue = Huanjing Kexue 2020, 41, 4413–4425. [Google Scholar] [CrossRef]
  16. Lang, J.; Li, S.; Cheng, S.; Zhou, Y.; Wang, H. Chemical Characteristics and Sources of Submicron Particles in a City with Heavy Pollution in China. Atmosphere 2018, 9, 388. [Google Scholar] [CrossRef]
  17. Zhang, Y.; Lang, J.; Cheng, S.; Li, S.; Zhou, Y.; Chen, D.; Zhang, H.; Wang, H. Chemical composition and sources of PM1 and PM2.5 in Beijing in autumn. Sci. Total Environ. 2018, 630, 72–82. [Google Scholar] [CrossRef]
  18. Li, Y.F.; Liu, B.S.; Xue, Z.G.; Zhang, Y.F.; Sun, X.Y.; Song, C.B.; Dai, Q.L.; Fu, R.C.; Tai, Y.G.; Gao, J.Y.; et al. Chemical characteristics and source apportionment of PM2.5 using PMF modelling coupled with 1-hr resolution online air pollutant dataset for Linfen, China. Environ. Pollut. 2020, 263, 114532. [Google Scholar] [CrossRef]
  19. Chen, C.; Zhang, H.; Li, H.; Wu, N.; Zhang, Q. Chemical characteristics and source apportionment of ambient PM1.0 and PM2.5 in a polluted city in North China plain. Atmos. Environ. 2020, 242, 117867. [Google Scholar] [CrossRef]
  20. Xu, H.; Xiao, Z.; Chen, K.; Tang, M.; Zheng, N.; Li, P.; Yang, N.; Yang, W.; Deng, X. Spatial and temporal distribution, chemical characteristics, and sources of ambient particulate matter in the Beijing-Tianjin-Hebei region. Sci. Total Environ. 2019, 658, 280–293. [Google Scholar] [CrossRef]
  21. Paatero, P. Least squares formulation of robust non-negative factor analysis. Chemom. Intell. Lab. Syst. 1997, 37, 23–35. [Google Scholar] [CrossRef]
  22. Bai, D.P.; Wang, H.L.; Cheng, M.T.; Gao, W.K.; Yang, Y.; Huang, W.; Ma, K.J.; Zhang, Y.; Zhang, R.J.; Zou, J.N.; et al. Source apportionment of PM2.5 and its optical properties during a regional haze episode over north China plain. Atmos. Pollut. Res. 2020, 12, 89–99. [Google Scholar] [CrossRef]
  23. Grell, G.A.; Peckham, S.E.; Schmitz, R.; McKeen, S.A.; Frost, G.; Skamarock, W.C.; Eder, B. Fully coupled “online” chemistry within the WRF model. Atmos. Environ. 2005, 39, 6957–6975. [Google Scholar] [CrossRef]
  24. Qu, Y.; Chen, Y.; Liu, X.; Zhang, J.; Guo, Y.; An, J. Seasonal effects of additional HONO sources and the heterogeneous reactions of N2O5 on nitrate in the North China Plain. Sci. Total Environ. 2019, 690, 97–107. [Google Scholar] [CrossRef] [PubMed]
  25. Li, C.; Hammer, M.S.; Zheng, B.; Cohen, R.C. Accelerated reduction of air pollutants in China, 2017–2020. Sci. Total Environ. 2022, 803, 150011. [Google Scholar] [CrossRef]
  26. Li, H.; Cheng, J.; Zhang, Q.; Zheng, B.; Zhang, Y.; Zheng, G.; He, K. Rapid transition in winter aerosol composition in Beijing from 2014 to 2017: Response to clean air actions. Atmos. Chem. Phys. 2019, 19, 11485–11499. [Google Scholar] [CrossRef]
  27. Li, J.; Gao, W.; Cao, L.; Xiao, Y.; Zhang, Y.; Zhao, S.; Liu, Z.; Liu, Z.; Tang, G.; Ji, D.; et al. Significant changes in autumn and winter aerosol composition and sources in Beijing from 2012 to 2018: Effects of clean air actions. Environ. Pollut. 2021, 268, 115855. [Google Scholar] [CrossRef]
  28. Pang, N.; Gao, J.; Zhu, G.; Hui, L.; Zhao, P.; Xu, Z.; Tang, W.; Chai, F. Impact of clean air action on the PM2.5 pollution in Beijing, China: Insights gained from two heating seasons measurements. Chemosphere 2021, 263, 127991. [Google Scholar] [CrossRef]
  29. Dao, X.; Ji, D.; Zhang, X.; He, J.; Sun, J.; Hu, J.; Liu, Y.; Wang, L.; Xu, X.; Tang, G.; et al. Significant reduction in atmospheric organic and elemental carbon in PM2.5 in 2 + 26 cities in northern China. Environ. Res. 2022, 211, 113055. [Google Scholar] [CrossRef]
  30. Zhang, Q.; Geng, G. Impact of clean air action on PM2.5 pollution in China. Sci. China-Earth Sci. 2019, 62, 1845–1846. [Google Scholar] [CrossRef]
  31. Zhang, Q.; Zheng, Y.; Tong, D.; Shao, M.; Wang, S.; Zhang, Y.; Xu, X.; Wang, J.; He, H.; Liu, W.; et al. Drivers of improved PM2.5 air quality in China from 2013 to 2017. Proc. Natl. Acad. Sci. USA 2019, 116, 24463–24469. [Google Scholar] [CrossRef] [PubMed]
  32. Zhang, Y.; Liu, X.; Zhang, L.; Tang, A.; Goulding, K.; Collett, J.L.J., Jr. Evolution of secondary inorganic aerosols amidst improving PM2.5 air quality in the North China plain. Environ. Pollut. 2021, 281, 117027. [Google Scholar] [CrossRef] [PubMed]
  33. Zhao, S.; Yin, D.; Yu, Y.; Kang, S.; Qin, D.; Dong, L. PM2.5 and O-3 pollution during 2015–2019 over 367 Chinese cities: Spatiotemporal variations, meteorological and topographical impacts. Environ. Pollut. 2020, 264, 114694. [Google Scholar] [CrossRef]
  34. Xing, J.; Wang, J.; Mathur, R.; Wang, S.; Sarwar, G.; Pleim, J.; Hogrefe, C.; Zhang, Y.; Jiang, J.; Wong, D.C.; et al. Impacts of aerosol direct effects on tropospheric ozone through changes in atmospheric dynamics and photolysis rates. Atmos. Chem. Phys. 2017, 17, 9869–9883. [Google Scholar] [CrossRef]
  35. Couzo, E.; Lefer, B.; Stutz, J.; Yarwood, G.; Karamchandani, P.; Henderson, B.; Vizuete, W. Impacts of heterogeneous HONO formation on radical sources and ozone chemistry in Houston, Texas. Atmos. Environ. 2015, 112, 344–355. [Google Scholar] [CrossRef]
  36. Huang, Z.; Ou, J.; Zheng, J.; Yuan, Z.; Yin, S.; Chen, D.; Tan, H. Process Contributions to Secondary Inorganic Aerosols during Typical Pollution Episodes over the Pearl River Delta Region, China. Aerosol Air Qual. Res. 2016, 16, 2129–2144. [Google Scholar] [CrossRef]
  37. Huszar, P.; Karlicky, J.; Belda, M.; Halenka, T.; Pisoft, P. The impact of urban canopy meteorological forcing on summer photochemistry. Atmos. Environ. 2018, 176, 209–228. [Google Scholar] [CrossRef]
  38. Ma, S.M.; Shao, M.; Zhang, Y.F.; Dai, Q.L.; Xie, M.J. Sensitivity of PM2.5 and O-3 pollution episodes to meteorological factors over the North China Plain. Sci. Total Environ. 2021, 792, 148474. [Google Scholar] [CrossRef]
  39. Poupkou, A.; Markakis, K.; Liora, N.; Giannaros, T.M.; Zanis, P.; Im, U.; Daskalakis, N.; Myriokefalitakis, S.; Kaiser, J.W.; Melas, D.; et al. A modeling study of the impact of the 2007 Greek forest fires on the gaseous pollutant levels in the Eastern Mediterranean. Atmos. Res. 2014, 149, 1–17. [Google Scholar] [CrossRef]
  40. Shu, Q.; Koo, B.; Yarwood, G.; Henderson, B.H. Strong influence of deposition and vertical mixing on secondary organic aerosol concentrations in CMAQ and CAMx. Atmos. Environ. 2017, 171, 317–329. [Google Scholar] [CrossRef]
  41. Tchepel, O.; Ferreira, J.; Martins, H.; Silveira, C.; Miranda, A.I.; Borrego, C. Investigating the Contribution of Biogenic Emissions to the Formation of Secondary Pollutants in Portugal. In 33rd International Technical Meeting (ITM) on Air Pollution Modelling and Its Application; United States Environmental Protection Agency: Miami, FL, USA, 2013. [Google Scholar]
  42. Zhang, Y.; Vijayaraghavan, K.; Seigneur, C. Evaluation of three probing techniques in a three-dimensional air quality model. J. Geophys. Res.-Atmos. 2005, 110, D02305. [Google Scholar] [CrossRef]
  43. Zhao, K.; Wu, Y.; Yuan, Z.; Huang, J.; Liu, X.; Ma, W.; Xu, D.; Jiang, R.; Duan, Y.; Fu, Q.; et al. Understanding the underlying mechanisms governing the linkage between atmospheric oxidative capacity and ozone precursor sensitivity in the Yangtze River Delta, China: A multi-tool ensemble analysis. Environ. Int. 2022, 160, 107060. [Google Scholar] [CrossRef] [PubMed]
  44. Jiang, F.; Zhou, P.; Liu, Q.; Wang, T.; Zhuang, B.; Wang, X. Modeling tropospheric ozone formation over East China in springtime. J. Atmos. Chem. 2012, 69, 303–319. [Google Scholar] [CrossRef]
  45. Zhao, K.; Bao, Y.; Huang, J.; Wu, Y.; Moshary, F.; Arend, M.; Wang, Y.; Lee, X. A high-resolution modeling study of a heat wave-driven ozone exceedance event in New York City and surrounding regions. Atmos. Environ. 2019, 199, 368–379. [Google Scholar] [CrossRef]
  46. Chang, L.Y.; He, F.F.; Tie, X.X.; Xu, J.M.; Gao, W. Meteorology driving the highest ozone level occurred during mid-spring to early summer in Shanghai, China. Sci. Total Environ. 2021, 785, 147253. [Google Scholar] [CrossRef]
  47. Yang, H.; Chen, L.; Liao, H.; Zhu, J.; Wang, W.J.; Li, X. Impacts of aerosol-photolysis interaction and aerosol-radiation feedback on surface-layer ozone in North China during multi-pollutant air pollution episodes. Atmos. Chem. Phys. 2022, 22, 4101–4116. [Google Scholar] [CrossRef]
  48. Chen, L.; Zhu, J.; Liao, H.; Gao, Y.; Qiu, Y.L.; Zhang, M.G.; Liu, Z.R.; Li, N.; Wang, Y.S. Assessing the formation and evolution mechanisms of severe haze pollution in the Beijing-Tianjin-Hebei region using process analysis. Atmos. Chem. Phys. 2019, 19, 10845–10864. [Google Scholar] [CrossRef]
  49. Zhu, J.; Chen, L.; Liao, H.; Yang, H.; Yang, Y.; Yue, X. Enhanced PM2.5 Decreases and O-3 Increases in China During COVID-19 Lockdown by Aerosol-Radiation Feedback. Geophys. Res. Lett. 2021, 48, e2020GL090260. [Google Scholar] [CrossRef]
  50. Tao, W.; Liu, J.; Ban-Weiss, G.A.; Hauglustaine, D.A.; Zhang, L.; Zhang, Q.; Cheng, Y.; Yu, Y.; Tao, S. Effects of urban land expansion on the regional meteorology and air quality of eastern China. Atmos. Chem. Phys. 2015, 15, 8597–8614. [Google Scholar] [CrossRef]
  51. Wang, Z.B.; Zhu, B.; Kang, H.Q.; Lu, W.; Yan, S.Q.; Zhao, D.L.; Zhang, W.H.; Gao, J.H. A black carbon peak and its sources in the free troposphere of Beijing induced by cyclone lifting and transport from central China. Atmos. Chem. Phys. 2021, 21, 15555–15567. [Google Scholar] [CrossRef]
  52. Chen, D.L.; Liao, H.; Yang, Y.; Chen, L.; Zhao, D.L.; Ding, D.P. Simulated impacts of vertical distributions of black carbon aerosol on meteorology and PM2.5 concentrations in Beijing during severe haze events. Atmos. Chem. Phys. 2022, 22, 1825–1844. [Google Scholar] [CrossRef]
  53. Liu, B.; Sun, X.; Zhang, J.; Bi, X.; Li, Y.; Li, L.; Dong, H.; Xiao, Z.; Zhang, Y.; Feng, Y. Characterization and Spatial Source Apportionments of Ambient PM10 and PM2.5 during the Heating Period in Tian’jin, China. Aerosol Air Qual. Res. 2020, 20, 1–13. [Google Scholar] [CrossRef]
  54. Jiang, N.; Li, Q.; Su, F.; Wang, Q.; Yu, X.; Kang, P.; Zhang, R.; Tang, X. Chemical characteristics and source apportionment of PM2.5 between heavily polluted days and other days in Zhengzhou, China. J. Environ. Sci. 2018, 66, 188–198. [Google Scholar] [CrossRef]
  55. Wu, X.C.; Chen, B.; Wen, T.X.; Habib, A.; Shi, G.Y. Concentrations and chemical compositions of PM10 during hazy and non-hazy days in Beijing. J. Environ. Sci. 2020, 87, 1–9. [Google Scholar] [CrossRef]
  56. World Health Organization. WHO Guidelines for Air Quality Geneva; World Health Organization: Geneva, Switzerland, 2000.
  57. Yu, L.; Wang, G.; Zhang, R.; Zhang, L.; Song, Y.; Wu, B.; Li, X.; An, K.; Chu, J. Characterization and Source Apportionment of PM2.5 in an Urban Environment in Beijing. Aerosol Air Qual. Res. 2013, 13, 574–583. [Google Scholar] [CrossRef]
  58. Kauppinen, E.I.; Pakkanen, T.A. Coal combustion aerosols—A field study. Environ. Sci. Technol. 1990, 24, 1811–1818. [Google Scholar] [CrossRef]
  59. Duan, J.; Tan, J. Atmospheric heavy metals and Arsenic in China: Situation, sources and control policies. Atmos. Environ. 2013, 74, 93–101. [Google Scholar] [CrossRef]
  60. Hassanvand, M.S.; Naddafi, K.; Faridi, S.; Nabizadeh, R.; Sowlat, M.H.; Momeniha, F.; Gholampour, A.; Arhami, M.; Kashani, H.; Zare, A.; et al. Characterization of PAHs and metals in indoor/outdoor PM10/PM2.5/PM1 in a retirement home and a school dormitory. Sci. Total Environ. 2015, 527, 100–110. [Google Scholar] [CrossRef]
  61. Wei, F.S.; Chen, J.S.; Wu, Y.Y.; Zheng, C.J. Introduction to Background Value of Soil Environment; China Environmental Science Press: Beijing, China, 1990. [Google Scholar]
  62. Hopke, P.K. An introduction to receptor modeling. Chemometr. Intell. Lab. 1991, 10, 21–43. [Google Scholar] [CrossRef]
  63. Querol, X.; Zhuang, X.; Alastuey, A.; Viana, M.; Lv, W.; Wang, Y.; Lopez, A.; Zhu, Z.; Wei, H.; Xu, S. Speciation and sources of atmospheric aerosols in a highly industrialised emerging mega-city in Central China. J. Environ. Monit. 2006, 8, 1049–1059. [Google Scholar] [CrossRef]
  64. Xia, L.; Gao, Y. Characterization of trace elements in PM2.5 aerosols in the vicinity of highways in northeast New Jersey in the US east coast. Atmos. Pollut. Res. 2011, 2, 34–44. [Google Scholar] [CrossRef]
  65. Tian, H.Z.; Wang, Y.; Xue, Z.G.; Cheng, K.; Qu, Y.P.; Chai, F.H.; Hao, J.M. Trend and characteristics of atmospheric emissions of Hg, As, and Se from coal combustion in China, 1980–2007. Atmos. Chem. Phys. 2010, 10, 11905–11919. [Google Scholar] [CrossRef]
  66. Feng, J.; Yu, H.; Mi, K.; Su, X.; Li, Y.; Li, Q.; Sun, J. One year study of PM2.5 in Xinxiang city, North China: Seasonal characteristics, climate impact and source. Ecotoxicol. Environ. Saf. 2018, 154, 75–83. [Google Scholar] [CrossRef]
  67. Pan, Y.; Wang, Y.; Sun, Y.; Tian, S.; Cheng, M. Size-resolved aerosol trace elements at a rural mountainous site in Northern China: Importance of regional transport. Sci. Total Environ. 2013, 461, 761–771. [Google Scholar] [CrossRef]
  68. Gao, X.M.; Gao, W.D.; Sun, X.Y.; Jiang, W.; Wang, Z.Y.; Li, W.S. Measurements of Indoor and Outdoor Fine Particulate Matter during the Heating Period in Jinan, in North China: Chemical Composition, Health Risk, and Source Apportionment. Atmosphere 2020, 11, 885. [Google Scholar] [CrossRef]
  69. Li, H.; Ma, Y.L.; Duan, F.K.; He, K.B.; Zhu, L.D.; Huang, T.; Kimoto, T.; Ma, X.; Ma, T.; Xu, L.L.; et al. Typical winter haze pollution in Zibo, an industrial city in China: Characteristics, secondary formation, and regional contribution. Environ. Pollut. 2017, 229, 339–349. [Google Scholar] [CrossRef]
  70. Fang, G.C.; Wu, Y.S.; Chou, T.Y.; Lee, C.Z. Organic carbon and elemental carbon in Asia: A review from 1996 to 2006. J. Hazard. Mater. 2008, 150, 231–237. [Google Scholar] [CrossRef]
  71. Briggs, N.L.; Long, C.M. Critical review of black carbon and elemental carbon source apportionment in Europe and the United States. Atmos. Environ. 2016, 144, 409–427. [Google Scholar] [CrossRef]
  72. Watson, J.G.; Chow, J.C.; Houck, J.E. PM2.5 chemical source profiles for vehicle exhaust, vegetative burning, geological material, and coal burning in Northwestern Colorado during 1995. Chemosphere 2001, 43, 1141–1151. [Google Scholar] [CrossRef]
  73. Zhang, Y.-X.; Shao, M.; Zhang, Y.-H.; Zeng, L.-M.; He, L.-Y.; Zhu, B.; Wei, Y.-J.; Zhu, X.-L. Source profiles of particulate organic matters emitted from cereal straw burnings. J. Environ. Sci. 2007, 19, 167–175. [Google Scholar] [CrossRef]
  74. Chow, J.C.; Watson, J.G.; Lu, Z.Q.; Lowenthal, D.H.; Frazier, C.A.; Solomon, P.A.; Thuillier, R.H.; Magliano, K. Descriptive analysis of PM2.5 and PM10 at regionally representative locations during SJVAQS/AUSPEX. Atmos. Environ. 1996, 30, 2079–2112. [Google Scholar] [CrossRef]
  75. Turpin, B.J.; Huntzicker, J.J. Identification of secondary organic aerosol episodes and quantitation of primary and secondary organic aerosol concentrations during SCAQS. Atmos. Environ. 1995, 29, 3527–3544. [Google Scholar] [CrossRef]
  76. Liu, B.S.; Bi, X.H.; Zhang, J.Y.; Yuan, J.; Xiao, Z.M.; Dai, Q.L.; Feng, Y.C.; Zhang, Y.F. Insight into the critical factors determining the particle number concentrations during summer at a megacity in China. J. Environ. Sci. 2019, 75, 169–180. [Google Scholar] [CrossRef]
  77. Wagener, S.; Langner, M.; Hansen, U.; Moriske, H.-J.; Endlicher, W.R. Assessing the Influence of Seasonal and Spatial Variations on the Estimation of Secondary Organic Carbon in Urban Particulate Matter by Applying the EC-Tracer Method. Atmosphere 2014, 5, 252–272. [Google Scholar] [CrossRef]
  78. Almeida, S.M.; Lage, J.; Fernandez, B.; Garcia, S.; Reis, M.A.; Chaves, P.C. Chemical characterization of atmospheric particles and source apportionment in the vicinity of a steelmaking industry. Sci. Total Environ. 2015, 521, 411–420. [Google Scholar] [CrossRef]
  79. Liu, B.; Li, T.; Yang, J.; Wu, J.; Wang, J.; Gao, J.; Bi, X.; Feng, Y.; Zhang, Y.; Yang, H. Source apportionment and a novel approach of estimating regional contributions to ambient PM2.5 in Haikou, China. Environ. Pollut. 2017, 223, 334–345. [Google Scholar] [CrossRef]
  80. Yang, Y.; Zhou, R.; Yu, Y.; Yan, Y.; Liu, Y.; Di, Y.a.; Wu, D.; Zhang, W. Size-resolved aerosol water-soluble ions at a regional background station of Beijing, Tianjin, and Hebei, North China. J. Environ. Sci. 2017, 55, 146–156. [Google Scholar] [CrossRef]
  81. Zhang, D.Z.; Iwasaka, Y. Nitrate and sulfate in individual Asian dust-storm particles in Beijing, China in spring of 1995 and 1996. Atmos. Environ. 1999, 33, 3213–3223. [Google Scholar] [CrossRef]
  82. Behrooz, R.D.; Esmaili-Sari, A.; Bahramifar, N.; Kaskaoutis, D.G.; Saeb, K.; Rajaei, F. Trace-element concentrations and water-soluble ions in size-segregated dust-borne and soil samples in Sistan, southeast Iran. Aeolian Res. 2017, 25, 87–105. [Google Scholar] [CrossRef]
  83. Aikawa, M.; Hiraki, T.; Suzuki, M.; Tamaki, M.; Kasahara, M. Separate chemical characterizations of fog water, aerosol, and gas before, during, and after fog events near an industrialized area in Japan. Atmos. Environ. 2007, 41, 1950–1959. [Google Scholar] [CrossRef]
  84. Urban, R.C.; Lima-Souza, M.; Caetano-Silva, L.; Queiroz, M.E.C.; Nogueira, R.F.P.; Allen, A.G.; Cardoso, A.A.; Held, G.; Campos, M.L.A.M. Use of levoglucosan, potassium, and water-soluble organic carbon to characterize the origins of biomass-burning aerosols. Atmos. Environ. 2012, 61, 562–569. [Google Scholar] [CrossRef]
  85. Sun, Y.L.; Wang, Z.F.; Du, W.; Zhang, Q.; Wang, Q.Q.; Fu, P.Q.; Pan, X.L.; Li, J.; Jayne, J.; Worsnop, D.R. Long-term real-time measurements of aerosol particle composition in Beijing, China: Seasonal variations, meteorological effects, and source analysis. Atmos. Chem. Phys. 2015, 15, 10149–10165. [Google Scholar] [CrossRef]
  86. Wang, C.J.; Hui, F.; Wang, Z.W.; Zhu, X.L.; Zhang, X.S. Chemical characteristics of size-fractioned particles at a suburban site in Shijiazhuang, North China: Implication of secondary particle formation. Atmos. Res. 2021, 259, 105680. [Google Scholar] [CrossRef]
  87. Wang, Z.; Zhang, D.; Liu, B.; Li, Y.; Chen, T.; Sun, F.; Yang, D.; Liang, Y.; Chang, M.; Yang, L.; et al. Analysis of chemical characteristics of PM2.5 in Beijing over a 1-year period. J. Atmos. Chem. 2016, 73, 407–425. [Google Scholar] [CrossRef]
  88. Zhang, T.; Cao, J.J.; Tie, X.X.; Shen, Z.X.; Liu, S.X.; Ding, H.; Han, Y.M.; Wang, G.H.; Ho, K.F.; Qiang, J.; et al. Water-soluble ions in atmospheric aerosols measured in Xi’an, China: Seasonal variations and sources. Atmos. Res. 2011, 102, 110–119. [Google Scholar] [CrossRef]
  89. Meng, Z.Y.; Seinfeld, J.H. On the Source of the Submicrometer Droplet Mode of Urban and Regional Aerosols. Aerosol Sci. Technol. 1994, 20, 253–265. [Google Scholar] [CrossRef]
  90. Wang, G.; Zhu, Z.; Zhao, N.; Wei, P.; Li, G.; Zhang, H. Variations in characteristics and transport pathways of PM2.5 during heavy pollution episodes in 2013–2019 in Jinan, a central city in the north China Plain. Environ. Pollut. 2021, 284, 117450. [Google Scholar] [CrossRef]
  91. Pathak, R.K.; Wu, W.S.; Wang, T. Summertime PM2.5 ionic species in four major cities of China: Nitrate formation in an ammonia-deficient atmosphere. Atmos. Chem. Phys. 2009, 9, 1711–1722. [Google Scholar] [CrossRef]
  92. Li, Q.; Yang, Z.; Li, X.; Ding, S.; Du, F. Seasonal Characteristics of Sulfate and Nitrate in Size-segregated Particles in Ammonia-poor and -rich Atmospheres in Chengdu, Southwest China. Aerosol Air Qual. Res. 2019, 19, 2697–2706. [Google Scholar] [CrossRef]
  93. Huang, X.; Liu, Z.; Zhang, J.; Wen, T.; Ji, D.; Wang, Y. Seasonal variation and secondary formation of size-segregated aerosol water-soluble inorganic ions during pollution episodes in Beijing. Atmos. Res. 2016, 168, 70–79. [Google Scholar] [CrossRef]
  94. Li, X.; Wang, L.; Ji, D.; Wen, T.; Pan, Y.; Sun, Y.; Wang, Y. Characterization of the size-segregated water-soluble inorganic ions in the Jing-Jin-Ji urban agglomeration: Spatial/temporal variability, size distribution and sources. Atmos. Environ. 2013, 77, 250–259. [Google Scholar] [CrossRef]
  95. Liu, B.; Wu, J.; Zhang, J.; Wang, L.; Yang, J.; Liang, D.; Dai, Q.; Bi, X.; Feng, Y.; Zhang, Y.; et al. Characterization and source apportionment of PM2.5 based on error estimation from EPA PMF 5.0 model at a medium city in China. Environ. Pollut. 2017, 222, 10–22. [Google Scholar] [CrossRef] [PubMed]
  96. Contini, D.; Genga, A.; Cesari, D.; Siciliano, M.; Donateo, A.; Bove, M.C.; Guascito, M.R. Characterisation and source apportionment of PM10 in an urban background site in Lecce. Atmos. Res. 2010, 95, 40–54. [Google Scholar] [CrossRef]
  97. Tan, J.; Zhang, L.; Zhou, X.; Duan, J.; Li, Y.; Hu, J.; He, K. Chemical characteristics and source apportionment of PM2.5 in Lanzhou, China. Sci. Total Environ. 2017, 601, 1743–1752. [Google Scholar] [CrossRef]
  98. Jaiprakash; Habib, G. Chemical and optical properties of PM2.5 from on-road operation of light duty vehicles in Delhi city. Sci. Total Environ. 2017, 586, 900–916. [Google Scholar] [CrossRef]
  99. Hleis, D.; Fernandez-Olmo, I.; Ledoux, F.; Kfoury, A.; Courcot, L.; Desmonts, T.; Courcot, D. Chemical profile identification of fugitive and confined particle emissions from an integrated iron and steelmaking plant. J. Hazard. Mater. 2013, 250, 246–255. [Google Scholar] [CrossRef]
  100. Qiu, X.; Duan, L.; Gao, J.; Wang, S.; Chai, F.; Hu, J.; Zhang, J.; Yun, Y. Chemical composition and source apportionment of PM10 and PM2.5 in different functional areas of Lanzhou, China. J. Environ. Sci. 2016, 40, 75–83. [Google Scholar] [CrossRef]
  101. Yang, Y.; Zhang, P.; Zhang, W.; Tian, Y.; Zheng, Y.; Wang, L. Quantitative appraisal and potential analysis for primary biomass resources for energy utilization in China. Renew. Sustain. Energy Rev. 2010, 14, 3050–3058. [Google Scholar] [CrossRef]
  102. Zhang, Y.; Huang, W.; Cai, T.; Fang, D.; Wang, Y.; Song, J.; Hu, M.; Zhang, Y. Concentrations and chemical compositions of fine particles (PM2.5) during haze and non-haze days in Beijing. Atmos. Res. 2016, 174, 62–69. [Google Scholar] [CrossRef]
  103. Ichikawa, Y.; Fujita, S. An analysis of wet deposition of sulfate using a trajectory model for East Asia. Water Air Soil Pollut. 1995, 85, 1927–1932. [Google Scholar] [CrossRef]
  104. Qu, Y.; An, J.L.; He, Y.J.; Zheng, J. An overview of emissions of SO2 and NOx and the long-range transport of oxidized sulfur and nitrogen pollutants in East Asia. J. Environ. Sci. 2016, 44, 13–25. [Google Scholar] [CrossRef] [PubMed]
  105. Ge, X.; He, Y.; Sun, Y.; Xu, J.; Wang, J.; Shen, Y.; Chen, M. Characteristics and Formation Mechanisms of Fine Particulate Nitrate in Typical Urban Areas in China. Atmosphere 2017, 8, 62. [Google Scholar] [CrossRef]
  106. Chan, Y.-C.; Evans, M.J.; He, P.; Holmes, C.D.; Jaegle, L.; Kasibhatla, P.; Liu, X.-Y.; Sherwen, T.; Thornton, J.A.; Wang, X.; et al. Heterogeneous Nitrate Production Mechanisms in Intense Haze Events in the North China Plain. J. Geophys. Res.-Atmos. 2021, 126, e2021JD034688. [Google Scholar] [CrossRef]
  107. Chuang, M.-T.; Wu, C.-F.; Lin, C.-Y.; Lin, W.-C.; Chou, C.C.K.; Lee, C.-T.; Lin, T.-H.; Fu, J.S.; Kong, S.S.-K. Simulating nitrate formation mechanisms during PM2.5 events in Taiwan and their implications for the controlling direction. Atmos. Environ. 2022, 269, 118856. [Google Scholar] [CrossRef]
  108. Xie, X.; Hu, J.; Qin, M.; Guo, S.; Hu, M.; Wang, H.; Lou, S.; Li, J.; Sun, J.; Li, X.; et al. Modeling particulate nitrate in China: Current findings and future directions. Environ. Int. 2022, 166, 107369. [Google Scholar] [CrossRef]
  109. Yang, J.; Qu, Y.; Chen, Y.; Zhang, J.; Liu, X.; Niu, H.; An, J. Dominant physical and chemical processes impacting nitrate in Shandong of the North China Plain during winter haze events. Sci. Total Environ. 2024, 912, 169065. [Google Scholar] [CrossRef]
  110. Zhang, J.; Chen, J.; Xue, C.; Chen, H.; Zhang, Q.; Liu, X.; Mu, Y.; Guo, Y.; Wang, D.; Chen, Y.; et al. Impacts of six potential HONO sources on HOx budgets and SOA formation during a wintertime heavy haze period in the North China Plain. Sci. Total Environ. 2019, 681, 110–123. [Google Scholar] [CrossRef]
Figure 1. (a) Time series of PM10 and its chemical components, (b) box and whisker plots of variation of heavy metals, water soluble ions, OC and EC with pollution level. N and P refer to non-polluted and polluted days, respectively.
Atmosphere 16 00656 g001
Figure 2. Mass distribution of trace elements.
Atmosphere 16 00656 g002
Figure 3. Comparison of concentrations of OC, EC, and water-soluble ions from this study and other studies of 2 + 26 cities.
Atmosphere 16 00656 g003
Figure 4. Box and whisker plots of variation of (a) SOC, (b) SOC/EC, and correlations between PM10 and SOC (c). N and P refer to non-polluted and polluted days, respectively. The mean (dot), median (horizontal line), 25th and 75th percentiles (lower and upper box), and 10th and 90th percentiles (lower and upper whiskers) are shown in the box and whisker plots.
Atmosphere 16 00656 g004
Figure 5. Box and whisker plots of variation of SOR and NOR values, and RH on non-polluted (N) and polluted (P) days. The mean (dot), median (horizontal line), 25th and 75th percentiles (lower and upper box), and the 10th and 90th percentiles (lower and upper whiskers) are shown in the box and whisker plots.
Atmosphere 16 00656 g005
Figure 6. Source profiles (a) and source contributions (b) to PM10 caculated by PMF.
Atmosphere 16 00656 g006
Figure 7. Backward trajectory (a) and results of potential source contribution factor analysis for NO3, SO42−, NH4+ and OC (be).
Atmosphere 16 00656 g007
Figure 8. Hourly net production rates of NH4+, SO42− and NO3 (top panel), and contributions of each physical/chemical process to concentrations of NH4+, SO42− and NO3 (bottom panel) during two pollution episodes.
Atmosphere 16 00656 g008
Figure 9. Hourly production rates of HNO3 during two pollution episodes.
Atmosphere 16 00656 g009
Table 1. Comparison of heavy metals in different cities and limits of concentration guidelines (unit: μg/m3).
ZhuozhouBaoding
Winter a
Langfang
Winter a
Beijing
Winter a
Tianjin
Winter b
Averaged Level in China cNAAQS GB3095-2012WHO
Al2.962.632.042.051.3
Ca2.373.022.992.363.4
Fe2.471.951.822.181.9
K0.602.921.812.131.0
Zn0.691.170.410.31 0.43
Mn0.53↑0.750.090.07 0.20 0.15
Pb0.120.460.180.15 0.260.50.5
Cu0.050.190.120.20 0.12
As0.02↑0.070.020.01 0.050.0060.0066
Hg0.003 0.051
a Gao et al. (2018) [10], b Liu et al. (2020) [53], c Duan and Tan (2013) [59].
Table 2. Comparison of NOR and SOR in some cities.
CityNORSORObservation PeriodReference
Zhuozhou0.120.20December 2021–January 2022in this study
Shijiazhuang0.170.38May 2016–January 2017Wang et al. (2021) [86]
Tianjin0.140.17June 2015Liu et al. (2020 ) [53]
Beijing0.250.43August 2012–July 2013Wang et al. (2016) [87]
Handan0.210.236–31 December 2015Chen et al. (2020) [19]
Jinan0.13–0.340.14–0.571 January–14 Feberary 2017Wang et al. (2021) [90]
Zibo0.20.111–25 January 2015Li et al. (2017) [69]
Linfen0.260.2215 November 2018–20 January 2019Li et al. (2020) [18]
Xinxiang0.03–0.070.04–0.112015Feng et al. (2018) [66]
Disclaimer/Publisher’s Note: The statements, opinions and data contained in all publications are solely those of the individual author(s) and contributor(s) and not of MDPI and/or the editor(s). MDPI and/or the editor(s) disclaim responsibility for any injury to people or property resulting from any ideas, methods, instructions or products referred to in the content.

