
Research on Time Series Interpolation and Reconstruction of Multi-Source Remote Sensing AOD Product Data Using Machine Learning Methods

 ,
,  and
and
Abstract
1. Introduction
2. Materials and Methods
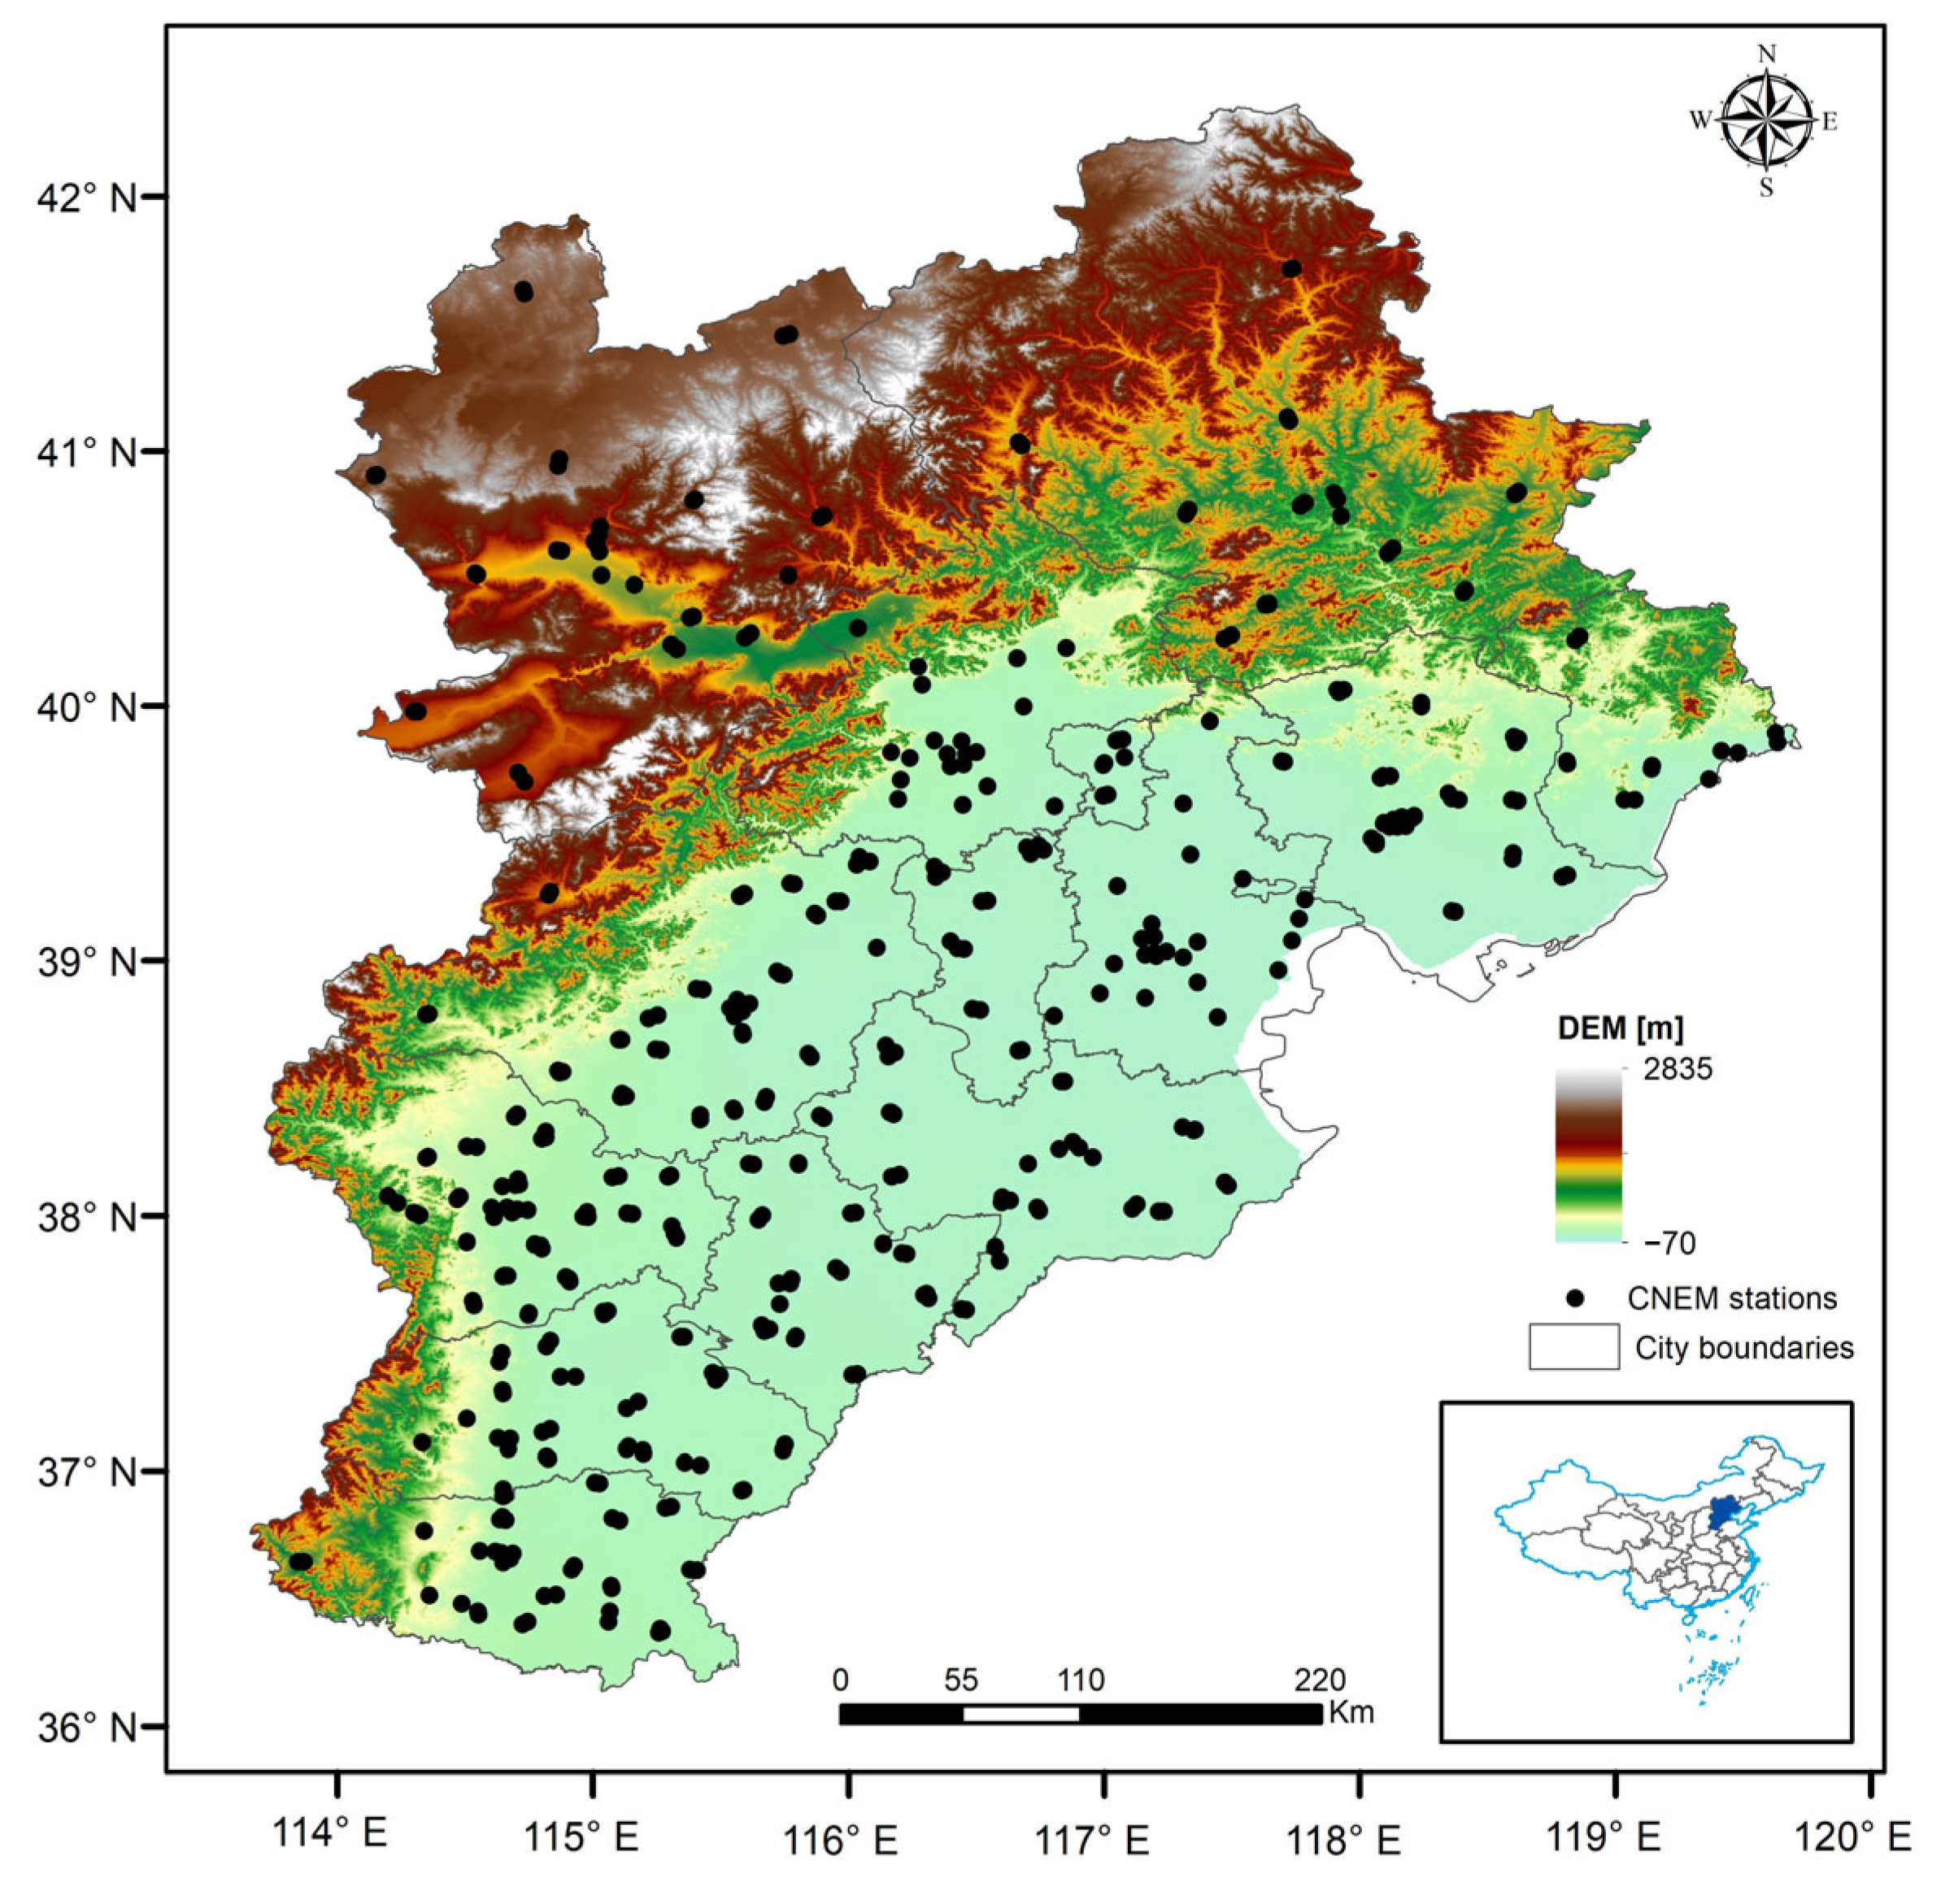
2.1. Study Area
2.2. Data and Processing
2.2.1. Remote Sensing Data
- FY 3D/MERSI-II: FY 3D/MERSI-II was launched in November 2017 and can achieve global multi-frequency coverage observations every day [19,42,43]. FY3D is an afternoon orbit satellite, with its equatorial ascending node crossing time around 13:30. The average orbital altitude is 836 km. The data were sourced from the National Satellite Meteorological Center’s satellite data server website http://satellite.nsmc.org.cn/PortalSite/Data/Satellite.aspx (accessed on 1 January 2019). It has 25 bands, including 6 visible light bands, 10 visible-infrared bands, 3 short-wave infrared bands, and 6 medium-long wave infrared bands [44]. The temporal resolution of the data is 1 day, and the spatial resolution is approximately 0.5–4 km [45].
- FY-4A/AGRI: FY-4A/AGRI is China’s new generation of geostationary meteorological satellites [46]. AGRI has 14 bands, with wavelengths ranging from 0.45 to 13.8 μm, covering visible, near-infrared, and infrared bands [47]. The temporal resolution of the full disk TOAR data is 15 min, and the spatial resolution is approximately 0.5–4 km. TOAR and CLM data are available from the National Satellite Meteorological Center’s satellite data server website http://satellite.nsmc.org.cn/PortalSite/Data/Satellite.aspx (accessed on 25 September 2017). The spatial resolution of TOAR data is 4 km, and the temporal resolution is hourly.
- Modis data: The MODIS MCD19A2 Version 6 data product is a Level 2 gridded product of land AOD released by the National Aeronautics and Space Administration (NASA) of the United States. It was generated based on data from the MODIS Terra and Aqua satellites, using the Multi-Angle Implementation of Atmospheric Correction (MAIAC) algorithm. This product is generated daily with a resolution of 1 km. This article uses MCD19A2-MODIS AOD data from the LAADS DAAC (https://ladsweb.modaps.eosdis.nasa.gov/ (accessed on 21 May 2024), which Terra was launched on 18 December 1999, and Aqua was launched on 4 May 2002).
- Himawari AHI: Himawari8 is a new-generation geostationary meteorological satellite launched by the Japan Meteorological Agency (JMA), equipped with the advanced optical sensor AHI (Advanced Himawari Imager, L3Harris Technologies, Melbourne, FL, USA). The Japan Aerospace Exploration Agency (JAXA) provides the recently updated AHI aerosol products, which include two main datasets (AODpure and AODmerged), namely, Himawari AHI. AHI is capable of providing high temporal resolution (every 10 min) and high spatial resolution (0.5 to 2 km) observational data, covering the Pacific Ocean and its adjacent seas extensively [48]. The AOD products from Himawari-8 AHI are divided into Level 2 and Level 3, primarily used for monitoring the aerosol content and distribution in the atmosphere. Among them, L2 data were used for span calibration in the eastern region of China [49]. The data were sourced from the Meteorological Satellite Center (MSC) | Product and Library. It is accessed on 7 July 2015.
2.2.2. Meteorological Model Data
2.2.3. Auxiliary Data
- Normalized Difference Vegetation Index (NDVI): MODIS products are obtained from the NASA website and processed to generate 16-day, monthly, and annual NDVI periodic products within the study area, with resolutions of 250 m, 500 m, and 1 km. FY data products, after preprocessing, generate 10-day, monthly, and annual NVI periodic products, with resolutions of 250 m and 1 km.
- Land Cover Types (LUCC): The land cover type data were obtained from the NASA website’s MCD12Q1 product and preprocessed to generate land cover products for the study area from 2000 to 2020, with a spatial resolution of 500 m.
- Digital Elevation Model (DEM): STRM surface elevation data with a spatial resolution of 90 m were obtained and resampled to generate data that are consistent with the spatial resolution of the training set.
2.2.4. Training Dataset Processing
2.3. Model
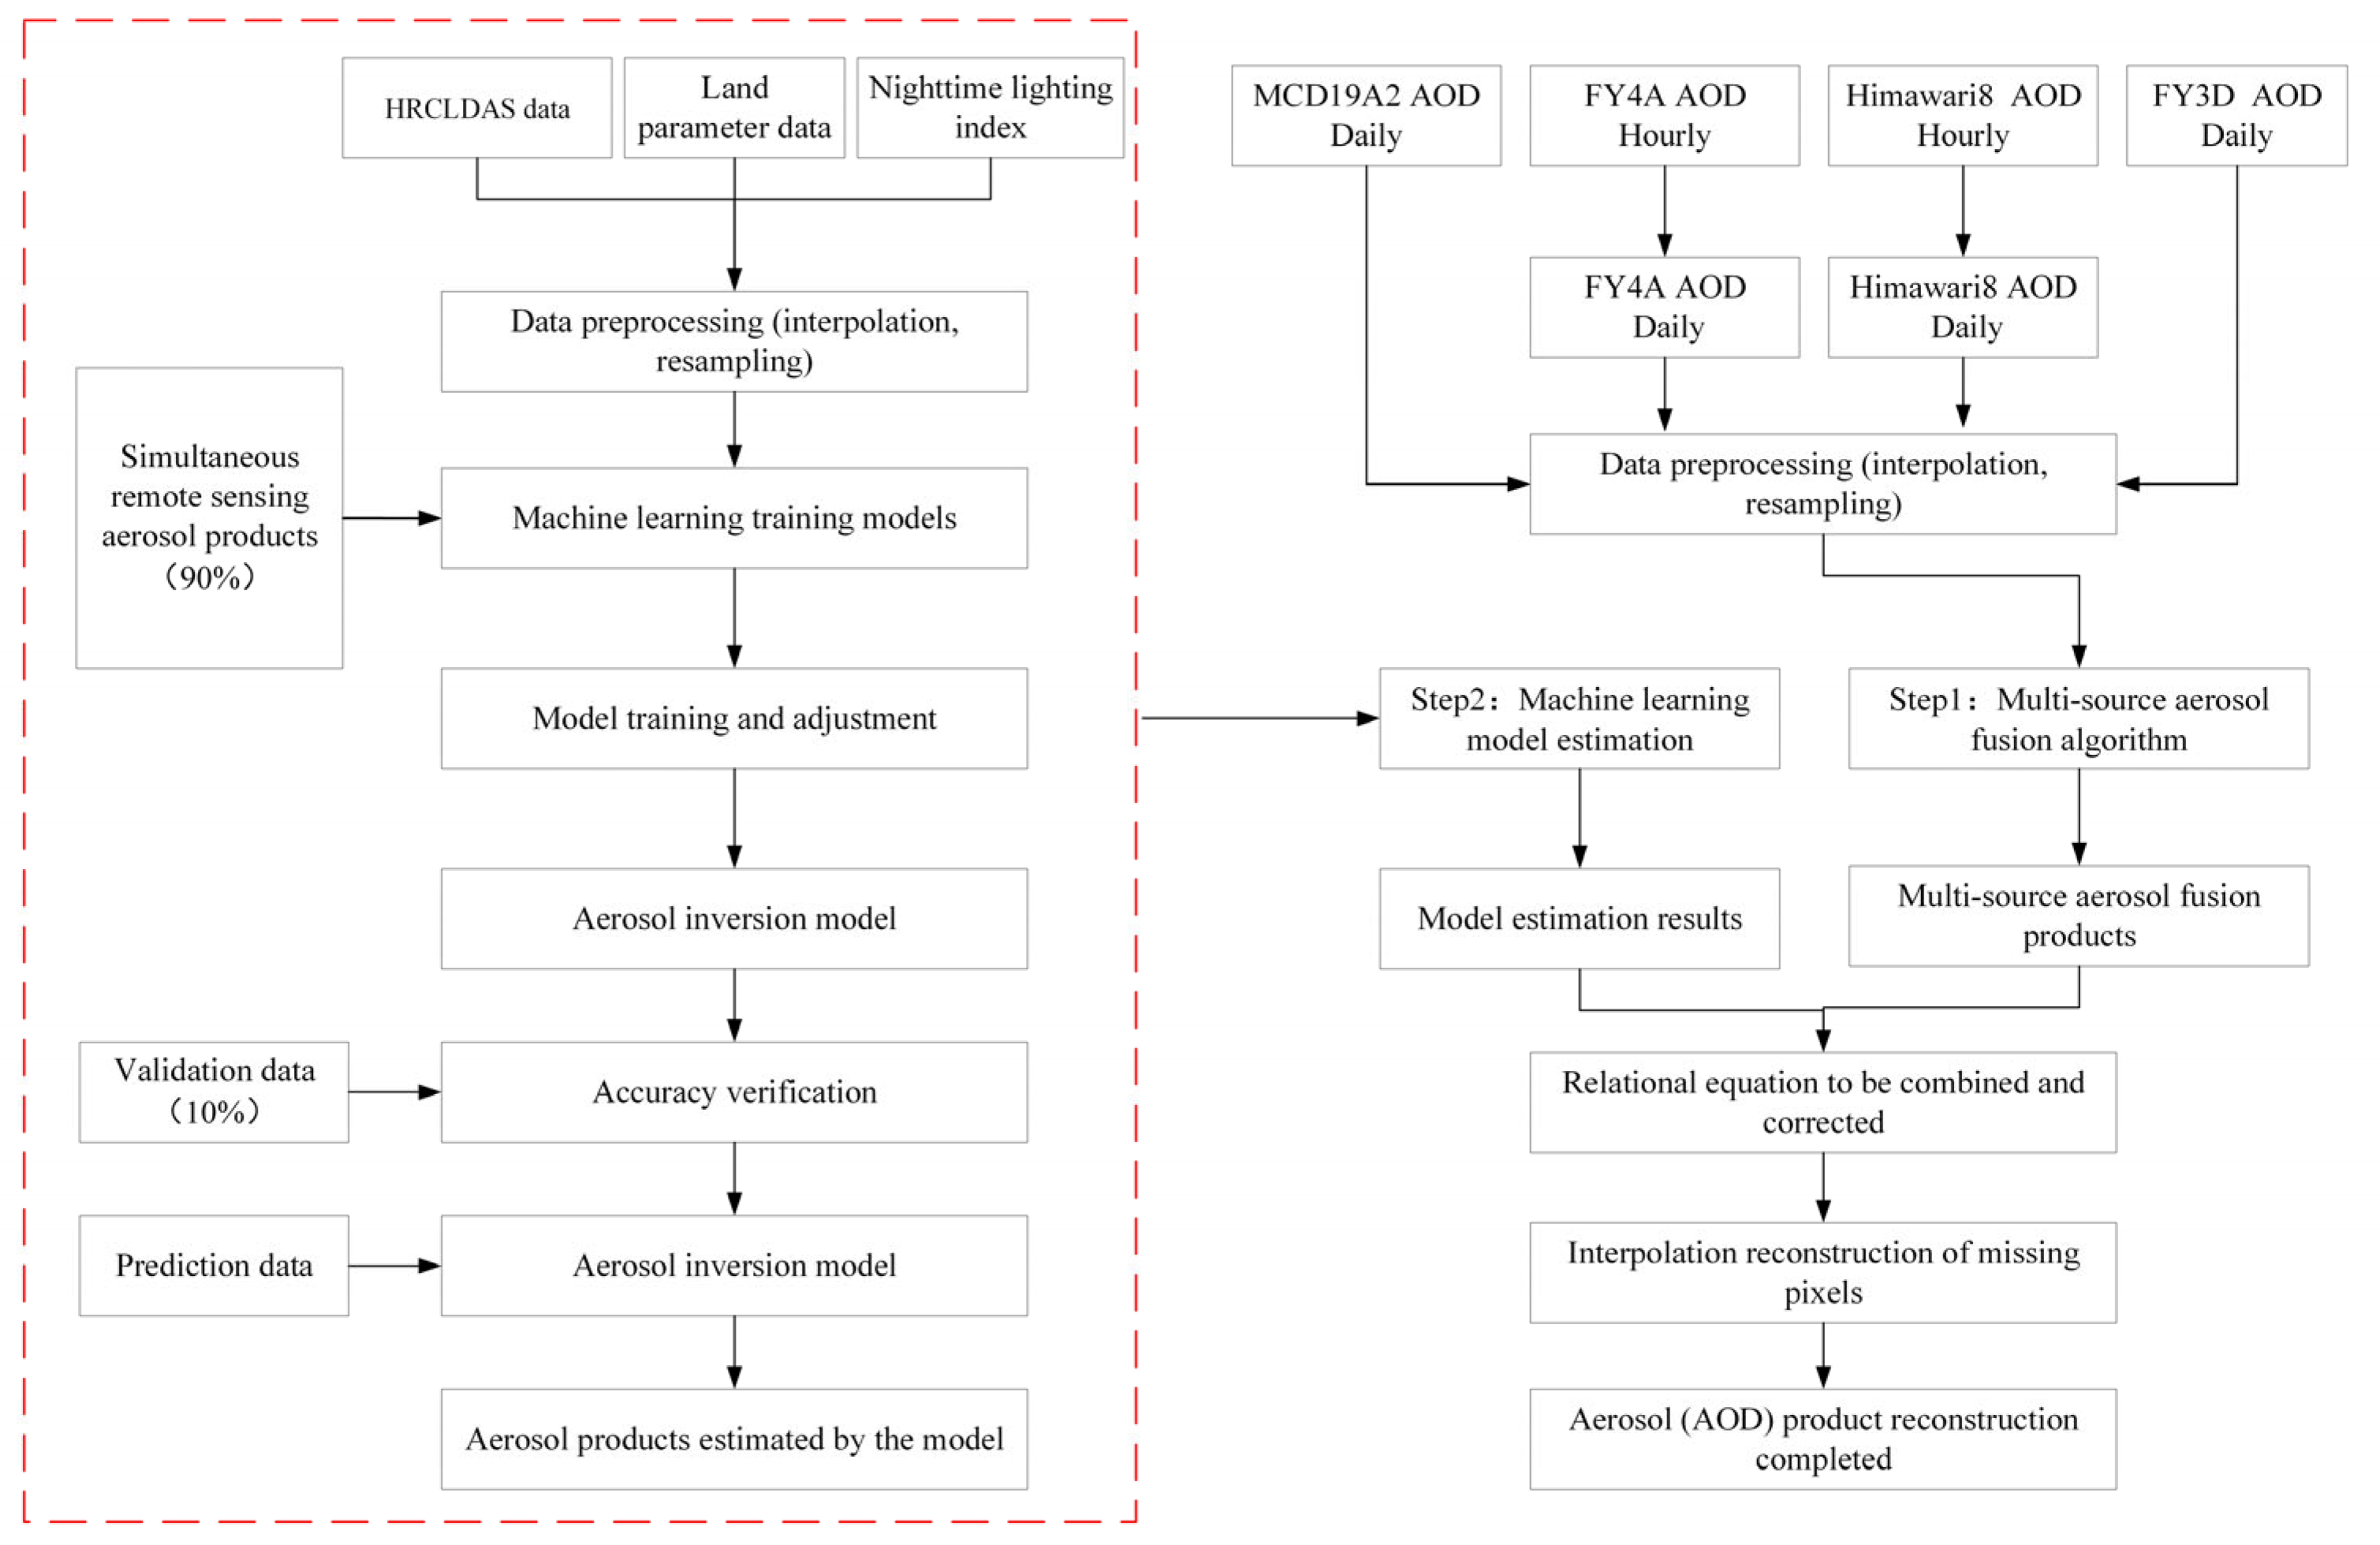
- (1)
- Preprocess four types of aerosol product data sources to extract high-quality AOD pixel values, using the MCD19A2 product as a benchmark to unify spatial and temporal resolutions.
- (2)
- Retrieve aerosol products pixel by pixel; if the MCD19A2 aerosol (AOD) product exists, stop the retrieval, and use the MCD19A2 aerosol (AOD) product as the pixel value for that pixel.
- (3)
- If it does not exist, retrieve the FY4A aerosol product at the same spatial location. If the FY4A aerosol product exists, use linear regression to correct the pixel value, and the corrected result will be the pixel value for that pixel.
- (4)
- If the FY4A aerosol product does not exist, continue to retrieve the Himawari-8 aerosol product. If the Himawari-8 aerosol product exists, use linear regression to correct the pixel value, and the corrected result will be the pixel value for that pixel.
- (5)
- If the Himawari-8 aerosol product does not exist, continue to retrieve the FY3D aerosol product. If the Fengyun 3D aerosol product exists, use linear regression to correct the pixel value, and the corrected result will be the pixel value for that pixel. If it does not exist, invoke machine learning algorithms to estimate and simulate the aerosol product.
2.4. Model Building
2.5. Parameter Importance Analysis
2.6. Model Training Set Validation
3. Results
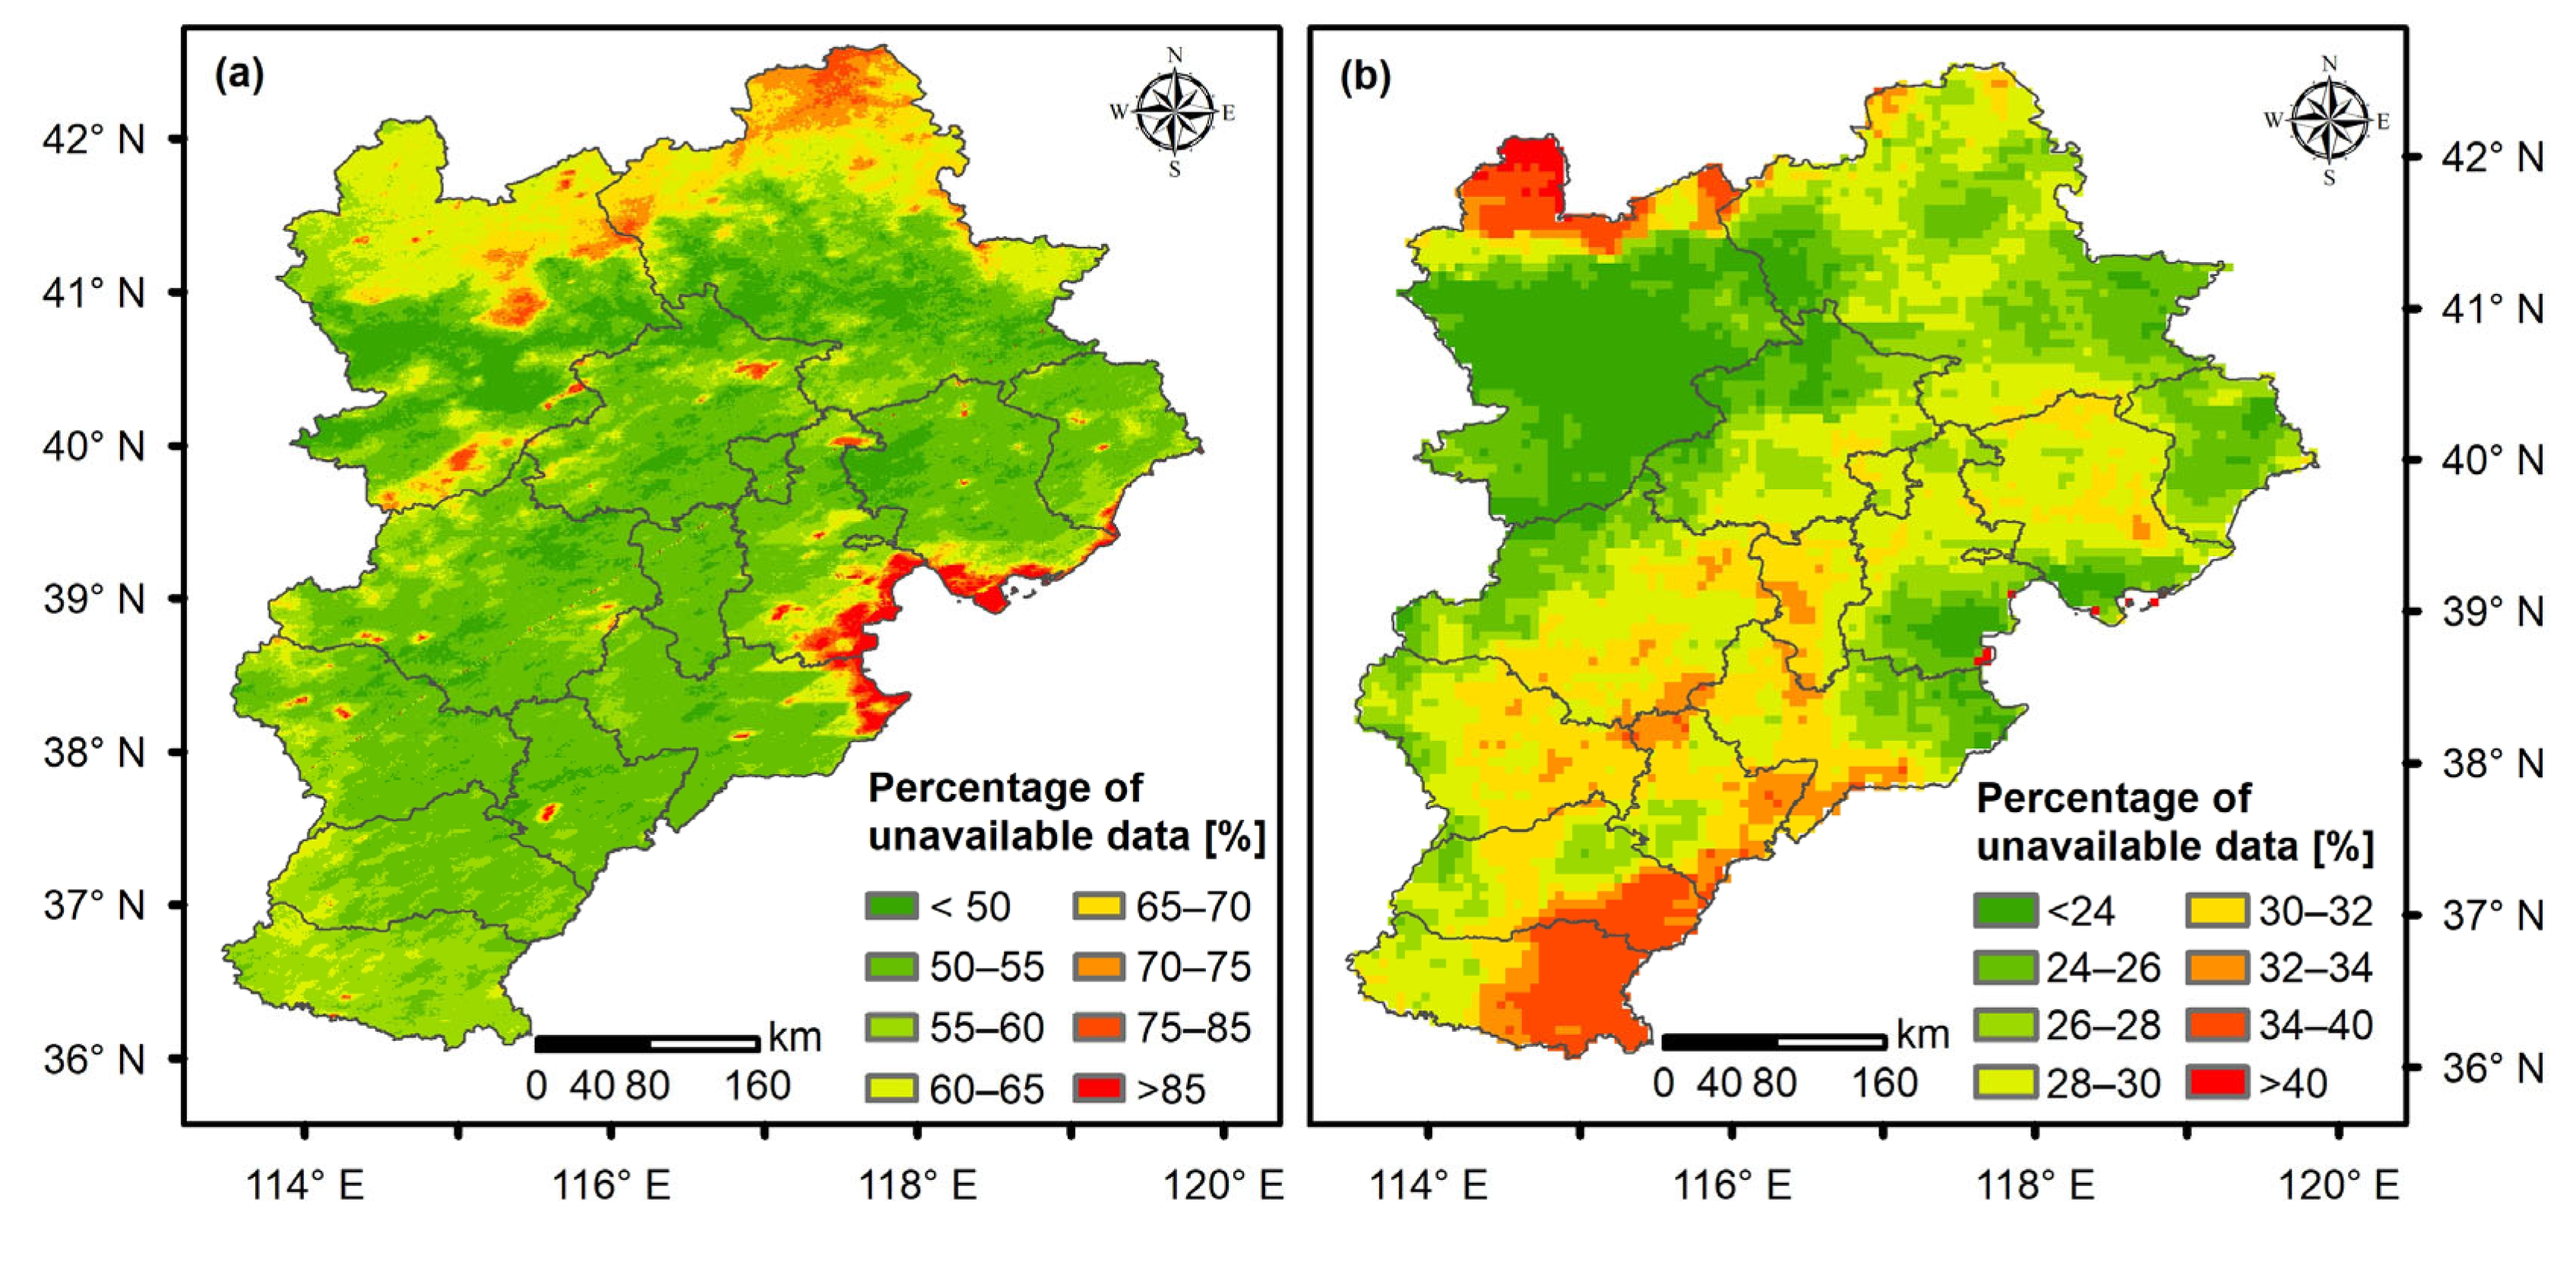
3.1. Missing Rate Analysis
3.2. Machine Model Estimation
3.2.1. Comparison of Model Results
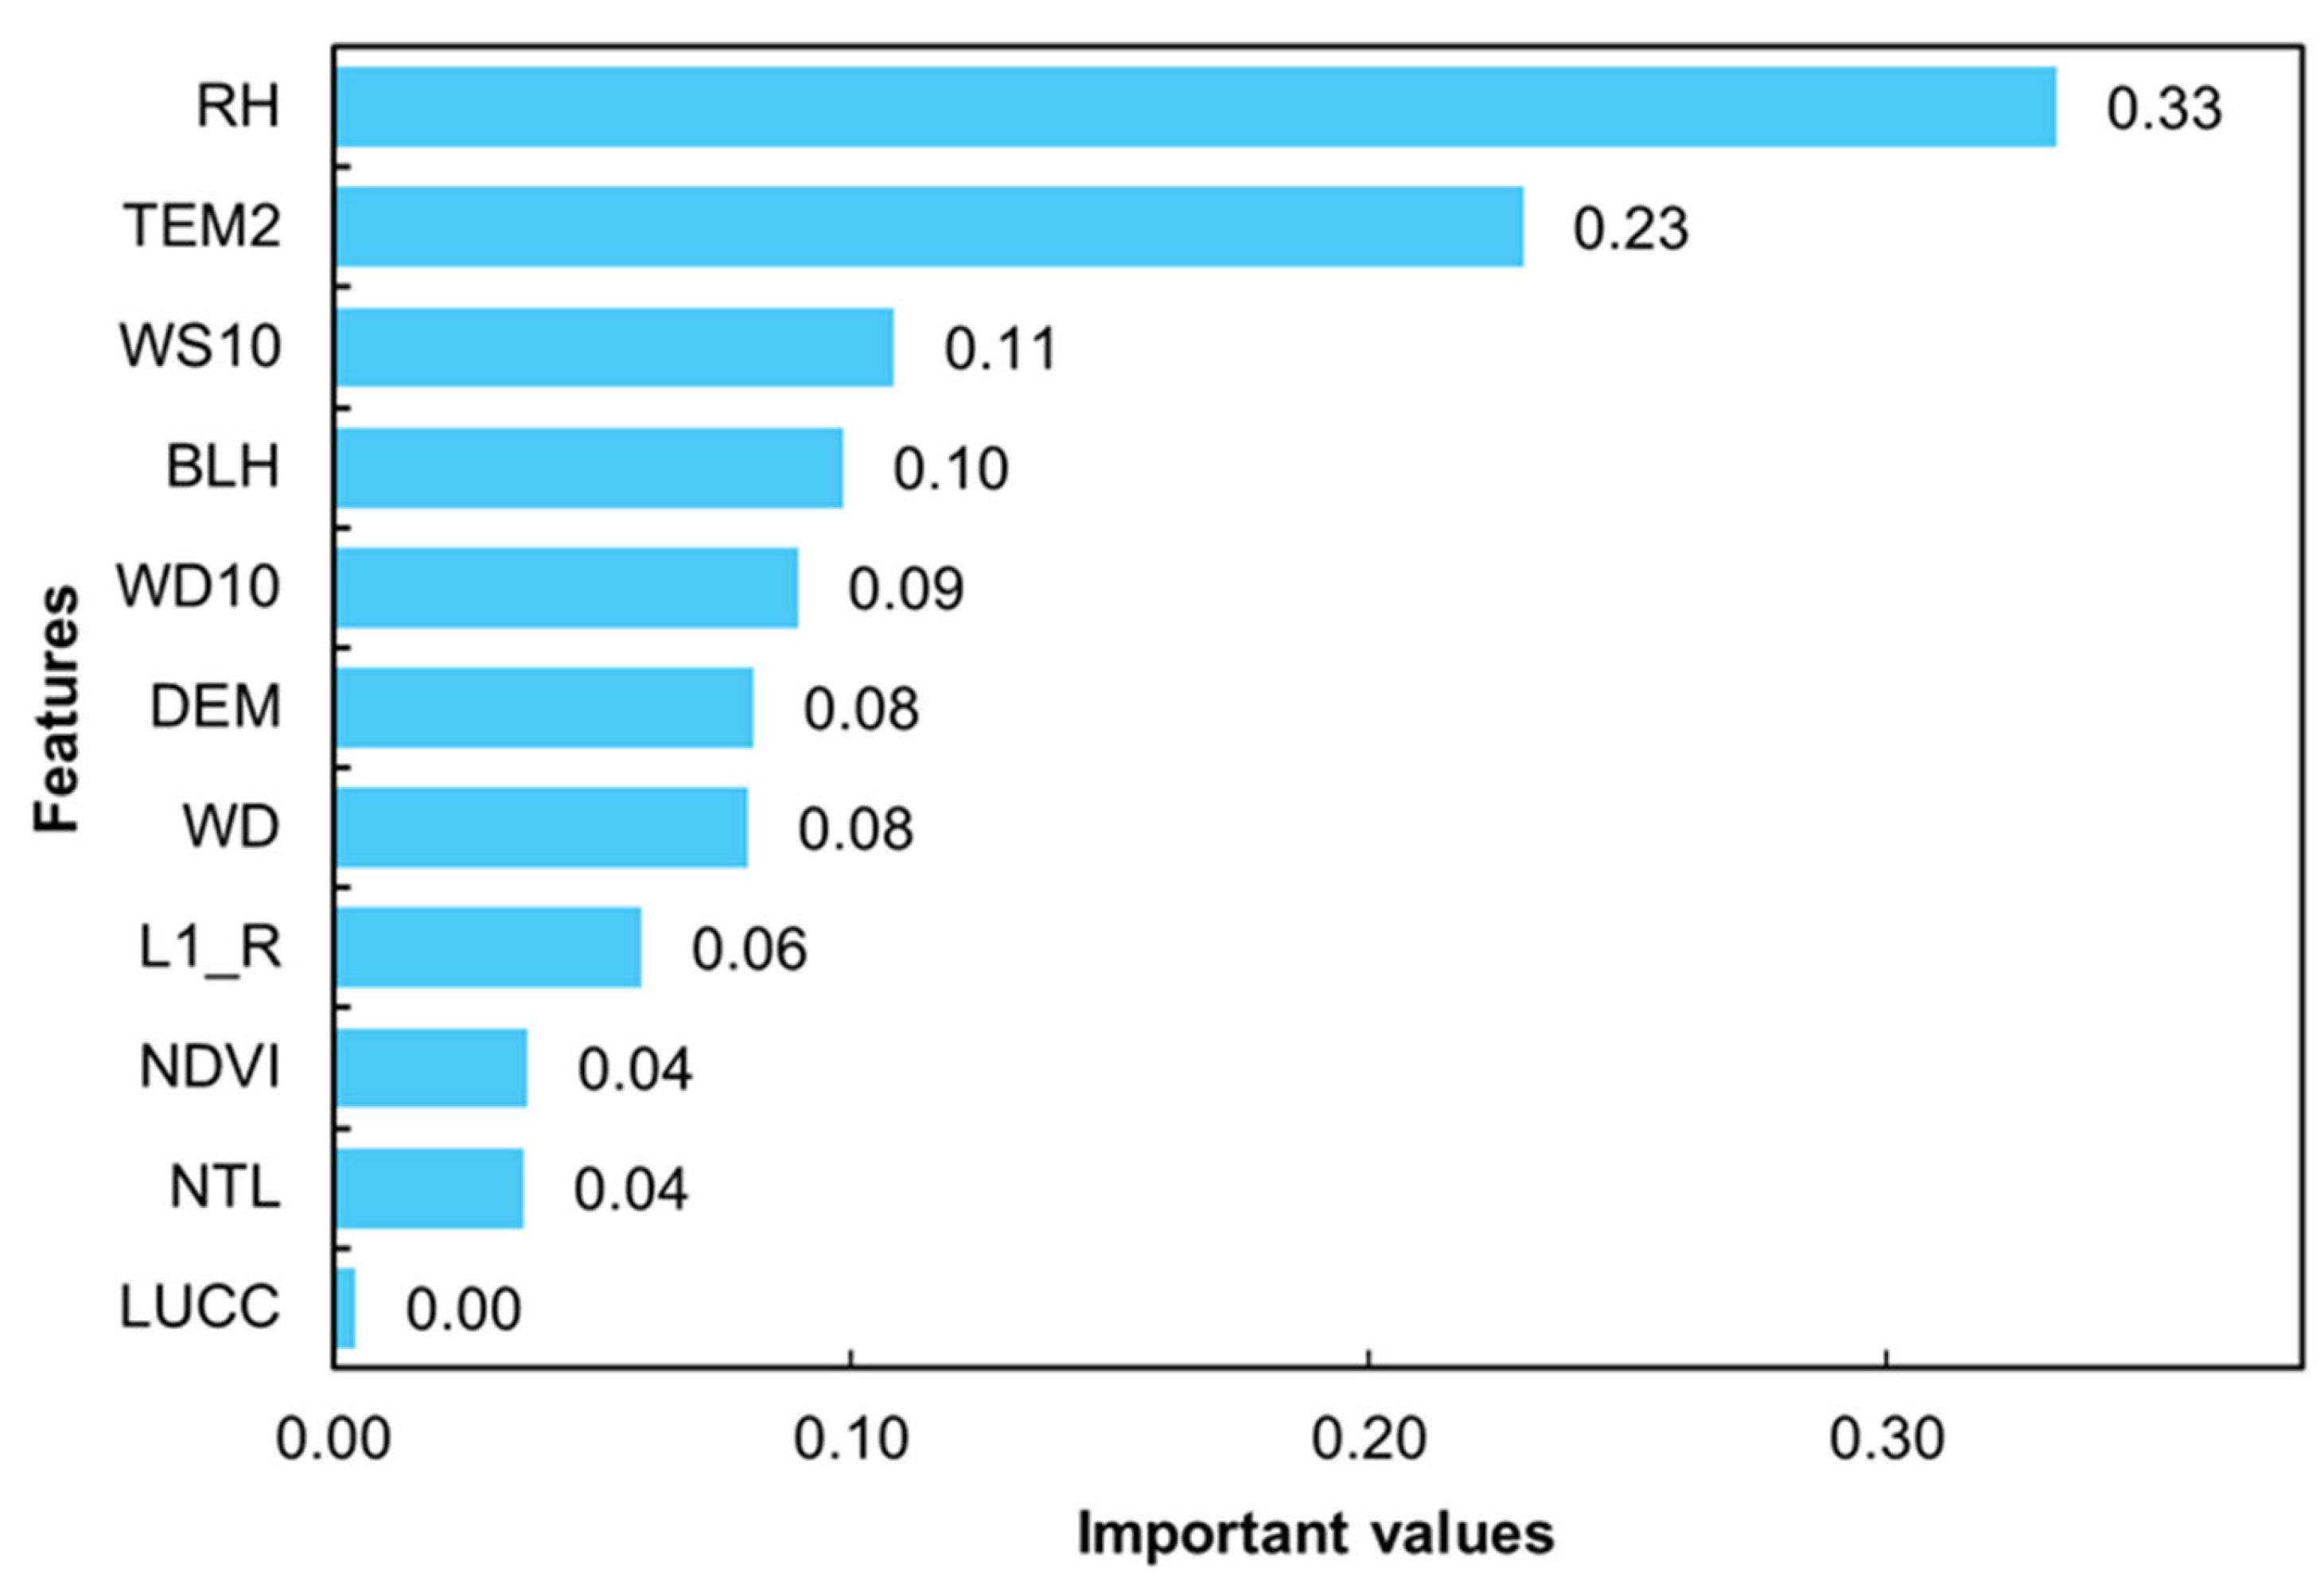
3.2.2. Model Variable Importance Analysis Unit
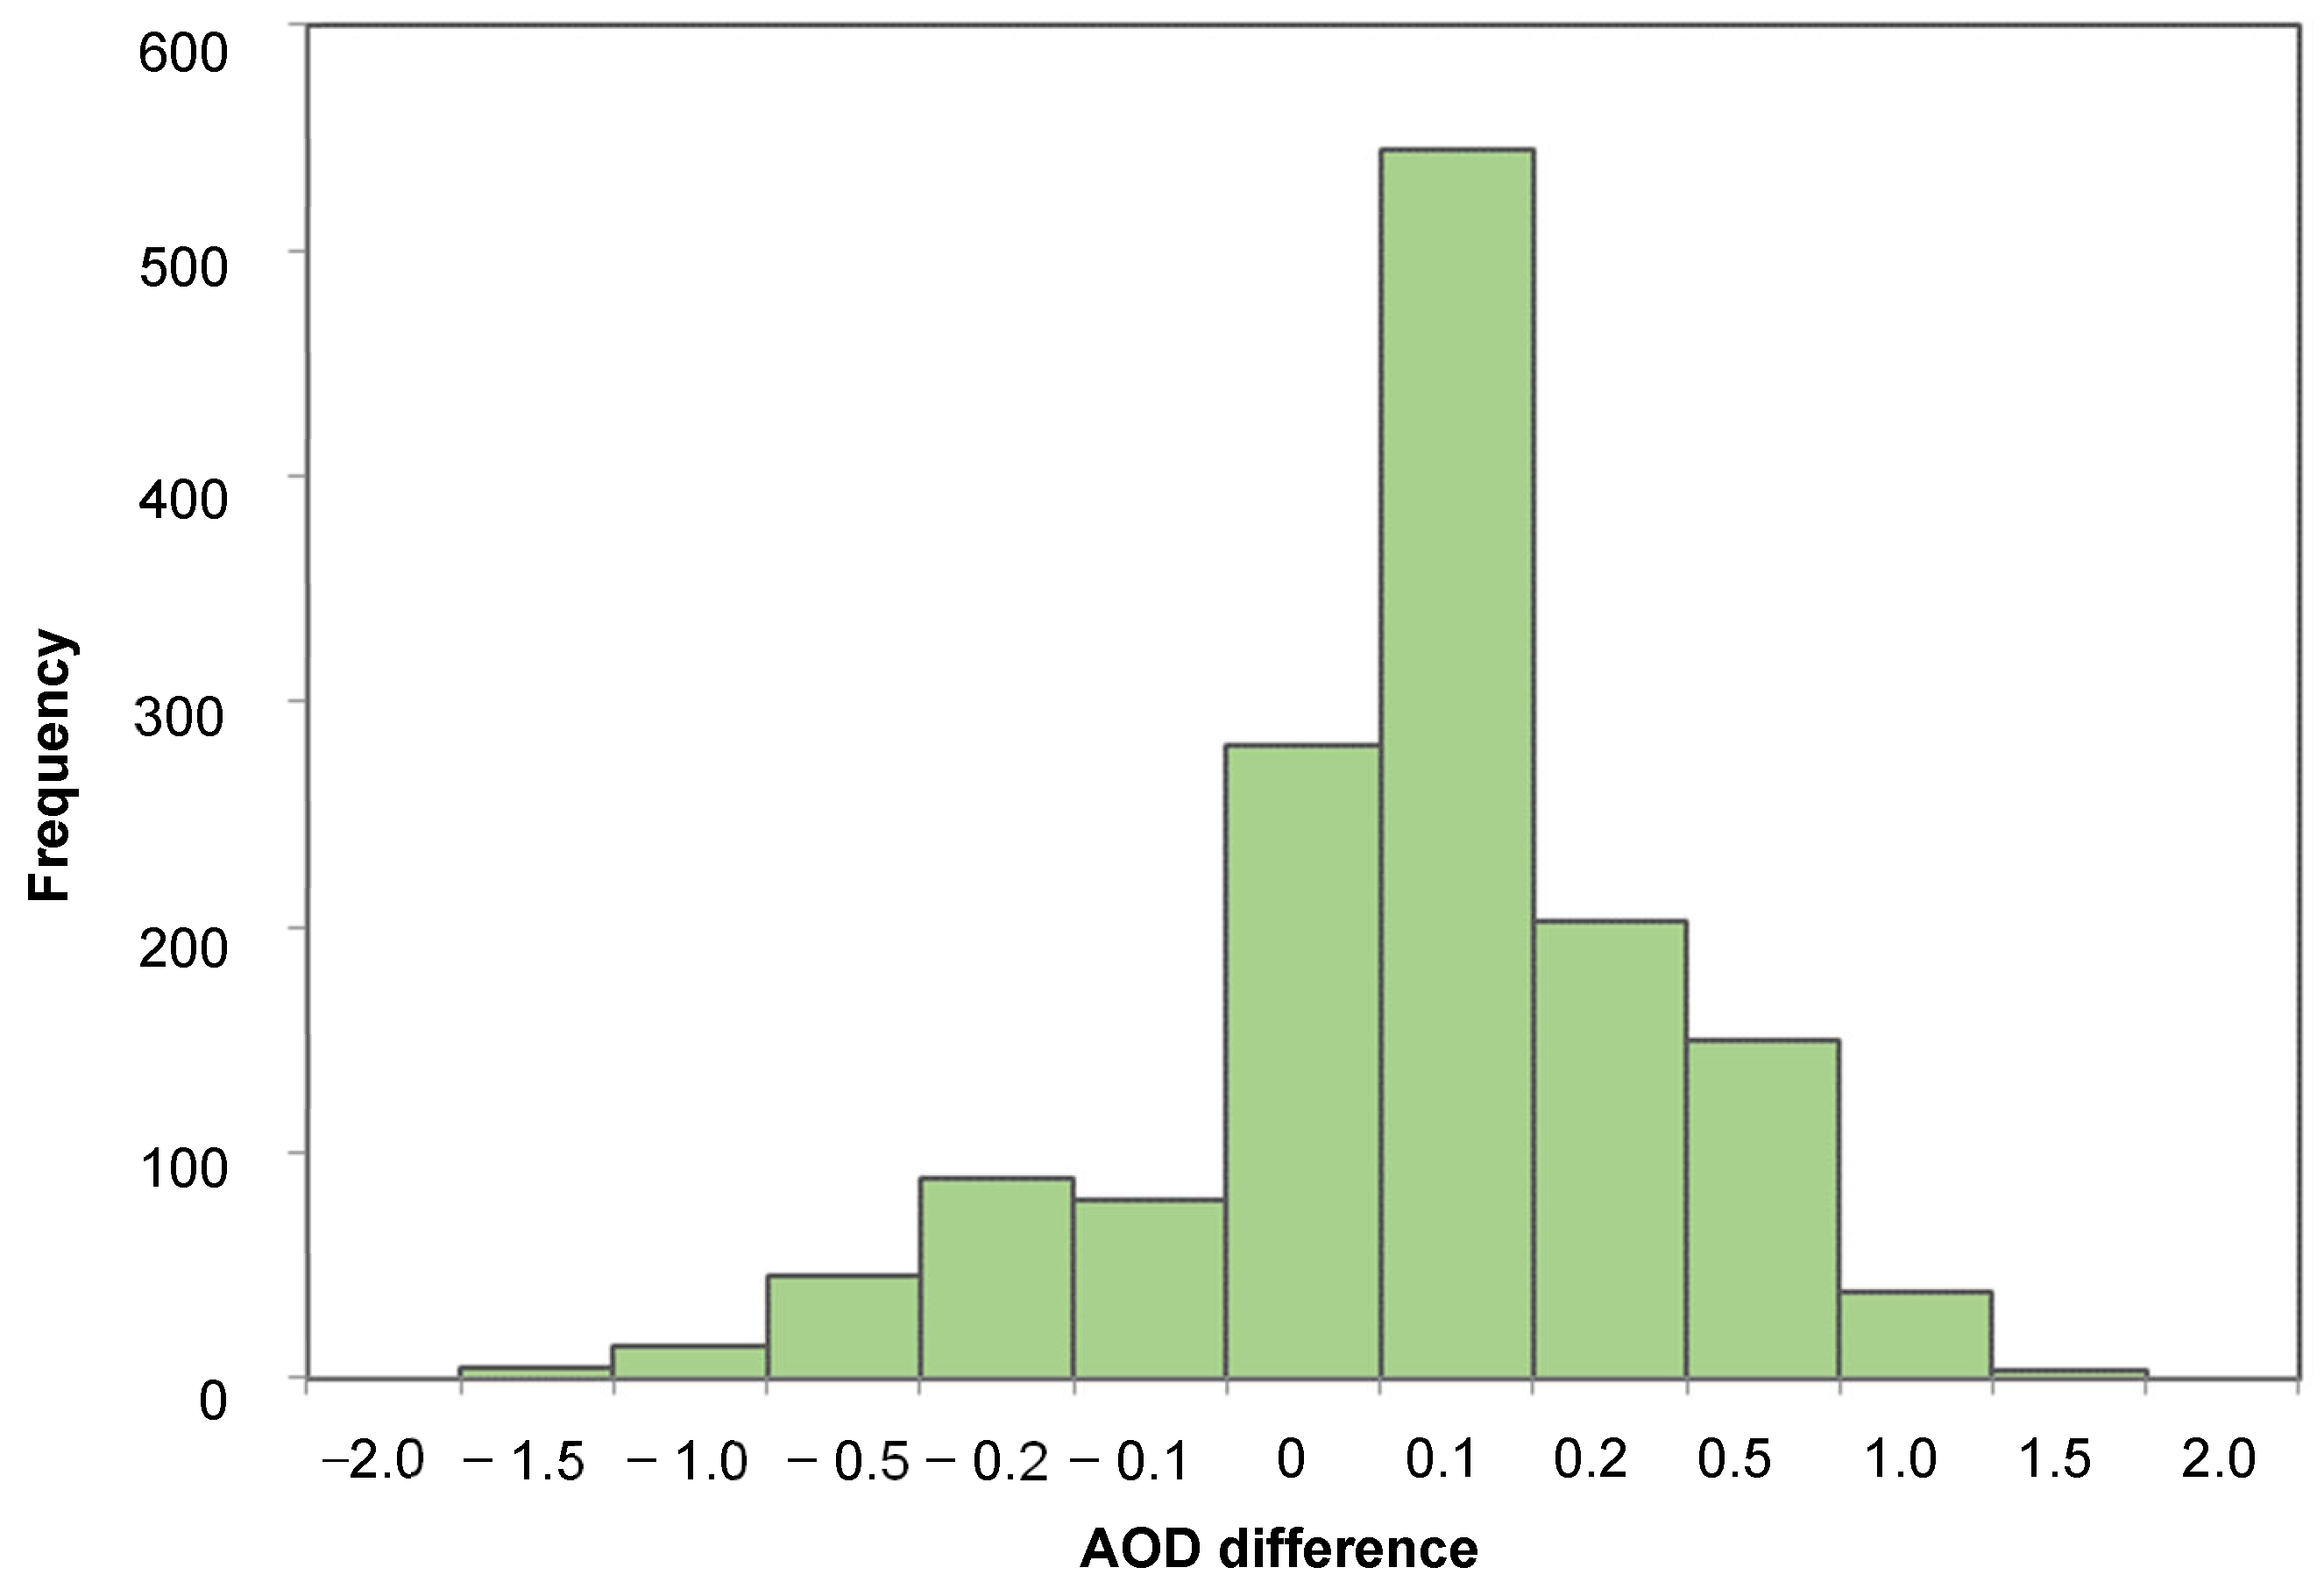
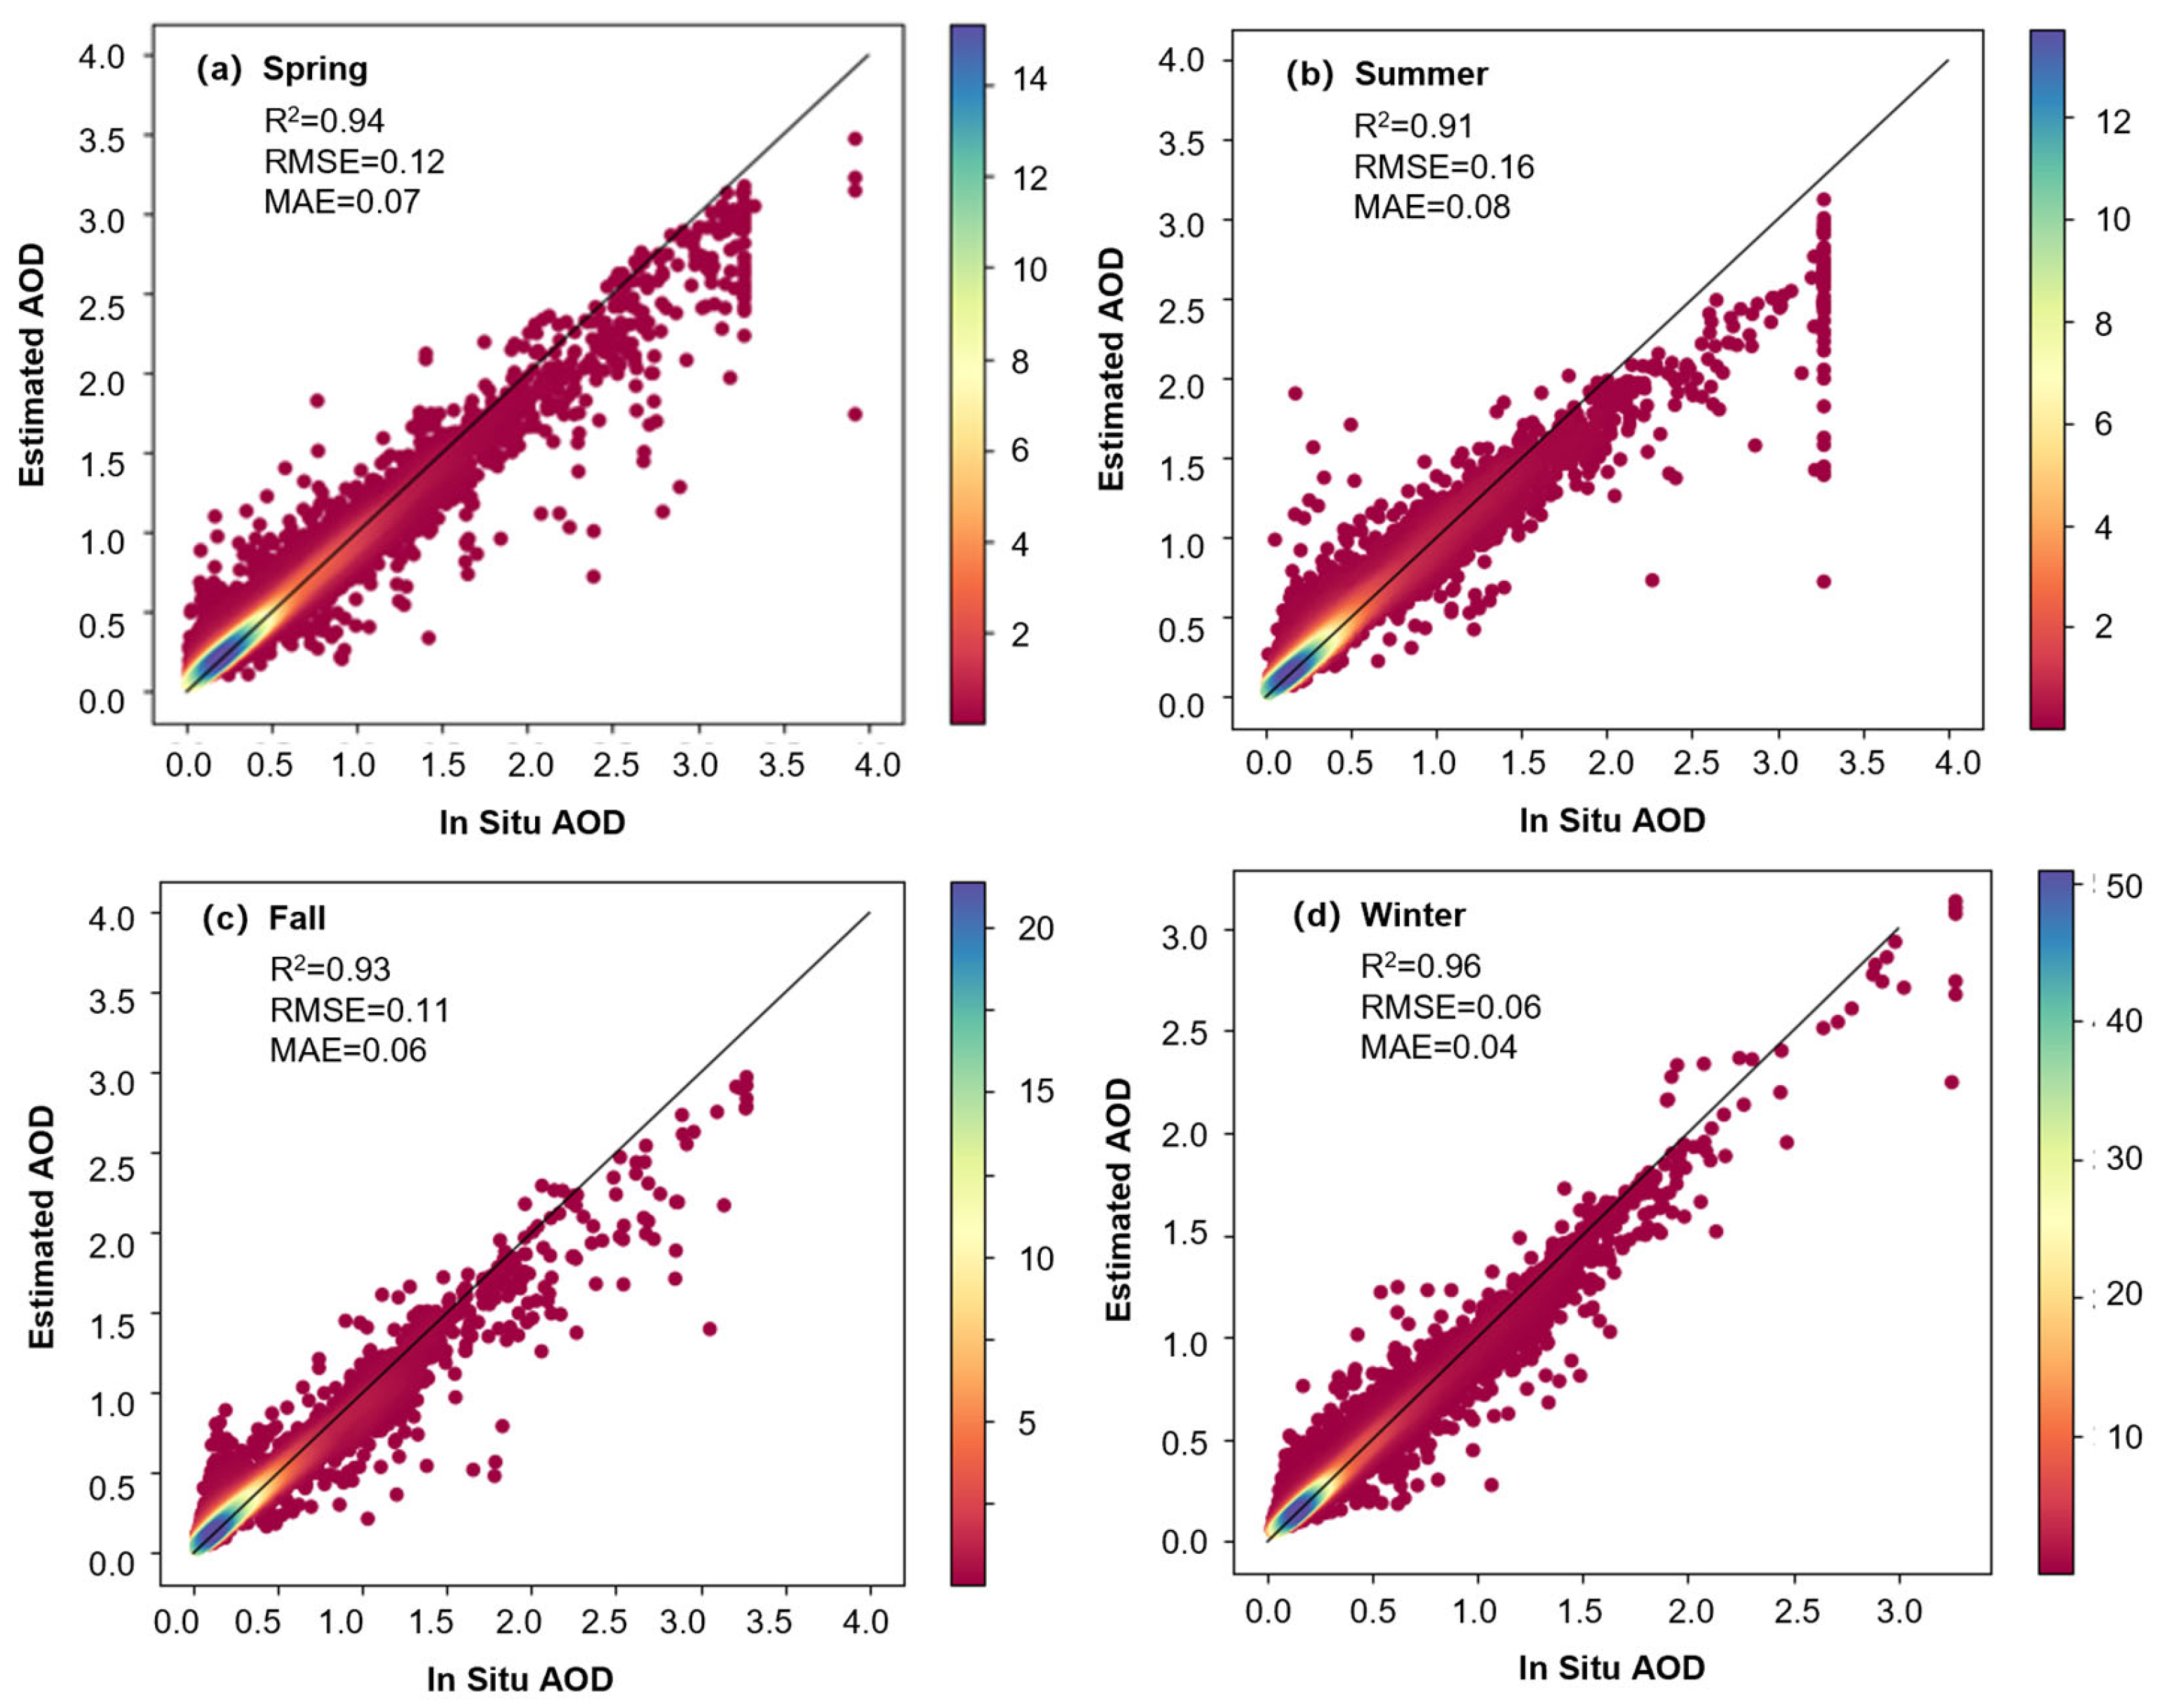
3.2.3. AOD Product Result Evaluation
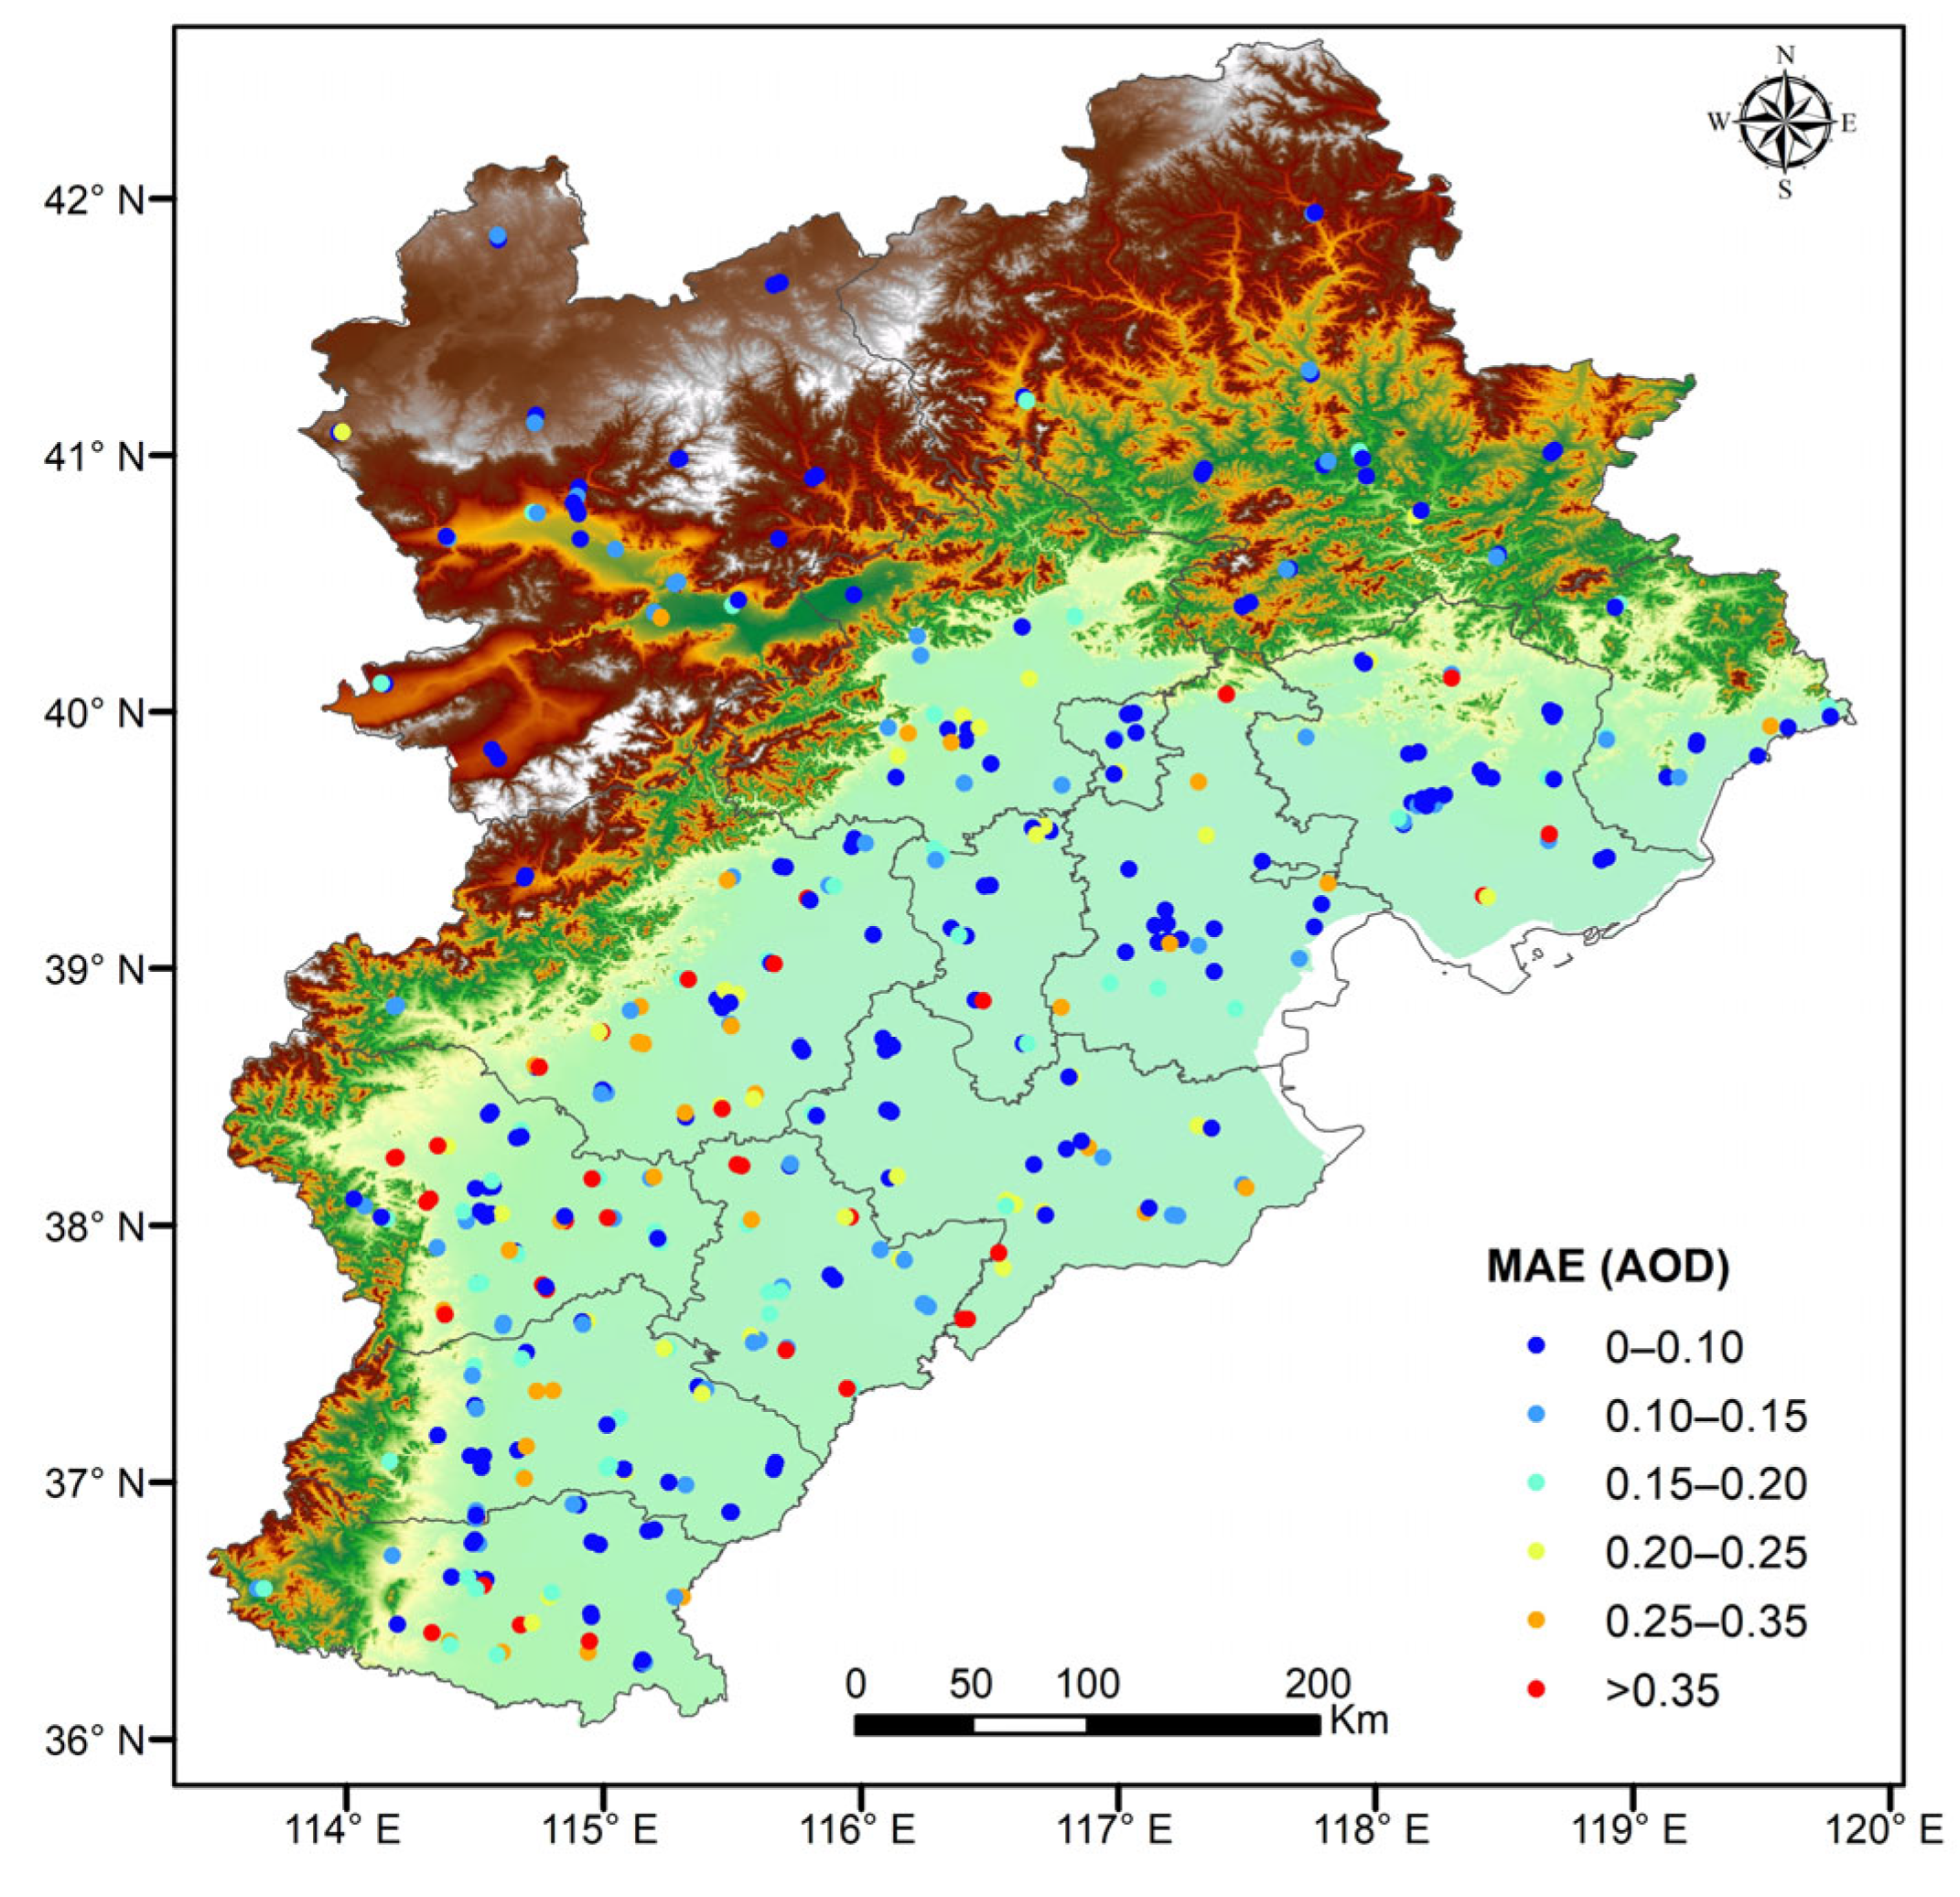
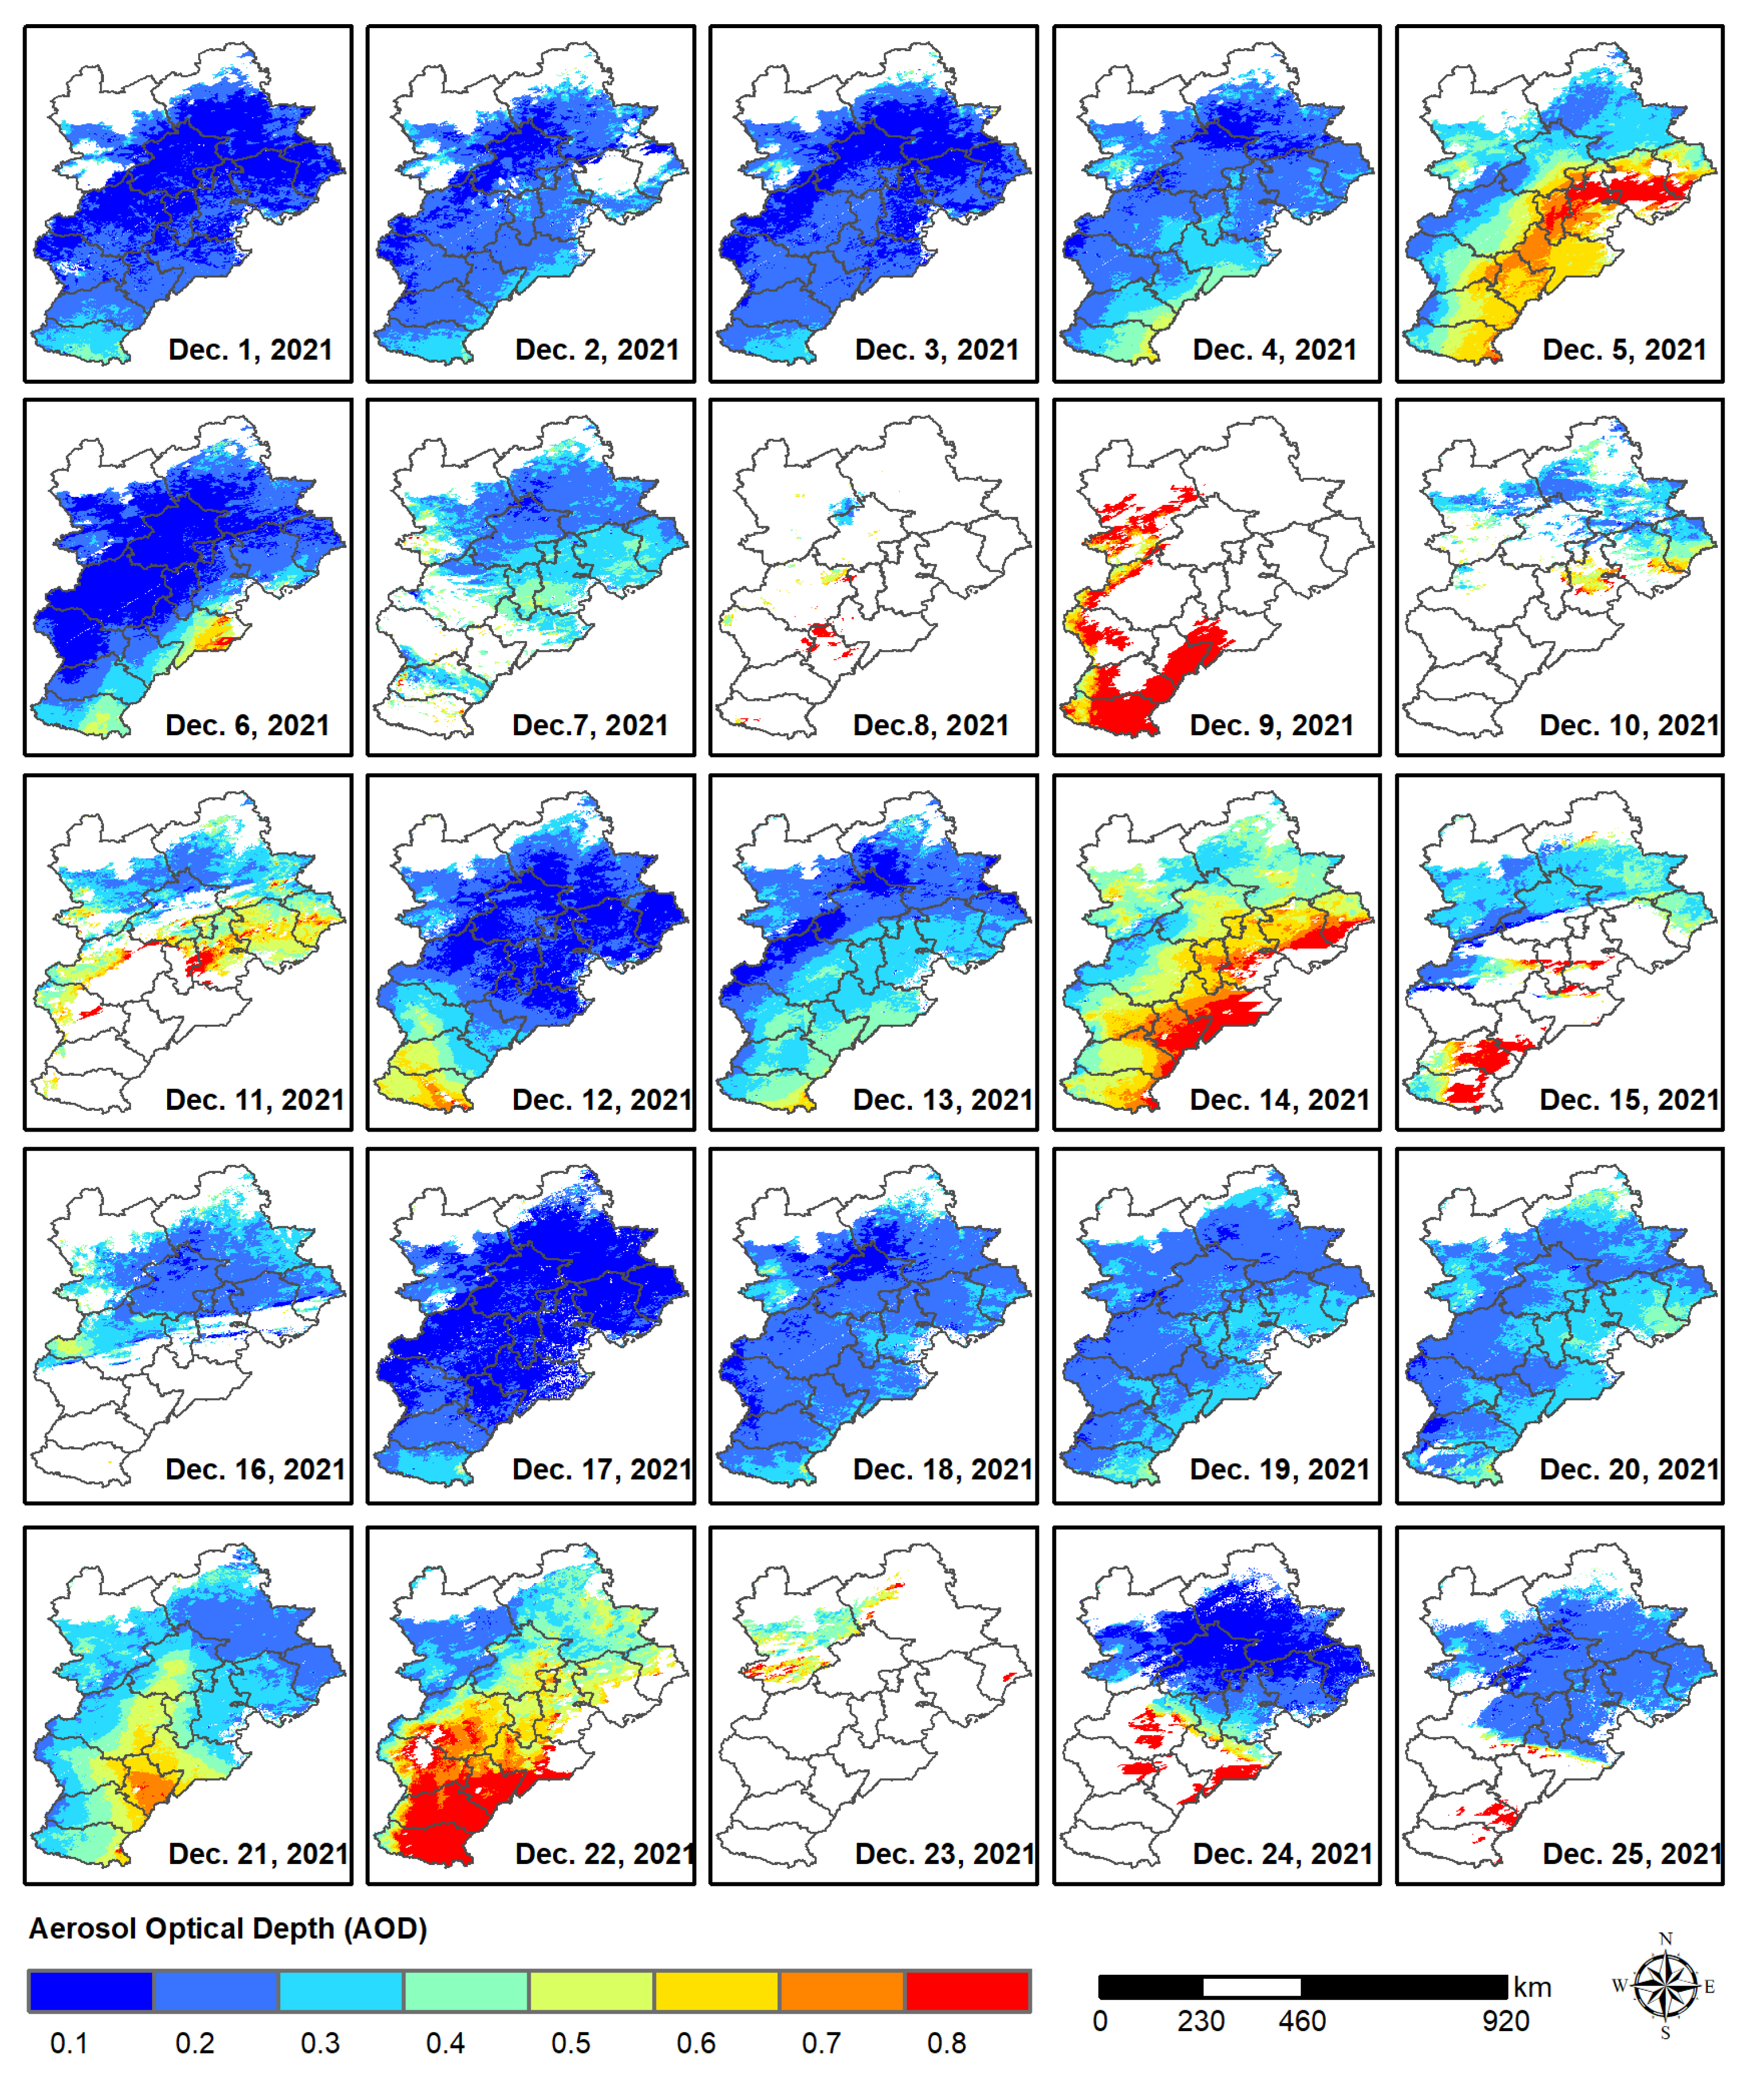
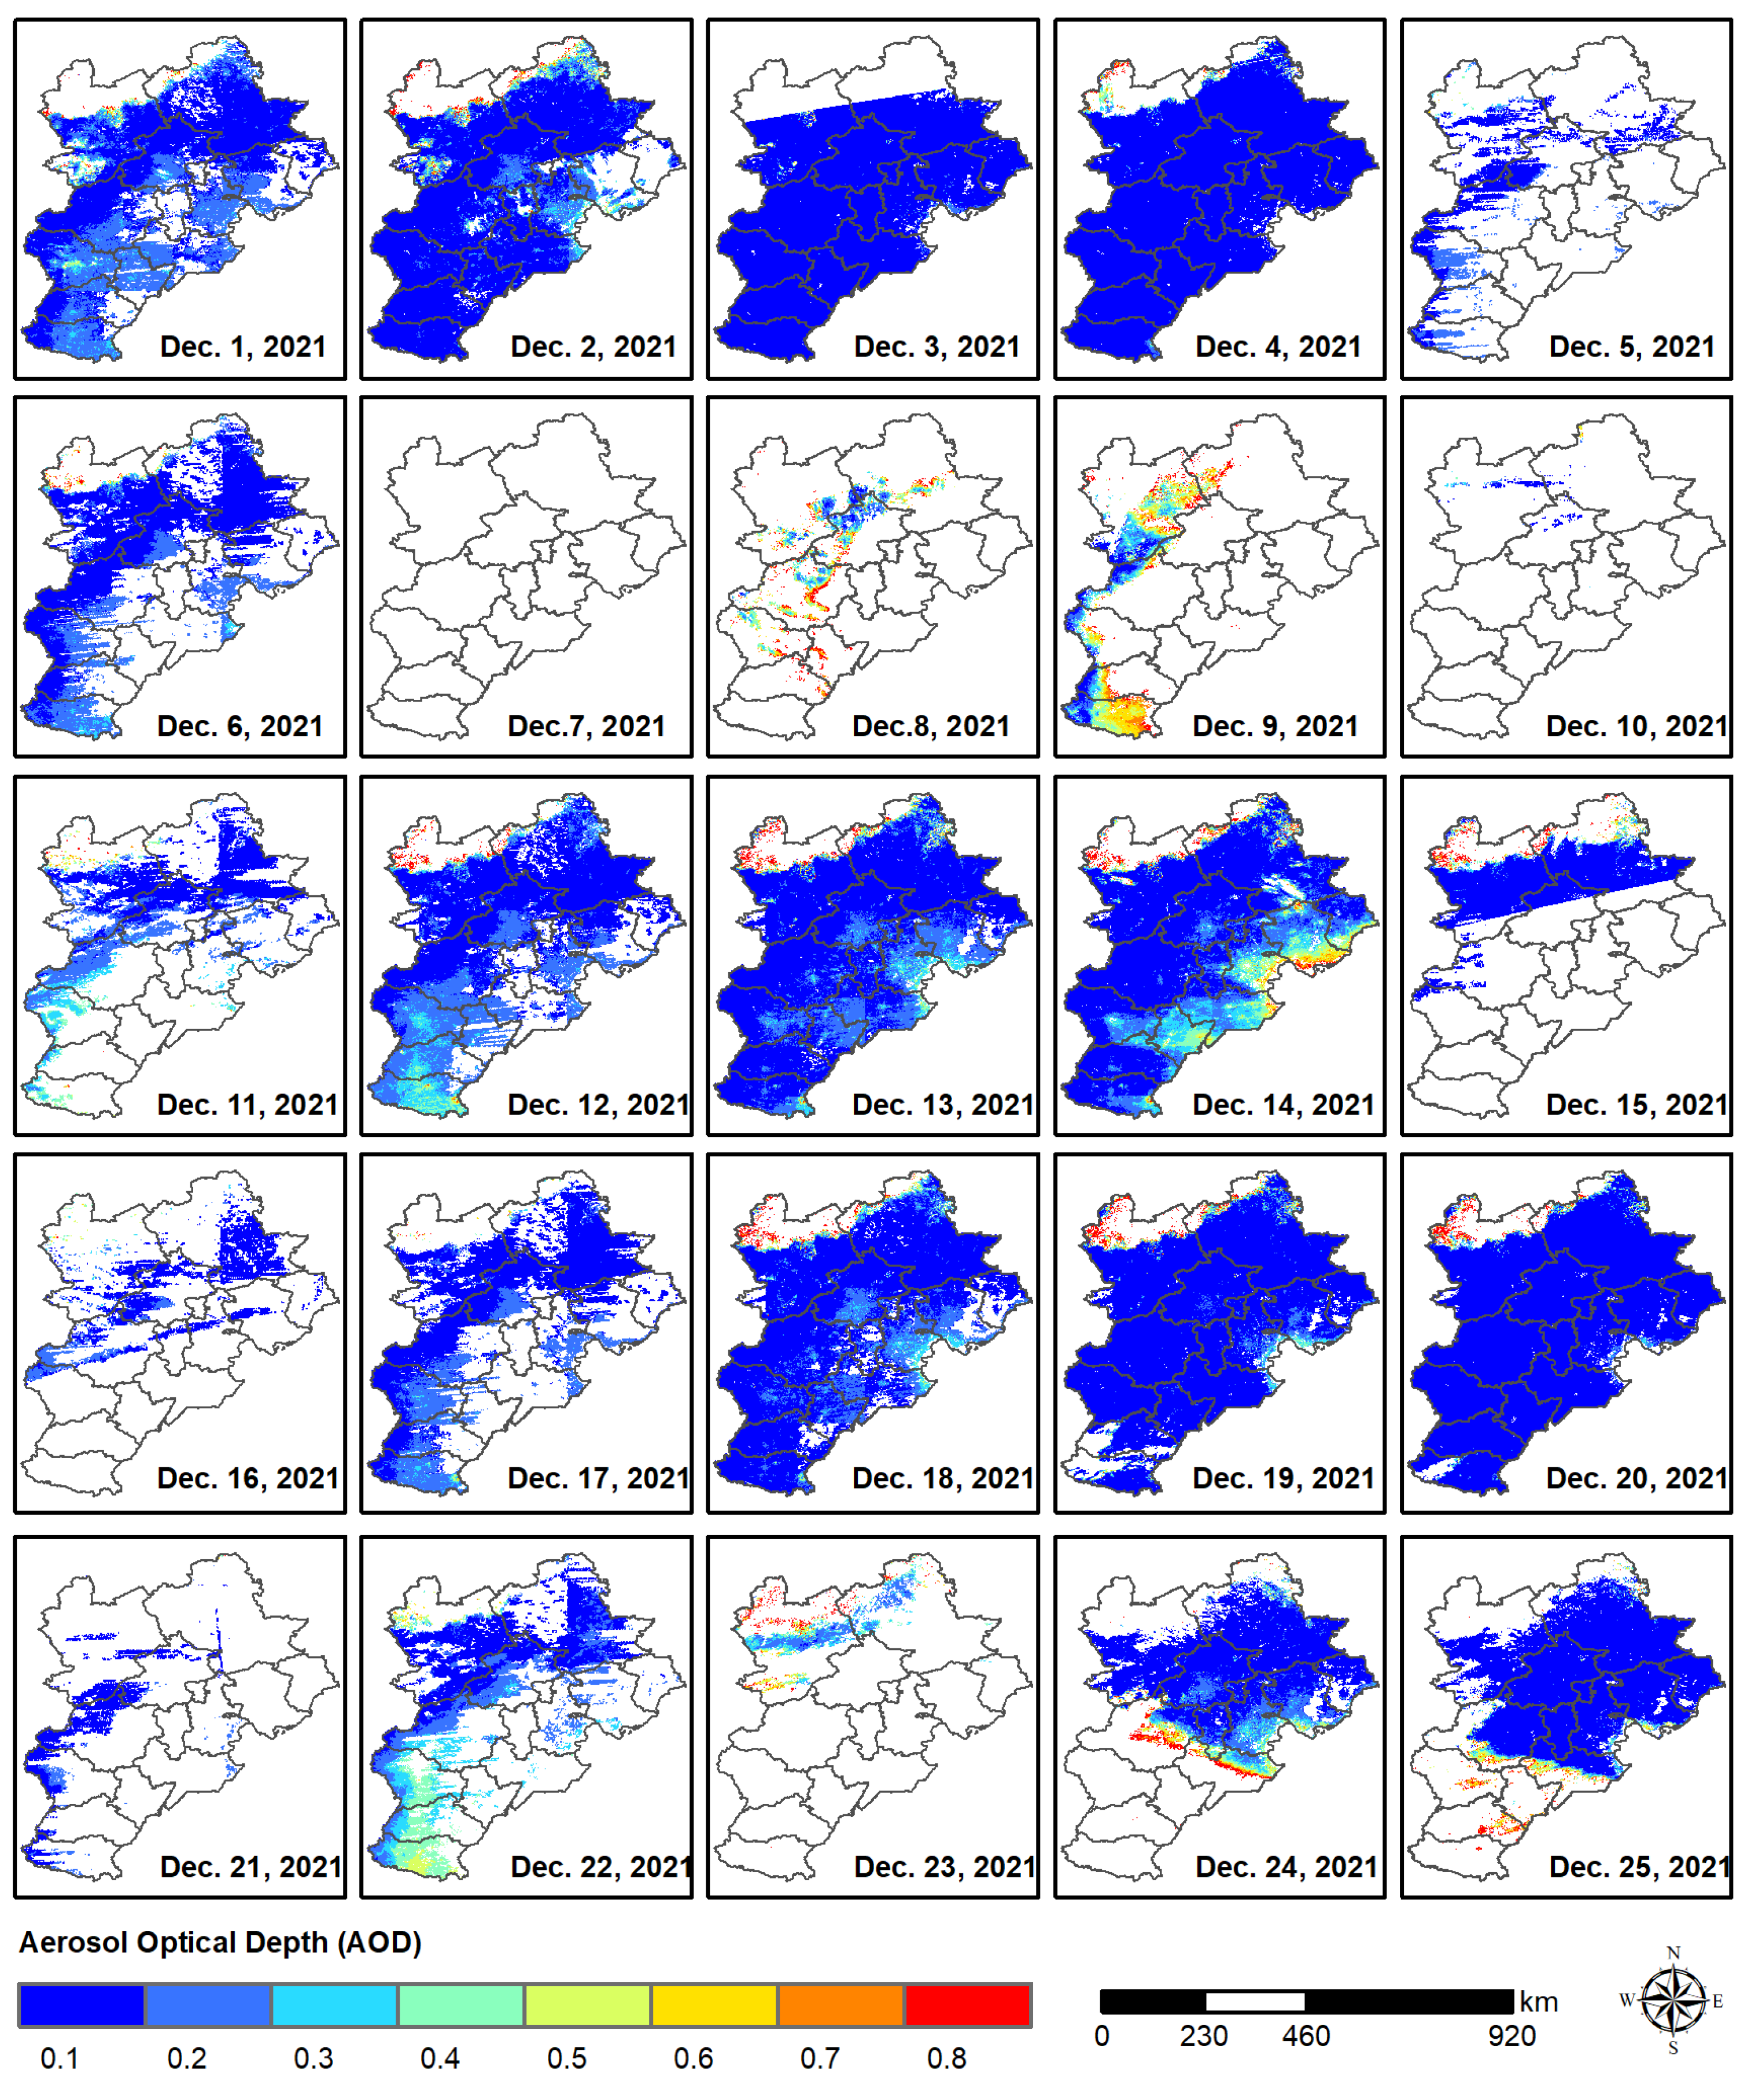
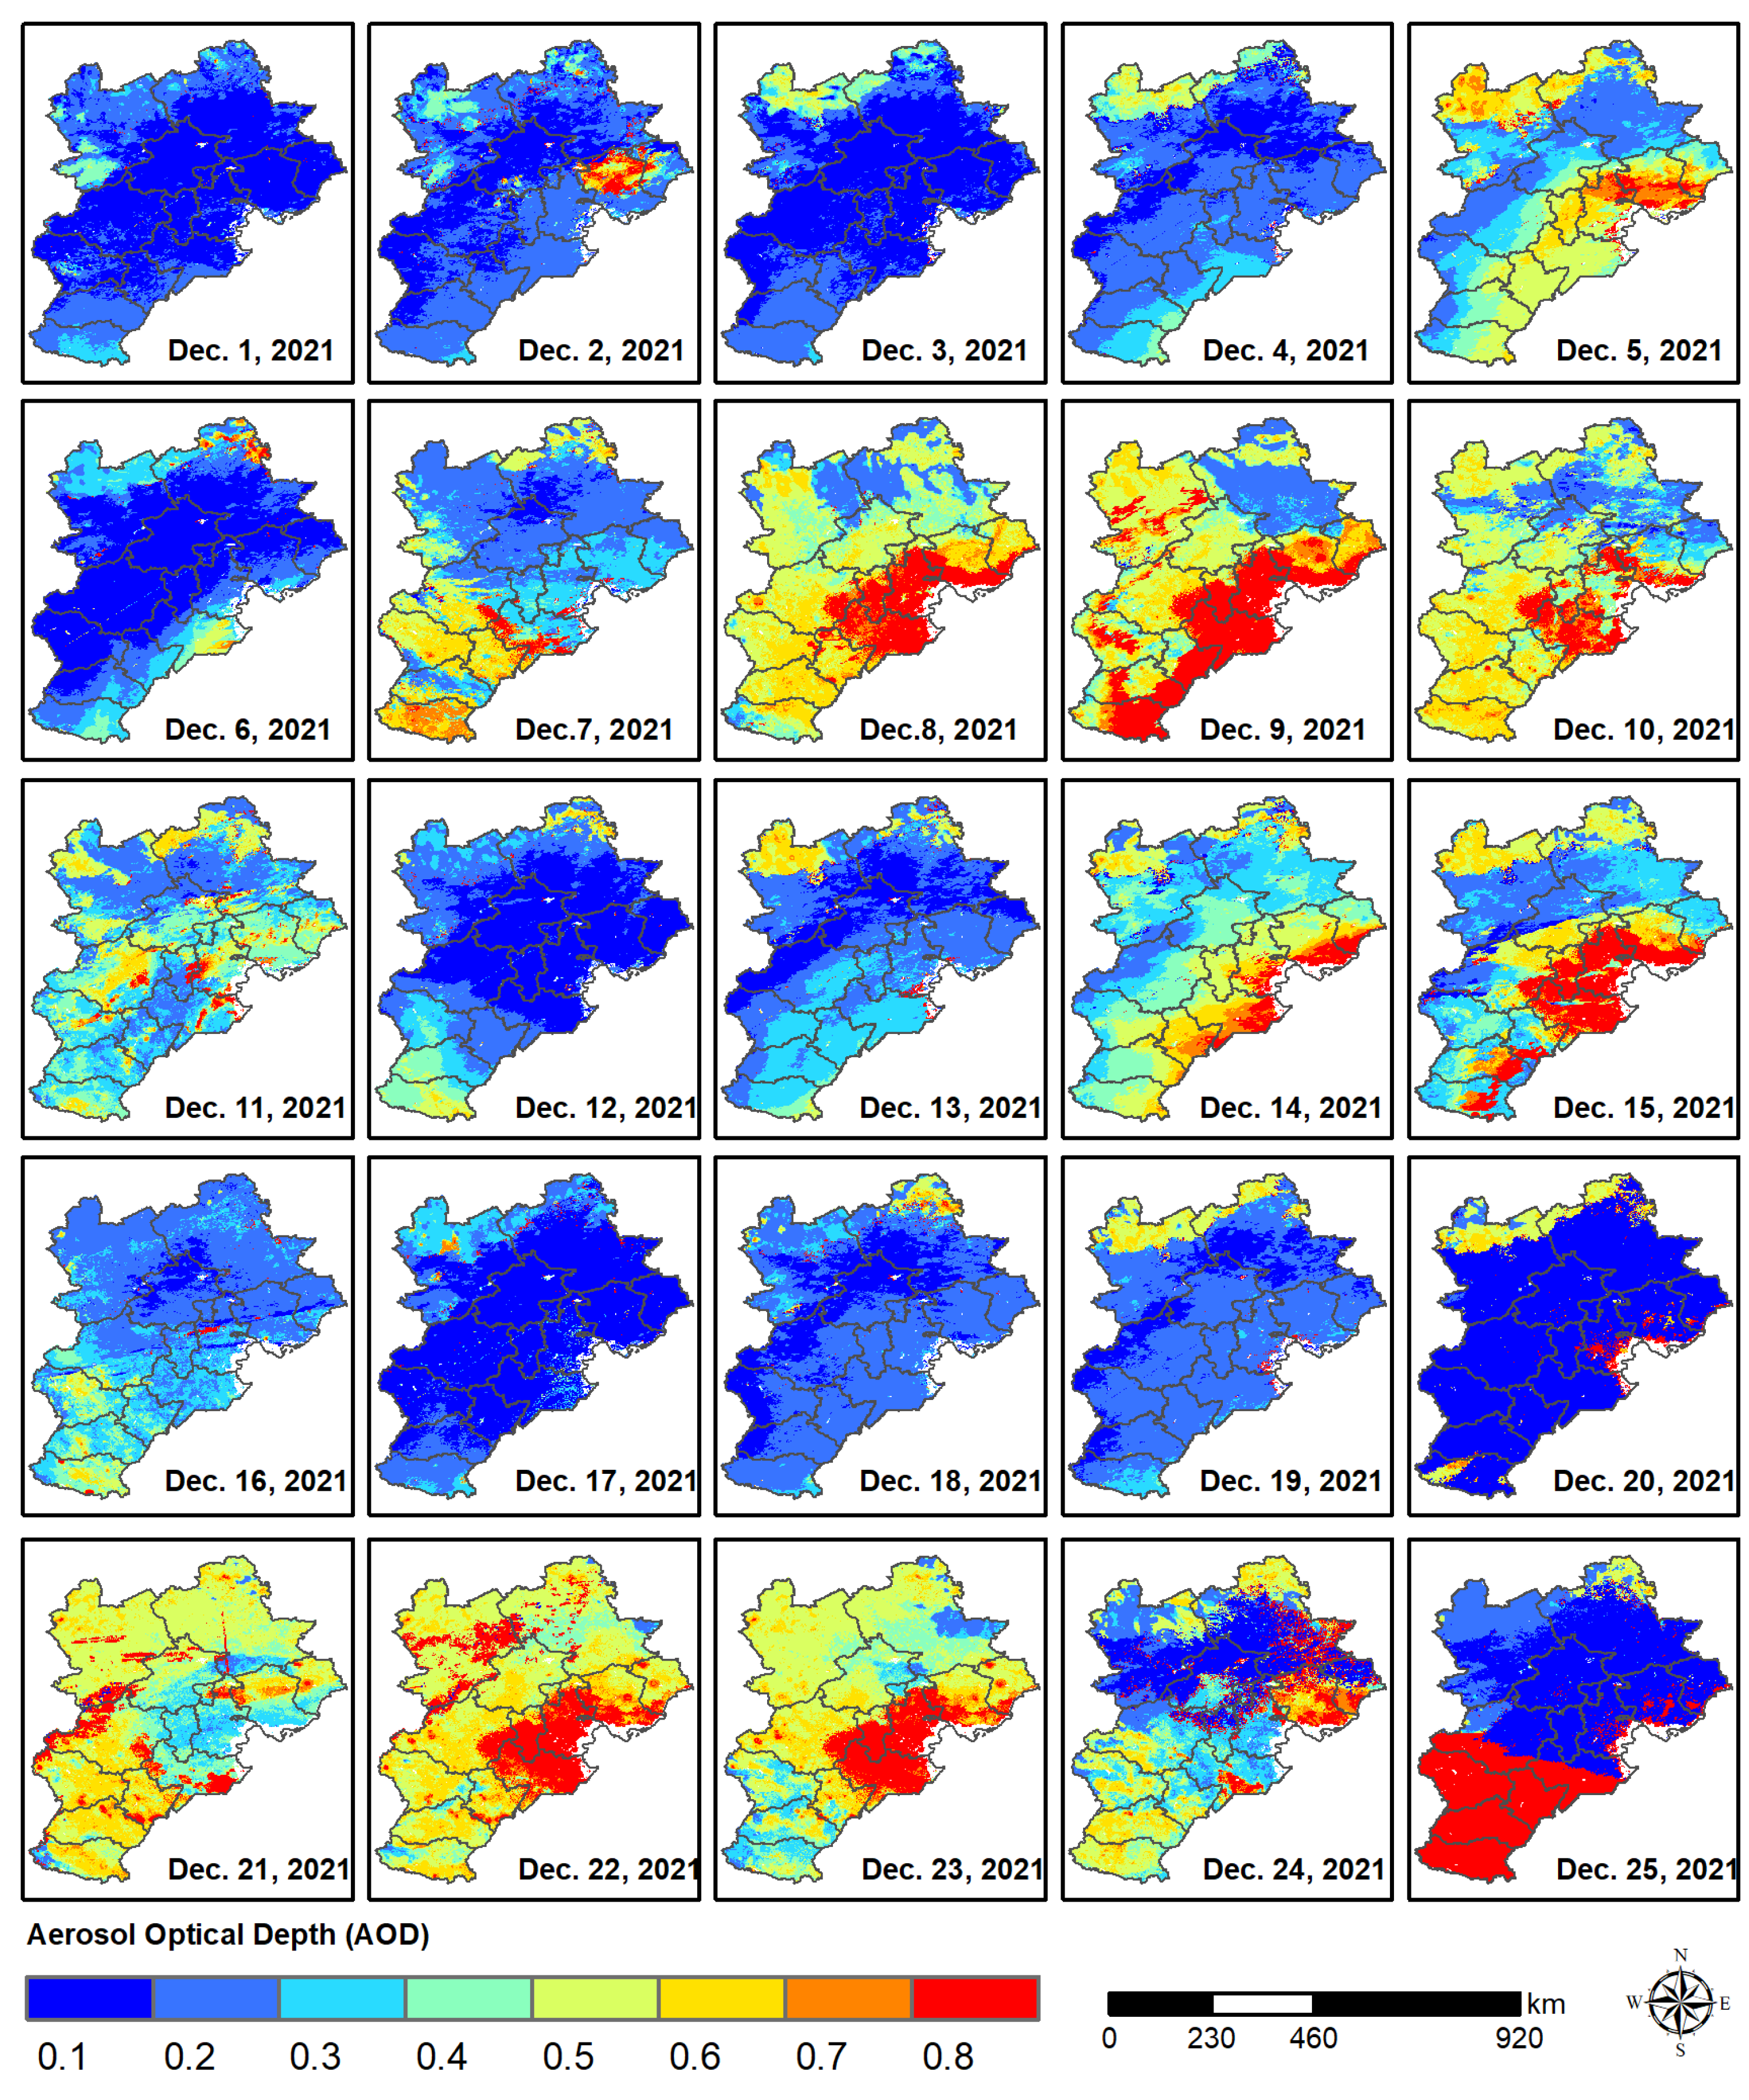
3.2.4. Spatial Distribution of Reconstruction Results
4. Discussion
5. Conclusions
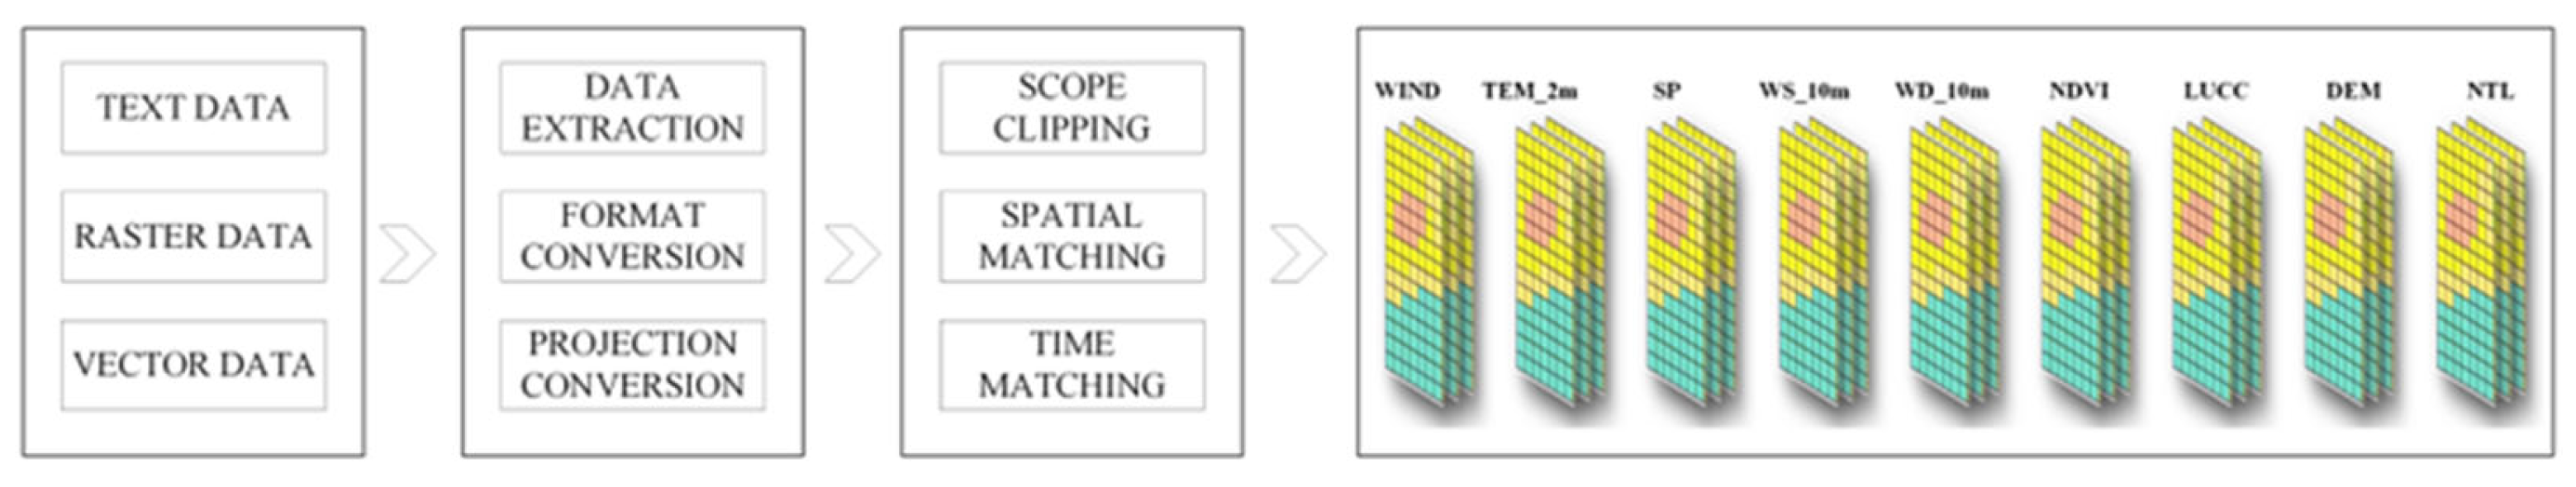
- After collecting and preprocessing multi-source data, including projection transformation, spatial matching, null value data removal, data fusion, and other operations, a high-quality dataset was obtained, which provided a reliable data foundation for the construction of subsequent models.
- The AOD data missing reconstruction model constructed based on the random forest algorithm can accurately learn the complex relationship between AOD and auxiliary factors and determine the auxiliary factors that have a greater impact on AOD through feature selection, which effectively improves the reconstruction accuracy of the model. During the verification process, the evaluation indicators such as the mean absolute error (MAE), root mean square error (RMSE), and determination coefficient (R2) of the model performed well, and, compared with the traditional spatial interpolation method and multi-source data fusion method, it has obvious advantages.
Author Contributions
Funding
Institutional Review Board Statement
Informed Consent Statement
Data Availability Statement
Acknowledgments
Conflicts of Interest
References
- Cochrane, M.A. Fire science for rainforests. Nature 2003, 421, 913–919. [Google Scholar] [CrossRef] [PubMed]
- Guo, B.; Wu, H.J.; Pei, L.; Zhu, X.W.; Zhang, D.M.; Wang, Y.; Luo, P.P. Study on the spatiotemporal dynamic of ground-level ozone concentrations on multiple scales across China during the blue-sky protection campaign. Environ. Int. 2022, 170, 107606. [Google Scholar] [CrossRef] [PubMed]
- Kaufman, Y.J.; Tanré, D.; Boucher, O. A satellite view of aerosols in the climate system. Nature 2002, 419, 215–223. [Google Scholar] [CrossRef]
- Wei, X.; Chang, N.B.; Bai, K.; Gao, W. Satellite remote sensing of aerosol optical depth: Advances, challenges, and perspectives. Crit. Rev. Environ. Sci. Technol. 2020, 50, 1640–1725. [Google Scholar] [CrossRef]
- Kumar, V.; Patil, R.; Bhawar, R.L.; Rahul, P.R.C.; Yelisetti, S. Increasing wind speeds fuel the wider spreading of pollution caused by fires over the IGP region during the Indian post-monsoon season. Atmosphere 2022, 13, 1525. [Google Scholar] [CrossRef]
- Tianchen, L.; Lin, S.; Haoxin, L. MODIS aerosol optical depth retrieval based on random forest approach. Remote Sens. Lett. 2021, 12, 179–189. [Google Scholar]
- Von Schneidemesser, E.; Monks, P.S.; Allan, J.D.; Bruhwiler, L.; Forster, P.; Fowler, D.; Lauer, A.; Morgan, W.T.; Paasonen, P.; Righi, M.; et al. Chemistry and the linkages between air quality and climate change. Chem. Rev. 2015, 115, 3856–3897. [Google Scholar] [CrossRef]
- Fuzzi, S.; Baltensperger, U.; Carslaw, K.; Decesari, S.; Denier van der Gon, H.; Facchini, M.C.; Fowler, D.; Koren, I.; Langford, B.; Lohmann, U.; et al. Particulate matter, air quality and climate: Lessons learned and future needs. Atmos. Chem. Phys. 2015, 15, 8217–8299. [Google Scholar]
- Gao, M.; Beig, G.; Song, S.; Zhang, H.; Hu, J.; Ying, Q.; Liang, F.; Liu, Y.; Wang, H.; Lu, X.; et al. The impact of power generation emissions on ambient PM2.5 pollution and human health in China and India. Environ. Int. 2018, 121, 250–259. [Google Scholar] [CrossRef]
- Shen, F.; Zhang, L.; Jiang, L.; Tang, M.; Gai, X.; Chen, M.; Ge, X. Temporal variations of six ambient criteria air pollutants from 2015 to 2018, their spatial distributions, health risks and relationships with socioeconomic factors during 2018 in China. Environ. Int. 2020, 137, 105556. [Google Scholar] [CrossRef]
- Sun, J.-L.; Jing, X.; Chang, W.-J.; Chen, Z.-X.; Zeng, H. Cumulative health risk assessment of halogenated and parent polycyclic aromatic hydrocarbons associated with particulate matters in urban air. Ecotox. Environ. Saf. 2015, 113, 31–37. [Google Scholar] [CrossRef] [PubMed]
- Yang, Y.; Zheng, Z.; Yim, S.H.L.; Roth, M.; Ren, G.; Gao, Z.; Wang, T.; Li, Q.; Shi, C.; Ning, G.; et al. PM2.5 Pollution Modulates Wintertime Urban-Heat-Island Intensity in the Beijing-Tianjin-Hebei Megalopolis, China. Geophys. Res. Lett. 2020, 47, e2019GL084288. [Google Scholar] [CrossRef]
- Guo, B.; Zhang, D.M.; Pei, L.; Su, Y.; Wang, X.X.; Bian, Y.; Zhang, D.H.; Yao, W.Q.; Zhou, Z.X.; Guo, L.Y. Estimating PM2.5 concentrations via random forest method using satellite, auxiliary, and ground-level station dataset at multiple temporal scales across China in 2017. Sci. Total Environ. 2021, 778, 146288. [Google Scholar] [CrossRef]
- Hansen, J.; Sato, M.; Ruedy, R. Radiative Forcing and Climate Response. J. Geophys. Res. Biogeosci. 1997, 102, 6831–6864. [Google Scholar] [CrossRef]
- Li, X.; Liu, K.; Tian, J. Variability, predictability, and uncertainty in global aerosols inferred from gap-filled satellite observations and an econometric modeling approach. Remote Sens. Environ. 2021, 261, 112501. [Google Scholar] [CrossRef]
- Jose, S.; Lakshmi, N.B.; Babu, S.S. Long Term Trend in Aerosol Direct Radiative Effects over Indian Ocean Region from Multi-Satellite Observations. Remote Sens. Lett. 2021, 12, 994–1003. [Google Scholar] [CrossRef]
- Zhao, C.; Yang, Y.; Fan, H.; Huang, J.; Fu, Y.; Zhang, X.; Kang, S.; Cong, Z.; Letu, H.; Menenti, M. Aerosol characteristics and impacts on weather and climate over the Tibetan Plateau. Natl. Sci. Rev. 2020, 7, 492–495. [Google Scholar] [CrossRef]
- Zheng, Z.; Ren, G.; Wang, H.; Dou, J.; Gao, Z.; Duan, C.; Li, Y.; Ngarukiyimana, J.; Zhao, C.; Cao, C.; et al. Relationship between Fine Particle Pollution and the Urban Heat Island in Beijing, China: Observational Evidence. Bound.-Lay. Meteorol. 2018, 169, 93–113. [Google Scholar] [CrossRef]
- Chen, H.; Li, Q.; Wang, Z.; Ma, P.; Li, Y.; Zhao, A. Retrieval of Aerosol Optical Depth Using FY3D MERSI2 Data. J. Geo-Inf. Sci. 2020, 22, 1887–1896. [Google Scholar]
- Chen, Z.Y.; Jin, J.Q.; Zhang, R.; Zhang, T.H.; Chen, J.J.; Yang, J.; Ou, C.Q.; Guo, Y.M. Comparison of different missing-imputation methods for MAIAC (multiangle implementation of atmospheric correction) AOD in estimating daily PM2.5 levels. Remote Sens. 2020, 12, 3008. [Google Scholar] [CrossRef]
- Zhang, Y.; Chen, H.; Wang, Z. Terrestrial Aerosol Retrieval over Beijing from Chinese GF-1 Data Based on the Blue/Red Correlation. Remote Sens. Lett. 2020, 12, 219–228. [Google Scholar] [CrossRef]
- Varotsos, C.; Ondov, J.; Tzanis, C.; Öztürk, F.; Nelson, M.; Ke, H.; Christodoulakis, J. An observational study of the atmospheric ultra-fine particle dynamics. Atmos. Environ. 2012, 59, 312–319. [Google Scholar] [CrossRef]
- Shin, J.; Sim, J.; Dehkhoda, N.; Joo, S.; Kim, T.; Kim, G.; Müller, D.; Tesche, M.; Shin, S.-K.; Shin, D.; et al. Long-Term Variation Study of Fine-Mode Particle Size and Regional Characteristics Using AERONET Data. Remote Sens. 2022, 14, 4429. [Google Scholar] [CrossRef]
- Pandey, P.C. Highlighting the Role of Earth Observation Sentinel5P TROPOMI in Monitoring Volcanic Eruptions: A Report on Hunga Tonga, a Submarine Volcano. Remote Sens. Lett. 2022, 13, 912–923. [Google Scholar] [CrossRef]
- Tidblad, J.; Kreislová, K.; Faller, M.; De la Fuente, D.; Yates, T.; Verney-Carron, A.; Grøntoft, T.; Gordon, A.; Hans, U. ICP Materials Trends in Corrosion, Soiling and Air Pollution (1987–2014). Materials 2017, 10, 969. [Google Scholar] [CrossRef]
- Tzanis, C.; Varotsos, C.; Ferm, M.; Christodoulakis, J.; Assimakopoulos, M.N.; Efthymiou, C. Nitric acid and particulate matter measurements at Athens, Greece, in connection with corrosion studies. Atmos. Chem. Phys. 2009, 9, 8309–8316. [Google Scholar] [CrossRef]
- Tzanis, C.; Varotsos, C.; Christodoulakis, J.; Tidblad, J.; Ferm, M.; Ionescu, A.; Lefevre, R.-A.; Theodorakopoulou, K.; Kreislova, K. On the corrosion and soiling effects on materials by air pollution in Athens, Greece, Atmos. Chem. Phys. 2011, 11, 12039–12048. [Google Scholar]
- Li, Z.; Wang, Y.; Guo, J.; Zhao, C.; Cribb, M.C.; Dong, X.; Fan, J.; Gong, D.; Huang, J.; Jiang, M.; et al. East Asian Study of Tropospheric Aerosols and their Impact on Regional Clouds, Precipitation, and Climate (EAST-AIRCPC). J. Geophys. Res.-Atmos. 2019, 124, 13026–13054. [Google Scholar] [CrossRef]
- Bai, K.; Chang, N.-B.; Chen, C.-F. Spectral Information Adaptation and Synthesis Scheme for Merging Cross-Mission Ocean Color Reflectance Observations from MODIS and VIIRS. IEEE Trans. Geosci. Remote Sens. 2016, 54, 311–329. [Google Scholar] [CrossRef]
- Bai, K.; Li, K.; Guo, J.; Yang, Y.; Chang, N.-B. Filling the gaps of in situ hourly PM2.5 concentration data with the aid of empirical orthogonal function analysis constrained by diurnal cycles. Atmos. Meas. Technol. 2020, 13, 1213–1226. [Google Scholar] [CrossRef]
- Chang, N.-B.; Bai, K.; Chen, C.-F. Smart Information Reconstruction via Time-Space-Spectrum Continuum for Cloud Removal in Satellite Images. IEEE J. Sel. Top. Appl. 2015, 8, 1898–1912. [Google Scholar] [CrossRef]
- Lv, B.L.; Hu, Y.T.; Chang, H.H.; Russell, A.G.; Bai, Y.Q. Improving the accuracy of daily PM2.5 distributions derived from the fusion of ground-level measurements with aerosol optical depth observations: A case study in North China. Environ. Sci. Technol. 2016, 50, 4752–4759. [Google Scholar] [CrossRef] [PubMed]
- Xiao, Q.Y.; Wang, Y.J.; Chang, H.H.; Meng, X.; Geng, G.N.; Lyapustin, A.; Liu, Y. Full-coverage high-resolution daily PM2.5 estimation using MAIAC AOD in the Yangtze River Delta of China. Remote Sens. Environ. 2017, 199, 437–446. [Google Scholar] [CrossRef]
- Di, Q.; Kloog, I.; Koutrakis, P.; Lyapustin, A.; Wang, Y.J.; Schwartz, J. Assessing PM2.5 exposures with high spatiotemporal resolution across the continental United States. Environ. Sci. Technol. 2016, 50, 4712–4721. [Google Scholar] [CrossRef]
- Jiang, M.J.; Chen, Z.H.; Yang, Y.S.; Ni, C.J.; Yang, Q. Establishment of aerosol optical depth dataset in the Sichuan Basin by the random forest approach. Atmos. Pollut. Res. 2022, 13, 101394. [Google Scholar] [CrossRef]
- Bai, K.X.; Li, K.; Ma, M.L.; Li, K.T.; Li, Z.Q.; Guo, J.P.; Chang, N.B.; Tan, Z.; Han, D. LGHAP: The Long-term Gap-free High-resolution Air Pollutant concentration dataset, derived via tensor-flow-based multimodal data fusion. Earth Syst. Sci. Data 2022, 14, 907–927. [Google Scholar] [CrossRef]
- Chen, X.; Shi, G. Machine learning-based inversion of aerosol optical depth inversion from FY-4A data. Remote Sens. Nat. Resour. 2025, 37, 213–220. [Google Scholar]
- Si, L. Remote Sensing Retrieval of Aerosol Optical Depth Based on Deep Learning and Its Spatiotemporal Pattern and Driving Force Analysis. Ph.D. Thesis, Shandong University, Shandong, China, 2023. [Google Scholar]
- Ali, M.A.; Bilal, M.; Wang, Y.; Qiu, Z.F.; Nichol, J.E.; de Leeuw, G.; Ke, S.; Mhawish, A.; Almazroui, M.; Mazhar, U.; et al. Evaluation and comparison of CMIP6 models and MERRA-2 reanalysis AOD against Satellite observations from 2000 to 2014 over China. Geosci. Front. 2022, 13, 101–325. [Google Scholar] [CrossRef]
- Fan, R.A.; Ma, Y.Y.; Jin, S.K.; Gong, W.; Liu, B.M.; Wang, W.Y.; Li, H.; Zhang, Y.Q. Validation, analysis, and comparison of MISR V23 aerosol optical depth products with MODIS and AERONET observations. Sci. Total Environ. 2023, 856, 159117. [Google Scholar] [CrossRef]
- Zhang, H. Technical Specification for Space-Ground Interface of Fengyun-3D Satellite (1); Shanghai Engineering Institute of Satellite: Shanghai, China, 2014; pp. 5–20. [Google Scholar]
- Tang, S.H.; Qiu, H.; Ma, G. Review on progress of the Fengyun meteorological satellite. J. Remote Sens. 2016, 20, 842–849. [Google Scholar]
- Zhu, A.J.; Hu, X.Q.; Lin, M.Y.; Jia, S.Z.; Ma, Y. Global data acquisition methods and data distribution for FY-3D meteorological satellite. J. Mar. Meteorol. 2018, 38, 1–10. [Google Scholar]
- Yang, L.K.; Hu, X.Q.; Wang, H.; He, X.W.; Liu, P.; Xu, N.; Yang, Z.D.; Zhang, P. Preliminary test of quantitative capability in aerosol retrieval over land from MERSI-II onboard FY-3D. Natl. Remote Sens. Bull. 2022, 26, 923–940. [Google Scholar] [CrossRef]
- Xu, M.J. Study on inversion method of AOD in Beijing-Tianjin-Hebei Region by FY-4A Meteorological Satellite. Master’s Thesis, Nanjing University of Information Science & Technology, Nanjing, China, 2021. [Google Scholar]
- Zhang, Y.; Li, Z.; Li, J. A preliminary layer perceptible water vapor retrieval algorithm for Fengyun-4 advanced geosynchronous radiation imager. In Proceedings of the IGARSS 2019–2019 IEEE International Geoscience and Remote Sensing Symposium, Yokohama, Japan, 28 July–2 August 2019; pp. 7564–7566. [Google Scholar]
- Wang, Y.; Liu, H.; Zhang, Y.; Duan, M.; Tang, S.; Deng, X. Validation of FY-4A AGRI layer precipitable water products using radiosonde data. Atmos. Res. 2021, 253, 105502. [Google Scholar] [CrossRef]
- Xu, W.; Wang, W.; Chen, B. Comparison of hourly aerosol retrievals from JAXA Himawari/AHI in version 3.0 and a simple customized method. Sci. Rep. 2020, 10, 20884. [Google Scholar] [CrossRef]
- He, X.; Zhao, L.; Zhai, W.; Qiao, M.; Zhang, W.; Xin, J. Calibration of the Span of Himawari-8 AOD Products in Eastern China. Remote Sens. Lett. 2021, 12, 1136–1146. [Google Scholar] [CrossRef]

| On-Board Instruments | Products | Physical Parameters | Time Resolution | Spatial Resolution |
|---|---|---|---|---|
| FY-3D/MESRI-II | Land-based aerosol products | AOD | 1 time/day | 1 km |
| MODIS | MCD19A2 (L2) | AOD | 1 time/day | 1 km |
| FY-4A/AGRI | Aerosol parameter product (L2) | AOD | 1 time/hour | 4 km |
| Himawari-8/AHI | Aerosol products (L2/L3) | AOD | 1 time/hour | 4 km |
| No. | Type | Variable Name | Unit | Spatial Resolution | Spatial Resolution | Data Type | Note |
|---|---|---|---|---|---|---|---|
| 1 | Measured data | Aerosol products (AOD) | -- | -- | Table 1 | ||
| 2 | Meteorological variables | 2 m temperature (TEM) | °C | 1 km | 1 h | Real-time data integration | HRCLDAS |
| 3 | Relative humidity (RH) | % | 1 km | 1 h | Real-time data integration | HRCLDAS | |
| 4 | Precipitation (PRE) | mm | 1 km | 1 h | Real-time data integration | HRCLDAS | |
| 5 | Total evaporation (ET) | 1 km | 3 h | Real-time data integration | HRCLDAS | ||
| 6 | Surface pressure (SP) | hPa | 1 km | 3 h | Real-time data integration | HRCLDAS | |
| 7 | 10 m wind speed (WS) | m/s | 1 km | 1 h | Real-time data integration | HRCLDAS | |
| 8 | 10 m wind direct (WD) | m/s | 1 km | 1 h | Real-time data integration | HRCLDAS | |
| 9 | Boundary layer height (BLH) | m | 3 km | 1 h | Forecast data (forecast at 8 PM) | Chem 3 km-pblh | |
| 10 | Surface condition parameters | Normalized vegetation index (NDVI) | -- | 1 km | monthly | MOD13A3 | |
| 11 | Land cover data (LUCC) | -- | 500 m | yearly | MCD12Q1 | ||
| 12 | Surface elevation data (DEM) | -- | 90 m | yearly | SRTM | ||
| 13 | Population data | Nighttime light data (NTL) | -- | 500 m | daily | VNP46A1 |
| Verification Method | Model | Validation of AOD Simulation Results | |||
|---|---|---|---|---|---|
| Sample | MAE | RMSE | R2 | ||
| Model validation | DT | 373,482 | 0.00 | 0.00 | 0.99 |
| RF | 373,482 | 0.06 | 0.11 | 0.93 | |
| AdaBoost | 373,482 | 0.31 | 0.30 | 0.40 | |
| GBDT | 373,482 | 0.21 | 0.32 | 0.53 | |
| MLP | 373,482 | 0.21 | 0.32 | 0.53 | |
| Product verification | DT | 41,498 | 0.20 | 0.41 | 0.33 |
| RF | 41,498 | 0.14 | 0.24 | 0.74 | |
| AdaBoost | 41,498 | 0.30 | 0.38 | 0.29 | |
| GBDT | 41,498 | 0.22 | 0.35 | 0.47 | |
| MLP | 41,498 | 0.24 | 0.36 | 0.46 | |
| Season | AOD | |||
|---|---|---|---|---|
| Sample Num | MAE | RMSE | R2 | |
| Spring | 10,713 | 0.07 | 0.12 | 0.94 |
| Summer | 6064 | 0.08 | 0.16 | 0.91 |
| Autumn | 6616 | 0.06 | 0.11 | 0.93 |
| Winter | 14,504 | 0.04 | 0.06 | 0.96 |
Disclaimer/Publisher’s Note: The statements, opinions and data contained in all publications are solely those of the individual author(s) and contributor(s) and not of MDPI and/or the editor(s). MDPI and/or the editor(s) disclaim responsibility for any injury to people or property resulting from any ideas, methods, instructions or products referred to in the content. |
© 2025 by the authors. Licensee MDPI, Basel, Switzerland. This article is an open access article distributed under the terms and conditions of the Creative Commons Attribution (CC BY) license (https://creativecommons.org/licenses/by/4.0/).
Share and Cite
Wang, H.; Wang, M.; Jiang, P.; Ma, F.; Gao, Y.; Gu, X.; Luan, Q. Research on Time Series Interpolation and Reconstruction of Multi-Source Remote Sensing AOD Product Data Using Machine Learning Methods. Atmosphere 2025, 16, 655. https://doi.org/10.3390/atmos16060655
Wang H, Wang M, Jiang P, Ma F, Gao Y, Gu X, Luan Q. Research on Time Series Interpolation and Reconstruction of Multi-Source Remote Sensing AOD Product Data Using Machine Learning Methods. Atmosphere. 2025; 16(6):655. https://doi.org/10.3390/atmos16060655
Chicago/Turabian StyleWang, Huifang, Min Wang, Pan Jiang, Fanshu Ma, Yanhu Gao, Xinchen Gu, and Qingzu Luan. 2025. "Research on Time Series Interpolation and Reconstruction of Multi-Source Remote Sensing AOD Product Data Using Machine Learning Methods" Atmosphere 16, no. 6: 655. https://doi.org/10.3390/atmos16060655
APA StyleWang, H., Wang, M., Jiang, P., Ma, F., Gao, Y., Gu, X., & Luan, Q. (2025). Research on Time Series Interpolation and Reconstruction of Multi-Source Remote Sensing AOD Product Data Using Machine Learning Methods. Atmosphere, 16(6), 655. https://doi.org/10.3390/atmos16060655