Next Article in Journal
Urban Impacts on Convective Squall Lines over Chicago in the Warm Season—Part II: A Numerical Study of Urban Infrastructure Effects on the Evolution of City-Scale Convection
Previous Article in Journal
Erosive Wind Characteristics and Aeolian Sediment Transport and Dune Formation in Makran Region of Baluchistan, Iran
Previous Article in Special Issue
Wide and Deep Learning Model for Satellite-Based Real-Time Aerosol Retrievals in China
 
 
Due to scheduled maintenance work on our database systems, there may be short service disruptions on this website between 10:00 and 11:00 CEST on June 14th.
Article

Output of Volcanic SO2 Gases and Their Dispersion in the Atmosphere: The Case of Vulcano Island, Aeolian Archipelago, Italy

1
INGV Sezione Palermo, Via Ugo La Malfa, 153, 90146 Palermo, Italy
2
Instituto de Geofísica, Universidad Nacional Autónoma de México, Mexico City 04510, Mexico
3
Departamento de Geología, Centro de Investigación Científica y de Educación Superior de Ensenada, Baja California (CICESE), Carretera Ensenada-Tijuana 3918, Ensenada 22860, Ensenada Baja California, Mexico
4
Istituto Nazionale di Geofisica e Vulcanologia, Sezione di Bologna, Viale Berti Pichat 6/2, 40127 Bologna, Italy
5
CNR-IGG Istituto di Geoscienze e Georisorse, Via La Pira, 450121 Firenze, Italy
6
INGV Sezione Roma 1, Via di Vigna Murata, 605, 00143 Rome, Italy
7
Dipartimento Scienze Della Terra, Università di Firenze, Via La Pira, 4, 50121 Firenze, Italy
*
Author to whom correspondence should be addressed.
Atmosphere 2025, 16(6), 651; https://doi.org/10.3390/atmos16060651
Submission received: 19 March 2025 / Revised: 22 May 2025 / Accepted: 23 May 2025 / Published: 27 May 2025
(This article belongs to the Special Issue Natural Sources Aerosol Remote Monitoring (2nd Edition))

Abstract

:
Gases emitted from active volcanic systems constitute a primary natural source of global atmospheric pollution. Atmospheric sulfur dioxide (SO2) concentrations were monitored using a near-continuous network based on Scan-DOAS (Differential Optical Absorption Spectroscopy) technology. Complementary intermittent measurements were performed using a UV Thermo® analyzer deployed at fixed locations and along predefined transects on the island. SO2 flux data derived from the Scan-DOAS measurements, coupled with atmospheric dispersion maps generated using the AERMOD modeling software, enabled the estimation of SO2 distribution across the volcanic crater region and inhabited areas of the island, including Vulcano Village and Vulcano Piano. The results of the estimation of SO2 concentration in the atmosphere, integrated with the dispersion modeling, exhibited consistency with direct SO2 concentration measurements obtained by the Thermo® analyzer, demonstrating coherence between the two methodologies, although some overestimations of ambient SO2 were noted. This study provided valuable insights into areas with anomalous SO2 concentrations exceeding the threshold limits established by the World Health Organization (WHO) and the European Union (EU). These limits are generally exceeded in the crater zone and surrounding areas. The findings also highlighted the influence of prevailing winds and the temporal variations in volcanic degassing activity observed over the preceding 17 years, characterized by four periods of unrest degassing with SO2 emission rates from the summit solfataric area reaching up to 250 tonnes per day (td−1).

1. Introduction

Sulphur dioxide (SO2) is discharged into the atmosphere from both anthropogenic and natural sources. Anthropogenic SO2 mostly derives from industrial emissions and the combustion of fossil fuel (coal, oil, and natural gas), while the main natural SO2 sources include volcanic fluids (plumes, fumaroles, and hot springs) discharging deep-originated fluids into the atmosphere [1,2,3].
Volatile substances emitted by volcanic systems contribute to air pollution and several gaseous species that are harmful to human health, not only SO2, but also H2S, CO2, and CO [4,5], whose effects are well known and tabulated in the health records of the World Health Organization [6] and the European and Italian Ministries of Health [7].
In particular, sulphur dioxide (SO2) in the atmosphere has a strong impact on the environment, health, and climate [8,9,10], representing a direct danger to human health [11,12] and being therefore considered one of the main air pollutants.
The permissible concentration of hazardous gases for human exposure exhibits an inverse relationship with the duration of exposure. Specifically, as the exposure period lengthens, the maximum allowable concentration diminishes to mitigate potential adverse health outcomes and ensure adherence to established air quality standards. In particular, in the case of SO2, the limit concentration allowed by the WHO is 40 µg/m3 for an exposure time of 24 h. Moreover, the daily mean value of SO2 allowed by the EU guideline is 125 µg/m3 and cannot be exceeded more than 3 times in a year, and the SO2 hourly mean value should not exceed 350 µg/m3 more than 24 times in a year [6].
Vulcano island (Aeolian Archipelago of Sicily, Italy) shows a solfataric activity that started after the last eruption that persisted for about 2 years in 1888–1890. Most of the fluid emissions are clustered at (a) the summit area of the La Fossa Crater, characterized by a fumarolic field with outlet temperatures around 450 °C; (b) the area of the Baia di Levante, characterized by a hydrothermal system with fluids emitted at boiling temperature [13]. Moreover, anomalous soil degassing has been recognized over the whole island, especially in areas located both at La Fossa Crater and at the foot of the volcanic edifice, e.g., Baia di Levante, Palizzi, and in the inhabited center of the village of Vulcano (Figure 1) [13].
Sulfur dioxide is the main sulfur species in high-temperature fumarolic gases. The emission flux of this volatile is used in volcanic surveillance as an indicator of the state of activity and for calculating the magma volumes involved in the degassing volcanic systems [14,15]. In recent years, many studies have been conducted on SO2 flux measurements from volcanic plumes that have led to technological advances in monitoring this parameter. Although Vulcano Island does not show a real plume as those typically emitted by open vent volcanoes, in recent years, many researchers have tested new remote sensing techniques and several prototypes to carry out SO2 flux measurements on fumarolic fields.
Over the last decades, much research has been carried out at Vulcano Island to characterize the gaseous emissions [13,15] and to monitor the state of volatiles degassing with particular attention to the degassing unrest periods in the years 2009, 2021, 2023, 2024, [16,17,18,19]. Most of the studies are focused on identifying geochemical changes that could presage a paroxysmal event [18,19].
Moreover, in recent years, environmental studies with human health implications have been carried out on the harmful volcanic gases emitted by the Vulcano system, i.e., CO2, H2S, and SO2, in order to evaluate their effect on the local and tourist population and to identify the areas at greatest risk for human health [15,20,21,22].
The aim of this study is to characterize and monitor the temporal evolution of volcanic fluid emissions, with particular reference to the SO2 discharged from the solfataric area over the past 17 years (2008–2024), focusing on periods of increased degassing activity. Special attention was given to SO2 spatial distribution in the atmosphere, creating SO2 dispersion maps to identify anomalous areas with dangerous levels for human health where SO2 concentrations exceed WHO limits during both normal degassing and periods of increased activity. We focused our investigation on three main areas: (a) the crater area and the paths leading to the crater of La Fossa, (b) the Village of Vulcano Porto, and (c) the historical Village of Piano. The first area primarily concerns tourists who visit the island to see the crater of Vulcano and remain for a few hours or days, with short exposure times. The other areas concern the inhabitants who live on the island, who could be affected by harmful gases due to longer exposure times. Moreover, to test the reliability of the generated SO2 dispersion maps, direct measurements of SO2 concentrations in the air at fixed points within inhabited areas of Vulcano Village, as well as measurements of SO2 concentrations along a fixed path, have been performed too.

2. Materials and Methods

2.1. Vulcano SO2 Network

In order to measure the gas emission rate from a volcano in real-time, the best method is passive remote sensing based on Differential Optical Absorption Spectroscopy (DOAS) [23,24]. This method is used for the quantification of different concentrations of trace gases and is based on the principles of absorption spectroscopy [25,26,27,28]. Ground-based scanning differential optical absorption spectrometry (Scan-DOAS) allows the quantification of volcanic SO2 and BrO emissions by collecting UV spectra using sunlight scattered from the sky [29,30].
ScanDOAS, built by Chalmers University of Technology (Sweden), consists of a conical scanning UV telescope with a 60-degree rotating window terminal, a focused optical fiber connected to a UV spectrometer, an embedded PC, a GPS, a timer, a WIFI system for near-real-time data transmission and a self-powered system with a photovoltaic panel and battery. Each measurement involves a complete scan from horizon to horizon (−90/+90 degrees) that is collected every 1–15 min, depending on lighting conditions. Details of the instrument and operating routines are reported by [31]. To estimate the gas emission rate from the volcano, Q, we apply mass balance within a volume in which the volcano is the only source. In differential form:
d (D)/dt + div (J) = q
where the first term is the time derivative of mass density D, the second term is the divergence of current density J = D ∗ V, where V is velocity, and q is the mass emission rate per volume from the volcano. The mass emission rate we integrate over a volume is defined by the scanning surfaces of the instruments. Assuming that no accumulation occurs within the volume and applying the divergence theorem, we get:
I ( C D ) v = Q
where I(CD) is the line integral of column densities CD, and v is the component of velocity orthogonal to the integration surface. The CDs are estimated from the DOAS analysis. To compute the integral, one needs to know the distance to the plume, which depends on viewing angles and the height of the plume relative to the instrument. The integral is approximated as a sum, and the index i refers to each scan angle (from −90 to 90 in user-selected steps, typically every 3.6 degrees). The equation that summarizes this flux calculation is [32]:
Q = h × c o s w d ϕ × 90 90 [ t a n ( α i + 1 ) t a n ( α i ) C D a v e i ]
where h is plume height, wd is wind direction, ϕ is azimuth of the scanner, αi is scan angle, and CDave is the average column density between two consecutive steps of the stepper motor of the scanner, from one horizon to the other. To improve the observation of volcanic degassing and to properly estimate SO2 fluxes at Vulcano Island, we installed the first UV Scanning-DOAS instrument in the Palizzi area (W side of the island, close to the active crater) in March 2008 and a second on the Porto di Levante area (NE side of the island), in February 2015. From each measuring station, the data were telemetered in real-time to the Vulcano Observatory by a wireless system. From the Vulcano Observatory, the data are then transmitted to the National Institute of Geophysics and Volcanology (INGV, Palermo) (Figure 1 and Figure 2).
Data from the Scan-DOAS were transmitted to the Observatory, where they were analyzed and archived. The program called NOVAC Post Processing Program (NovacPPP) was developed by [32]. allows, through a standardized methodology, the evaluation of the data collected from each station. Raw and analyzed data are archived on a server hosted in Gothenburg and mirrored in Brussels and Heidelberg. This server is accessible to the members of the network.

2.2. Air Dispersion Model

The AERMOD (Lakes Environmental™, Waterloo, ON, Canada; https://www.weblakes.com/ (accessed on 23 December 2024)) is a steady-state Gaussian air dispersion model that operates based on the planetary boundary layer (PBL) and is designed for short-range assessments (with a source-receptor distance of less than 50 km) from a given source [33]. Gaussian dispersion is defined by its normal distribution, allowing it to effectively simulate both the horizontal and vertical dispersion of a pollutant plume. The algorithm parameters, along with meteorological data, can define the vertical wind variation, wind structure, and turbulence profiles. Additionally, the AERMOD algorithm incorporates elements such as terrain effects, buoyancy, plume rise, and building downwash. However, it is important to note that AERMOD does not account for chemical reactions among atmospheric substances. The simulation of dispersion within the PBL (which extends from the earth’s surface up to 3 km) is crucial due to its direct interaction with the ground and its significant impact on the dispersion, emission, transport, and mixing of pollutants [34].
For the AERMOD model to operate, a complete emission inventory, including details on pollutant compounds and point sources, is essential. For this study, we utilized the SO2 inventory concentration and flux values acquired by the UV Scanning DOAS network. Additionally, the model demands specific parameters such as the source’s coordinates (latitude and longitude), elevation, gas temperature, duct diameter, and flow rate. After various tests, a 3 km radius was deemed optimal, minimizing errors related to the challenges posed by the complex terrain and the proximity to the coastline. The AERMOD system, including AERMET and AERMAP, accounts for terrain morphology and meteorological factors influencing contaminant dispersion and air quality. AERMET processes meteorological data, detailing surface conditions, mixed layers, and PBL turbulence. Currently, the model simulates concentrations at a level of 1.5 m AGL using the flagpole option (internal option of the same AERMOD model). This level has been used to simulate the human breathing rate in all the dispersion maps. The meteorological model requires inputs like wind speed and direction, cloud cover, air temperature, and more. It outputs parameters such as friction velocity, mixing height, convective velocity scale, and surface heat flux. Meteorological data (http://www.meteosystem.com/dati/vulcano/ (accessed on 23 December 2024)) of Vulcano Island were downloaded from Lentia station (Figure 1). AERMAP, a terrain pre-processor, creates receptor grids and models complex terrain using USGS Digital Elevation data (GeoTIFF format, 30 m resolution). It enhances AERMOD accuracy, particularly in mountainous regions. Further information on the dispersion model can be found in [20,33]. The AERMOD software (version 18.8.207) creates each map individually. It is not possible to enter data for different days, months, and years and report the same scale. For this reason, each map has its own scale.

2.3. Measurements of SO2 Concentrations in Air

Independent in situ measurements of atmospheric SO2 concentrations, obtained using a Thermo®450i pulsed fluorescence analyzer (Thermo Fisher Scientific Inc., Hanna-Kunath street 11, 28199 Bremen, Germania), were conducted to complement and compare with estimates derived from atmospheric dispersion models [35]. The instrument operates on the SO2 absorption of pulsating ultraviolet (UV) light generated by a fluorescence chamber, followed by excitation and UV emission at a different wavelength that reaches the detector (photomultiplier tube) and that is proportional to the SO2 concentration -. A hydrocarbon kicker removes hydrocarbons while allowing SO2 molecules to pass through undisturbed [35]. The instrument has a standard operative flux of 1 L/min and provides average concentrations calculated using data measured over a defined period (i.e., 60 s). The detection limit is 5.2 μg/m3, the linearity is ±1%, and the zero drift over 24 h is <2.6 μg/m3 [35]. A high-capacity gel battery has to be connected to the instrument through an AC/DC converter to meet the power requirements.
Continuous SO2 measurements using the Thermo®analyzer were performed both at fixed points (Figure 1) and along a pathway selected by considering the potential contaminant sources inside the study area. In the latter case, the instrument was placed on a car moving at an average speed < 10 km/h with no interferences of the exhaust gases. A GPS (Garmin® GPSMAP 62) synchronized with the Thermo®analyzer then allowed each SO2 measurement to be associated with a geographic position 37. The established route for the atmospheric SO2 measurements started from Vulcanello and went through the inhabited Vulcano village, then passed around the southwest flank of the volcano, and finally through the inhabited Piano village. The pathway was repeated on different days (keeping the start and end time approximately the same) or within the same day (morning vs. evening) in order to better appreciate possible daily variations in SO2 distribution.

2.4. Environmental Parameters Network and 2008_2024 Dataset

In 2008, a local environmental parameter network was installed on Vulcano Island to facilitate and improve the analysis, filtering, and processing of raw summit SO2 flux data monitored using the UV Scanning-DOAS network, along with atmospheric chemical composition measurements conducted with the Thermo® analyzer. The main weather station, used to process the data provided by UV scanning DOAS, was installed on Lentia Hill (Figure 1) at an altitude comparable to that of the Fossa crater (190 m a.s.l.). This location ensured the same exposure to the main wind directions and the absence of any physical barrier between the sensor positions and the fumarole field of the La Fossa cone, allowing acquisation the best local weather variable suitable for DOAS measurements to extrapolate the real flux of SO2. The “Lentia” Davis weather station model Vantage Pro2 measures the following variables: wind speed and direction, precipitation, air temperature, relative humidity, infrared radiation, and UV radiation (Figure 1). The environmental parameters network has been integrated with a second weather station installed in the automatic soil CO2 flux station VSCS, located in the summit area of the crater located 150 m outside of the fumarolic field. The anemometer used is a Wind-Sonic Gill ultrasonic wind sensor, which is ideal considering the adverse conditions found in the Vulcano crater area, having no moving parts that wear out and being robust and corrosion-resistant. Local wind monitoring is crucial because any misestimation of wind speed and propagation direction results in underestimation or overestimation of the flux measurement.
For these reasons, we used wind data from our environmental parameter network (Lentia and VSCS in Figure 1 and Figure 2). In addition, a visible camera (MOBOTIX M25 Res. 1280 × 720 HD) was installed in 2016 on the roof of the Carapezza volcanological center facing the summit of the volcano, and a daily time-lapse was recorded with 5 min frames. This provided a view of both the direction and height of the plume, which is useful for processing the data of the slant column density of SO2 to be multiplied by wind speed. Furthermore, the visual information acquired by the visible camera allowed us to estimate the plume’s altitude and confirm the plume’s direction.
The impressive data set acquired over the last 17 years (2008–2024) was statistically elaborated to establish the dominant winds on Vulcano Island and their average intensity (Figure 3). These local atmospheric data are essential to develop a dispersion map of volatiles and define the areas at risk for human health and the periods in which increases occur beyond the threshold limits allowed by the health guidelines.
It is evident that the winds blowing from NE and ENE are the most frequent in this area. Together with the winds blowing from west (W to NW), they represent the dominant winds on Vulcano Island, accounting for around 80% of the total frequency (“Grecale”, “Maestrale”, and “Ponente”), and generally exhibit stronger wind speeds. In contrast, the winds blowing from the south (SE to SW) are the least frequent, representing less than 10% of the total (“Libeccio” and “Scirocco”).

3. Results

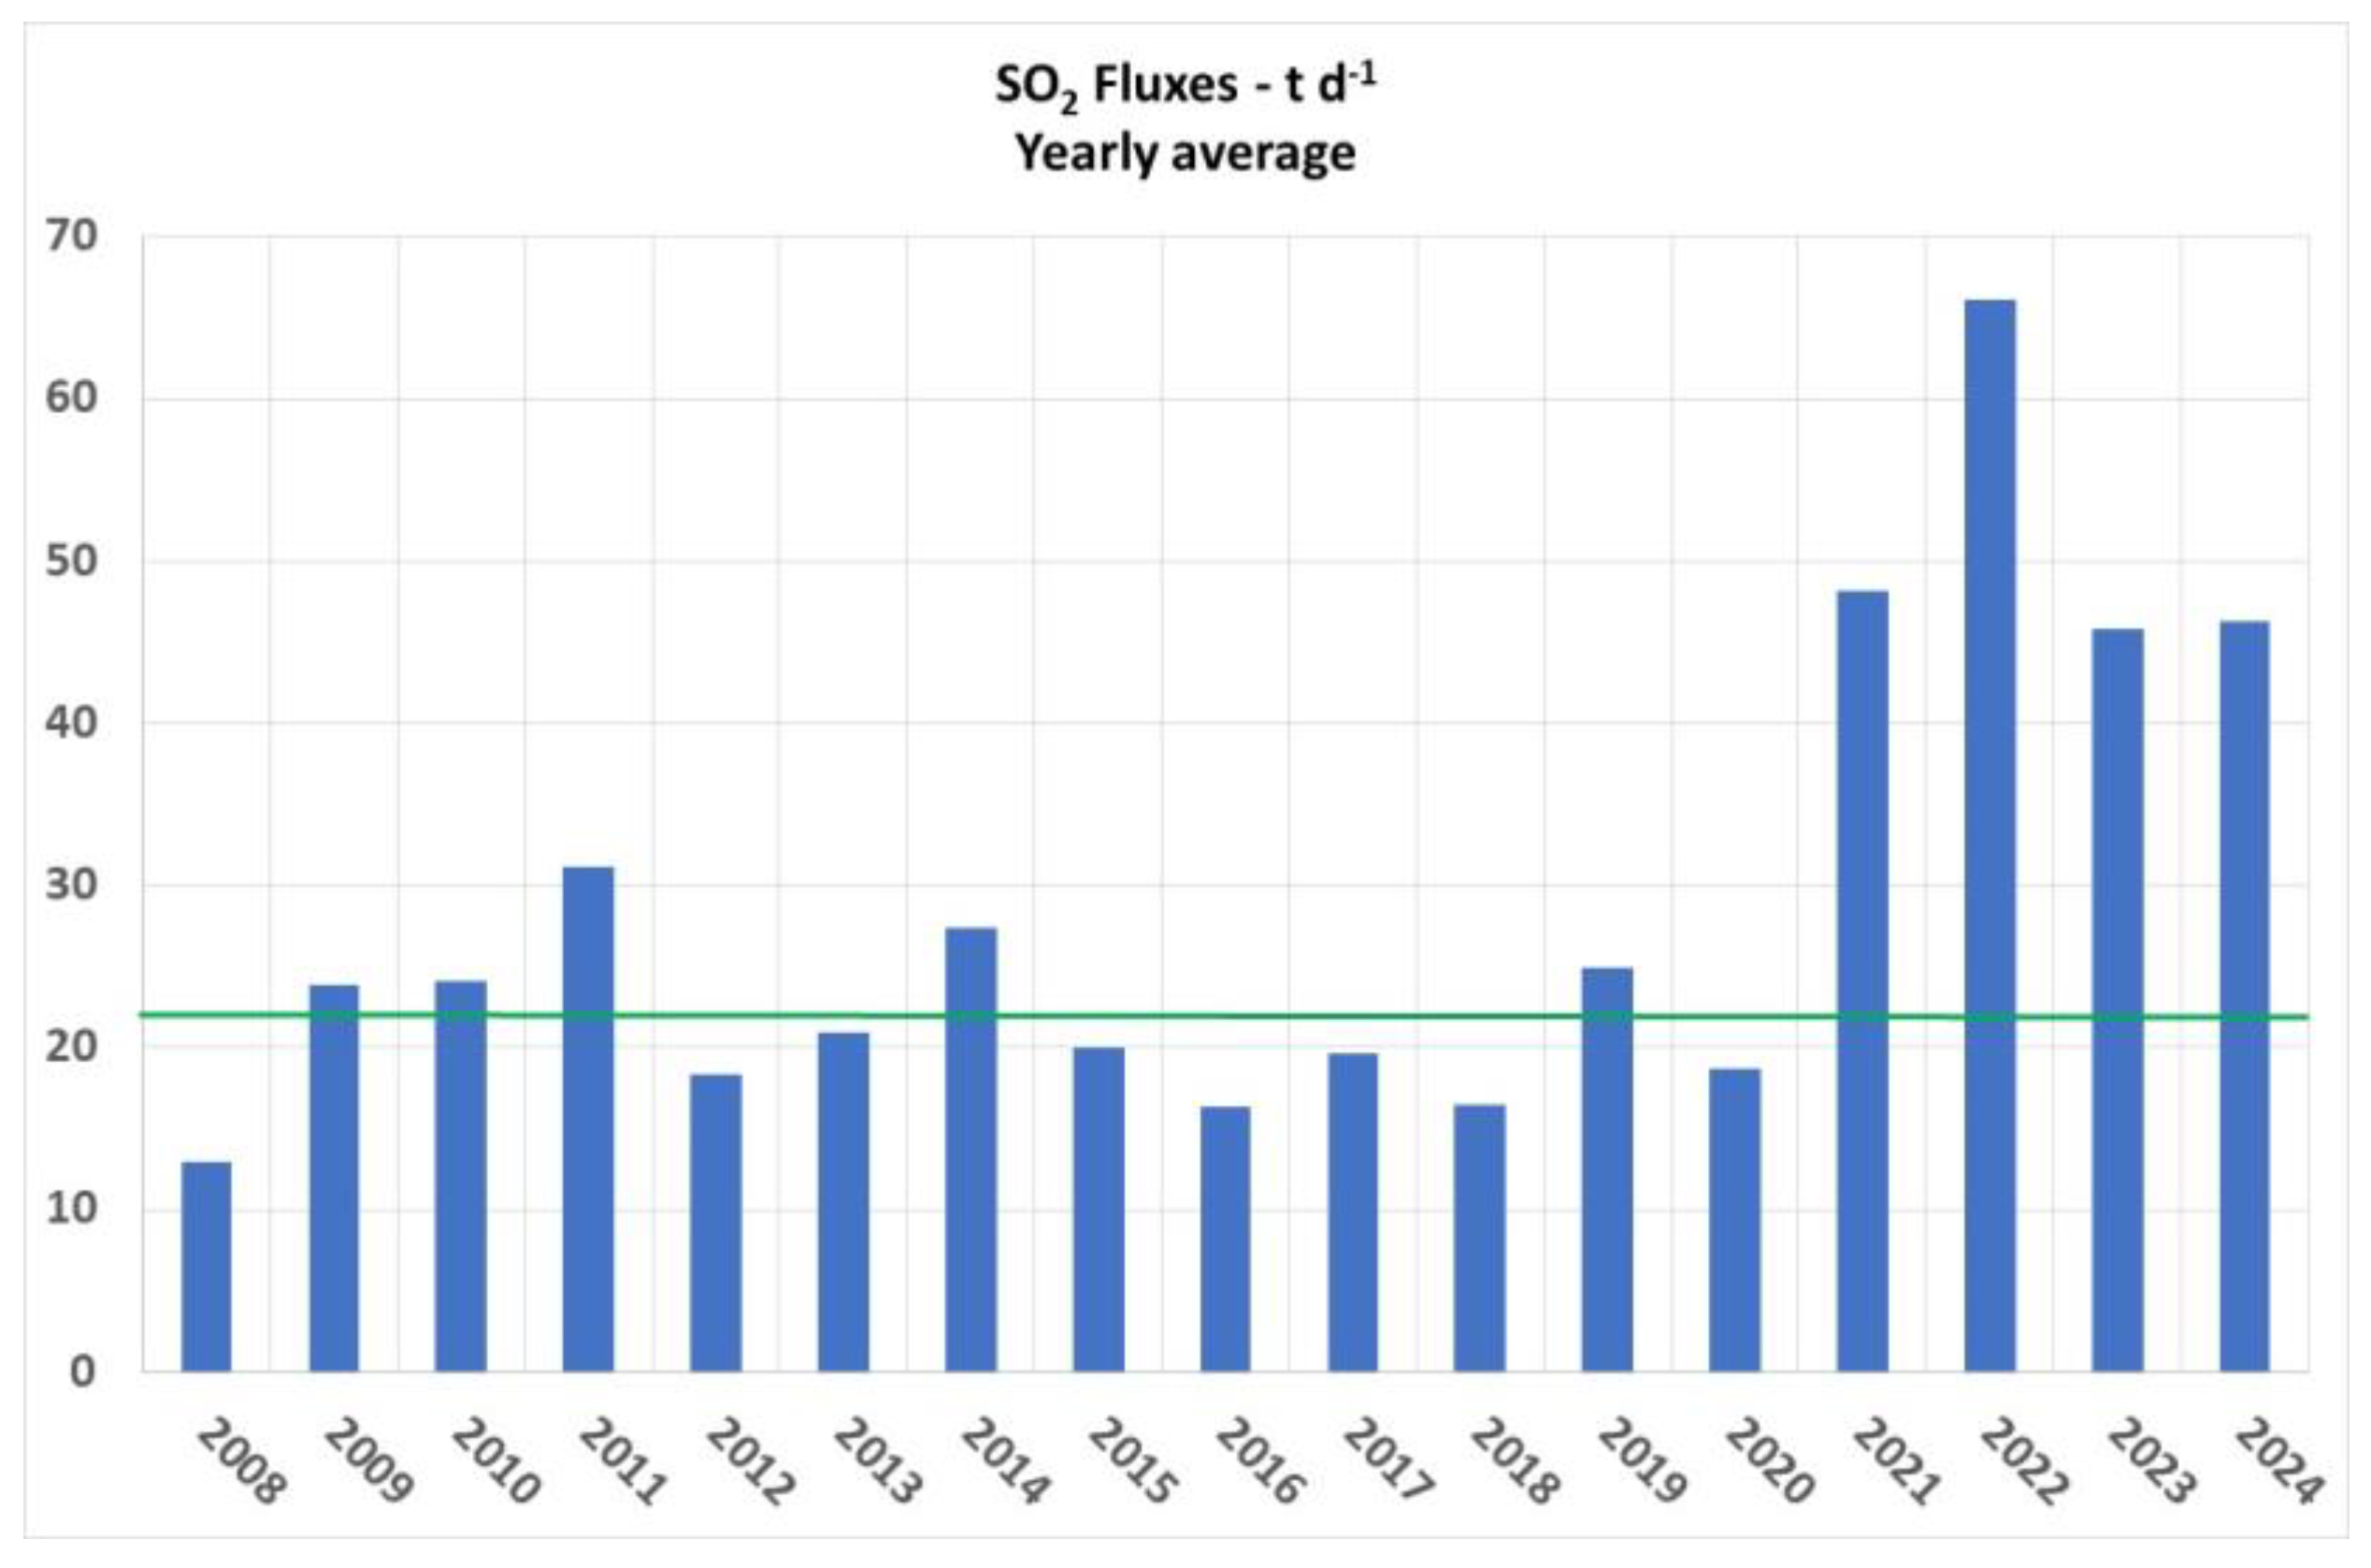
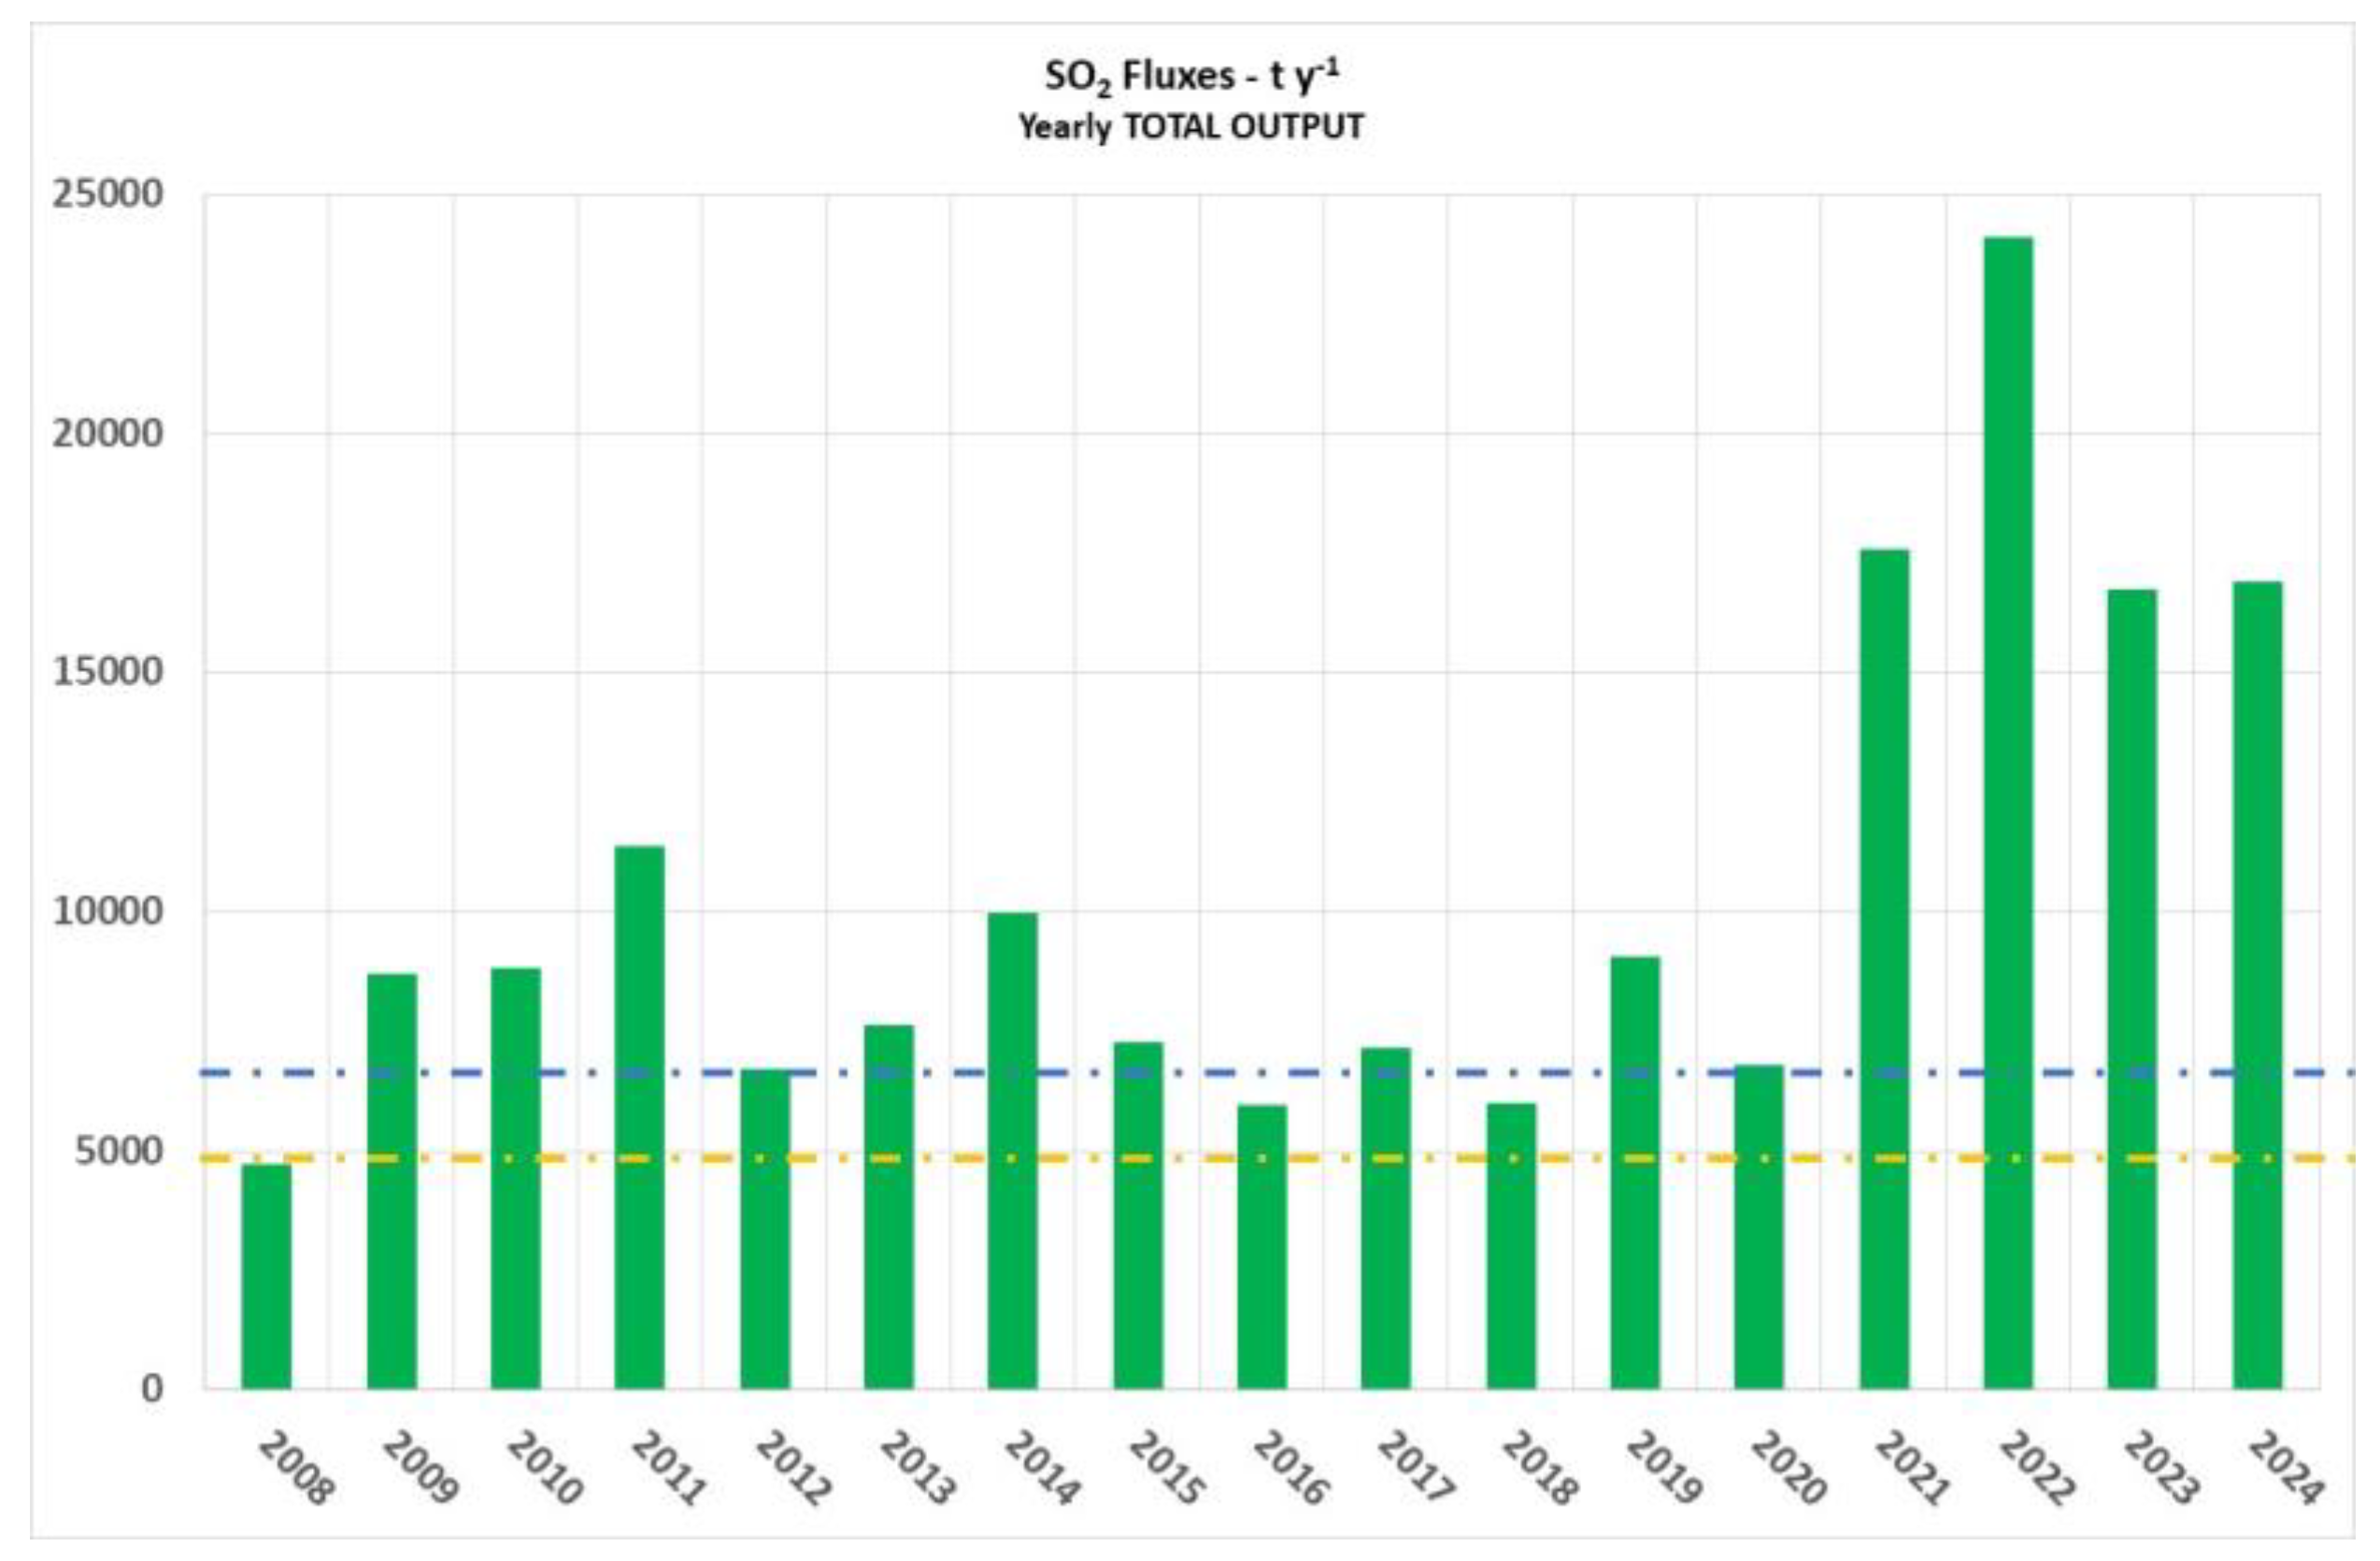
3.1. Near Real-Time Monitoring of SO2 Solfataric Clouds (2008–2024)

The complete dataset of SO2 flux from 2008 to 2024, acquired with the UV-Scanning DOAS network, is reported in Figure 4. This graphic shows background values around 26 t d−1 from 2010 to May 2021 and four degassing unrest periods recorded in 2009, 2021, 2023, and 2024. The first and lowest degassing unrest occurred in 2009, with maximum values around 100 t d−1, while the strongest SO2 output reached up to 250 t d−1 in 2021. Subsequently, two other degassing unrests were observed in 2023 and 2024, with maximum values of 180 and 140 t d−1 of SO2, respectively. After the last degassing unrest of 2024, the average daily values of SO2 output remained around 40 t d−1, higher than the background values of 26 t d−1 recorded during the 2010–2021 period.

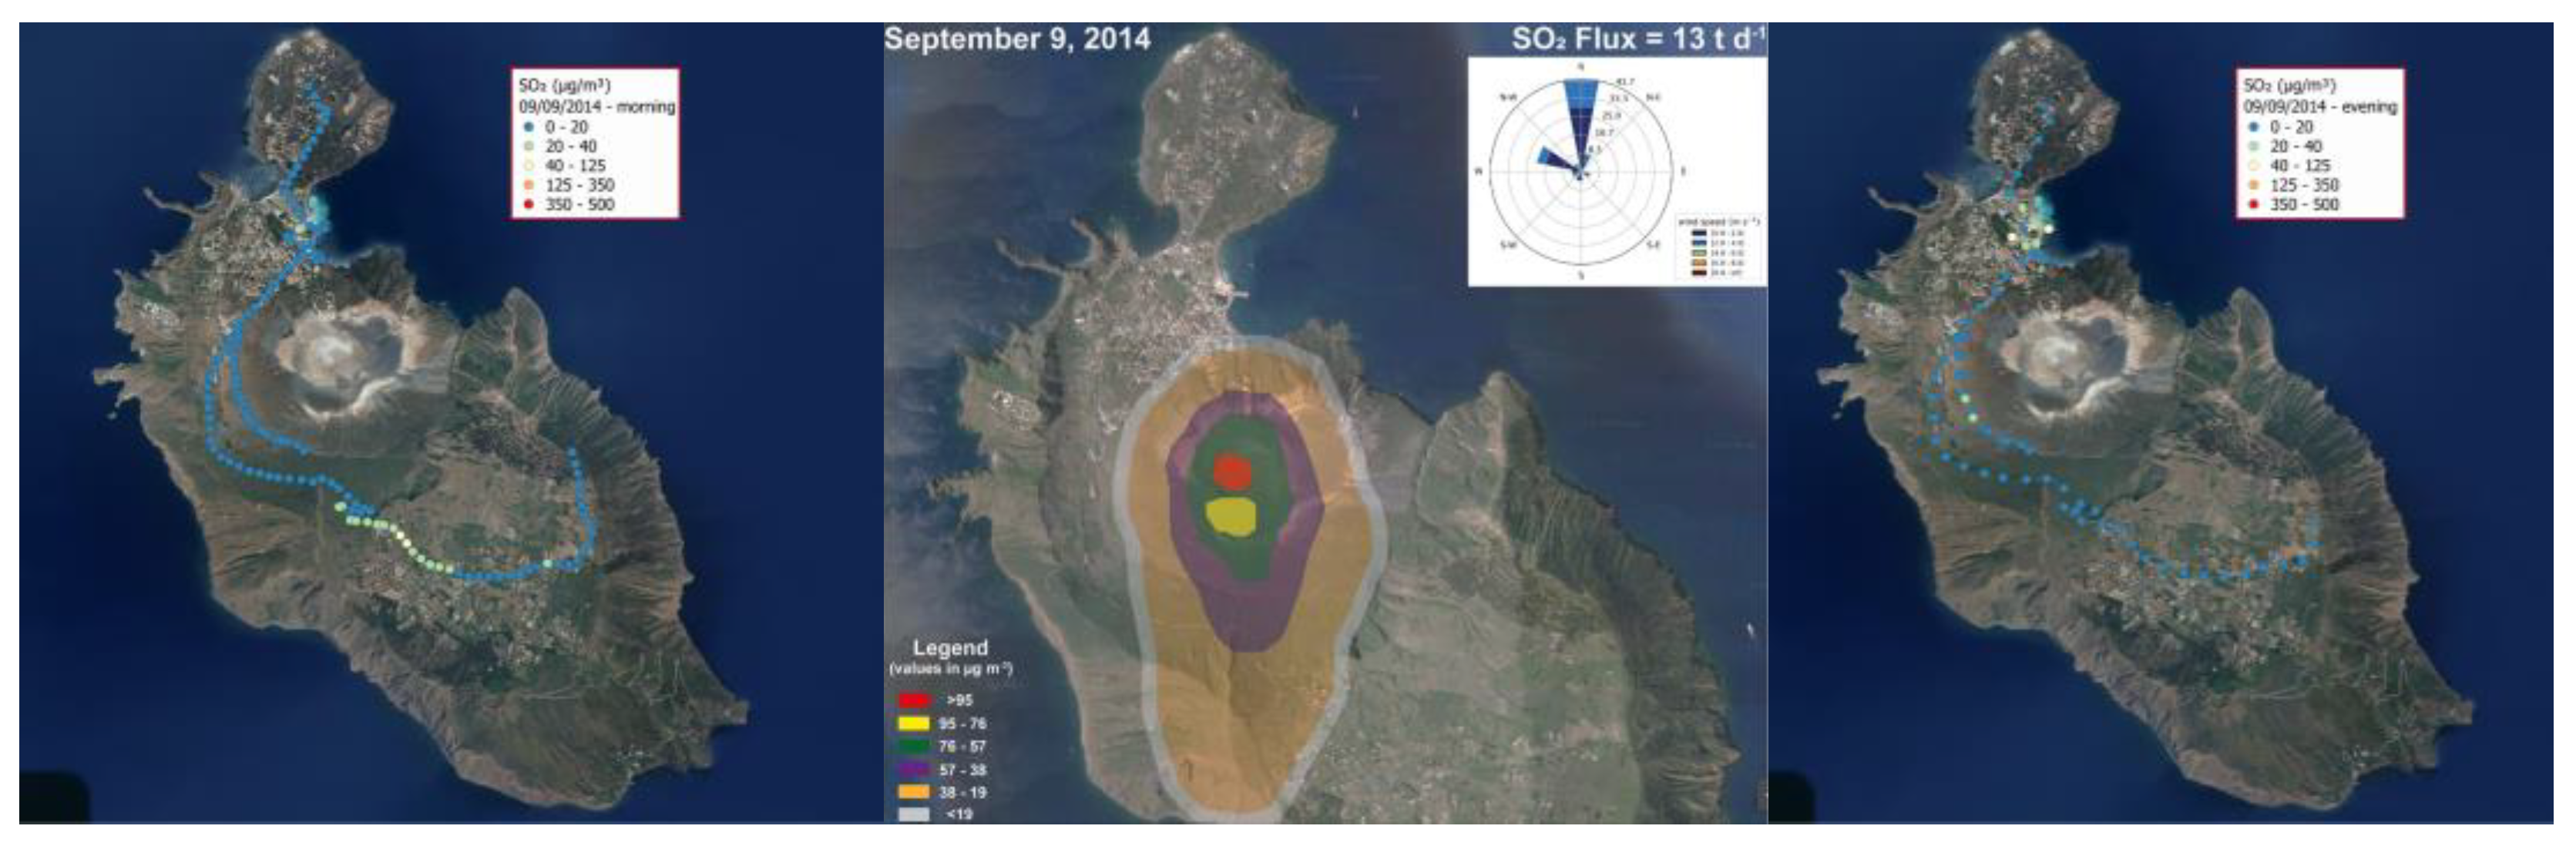
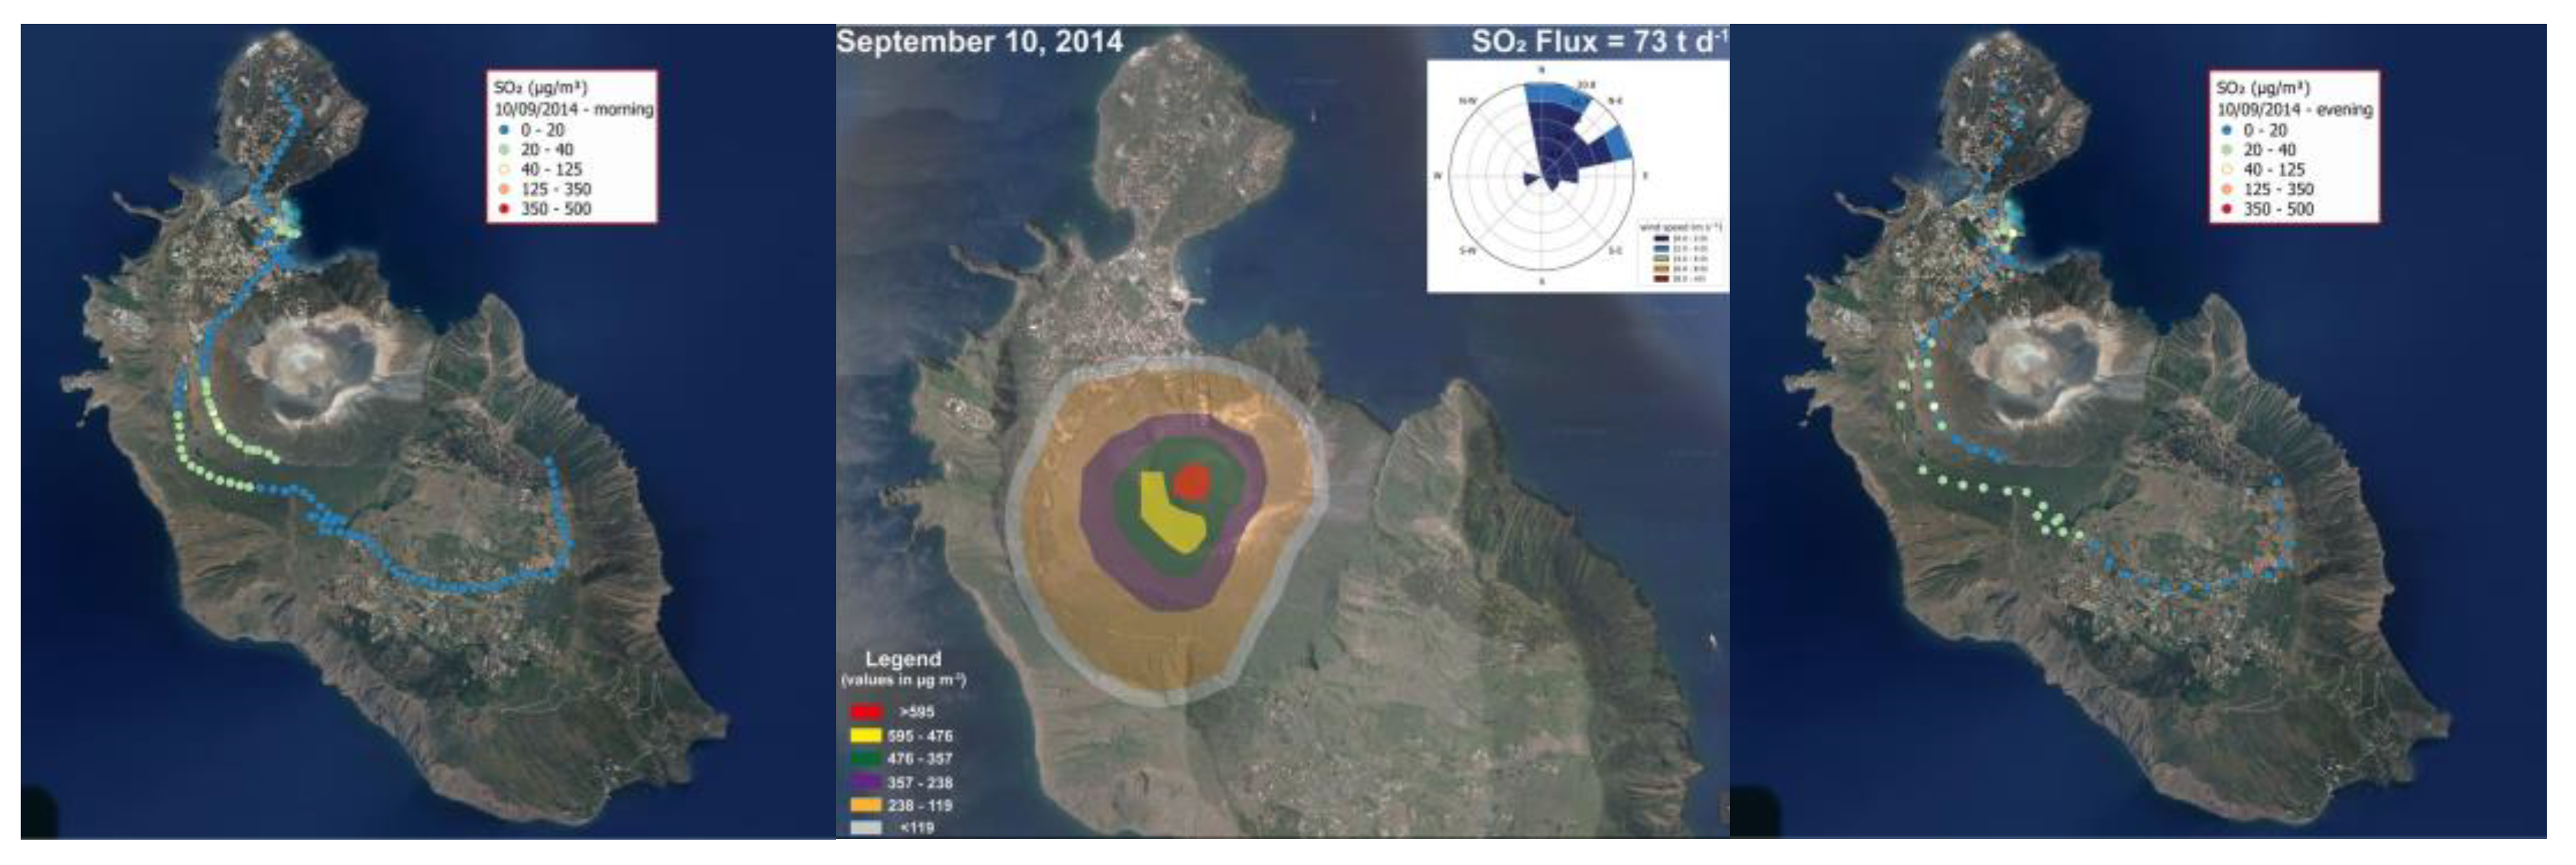
3.2. SO2 Dispersion Maps

Utilizing the AERMOD software model, we realized the SO2 dispersion maps of the quiet period relative to the (i) normal degassing background of SO2 fluxes recorded in the 2010_2021 and (ii) the unrest degassing periods recorded in the 2009, 2021, and 2024.

3.2.1. SO2 Degassing Unrest (2009)

In 2009, starting from a base value of 23 t d−1 of SO2, we observed the first strong increase of SO2 degassing from the summit crater area that showed fluxes values up to 100 t d−1 in October–November. This increase was characterized by a short time life from July 2009 to January 2010. After this increase, we observed a decrease in the values of SO2 fluxes that, despite little oscillation, remained around average values of 26 t d−1 up to June 2021.
To investigate the SO2 dispersion in the atmosphere, we realize two dispersion maps (Figure 5), the first during the normal degassing activity in the 2008–2009 period before the abrupt increase (23 t d−1) and the other one including the maximum value (100 t d−1) reached in October-November 2009. The monthly average of the atmospheric parameters like wind speed and dominant wind direction in the observed period have been utilized. In the map with normal degassing, we observed SO2 iso-concentrations in the atmosphere from <82 to >302 µg/m3, respectively, for the Vulcano village area and inner crater area. In the other map realized utilizing the maximum values of 100 t d−1, the SO2 values were instead between <320 and >1310 µg/m3, respectively.

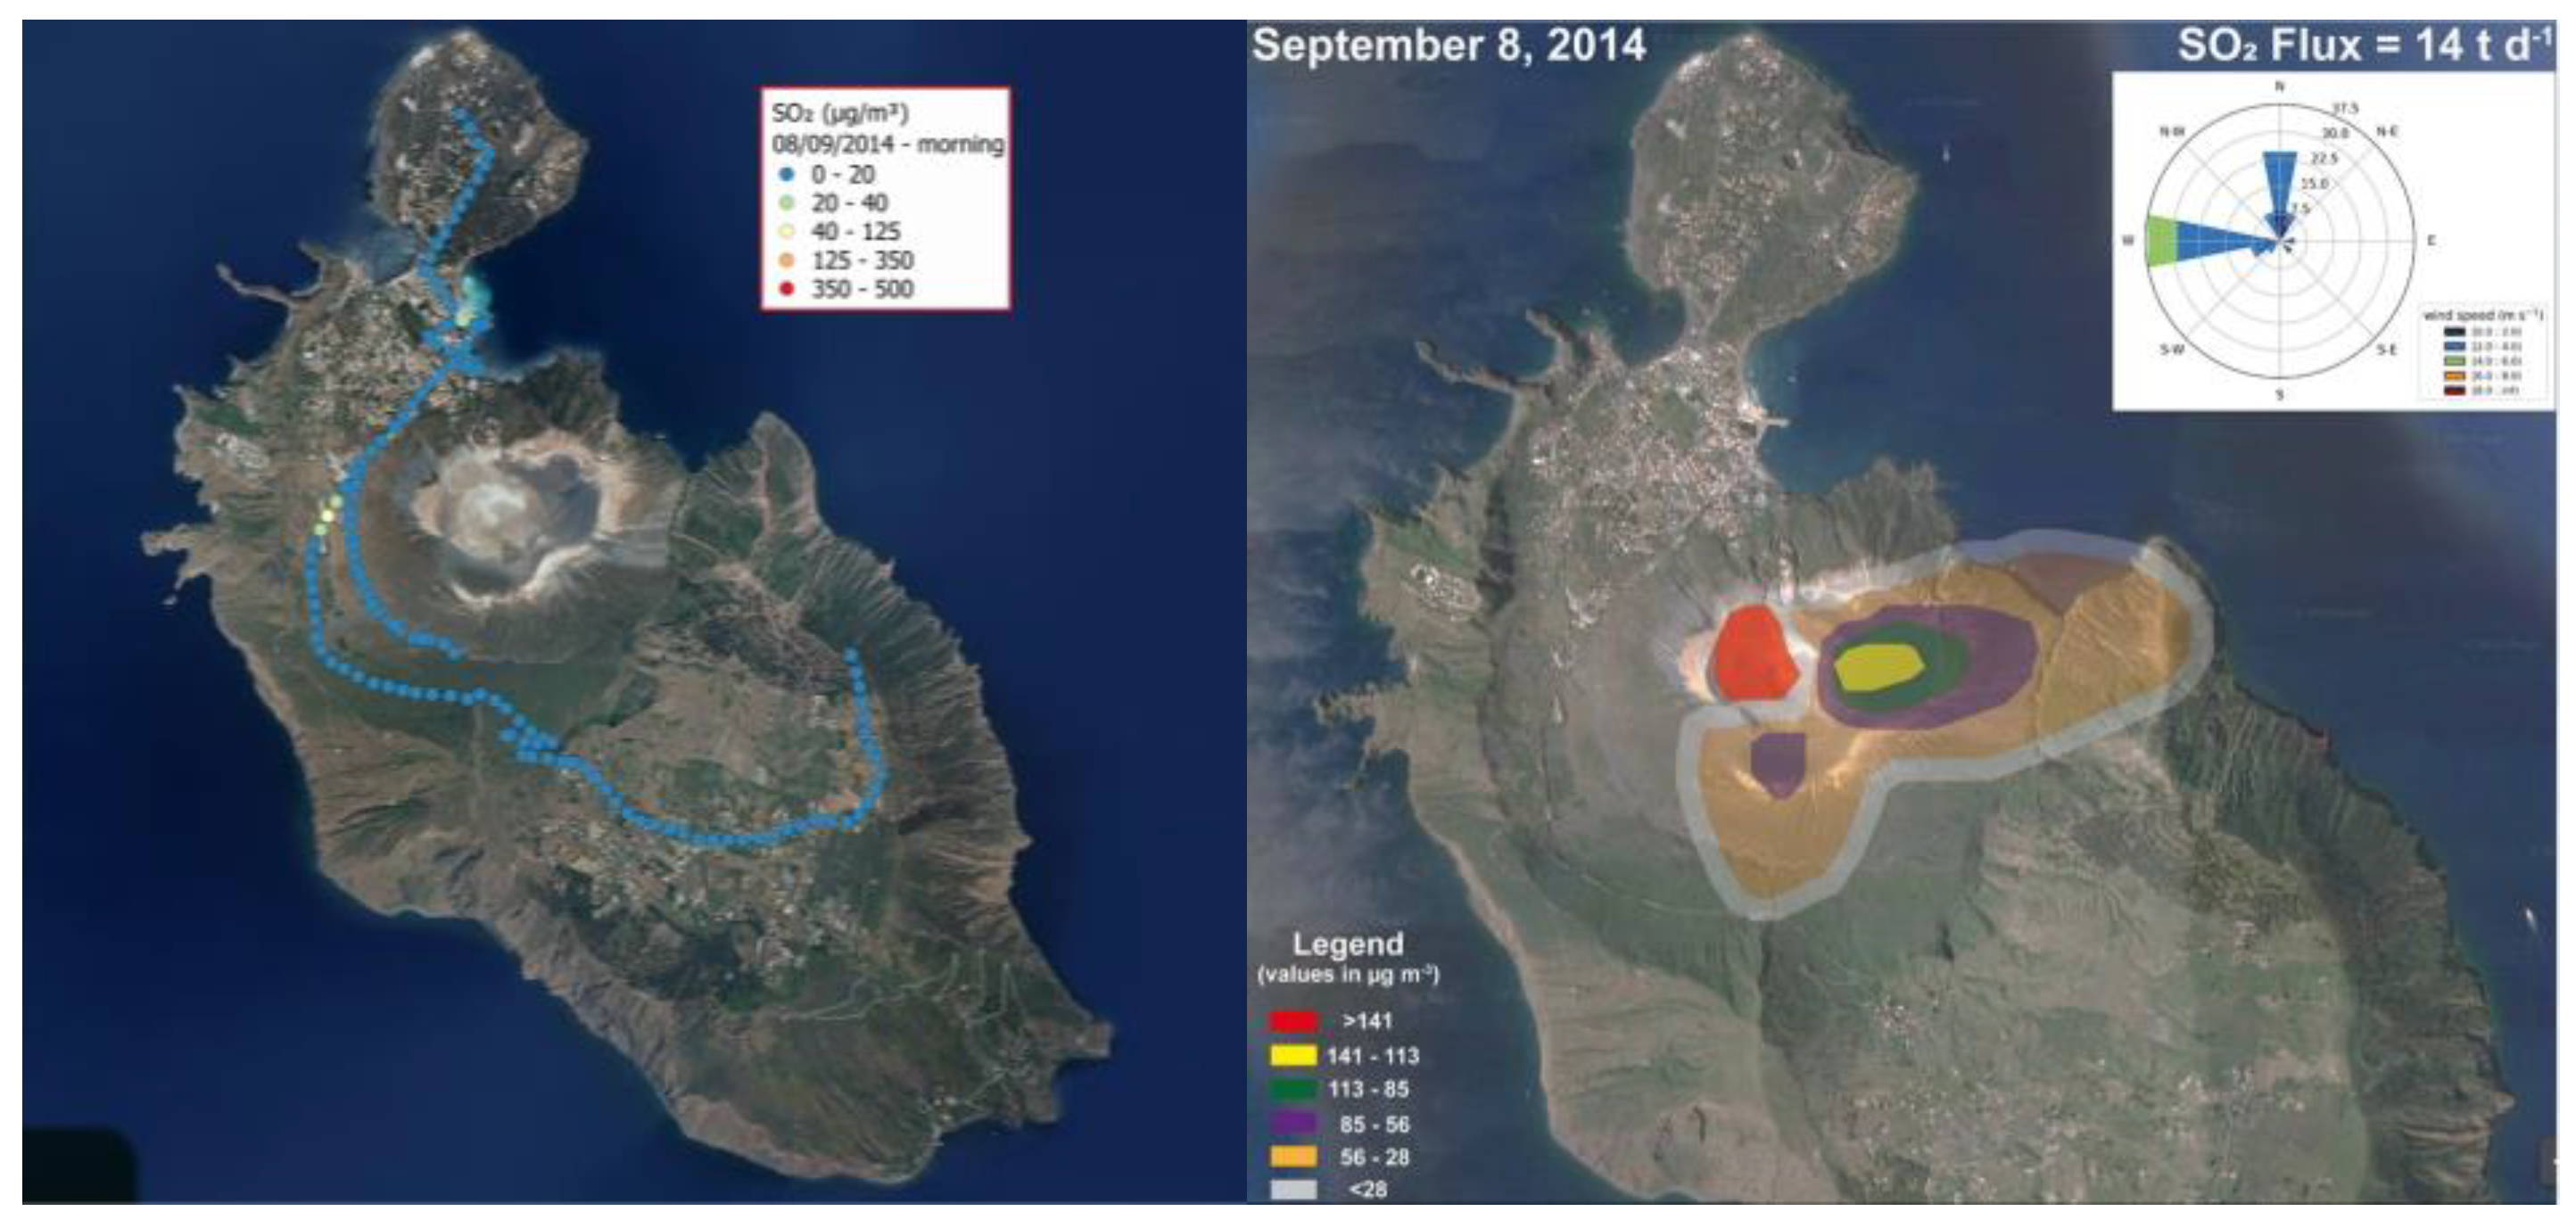
3.2.2. SO2 Normal Degassing (2010–2021)

To define the concentration of SO2 in the atmosphere during the quiet inter-period characterized by the normal degassing activity, a dispersion map of SO2 was constructed based on the data acquired from 2010 to May 2021 (Figure 6). We observed SO2 iso-concentration between <96 and >582 µg/m3, respectively, for the Vulcano village area and the inner crater area. The SO2 dispersion map made for this long period (January 2010–May 2021) clearly shows that the effects of SO2 in the atmosphere due to the prevailing W-NE winds do not affect the Vulcano and Piano village area for long periods of the year.

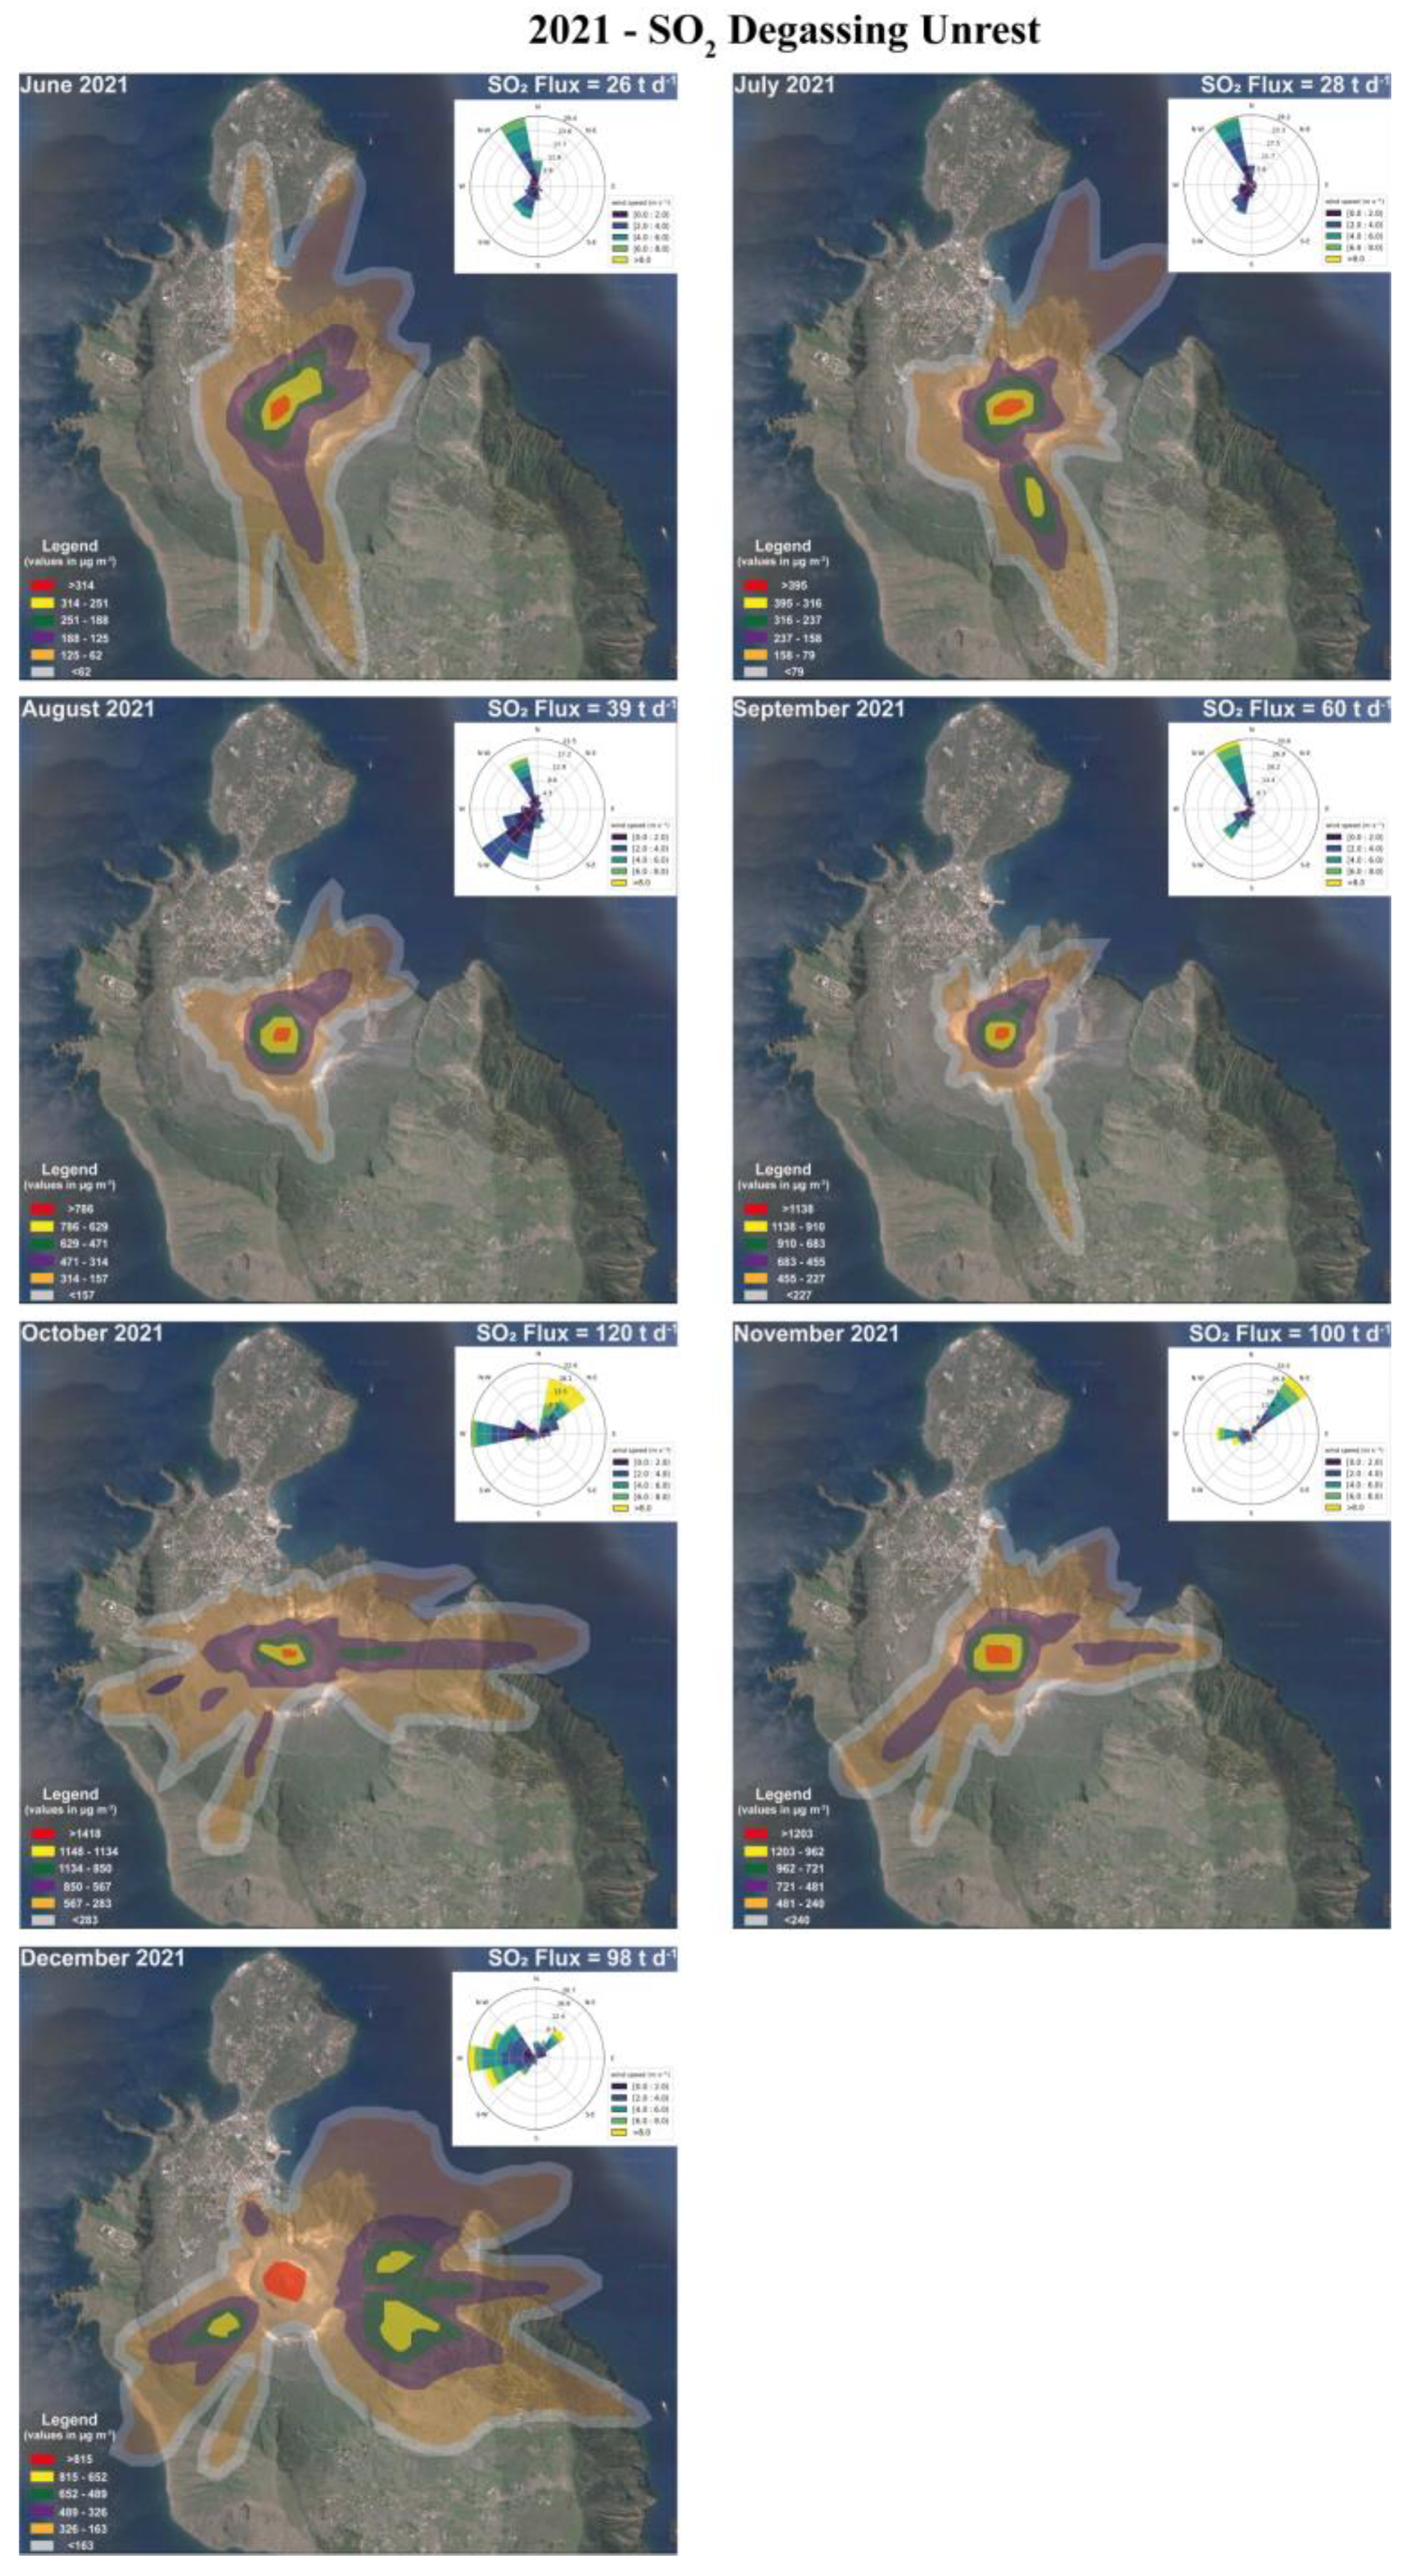
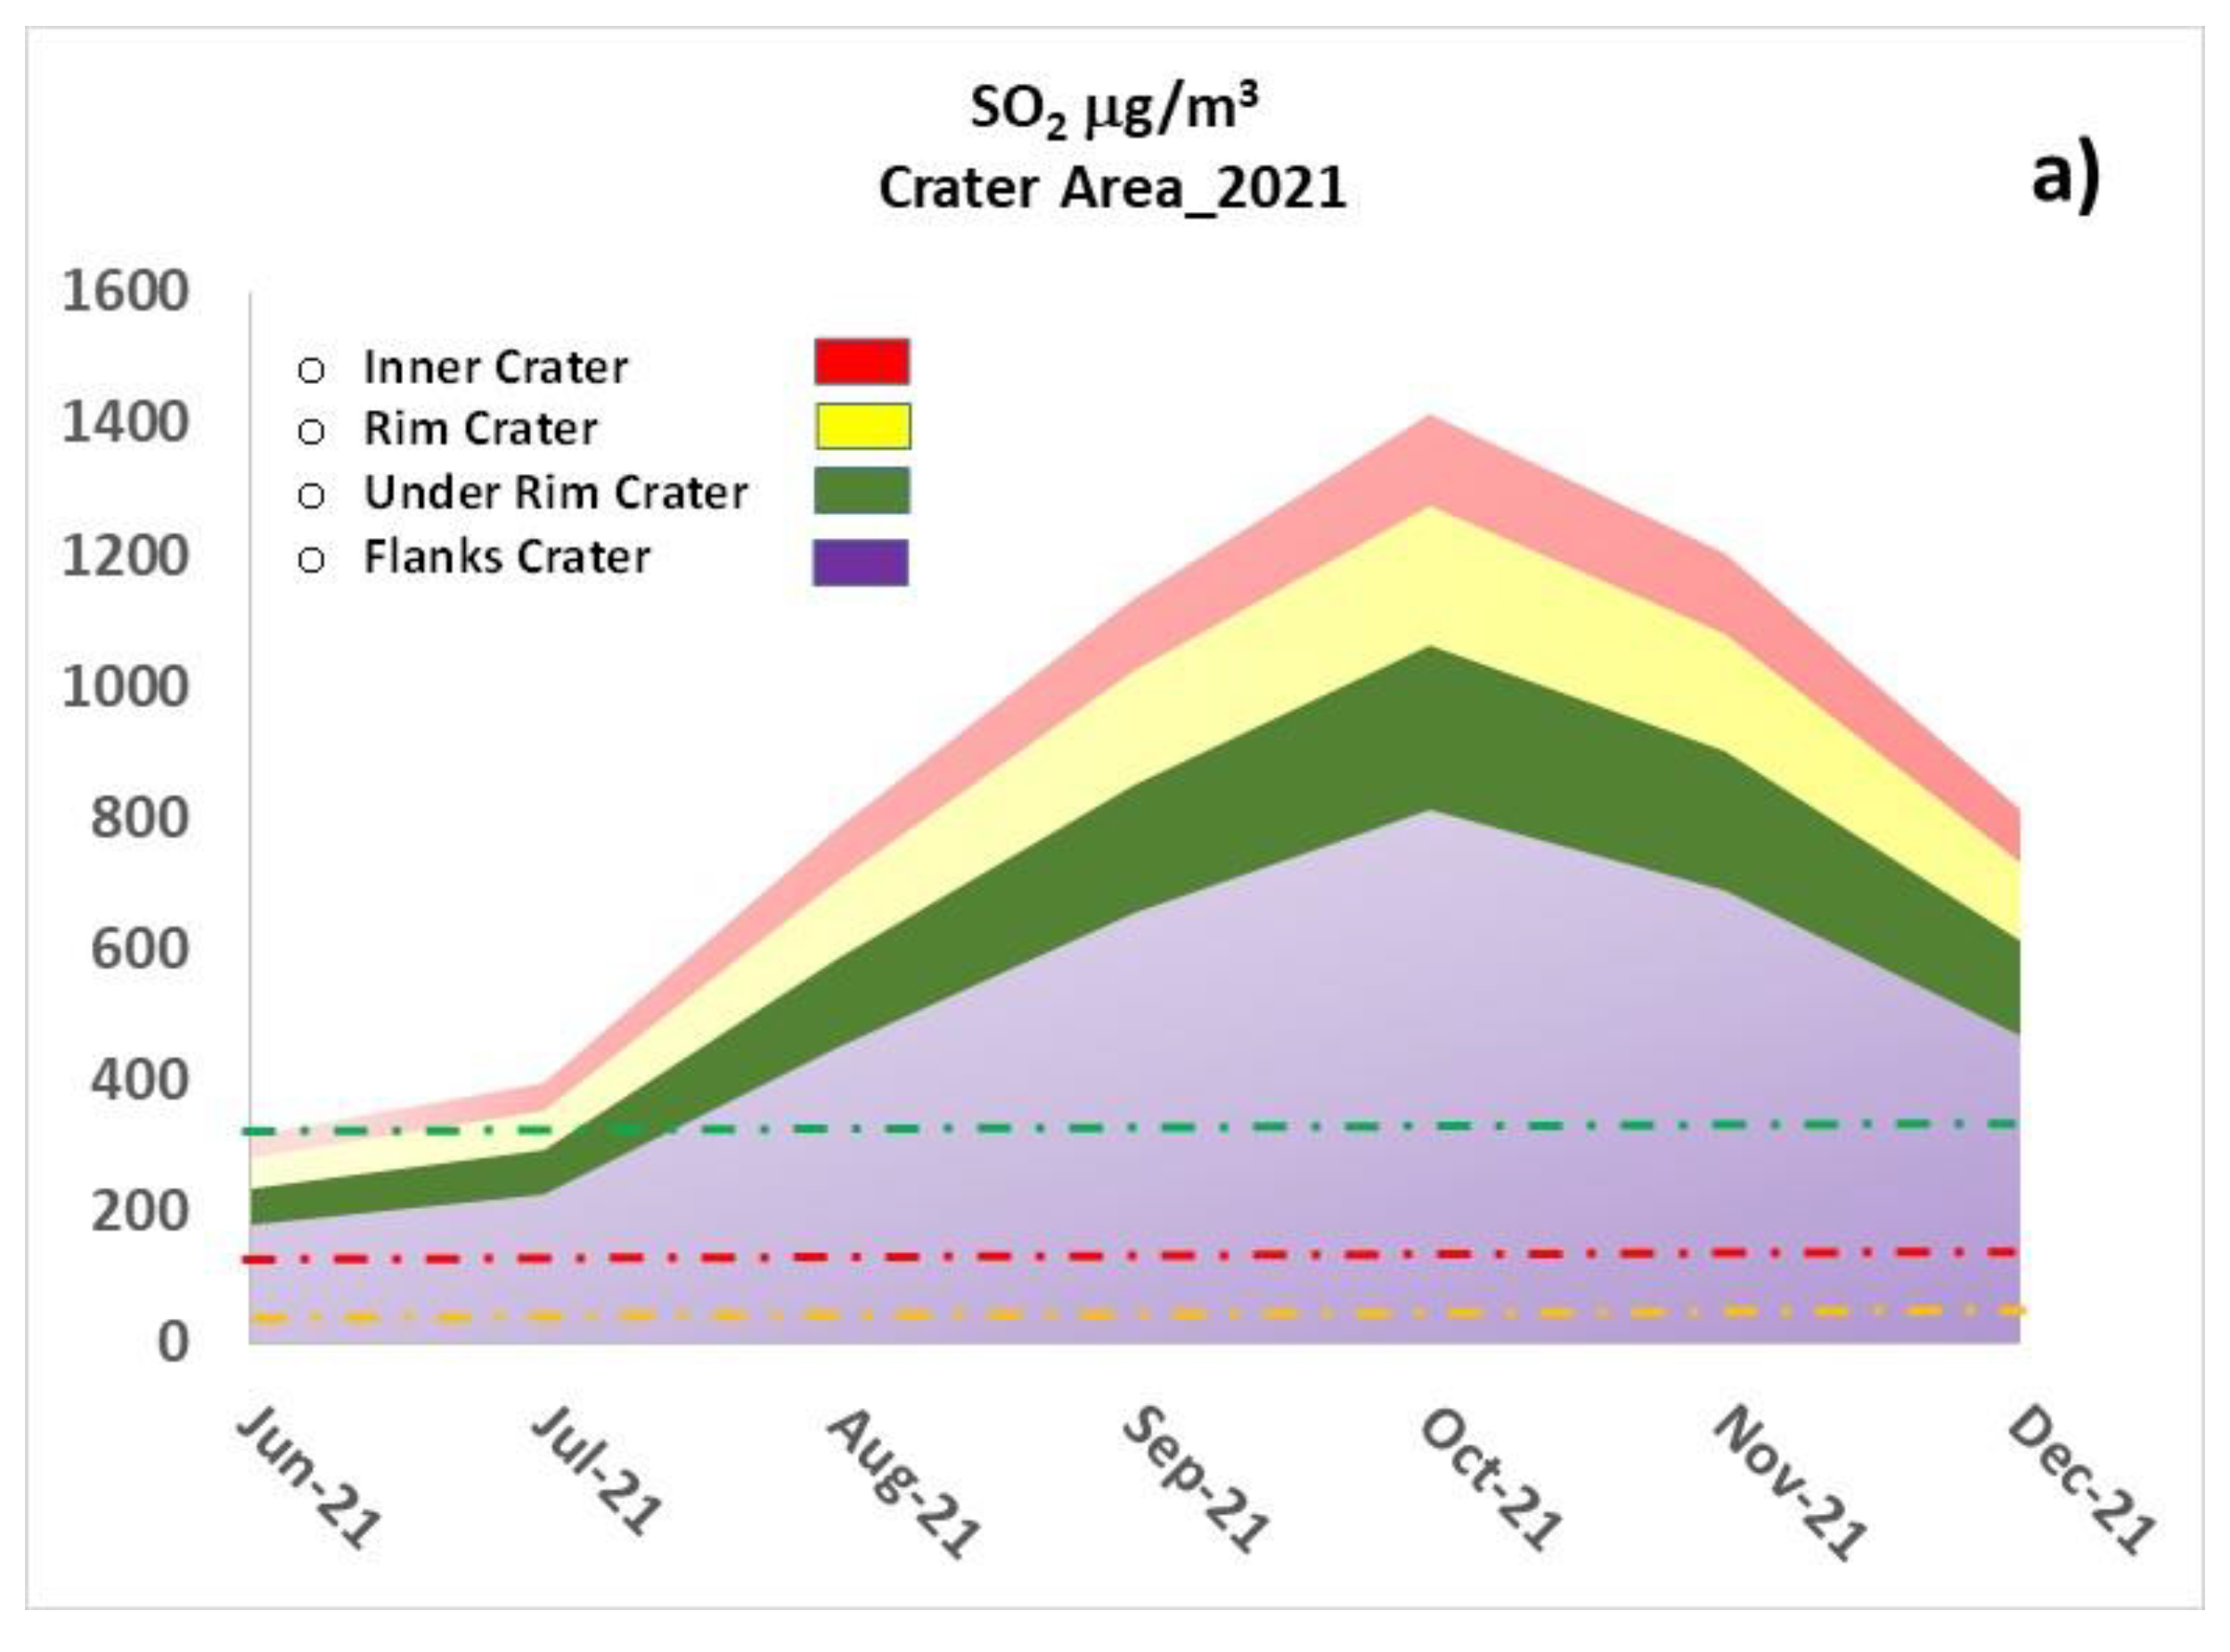
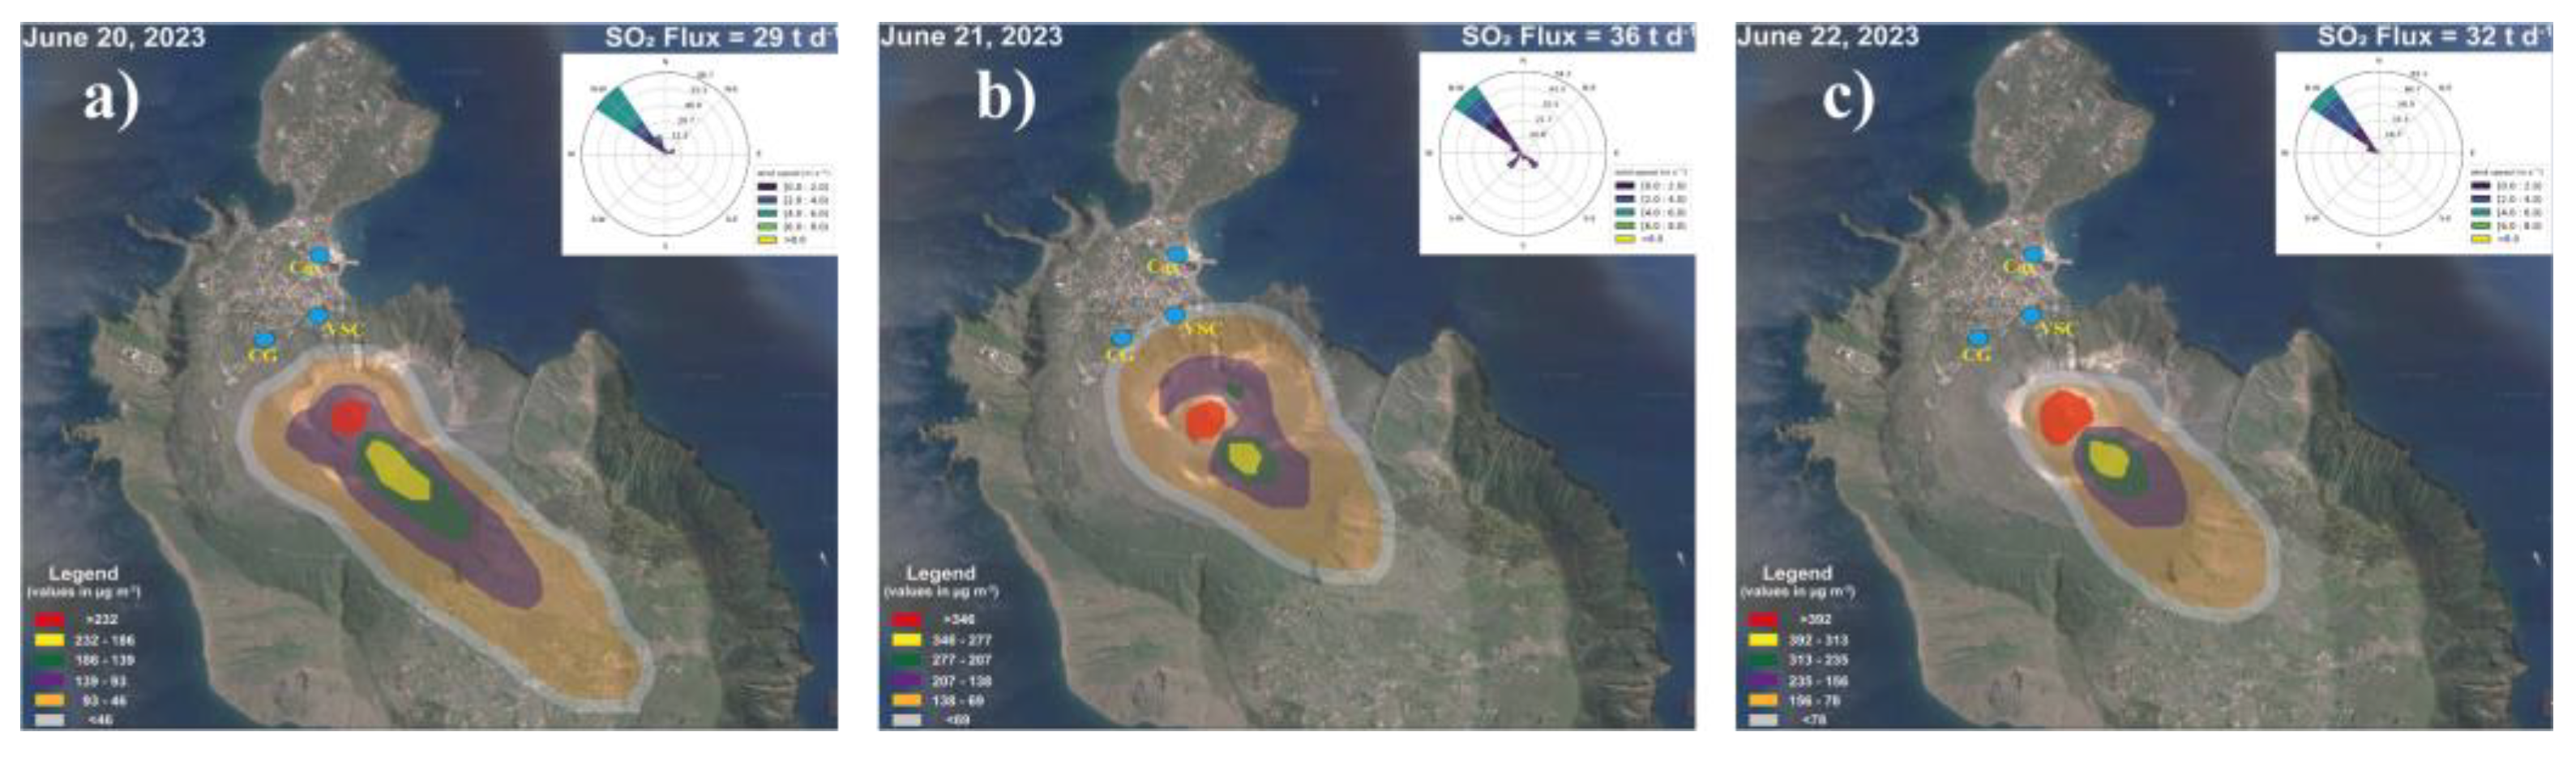
3.2.3. SO2 Degassing Unrest (2021)

Considering the awakening of the summit degassing, which occurred in 2021, we have processed the average monthly data of the SO2 flux to estimate the iso-concentration of SO2 in the crater area and in the adjacent areas affected by the plume movement as a function of the average monthly winds.
The first signs of the increase in the SO2 flux were recorded in the month of June, and a maximum monthly average value of 120 t d−1 was measured in October (Figure 7). Subsequently, the data showed a slight decrease with values of 99 t d−11 in the month of December.
As shown in the monthly maps of SO2 dispersions realized from June to December 2021 (Figure 7), the SO2 concentration in the crater area was from <62 to >314 µg/m3 and from <283 to >1418 µg/m3 in June and October, respectively (Figure 6).

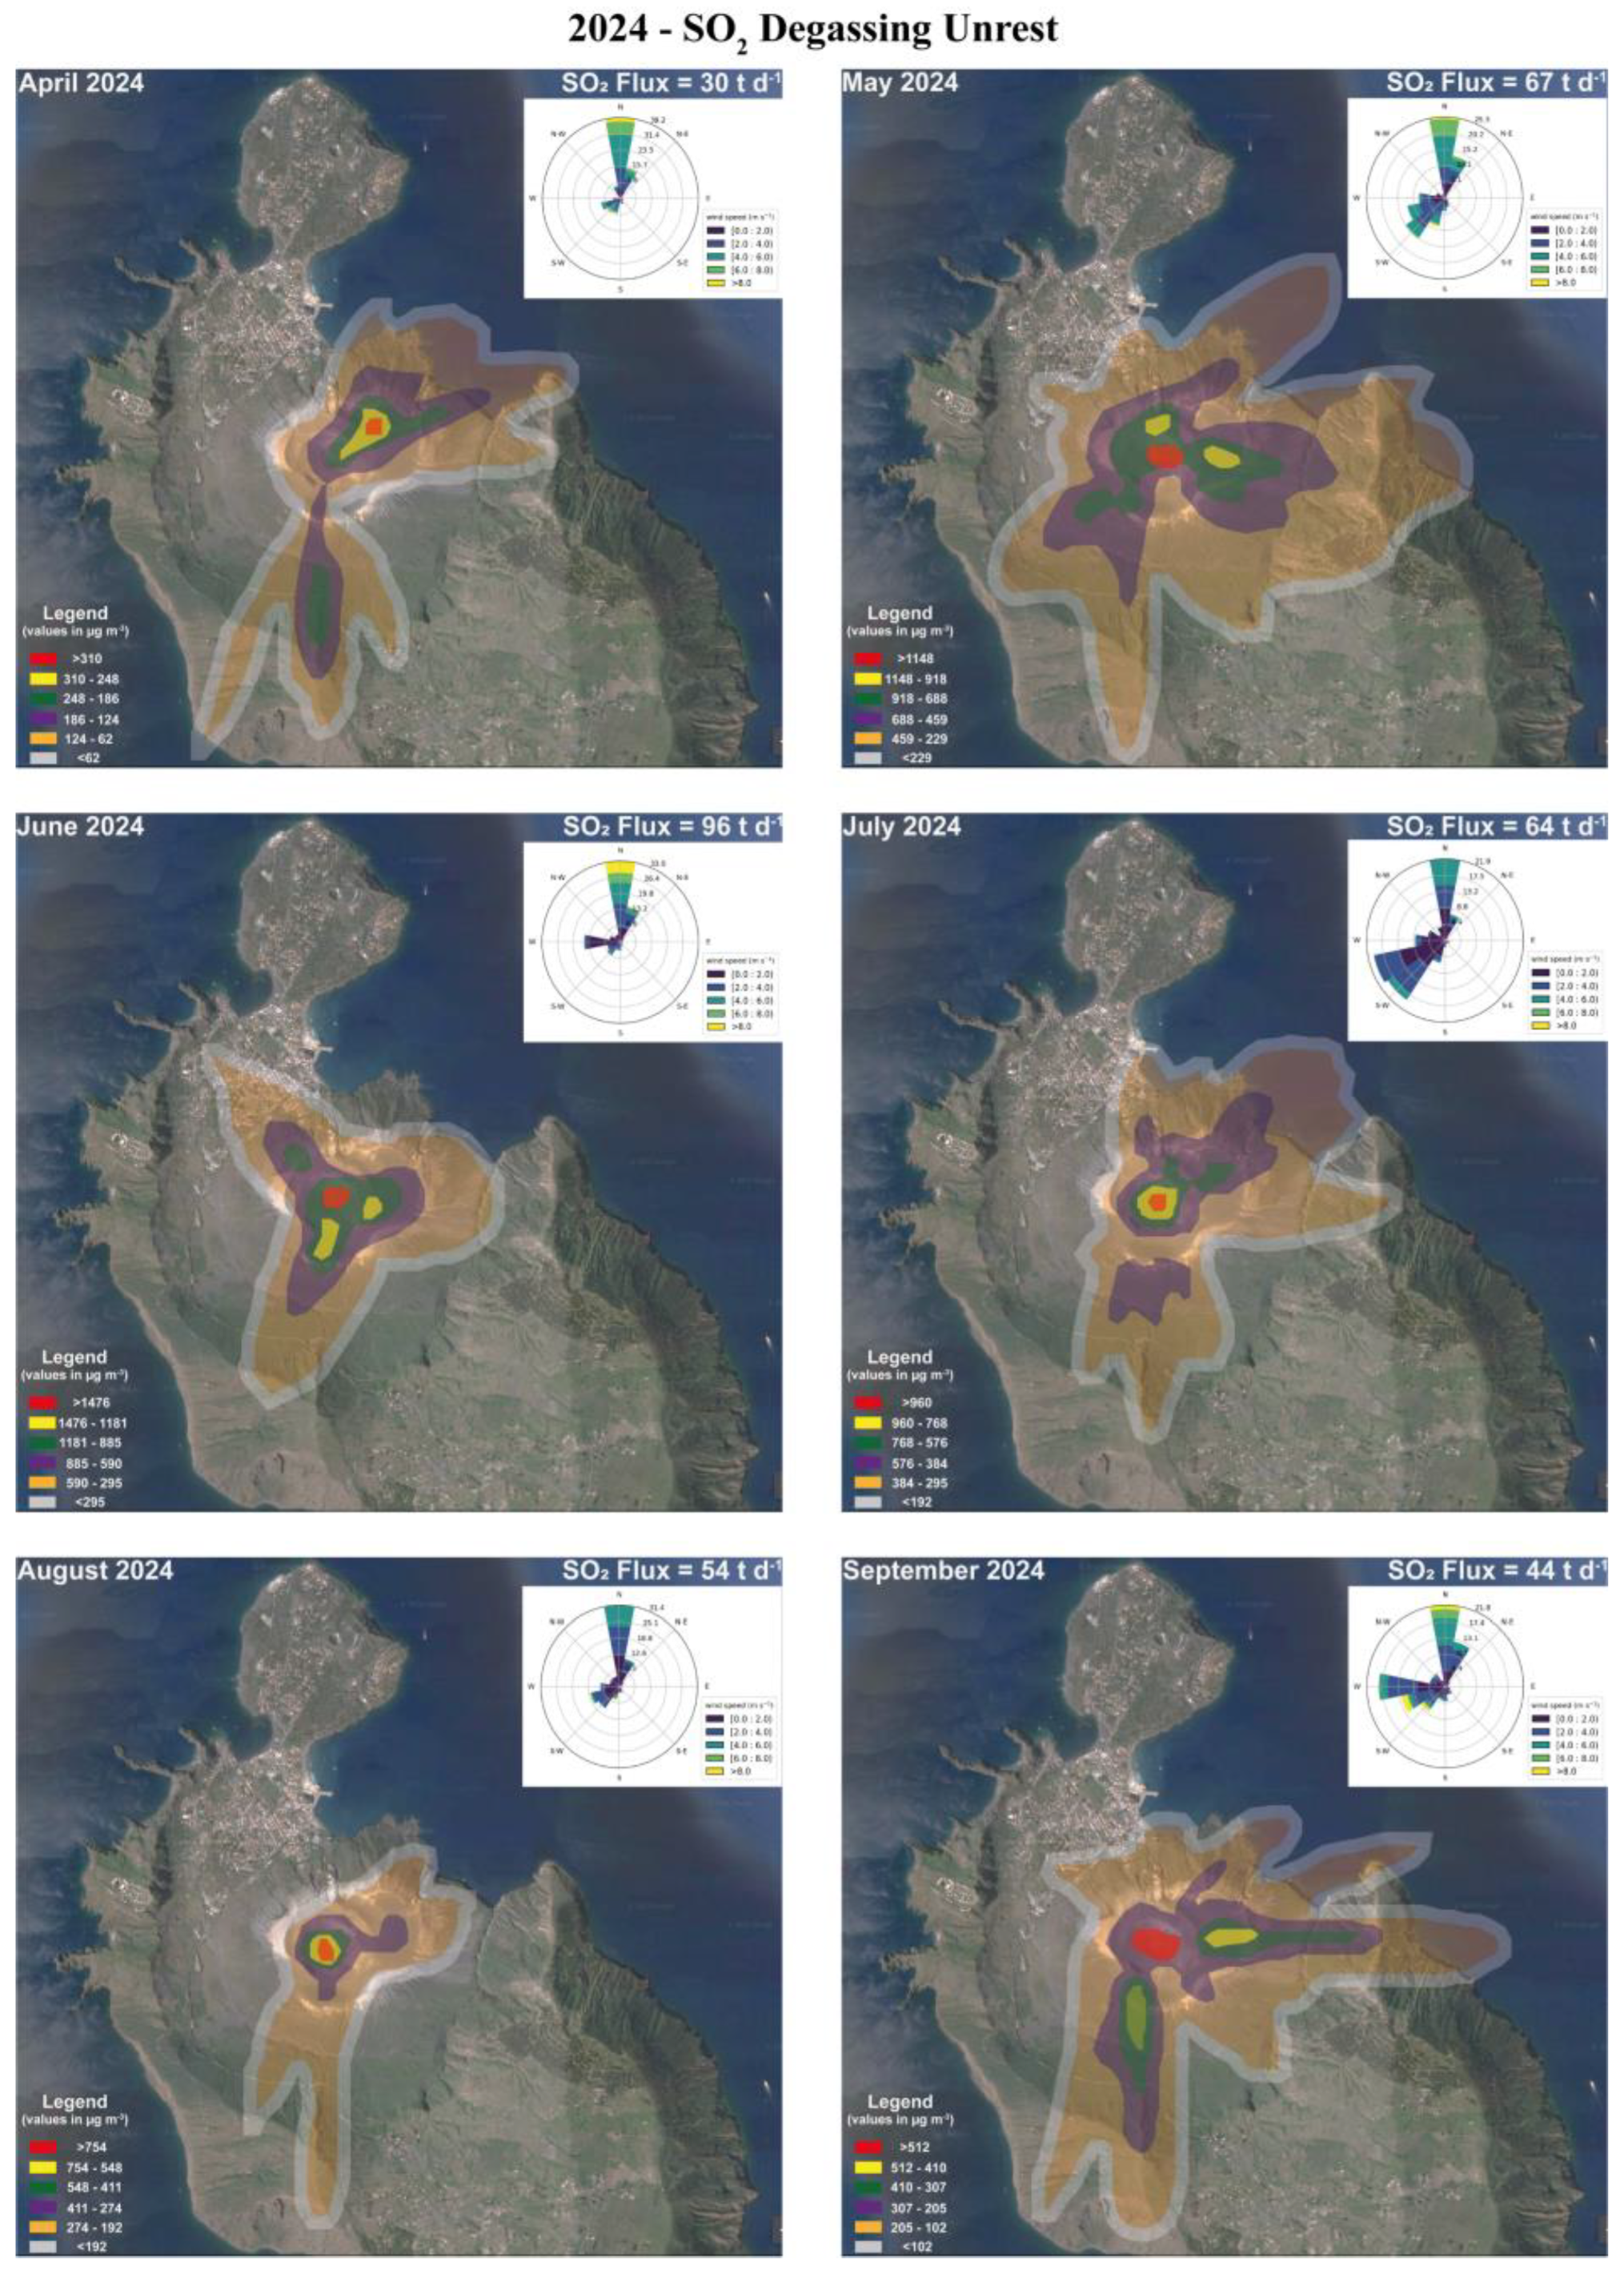
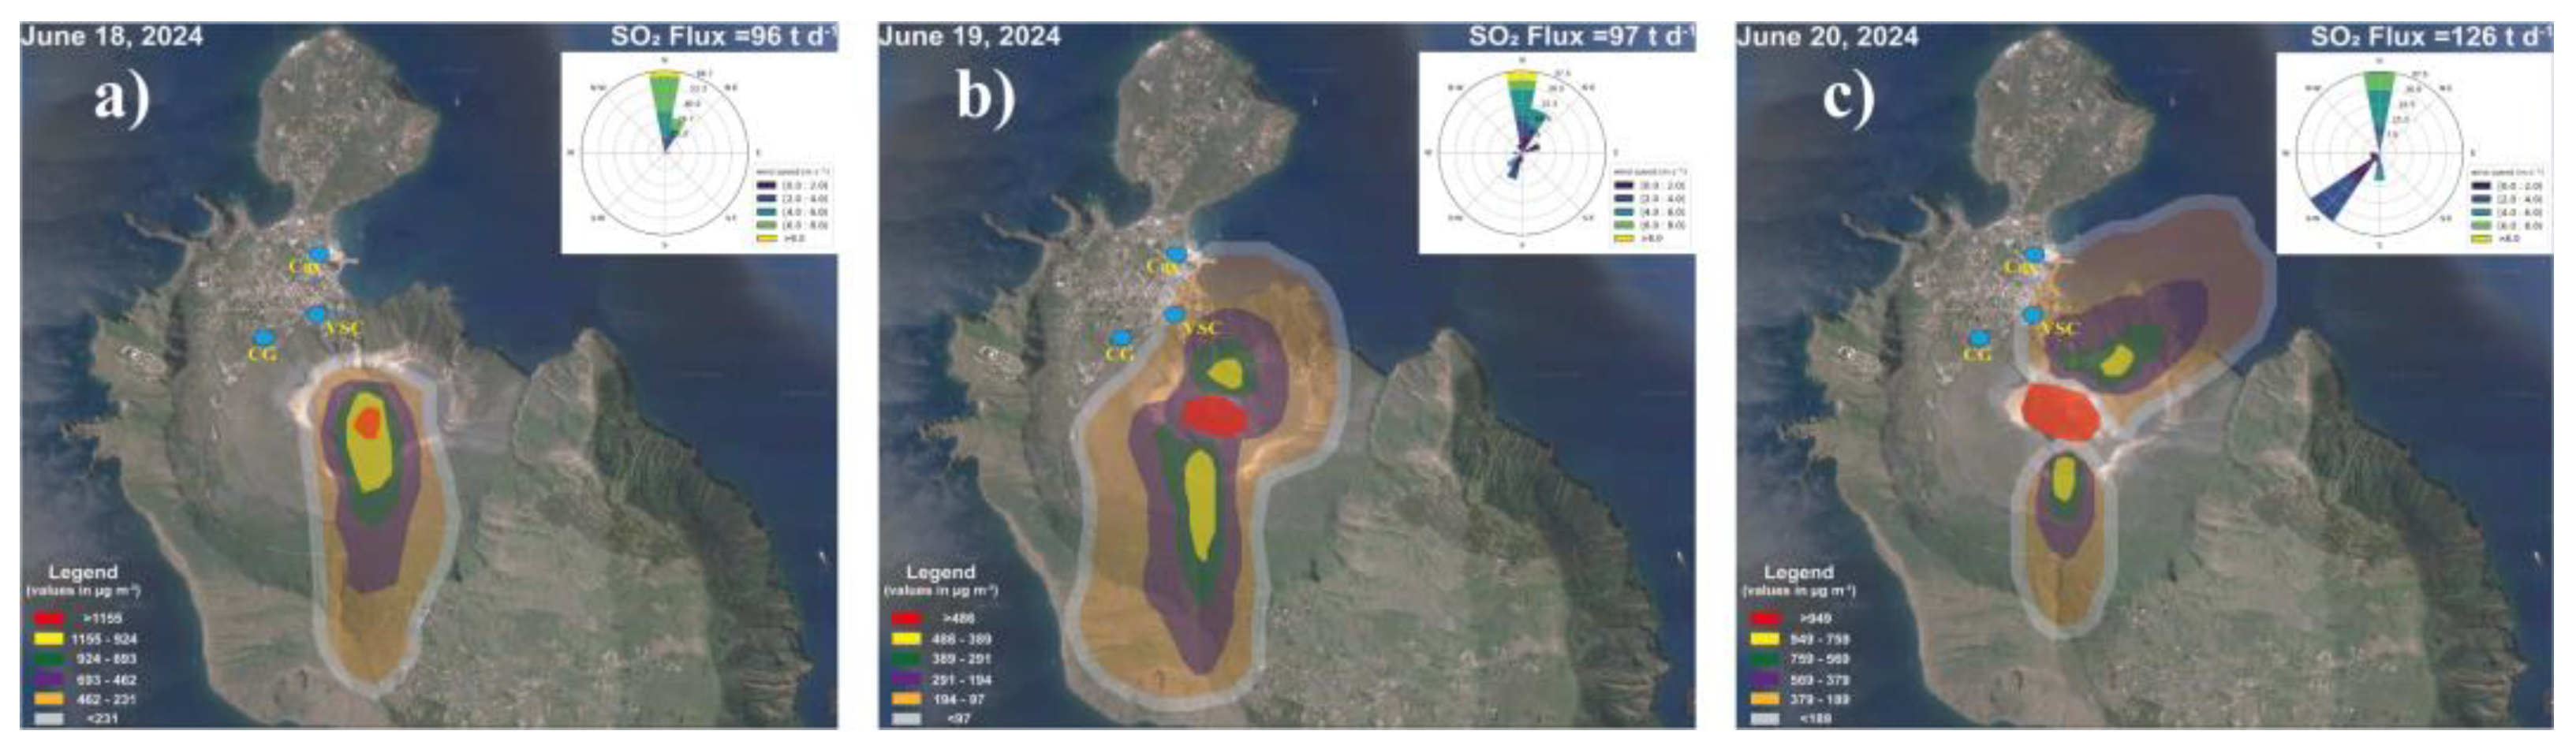
3.2.4. SO2 Degassing Unrest (2024)

In 2024, a new increase in summit degassing was observed. The reawakening of degassing activity began in May 2024, with a monthly average SO2 flux of 67 t d−1 and a maximum value reached in June 2024 of 96 t d−1. Subsequently, a decrease was observed, with SO2 flux values reaching 43 t d−1 in September 2024. In Figure 8, the monthly dispersions maps of SO2 realized from April to September 2024 are shown.
In this case, the data of atmospheric SO2 concentrations in the crater area showed the lowest values in April and the highest ones in June, ranging from <62 to >310 µg/m3 and from <295 to >1476 µg/m3, respectively (Figure 8).

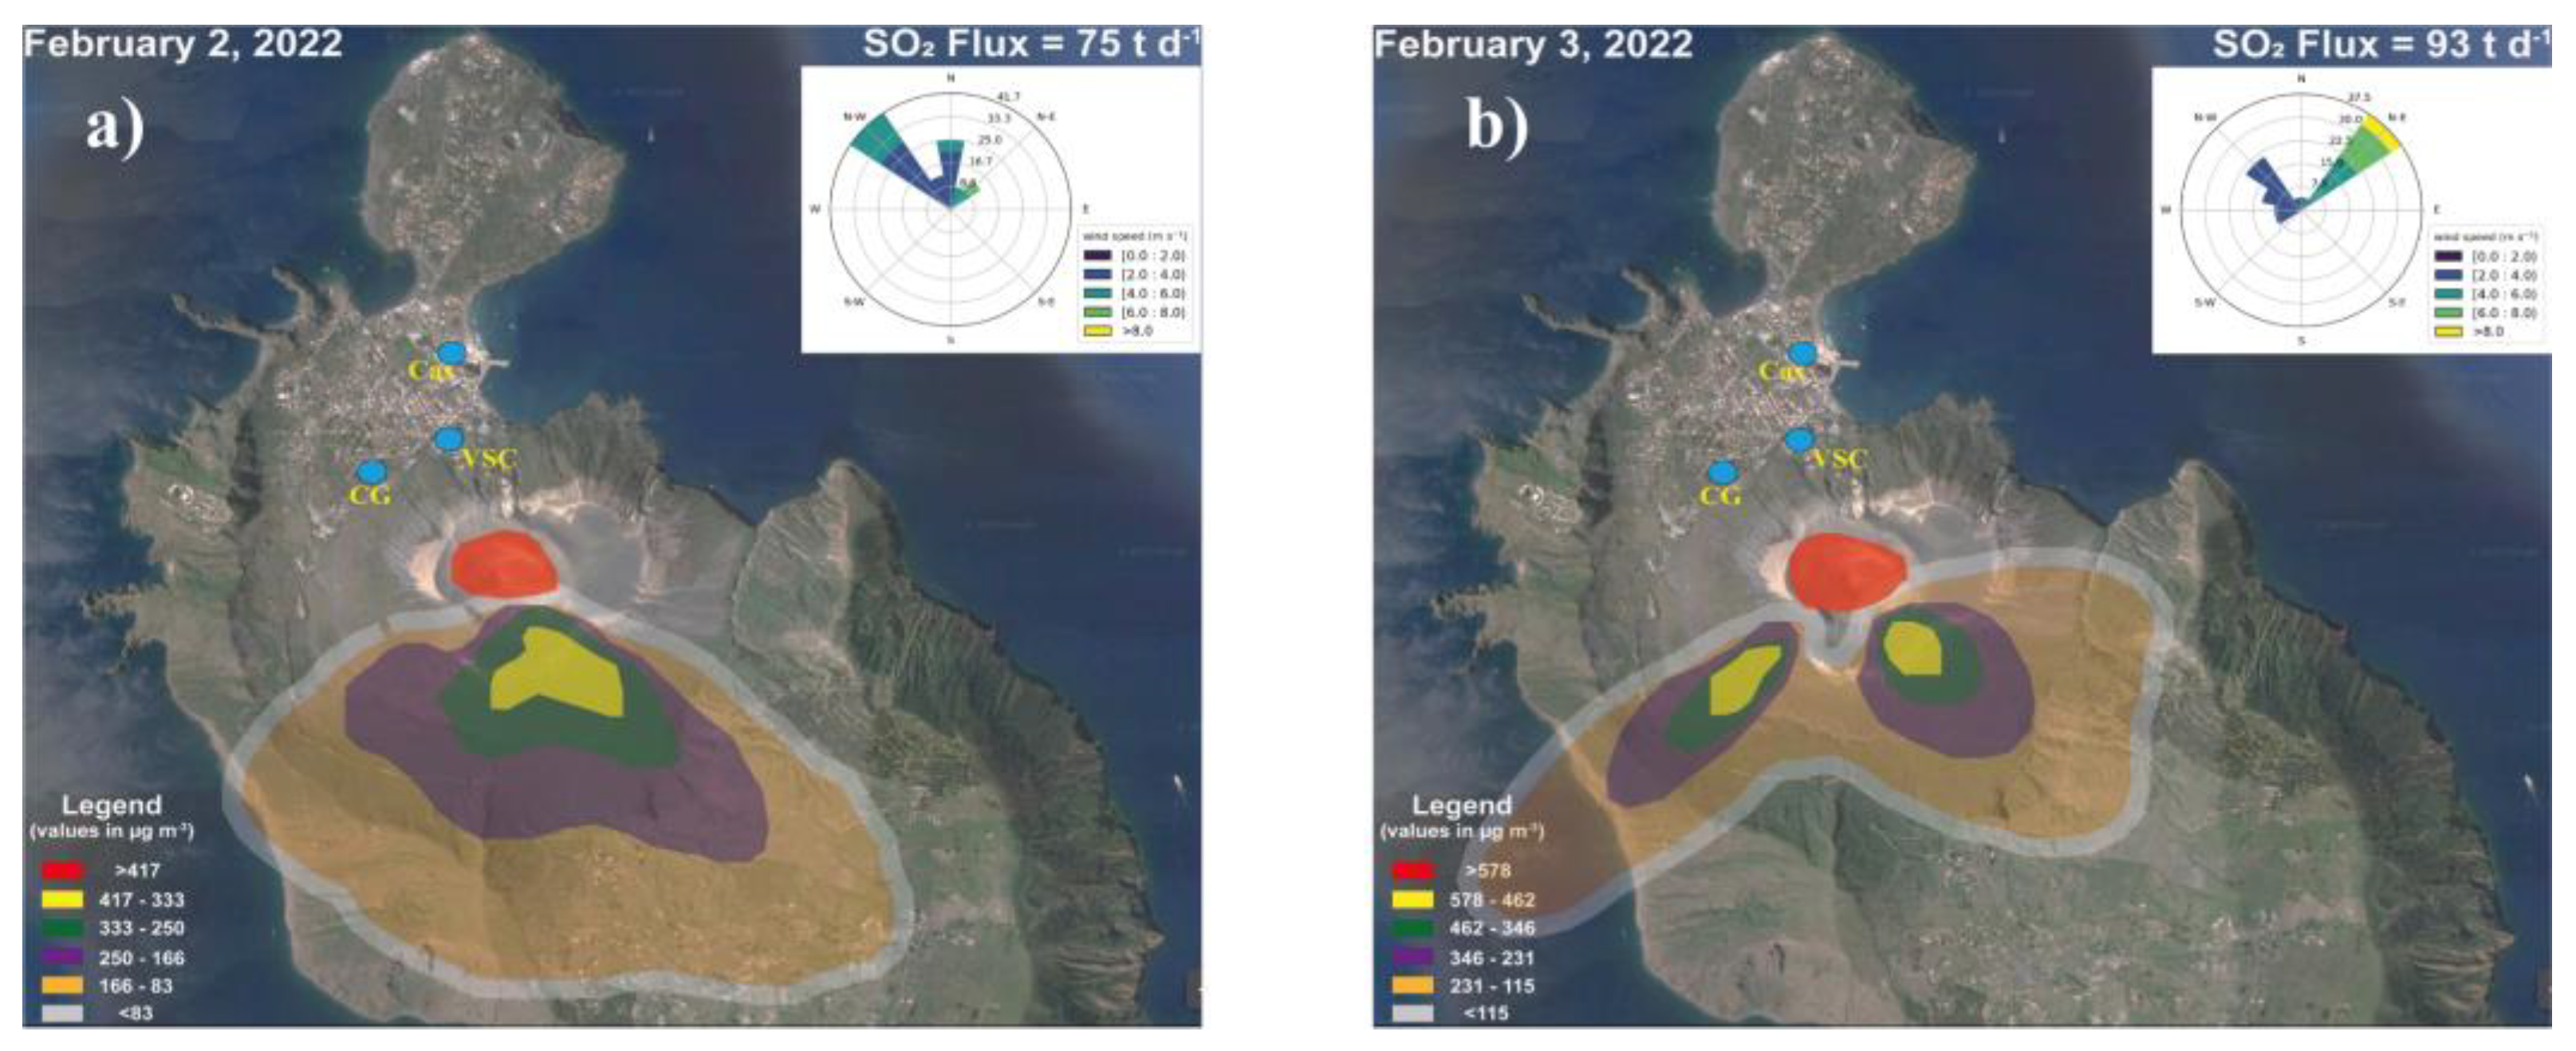
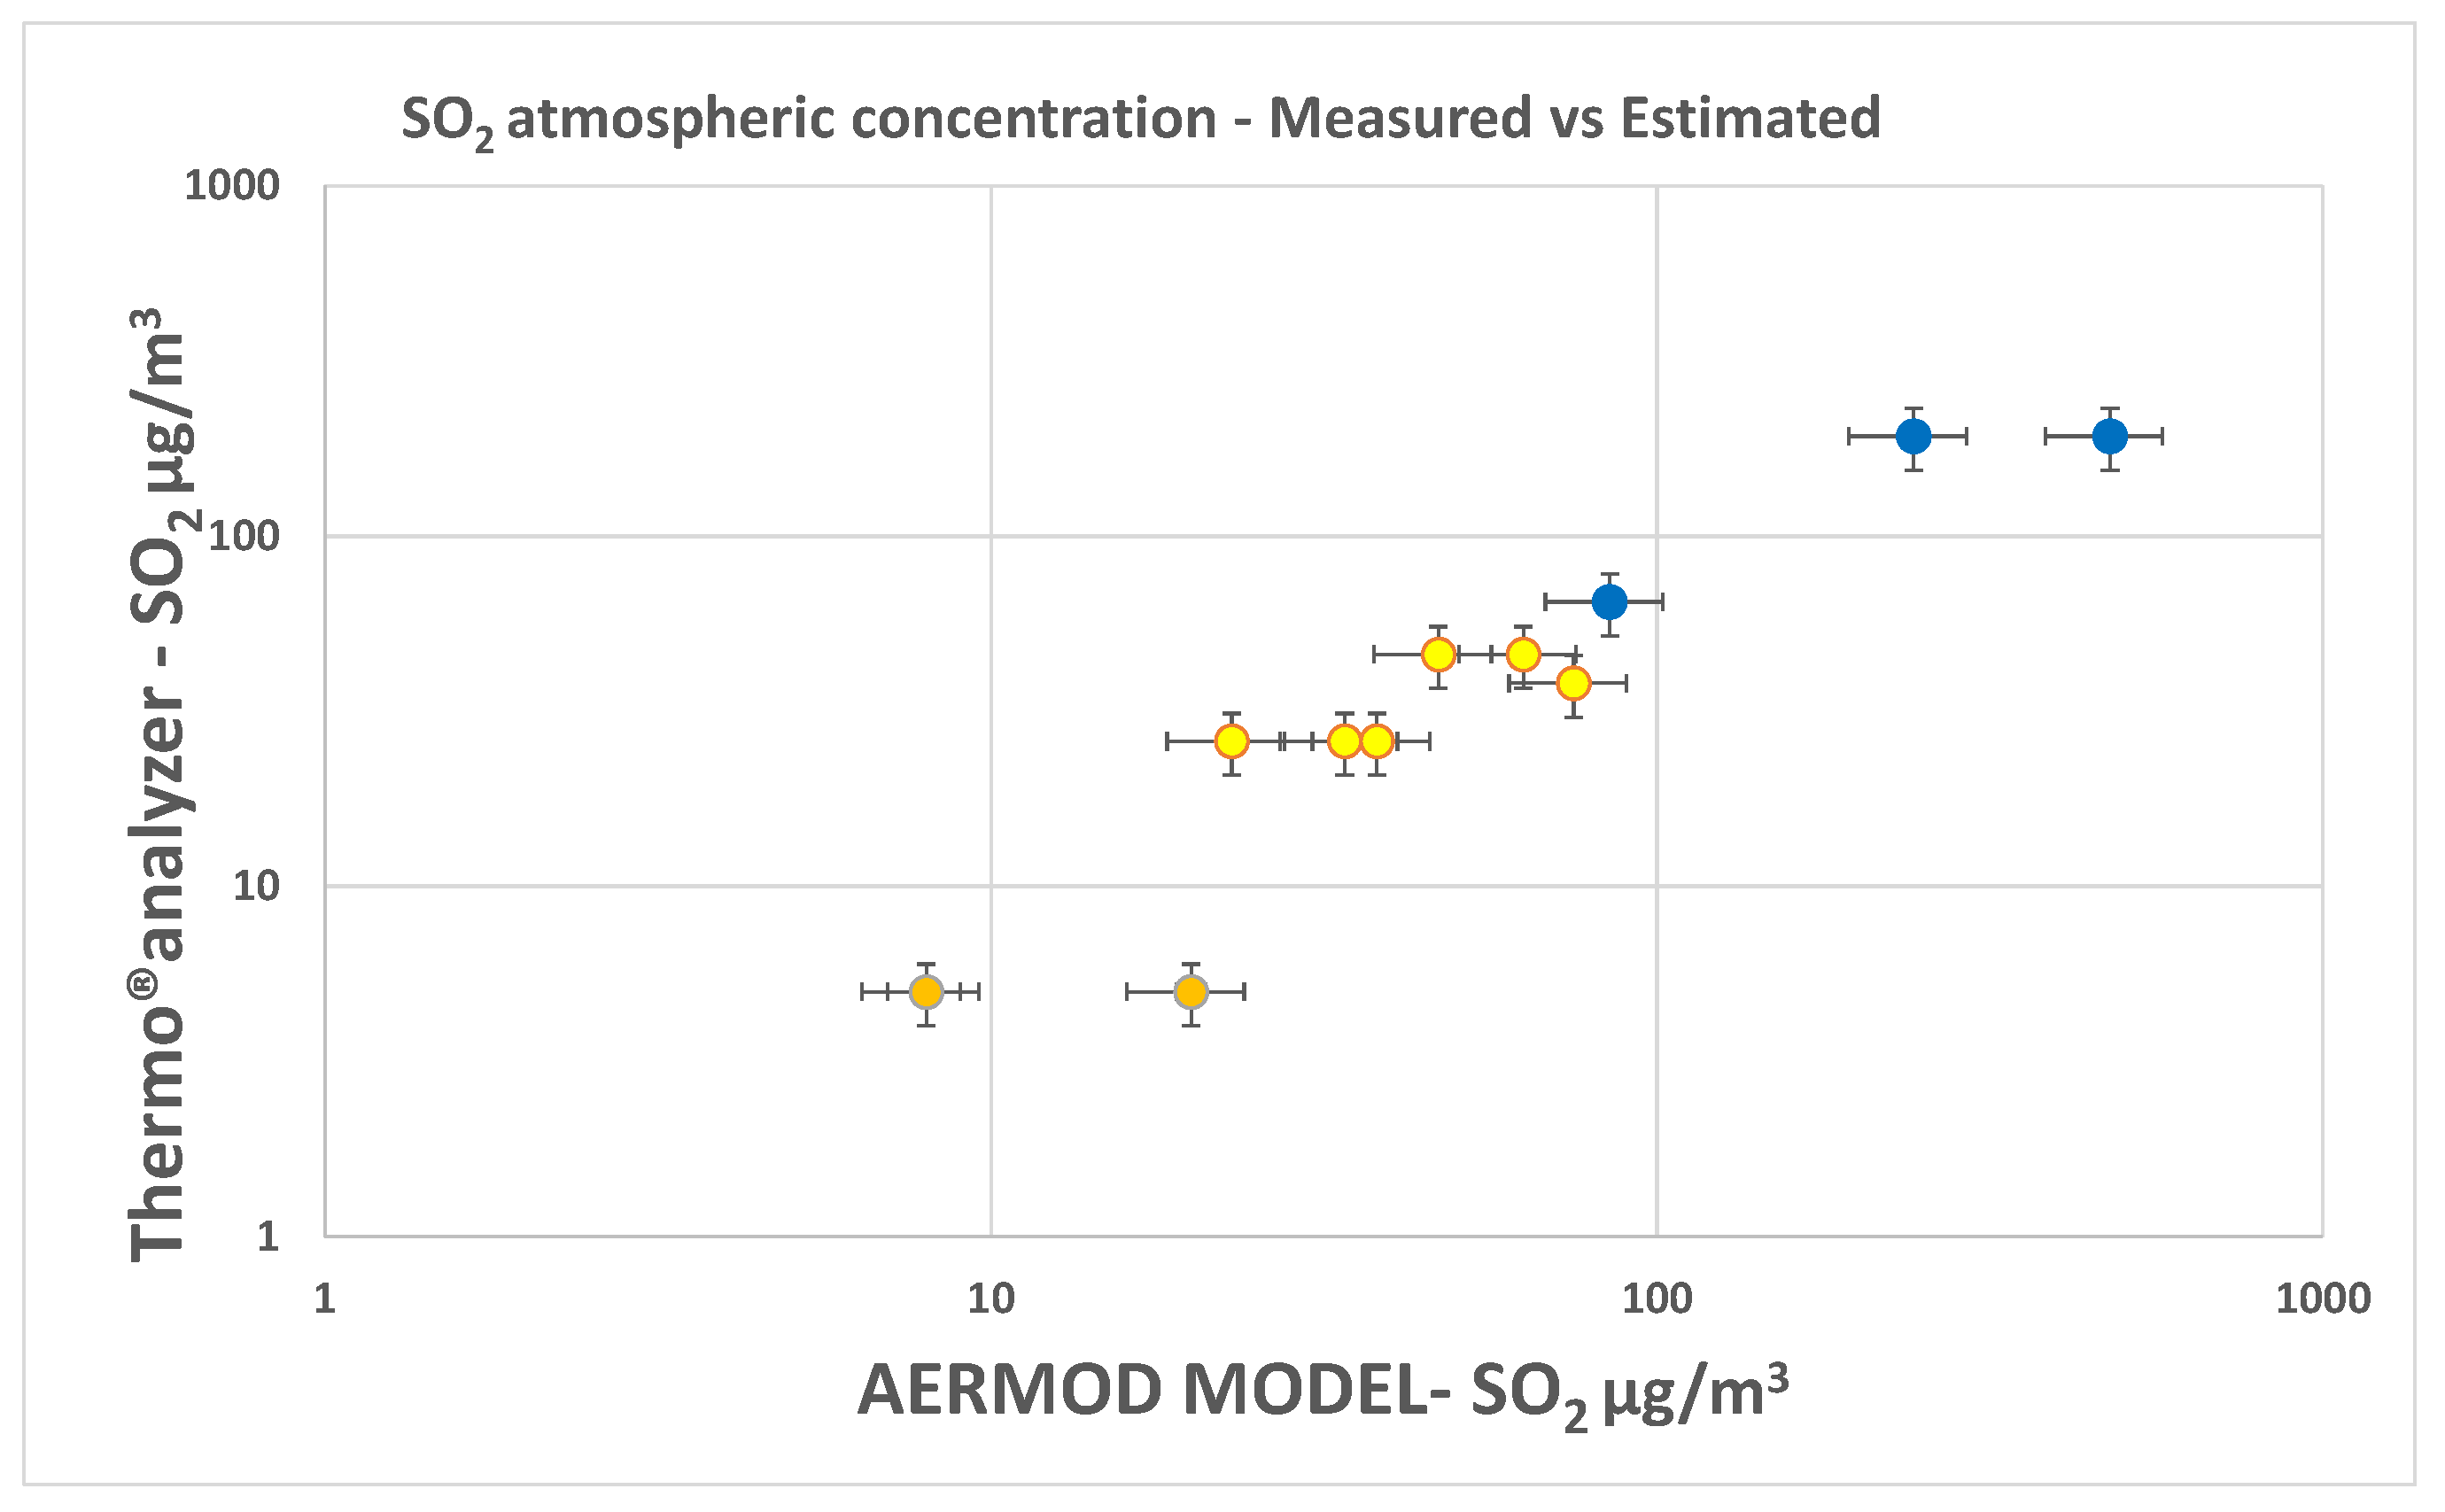
3.3. SO2 Concentrations in the Air

Continuous SO2 measurements using the Thermo® analyzer were performed both at fixed points (Il Castello, Casa Genovese, Via sotto il cratere) (Figure 1) and along a pathway selected by considering the potential contaminant sources inside the study area. The pathway was repeated on different days (keeping the start and end time approximately the same) or within the same day (morning vs. evening) in order to appreciate possible daily variations in SO2 distribution.
In Table 1, the minimum, maximum, mean, and standard deviation values of the measured SO2 concentrations for each selected site are reported, together with details on acquisition timing and duration.

4. Discussion

The SO2 dispersion maps performed with the AERMOD model display the SO2 isoconcentration values for a radius of 3 km starting from the emission source. These maps were created using the SO2 flux values from the source of the summit sulphur area, measured with the UV-Scanning DOAS network, together with the wind speed and wind direction data.
In this work, we constructed the monthly dispersion maps of the 2021 and 2024 degassing unrest periods that occurred on Vulcano Island (Figure 7 and Figure 8). The data of the SO2 concentration in the atmosphere is estimated from the monthly dispersion maps (Figure 7 and Figure 8), which were reported in graphic form to highlight the variations of SO2 content in the atmosphere over time during the periods of degassing awakening (Figure 9a,b). It is evident that during both degassing crises (2021 and 2024), average monthly SO2 concentrations in the atmosphere of the volcanic area, from the internal crater to the flanks of the volcano, showed anomalous values throughout the entire unrest period, exceeding the limits allowed by the WHO. In particular, the inner part of the crater reached values of 1400 µg/m3, coinciding with the maximum SO2 degassing values in both 2021 and 2024 (Figure 9a,b).
In contrast, the monthly dispersion maps performed in the 2021 and 2024 anomalous degassing periods showed that only in a few cases did wind speed and direction move the SO2 plume towards the Vulcano or Piano village (Figure 7 and Figure 8).
Daily dispersion maps of sulphur dioxide were also constructed based on data measured only when high SO2 fluxes and, simultaneously, direct measurements on fixed points were recorded, as follows: (i) 16 to 18 November 2021, (ii) 2–3 February 2022, (iii) 20 to 22 June 2023, and (iv) 18 to 21 June 2024.
The direct SO2 measurements were not performed on the same fixed points in different years. However, these direct measurements are still consistent with the estimates made with the dispersion maps. In particular, the measurements taken on 16, 17, and 18 November 2021, are related to days with high daily SO2 fluxes, i.e., 238, 141, and 90 t d−1, respectively. During these days, the measurements were performed at the fixed point of Casa Genovese (CG) (Figure 10; Table 1). On 16 and 17 November, high SO2 contents, even higher than the limits allowed by the WHO, were measured, with daily averages of 193 µg/m3 and maximum values of 5950 and 2159 µg/m3, respectively. The data estimated from the dispersion maps also indicate high average values, above the limits allowed by the WHO, i.e., between 182 and 719 µg/m3. On 18 November, however, the winds moved the plume in a west-east direction and did not affect the CG measurement point. In fact, the data from the fixed station indicated SO2 average values of 65 µg/m3, i.e., values allowed by the WHO, consistently with the dispersion maps of SO2 that lap the town and CG but do not reach them directly. In this case, the dispersion maps estimated values lower than 167 µg/m3 in an area located more than 300 m from CG.
The SO2 dispersion maps of 2 and 3 February 2022 at the Via sotto il Cratere (VSC) site were characterized by daily average SO2 fluxes of 75 and 93 t d−1, respectively. In this case, the prevailing winds pushed the plume towards the SW and SE, not completely affecting the town center and the CG measurement point (Figure 11). In this case, in fact, the SO2 data recorded by the Thermo® analyzer indicated low daily mean values below 5 µg/m3, confirming the absence of SO2 plumes in this area as indicated by the dispersion maps.
The third set of SO2 measurements refers to those carried out at the “Castello” (Cas) between 20 and 22 June 2023. In these days, the daily average SO2 flux was approximately 34 t d−1. Furthermore, the prevailing winds blew from NW and carried the plume toward SE without affecting the town of Vulcano and even less Cas. It was only on day 21 that the SO2 cloud affected the town near VSC and CG, but it did not affect the Cas measurement point (Figure 12). The daily SO2 average values, measured by the Thermo®analyzer at the Cas site, recorded an average value of 26 µg/m3, confirming the consistency of these measured data with the data estimated.
The last set of direct measurements conducted using the Thermo® analyzer at the Cas site took place on 18, 19, and 20 June 2024. These days were characterized by anomalously high daily sulfur dioxide (SO2) fluxes, as quantified by the NOVAC Network, with values of 97, 97, and 126 tons per day (t d−1), respectively. During this period, prevailing winds were predominantly northerly, ensuring minimal interference at the measurement location in Vulcano Village. However, on 19 and 20 June, a south-westerly wind component supplemented the northerly flow. Atmospheric SO2 concentrations averaged 38, 46, and 36 µg/m3 across these days, remaining within the World Health Organization (WHO) guidelines. These observed values aligned with dispersion map estimates, which indicated concentrations around 45 µg/m3 approximately 100 m from the Cas site (Figure 13).
Daily dispersion maps were also generated on the days when measurements were conducted with the Thermo®analyzer along a predefined path. This was done to further verify the coherence between the estimated and directly measured data sets (Table 1). To assess the consistency between the sulfur dioxide (SO2) concentrations measured directly in the atmosphere using the Thermo® analyzer and those estimated by the AERMOD dispersion model, a comparative analysis was conducted. This study examined data from multiple measurement campaigns carried out at fixed locations between 2021 and 2024, with results plotted in Figure 14. The findings indicate a general concordance between observed and modeled atmospheric SO2 concentrations; however, specific instances of overestimations were identified in the AERMOD_generated dataset.
This discrepancy likely arises from the model’s inherent assumptions concerning various atmospheric processes governing SO2 transport and removal mechanisms. Once released into the atmosphere, SO2 is subjected to meteorological influences, including wind patterns, humidity, and temperature, which affect its dispersion and chemical transformation. The SO2 released into the atmosphere has an average life of 6 to 24 h, and this means that after a few days, only a small percentage of the SO2 emitted remains in the atmosphere. The removal of SO2 from the atmosphere occurs through chemical oxidation, primarily via reactions with hydroxyl radicals (OH), leading to the formation of sulfate aerosols. Additionally, wet and dry deposition mechanisms facilitate its removal, with precipitation scavenging SO2 and surface interactions contributing to its depletion [36,37,38]. Failure to account for these sink processes in dispersion models can result in an overestimation of SO2 concentrations, potentially impacting air quality assessments.
In the specific case of Vulcano Island, the island’s topography must be considered, as it consists of a volcanic edifice rising to approximately 400 m in elevation. The fumarolic field, located less than one kilometer from the town center, serves as a continuous emission source for SO2. Given the local meteorological conditions—specifically, an average wind speed of around 4 km/h—the sulfurous cloud can reach the town center and monitoring stations within minutes. This rapid transport limits the time available for oxidation processes to reduce SO2 concentrations significantly. Consequently, wet and dry deposition remain the primary mechanisms responsible for removing SO2 from the atmosphere in this region. This refined understanding highlights the necessity of incorporating removal mechanisms into atmospheric dispersion models to improve the accuracy of SO2 concentration estimates and ensure reliable air quality assessments.
In Figure 15, Figure 16 and Figure 17, the maps with the SO2 measurements point in the atmosphere along the pathway, taken with Thermo®analyzer, were compared with the daily dispersion map of SO2 carried out with the AERMOD software realized on the same day. Also, in these cases, the comparison between direct and estimated measurements is consistent and confirms the validity of the dispersion maps in evaluating the average concentrations of SO2 in the air on Vulcano Island.
In addition, the direct measurements performed in the atmosphere along a pathway on 8 September 2014, showed very low values of 0–20 µg/m3 in almost the entire path (Figure 15). This is in agreement with both (i) the relatively low (14 t d−1) SO2 flux emitted on that day from the crater area and (ii) the dominant winds blowing mainly from the west with a small component from the north. In fact, the dispersion map produced with AERMOD showed that the plume was pushed towards the east and only a small part towards the south, without going beyond the crater walls. Furthermore, the estimates of SO2 concentration in the atmosphere produced by the dispersion modeling show values lower than 28 µg/m3 in the external part, in line with the values measured directly in the atmosphere.
Conversely, direct measurements conducted on 9 September 2014, along the southern transect, recorded SO2 concentrations between 20 and 40 µg/m3 (Figure 16) with a corresponding daily average flux of 13 t d−1. However, the prevailing wind direction on this day was predominantly northerly, with only a minor northwesterly component, effectively advecting the sulfurous plume southward towards the village of Piano. The estimates of SO2 in this area were between 19 and 38 µg/m3, consistent with the direct measurements (Figure 16).
Finally, the measurements on 10 September 2014, show in the southern and western parts of the path values between 20 and 125 µg/m3 (Figure 17). In this case, the daily average flux was high, with a value of 73 t d−1, and the dominant winds blew mainly from the north and east, thus pushing the plume towards the south and west and intercepting the pathway area where the estimated SO2 concentration showed values lower than 119 µg/m3. In this instancel, a general correspondence between the measured values and those estimated by the AERMOD dispersion model was also confirmed.
Furthermore, the importance of performing daily maps with measurements of SO2 flux and environmental parameters is highlighted, as it provides a more timely and realistic picture of SO2 concentrations in the atmosphere compared to monthly dispersion map results that attenuate and average daily values.
It is worth noting that the SO2 concentrations in air estimated by modelling software based on the crater SO2 fluxes emissions agree with those measured directly at the fixed sites. However, in some cases, direct measurements carried out at the Castello site (Baia di Levante area) present anomalous values in the 20–40 mg/m3 range despite the wind blowing from the north or north-east (20 June 2023; 18 June 2024; 8–10 September 2014). Therefore, the arrival of SO2 from the sulphurous area of the crater, which is located south of the Castello measurement site, cannot be justified.
In these instances, it is legitimate to question the origin of this SO2, considering that the crater is the only source of SO2 on the island. A hypothesis that must be taken into consideration is the adjacent source of H2S coming from the huge hydrothermal area of Baia di Levante, which could undergo oxidation processes. This hypothesis warrants a dedicated and in-depth study to evaluate H2S flux, wind direction, and the chemical kinetics related to the possible oxidation process in a future scientific investigation [39].
To gain a complete and clear picture of the measured SO2 fluxes degassing from the summit area of Vulcano Island, we calculated the average annual value of SO2 emitted over the past decades. These results are depicted in Figure 18, where an average value of approximately 23 t d−1 is observed from 2008 to 2020. In 2021, a sharp and consistent increase in the annual average of SO2 degassing was recorded, with values reaching 50 t d−1. In 2022, a further increase in the annual average was observed, with values close to 70 t d−1. In 2023, a slight decrease was recorded with values above 40 t d−1, which nevertheless remained anomalous compared to the background values (23 t d−1) recorded in previous years. Current data collected in 2024 again showed anomalous degassing, returning to high values above 50 t d−1. This indicates a change in the degassing activity that transcends transient anomalies and suggests the establishment of a higher reference level, representing a new background state of SO2 degassing. The calculated annual averages were used to estimate the total SO2 degassing output emitted by the volcano during the observation period from 2008 to 2024 (Figure 19). Total annual output data of about 8000 tons were estimated for the entire period, with a minimum value of 5000 tons in 2008. In contrast, the maximum SO2 output values were estimated between 18,000 and 25,000 t y−1 for 2021–2022. In 2023 and 2024, the output values remain anomalous, with an increasing trend stabilizing around 20,000 t y−1, around three times higher than the average value recorded in the last decade.

5. Conclusions

The total SO2 output emitted into the atmosphere from Vulcano Island over the past decades of observation has shown a drastic change in degassing. Annual emissions increased from the normal solfataric degassing level of 7700 t y−1 (2008–2020) during a quiet period to approximately 25,000 t y−1 in 2022 during the unrest degassing period and then stabilized at an average value of approximately 18,800 t y−1 for the 2021–2024 period.
This significant increase has alerted the scientific community worldwide to evaluate potential changes in volcanic activity and raised concerns about the environmental safety of the local population and tourists due to the average increase in SO2 levels in the atmosphere. Consequently, we identified and evaluated the areas at greatest environmental risk on Vulcano Island and focused our attention on three main areas: crater and surrounding zones, Vulcano, and Piano villages.
The crater area represents the main source of SO2 emissions on the island and, therefore, shows the highest values. Specifically, the summit area of the crater exhibits monthly average SO2 levels ranging from 300 µg/m3 during periods of ‘normal’ activity (26 t d−1) to over 1400 µg/m3 during periods of increased degassing (up to 120 t d−1). These elevated SO2 levels in the crater area consistently exceeded the daily and hourly mean values indicated by the EU guidelines throughout the year.
On the contrary, data estimated by the dispersion map model for Vulcano Porto and Vulcano Piano show different results, with threshold values exceeded only a few times during the year. This difference is due to the exposure of the crater area to prevailing winds and the location of the inhabited centers. Considering that the prevailing winds blow from the NE and W, the plume from the summit crater moves outside the inhabited centers for over 80% of the days each year. Therefore, monthly maps provide a general picture of plume movement and atmospheric concentrations in different areas of the island. In contrast, daily maps offer greater detail on individual anomalous degassing events. Coupled with threshold values, which are normally based on short intervals of an hour or a day, this provides greater precision in identifying possible harmful events to human health due to exposures above the threshold limits.

Author Contributions

Conceptualization, S.I., F.V., B.S., C.I., S.V. and J.C.; methodology, S.I., F.V., B.S., J.C. and S.V.; validation, S.I., F.V., B.S., J.C. and S.V.; investigation, S.I., FV, B.S., C.I. and F.T.; data curation, F.V., J.C., S.V., S.I. and B.S.; writing original draft preparation, S.I., F.V., C.I., J.C. and B.S.; writing review and editing, S.I., F.V., B.S., C.I., F.T., S.V. and J.C.; funding acquisition, S.I. and F.V. All authors have read and agreed to the published version of the manuscript.

Funding

This investigation was funded by institutional INGV projects of Italy: (i) grant “Progetto INGV Pianeta Dinamico”—WUnderVul (Toward a wider understanding of Vulcano)—code CUP D53J19000170001—funded by Italian Ministry MIUR; (ii) Pianeta Dinamico Task V2, ObFu 1020.010; and (iii) TORS project (“Ricerca Libera”, ObFu 9999.549).

Institutional Review Board Statement

Not applicable.

Informed Consent Statement

Not applicable.

Data Availability Statement

The original contributions presented in this study are included in the article. Further inquiries can be directed to the corresponding author.

Acknowledgments

The authors wish to thank their colleagues at the Istituto Nazionale di Geofisica e Vulcanologia of Palermo, Lorenzo Calderone and Giuseppe Passafiume, for their help in acquiring and processing data and for their support in field logistics Rebecca Biagi, Martina Ferrari and Francesco Capecchiacci for their help during field activities and data acquisition.

Conflicts of Interest

The authors declare no conflict of interest.

References

  1. Pyle, D.M.; Beattie, P.D.; Bluth, G.J.S. Sulphur emissions to the stratosphere from explosive volcanic eruptions. Bull. Volcanol. 1996, 57, 663–671. [Google Scholar] [CrossRef]
  2. Fioletov, V.E.; McLinden, C.A.; Griffin, D.; Abboud, I.; Krotkov, N.; Leonard, P.J.T.; Li, C.; Joiner, J.; Theys, N.; Carn, S. Version 2 of the global catalogue of large anthropogenic and volcanic SO2 sources and emissions derived from satellite measurements. Earth Syst. Sci. Data 2023, 15, 75–93. [Google Scholar] [CrossRef]
  3. Carn, S.A.; Fioletov, V.E.; McLinden, C.A.; Li, C.; Krotkov, N.A. A decade of global volcanic SO2 emissions measured from space. Sci. Rep. 2017, 7, 44095. [Google Scholar] [CrossRef] [PubMed]
  4. Arthur, M.A. Volcanic contributions to the carbonand sulfur geochemical cycles and global change. In Encyclopedia of Volcanoes; Sigurdsson, H., Houghton, B., Rymer, H., Stix, J., McNutt, S., Eds.; Academic Press: San Diego, CA, USA, 2000; pp. 1045–1056. [Google Scholar]
  5. Brantley, S.L.; Koepenick, K.W. Measured carbon dioxide emissions from Oldoinyo Lengai and the skewed distribution of passive volcanic fluxes. Geology 1995, 23, 933–936. [Google Scholar] [CrossRef]
  6. WHO. Air quality guidelines for Europe. In World Health Organization, Regional Publication, 2nd ed.; European Series, N; WHO: Geneva, Switzerland, 2000; Volume 91. [Google Scholar]
  7. EU. Council Directive 1999/30/EC of 22 April 1999 relating to limit values for sulphur dioxide, nitrogen dioxide and oxides of nitrogen, particulate matter and lead in ambient air. Eur. Union Off. J. 1999, L163, 41–60. [Google Scholar]
  8. Hansell, A.; Oppenheimer, C. Health hazards from volcanic gases: A systematic literature review. Arch. Environ. Health 2010, 59, 628–639. [Google Scholar] [CrossRef]
  9. Robock, A. Volcanic eruptions and climate. Rev. Geophys. 2000, 38, 191–219. [Google Scholar] [CrossRef]
  10. Stevenson, D.S.; Johnson, C.E.; Collins, W.J.; Derwent, R.G. The Tropospheric Sulphur Cycle and the Role of Volcanic SO2; Special Publications; Geological Society: London, UK, 2007; Volume 213, p. 295. [Google Scholar]
  11. Longo, K.M.; Freitas, S.R.; Pirre, M.; Marécal, V.; Rodrigues, L.F.; Panetta, J.; Arteta, J. The chemistry CATT-BRAMS model (CCATT-BRAMS 4.5): A regional atmospheric model system for integrated air quality and weather forecasting and research. Geosci. Model Dev. 2010, 3, 585–601. [Google Scholar] [CrossRef]
  12. Pope, C.A.; Dockery, D.W. Health effects of fine particulate air pollution: Lines that connect. J. Air Waste Manag. Assoc. 2006, 56, 709–742. [Google Scholar] [CrossRef]
  13. Inguaggiato, S.; Mazot, A.; Diliberto, I.S.; Inguaggiato, C.; Madonia, P.; Rouwet, D.; Vita, F. Total CO2 output from Vulcano island (Aeolian Islands, Italy). Geochem. Geophys. Geosystems 2012, 13, 1–19. [Google Scholar] [CrossRef]
  14. Inguaggiato, S.; Liotta, M.; Rouwet, D.; Tassi, F.; Vita, F.; Schiavo, B.; Keller, N.S. Sulfur origin and flux variations in fumarolic fluids of Vulcano Island, Italy. Front. Earth Sci. 2023, 11, 1197796. [Google Scholar] [CrossRef]
  15. Aiuppa, A.; Bitetto, M.; Calabrese, S.; Donne, D.D.; Lages, J.; La Monica, F.P.; Chiodini, G.; Tamburello, G.; Cotterill, A.; Fulignati, P.; et al. Mafic magma feeds degassing unrest at Vulcano Island, Italy. Commun. Earth Environ. 2022, 3, 255. [Google Scholar] [CrossRef]
  16. Federico, C.; Cocina, O.; Gambino, S.; Paonita, A.; Branca, S.; Coltelli, M.; Sortino, F. Inferences on the 2021 ongoing volcanic unrest at Vulcano Island (Italy) through a comprehensive multidisciplinary surveillance network. Remote Sens. 2023, 15, 1405. [Google Scholar] [CrossRef]
  17. Capecchiacci, F.; Tassi, F.; Vaselli, O.; Venturi, S. The 2021–2023 unrest of Vulcano Island volcanic system (Aeolian Islands, Italy): Geochemical evidence from fumarolic gas discharges and well waters. Bull. Volcanol. 2025, 87, 24. [Google Scholar] [CrossRef]
  18. Inguaggiato, S.; Vita, F.; Diliberto, I.S.; Mazot, A.; Calderone, L.; Mastrolia, A.; Corrao, M. The Extensive Parameters as a Tool to Monitoring the Volcanic Activity: The Case Study of Vulcano Island (Italy). Remote Sens. 2022, 14, 1283. [Google Scholar] [CrossRef]
  19. Diliberto, I.S. Long-term monitoring on a closed-conduit volcano: A 25 year long time-series of temperatures recorded at La Fossa cone (Vulcano Island, Italy), ranging from 250 °C to 520 °C. J. Volcanol. Geotherm. Res. 2017, 346, 151–160. [Google Scholar] [CrossRef]
  20. Vita, F.; Schiavo, B.; Inguaggiato, C.; Inguaggiato, S.; Mazot, A. Environmental and volcanic implications of volatile output in the atmosphere of vulcano island detected using SO2 plume (2021–23). Remote Sens. 2023, 15, 3086. [Google Scholar] [CrossRef]
  21. Granieri, D.; Carapezza, M.L.; Barberi, F.; Ranaldi, M.; Ricci, T.; Tarchini, L. Atmospheric dispersion of natural carbon dioxide emissions on Vulcano Island, Italy. J. Geophys. Res. Solid Earth 2014, 119, 5398–5413. [Google Scholar] [CrossRef]
  22. Di Martino, R.M.R.; Gurrieri, S.; Camarda, M.; Capasso, G.; Prano, V. Hazardous changes in soil CO2 emissions at Vulcano, Italy, in 2021. J. Geophys. Res. Solid Earth 2022, 127, e2022JB024516. [Google Scholar] [CrossRef]
  23. Galle, B.; Oppenheimer, C.; Geyer, A.; McGonigle, A.; Edmonds, M.; Horrocks, L. A miniaturised ultraviolet spectrometer for remote sensing of SO2 fluxes: A new tool for volcano surveillance. J. Volcanol. Geotherm. Res. 2003, 119, 241–254. [Google Scholar] [CrossRef]
  24. Platt, U.; Stutz, J. Differential Optical Absorption Spectroscopy Principles and Applications, Physics of Earth and Space Environments; Springer: Berlin/Heidelberg, Germany, 2008; 597p, ISBN 978-3-540-75776-4. [Google Scholar]
  25. Platt, U.; Perner, D.; Pätz, H.W. Simultaneous measurement of atmospheric CH2O, O3, and NO2 by differential optical absorption. J. Geophys. Res. Ocean. 1979, 84, 6329–6335. [Google Scholar] [CrossRef]
  26. Stutz, J.; Platt, U. Numerical analysis and estimation of the statistical error of differential optical absorption spectroscopy measurements with least-squares methods. Appl. Opt. 1996, 35, 6041–6053. [Google Scholar] [CrossRef] [PubMed]
  27. Kern, C.; Detschmann, T.; Vogel, L.; Wohrbach, M.; Wagner, T.; Platt, U. Radiative transfer corrections for accurate spectroscopic measuremens of volcanic gas emissions. Bull. Volcanol. 2009, 72, 233–247. [Google Scholar] [CrossRef]
  28. Kern, C.; Sihler, H.; Vogel, L.; Rivera, C.; Herrera, M.; Platt, U. Halogen oxide measurements at Masaya Volcano, Nicaragua using active long path differential optical absorption spectroscopy. Bull. Volcanol. 2009, 71, 659–670. [Google Scholar] [CrossRef]
  29. Bobrowski, N.; Hönninger, G.; Galle, B.; Platt, U. Detection of bromine monoxide in a volcanic plume. Nature 2003, 423, 273–276. [Google Scholar] [CrossRef]
  30. Vita, F.; Inguaggiato, S.; Bobrowski, N.; Calderone, L.; Galle, B.; Parello, F. Continuous SO2 flux measurements for Vulcano Island, Italy. Ann. Geophys. 2012, 55, 2. [Google Scholar] [CrossRef]
  31. Galle, B.; Johansson, M.; Rivera, C.; Zhang, Y.; Kihlman, M.; Kern, C.; Lehmann, T.; Platt, U.; Arellano, S.; Hidalgo, S. Network for Observation of Volcanic and Atmospheric Change (NOVAC)—A global network for volcanic gas monitoring: Network layout and instrument description. J. Geophys. Res. 2010, 115, D05304. [Google Scholar] [CrossRef]
  32. Johansson, M.; Galle, B.; Zhang, Y.; Rivera, C.; Chen, D.; Wyser, K. The dual-beam mini-DOAS technique: Measurements of volcanic gas emission, plume height and plume speed with a single instrument. Bull. Volcanol. 2009, 71, 747–751. [Google Scholar] [CrossRef]
  33. Cimorelli, A.J.; Perry, S.G.; Venkatram, A.; Weil, J.C.; Paine, R.J.; Wilson, R.B.; Lee, R.F.; Peters, W.D.; Paumier, J.O. AERMOD: Description of Model Formulation; U.S. Environmental Protection Agency Report; EPA 2003 454/R,03,002d; U.S. EPA: Washington, DC, USA, 2003; 85p. Available online: https://gaftp.epa.gov/Air/aqmg/SCRAM/models/preferred/aermod/aermod_mfd_454-R-03-004.pdf (accessed on 11 February 2025).
  34. Jenkins, S.F.; Barsotti, S.; Hincks, T.K.; Neri, A.; Phillips, J.C.; Sparks, R.S.J.; Sheldrake, T.; Vougioukalakis, G. Rapid emergency assessment of ash and gas hazard for future eruptions at Santorini Volcano, Greece. J. Appl. Volcanol. 2015, 4, 16. [Google Scholar] [CrossRef]
  35. Thermo Fisher Scientific Inc. Model 450i Instruction Manual. 2007. Available online: https://assets.thermofisher.com/TFS-Assets/LSG/manuals/EPM-manual-Model%20450i.pdf (accessed on 15 January 2025).
  36. Finlayson-Pitts, B.J.; Pitts, J.N. Atmospheric Chemistry: Fundamentals and Experimental Techniques; Wiley-Interscience Publication: New York, NY, USA, 1986. [Google Scholar]
  37. Brimblecombe, P. Air Composition and Chemistry; Cambridge University Press: Cambridge, UK, 1996. [Google Scholar]
  38. Porter, J.N.; Horton, K.A.; Mouginis-Mark, P.J.; Lienert, B.; Sharma, S.K.; Lau, E.; Sutton, A.J.; Elias, T.; Oppenheimer, C. Sun photometer and lidar measurements of the plume from the Hawaii Kilauea volcano Pu’u O’o vent: Aerosol flux and SO2 lifetime. Geophys. Res. Lett. 2002, 29, 30-1–30-4. [Google Scholar] [CrossRef]
  39. Badalamenti, B.; Liotta, M.; Valenza, M. An automatic system for continuous monitoring of CO2, H2S, SO2 and meteorological parameters in the atmosphere of volcanic areas. Geochem. Trans. 2001, 2, 30. [Google Scholar] [CrossRef]
Figure 1. (a) Vulcano map with the location of the SO2_VULNET stations. Yellow dashed circle indicates the UV-scanning DOAS equipment located at NE and SW with respect to the Vulcano edifice, respectively, Levante and Palizzi stations. Blue and red dashed circles indicate the meteorological stations (Lentia and VSCS, respectively) of the environmental parameters network. The white dashed circle indicates the Volcanological Observatory Center, where the camera (VC) has been installed to monitor the crateric degassing activity. The star symbols indicate the fixed points of measurement of SO2 with thermo@ analyzer. Orange, yellow, and blue stars for VSC (Via sotto il cratere), CG (Casa Genovese), and Cas (Castello), respectively; (b) Inset of Aeolian Archipelago and Vulcano Island position.
Atmosphere 16 00651 g001
Figure 2. (a) Vulcano picture with the location of the SO2_VULNET stations. Red circles denote the scanning DOAS stations; blue and yellow circles indicate weather stations; (b) geometry of observations: ph plume height, vertical distance between the instrument and the plume’s center of mass; wd: wind direction; α: scan angle; (ce) pictures of solphataric degassing area during the 2021 unrest; (f) SO2 optical density from NOVAC program.
Atmosphere 16 00651 g002
Figure 3. Wind occurrence frequency catalogued by season wind direction and average wind intensity. The graph was produced by extrapolating a long-time dataset from 2008 to 2024. The dominant winds that are more frequent and intense are those that blow from NE and W.
Atmosphere 16 00651 g003
Figure 4. Complete dataset of daily average SO2 fluxes (2008–2024) discharged by solfataric area of Vulcano expressed in tons for days. The daily standard deviation of the SO2 measurements has been reported. The four unrest-degassing periods have been indicate.
Atmosphere 16 00651 g004
Figure 5. SO2 dispersion maps in the atmosphere produced by the AERMOD model for the 2008–2009 period: (a) normal degassing period from May 2008 to October 2009, 23,2 t d−1; (b) degassing unrest from October to December 2009, 106 t d−1.
Atmosphere 16 00651 g005
Figure 6. SO2 dispersion maps in the atmosphere produced by the AERMOD model for the normal degassing period 2010–2021, a daily average of 26 t d−1.
Atmosphere 16 00651 g006
Figure 7. SO2 monthly dispersion maps in the atmosphere in 2021: seven dispersion maps from June to December 2021, with fluxes ranging from 26 t d−1 to 120 t d−1.
Atmosphere 16 00651 g007
Figure 8. SO2 monthly dispersion maps in the atmosphere in 2024: six dispersion maps from April to September 2024, with fluxes ranging from 31 t d−1 to 96 t d−1.
Atmosphere 16 00651 g008
Figure 9. Estimated average monthly SO2 concentrations in the atmosphere (in µg/m3) in the crateric area in (a) the 2021 period and (b) the 2024 period. Yellow dashed line: WHO concentration limit for an exposure time of 24 h (40 µg/m3). Dashed red line: daily mean value of SO2 allowed by the EU guideline (125 µg/m3) that cannot be exceeded more than 3 times in a year; Green dashed line: SO2 hourly mean value (350 µg/m3) that should not exceed more than 24 times in a year.
Atmosphere 16 00651 g009aAtmosphere 16 00651 g009b
Figure 10. Daily dispersion maps of 16, 17 and 18 November 2021 showing the SO2 concentrations in the atmosphere estimated by the AERMOD model. (a) 16 November, with SO2 fluxes of 238 t d−1; (b) 17 November, with SO2 fluxes of 141 t d−1, (c) 18 November, with SO2 fluxes of 90 t d−1. Blue circles indicate the fixed point of SO2 measurements with Thermo® analyzer, i.e., Il Castello (Cas), Via Sotto il Cratere (VSC), Casa Genovese (CS).
Atmosphere 16 00651 g010
Figure 11. Daily dispersion maps of 2 and 3 February 2022 showing the SO2 concentrations in the atmosphere estimated by the AERMOD model. (a) 2 February with SO2 fluxes of 75 t d−1; (b) 3 February with SO2 fluxes of 93 t d−1.
Atmosphere 16 00651 g011
Figure 12. Daily dispersion maps of 20, 21, and 22 June 2023 showing the SO2 concentrations in the atmosphere estimated by the AERMOD model. (a) 20 June with SO2 fluxes of 29 d−1 (b) 21 June with SO2 fluxes of 36 t d−1, (c) 22 June with SO2 fluxes of 32 t d−1.
Atmosphere 16 00651 g012
Figure 13. Daily dispersion maps of 18, 19, and 20 June 2021 showing the SO2 concentrations in the atmosphere estimated by the AERMOD model. (a) 18 June with SO2 fluxes of 97 t d−1 (b) 19 November with SO2 fluxes of 97 t d−1, (c) 20 June with SO2 fluxes of 126 t d−1.
Atmosphere 16 00651 g013
Figure 14. Sulfur dioxide concentrations (µg/m3) in the atmosphere measured directly using the Thermo® analyzer vs those estimated by the AERMOD dispersion model. The fixed measurement points for SO2 concentrations, obtained using a Thermo® analyzer, are indicated by circles. Specifically, the yellow circles denote Il Castello (Cas), the orange circles signify Via Sotto il Cratere (VSC), and the blue circles correspond to Casa Genovese (CS). The uncertainties for both data sets, measured and estimated, have been reported. The two datasets exhibit a general agreement, although the SO2 concentrations estimated by the dispersion model show a slight positive bias compared to the directly measured in-situ data.
Atmosphere 16 00651 g014
Figure 15. The maps with the measurement points along the pathway performed by 8 September, 2014 (left side) were compared with the daily dispersion map of SO2 (right side), carried out with the AERMOD software, on the same day of the direct measurements.
Atmosphere 16 00651 g015
Figure 16. The maps with the measurements point along the pathway carried out on the morning and evening, respectively, left side and right side performed by 9 September 2014, compared with the daily dispersion map of SO2 (central side), realized with the AERMOD software, in the same day of the punctual direct measurements.
Atmosphere 16 00651 g016
Figure 17. The maps with the measurements point along the pathway carried out on the morning and evening, respectively, left side and right side (Table 1) performed on 10 September 2014 was, compared with the daily dispersion map of SO2 (central side), realized with the AERMOD software, in the same day of the punctual direct measurements.
Atmosphere 16 00651 g017
Figure 18. Yearly average of measured SO2 plume degassing measured by UV-scanning DOAS network from 2008 to 2024. The green line represents the SO2 background value (around 23 t y−1) in the last decades.
Atmosphere 16 00651 g018
Figure 19. Yearly output of SO2 emitted from the crater solfataric area. The yellow line represents the minimum value of around 5000 t y−1 in 2008. The blue line represents the average SO2 output value of 7700 t y−1.
Atmosphere 16 00651 g019
Table 1. For each fixed measuring site, (i) year, (ii) location, (iii) start, end, and duration of acquisition, and (iv) summary statistics (minimum, maximum, mean, and standard deviation values) of SO2 concentration measured directly in the atmosphere with the Thermo® analyzer are reported. The 2021 data were already partially published in [17].
YearSiteZoneE (UTM)N (UTM)StartEndDuration (min)SO2 (µg/m3)
minmaxmeanstd.dev
2024Il Castello33S49639342519782024/6/18 7:452024/6/18 15:45480246437.56.2
2024/6/20 7:252024/6/20 15:064611270.245.611
2024/6/20 16:002024/6/21 13:0712671112036.123.762
2023Il Castello33S49639342519782023/6/20 8:492023/6/22 16:5333646.412525.612
2022Via sotto il cratere33S49636642515302022/2/2 10:022022/2/3 17:401898<5.25.27<5.20.1
2021Casa Genovese33S49603142513682021/11/16 11:152021/11/16 22:216666.25951193474
2021/11/17 12:202021/11/18 17:351755<5.2215965178
Disclaimer/Publisher’s Note: The statements, opinions and data contained in all publications are solely those of the individual author(s) and contributor(s) and not of MDPI and/or the editor(s). MDPI and/or the editor(s) disclaim responsibility for any injury to people or property resulting from any ideas, methods, instructions or products referred to in the content.

