Abstract
Urbanization has been suspected to increase the allergic rate of people, and its impact on airborne fungi and potential allergens has drawn attention. In this study, aerosol samples were collected concurrently at proximate urban and rural sites of Shanghai during the four seasons to analyze the changes in abundance and community composition of airborne fungi. In summer, there were significantly higher concentrations of fungi in the urban atmosphere compared to at the rural site. Ascomycota and Basidiomycota were the top two fungal phyla, and Cladosporium was the most abundant genus year round. Alternaria was the second highest genus in spring and winter (only the rural site), whereas Nigrospora ranked second during summer and autumn due to it largely being sourced from marine organisms and predominantly marine-influenced air masses in these seasons. Airborne fungal richness was relatively higher at the rural site than in urban during winter. Allergenic fungal species were found to be more abundant in winter than in other seasons; particularly, the relative abundance of Cladosporium sp. was significantly higher (p < 0.001), and Fusarium culmorum and Cladosporium herbarum also increased more in urban than in rural areas, which may be one of the key factors contributing to the rising allergic rate in the urban population.
1. Introduction
Bioaerosols constitute a significant fraction of atmospheric aerosols, including bacteria, fungi, and other microorganisms, along with various biological materials. The sizes of airborne microorganisms typically span from tens of nanometers to one-tenth of a millimeter [1]. To date, approximately 150,000 fungal species have been identified, yet it is estimated that millions more remain undiscovered [2,3]. Fungi play an essential role in maintaining Earth’s ecosystems and significantly impact human health.
The global burden of fungal diseases is substantial. Annually, superficial infections (e.g., skin, hair, nails, and eyes) affect approximately one billion individuals, mucosal infections (e.g., oral and vaginal) impact around 135 million people, allergic fungal diseases influence approximately 23.3 million individuals, and severe chronic or acute invasive infections affect millions worldwide [4]. Fungal diseases are responsible for over 1.6 million deaths annually, a mortality rate comparable to tuberculosis and over three times higher than that of malaria [4]. Furthermore, fungal sensitization is a recognized risk factor for allergic rhinitis and asthma and may lead to acute respiratory issues [5,6]. The global prevalence of fungal allergies is estimated to range from 3% to 10% [7,8]. A strong correlation exists between environmental fungal spore exposure and the prevalence of allergies and asthma [9]. Notably, key allergenic fungi have been reported to elicit allergic reactions in 19–45% of allergic individuals and 80% of asthmatic patients undergoing skin testing [10,11,12,13]. Dominant allergenic fungal taxa, ranked by frequency, include Cladosporium, Aspergillus, Penicillium, and Alternaria. These fungal spores are particularly associated with asthma exacerbation, with more severe symptoms observed in children [14,15,16,17]. Hence, studying the composition of airborne fungi, particularly allergens and pathogens, is essential for protecting human health.
Urbanization may alter human exposure to microbial communities and thereby significantly impact health [18]. Elevated asthma and allergy prevalence in urban areas may be attributed to urbanization-induced changes in the microbial community structure, including atmospheric fungi. Li et al. reported statistically significant differences in the levels and diversity of bioaerosol emissions across various land use types, with emissions from human-impacted areas such as farmland, sewage treatment plants, streets, and smelters being significantly higher [19]. In contrast, less human-impacted regions, such as lakes, forests, gardens, and wetlands, showed lower bioaerosol levels, but higher culturability, with wetlands showing up to 16% culturability. Additionally, microbial communities in these land use types demonstrated higher richness and diversity, with distinct dominant taxa. Pan et al. examined the spatial variation in atmospheric fungal communities across forests, urban areas, and suburbs, revealing higher fungal diversity in forests [19]. Although Ascomycota and Basidiomycota were the dominant phyla across the three sampling sites, significant differences were observed at other taxonomic levels.
The concentration, size distribution, and relative abundance of fungi also vary temporally. Previous studies reported peak fungal abundance in early spring, summer, and late autumn [20,21,22,23]. Notably, the fungal abundance peak in late spring and early summer coincided with the onset of the North American monsoon season in Colorado, characterized by widespread thunderstorms. It has been suggested that convective instability preceding thunderstorms facilitates the emission of concentrated fungal plumes. These fungal spores, bacteria, and other bioaerosols may ascend via upward airflows to altitudes conducive to long-distance transport and dispersion [24]. The seasonal variability of fungal diversity differs across regions due to variations in sources, meteorological conditions, land use types, and human activities [25].
Urbanization has changed land use patterns and population density, potentially influencing the abundance and community composition of atmospheric fungi. Shanghai is one of the cities in China with the largest economic scale and the highest level of urbanization. Over the past 30 years, its Pudong New Area has undergone rapid urbanization, with the proportion of urbanized area rising from less than 10% to 70–80%. This study collected atmospheric aerosols simultaneously from the urban and rural sites of Pudong New Area to investigate the differences in abundance, community composition, seasonal variation, and potential allergens of airborne fungi, as well as influencing factors. The findings aim to provide scientific insights into the mechanisms of urbanization-induced changes in atmospheric fungal communities and potential health impacts.
2. Materials and Methods
2.1. Aerosol Collection
Total suspended particles (TSPs, with an aerodynamic diameter of up to 100 μm) were collected from two distinct locations: the Pudong Environmental Monitoring Station (31.23° N, 121.54° E), representing a densely populated urban center in Shanghai characterized by heavy traffic, and the Huinan Environmental Monitoring Station (31.03° N, 121.8° E), a rural site situated in the outskirts of Shanghai and surrounded by extensive farmland. Aerosol sampling was conducted on the rooftop platform of the monitoring stations, with the sampler inlet positioned 21 m above ground level. Sampling was conducted between July 2020 and June 2021, with continuous collections spanning a minimum of 20 days per season (about 9–10 samples each season were chosen for the sequencing analysis of fungal communities, Table S1). To standardize the sampling conditions and enable direct comparisons, all samplings were performed over a consistent 24 h period, with a new filter loaded at 9:00 am each day. At the two locations, TSP samples were collected using high-volume air samplers (HY-1000, Hengyuan Technology Development Co., Ltd., Qingdao, China, and flow rate: 1.05 m3/min) equipped with sterilized quartz fiber filters (Whatman® QMA, Global Life Sciences Technologies (Shanghai) Co., Ltd., Shanghai, China, 203 mm × 254 mm). The flow of high-volume samplers was monitored during aerosol collection, and the stable flow suggested no overloading of particles. The collected filter samples and blanks were stored at −20 °C prior to DNA extraction to preserve the integrity of double-stranded DNA [26].
2.2. Air Mass Backward Trajectory and Auxiliary Data
Air mass backward trajectories were calculated using the Meteoinfo platform and its TrajStat plugin, which generates trajectories by invoking the core algorithm of the National Oceanic and Atmospheric Administration (NOAA) Hybrid Single-Particle Lagrangian Integrated Trajectory (HYSPLIT) model. The Meteoinfo platform is integrated with the Global Data Assimilation System (GDAS) from the National Centers for Environmental Prediction (NCEP), and the corresponding data were downloaded from the official archive (ftp://arlftp.arlhq.noaa.gov/pub/archives/gdas1, accessed on 10 December 2024). Meteorological parameters including temperature, wind speed, relative humidity (RH), and PM2.5 concentrations were obtained from the Pudong and Huinan Environmental Monitoring Stations in Shanghai, representing urban and rural sites, respectively. The sampling dates and auxiliary data are provided in Table S1.
2.3. DNA Extraction and qPCR Measurement
The extraction of airborne fungal DNA was performed on one-quarter of each filter sample using the DNeasy PowerSoil Kit (QIAGEN, Hilden, Germany), following the manufacturer’s protocol. The concentration and purity of the extracted DNA were assessed using a NanoDrop spectrophotometer (Thermo Fisher Scientific Inc., Waltham, MA, USA) to ensure that it met the requirements for subsequent sequencing. The DNA extraction efficiency was not calculated, as it was assumed that the fungal community DNA was uniformly distributed within the sample, and its composition was considered independently of the DNA amount.
The total fungal concentration was measured using a Real-time Fluorescence Quantitative Polymerase Chain Reaction (qPCR) Detecting System (Aglient Mx3000P, Aglient Technologies Inc., Santa Clara, CA, USA), which detects a significant fluorescence signal when the amplification cycles (Ct) of sample DNA reach a certain amount. The primers ITS5 (5′-GGAAGTAAAAGTCATAACAAGG-3′) and ITS2 (5′-GCTGCGTTCTTCATCGATGC-3′) were selected for the amplification reaction, and the reaction media include 10 μL of SYBR Green I dye, 0.2 μL of BSA (Bovine Serum Albumin, Thermo Fisher Scientific Inc., Waltham, MA, USA) as a stabilizer, 0.6 μL of each forward and reverse primer, 2 μL of DNA template, and 6.6 μL of ddH2O. The amplification was cycled with an initial denaturation at 95 °C for 10 min, followed by denaturation at 95 °C for 30 s, annealing at 55 °C for 30 s, and extension at 72 °C for 30 s. Operational blanks for DNA extraction and qPCR amplification were also measured, and the corrected Ct was converted to log(copies/μL) according to a standard curve. Due to the variation in fungal genome numbers (30–200), the fungal concentration is expressed as the log(copies/m3) in this study [27].
2.4. Sequencing Analysis
The community structure of fungi was determined via the PCR amplification of the ITS1a gene with the primers ITS5F (GGAAGTAAAAGTCGTAACAAGG) and 806R (GCTGCGTTCTTCATCGATGC). The PCR reaction mixture consisted of 5 μL of diluted reaction buffer, 5 μL of diluted GC buffer, 2 μL of dNTPs (2.5 mM), 1 μL of each primer (10 μM), 1 μL of DNA template, 9.75 μL of nuclease-free water, and 0.25 μL of Q5 DNA Polymerase. The thermal cycling conditions included an initial denaturation at 98 °C for 5 min, followed by 28 cycles of denaturation at 98 °C for 30 s, annealing at 52 °C for 30 s, and extension at 72 °C for 1 min, with a final extension at 72 °C for 5 min and storage at 12 °C.
Paired-end sequencing of the amplified DNA fragments was conducted using an Illumina Novaseq 6000 platform at Shanghai Personal Biotechnology Co., Ltd. (Shanghai, China). The paired-end raw sequences were processed in QIIME2 software (version 2019.4). Initially, the raw sequences were deduplicated to obtain high-quality sequences, during which barcodes and primers were simultaneously removed while selecting valid sequences meeting the quality criteria. Subsequently, the DADA2 plugin was employed for sequence denoising, merging, and chimera removal [28]. Amplicon sequence variants (ASVs) were retained for taxonomic assignment, as they are considered more accurate and reliable than operational taxonomic units (OTUs) derived from sequence clustering [29]. The taxonomic classification of ASVs was conducted using the Naive Bayes classifier against the Unite database, utilizing 99% OTUs as reference sequences.
2.5. Statistical Analyses and Allergen Identification
Statistical analyses were conducted using R version 4.4.1 and Origin2019. The Kruskal–Wallis and Fisher’s Least Significant Difference (LSD) tests were employed to evaluate the statistical significance of differences in fungal communities. Principal Coordinate Analysis (PCoA), based on the unconstrained dimensionality reduction in the Bray–Curtis dissimilarity matrix, was performed to visualize and assess the differences and variations in the fungal communities across seasons and sampling sites. Allergenic fungi were identified based on the Catalog of Pathogenic Microorganisms Infecting Humans issued by the Ministry of Health of China, as well as the allergenic fungi list proposed by Simon-Nobbe et al. [30].
3. Results and Discussion
3.1. Air Transport Paths and Land Use Types
Airborne microorganisms can be transported over a long distance with the wind due to their small size, light weight, and hydrophobicity. Therefore, the community structure of airborne fungi derived locally from the underlying surface can be influenced by the transport paths of air masses reaching the receptor sites. Figure 1 shows the directions of air mass back trajectories during different sampling periods at the rural and urban sites. Overall, the transport paths of air masses at both sites are highly similar, primarily governed by large-scale atmospheric circulation systems. The wind rose diagrams in the four sampling periods for both rural and urban sites are also provided in the Supplementary Materials (Figures S1 and S2).
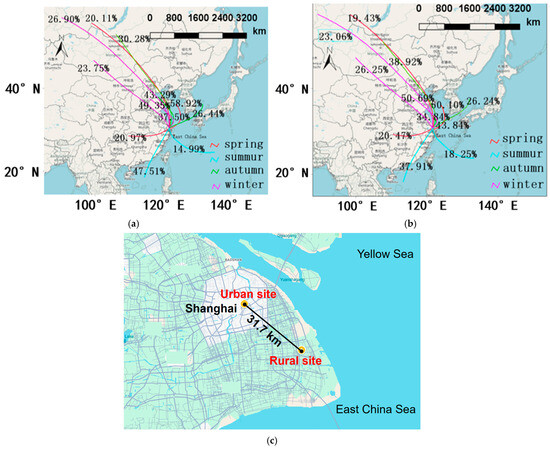
Figure 1.
This shows the 72 h air mass backward trajectories clustered for each sampling season, with the starting height of 500 m over the (a) rural and (b) urban sampling sites and (c) the distance between the two sites in Shanghai, China.
In summer, the air masses predominantly originated from the South China coastal area and could even be traced back to the South China Sea and Southeast Asia. Additionally, a portion of the air masses came from the southeast, including offshore areas, as well as from the local regions of Shanghai and Jiangsu province. In contrast, the air masses in autumn were mainly from the northern part of China across the Bohai and Yellow seas before reaching the study sites. This transport pattern may lead to interactions between continental anthropogenic pollutants and marine aerosols. During winter, compared to the other three seasons, the frequency of the direct transport of air masses from northern/northwestern China to Shanghai was notably higher. In spring 2021, air masses primarily originated from northwestern China, southwestern China, and the East China Sea.
The land use types and their respective proportions within a 10 km radius of the urban or rural site are illustrated in Figure 2. The impermeable surface area around the urban site was 216 km2, constituting ~67% of the total area. Forest land covered 67.4 km2, or ~21% of the total area; water bodies occupied 18.7 km2, representing ~6%; scrubland accounted for ~4% (11.7 km2); grassland covered ~2% (7.73 km2); and agricultural land comprised a negligible proportion of the area (1.46 km2). In contrast, the impermeable surface around the rural site was 121 km2, making up ~38% of the total area. Forest land covered 98.0 km2, ~30% of the total area; agricultural land was 57.9 km2, representing ~18%; water bodies accounted for ~5% (14.3 km2); scrubland was ~4% (14.2 km2); and grassland covered ~5% (17.0 km2). The urban site had a significantly larger impermeable surface, approximately twice that of the rural area. Nonetheless, the proportion of agricultural land in the urban site was almost negligible in contrast to ~18% in the rural site.
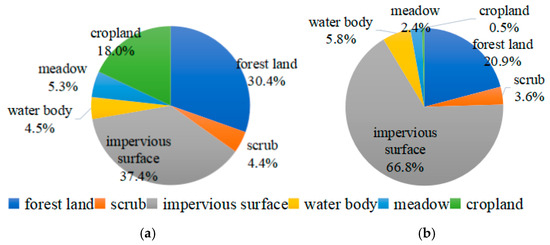
Figure 2.
Land use types and proportions within a 10 km radius of the (a) rural or (b) urban sampling sites.
3.2. Concentration of Airborne Fungi
Fungal concentrations are presented as the log(copies/m3) in Figure 3. Compared to the urban site, the rural site showed significantly lower concentrations in summer (p < 0.05), but higher values in autumn (p < 0.05). The urban site demonstrated a higher average temperature (29.2 °C) than the rural site (28.9 °C) during the summer sampling period (Table S1), likely associated with the urban heat island effect, which might promote fungal reproduction and lead to higher concentrations. Contrastingly, the large proportion of agricultural land and seasonal harvesting might explain the higher fungal concentration in the rural site in autumn compared to in the urban site. No significant difference in the fungal concentration was observed between the urban and rural sites during spring and winter. At the urban site, the fungal concentrations in autumn were significantly lower than those in spring (p < 0.001), summer (p < 0.01), and winter (p < 0.001), while no significant differences were observed among spring, summer, and winter (Figure S3). At the rural site, summer fungal concentrations were significantly lower than those in spring (p < 0.001), autumn (p < 0.05), and winter (p < 0.001), with spring concentrations significantly higher than in autumn (p < 0.05), and no significant difference between spring and winter.
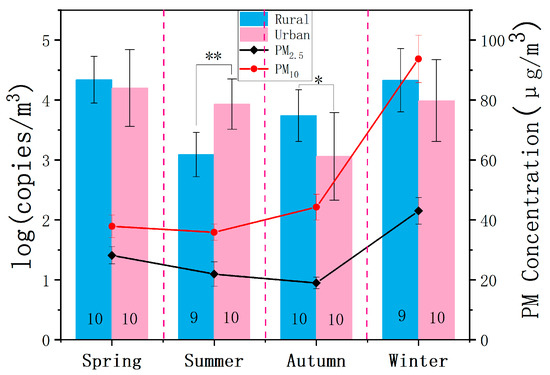
Figure 3.
Airborne fungal concentrations in log(copies/m3) at the urban and rural sites during four seasons. PM indicates Particulate Matter. The black numbers in each column represent the number of samples analyzed. One-way ANOVA was used to test for differences between samples, with * and ** indicating p < 0.05 and p < 0.01, respectively. Error bars denote standard deviations. The line represents the trends of PM2.5 and PM10 concentrations.
Although bioaerosols are predominantly hydrophobic, positive correlations between the RH and concentration of bioaerosols have been observed in previous studies. It was indicated that the RH and temperature affect the amount of emission from the source and regulate the release process of fungal spores [31]. High RH values (70–80%) particularly assist the release of basidiospores and ascospores. It was also suggested that elevated RH supports microbial proliferation by creating favorable conditions for growth and reproduction, thereby increasing microbial abundance [32]. Furthermore, the RH was a key factor in strengthening the hygroscopic growth of bioaerosols [33], and this growth varied among fungal species because of the differences in the chemical composition of the spore coating [34].
High summer temperatures and RH are generally conducive to fungal reproduction; however, relatively low concentrations were observed in summer compared to in other seasons at both the urban and rural sites, which could be linked to the lower concentrations of PM2.5 and relatively clean air masses originating from the South China coast and offshore area (Figure 1a,b). It was also indicated that extremely high temperatures (especially those exceeding 30 °C) could suppress fungal growth, and that excessive RH (approaching 100%) might cause spores to adhere and settle, thus preventing their effective dispersion. Previous studies observed reduced fungal spore concentrations under extreme RH levels in cities such as Guwahati, Kolkata, and Delhi [35,36,37,38]. The decline in fungal concentrations might also be attributed to the wet removal effect of precipitation during heavy rainfall [39]. Therefore, the extreme temperatures (Table S1) in Shanghai during summer and the frequent rainfall in summer and autumn associated with the East Asian summer monsoon season likely play a part in seasonally lower concentrations of airborne fungi.
3.3. Dominant Fungal Taxa
A total of 14 and 12 fungal phyla were identified at the rural and urban sites, respectively (Figure 4). Ascomycota was found to be the most abundant phylum, occupying averages of 74.8% and 78.5% of fungal taxa at the rural and urban sites in spring, 64.6% and 78.2% in summer, 75.2% and 80.6% in autumn, and 90.3% and 91.1% in winter, respectively. Basidiomycota was ranked the second highest phylum, accounting for averages of 24.3% and 20.6% at the rural and urban sites in spring, 32.5% and 17.7% in summer, 12.3% and 4.93% in autumn, and 7.64% and 7.63% in winter, respectively. These findings align with previous studies indicating that Ascomycota and Basidiomycota are consistently the most abundant fungal phyla in the atmosphere [40]. Ascomycota was more abundant at the urban site compared to at the rural site in all seasons, whereas Basidiomycota had higher proportions at the rural site. A similar seasonal pattern was found for both sampling sites, with Ascomycota peaking in winter and Basidiomycota reaching its highest in spring or summer. Previous studies have suggested that Ascomycota includes many fungal allergens and pathogens that are abundant in outdoor environments [41], thus posing a higher risk of allergy in winter compared to summer.
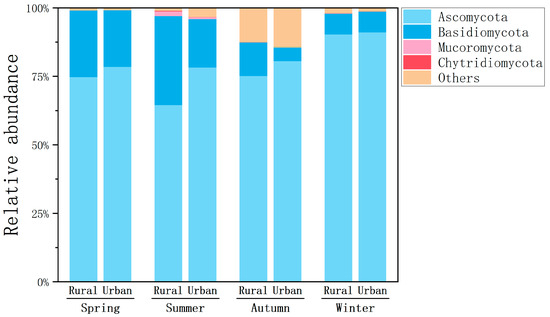
Figure 4.
Relative abundances of dominant fungal phyla in the atmosphere at the rural and urban sites in different seasons.
The higher ratio of Ascomycota/Basidiomycota in winter compared to summer and fall was also observed in the mix of urban and rural air in central Europe, and the ambient temperature and RH were found to be negatively and positively correlated with the proportions of Ascomycota and Basidiomycota, respectively [42]. Ascomycota are largely among molds, endophytes, and epiphytes that may spread in winter (especially with mild cold conditions in Shanghai), whereas Basidiomycota primarily rely on mushroom-forming species that develop fruiting bodies during warmer seasons [43]. Apart from the sources, the elevated proportion of Ascomycota also accorded with the lower temperature and RH in winter compared to other seasons (Table S1). Moreover, Ascomycota are mostly single celled (yeast) or filamentous (hyphal), with relatively small sizes of spores (e.g., Cladosporium, the prominent taxa, have aerodynamic diameters of 2–5 μm). In contrast, Basidiomycota tend to have spores with relatively large aerodynamic diameters (5–10 μm) due to the release of large tissue particles [43]. Small particles of Ascomycota may accumulate more than those of Basidiomycota under the conditions of temperature inversion and decreased dispersion in winter.
A total of 1524 and 1451 fungal genera were identified at the rural and urban sites, respectively. The top five genera of airborne fungi were Cladosporium, Nigrospora, Alternaria, Aspergillus, and Fusarium, accounting for averages of 18.9%, 7.74%, 7.60%, 4.83%, and 2.73% of the total fungi, respectively (Figure 5). These fungal genera showed various ranking orders in different seasons, influenced predominantly by the prevailing winds, temperature, RH, air pollution, and local agricultural activities. Plant debris, including fallen leaves, decaying plants, and tree bark, acts as a major habitat for these fungal spores. Soil microbial communities also harbor these fungi, particularly in moist and warm environments. Cladosporium belongs to a ‘dry-spore’ group of taxa with optimal growth temperatures at 18–28 °C, and can still slowly grow around 0 °C [44]. The seasonal and site variations in the relative abundance of Cladosporium were strongly affected by other top genera (Figure 5).
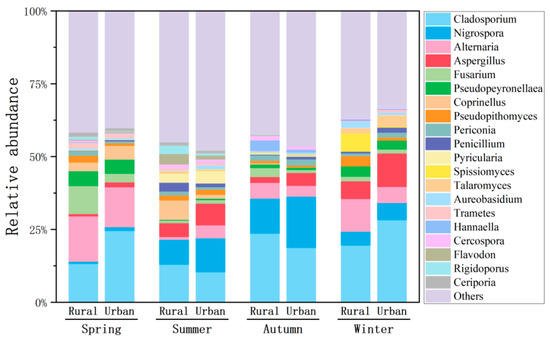
Figure 5.
Relative abundances of dominant fungal genera in the atmosphere at the rural and urban sites in different seasons.
Cladosporium and Alternaria/Aspergillus accounted for the two highest proportions in winter and spring, whereas Cladosporium and Nigrospora were the most abundant genera in summer and autumn (Figure 5). Higher concentrations of fungi were observed in winter and spring compared to summer and autumn, consistent with the prevailing winds from the inland area and the sources of the terrestrial ecosystem (Figure 3). Accordingly, the mean concentration of PM2.5 (41.9 μg/m3) during winter was approximately twice of those in summer (23.2 μg/m3) and autumn (18.3 μg/m3). Both the highest fungi and PM2.5 in winter were also partly attributed to the poor diffusion conditions of the atmosphere. The second highest proportions of Alternaria/Aspergillus in winter and spring were consistent with their dominant sources in soil and on plants [45]. Nonetheless, Nigrospora has been reported to occur in both terrestrial and marine environments. Specifically, Nigrospora oryzae and Nigrospora sphaerica have predominantly been isolated from marine organisms such as corals, mangroves, macroalgae, sea fans, and sponges [46]. This may explain the second highest proportion of Nigrospora in summer (average 10%) and autumn (14.8%), when the majority of air masses passed through the ocean prior to sampling sites (Figure 1 and Figure 5).
Alternatia outcompeted Aspergillus in spring (15.6% vs. 0.77% for the rural site and 13.8% vs. 1.64% for the urban site, with an average temperature of 22.3 °C and a RH of 78.3%), but only the rural site in winter (11.3% vs. 6.11%, with an average temperature of 6.84 °C and RH of 46.1%, Figure 5), which agreed well with previous findings on Alternatia Alternata. The species prefers a warm environment and shows a reduction in the growth rate when the temperature is below 15 °C [47]. Although its spore counts remained high throughout the year in subtropical areas, it showed the highest values from May to November in temperate climates and in the area surrounded by intensive agricultural practices [48]. By contrast, the relative abundance of Aspergillus reached its peak in winter (6.11%) and was lowest in spring. Aspergillus is capable of tolerating low-temperature environments, and the cold conditions in winter do not limit its growth or spore release. Some Aspergillus species exhibit stronger reproductive capabilities during the cold winter months [49].
Both Alternaria (average 15.6%) and Fusarium (9.64%) reached their highest relative abundance in spring (Figure 5). Agricultural activities such as crop cultivation and field management (e.g., fertilization and irrigation) may serve as the primary sources of Alternaria and Fusarium spores. In agricultural areas, spring typically coincides with the sowing season and peak field management activities, which may promote higher proportions of Alternaria and Fusarium at the rural site than at the urban site.
Nigrospora magnoliae, Cladosporium herbarum, Pseudopeyronellaea eucalypti, Coprinellus radians, Fusarium culmorum, Pseudopithomyces rosae, and Aspergillus flavus were identified as the most abundant species of airborne fungi, accounting for averages of 5.32% and 7.17%, 1.58% and 3.67%, 2.51% and 2.29%, 2.04% and 1.22%, 2.38% and 0.79%, 2.0% and 0.99%, and 0.62% and 1.09% of total species at the rural and urban sites, respectively (Figure 6). N. magnolia demonstrated a seasonal pattern similar to that of Nigrospora genus, with its highest and lowest relative abundances in autumn and spring, respectively. P. eucalypti, C. radians, P. rosaea, and A. flavus all presented the same seasonal variations as their respective genera, suggesting the likely dominance of these species. F. culmorum showed the highest proportion in spring, consistent with Fusarium genus; however, this species almost disappeared in other seasons. Moreover, C. herbarum illustrated the highest proportion in spring, in contrast to the more abundant Cladosporium genus in autumn and winter.
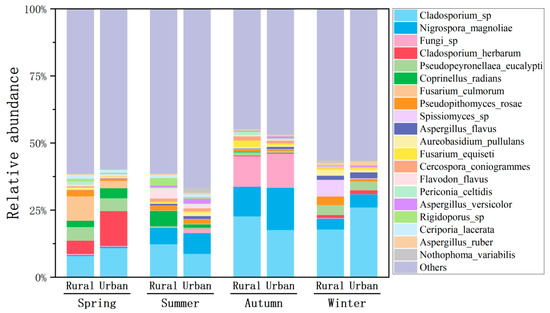
Figure 6.
Relative abundances of dominant fungal species in the atmosphere at the rural and urban sites in different seasons.
3.4. Fungal Community Diversity
Alpha diversity indices, including the Chao1, Shannon, Simpson, and Pielou_e indices, were calculated for each sampling season to quantify fungal community richness, diversity, diversity, and evenness, respectively. The Chao1 index estimates the total richness, including undetected species, which reflects the number of unique fungal taxa presented in the atmosphere. Both the Shannon and Simpson indices combine species richness and evenness, and higher values indicate greater diversity (both with more species and more balanced abundances). It should be noted that the Simpson index highlights dominant taxa, while the Shannon index is more sensitive to rare taxa. Pielou_e isolates evenness by normalizing the Shannon index against the theoretical maximum for the observed richness. Specifically, a low Pielou_e index often signals environmental stress (e.g., pollution or extreme pH), resource limitation, or the competitive dominance of a few taxa.
Comparisons of diversity indices between the urban and rural sites for each season revealed no significant differences (Kruskal–Wallis test, p > 0.05, Figure 7), although the Chao1 index in the rural area was higher than that of the urban site during winter (median 996 vs. 832). For both sampling sites, largely seasonal fluctuations in fungal community diversities were observed. Specifically, the Chao1 index in autumn was significantly lower than in winter and summer for the rural and urban sites, respectively (Kruskal–Wallis test, p < 0.05), with no significant differences among the other seasons (Figure 7a). The Shannon index in summer was found to be significantly higher than in spring and autumn for the urban site (Kruskal–Wallis test, p < 0.05), while no significant seasonal difference was observed at the rural site (Figure 7b). Unlike the Chao1 and Shannon indices, the Simpson index in summer significantly exceeded that of all other seasons (p < 0.01 for spring and autumn and p < 0.05 for winter) at the urban site, but it was only higher than autumn at the rural site (p < 0.05, Figure 7c). Pielou_e index comparisons indicated no significant seasonal difference at the rural site (p > 0.05), whereas the urban site showed a significantly higher value in summer compared with spring (p < 0.01), but not with other seasons (Figure 7d).
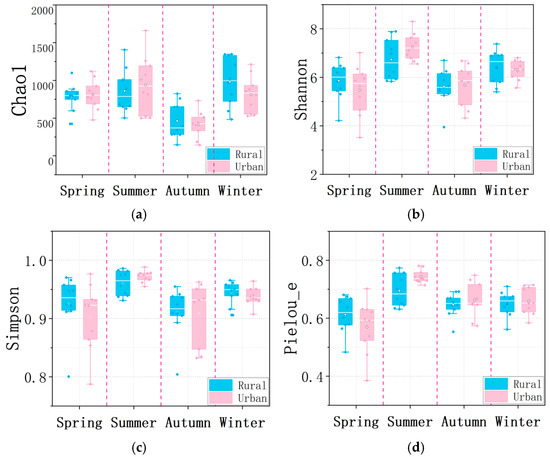
Figure 7.
Airborne fungal diversities including (a) Chao1, (b) Shannon, (c) Simpson, and (d) Pielou_e indices at the rural and urban sites in different seasons. Boxes represent interquartile ranges, horizontal lines within boxes indicate medians.
Overall, fungal richness (Chao1 index) peaked in winter and summer for the rural and urban sites, respectively, with the lowest values in autumn at both sites; fungal diversity (Shannon index) was the highest in summer followed by winter at both sites (Figure 7a,b). The elevated diversities of the airborne fungal community in summer, especially in the urban area (both richness and evenness), agreed well with the increased temperature (average 29.1 °C) and RH (78.3%), which could promote the growth and proliferation of fungal species and niche diversification. However, the maximum richness of airborne fungi occurred at the rural site in winter, aligning with the highest concentrations of PM2.5 in this season. This may be explained as the poor dispersion condition of accumulated particles and also strengthened local source emissions of fungal species in the rural area with large portions of agricultural (18.0%) and forest (30.4%) lands. Moreover, the lowest richness in autumn was likely associated with the majority of air masses in autumn passing through the ocean prior to the sampling sites during this period, and the fungal abundance in the marine boundary layer could be 1–3 orders of magnitude lower than that over land [50].
The PCoA analysis revealed significant seasonal variations in the fungal community’s composition, with samples from the spring completely diverging from those of other seasons and samples from the autumn slightly overlapping with those of the summer and more with the winter ones (Figure 8). The samples from rural and urban sites during the same season clustered together, indicating no significant difference in the airborne fungal community between the two sites. Non-metric multidimensional scaling (NMDS) analysis demonstrated the isolation of the four seasons, with overlapped rural and urban samples in each season (Figure S4). The seasonal separation suggested distinct community structures, such as substantially lower proportions of Nigrospora and Aspergillus in spring than in the other three seasons. Both genera could be more abundant with the increased presence of decaying plant materials, and therefore declined dramatically in spring (growing season), with fewer dead leaves.
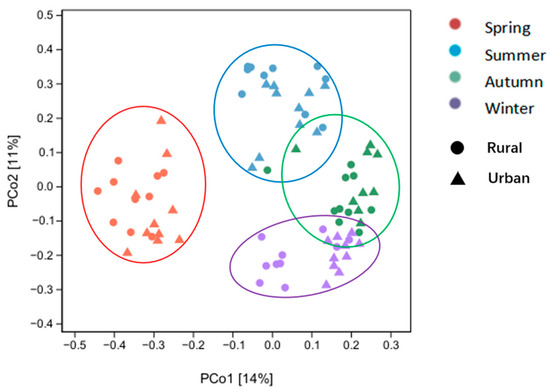
Figure 8.
The Principal Coordinate Analysis (PCoA) based on Bray–Curtis distances of airborne fungal communities measured at the rural and urban sites in different seasons. PCoA ordination was based on OTU level. The percentage values along each axis represent the proportion of variance explained by the corresponding axis. Seasons are differentiated by distinct colors, while sampling sites are represented by distinct shapes.
3.5. Airborne Fungal Allergens
To date, approximately 80 fungal genera comprising 150 allergenic species have been identified as containing allergenic proteins [29]. It was found that the primary allergenic species of airborne fungi from both urban and rural sites included Cladosporium sp., Fusarium culmorum, Cladosporium herbarum, and Aspergillus flavus. Allergenic fungi accounted for averages of 24.4%, 11.5%, 22.8%, and 25.1% of the total species in spring, summer, autumn, and winter, respectively (Figure S5).
At the rural site, the mean proportion of allergenic fungi in summer (13.1%) was significantly lower than in spring (22.1%, p < 0.05), autumn (22.8%, p < 0.01), and winter (20.5%, p < 0.05). There were no significant differences between spring, autumn, and winter (Figure 9). Similarly, the lowest mean proportion of allergenic fungi was also observed in summer (9.93%) at the urban site, which was significantly different compared to spring (26.8%, p < 0.01), autumn (22.8%, p < 0.05), and winter (29.8%, p < 0.01). Among the other three seasons, the autumn proportion was significantly lower than those in winter (p < 0.01) and spring (p < 0.05). There were no significant differences in allergen proportions between the urban and rural sites during spring, summer, or autumn. However, in winter, the proportion of allergenic fungi at the urban site was significantly higher than at the rural site (p < 0.01). These findings suggested that preventive measures for fungal allergens should particularly focus on winter in the urban area.
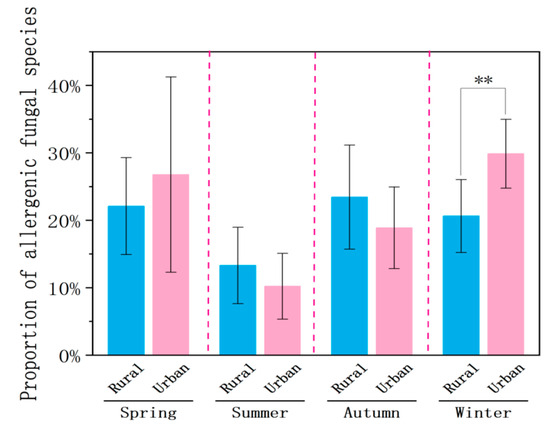
Figure 9.
Proportions of allergenic species to total species of airborne fungi at the rural and urban sites in different seasons. Significant difference was indicated as p < 0.01 (**). Error bars represent standard deviations.
Cladosporium sp. was found to be the most abundant allergenic species, and it was substantially higher in the urban than rural site during the winter (p < 0.001, Figure 10). This notable disparity in Cladosporium sp. largely accounts for the higher proportion of allergenic fungi observed at the urban site in winter. During the winter sampling period, the average temperature at the urban site was approximately 1 °C higher than at the rural site (7.31 °C vs. 6.38 °C), providing more favorable conditions for fungal growth and proliferation. Moreover, urban vegetation, often dominated by cultivated plants, may provide an ideal niche for Cladosporium, whereas the diverse and natural vegetation in rural areas may suppress the growth of specific fungal species [6]. No significant differences in the temperature, wind speed, RH, or PM2.5 concentrations were found between the rural and urban sites in each season (p > 0.05). The two sampling sites, located approximately 32 km apart in Shanghai (Figure 1c), are primarily influenced by large-scale weather systems (e.g., East Asian monsoons and subtropical highs) that drive regional climatic uniformity. This similarity is further reinforced by Shanghai’s flat topography, which promotes the horizontal dispersion of pollutants. Therefore, meteorological and pollution parameters were not important factors causing the changes in the fungal community composition. Regardless of the sites, Cladosporium sp. consistently exhibited the highest proportions, significantly exceeding those of other allergens. A. flavus ranked second, while F. culmorum displayed minimal proportions, approaching zero. No significant differences were observed between the urban and rural sites for A. flavus or F. culmorum (p > 0.05).
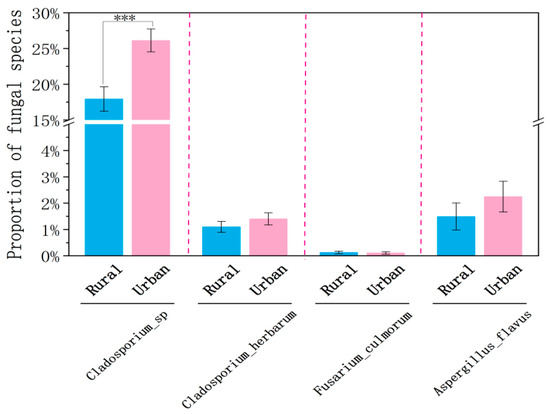
Figure 10.
Proportions of Cladosporium sp., Fusarium culmorum, Cladosporium herbarum, and Aspergillus flavus in winter at the rural and urban sites. Significant difference was indicated as p < 0.001 (***). Error bars represent standard deviations.
Both Cladosporium and Aspergillus are classified as molds. Although their optimal growth conditions vary, the ideal temperature range for mold growth is between 18 °C and 32 °C. Molds can thrive on almost any substrate, including glass and plastic surfaces. The spectrum of allergic symptoms caused by mold allergens is broad, including rhinitis, asthma, atopic dermatitis, and allergic bronchopulmonary mycosis [29]. Airborne spores of Cladosporium are serious allergens that can trigger asthma attacks or allergic reactions in individuals with respiratory conditions. Prolonged exposure may lead to immune system degradation. Although Cladosporium does not produce major toxic compounds, it is often associated with odors resulting from volatile organic compounds. Aspergillus species grow outdoors on decaying vegetation and indoors in environments such as air conditioning systems, producing numerous small conidia measuring 2–3 μm. Once inhaled, these conidia can either reach the terminal airways or accumulate in the upper respiratory tract [51,52]. Diseases caused by Aspergillus include respiratory disorders such as allergic pneumonitis (extrinsic allergic alveolitis), allergic rhinitis, sinusitis, asthma, life-threatening systemic invasive aspergillosis, and allergic bronchopulmonary aspergillosis [53,54].
4. Conclusions
Fungal spore exposure is strongly correlated with the prevalence of allergies and asthma, and urbanization may change airborne fungal communities and therefore significantly impact human health. Our study on the airborne fungi concurrently sampled from urban and rural sites revealed distinctly seasonal patterns in fungal concentrations, with relatively low levels in summer and autumn, which agreed well with the lower PM2.5 concentrations and cleaner air masses from the ocean or South China coast in these seasons. When comparing the two sites, significantly higher fungal concentrations were observed at the urban and rural sites in summer and autumn, respectively, likely associated with the slightly higher temperature at the urban site in summer (urban heat island effect) and the seasonally agricultural activities in the rural area. Ascomycota and Basidiomycota were the most dominant phyla of airborne fungi, and Cladosporium, Nigrospora, Alternaria, Aspergillus, and Fusarium were the top five genera. Cladosporium dominated year round, with Nigrospora ranking second in summer and autumn, Alternaria in spring and winter (only rural site), and Aspergillus in winter at the urban site. The order changes in the dominant genera were likely attributed to the significant marine sources of Nigrospora, the warm temperature preference of Alternaria, cold tolerance of Aspergillus, and the degree of association with agricultural activities. No significant differences in fungal diversity were observed between the urban and rural sites, though the rural site showed relatively higher richness in winter. Both sites exhibited minimal diversity in autumn, consistent with predominantly marine-influenced air masses.
Allergenic fungal species displayed markedly seasonal variations. Urban and rural sites showed comparable proportions of total allergens in spring, summer, and autumn. However, urban winter samples had a significantly higher ratio of allergens, aligning with prior findings on elevated urban allergy prevalence. Major allergenic species included Cladosporium sp., Fusarium culmorum, Cladosporium herbarum, and Aspergillus flavus. The relative abundance of Cladosporium sp. was significantly higher, and C. herbarum and A. flavus also increased, corresponding to the lower fungal richness in the urban compared to the rural site in winter. These findings suggest that urbanization may increase the proportions of fungal allergens in the atmosphere, posing a heightened health risk to the urban population.
Supplementary Materials
The following supporting information can be downloaded at: https://www.mdpi.com/article/10.3390/atmos16060641/s1. Table S1: Meteorological data and PM2.5 and PM10 concentrations on sampling dates of airborne fungi at the rural and urban sites in different seasons; Figure S1: The wind rose diagrams in four sampling periods for the rural site; Figure S2: The wind rose diagrams in four sampling periods for the urban site; Figure S3: Seasonal variations in airborne fungal concentrations in log(copies/m3) at the rural and urban sites; Figure S4: Non-metric multidimensional scaling (NMDS) based on Bray–Curtis distances of airborne fungal communities sampled at the rural and urban sites in different seasons; and Figure S5: The proportions of allergenic species to total fungi in the atmosphere at the rural and urban sites in different seasons.
Author Contributions
Conceptualization, Y.C.; data curation, K.Y.; formal analysis, K.Y. and Y.C.; funding acquisition, Y.C.; investigation, K.Y., Y.L., and J.H.; methodology, K.Y. and Y.C.; software, K.Y. and M.Z.; supervision, Y.C.; validation, K.Y. and Y.L.; visualization, K.Y. and M.Z.; writing—original draft, K.Y.; writing—review and editing, Y.C. All authors have read and agreed to the published version of the manuscript.
Funding
This work is jointly Sponsored by the Natural Science Foundation of Shanghai (22ZR1403800) and the National Natural Science Foundation of China (41775145).
Institutional Review Board Statement
Not applicable.
Informed Consent Statement
Not applicable.
Data Availability Statement
The data will be made available on request.
Acknowledgments
We greatly thank the NOAA Air Resources Laboratory (ARL) for providing the HYSPLIT model. We acknowledge Yujing Xie for sharing the land-use type data of Shanghai. We also thank Shanghai Pudong Environmental Monitoring Station for assistance in field observations.
Conflicts of Interest
The authors declare no conflicts of interest.
Abbreviations
The following abbreviations are used in this manuscript:
| TSPs | Total suspended particles |
| RH | Relative humidity |
| qPCR | Quantitative Polymerase Chain Reaction |
| ASVs | Amplicon sequence variants |
References
- Fröhlich-Nowoisky, J.; Kampf, C.J.; Weber, B.; Huffman, J.A.; Pöhlker, C.; Andreae, M.O.; Lang-Yona, N.; Burrows, S.M.; Gunthe, S.S.; Elbert, W.; et al. Bioaerosols in the Earth System: Climate, Health, and Ecosystem Interactions. Atmos. Res. 2016, 182, 346–376. [Google Scholar] [CrossRef]
- Blackwell, M. The Fungi: 1, 2, 3 … 5.1 Million Species? Am. J. Bot. 2011, 98, 426–438. [Google Scholar] [CrossRef] [PubMed]
- Hawksworth, D.L.; Lücking, R. Fungal Diversity Revisited: 2.2 to 3.8 Million Species. Microbiol. Spectr. 2017, 5. [Google Scholar] [CrossRef] [PubMed]
- Bongomin, F.; Gago, S.; Oladele, R.O.; Denning, D.W. Global and Multi-National Prevalence of Fungal Diseases-Estimate Precision. J. Fungi 2017, 3, 57. [Google Scholar] [CrossRef]
- Gabaldón, T.; Naranjo-Ortíz, M.A.; Marcet-Houben, M. Evolutionary Genomics of Yeast Pathogens in the Saccharomycotina. FEMS Yeast Res. 2016, 16, fow064. [Google Scholar] [CrossRef]
- Hassan, M.I.A.; Voigt, K. Pathogenicity Patterns of Mucormycosis: Epidemiology, Interaction with Immune Cells and Virulence Factors. Med. Mycol. 2019, 57, S245–S256. [Google Scholar] [CrossRef]
- Opulente, D.A.; Langdon, Q.K.; Buh, K.V.; Haase, M.A.B.; Sylvester, K.; Moriarty, R.V.; Jarzyna, M.; Considine, S.L.; Schneider, R.M.; Hittinger, C.T. Pathogenic Budding Yeasts Isolated Outside of Clinical Settings. FEMS Yeast Res. 2019, 19, foz032. [Google Scholar] [CrossRef]
- Singh-Babak, S.D.; Babak, T.; Fraser, H.B.; Johnson, A.D. Lineage-Specific Selection and the Evolution of Virulence in the Candida Clade. Proc. Natl. Acad. Sci. USA 2021, 118, e2016818118. [Google Scholar] [CrossRef]
- Denning, D.W.; O’Driscoll, B.R.; Hogaboam, C.M.; Bowyer, P.; Niven, R.M. The Link between Fungi and Severe Asthma: A Summary of the Evidence. Eur. Respir. J. 2006, 27, 615–626. [Google Scholar] [CrossRef]
- Arbes, S.J.; Gergen, P.J.; Elliott, L.; Zeldin, D.C. Prevalences of Positive Skin Test Responses to 10 Common Allergens in the US Population: Results from the Third National Health and Nutrition Examination Survey. J. Allergy Clin. Immunol. 2005, 116, 377–383. [Google Scholar] [CrossRef]
- Mari, A.; Schneider, P.; Wally, V.; Breitenbach, M.; Simon-Nobbe, B. Sensitization to Fungi: Epidemiology, Comparative Skin Tests, and Ige Reactivity of Fungal Extracts. Clin. Exp. Allergy 2003, 33, 1429–1438. [Google Scholar] [CrossRef] [PubMed]
- Pongracic, J.A.; O’Connor, G.T.; Muilenberg, M.L.; Vaughn, B.; Gold, D.R.; Kattan, M.; Morgan, W.J.; Gruchalla, R.S.; Smartt, E.; Mitchell, H.E. Differential Effects of Outdoor Versus Indoor Fungal Spores on Asthma Morbidity in Inner-City Children. J. Allergy Clin. Immunol. 2010, 125, 593–599. [Google Scholar] [CrossRef] [PubMed]
- Roy, S.; Chakraborty, A.; Maitra, S.; Bhattacharya, K. Monitoring of Airborne Fungal Spore Load in Relation to Meteorological Factors, Air Pollutants and Allergic Symptoms in Farakka, an Unexplored Biozone of Eastern India. Environ. Monit. Assess. 2017, 189, 370. [Google Scholar] [CrossRef]
- Baxi, S.N.; Sheehan, W.J.; Sordillo, J.E.; Muilenberg, M.L.; Rogers, C.A.; Gaffin, J.M.; Permaul, P.; Lai, P.S.; Louisias, M.; Petty, C.R.; et al. Association between Fungal Spore Exposure in Inner-City Schools and Asthma Morbidity. Ann. Allergy Asthma Immunol. 2019, 122, 610–615. [Google Scholar] [CrossRef]
- Chen, C.H.; Chao, J.; Chan, C.C.; Chen, B.Y.; Guo, Y.L. Current Asthma in Schoolchildren Is Related to Fungal Spores in Classrooms. Chest 2014, 146, 123–134. [Google Scholar] [CrossRef]
- Lewis, S.A.; Corden, J.M.; Forster, G.E.; Newlands, M. Combined Effects of Aerobiological Pollutants, Chemical Pollutants and Meteorological Conditions on Asthma Admissions and a & E Attendances in Derbyshire UK, 1993–1996. Clin. Exp. Allergy 2000, 30, 1724–1732. [Google Scholar]
- Tham, R.; Vicendese, D.; Dharmage, S.C.; Hyndman, R.J.; Newbigin, E.; Lewis, E.; O’Sullivan, M.; Lowe, A.J.; Taylor, P.; Bardin, P.; et al. Associations between Outdoor Fungal Spores and Childhood and Adolescent Asthma Hospitalizations. J. Allergy Clin. Immunol. 2017, 139, 1140–1147.e4. [Google Scholar] [CrossRef]
- Flies, E.J.; Clarke, L.J.; Brook, B.W.; Jones, P. Urbanisation Reduces the Abundance and Diversity of Airborne Microbes—But What Does That Mean for Our Health? A Systematic Review. Sci. Total Environ. 2020, 738, 140337. [Google Scholar] [CrossRef]
- Li, X.Y.; Chen, H.X.; Yao, M.S. Microbial Emission Levels and Diversities from Different Land Use Types. Environ. Int. 2020, 143, 105988. [Google Scholar] [CrossRef]
- Bowers, R.M.; Clements, N.; Emerson, J.B.; Wiedinmyer, C.; Hannigan, M.P.; Fierer, N. Seasonal Variability in Bacterial and Fungal Diversity of the near-Surface Atmosphere. Environ. Sci. Technol. 2013, 47, 12097–12106. [Google Scholar] [CrossRef] [PubMed]
- Liao, C.M.; Luo, W.C.; Chen, S.C.; Chen, J.W.; Liang, H.M. Temporal/Seasonal Variations of Size-Dependent Airborne Fungi Indoor/Outdoor Relationships for a Wind-Induced Naturally Ventilated Airspace. Atmos. Environ. 2004, 38, 4415–4419. [Google Scholar] [CrossRef]
- Oliveira, M.; Ribeiro, H.; Abreu, I. Annual Variation of Fungal Spores in Atmosphere of Porto: 2003. Ann. Agric. Environ. Med. 2005, 12, 309–315. [Google Scholar] [PubMed]
- Yamamoto, N.; Bibby, K.; Qian, J.; Hospodsky, D.; Rismani-Yazdi, H.; Nazaroff, W.W.; Peccia, J. Particle-Size Distributions and Seasonal Diversity of Allergenic and Pathogenic Fungi in Outdoor Air. ISME J. 2012, 6, 1801–1811. [Google Scholar] [CrossRef] [PubMed]
- Burch, M.; Levetin, E. Effects of Meteorological Conditions on Spore Plumes. Int. J. Biometeorol. 2002, 46, 107–117. [Google Scholar]
- Núñez, A.; de Paz, G.A.; Rastrojo, A.; García, A.M.; Alcamí, A.; Gutiérrez-Bustillo, A.M.; Moreno, D.A. Monitoring of Airborne Biological Particles in Outdoor Atmosphere. Part 1: Importance, Variability and Ratios. Int. Microbiol. 2016, 19, 1–13. [Google Scholar]
- Wu, J.; Cunanan, J.; Kim, L.; Kulatunga, T.; Huang, C.; Anekella, B. Stability of Genomic DNA at Various Storage Conditions. In Proceedings of the International Society for Biological and Environmental Repositories 2009 Annual Meeting, Portland, OR, USA, 12–15 May 2009; Volume 12. [Google Scholar]
- Xu, C.H.; Chen, H.; Liu, Z.; Sui, G.D.; Li, D.; Kan, H.D.; Zhao, Z.H.; Hu, W.; Chen, J.M. The Decay of Airborne Bacteria and Fungi in a Constant Temperature and Humidity Test Chamber. Environ. Int. 2021, 157, 106816. [Google Scholar] [CrossRef]
- Ramakodi, M.P. A Comprehensive Evaluation of Single-End Sequencing Data Analyses for Environmental Microbiome Research. Arch. Microbiol. 2021, 203, 6295–6302. [Google Scholar] [CrossRef]
- Callahan, B.J.; McMurdie, P.J.; Rosen, M.J.; Han, A.W.; Johnson, A.J.A.; Holmes, S.P. Dada2: High-Resolution Sample Inference from Illumina Amplicon Data. Nat. Methods 2016, 13, 581–582. [Google Scholar] [CrossRef]
- Breitenbach, M. The Spectrum of Fungal Allergy. Int. Arch. Allergy Immunol. 2008, 145, 58–86. [Google Scholar]
- Jones, A.M.; Harrison, R.M. The Effects of Meteorological Factors on Atmospheric Bioaerosol Concentrations—A Review. Sci. Total Environ. 2004, 326, 151–180. [Google Scholar] [CrossRef] [PubMed]
- Gao, M.; Yan, X.; Qiu, T.L.; Han, M.L.; Wang, X.M. Variation of Correlations between Factors and Culturable Airborne Bacteria and Fungi. Atmos. Environ. 2016, 128, 10–19. [Google Scholar] [CrossRef]
- Li, Y.P.; Fu, H.L.; Wang, W.; Liu, J.; Meng, Q.L.; Wang, W.K. Characteristics of Bacterial and Fungal Aerosols during the Autumn Haze Days in Xi’an, China. Atmos. Environ. 2015, 122, 439–447. [Google Scholar] [CrossRef]
- Reponen, T.; Willeke, K.; Ulevicius, V.; Reponen, A.; Grinshpun, S.A. Effect of Relative Humidity on the Aerodynamic Diameter and Respiratory Deposition of Fungal Spores. Atmos. Environ. 1996, 30, 3967–3974. [Google Scholar] [CrossRef]
- Agarwal, M.K.; Shivpuri, D.N.; Mukerji, K.G. Studies on Allergenic Fungal Spores of Delhi, India, Metropolitan Area—Botanical Aspects (Aeromycology). J. Allergy 1969, 44, 193–203. [Google Scholar] [CrossRef]
- Chakrabarti, H.S.; Das, S.; Gupta-Bhattacharya, S. Outdoor Airborne Fungal Spora Load in a Suburb of Kolkata, India: Its Variation, Meteorological Determinants and Health Impact. Int. J. Environ. Health Res. 2012, 22, 37–50. [Google Scholar] [CrossRef]
- Garaga, R.; Avinash, C.K.R.; Kota, H. Seasonal Variation of Airborne Allergenic Fungal Spores in Ambient PM10 -a Study in Guwahati, the Largest City of North-East India. Air Qual. Atmos. Health 2019, 12, 11–20. [Google Scholar] [CrossRef]
- Kumar, A.; Attri, A.K. Characterization of Fungal Spores in Ambient Particulate Matter: A Study from the Himalayan Region. Atmos. Environ. 2016, 142, 182–193. [Google Scholar] [CrossRef]
- Liu, Y.; Zhang, Y.Y.; Shi, Y.T.; Shen, F.X.; Yang, Y.; Wang, M.J.; Zhang, G.Y.; Deng, T.; Lai, S.C. Characterization of Fungal Aerosol in a Landfill and an Incineration Plants in Guangzhou, Southern China: The Link to Potential Impacts. Sci. Total Environ. 2021, 764, 142908. [Google Scholar] [CrossRef]
- Gou, H.E.; Lu, J.J.; Li, S.M.; Tong, Y.B.; Xie, C.B.; Zheng, X.W. Assessment of Microbial Communities in PM1 and PM10 of Urumqi during Winter. Environ. Pollut. 2016, 214, 202–210. [Google Scholar] [CrossRef]
- Stalder, T.; Barraud, O.; Casellas, M.; Dagot, C.; Ploy, M.C. Integron Involvement in Environmental Spread of Antibiotic Resistance. Front. Microbiol. 2012, 3, 119. [Google Scholar] [CrossRef]
- Fröhlich-Nowoisky, J.; Pickersgill, D.A.; Després, V.R.; Pöschl, U. High Diversity of Fungi in Air Particulate Matter. Proc. Natl. Acad. Sci. USA 2009, 106, 12814–12819. [Google Scholar] [CrossRef] [PubMed]
- Hibbett, D.S.; Binder, M.; Bischoff, J.F.; Blackwell, M.; Cannon, P.F.; Eriksson, O.E.; Huhndorf, S.; James, T.; Kirk, P.M.; Lücking, R.; et al. A Higher-Level Phylogenetic Classification of the Fungi. Mycol. Res. 2007, 111, 509–547. [Google Scholar] [CrossRef] [PubMed]
- Grinn-Gofron, A.; Bosiacka, B. Effects of Meteorological Factors on the Composition of Selected Fungal Spores in the Air. Aerobiologia 2015, 31, 63–72. [Google Scholar] [CrossRef]
- Abel-Fernández, E.; Martínez, M.J.; Galán, T.; Pineda, F. Going over Fungal Allergy: Alternaria alternata and Its Allergens. J. Fungi 2023, 9, 582. [Google Scholar] [CrossRef] [PubMed]
- Lee, W.; Kim, D.G.; Perera, R.H.; Kim, J.S.; Cho, Y.; Lee, J.W.; Seo, C.W.; Lim, Y.W. Diversity of Nigrospora (Xylariales, Apiosporaceae) Species Identified in Korean Macroalgae Including Five Unrecorded Species. Mycobiology 2023, 51, 401–409. [Google Scholar] [CrossRef]
- Pose, G.; Patriarca, A.; Kyanko, V.; Pardo, A.; Pinto, V.F. Water Activity and Temperature Effects on Mycotoxin Production by Alternaria alternata on a Synthetic Tomato Medium. Int. J. Food Microbiol. 2010, 142, 348–353. [Google Scholar] [CrossRef]
- Kasprzyk, I.; Sulborska, A.; Nowak, M.; Szymanska, A.; Kaczmarek, J.; Haratym, W.; Weryszko-Chmielewska, E.; Jedryczka, M. Fluctuation Range of the Concentration of Airborne Alternaria conidiospores Sampled at Different Geographical Locations in Poland (2010–2011). Acta Agrobot. 2013, 66, 65–76. [Google Scholar] [CrossRef][Green Version]
- Rinu, K.; Malviya, M.K.; Sati, P.; Tiwari, S.C.; Pandey, A. Response of cold-tolerant Aspergillus spp. to solubilization of Fe and Al phosphate in presence of different nutritional sources. ISRN Soil Sci. 2013, 2013, 598541. [Google Scholar] [CrossRef]
- Santl-Temkiv, T.; Amato, P.; Casamayor, E.O.; Lee, P.K.H.; Pointing, S.B. Microbial Ecology of the Atmosphere. FEMS Microbiol. Rev. 2022, 46, fuac009. [Google Scholar] [CrossRef]
- Horner, W.E.; Helbling, A.; Salvaggio, J.E.; Lehrer, S.B. Fungal Allergens. Clin. Microbiol. Rev. 1995, 8, 161–179. [Google Scholar] [CrossRef]
- Vijay, H.M.; Kurup, V.P. Fungal Allergens. Clin. Allergy Immunol. 2004, 18, 223–249. [Google Scholar] [PubMed]
- Kurup, V.P.; Banerjee, B. Fungal Allergens and Peptide Epitopes. Peptides 2000, 21, 589–599. [Google Scholar] [CrossRef] [PubMed]
- Terr, A.I. Are Indoor Molds Causing a New Disease? J. Allergy Clin. Immunol. 2004, 113, 221–226. [Google Scholar] [CrossRef] [PubMed]
Disclaimer/Publisher’s Note: The statements, opinions and data contained in all publications are solely those of the individual author(s) and contributor(s) and not of MDPI and/or the editor(s). MDPI and/or the editor(s) disclaim responsibility for any injury to people or property resulting from any ideas, methods, instructions or products referred to in the content. |
© 2025 by the authors. Licensee MDPI, Basel, Switzerland. This article is an open access article distributed under the terms and conditions of the Creative Commons Attribution (CC BY) license (https://creativecommons.org/licenses/by/4.0/).