

Assessment of Coastal Zone Vulnerability in Context of Sea-Level Rise and Inundation Risk in Qatar


Abstract
1. Introduction
Study Objective
2. Materials and Methods
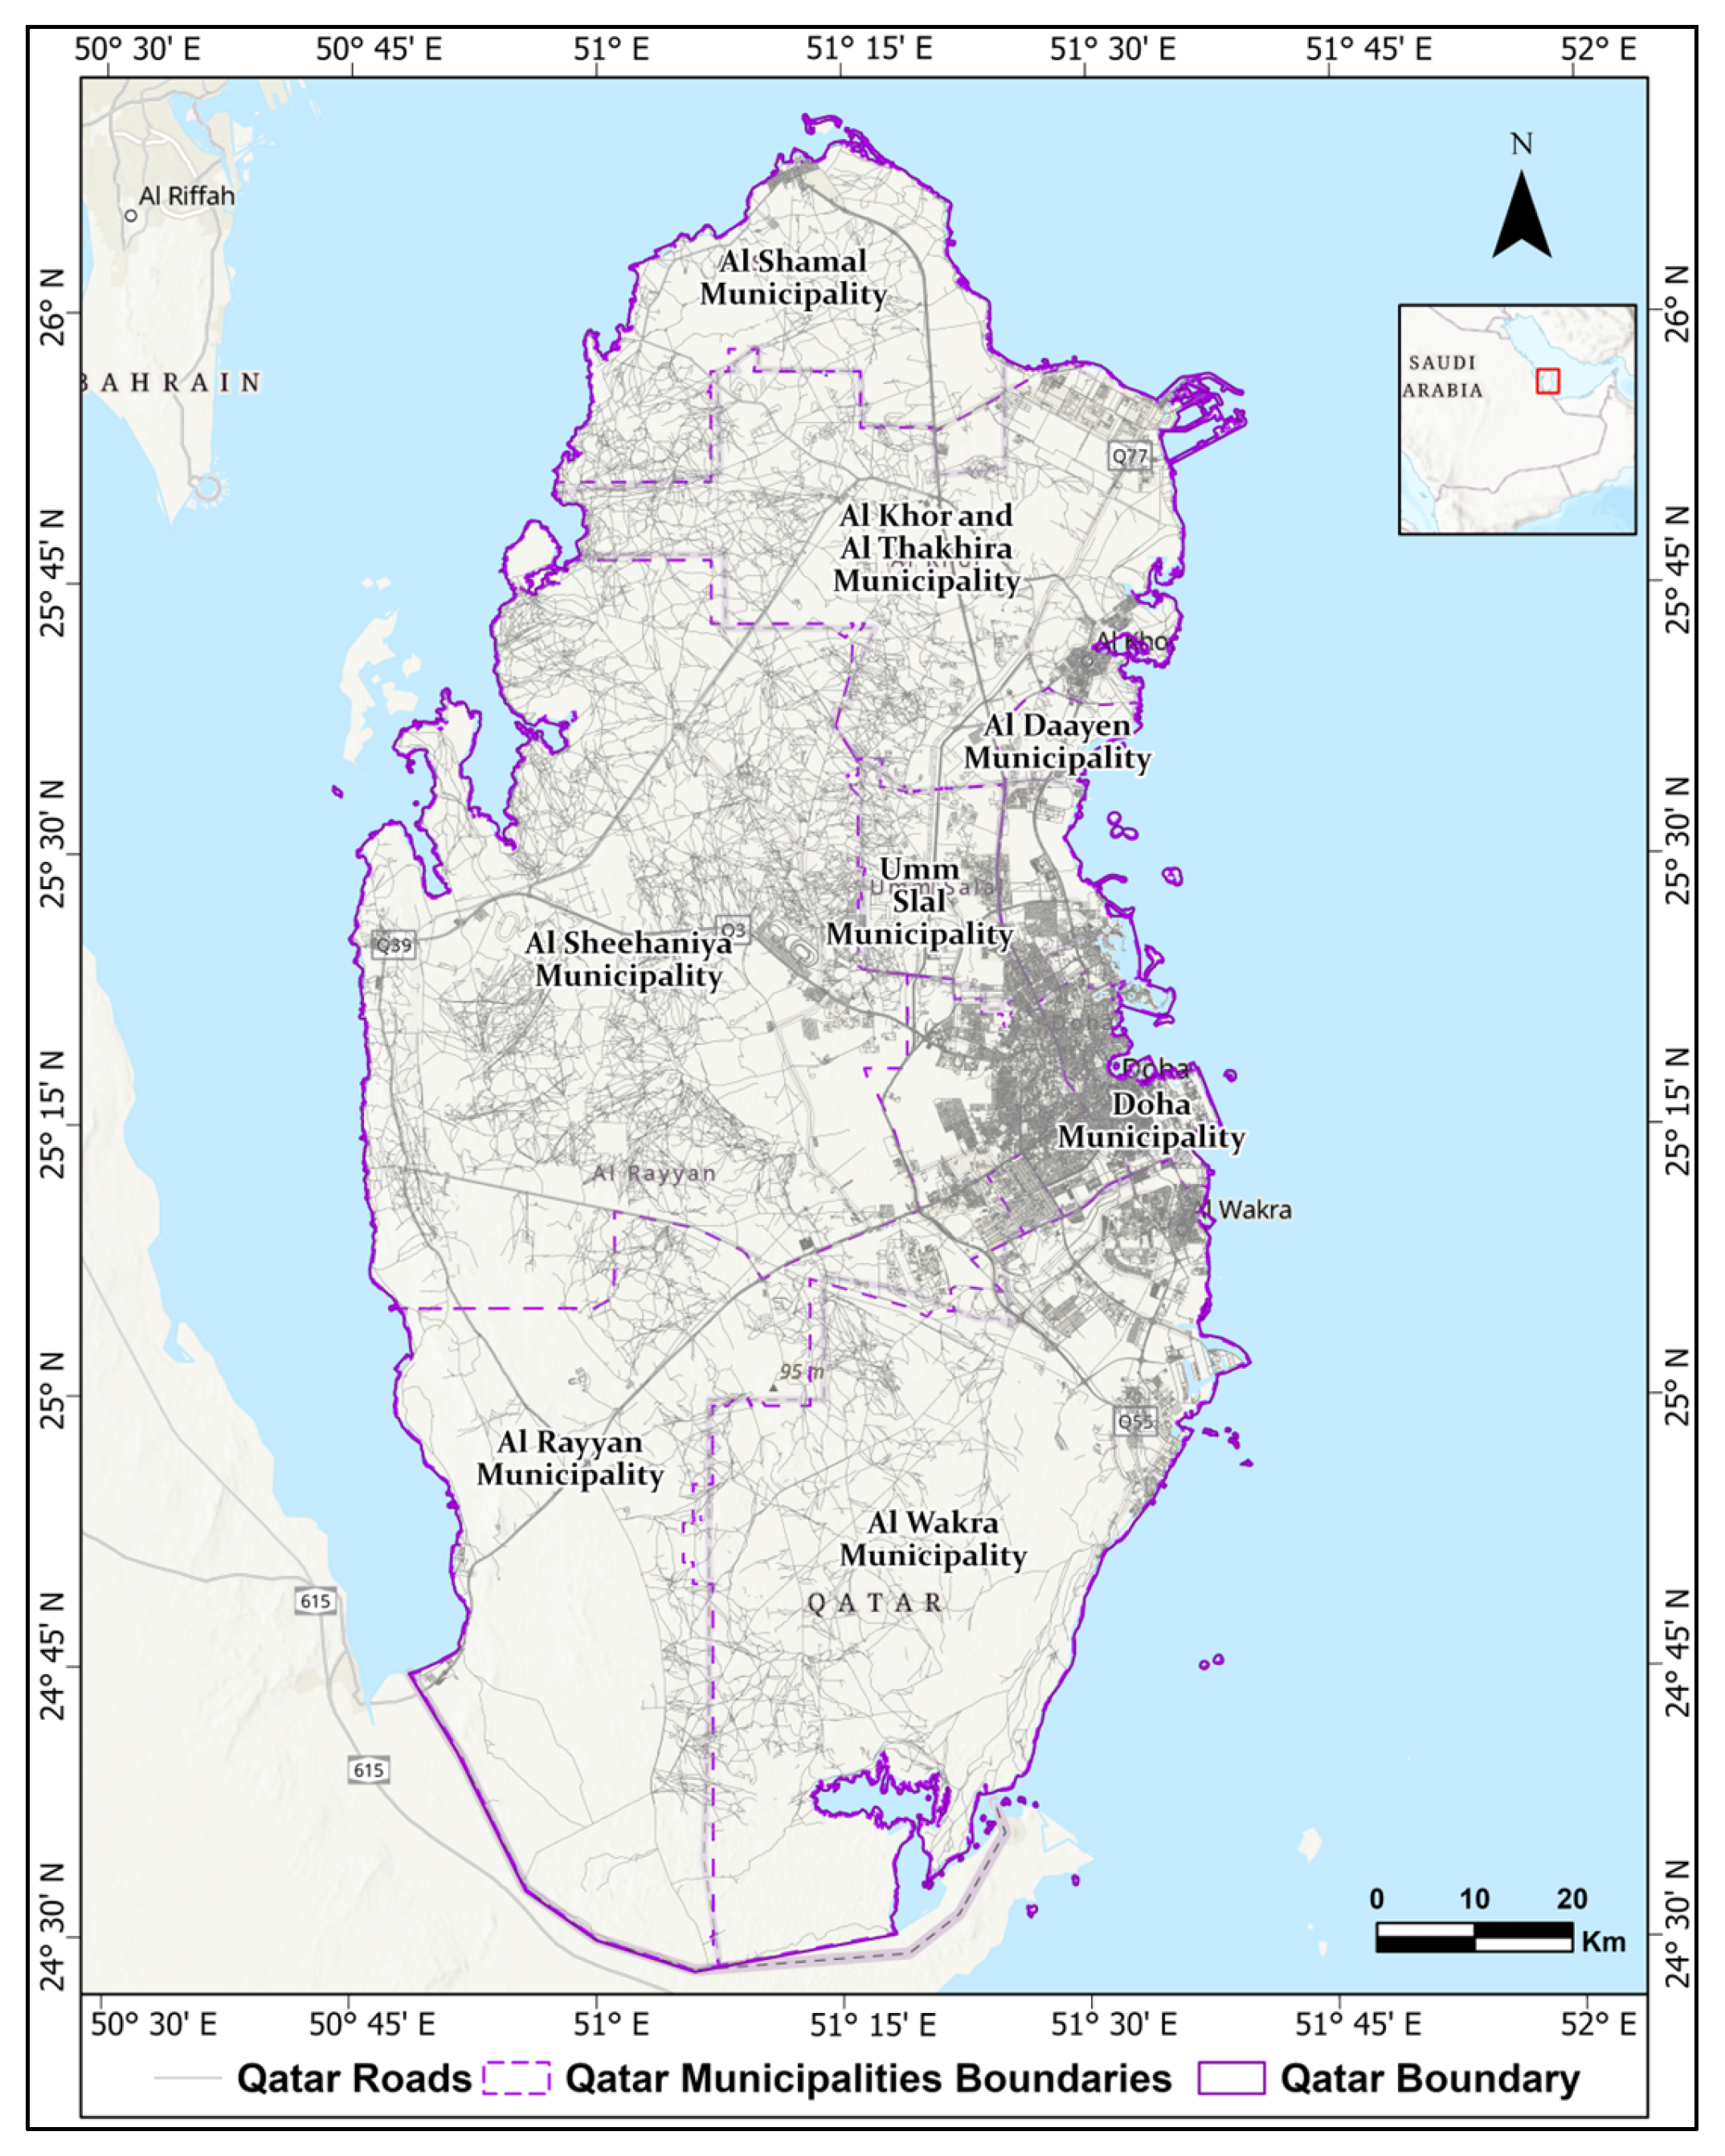
2.1. Study Area
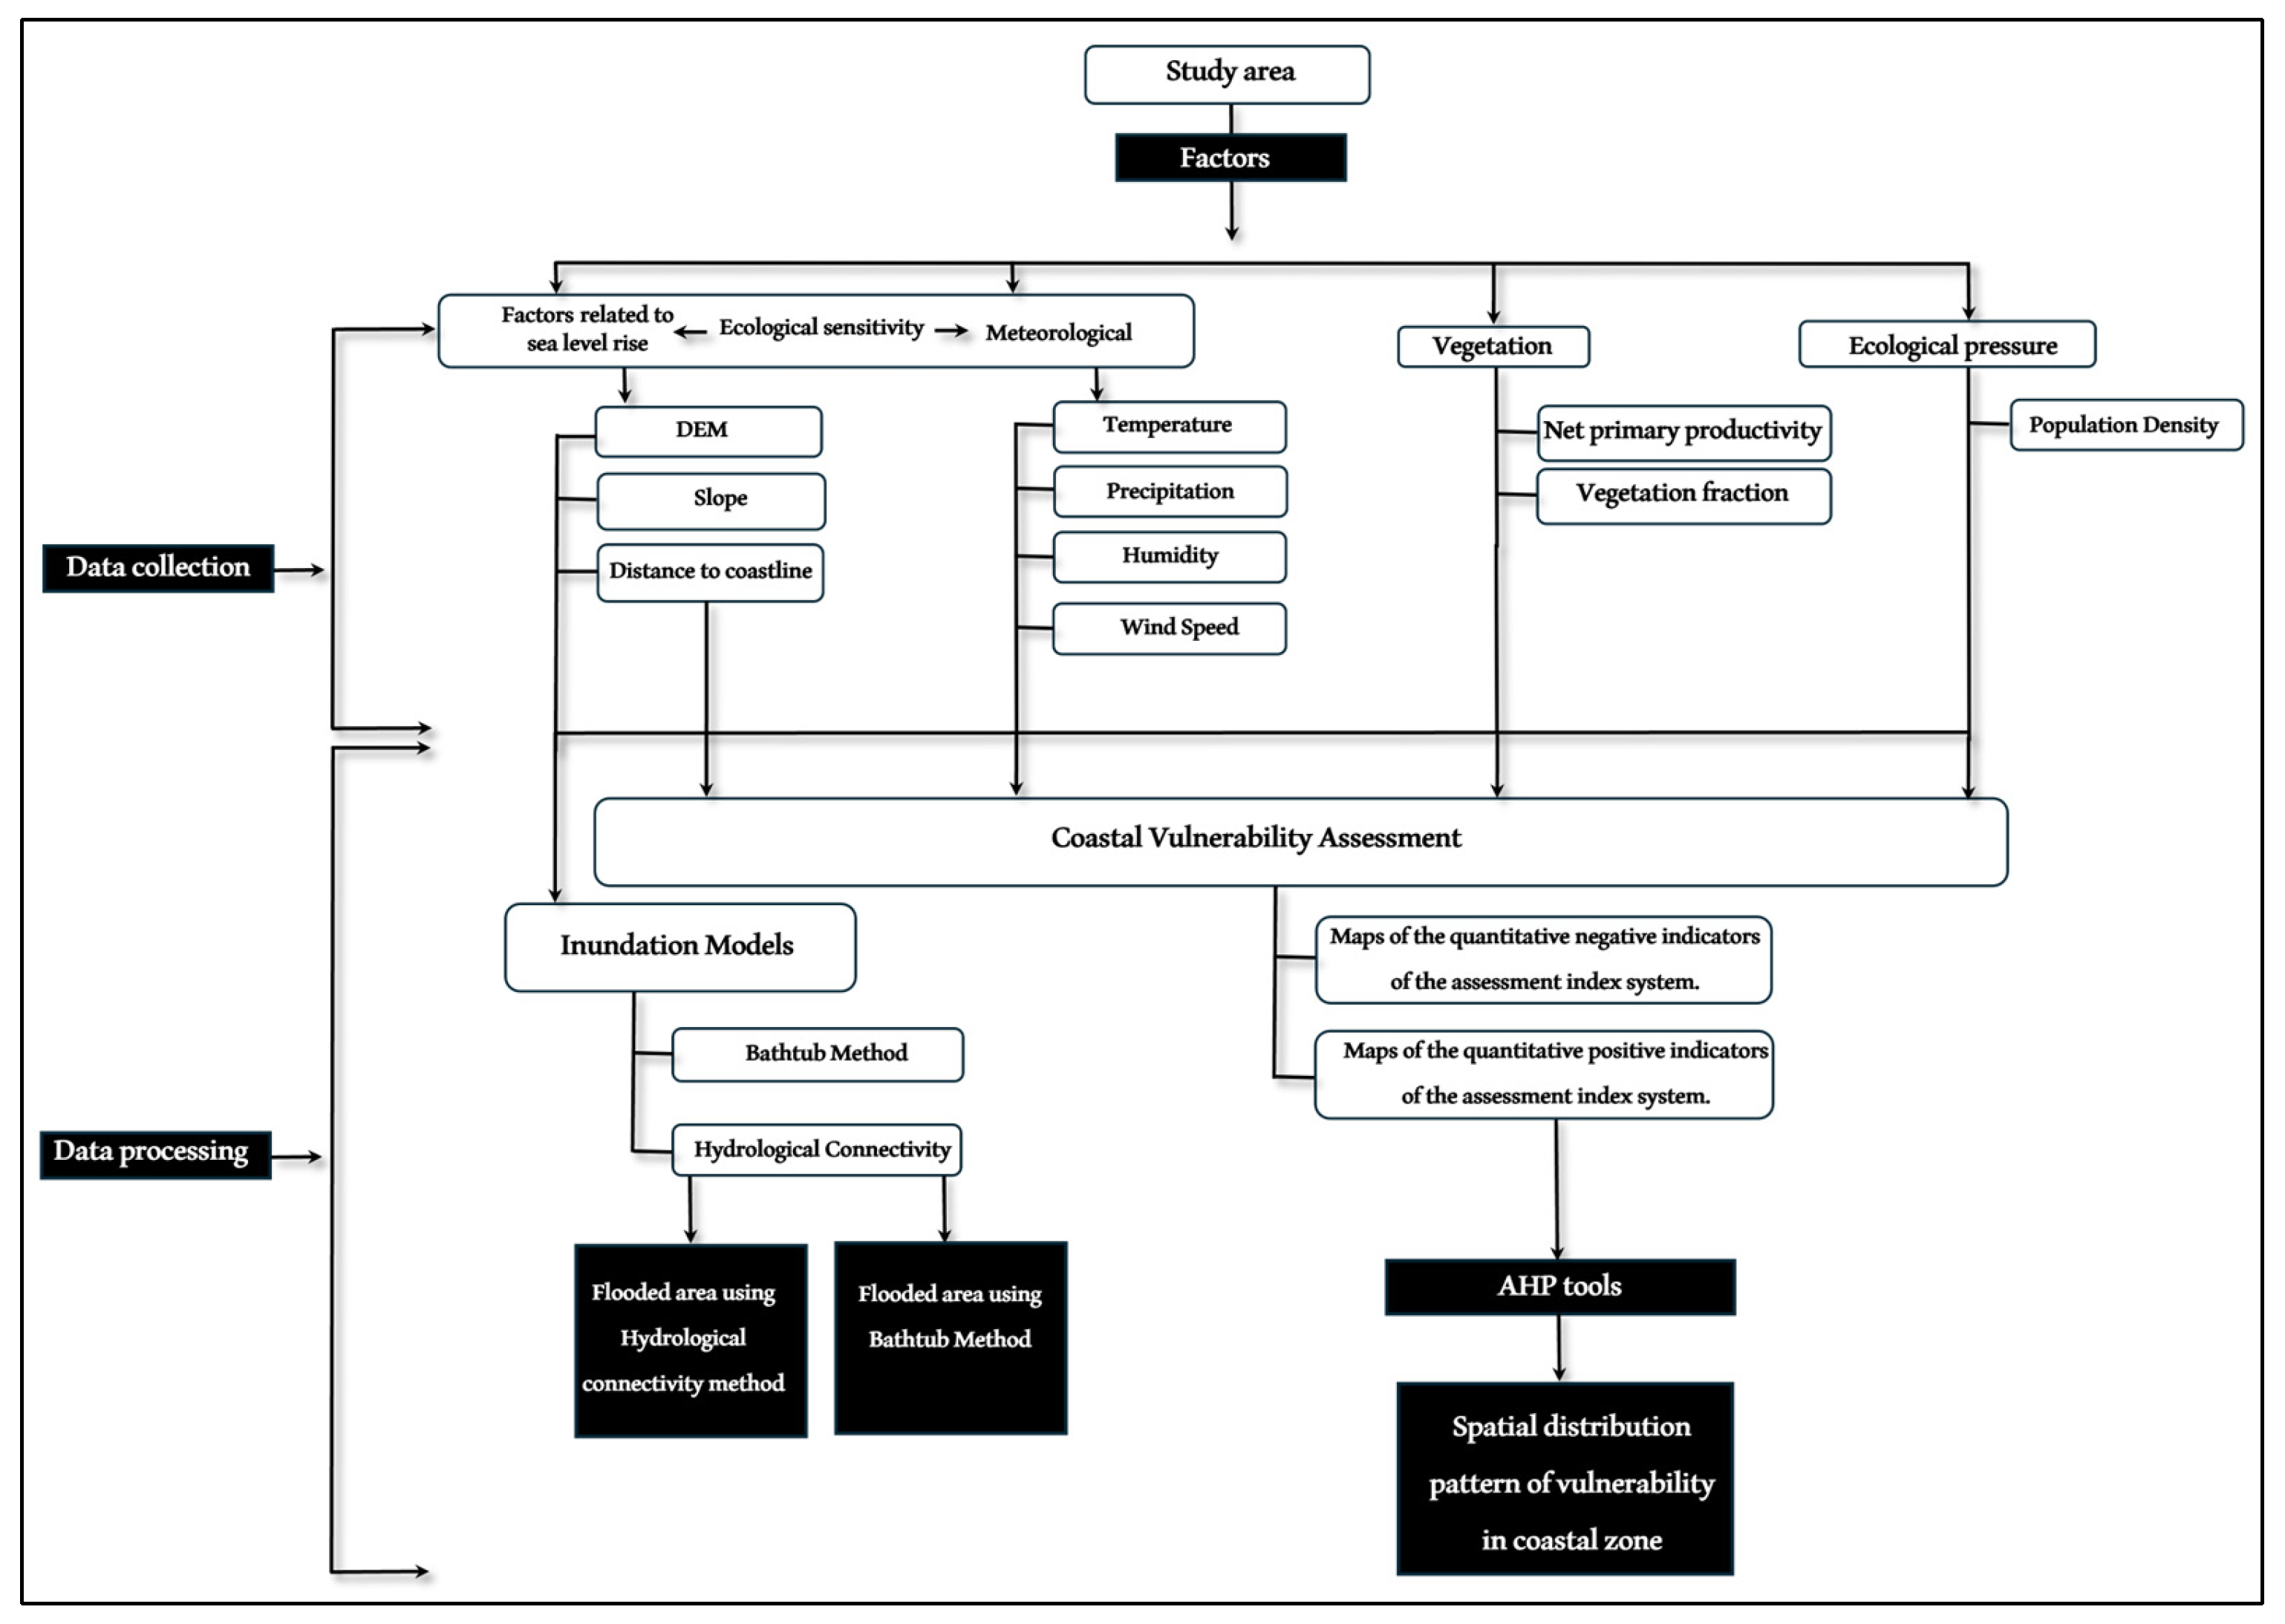
2.2. Methodology
2.2.1. Bathtub Method
- RCP 2.6, where in an ambitious mitigation scenario, emissions are forecasted to reach a peak between 2010 and 2020, followed by a substantial decline.
- RCP 4.5 and RCP 6.0, intermediate scenarios, which predict peaks in emissions between 2040 and 2080, respectively, with a subsequent reduction.
- RCP 8.5, classified as an extreme emissions circumstance, anticipates rising GHG atmospheric concentrations throughout the present century.
- The worst-case scenario in this analysis, represented by RCP 8.5, projects a maximum sea-level rise of 0.98 m in Qatar [32].
2.2.2. Hydrological Connectivity Method
2.2.3. Vulnerability Assessment Method
2.2.4. Selection of Vulnerability Index
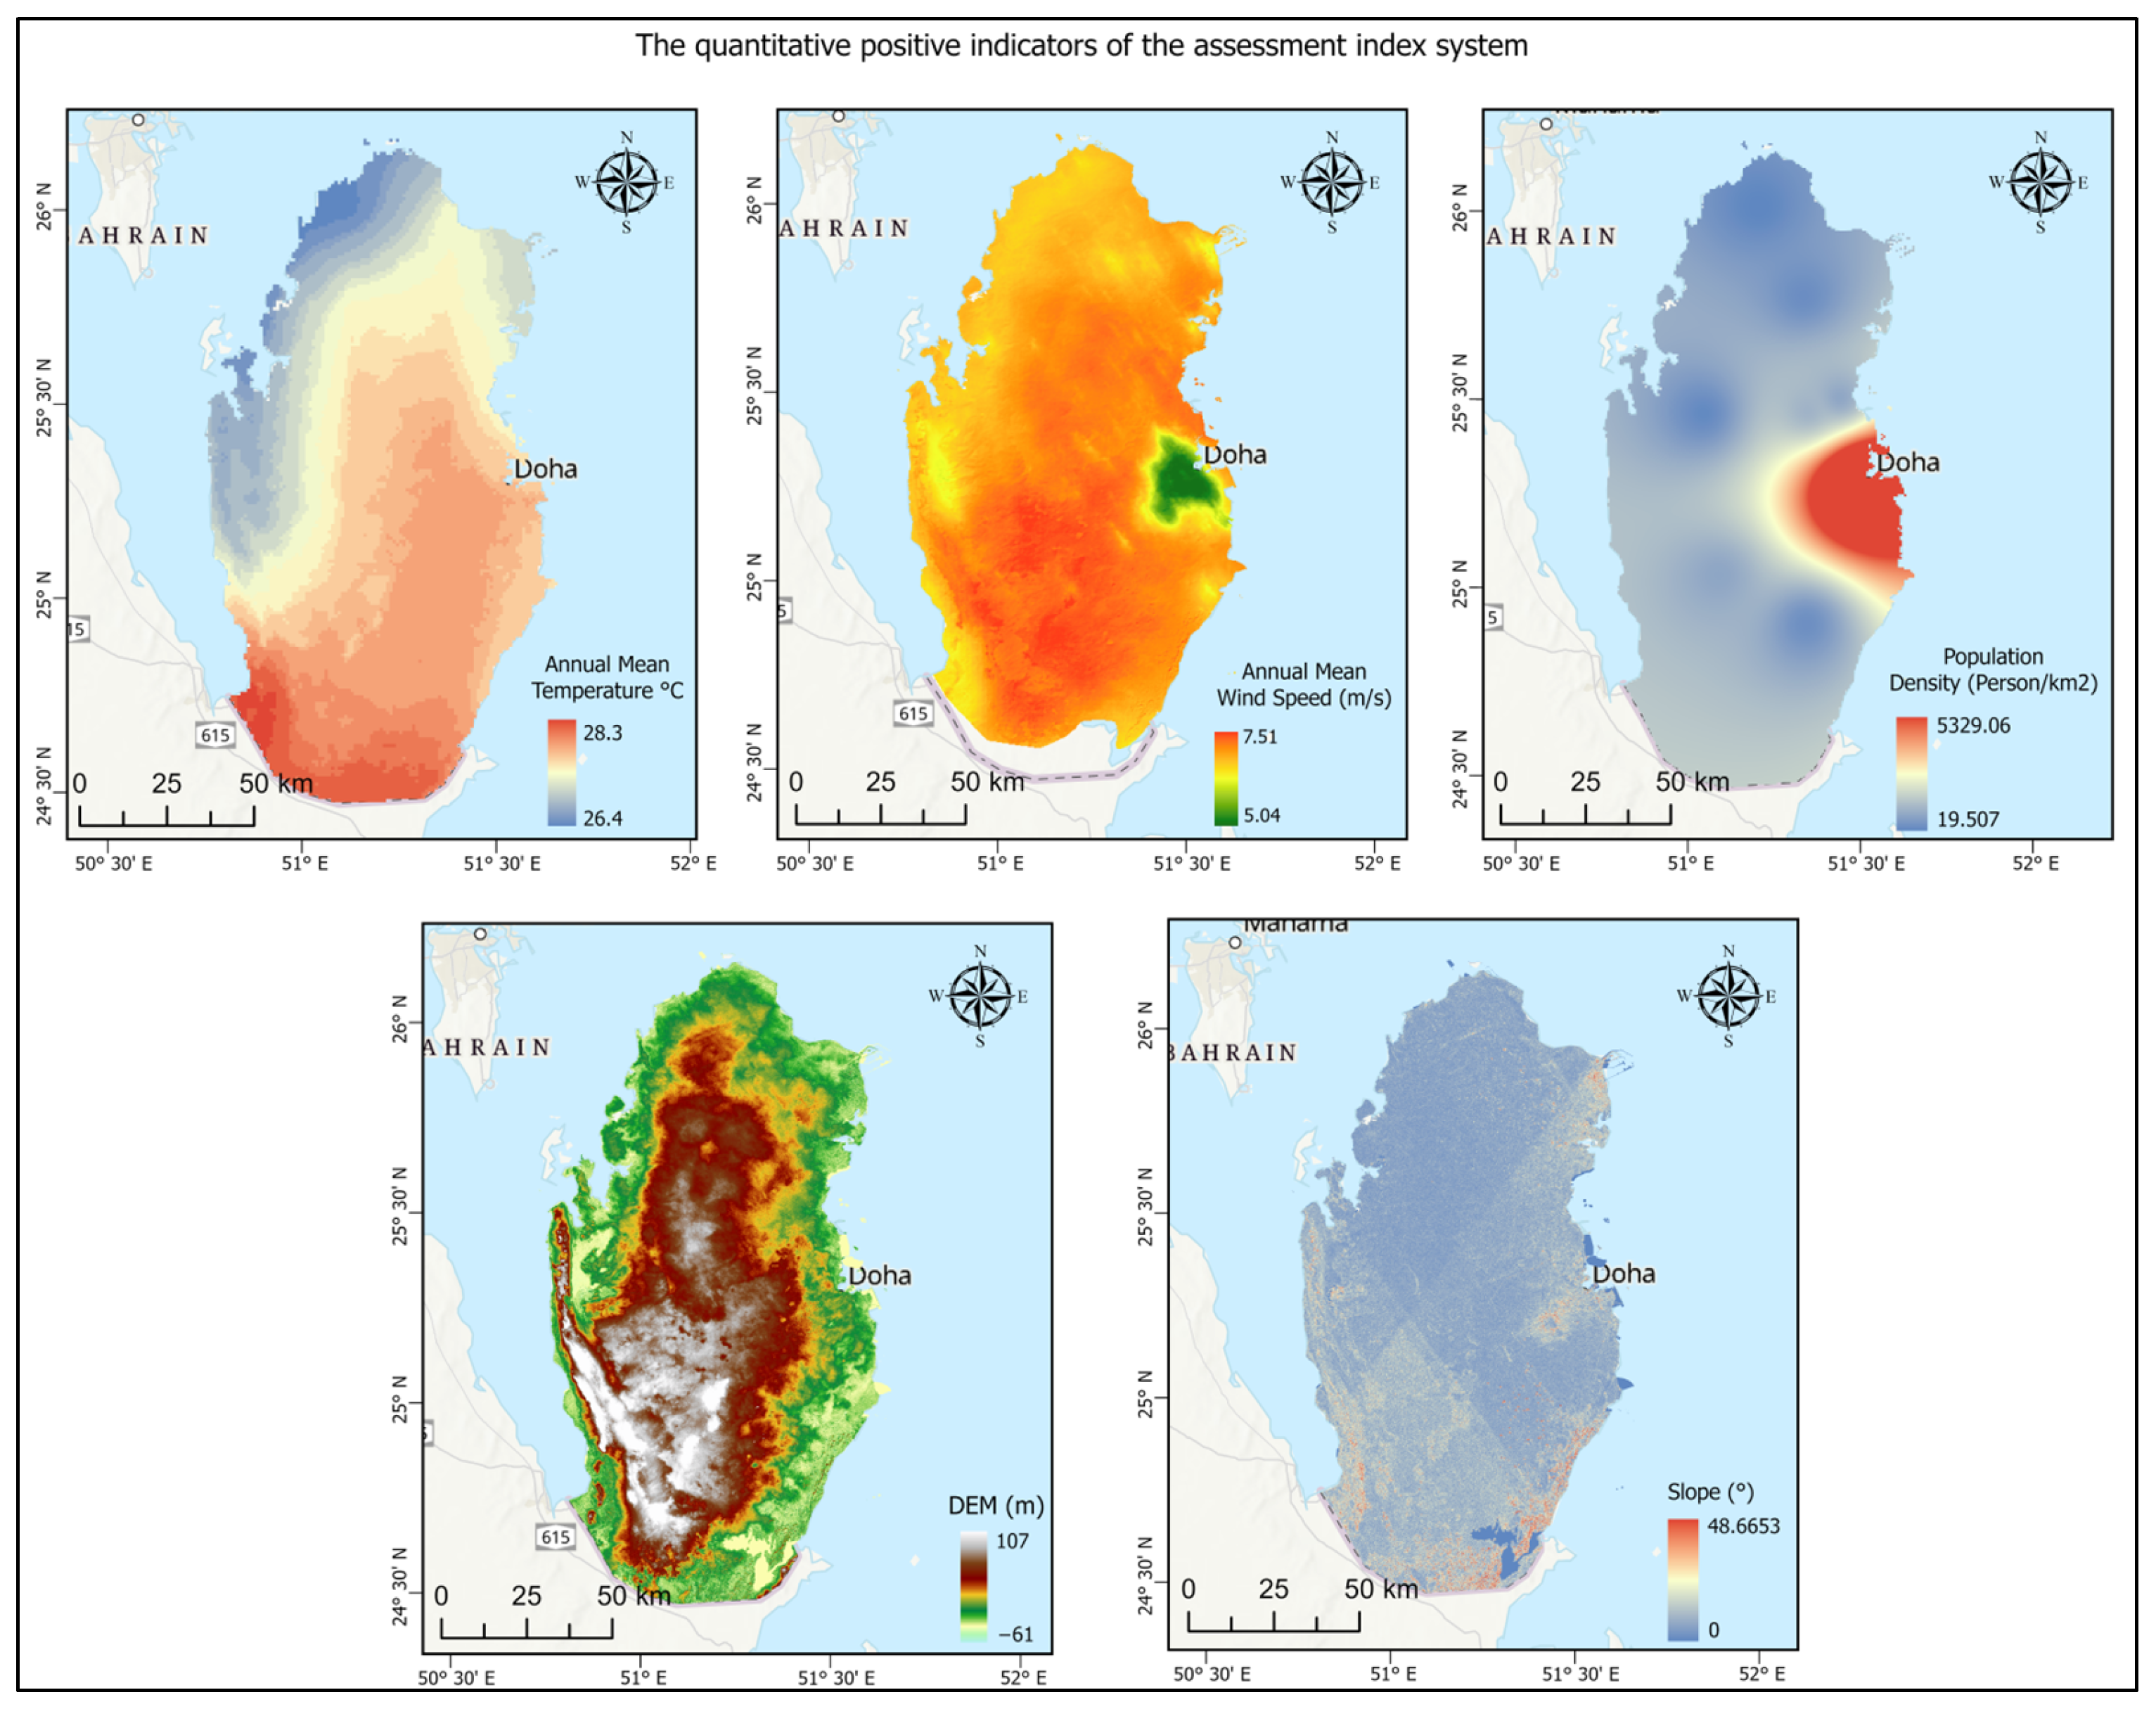
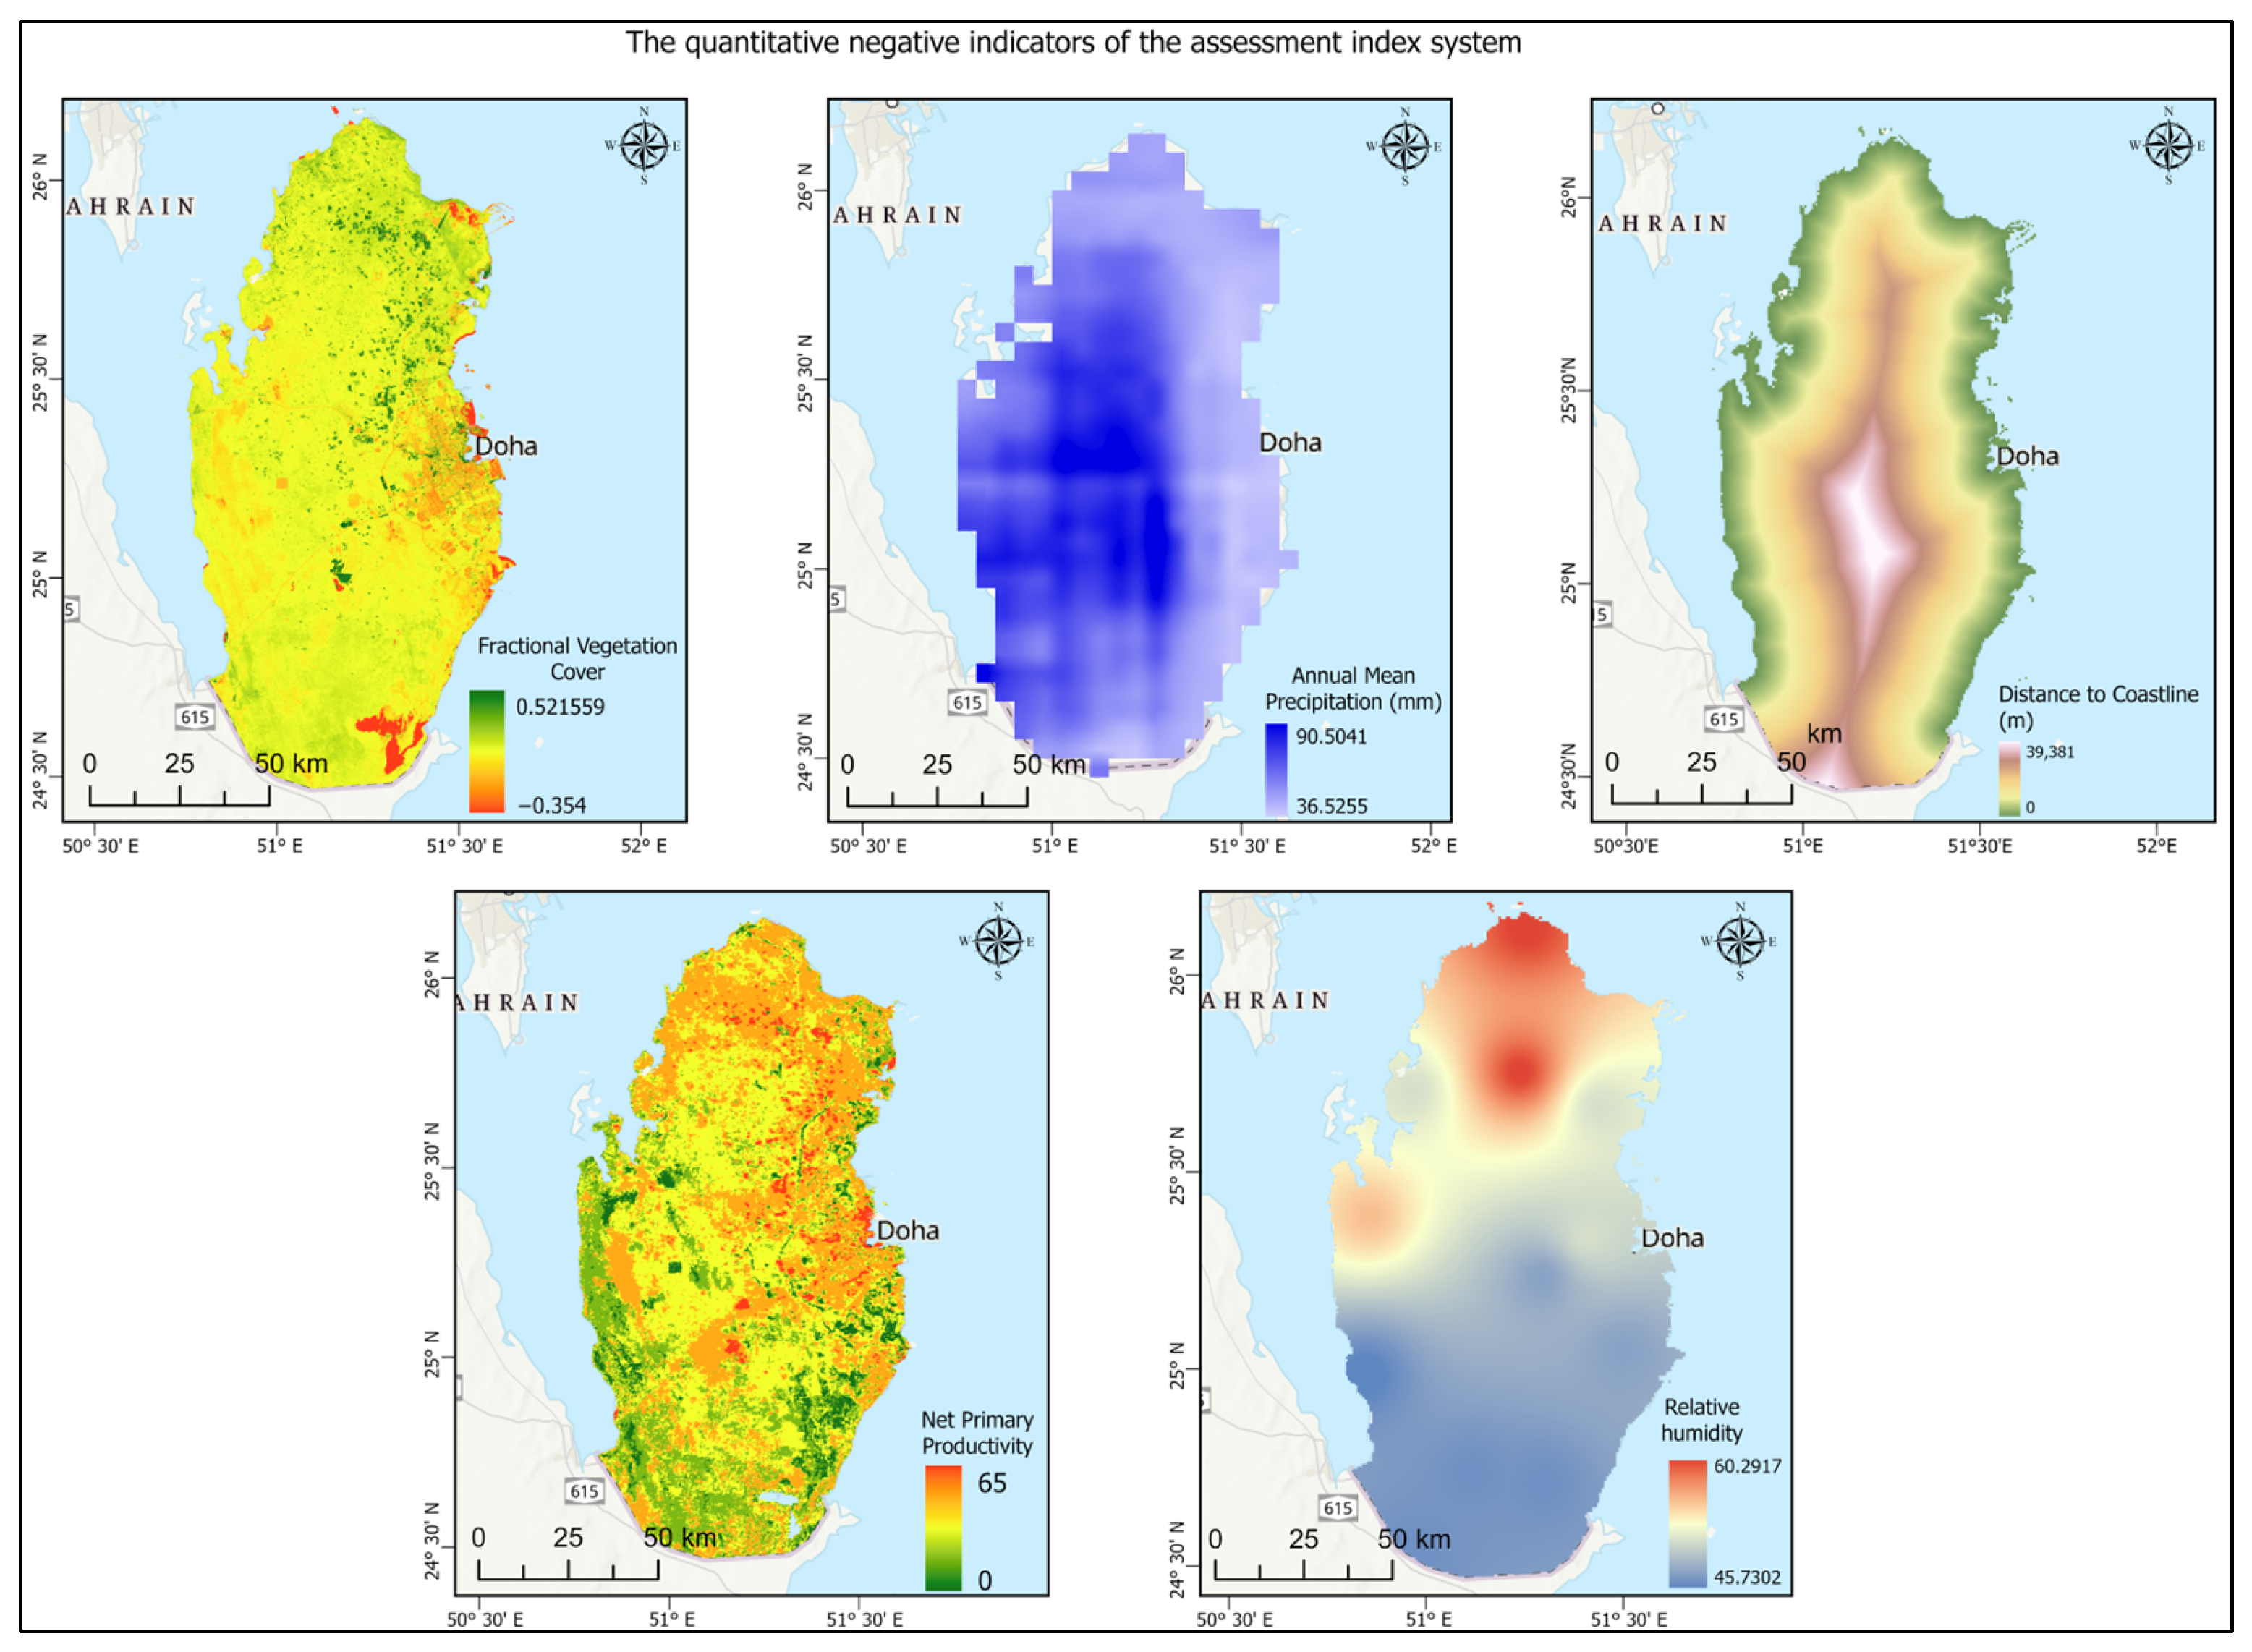
2.2.5. Data Acquisition for Vulnerability Index Parameters
2.2.6. AHP Method
3. Results
3.1. Estimated Flooded Area Using Bathtub Method
3.2. Estimated Flooded Area Using Flooded Area Using Hydrological Connectivity Method
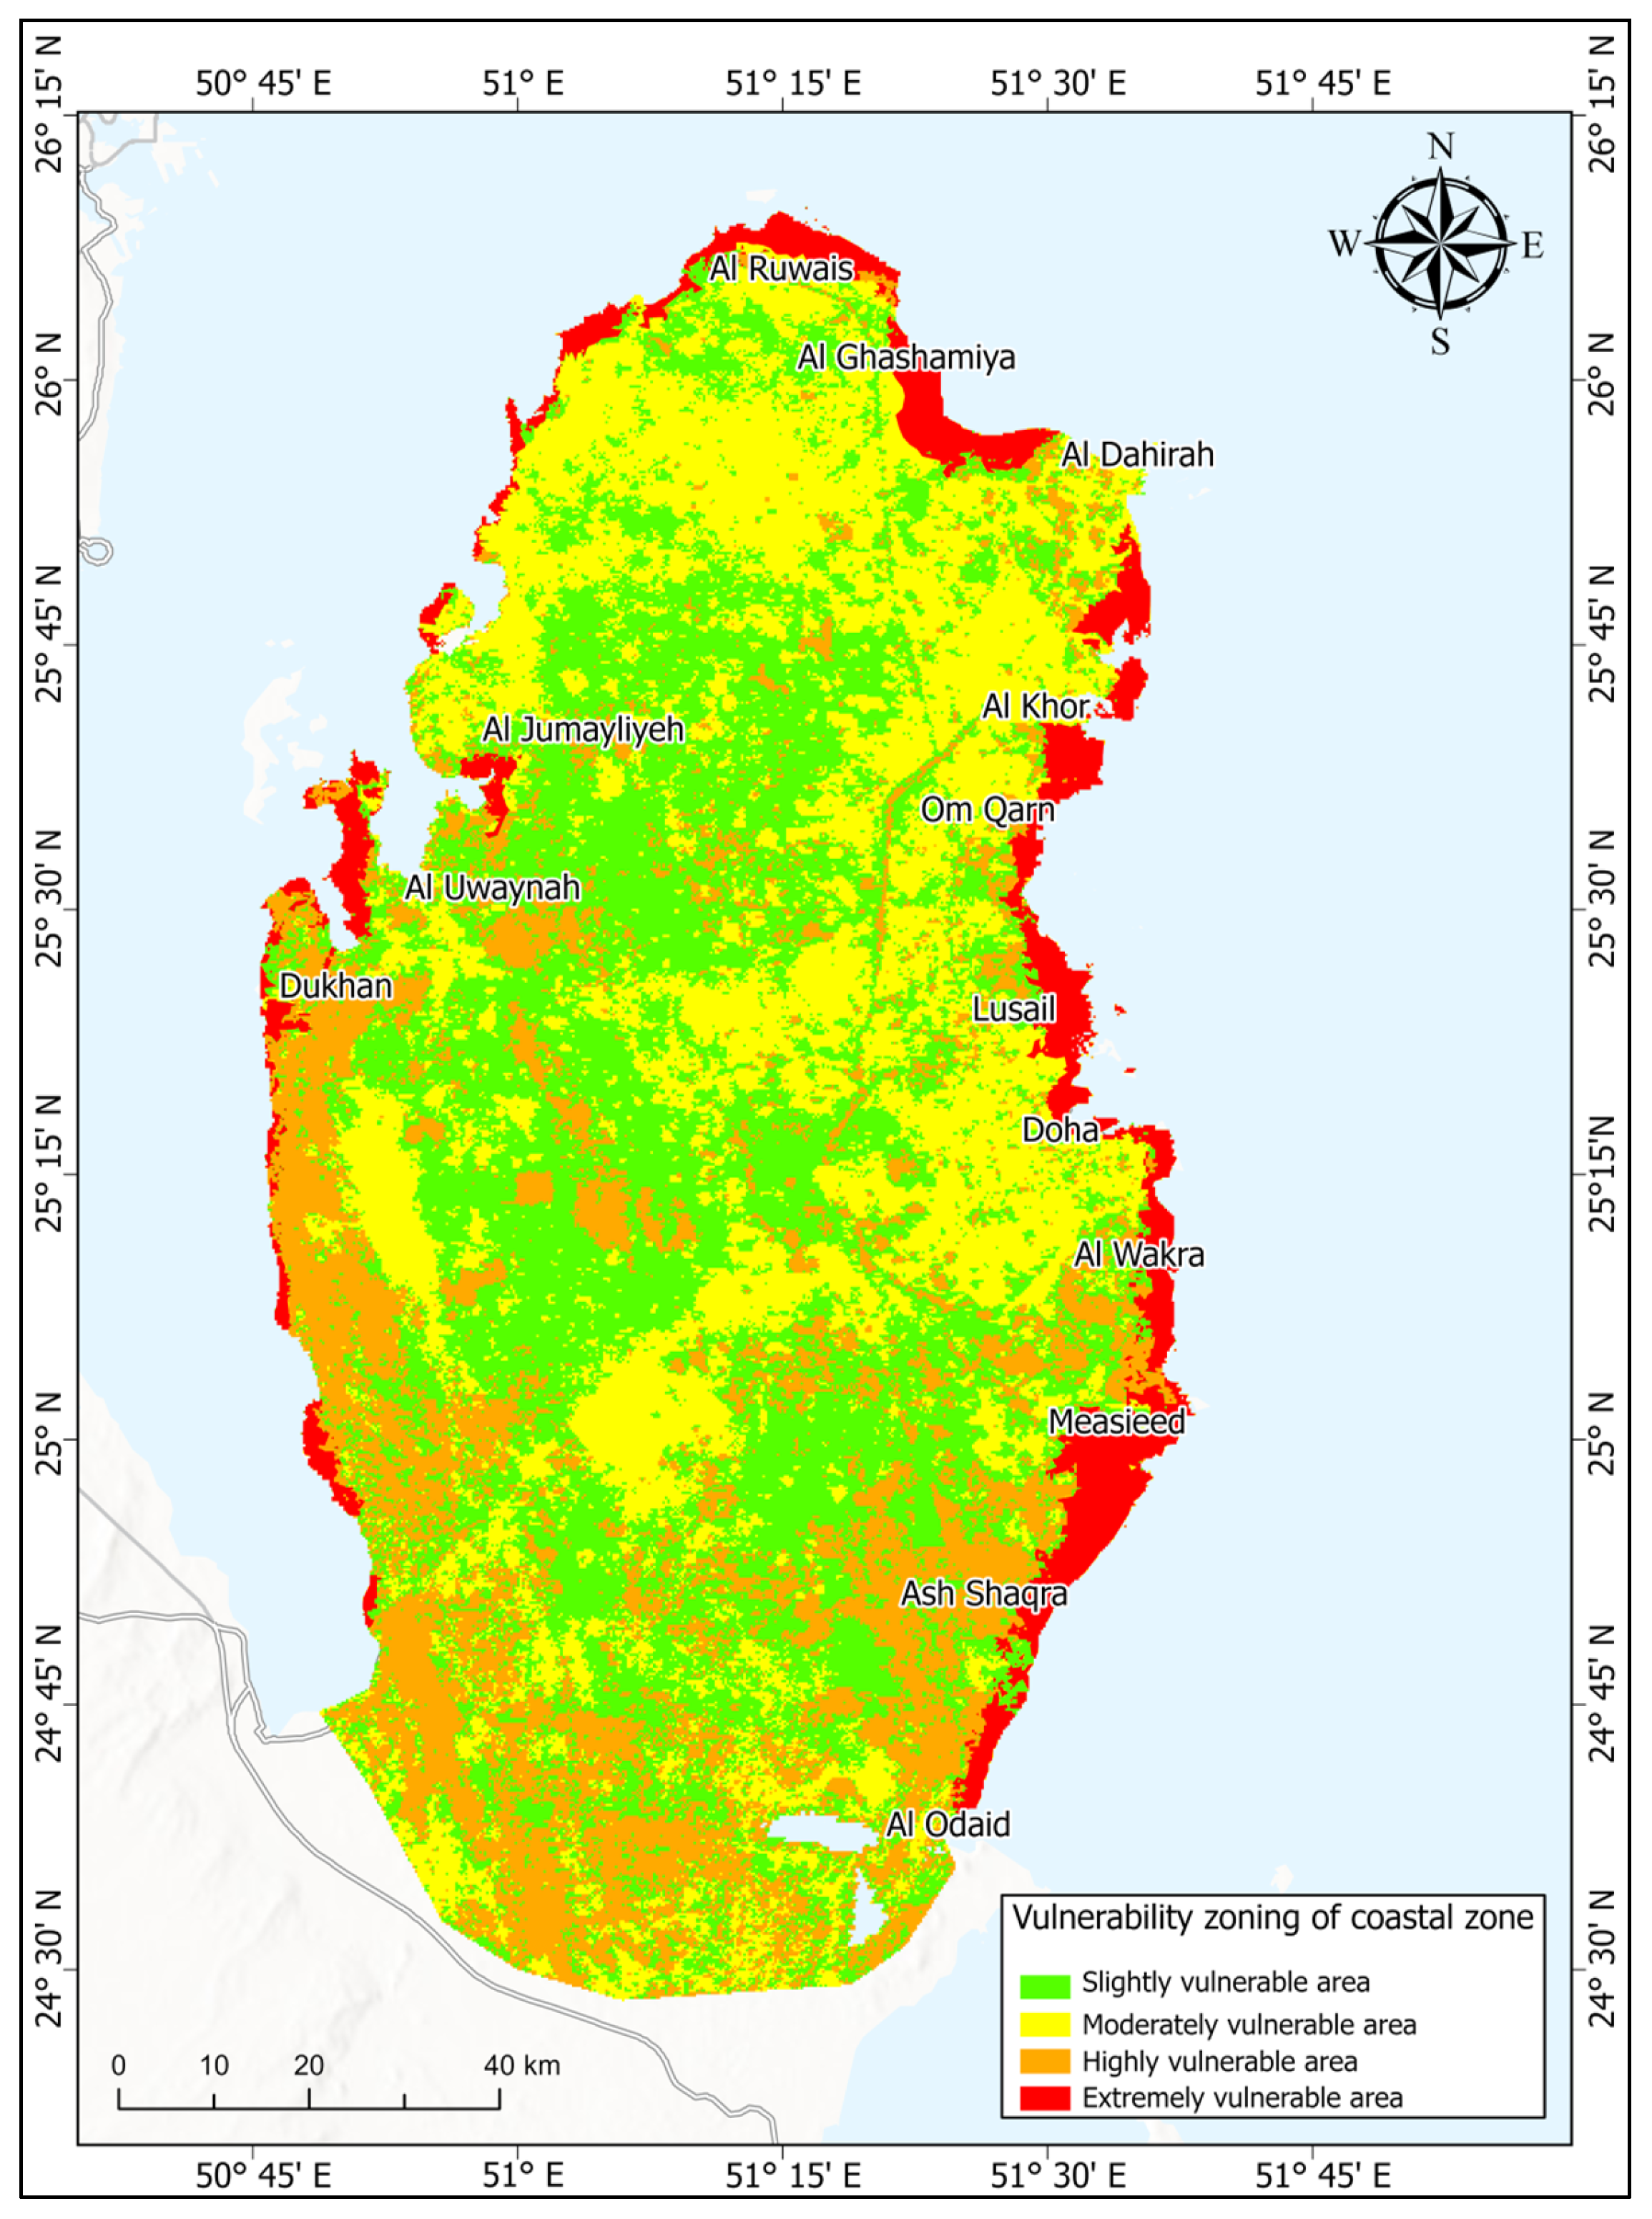
3.3. Vulnerability Assessment of Coastal Zone
3.4. Mapping Spatial Extent of Inundated Areas Coastal Line
4. Discussion
5. Conclusions
6. Limitations and Future Directions
Author Contributions
Funding
Institutional Review Board Statement
Informed Consent Statement
Data Availability Statement
Conflicts of Interest
References
- Moser, S.C.; Davidson, M.A.; Kirshen, P.; Mulvaney, P.; Murley, J.F.; Neumann, J.E.; Petes, L.; Reed, D. Coastal Zone Development and Ecosystems. In Climate Change Impacts in the United States: The Third National Climate Assessment; Melillo, J.M., Richmond, T.C., Yohe, G.W., Eds.; U.S. Global Change Research Program: Washington, DC, USA, 2014; pp. 579–618. [Google Scholar]
- Brooks, T.M.; Mittermeier, R.A.; da Fonseca, G.A.B.; Gerlach, J.; Hoffmann, M.; Lamoreux, J.F.; Mittermeier, C.G.; Pilgrim, J.D.; Rodrigues, A.S.L. Global Biodiversity Conservation Priorities. Science 2006, 313, 58–61. [Google Scholar] [CrossRef] [PubMed]
- Russell, J.A. In the Furnace: Saudi Arabia and the Dynamics of Global Climate Change. In Handbook of Transitions to Energy and Climate Security; Looney, R.E., Ed.; Routledge: New York, NY, USA, 2017. [Google Scholar]
- Dasgupta, S.; Laplante, B.; Meisner, C.; Wheeler, D.; Yan, J. The Impact of Sea Level Rise on Developing Countries: A Comparative Analysis. In World Bank Policy Research Working Paper 4136; World Bank: Washington, DC, USA, 2007. [Google Scholar]
- Toimil, A.; Camus, P.; Losada, I.J.; Le Cozannet, G.; Nicholls, R.J.; Idier, D.; Maspataud, A. Climate Change-Driven Coastal Erosion Modelling in Temperate Sandy Beaches: Methods and Uncertainty Treatment. Earth-Sci. Rev. 2020, 202, 103–110. [Google Scholar] [CrossRef]
- Santos, C.A.G.; do Nascimento, G.R.; Freitas, L.M.T.; Batista, L.V.; Zerouali, B.; Mishra, M.; da Silva, R.M. Coastal Evolution and Future Projections in Conde County, Brazil: A Multi-Decadal Assessment via Remote Sensing and Sea-Level Rise Scenarios. Sci. Total Environ. 2024, 915, 169–829. [Google Scholar] [CrossRef] [PubMed]
- IPCC. Technical Summary. In IPCC Special Report on the Ocean and Cryosphere in a Changing Climate; Pörtner, H.-O., Roberts, D.C., Masson-Delmotte, V., Zhai, P., Poloczanska, E., Mintenbeck, K., Tignor, M., Alegría, A., Nicolai, M., Okem, A., et al., Eds.; IPCC: Geneva, Switzerland, 2019. Available online: https://www.ipcc.ch/srocc/ (accessed on 6 March 2022).
- Sing Wong, A.; Vrontos, S.; Taylor, M.L. An Assessment of People Living by Coral Reefs over Space and Time. Glob. Change Biol. 2022, 28, 7139–7153. [Google Scholar] [CrossRef]
- Pal, I.; Kumar, A.; Mukhopadhyay, A. Risks to Coastal Critical Infrastructure from Climate Change. Annu. Rev. Environ. Resour. 2023, 48, 681–712. [Google Scholar] [CrossRef]
- AlQahtany, A.M.; Dano, U.L.; Abdalla, E.M.; Mohammed, W.E.; Abubakar, I.R.; Al-Gehlani, W.A.G.; Alshammari, M.S. Land Reclamation in a Coastal Metropolis of Saudi Arabia: Environmental Sustainability Implications. Water 2022, 14, 2546. [Google Scholar] [CrossRef]
- Gornitz, V.; White, T.W.; Cushman, R.M. Vulnerability of the US to Future Sea Level Rise. In Proceedings of the Symposium on Coastal and Ocean Management, Long Beach, CA, USA, 8–12 July 1991; American Society of Civil Engineers: Reston, VA, USA, 1991; pp. 1–17. [Google Scholar]
- Darvishmotevali, M.; Altinay, L. Green HRM, Environmental Awareness and Green Behaviors: The Moderating Role of Servant Leadership. Tour. Manag. 2022, 88, 104–401. [Google Scholar] [CrossRef]
- Church, J.A.; White, N.J. Sea-Level Rise from the Late 19th to the Early 21st Century. Surv. Geophys. 2011, 32, 585–602. [Google Scholar] [CrossRef]
- Williams, L.L.; Lück-Vogel, M. Comparative Assessment of the GIS-Based Bathtub Model and an Enhanced Bathtub Model for Coastal Inundation. J. Coast. Conserv. 2020, 24, 1–15. [Google Scholar] [CrossRef]
- Schmid, K.; Hadley, B.; Waters, K. Mapping and Portraying Inundation Uncertainty of Bathtub-Type Models. J. Coast. Res. 2014, 30, 548–561. [Google Scholar] [CrossRef]
- Murdukhayeva, A.; August, P.; Bradley, M.; LaBash, C.; Shaw, N. Assessment of Inundation Risk from Sea Level Rise and Storm Surge in Northeastern Coastal National Parks. J. Coast. Res. 2013, 29, 1–16. [Google Scholar] [CrossRef]
- Poulter, B.; Halpin, P.N. Raster Modelling of Coastal Flooding from Sea-Level Rise. Int. J. Geogr. Inf. Sci. 2008, 22, 167–182. [Google Scholar] [CrossRef]
- Strauss, B.H.; Ziemlinski, R.; Weiss, J.L.; Overpeck, J.T. Tidally Adjusted Estimates of Topographic Vulnerability to Sea Level Rise and Flooding for the Contiguous United States. Environ. Res. Lett. 2012, 7, 014033. [Google Scholar] [CrossRef]
- Titus, J.G.; Richman, C. Maps of Lands Vulnerable to Sea Level Rise: Modelled Elevations along the US Atlantic and Gulf Coasts. Clim. Res. 2001, 18, 205–228. [Google Scholar] [CrossRef]
- Weiss, J.L.; Overpeck, J.T. Climate Change and Sea Level. Environ. Res. Lett. 2003, 1, 014033. [Google Scholar]
- Williams, L.L.; Lück-Vogel, M. Geographic Information System Data Considerations in the Context of the Enhanced Bathtub Model for Coastal Inundation. Trans. GIS 2022, 26, 3074–3089. [Google Scholar] [CrossRef]
- Webster, T.L.; Forbes, D.L.; Dickie, S.; Shreenan, R. Using Topographic Lidar to Map Flood Risk from Storm-Surge Events for Charlottetown, Prince Edward Island, Canada. Can. J. Remote Sens. 2004, 30, 64–76. [Google Scholar] [CrossRef]
- Ministry of Development Planning and Statistics (MDPS). Third Annual Report on Environment Statistics 2015; MDPS: Doha, Qatar, 2015.
- Kouakou, M.; Tiémélé, J.A.; Djagoua, É.; Gnandi, K. Assessing Potential Coastal Flood Exposure along the Port-Bouët Bay in Côte d’Ivoire Using the Enhanced Bathtub Model. Environ. Res. Commun. 2003, 5, 10. [Google Scholar] [CrossRef]
- Van Vuuren, D.P.; Edmonds, J.; Kainuma, M.; Riahi, K.; Thomson, A.; Hibbard, K.; Hurtt, G.C.; Kram, T.; Krey, V.; Lamarque, J.F.; et al. The Representative Concentration Pathways: An Overview. Clim. Change 2011, 109, 5. [Google Scholar] [CrossRef]
- Sahin, O.; Mohamed, S. Coastal Vulnerability to Sea-Level Rise: A Spatial-Temporal Assessment Framework. Nat. Hazards 2014, 70, 395–414. [Google Scholar] [CrossRef]
- Gesch, D.B. Analysis of Lidar Elevation Data for Improved Identification and Delineation of Lands Vulnerable to Sea-Level Rise. J. Coast. Res. 2009, 53, 49–58. [Google Scholar] [CrossRef]
- Gesch, D.B. Consideration of Vertical Uncertainty in Elevation-Based Sea-Level Rise Assessments: Mobile Bay, Alabama Case Study. J. Coast. Res. 2013, 63, 197–210. [Google Scholar] [CrossRef]
- Leon, J.X.; Heuvelink, G.B.; Phinn, S.R. Incorporating DEM Uncertainty in Coastal Inundation Mapping. PLoS ONE 2014, 9, 1–12. [Google Scholar] [CrossRef]
- West, H.; Horswell, M.; Quinn, N. Exploring the Sensitivity of Coastal Inundation Modelling to DEM Vertical Error. Int. J. Geogr. Inf. Sci. 2018, 32, 1172–1193. [Google Scholar] [CrossRef]
- Burrough, P.A.; McDonnell, R.A. Principles of Geographic Information Systems, 3rd ed.; Oxford University Press: Oxford, UK, 1998. [Google Scholar]
- Church, J.A.; Clark, P.U.; Cazenave, A.; Gregory, J.M.; Jevrejeva, S.; Levermann, A.; Merrifield, M.A.; Milne, G.A.; Nerem, R.S.; Nunn, P.D.; et al. Sea Level Change. In Climate Change 2013: The Physical Science Basis; IPCC: Geneva, Switzerland, 2013. [Google Scholar]
- Uddin, M.N.; Islam, A.K.M.S.; Bala, S.K.; Islam, G.M.T.; Adhikary, S.; Saha, D.; Haque, S.; Fahad, M.G.R.; Akter, R. Mapping of Climate Vulnerability of the Coastal Region of Bangladesh Using Principal Component Analysis. Appl. Geogr. 2018, 102, 47–57. [Google Scholar] [CrossRef]
- Huo, T.; Zhang, X.; Zhou, Y.; Chen, W. Evaluation and Correlation Analysis of Spatio-Temporal Changes of Ecological Vulnerability Based on VSD Model: A Case in Suzhou Section, Grand Canal of China. Acta Ecol. Sin. 2022, 42, 2281–2293. [Google Scholar]
- Kunte, P.D.; Jauhari, N.; Mehrotra, U.; Kotha, M.; Hursthouse, A.S.; Gagnon, A.S. Multi-Hazards Coastal Vulnerability Assessment of Goa, India, Using Geospatial Techniques. Ocean Coast. Manag. 2014, 95, 264–281. [Google Scholar] [CrossRef]
- Li, X.; Duan, X.F.; Zhang, Z.J. The Vulnerability Zoning Research on the Sea Level Rise of Chinese Coastal. J. Catastrophol. 2016, 31, 103–109. [Google Scholar]
- Yan, X.H.; Cai, R.S.; Guo, H.X. Vulnerability of Hainan Dongzhaigang Mangrove Ecosystem to the Climate Change. J. Appl. Oceanogr. 2019, 38, 338–349. [Google Scholar]
- El-Shahat, S.; El-Zafarany, A.M.; El Seoud, T.A.; Ghoniem, S.A. Vulnerability Assessment of African Coasts to Sea Level Rise Using GIS and Remote Sensing. Environ. Dev. Sustain. 2021, 23, 2827–2845. [Google Scholar] [CrossRef]
- Pramanik, M.K.; Dash, P.; Behal, D. Improving Outcomes for Socioeconomic Variables with Coastal Vulnerability Index under Significant Sea-Level Rise: An Approach from Mumbai Coasts. Environ. Dev. Sustain. 2021, 23, 13819–13853. [Google Scholar] [CrossRef]
- Bera, R.; Maiti, R. An Assessment of Coastal Vulnerability Using Geospatial Techniques. Environ. Earth Sci. 2021, 80, 306–318. [Google Scholar] [CrossRef]
- Roy, P.; Pal, S.C.; Chakrabortty, R.; Chowdhuri, I.; Saha, A.; Shit, M. Effects of Climate Change and Sea-Level Rise on Coastal Habitat: Vulnerability Assessment, Adaptation Strategies and Policy Recommendations. J. Environ. Manag. 2023, 330, 117–187. [Google Scholar] [CrossRef] [PubMed]
- Maanan, M.; Maanan, M.; Rueff, H.; Adouk, N.; Zourarah, B.; Rhinane, H. Assess the Human and Environmental Vulnerability for Coastal Hazard by Using a Multi-Criteria Decision Analysis. Hum. Ecol. Risk Assess. 2018, 24, 1642–1658. [Google Scholar] [CrossRef]
- Liu, Y.; Zhang, Y. Assessment of Coastal Zone Vulnerability in the Context of Sea Level Rise and Climate Change. In Sea Level Rise and Ocean Health in the Context of Climate Change, 2nd ed.; Zhang, Y., Cheng, Q., Eds.; IntechOpen: Rijeka, Croatia, 2023; Volume 3, pp. 1–19. [Google Scholar]
- Saaty, T.L. Rank from Comparisons and from Ratings in the Analytic Hierarchy/Network Processes. Eur. J. Oper. Res. 2006, 168, 557–570. [Google Scholar] [CrossRef]
- Günen, M.A. A Comprehensive Framework Based on GIS-AHP for the Installation of Solar PV Farms in Kahramanmaras, Turkey. Renew. Energy 2021, 178, 212–225. [Google Scholar] [CrossRef]
- Georgiou, A.; Skarlatos, D. Optimal Site Selection for Sitting a Solar Park Using Multicriteria Decision Analysis and Geographical Information Systems. Geosci. Instrum. Method. Data Syst. 2016, 5, 321–332. [Google Scholar] [CrossRef]
- Al Garni, H.Z.; Awasthi, A. Solar PV Power Plant Site Selection Using a GIS-AHP Based Approach with Application in Saudi Arabia. Appl. Energy 2017, 206, 1225–1240. [Google Scholar] [CrossRef]
- Kereush, D.; Perovych, I. Determining Criteria for Optimal Site Selection for Solar Power Plants. Geomat. Land Manag. Landsc. 2016, 5, 321–332. [Google Scholar] [CrossRef]
- Khaldi, N.; Almadani, F.; Ouerghi, S. Landfill Siting Evaluation Using GIS and Multi-Criteria Decision-Making Method: A Case Study of Dammam Municipal Solid Waste Landfill. J. Geogr. Inf. Syst. 2021, 13, 508–522. [Google Scholar] [CrossRef]
- Arda, T.; Bayrak, O.C.; Uzar, M. Analyzing Coastal Vulnerability Using Analytic Hierarchy Process and Best-Worst Method: A Case Study of the Marmara Gulf Region. Arab. J. Sci. Eng. 2025, 50, 1851–1869. [Google Scholar] [CrossRef]
- Román, A.; Turriza, V.Z.F.; Rojas, D.M.C.; Tzuc, Ó.M. Coastal Vulnerability Assessment with a Hierarchical Coastal Segments Approach. Ocean Coast. Manag. 2024, 249, 106989. [Google Scholar]
- Özyurt, G.; Ergin, A.; Baykal, C. Coastal Vulnerability Assessment to Sea Level Rise Integrated with Analytical Hierarchy Process. Coast. Eng. Proc. 2011, 1, 1–6. [Google Scholar]
- Monjardin, C.E.F.; Tan, F.J.; Uy, F.A.A.; Bale, F.J.P.; Voluntad, E.O.; Batac, R.M.N. Assessment of the Existing Drainage System in Infanta, Quezon Province for Flood Hazard Management Using Analytical Hierarchy Process. In Proceedings of the 2020 IEEE Conference on Technologies for Sustainability (Sustech), Long Beach, CA, USA, 23–25 April 2020; IEEE: Piscataway, NJ, USA, 2020. [Google Scholar]


| Index Level | Index Feature | ||
|---|---|---|---|
| Ecological sensitivity | Meteorological factors | Annual mean temperature | + |
| Annual mean precipitation | − | ||
| Annual mean relative humidity | − | ||
| Annual mean wind speed | + | ||
| Factor related to sea-level rise | Elevation | + | |
| Slope | + | ||
| Distance to coastline | − | ||
| Vegetation factors | Fraction vegetation coverage | NDVI | − |
| Ecological resiliency | Net primary production | − | |
| Ecological pressure | Population | Population density | + |
| Criterion | Elevation | Distance to Coastline | Vegetation | Population Density | NPP | Slope | Temperature | Precipitation | Wind Speed | Humidity |
|---|---|---|---|---|---|---|---|---|---|---|
| Elevation | 1 | 3 | 5 | 7 | 8 | 7 | 8 | 8 | 8 | 8 |
| Distance to Coastline | 0.333 | 1 | 3 | 5 | 7 | 5 | 7 | 7 | 7 | 7 |
| Vegetation | 0.2 | 0.333 | 1 | 3 | 5 | 3 | 5 | 5 | 5 | 5 |
| Population Density | 0.143 | 0.2 | 0.333 | 1 | 3 | 1 | 3 | 3 | 3 | 3 |
| NPP | 0.125 | 0.143 | 0.2 | 0.333 | 1 | 0.333 | 1 | 1 | 1 | 1 |
| Slope | 0.143 | 0.2 | 0.333 | 1 | 3 | 1 | 3 | 3 | 3 | 3 |
| Temperature | 0.125 | 0.143 | 0.2 | 0.333 | 1 | 0.333 | 1 | 1 | 1 | 1 |
| Precipitation | 0.125 | 0.143 | 0.2 | 0.333 | 1 | 0.333 | 1 | 1 | 1 | 1 |
| Wind Speed | 0.125 | 0.143 | 0.2 | 0.333 | 1 | 0.333 | 1 | 1 | 1 | 1 |
| Humidity | 0.125 | 0.143 | 0.2 | 0.333 | 1 | 0.333 | 1 | 1 | 1 | 1 |
| Criteria No. | Criteria’s Name | Criteria’s Weight (%) |
|---|---|---|
| 1 | Elevation | 35% |
| 2 | Distance to Coastline | 25% |
| 3 | Vegetation | 15% |
| 4 | Population Density | 8% |
| 5 | NPP | 5% |
| 6 | Slope | 4% |
| 7 | Temperature | 3% |
| 8 | Precipitation | 2% |
| 9 | Wind Speed | 2% |
| 10 | Humidity | 1% |
| Land Use | Area (km2) in Extremely Vulnerable Zone | Flooded Areas (km2) Using Bathtub Method | Flooded Areas (km2) Using Hydrological Connectivity Method | ||
|---|---|---|---|---|---|
| RCP8.5 | RCP4.5 | RCP8.5 | RCP4.5 | ||
| Residential | 9.37 | 12.39 | 8.93 | 10.81 | 3.45 |
| Establishments Govt/Private | 3.19 | 5.56 | 2.02 | 2.87 | 0.27 |
| Business/Commercial | 1.11 | 0.43 | 0.16 | 0.40 | 0.02 |
| Hotel/Hotel Apartment/Restaurant | 2.33 | 1.95 | 1.34 | 2.43 | 0.14 |
| Financial/Banking | 0.04 | 0.08 | 0.02 | 0.02 | 0 |
| Workshop/Factory/Industry | 28.32 | 41.69 | 37.43 | 17.10 | 7.65 |
| Roads/Streets/Flower Beds | 38.04 | 47.36 | 33.09 | 30.03 | 14.97 |
| Educational Services | 0.06 | 0.11 | 0.01 | 0.04 | 0 |
| Health Services | 0.58 | 0.69 | 0.68 | 0 | 0 |
| Infrastructure/Utilities | 61.14 | 29.38 | 37.02 | 36.45 | 18.3 |
| Sports/Recreational | 11.13 | 17.53 | 4.82 | 5.88 | 2.3 |
| Religious/Cultural | 0.86 | 0.53 | 0.27 | 0.59 | 0.09 |
| Agricultural/Farms/Izbba | 5.77 | 2.48 | 1 | 1.42 | 1.01 |
| Vacant (Developed Land) | 38.64 | 46.50 | 47.41 | 36.42 | 27.58 |
| Barren/Other Undeveloped Land | 844.72 | 990.53 | 799.62 | 799.63 | 433.01 |
| Total | 1045.30 | 1197.21 | 973.82 | 944.09 | 508.79 |
| Percentage of Total Area | 8.85% | 10.13% | 8.24% | 8% | 4.31% |
Disclaimer/Publisher’s Note: The statements, opinions and data contained in all publications are solely those of the individual author(s) and contributor(s) and not of MDPI and/or the editor(s). MDPI and/or the editor(s) disclaim responsibility for any injury to people or property resulting from any ideas, methods, instructions or products referred to in the content. |
© 2025 by the authors. Licensee MDPI, Basel, Switzerland. This article is an open access article distributed under the terms and conditions of the Creative Commons Attribution (CC BY) license (https://creativecommons.org/licenses/by/4.0/).
Share and Cite
Al-Mannai, A.A.M.; Ouerghi, S.; Elhag, M. Assessment of Coastal Zone Vulnerability in Context of Sea-Level Rise and Inundation Risk in Qatar. Atmosphere 2025, 16, 622. https://doi.org/10.3390/atmos16050622
Al-Mannai AAM, Ouerghi S, Elhag M. Assessment of Coastal Zone Vulnerability in Context of Sea-Level Rise and Inundation Risk in Qatar. Atmosphere. 2025; 16(5):622. https://doi.org/10.3390/atmos16050622
Chicago/Turabian StyleAl-Mannai, Abdulaziz Ali M., Sarra Ouerghi, and Mohamed Elhag. 2025. "Assessment of Coastal Zone Vulnerability in Context of Sea-Level Rise and Inundation Risk in Qatar" Atmosphere 16, no. 5: 622. https://doi.org/10.3390/atmos16050622
APA StyleAl-Mannai, A. A. M., Ouerghi, S., & Elhag, M. (2025). Assessment of Coastal Zone Vulnerability in Context of Sea-Level Rise and Inundation Risk in Qatar. Atmosphere, 16(5), 622. https://doi.org/10.3390/atmos16050622