1. Introduction
Rapid urbanization has fundamentally transformed the physical and thermal properties of land surfaces while modifying energy flux patterns [
1]. The increasing frequency of high-temperature extremes in urbanized regions worldwide highlights the urgency of addressing urban thermal challenges. Climate change, characterized by progressive global warming coupled with accelerated urban expansion, has created critical thermal stress conditions in cities [
2]. The Urban Heat Island (UHI) phenomenon has emerged as a global environmental priority, with its genesis tied to the heat-retention capacity of built structures and emissions from anthropogenic sources [
3]. UHI effects amplify diurnal temperatures and suppress nocturnal cooling rates, potentially aggravating atmospheric pollution concentrations. These alterations not only compromise the functionality of outdoor public realms but also pose substantial health risks, particularly through heat-related morbidity [
4]. Vulnerable demographics—including elderly populations, children, expectant mothers, chronic disease patients, and low-income residents—demonstrate heightened susceptibility to thermal inequities exacerbated by UHI [
5]. Consequently, optimizing urban microclimates and enhancing thermal comfort in public spaces represents a crucial adaptation strategy for mitigating temperature-related urban vulnerabilities.
Streets serve as fundamental determinants of urban social dynamics, significantly influencing patterns of social interaction, physical activity, and community welfare. Precise quantification of architectural-environmental parameters in street canyon configurations enables predictive modeling of thermal conditions and informs evidence-based design optimization [
6]. Empirical studies demonstrate that street aspect ratios (H/W > 1:1) can reduce surface temperatures by 3–5 °C through building-mediated shading, though excessive urban canyon density compromises ventilation efficiency and promotes thermal stagnation [
7]. Street orientation and arboreal arrangements critically modulate solar irradiance angles, creating spatiotemporal variations in thermal exposure [
8]. Contemporary urban planning frequently prioritizes vehicular mobility over pedestrian thermal comfort metrics, resulting in underutilized walkable spaces during summer thermal extremes. This underscores the necessity for human-centric analysis of street morphology-thermal environment interactions to advance urban design paradigms. Notably, despite being the most utilized outdoor public spaces, thermal comfort considerations remain conspicuously absent from conventional street design frameworks.
Urban green infrastructure delivers vital ecosystem services including atmospheric carbon mitigation [
9], pollutant filtration [
10], acoustic buffering [
11], microclimate regulation, and biodiversity enhancement [
12]. Street vegetation integration in thoroughfare design serves dual esthetic and bioclimatic functions, cooling paved surfaces through combined shading and evapotranspiration mechanisms while improving public health outcomes [
13,
14,
15]. Arboreal canopies demonstrate 60–90% solar radiation interception capacity, with cooling efficacy varying significantly across species based on leaf area indices (LAI) and canopy architecture [
16,
17]. The multi-functional benefits extend to particulate deposition and noise attenuation, collectively enhancing environmental quality [
18]. Current research limitations persist in over-reliance on 2D greening metrics, neglecting 3D green volume distribution patterns and their perceptual impacts on urban populations.
The quantification of street vegetation through the GVI has gained prominence due to its operational efficacy in urban greening assessments [
19]. GVI exhibits dynamic responsiveness to vegetation cover fluctuations, with pronounced spatial variability across heterogeneous urban morphologies, offering unique microclimate mitigation opportunities [
20,
21]. Defined as the visible proportion of urban greenery, GVI demonstrates a quantifiable correlation with traditional canopy coverage metrics [
22], while outperforming them in capturing human-perceived greenness [
23]. Its synergistic relationship with pedestrian activities—including walking duration, jogging frequency, and cycling patterns—has been rigorously examined [
24]. The proliferation of geospatial technologies, particularly street view imagery (SVI) and web-mapping platforms, now enables large-scale GVI data acquisition [
25]. However, GVI distribution manifests significant spatial inequity [
26], despite its demonstrated capacity to enhance urban thermal performance and psychological well-being [
27]. Empirical analyses reveal a 15–20% improvement in pedestrian Thermal Comfort Vote (TCV) per 10% GVI increment [
28], underscoring its utility for climate-responsive urban planning when integrated with Urban Climate Mapping systems [
29]. The human-centric quantitative advantages of the GVI have become increasingly evident, with empirical evidence demonstrating significant correlations between GVI values and human health indicators as well as perceived environmental quality. When ambient green visibility exceeds specific thresholds, visual exposure mechanisms contribute to enhanced environmental comfort, elevated psychological relaxation levels, and mitigated physiological fatigue—phenomena directly associated with the psychological restoration effects of greenspace exposure [
30]. GVI improvements may enhance pedestrian-level thermal comfort through modulating solar radiation attenuation and evapotranspiration processes. Empirical evidence indicates significant negative correlations between GVI and mean air temperature, alongside positive correlations with relative humidity, while demonstrating substantial mitigating effects on physiological equivalent temperature (PET) [
31,
32]. Under comparable microclimatic conditions, varying GVI values exert distinct influences on pedestrian thermal perception. Areas with higher GVI correlate with lower thermal sensation votes (TSeV-g), indicating cooler subjective experiences [
33]. Green infrastructure and SVF jointly modulate urban street thermal comfort, with SVF exhibiting significant positive associations with PET and thermal sensation votes (TSV). Tree canopy coverage significantly reduces mean radiant temperature (Tₘᵣₜ) and PET through solar radiation shielding effects [
31,
34]. Nevertheless, the mechanistic interplay between GVI and microclimatic parameters remains insufficiently characterized, constraining its application in climate-adaptive design frameworks.
This investigation examines the GVI-thermal environment nexus within Hangzhou’s urban core. Leveraging street view analytics and machine learning algorithms, we first map the spatial patterning of GVI. Concurrently, mobile microclimate sensing facilitates the construction of a high-resolution thermal environment model, enabling spatiotemporal analysis of heat distribution patterns and hotspot genesis. Through multi-scale urban-street interface analysis, we elucidate the interaction dynamics between GVI and thermal conditions across temporal cycles, street orientations, canyon geometries, and urban-rural transects.
2. Materials and Methods
2.1. Study Area
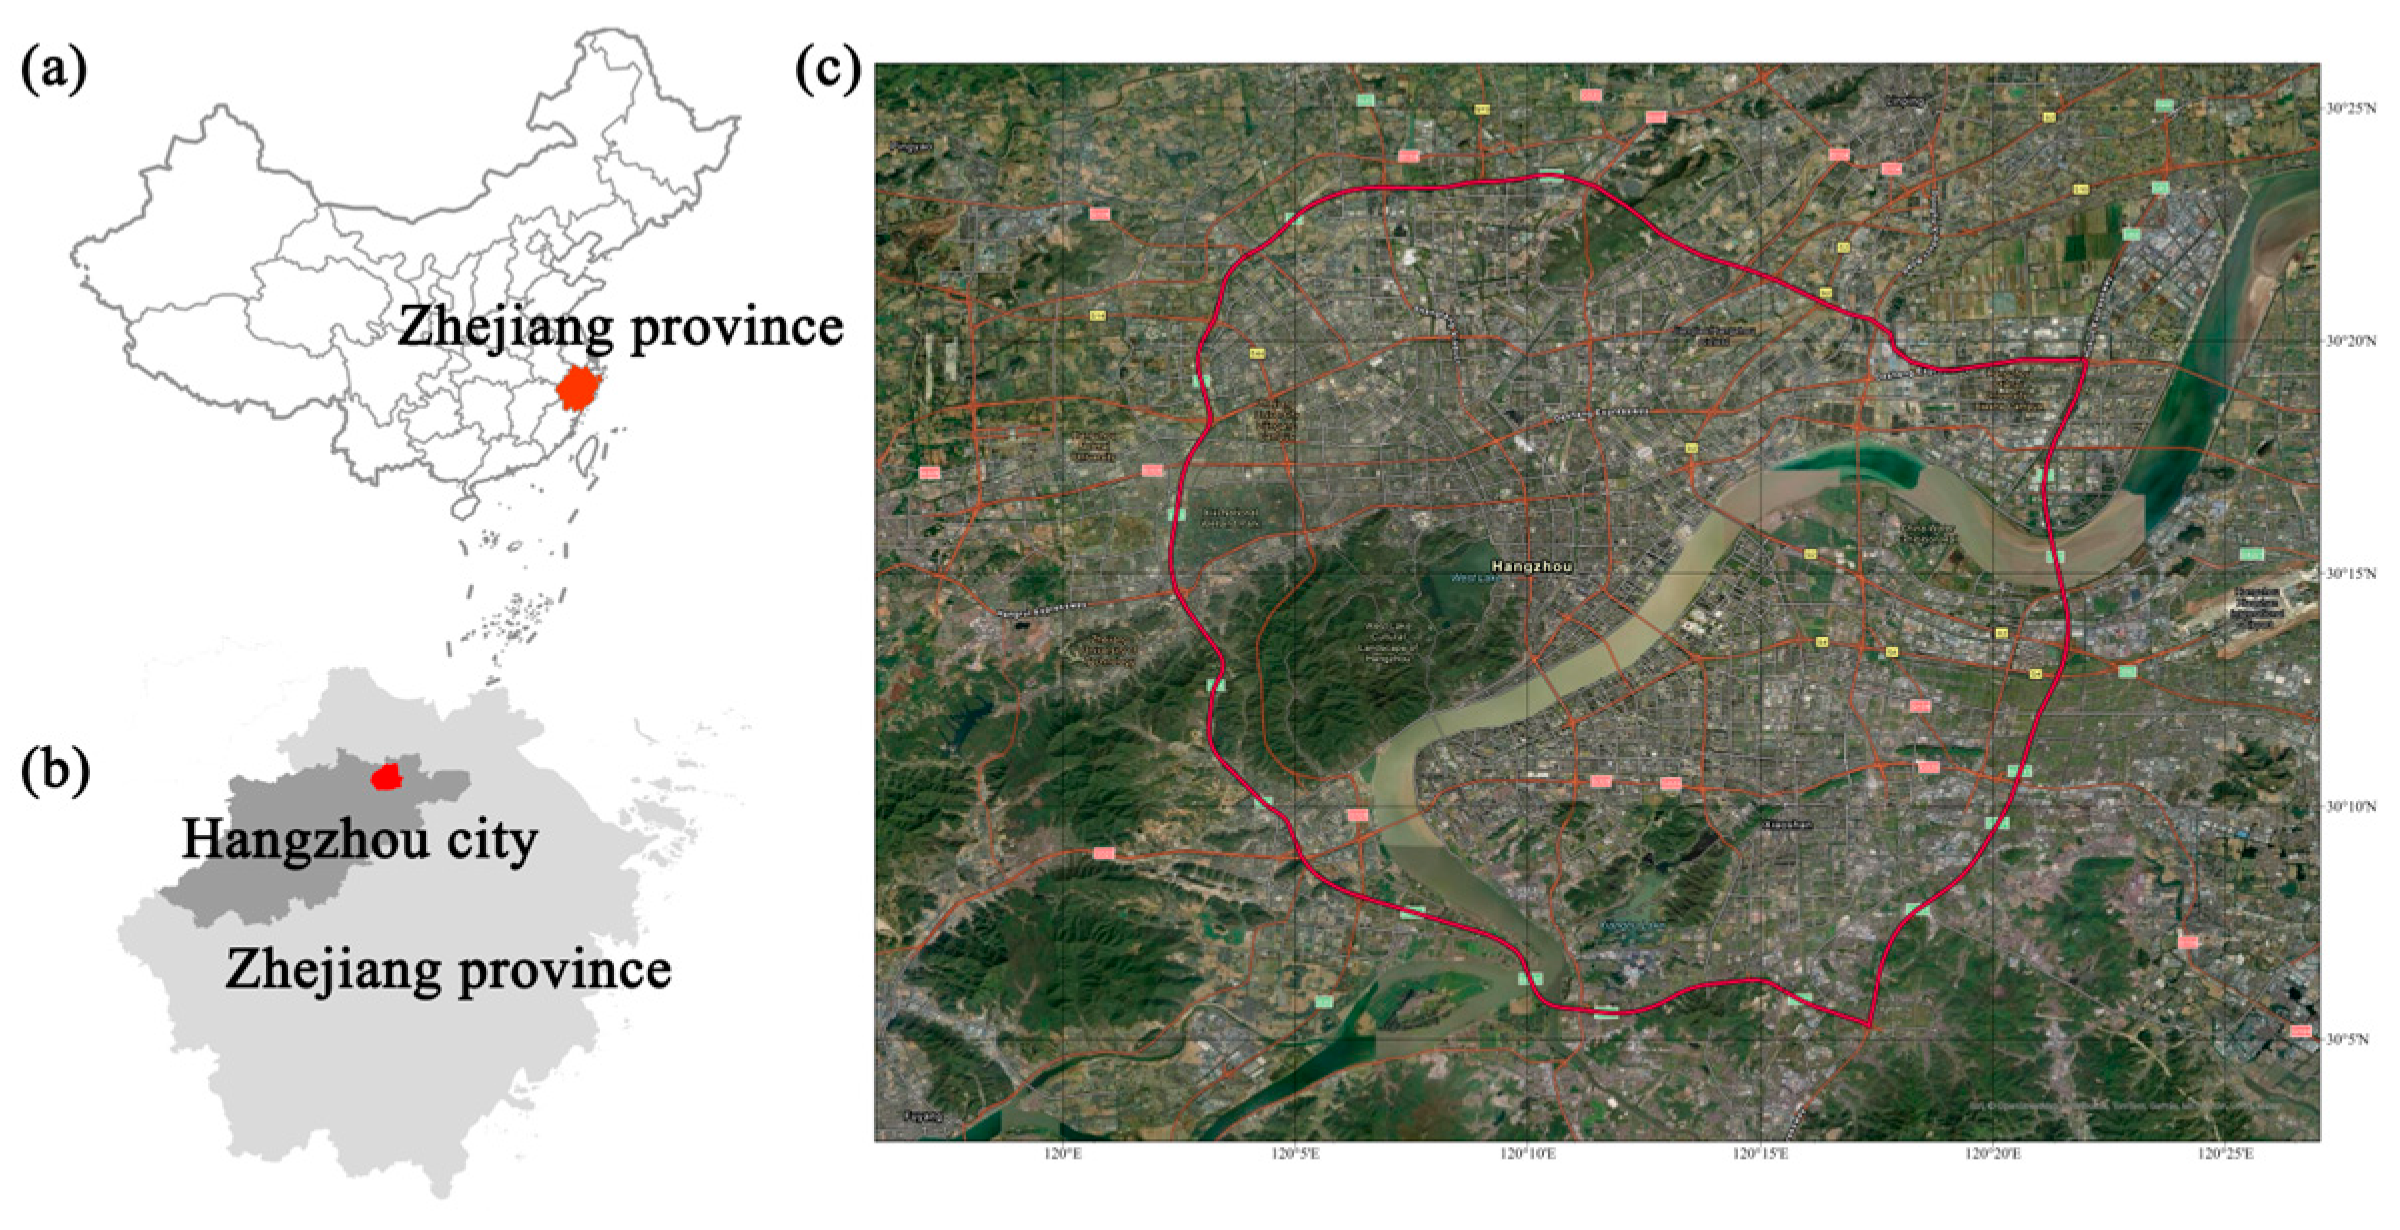
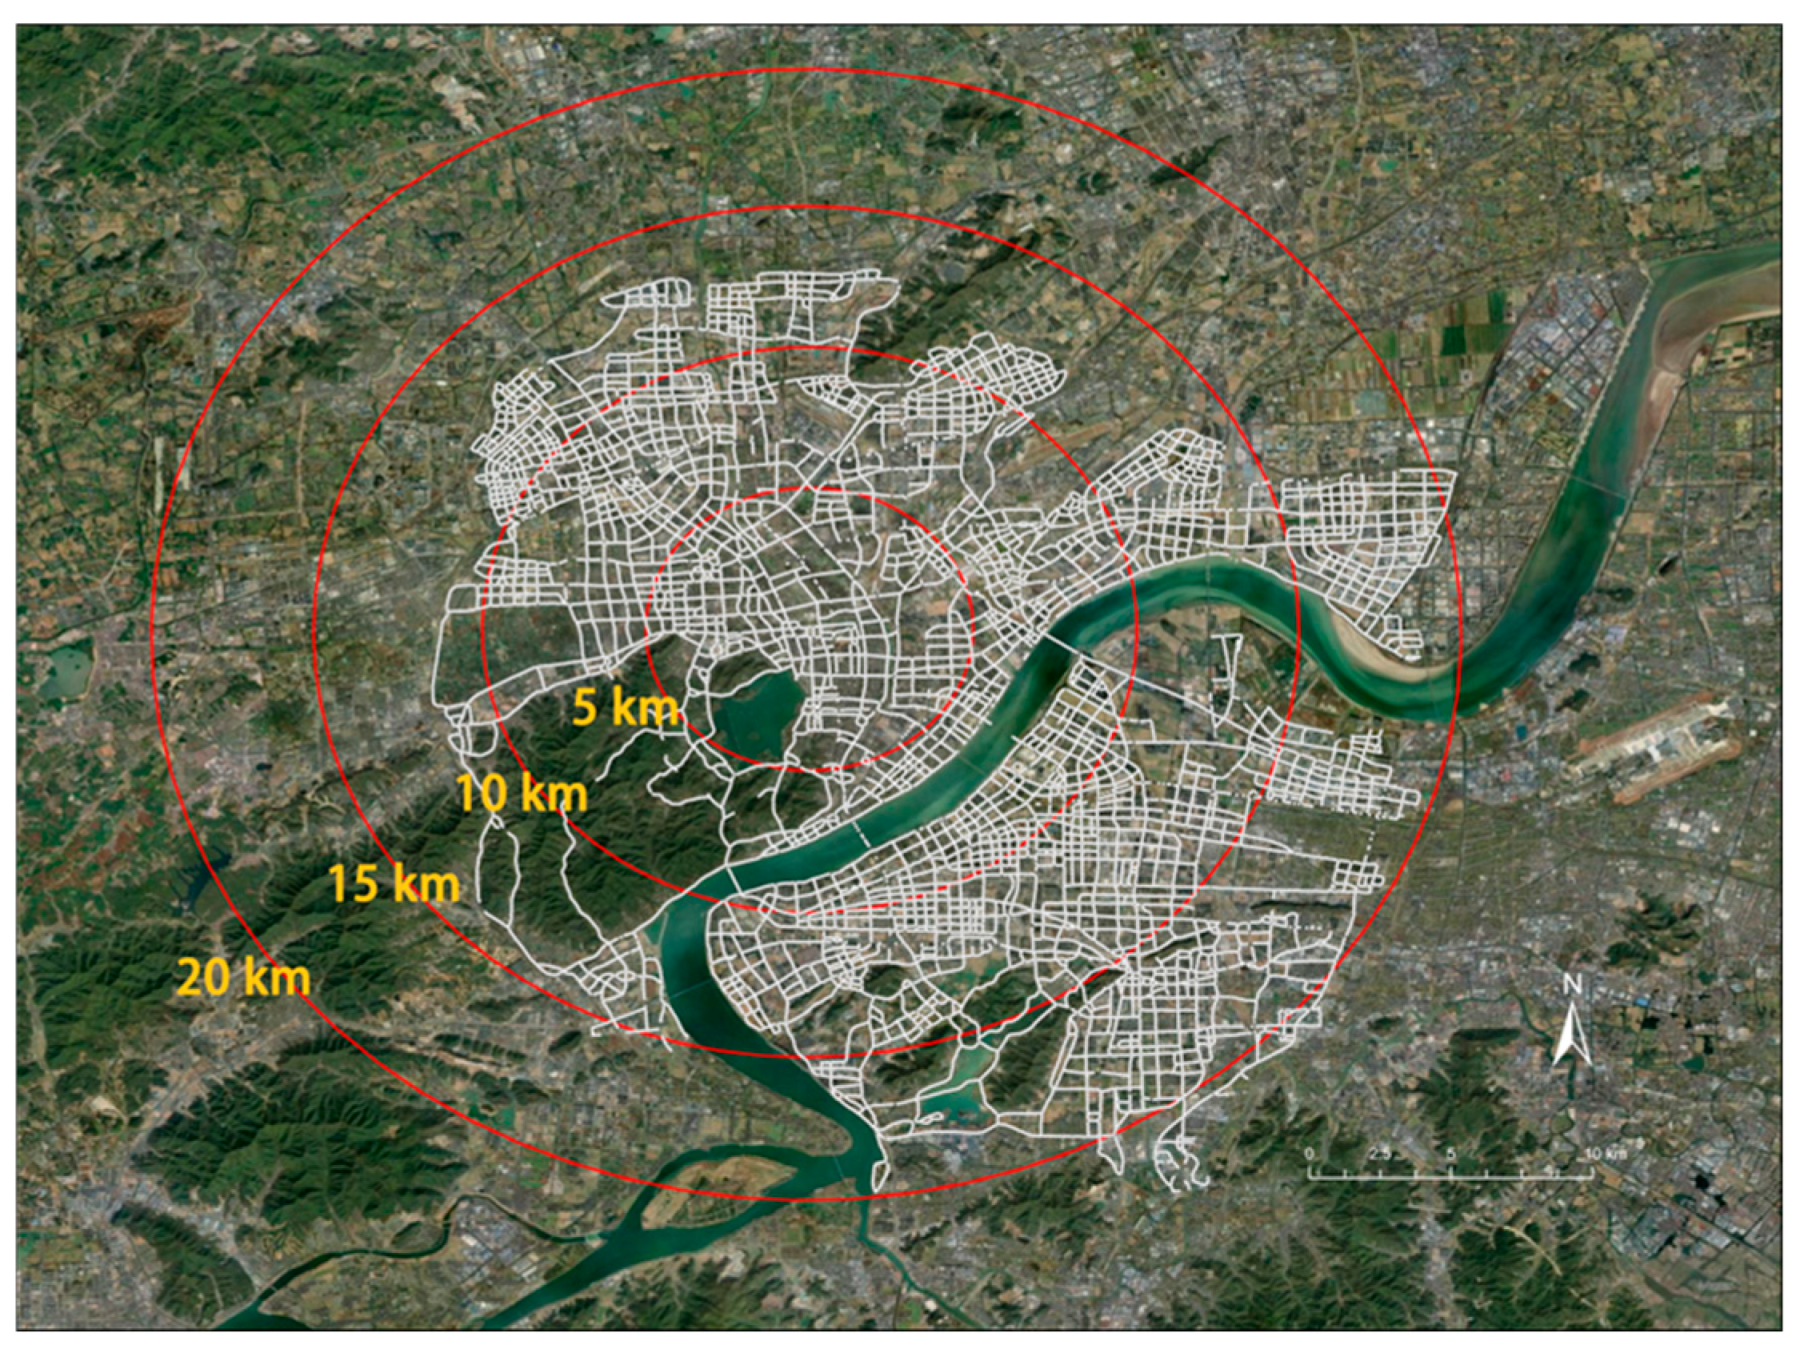
The study area encompasses Hangzhou City (30°06′ N–30°47′ N, 119°58′ E–120°43′ E) in Zhejiang Province, China (
Figure 1). Characterized by a humid subtropical climate (Köppen–Geiger classification Cfa), the region experiences hot, humid summers and cool, damp winters. Climatic records indicate a mean annual temperature of 17.8 °C, 70.3% relative humidity, 1454 mm precipitation, and 1765 sunshine hours.
Recent decades have witnessed escalating thermal extremes in Hangzhou, with summer heat events intensifying markedly. Meteorological data reveal unprecedented temperature anomalies: 59 days ≥35 °C in 2022 (historical record), escalating to 60 extreme heat days in 2024—the highest since standardized recording began in 1951. August 2024 alone recorded 28 days exceeding 35 °C, with persistent heatwaves extending into September. Extreme heat episodes (≥40 °C) surged to 10 days in 2024, peaking at 41.9 °C. This thermal intensification manifests not merely in duration but through increasing frequency and magnitude of heat extremes, exacerbating urban heat island (UHI) effects. The compound impacts threaten public health, strain energy infrastructure, and destabilize urban ecosystems through prolonged thermal stress exposure.
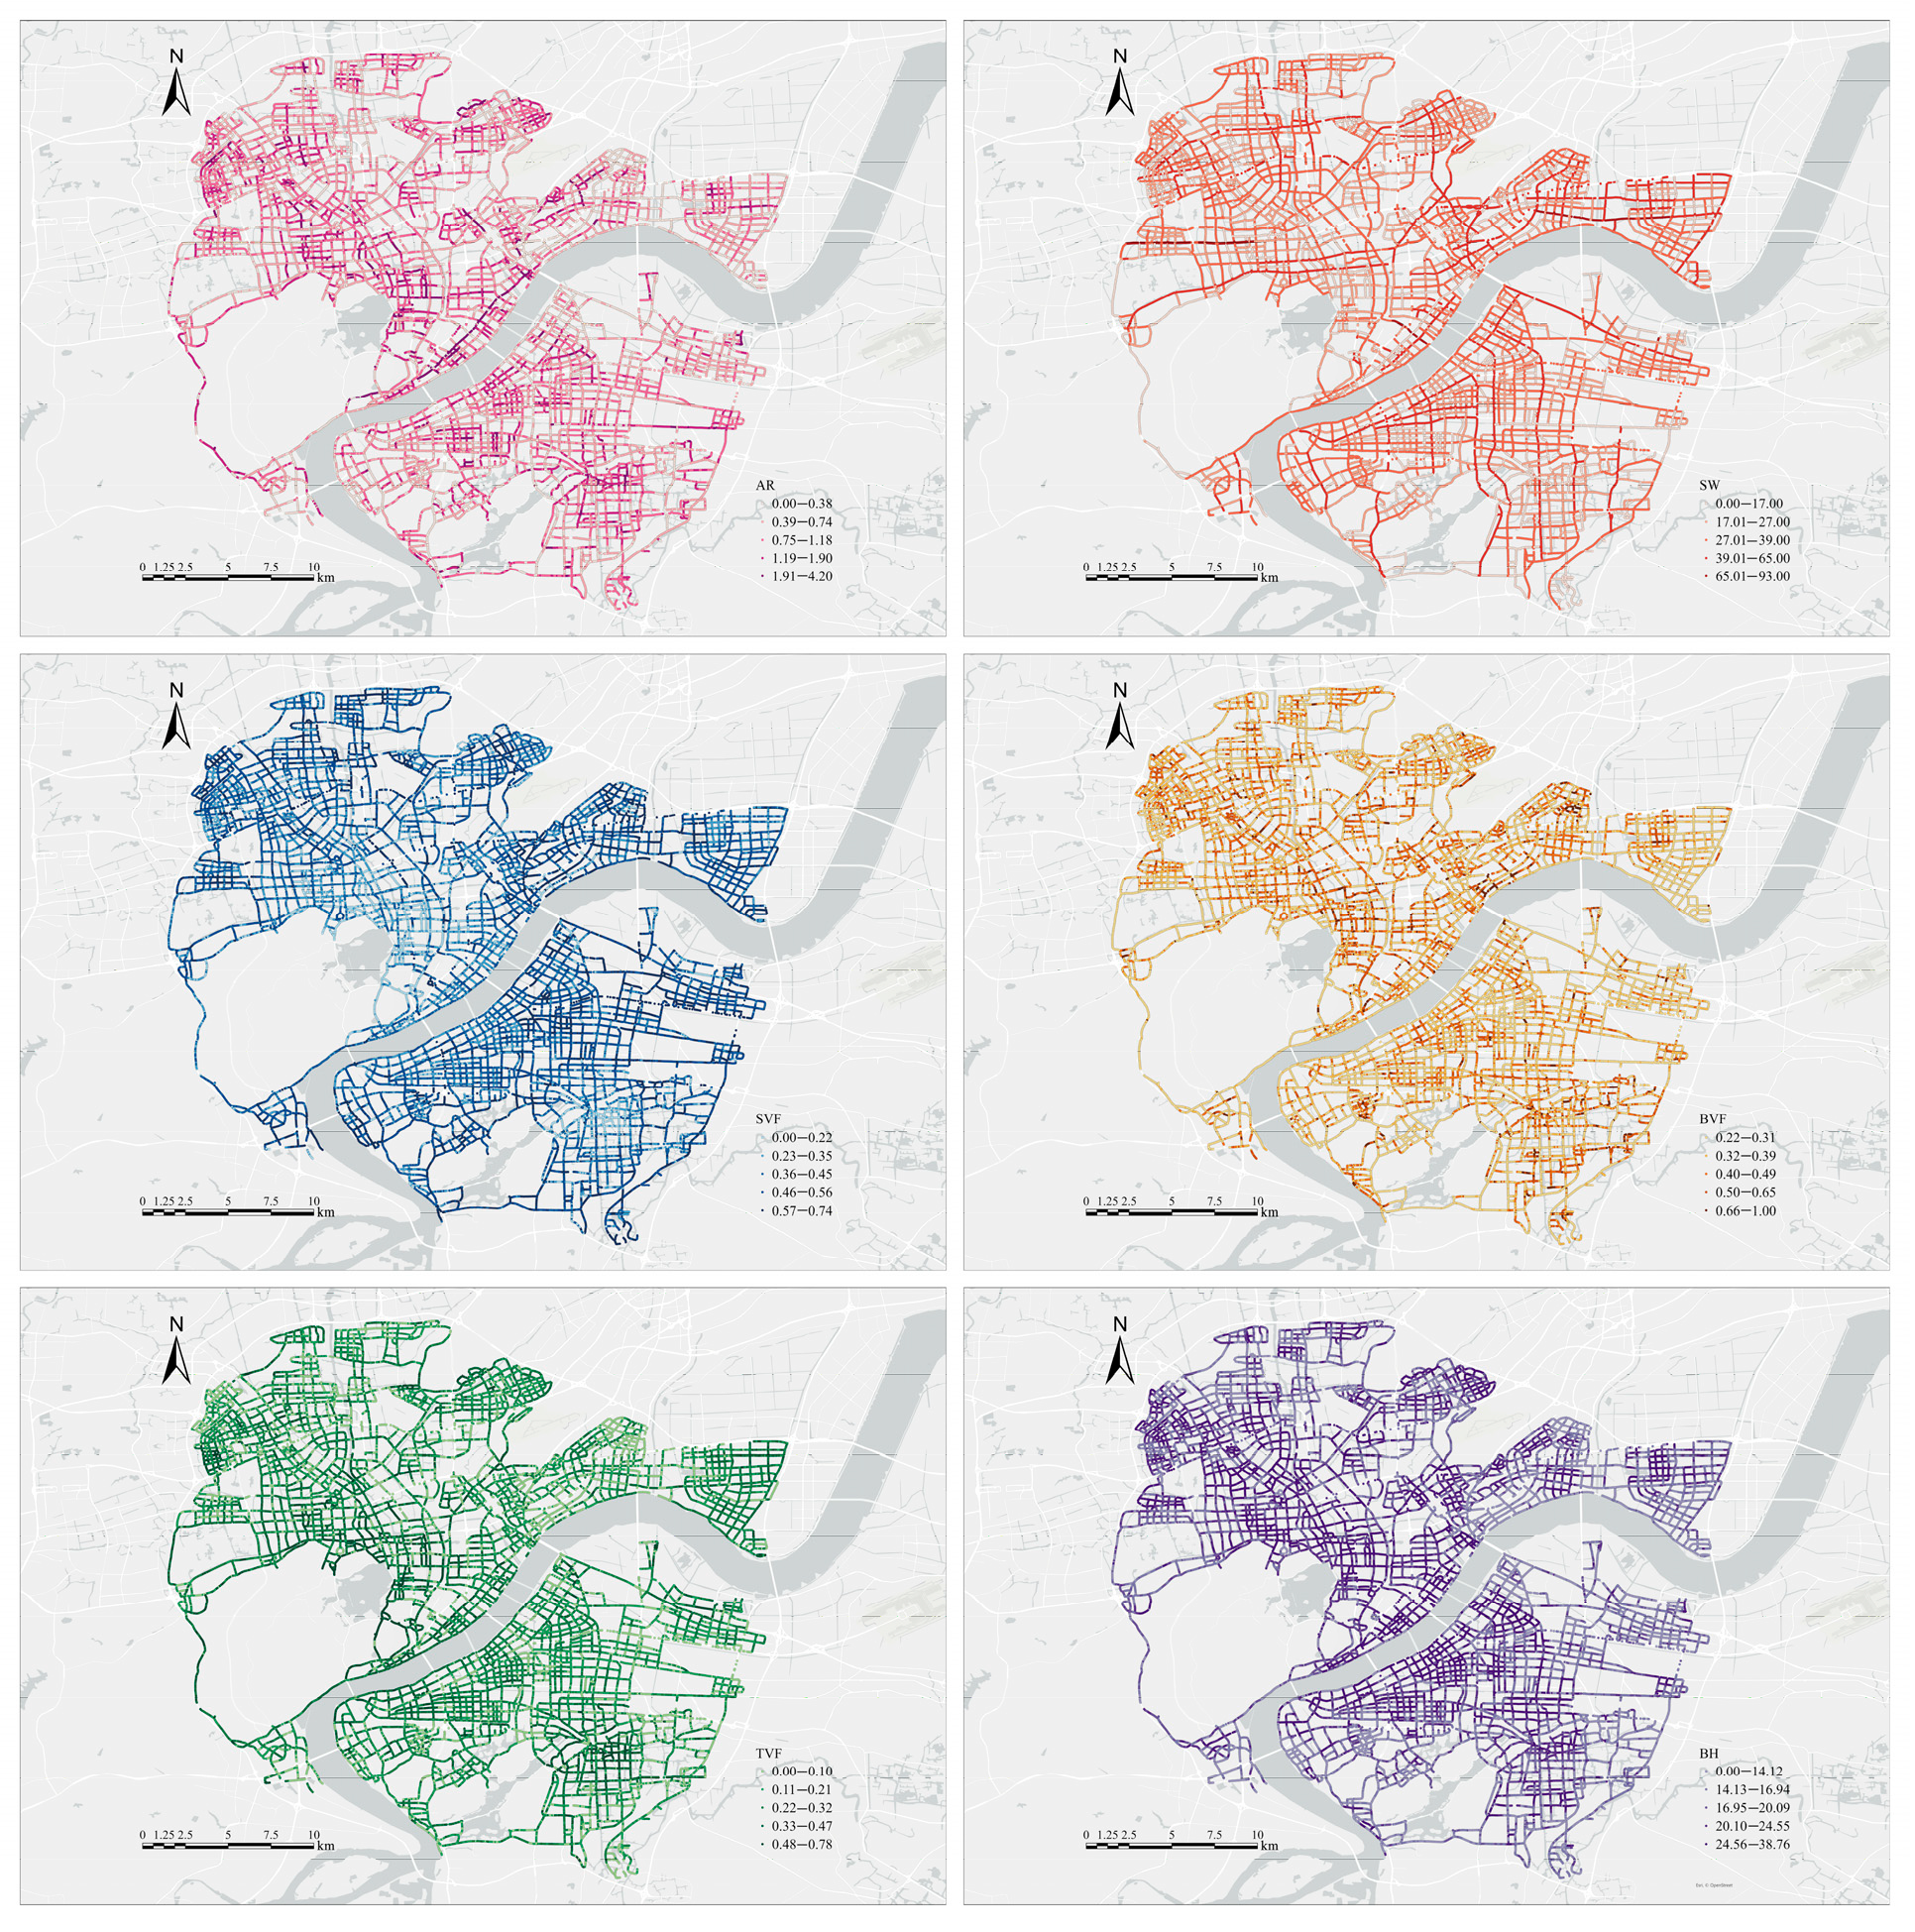
2.2. Morphological Parameter Selection and Calculation
This study examines the thermal-environment modulation capacity of urban vegetation through two principal morphological parameter categories: built-environment morphology and vegetation canopy morphology. The built-environment parameters comprise Sky View Factor (SVF), Building View Factor (BVF), street canyon aspect ratio (AR), and mean building height (BH). Vegetation parameters include Tree View Factor (TVF) and GVI, quantifying 2D and 3D greenery distribution, respectively. Among these metrics, the GVI quantifies the two-dimensional visible coverage proportion of all vegetation elements within the observer’s field of view, reflecting the perceived intensity of vegetation greening. The TVF specifically represents the three-dimensional shading efficacy of arboreal canopies in spatial contexts, derived through SVF correction calculations to characterize the physical radiation attenuation capacity of tree cover. While these parameters exhibit complementary interactions in urban thermal regulation, they represent distinct metrics reflecting different dimensions of vegetation–environment relationships.
Building elevation data were obtained from the CNBH-10 m digital surface model, with building footprint vectors extracted from the Bigemap geospatial platform using 0.25 m resolution aerial orthophotos. The vector-raster integration was achieved through spatial alignment via WGS84 Mercator projection (EPSG:3857). Urban road networks were acquired from OpenStreetMap (OSM), with panoramic sampling points georeferenced to the network through 10 m buffer spatial joins.
To overcome OSM’s resolution limitations in street canyon width parameterization, this study implemented a multi-source data fusion framework:
Among them, AR represents the street aspect ratio at the sample location, BH represents the average height of the street at that sample location, and SW refers to the average width of the street where the sample location is located.
The street view image data utilized in this study were acquired from Baidu Street View (BSV). We implemented an automated acquisition framework using Python 3.8 architecture, enabling efficient collection of panoramic imagery across 445,127 sampling points. This system integrated three core methodologies: batch processing of spatial coordinates, dynamic API interface invocation, and multi-threaded download protocols.
Preprocessing procedures encompassed three sequential stages:
Scene Filtering: Automated elimination of non-standard street environments through metadata analysis; Image Validation: Application of OpenCV-based exposure histogram thresholding to remove corrupted frames; Quality Assurance: Final human review to verify urban streetscape consistency.
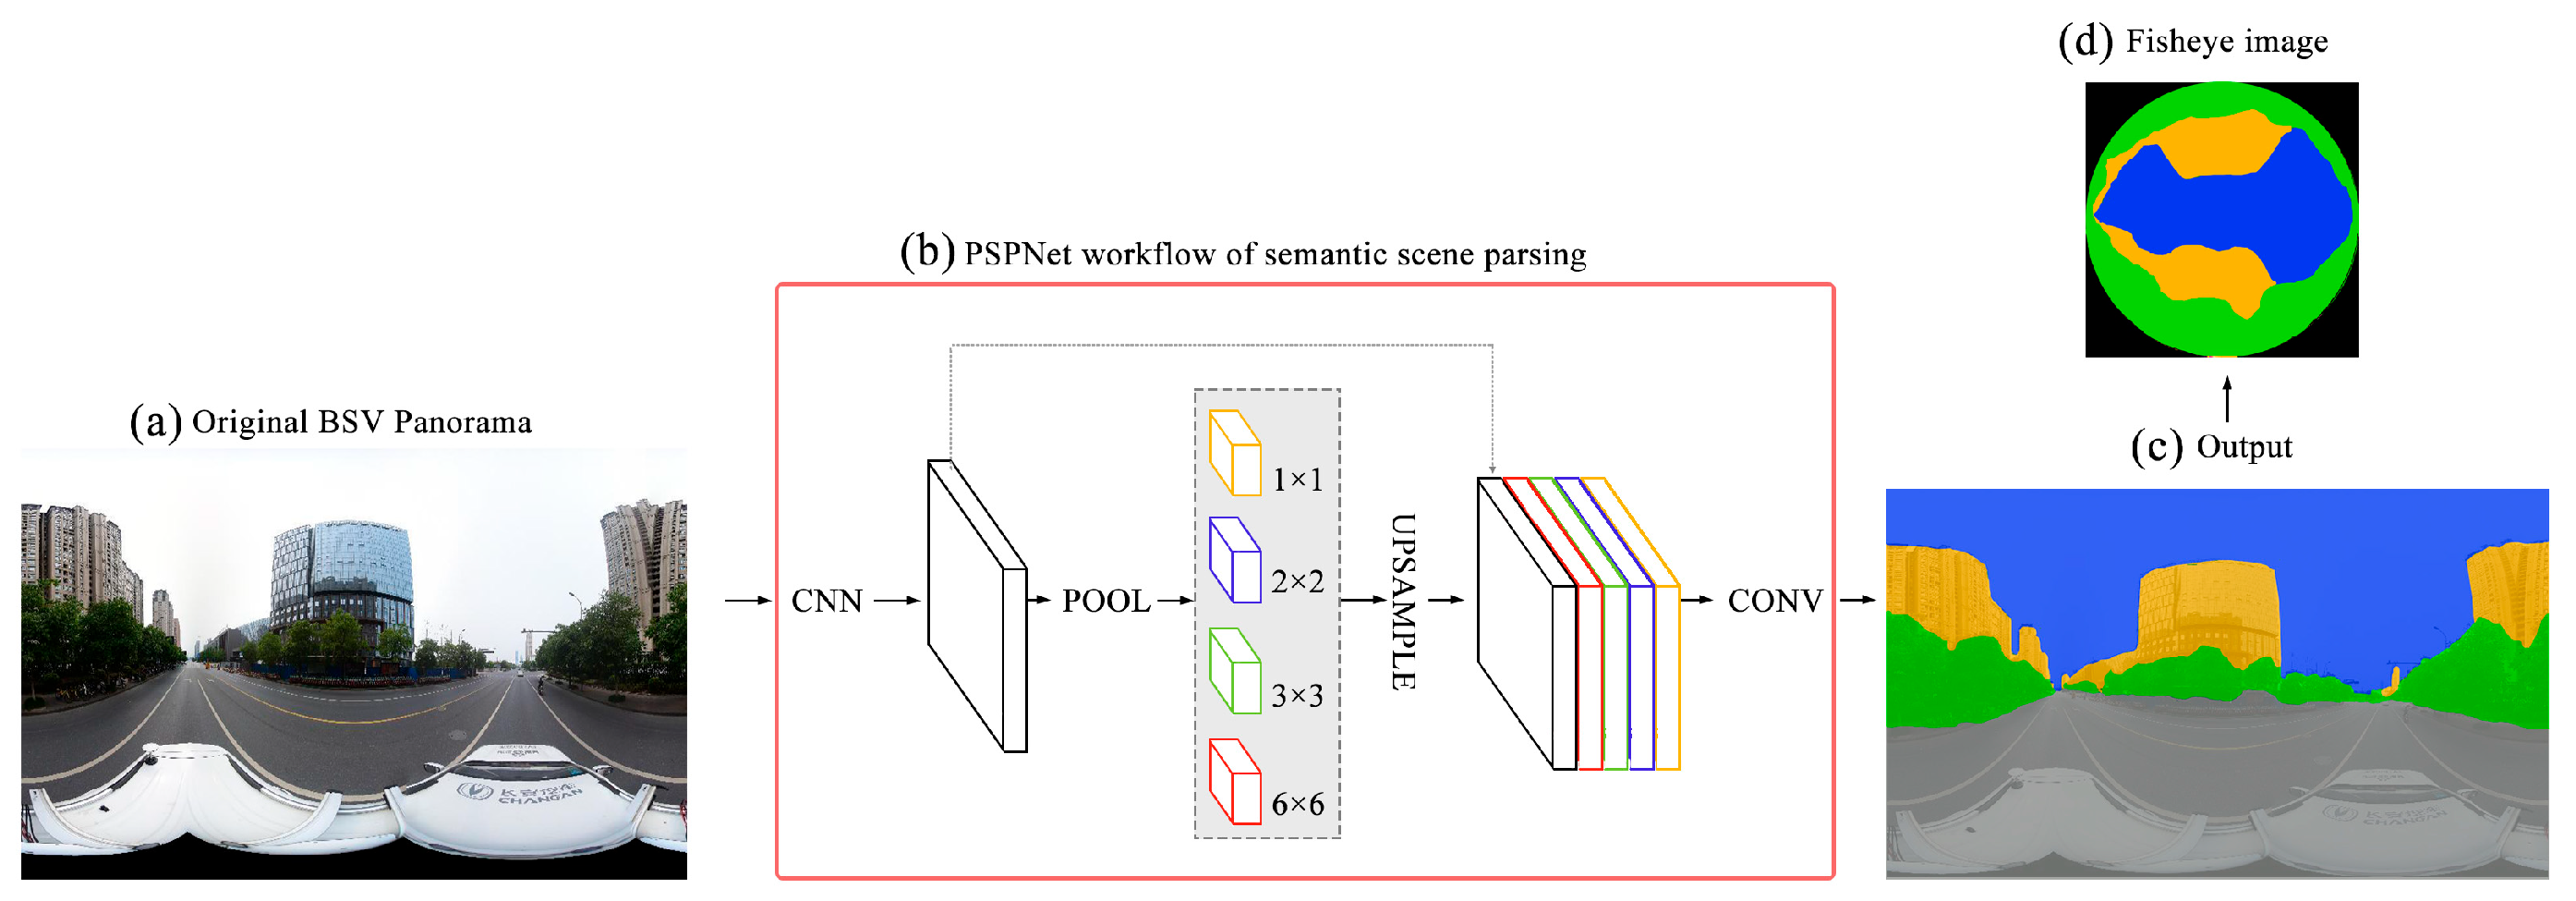
Image semantic segmentation was implemented utilizing a Convolutional Neural Network (CNN) architecture (
Figure 2). The study prioritized critical urban elements including sky, vegetation, and building categories within street scenes. A semantic segmentation framework was established based on the Pyramid Scene Parsing Network (PSPNet), with ResNet serving as the backbone architecture. Hierarchical feature fusion mechanisms were employed to integrate multi-scale contextual information from the imagery.
Following semantic segmentation, the panoramic imagery originally represented in Cartesian coordinates undergoes coordinate system transformation to polar coordinates. The technical implementation is detailed as follows: Upon completion of street view image segmentation, fisheye projection transformation is executed using the OpenCV image processing library within the Python development environment. The transformation’s core mechanism involves establishing precise mapping relationships between planar coordinates (
xp, yp) of the panoramic source and polar coordinates (
xf, yf) of the fisheye projection:
Here, xp and yp, respectively, represent the pixel coordinates in the panoramic street view image, while xf and yf represent the corresponding pixel coordinates in the fisheye image after transformation. Hp and Wp, respectively, denote the height and width of the image.
This study adopts the algorithmic framework proposed by Johnson and Watson [
35], implementing a hierarchical analysis strategy to quantify visible factors (VFs). The computational workflow involves batch processing through Python. The mathematical formulation is provided as:
In the formula, n represents the total number of rings (39 rings), i indicates the i-th ring, and ai represents the angular width of the i-th ring.
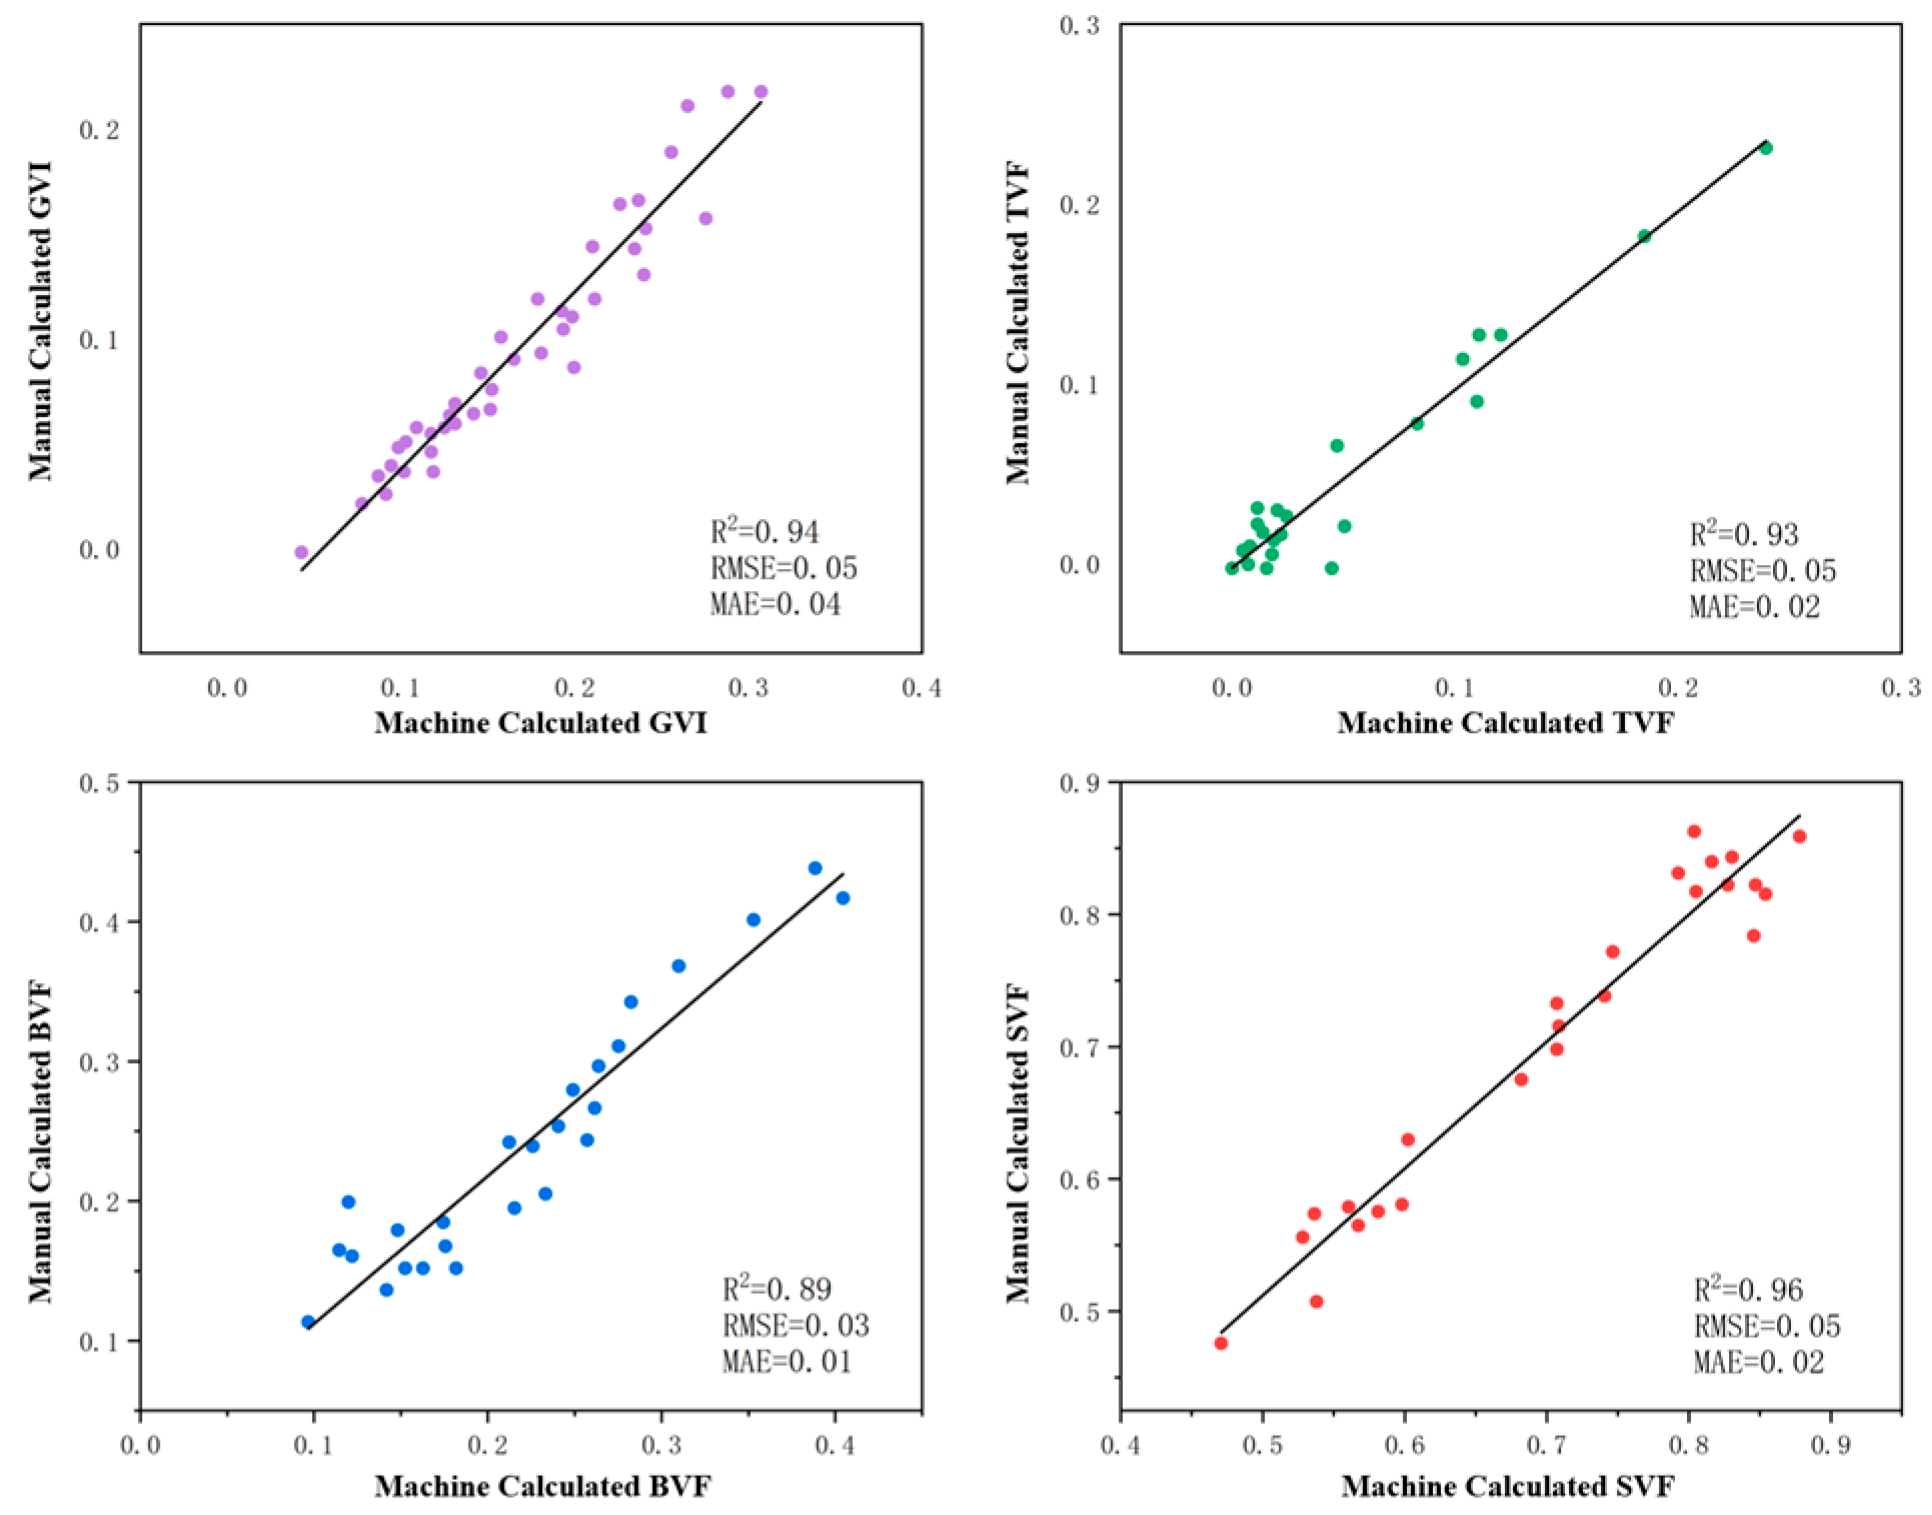
To validate the precision of the semantic segmentation algorithm in quantifying vegetation visible field (VF), this research employed fisheye lens-based field-of-view (FOV) photography. Representative street samples within the study area were selected through stratified random sampling. A Sigma 8 mm circular fisheye lens coupled with a Canon EOS 6D camera captured ground-truth imagery at a standardized 1.5 m height, simulating human-eye streetscape perception. Regression analysis comparing automated segmentation outputs with manual survey results (
Figure 3) yielded R
2 values between 0.89 and 0.96 and root mean square errors (RMSE) consistently within 0.03–0.05. These metrics substantiate the methodological reliability and computational accuracy of the Baidu Street View-based segmentation framework for VF and GVI assessments.
The GVI serves as a quantitative metric for assessing the proportion of green vegetation within street-level visual fields. This indicator transcends conventional two-dimensional planar limitations by incorporating three-dimensional spatial perception principles. Specifically, it measures the visibility of green elements within urban streetscapes from the pedestrian’s perspective. The GVI value is derived by computing the ratio of vegetation pixel area to the total panoramic pixel count in calibrated street-view imagery. The mathematical formulation is expressed as:
In the proposed equation, GVI denotes the green view index at the sampling location. Areav represents the vegetation pixel count within the defined spatial unit, while Areat corresponds to the total panoramic pixel count captured in the street-level imagery.
2.3. Urban Street Microclimate Measurement
Methodological Framework and Route Optimization
The Mobile Measurement Method employs a portable sensor suite integrated on a mobile platform to collect street-level microclimate data. This approach offers distinct advantages in flexibility, cost-efficiency, and high spatiotemporal resolution compared to stationary systems. By transcending the spatial constraints of fixed monitoring stations, it enables precise characterization of pedestrian-scale thermal environments and effective identification of urban heat island heterogeneities. The methodology provides critical empirical support for climate-responsive urban planning and complements conventional fixed-point observation networks.
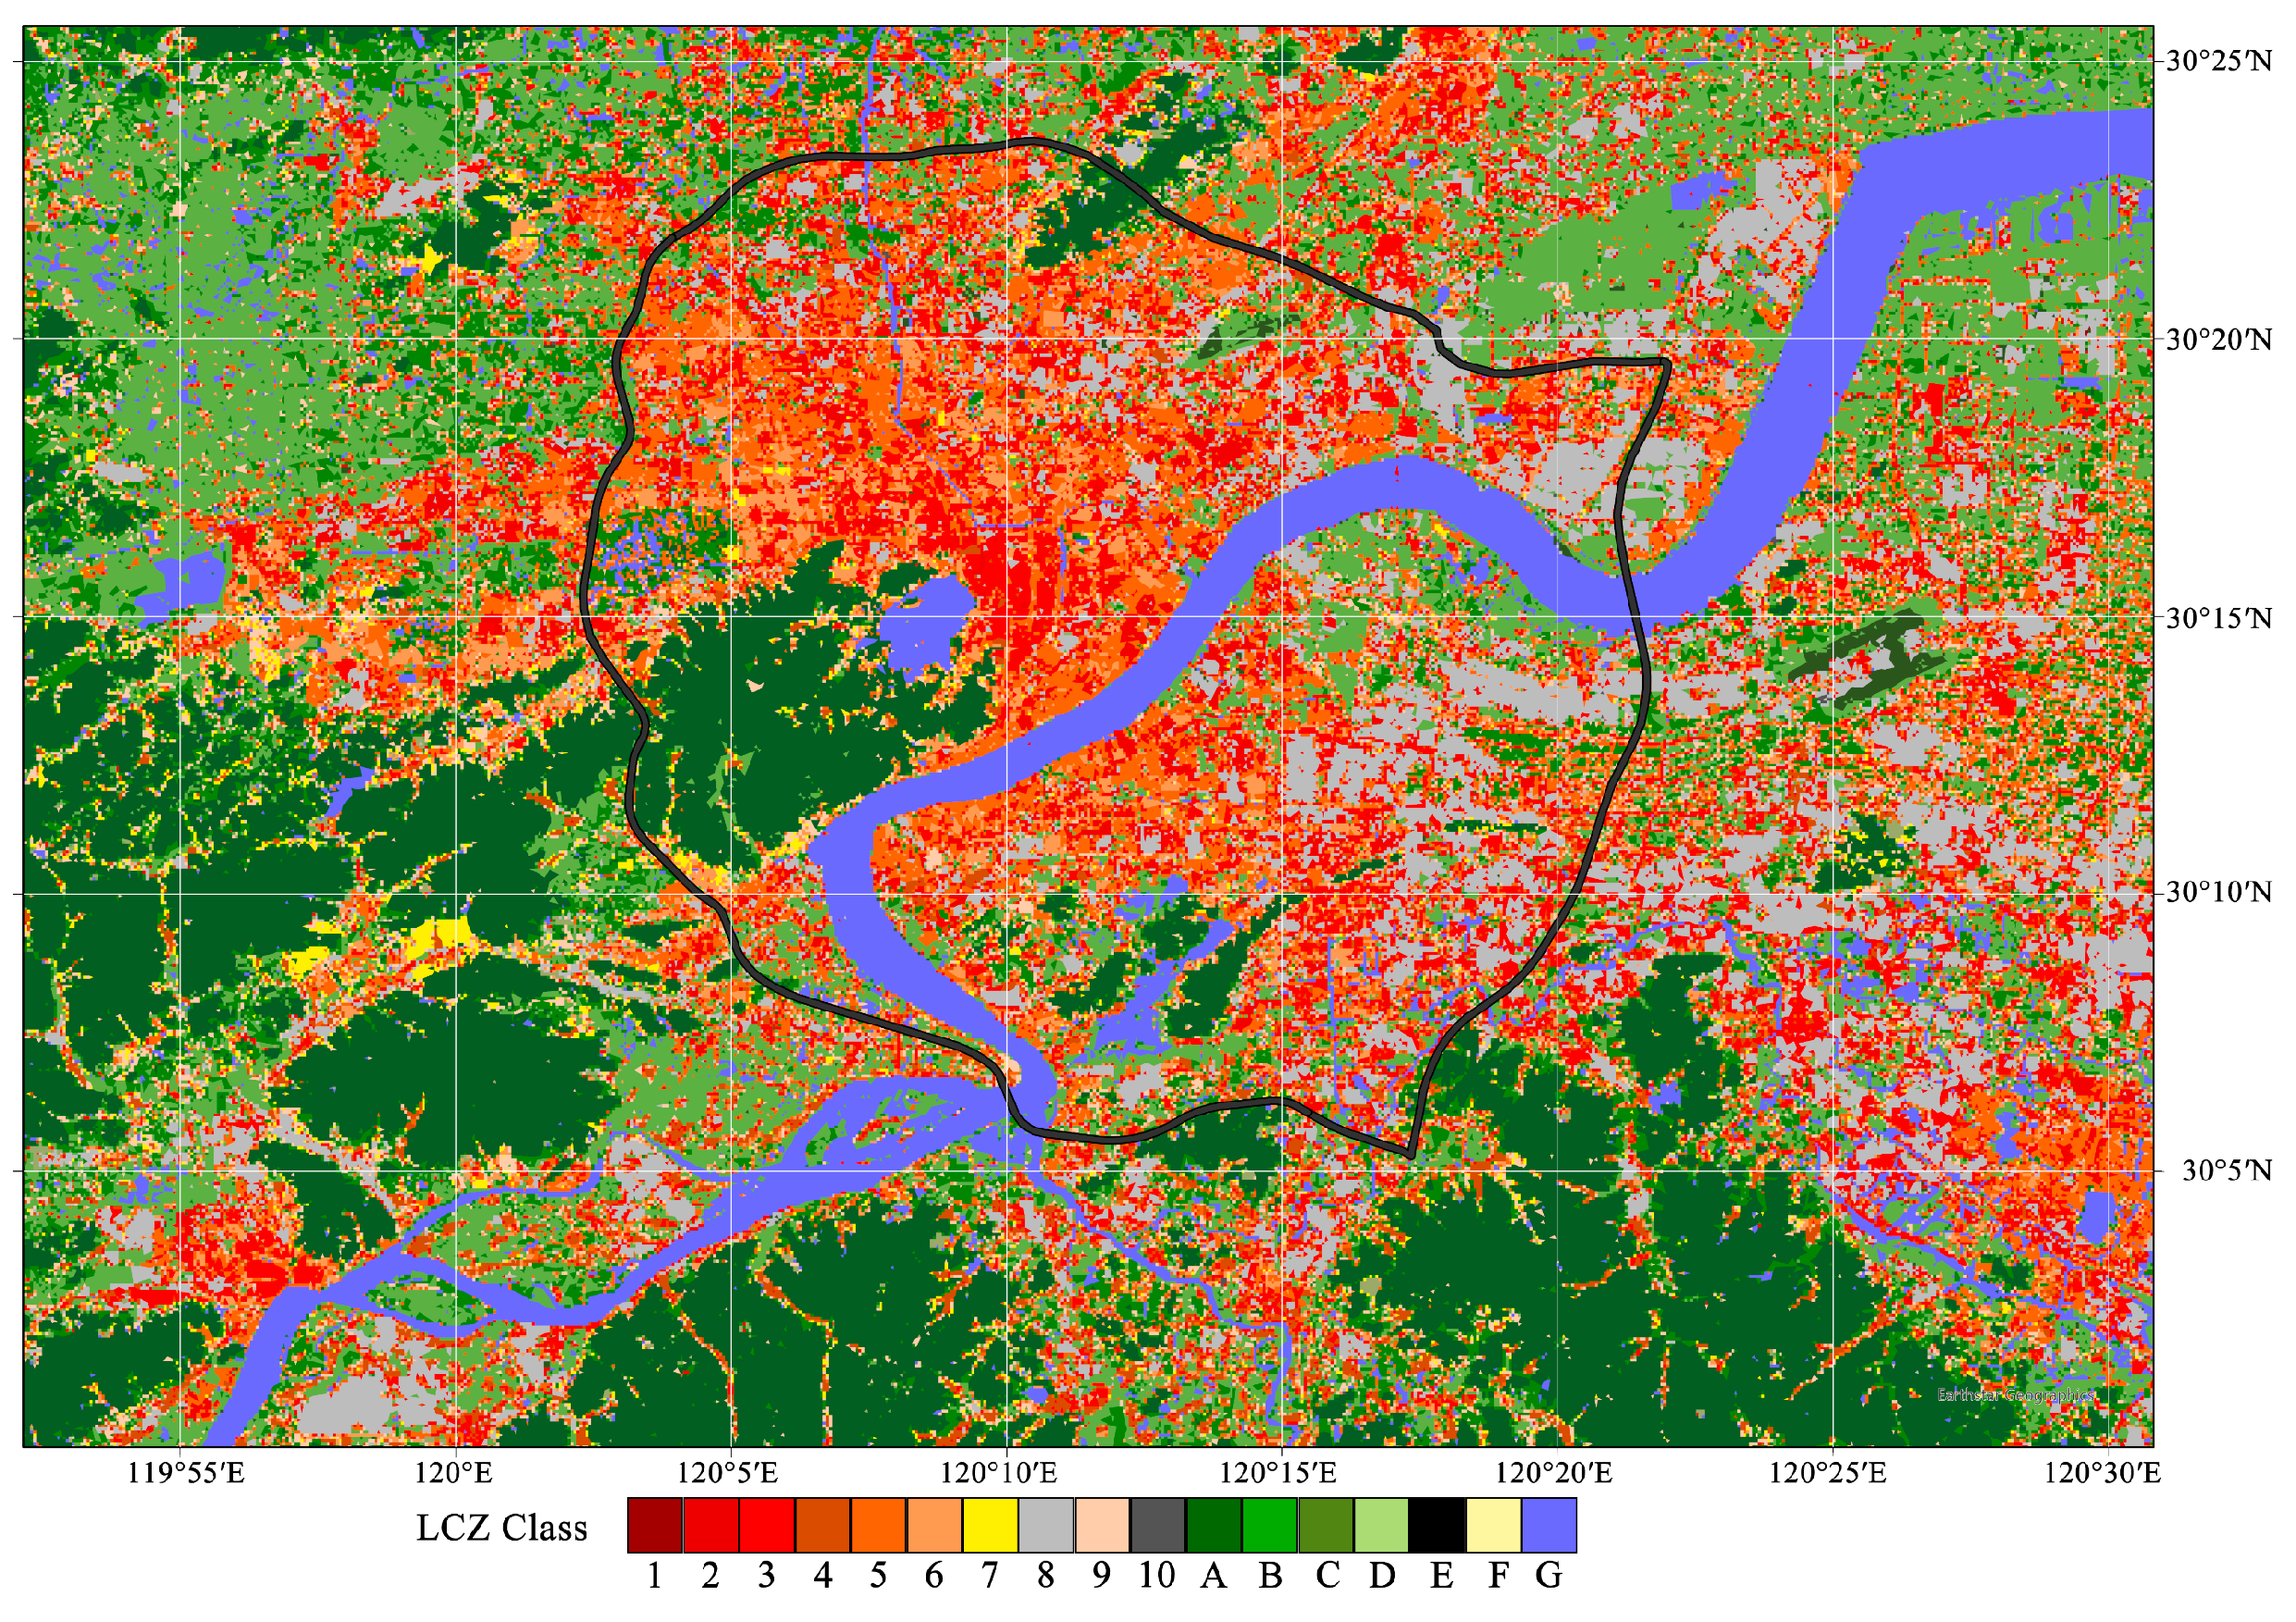
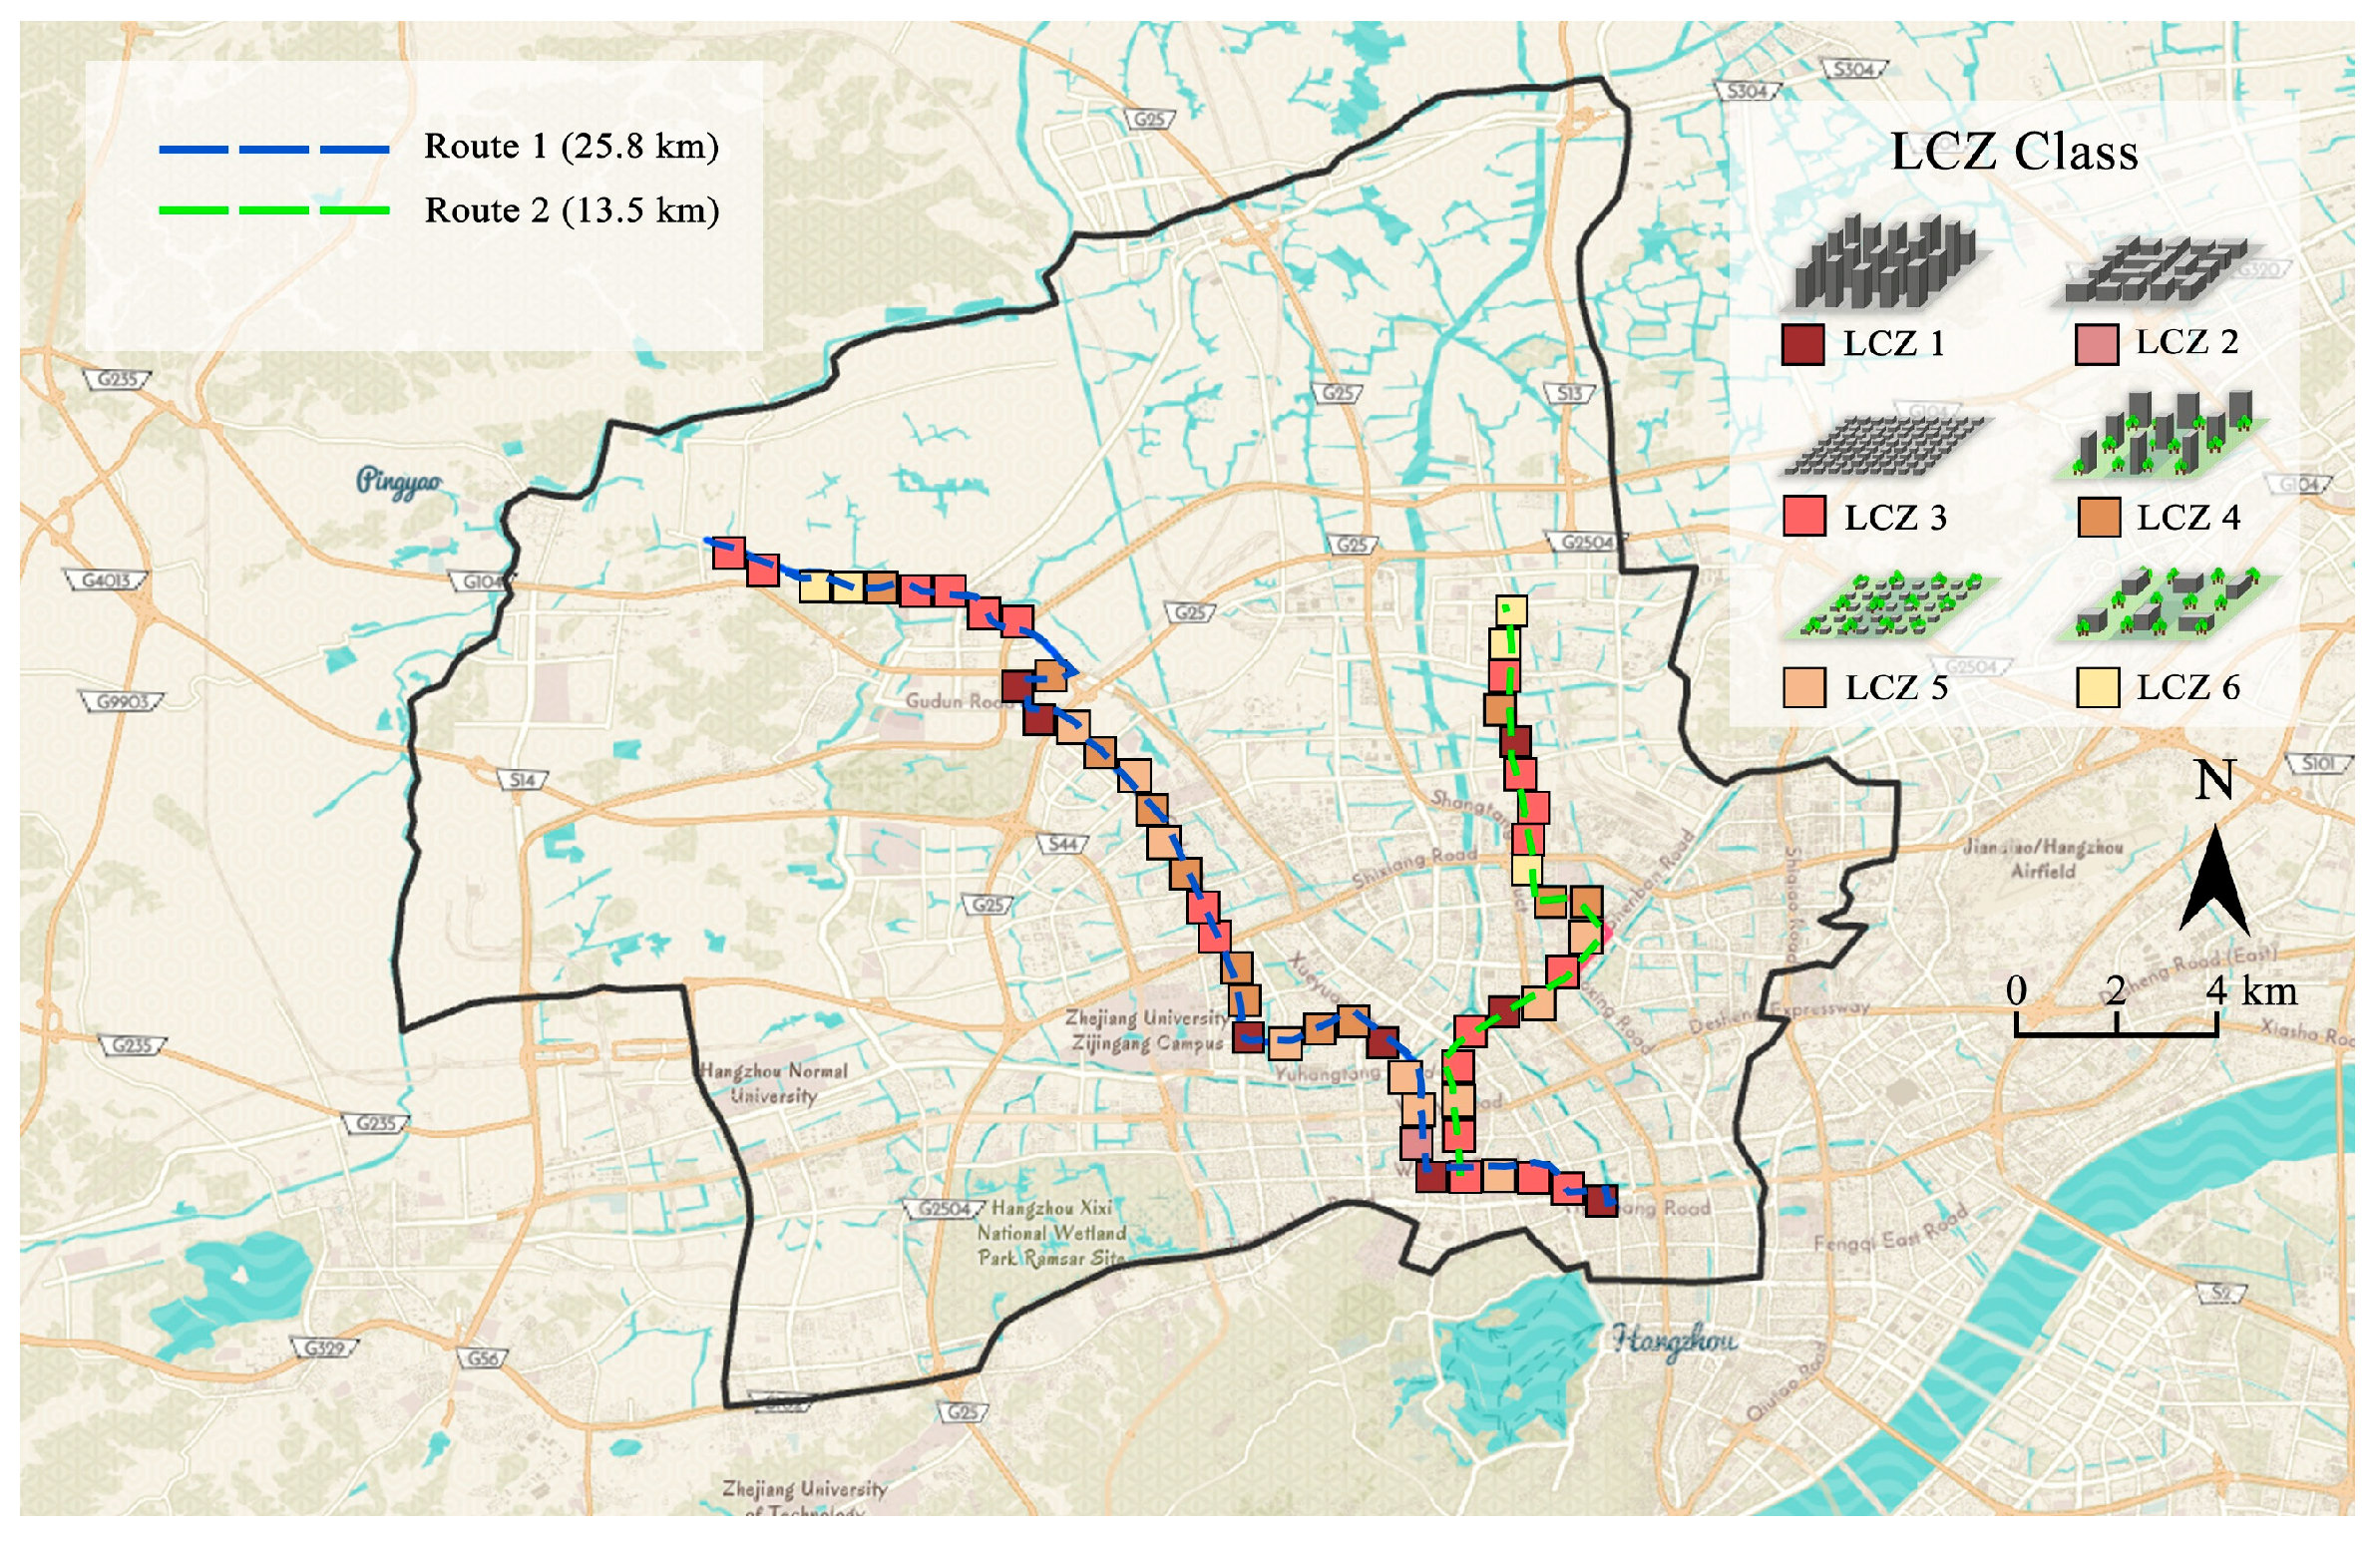
To ensure comprehensive coverage of street morphological diversity, this research incorporates the Local Climate Zone (LCZ) classification system. Utilizing the WUDAPT LCZ Generator tool, we conducted multi-scale urban climate analysis based on the World Urban Database and Access Portal Tool (WUDAPT) framework. The classification model was validated through systematic sampling of ground truth points, with accuracy assessment performed using the error matrix method. The obtained data such as BH, SVF and H/W are used as the accuracy evaluation, and necessary adjustments are made to the classification of the built-up area. Results demonstrated an overall classification accuracy of 79% and a Kappa coefficient of 0.76 for the optimized LCZ model.
According to LCZ classification principles (
Figure 4), this study developed two systematic measurement routes (
Figure 5), comprising Route 1 (25.8 km) and Route 2 (13.5 km). These routes were strategically designed to traverse six distinct LCZ categories within the urban matrix, ensuring comprehensive coverage of morphological diversity across the study area.
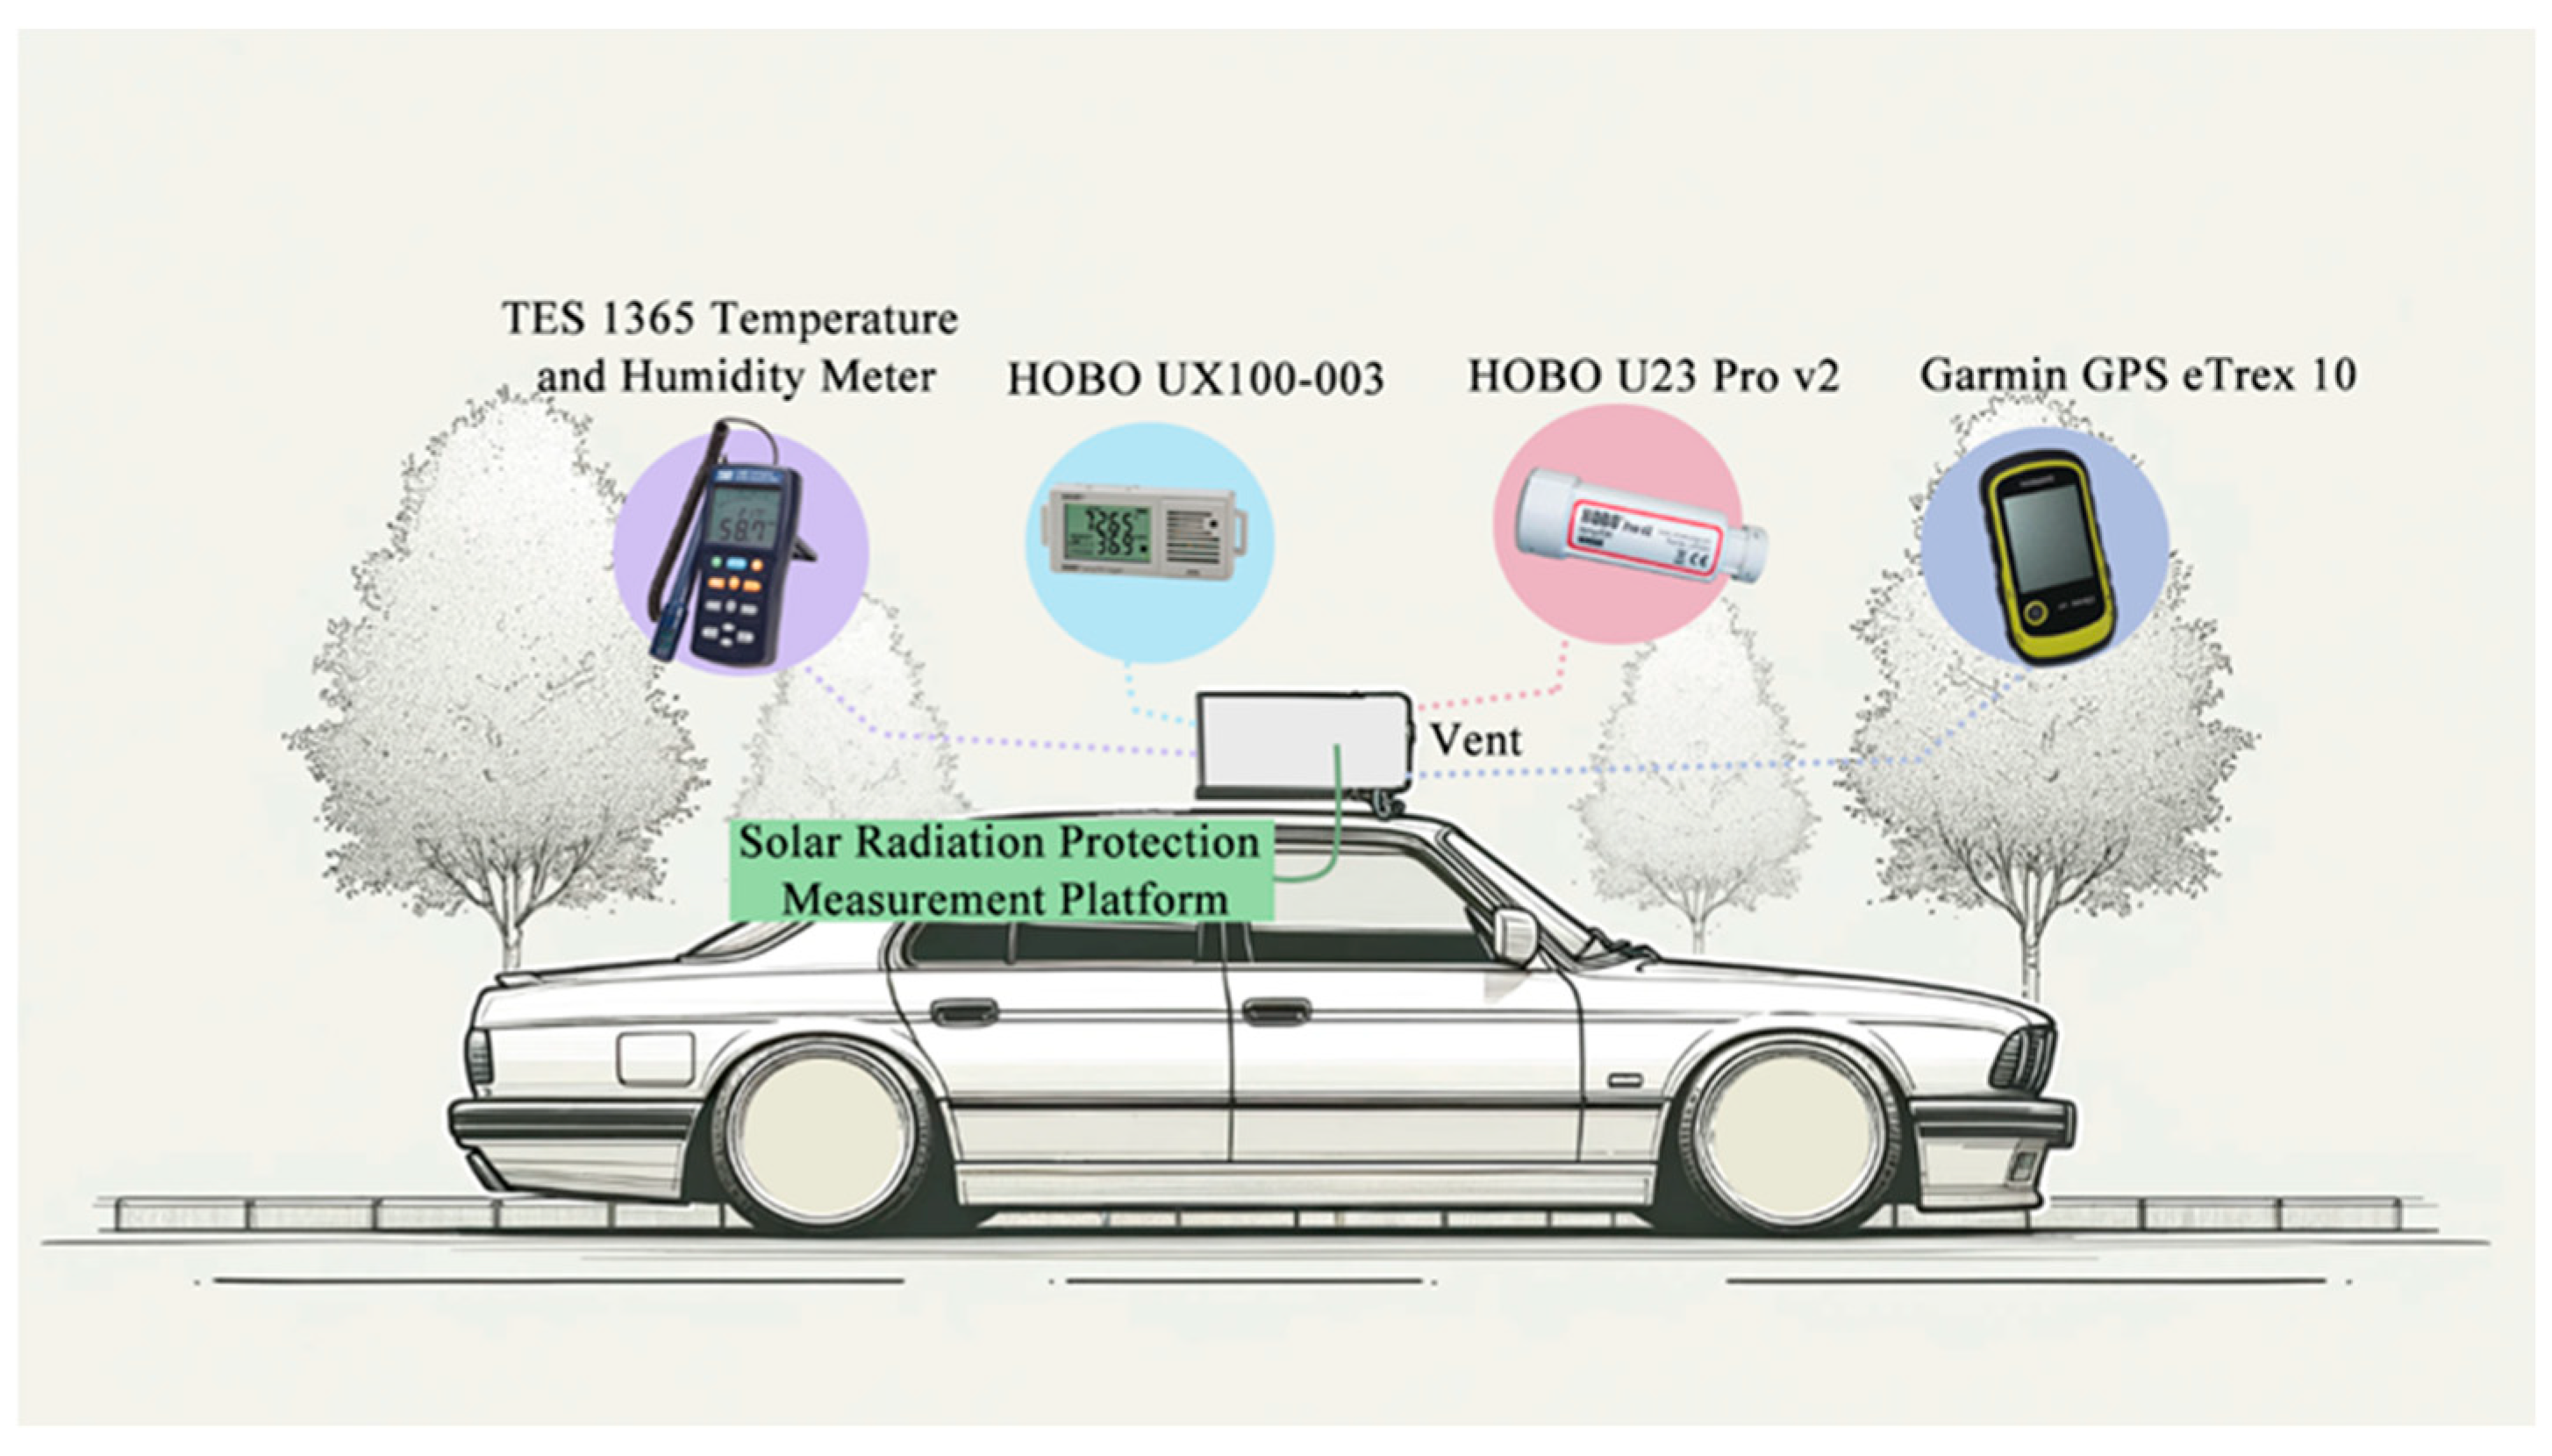
This study implemented a mobile monitoring protocol utilizing an instrumented vehicle as the primary data acquisition platform (
Figure 6). A radiation-shielded enclosure mounted on the vehicle roof housed three primary environmental sensors: 1. TES-1365 Temperature (0.1 °C resolution, ±0.4 °C accuracy, 3 s sampling interval); 2. HOBO UX100-003 data logger; 3. HOBO U23 Pro v2.0 temperature/humidity recorder. Spatial referencing was achieved through a Garmin GPS eTrex 10 receiver configured for 1 s epoch data collection, ensuring sub-meter georeferencing accuracy through real-time kinematic positioning. Concurrent route navigation was managed via the “Two-step Road” mobile application, while situational awareness documentation included timestamped photographic records of sky conditions and transient events (e.g., passing water trucks, traffic anomalies) captured via smartphone devices. This multimodal data collection framework enables rigorous traceability analysis and systematic processing of anomalous datasets through cross-referenced spatiotemporal metadata.
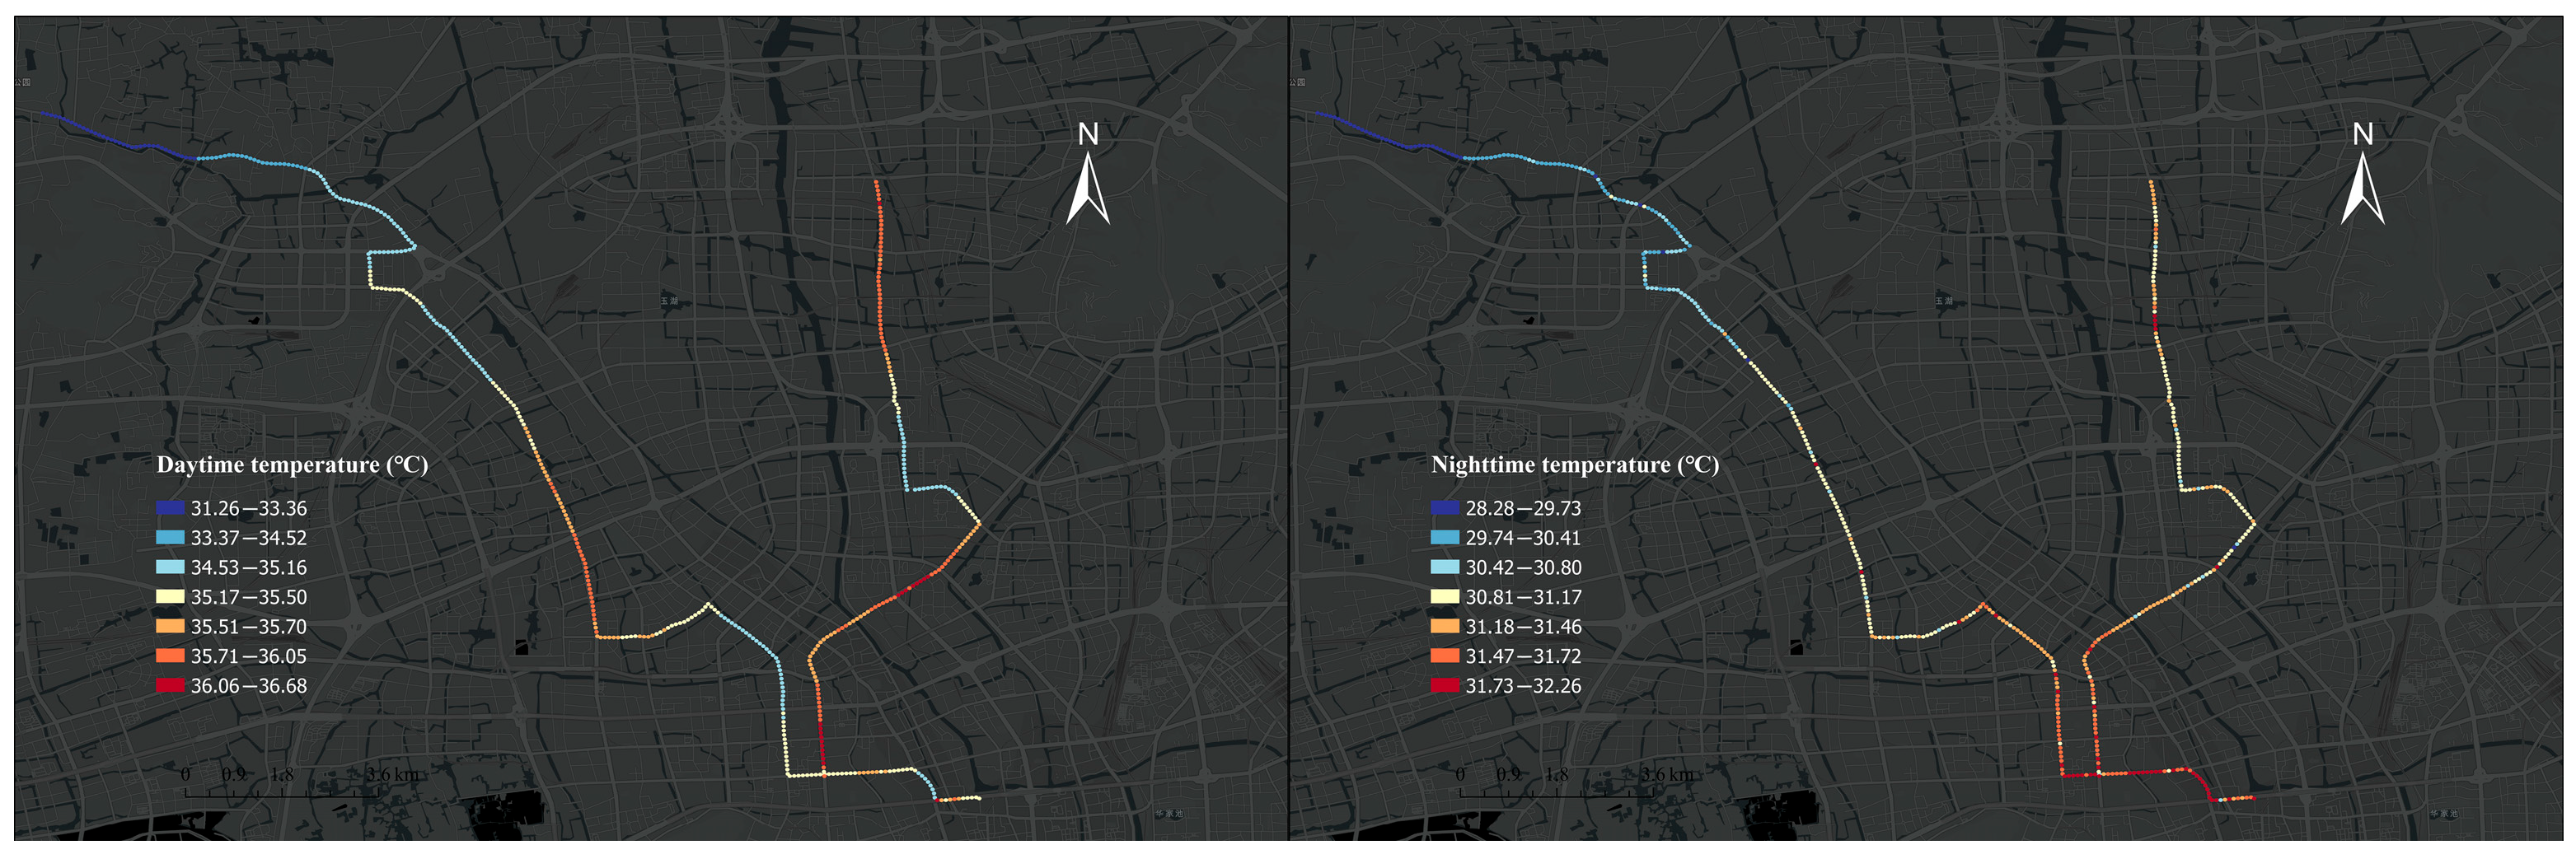
To investigate the spatio-temporal differentiation patterns of urban street thermal environments, this study established two distinct observation windows: 14:00–15:00 (daytime) and 23:00–24:00 (nighttime). Mobile measurements were conducted at a constant vehicle speed of 30 km/h, with each 90 min sampling campaign designed to minimize temporal variability effects. Data collection occurred in August and September 2023, comprising five daytime and five nighttime surveys to ensure comprehensive environmental characterization. All mobile measurements were systematically carried out under strictly controlled meteorological conditions. The selected measurement days were clear and cloudless (cloud cover < 10%) with wind speeds below 2 m per second to ensure the comparability of the temperature measurement results.
2.4. Street Temperature Modeling Framework
A stratified random sampling approach was employed to partition the acquired dataset into a training subset (70%) and a validation subset (30%). Through stepwise regression analysis, seven predictive variables were selected: Sky View Factor (SVF), Tree View Factor (TVF), Building Volume Fraction (BVF), Green View Index (GVI), Building Height (BH), Aspect Ratio (AR), and Surface Water coverage (SW). Separate daytime and nighttime air temperature (Ta) prediction models were subsequently developed. The training subset was utilized for coefficient optimization, while the validation subset served to evaluate model performance metrics. This two-stage methodology enables the establishment of quantifiable relationships between urban morphological characteristics and microclimatic thermal conditions.
To enhance model robustness and predictive accuracy, a Bootstrap sampling technique was implemented for inverse sampling of the mobile measurement dataset. A comprehensive training set was constructed through 1000 iterations of inverse sampling operations, effectively mitigating the influence of measurement errors associated with specific traversal routes. The simulation results demonstrated a standard deviation of R2 values below 0.03, substantiating the model’s stability. This approach reduces model dependency on specific datasets while improving generalization capabilities. The Random Forest Regressor algorithm from the Scikit-learn library was employed for temperature prediction. During data preprocessing, missing values in the raw dataset were appropriately addressed, followed by essential feature standardization procedures.
Model performance evaluation was conducted using a self-sampling approach for training set construction, with model stability assessed through 5-fold cross-validation. This cross-validation methodology partitions the dataset into five subsets, with four subsets utilized alternately for model training and the remaining subset for testing. This iterative validation process ensures comprehensive performance verification, minimizing partitioning biases and yielding more reliable evaluation outcomes. Model performance was quantified using the coefficient of determination (R
2) and root mean square error (RMSE) metrics. The daytime temperature prediction model achieved R
2 = 0.57 with RMSE = 0.33 °C, while the nighttime model attained R
2 = 0.75 with RMSE = 0.42 °C. These results demonstrate superior predictive performance compared to alternative algorithms such as the Landsat TM 5 thermal infrared sensor (TIRS)-based Ts calculation method, which typically exhibits RMSE values ranging from 1 to 3 °C [
36]. For reference, the RMSE associated with the 10th band of Landsat 8 TIRS is reported to be within 1.5–5 °C [
37]. Notably, Liu (2021) achieved R
2 and RMSE values of 0.953 and 1.74 °C, respectively, using the MLR model [
38]. The proposed model therefore demonstrates relatively low error levels and maintains robust predictive capabilities across testing scenarios.
4. Discussion
4.1. Spatiotemporal Variability of GVI Impact on Ta
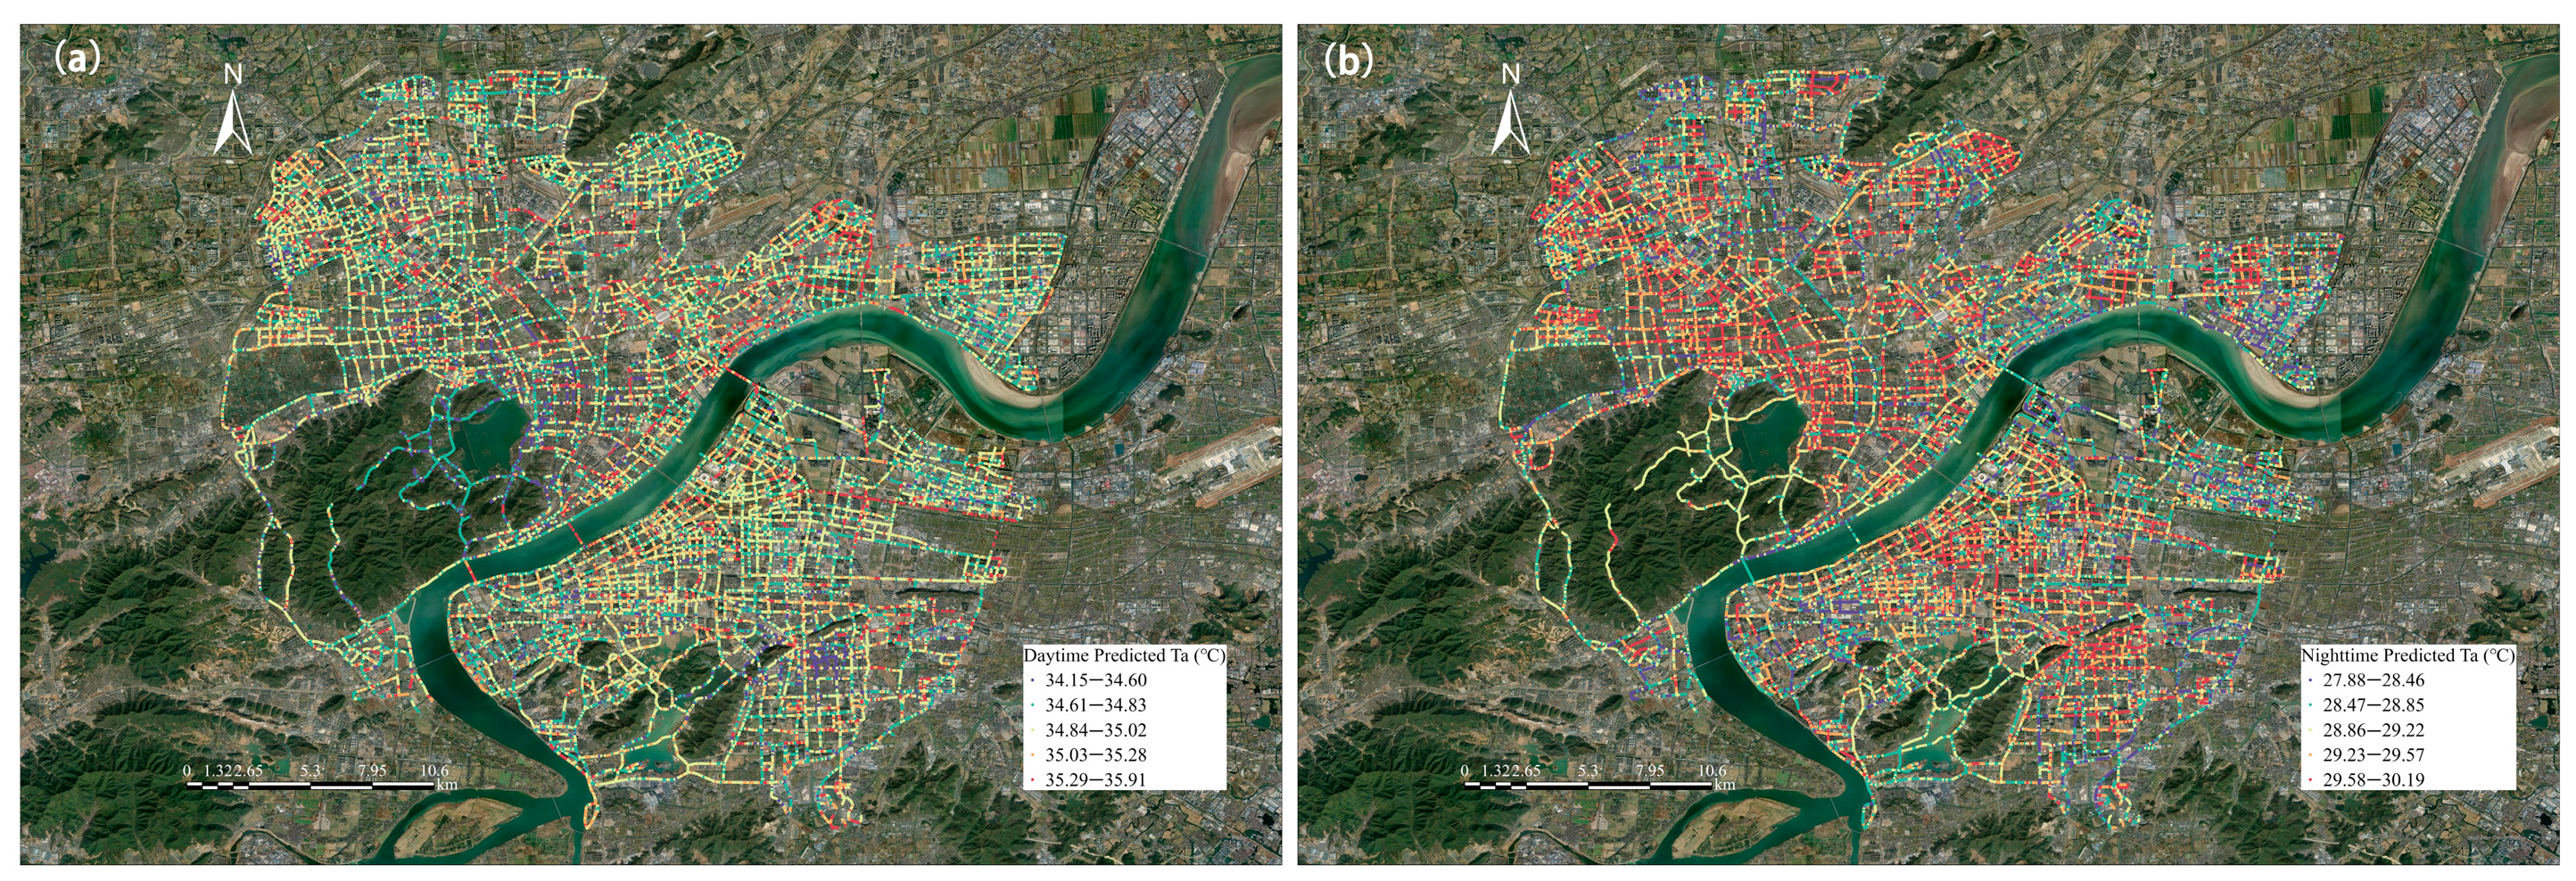
The UHI effect becomes particularly pronounced at night due to the low thermal capacity of urban surfaces. During daytime, these surfaces absorb substantial solar radiation, releasing stored heat after sunset and elevating nocturnal temperatures. Building clusters obstruct longwave radiative cooling while synergizing with vehicular emissions, creating significantly higher temperatures in UHI cores compared to suburban areas. As illustrated in the figure, the Qian Tang River and its riparian zones exhibit relatively lower temperatures, attributable to the high specific heat capacity of water bodies modulating ambient temperatures. Urban green spaces and parks also contribute to localized cooling by providing microclimatic refugia. Elevated temperatures along major roadways arise from combined effects of vehicle emissions and high thermal conductivity of pavement materials. Slow nocturnal heat dissipation in traffic-intensive zones sustains elevated temperatures across multiple blocks, potentially triggering extended UHI phenomena. This not only degrades residential quality of life, especially for elderly populations, but also amplifies heat-related morbidity risks, exacerbating dual burdens on public health and urban energy systems.
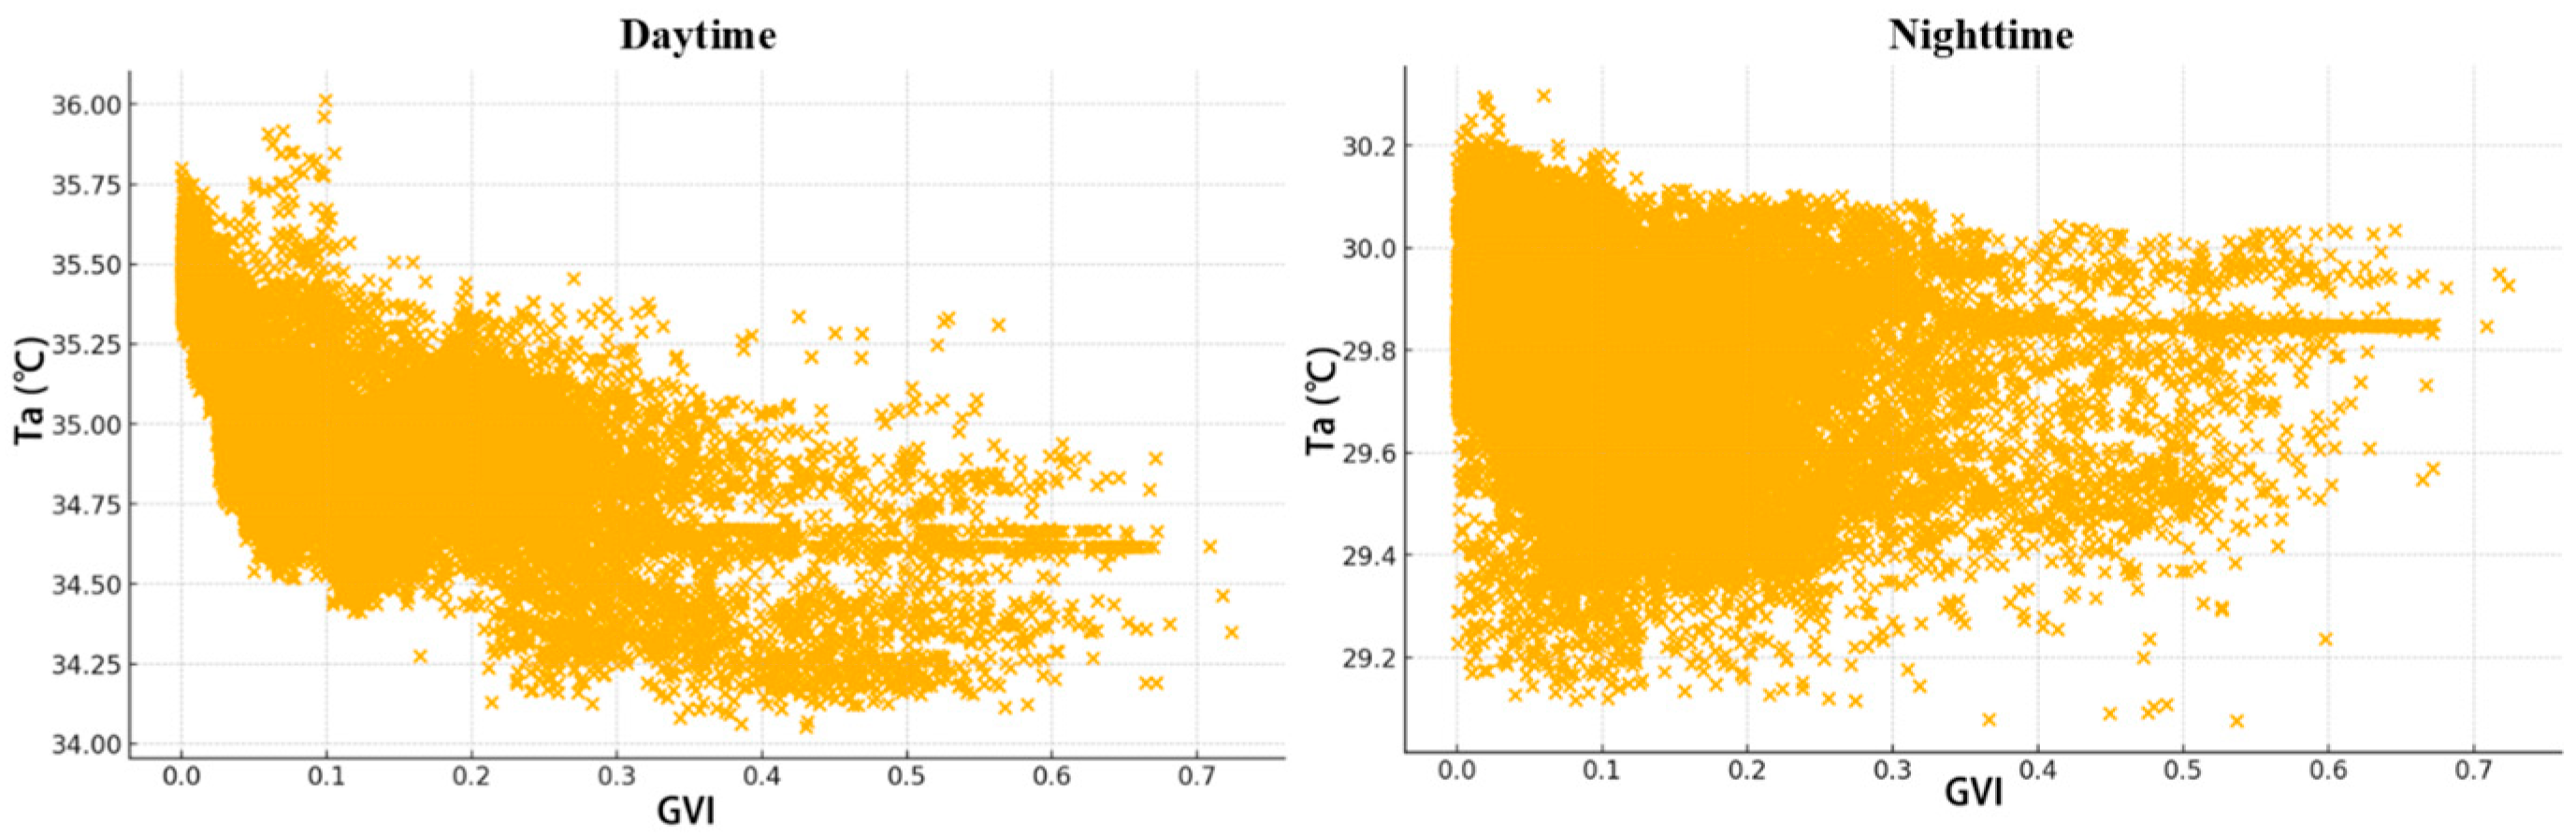
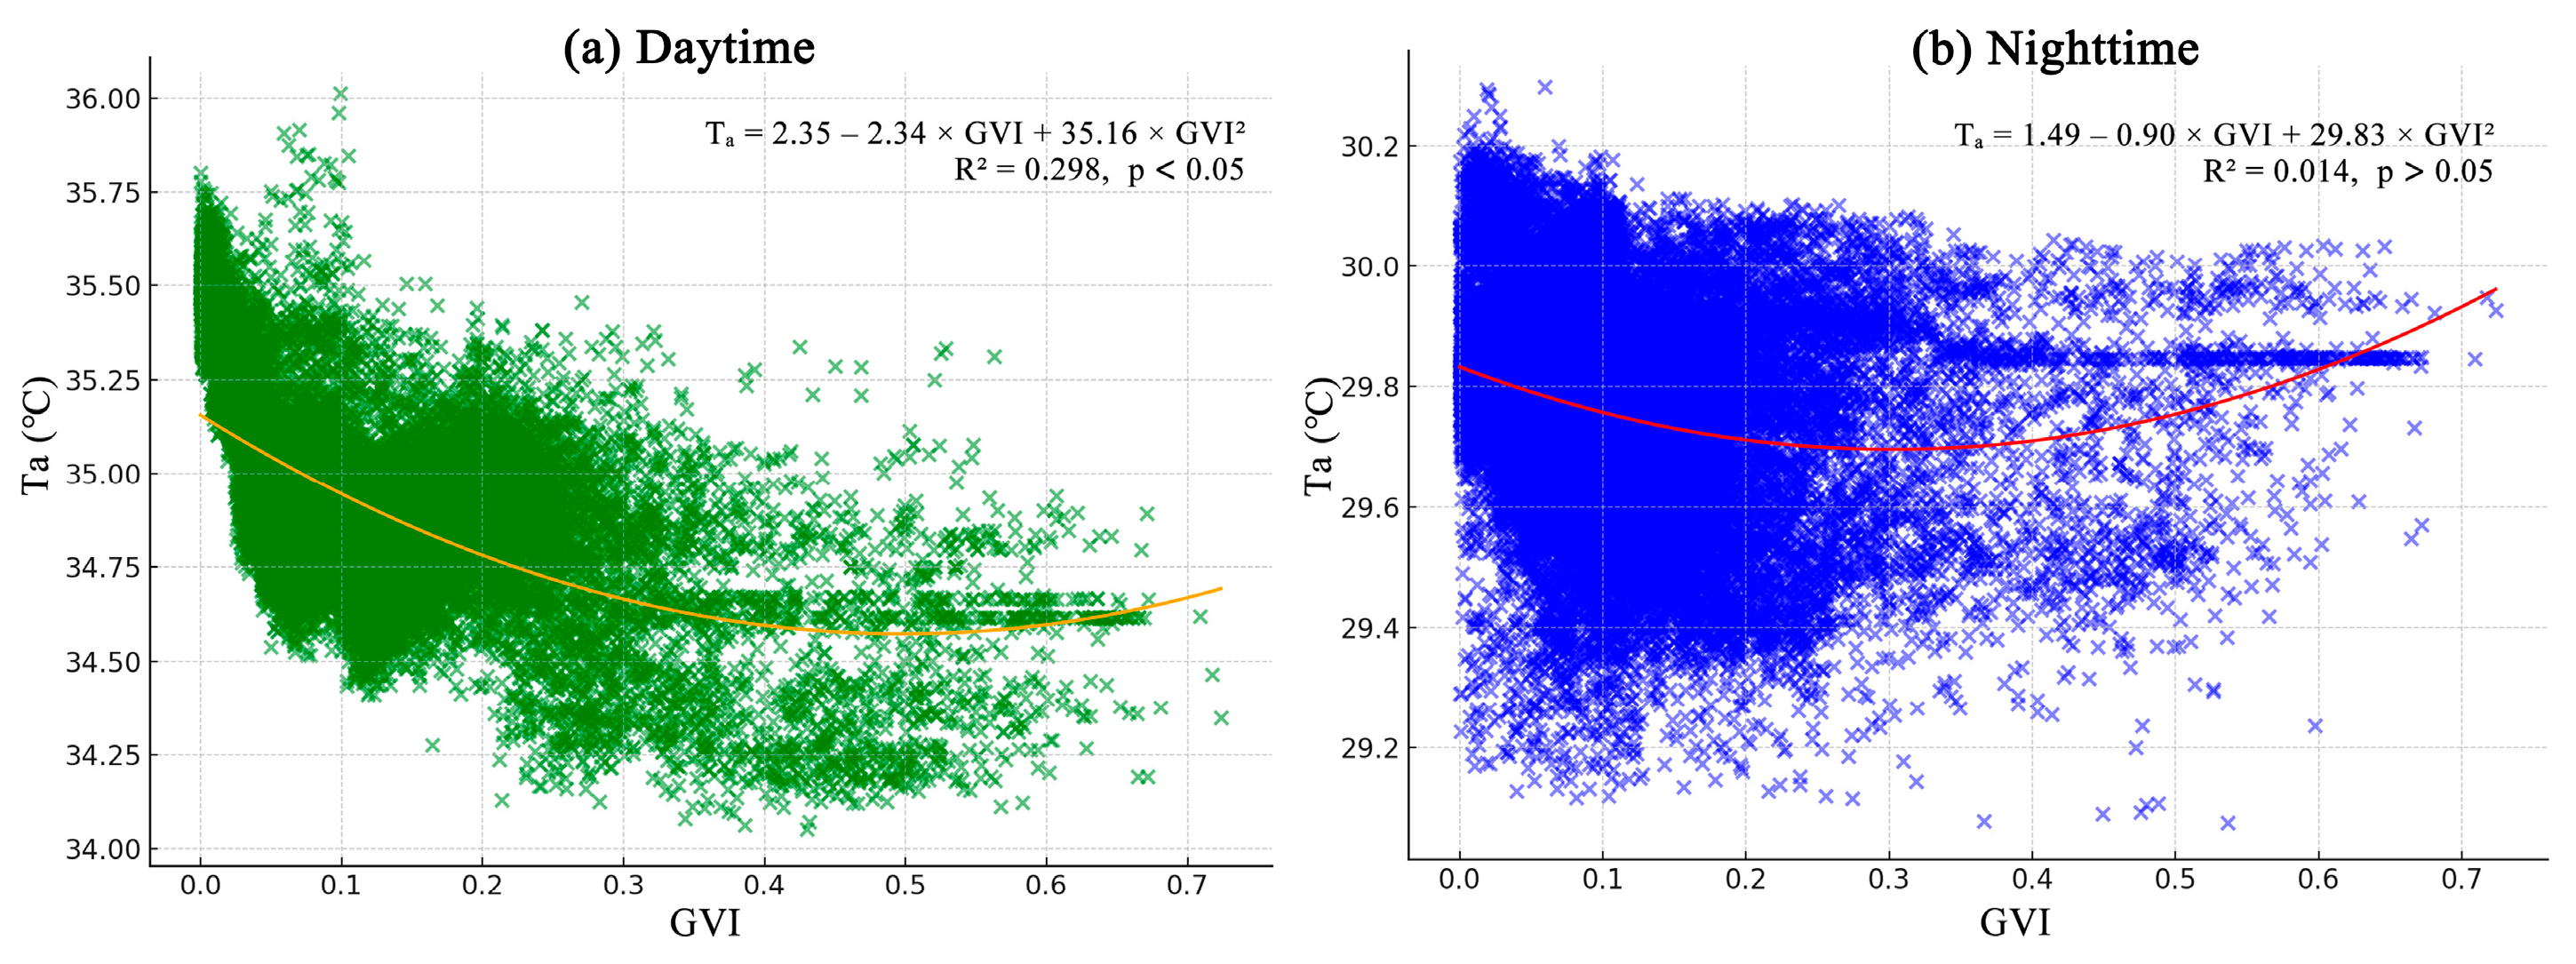
Diurnal cooling mechanisms differ significantly. Under intense solar irradiance, vegetation mitigates air temperatures through transpiration and shading effects. Our model shows that for every 0.1 GVI unit increase, Ta decreases by 0.171 °C during the day. During peak exposure periods (14:00–16:00), north–south oriented streets with ≥70% sunlit area coverage should prioritize planting tall trees with dense canopies to form continuous shade corridors (≥60% canopy projection coverage). Integrating climbing vegetation on building facades can further reduce surface temperatures. Nocturnal UHI dynamics are primarily governed by building thermal inertia and anthropogenic heat sources (transportation, air conditioning), with diminished GVI cooling efficacy. Existing research demonstrates that street vegetation significantly reduces daytime Ta through shading and evapotranspiration processes. For instance, Wei et al. (2025) identified a significant negative correlation between GVI and land surface temperature (LST), observing approximately 0.774 °C LST reduction per 0.1 GVI increment [
42]. Normalized Difference Vegetation Index (NDVI) exhibits a negative correlation with Ta (r = −0.31), indicating its positive cooling influence. Each 1% increase in panoramic green coverage corresponds to 0.21°C LST reduction, while a 0.007 NDVI increment also contributes to measurable LST decline [
43]. However, these studies have not addressed the regulatory effects of vegetation’s three-dimensional distribution on nocturnal thermal environments. The present research confirms the negative GVI-Ta correlation observed in prior studies [
44], with a 0.020 °C nocturnal temperature reduction per 0.1 GVI unit increment consistent with Oshio et al.’s (2021) leaf area index (LAI)-based finding. Their work highlights leaf area density (LAD) and SVF as critical determinants of nocturnal cooling efficacy, where increased LAD amplifies negative sensible heat flux values, indicating enhanced environmental heat removal and stronger cooling effects [
45]. This contrasts with observations that daytime LAI increases reduce LST while potentially elevating nighttime temperatures [
46], a discrepancy potentially attributable to 3D GVI’s capture of vertical vegetation structure effects on longwave radiation blocking (e.g., canopy density variations), whereas traditional 2D metrics only reflect horizontal projection information.
In low-GVI areas (GVI < 15%), strategies should include: (1) installing light-colored permeable pavements or cool roofs to minimize heat storage; (2) incorporating subsurface gravel-water layers for enhanced evaporative cooling; (3) identifying UHI cores via Local Climate Zone (LCZ) classification to optimize ventilation corridors through demolition of obstructive structures or adopting permeable fencing; (4) strengthening heat source management in high-density commercial districts through temperature-limited inverter air conditioning systems; (5) promoting electric public transit at night to reduce private vehicle usage; (6) retrofitting industrial zones with waste heat recovery systems and exhaust temperature controls.
Our findings reveal a distinct diurnal-nocturnal dichotomy in vegetation’s thermal regulation efficacy, necessitating time-differentiated strategies for thermal environment management. Specifically, daytime cooling can be effectively achieved through GVI enhancement, while nocturnal interventions should prioritize supplementary measures such as optimizing building material thermal inertia and designing ventilation corridors. This paradigm shift transcends conventional greenspace planning that overlooks temporal specificity, providing robust theoretical foundations for developing context-responsive thermal environment management frameworks.
4.2. Limitations and Future Research Directions
The present study employed mobile measurement methodologies to acquire street-level thermal data and leveraged semantic segmentation algorithms to extract three-dimensional morphological parameters. However, several limitations pertaining to spatiotemporal data acquisition warrant acknowledgment. This study’s data collection relied on diurnal sampling across five consecutive clear-sky days during late summer, consequently limiting the exploration of ecological seasonality and seasonal variations. Future work should extend these investigations to encompass diverse seasons (e.g., winter, spring) and critical phenological phases (e.g., vegetation dormancy periods). Future research should prioritize multi-temporal data fusion by incorporating four-season streetscape imagery and vegetation phenology records to develop a dynamic GVI model, thereby enhancing year-round thermal environment prediction accuracy. The GVI extraction methodology based on Baidu Street View imagery in this study exhibits inherent systematic biases. Firstly, the seasonal imbalance in street-level image acquisition (primarily collected between May-September) may result in overestimation of deciduous vegetation’s annual shading efficacy. Secondly, the fixed-angle street-view imagery acquisition mode tends to cause omissions in vertical greenery detection while inflating street tree canopy coverage estimates. This view-dependent distortion compromises the extraction accuracy of morphological parameters describing street-level three-dimensional geometric configurations, potentially introducing measurement uncertainties. Future research should integrate multi-temporal satellite imagery with ground-based mobile monitoring datasets to develop spatiotemporal calibration models, thereby mitigating the inherent limitations of street-view data heterogeneity.
While the random forest model enabled quantification of factor contributions, it provided limited insight into the interactive mechanisms between GVI and street morphology parameters (e.g., aspect ratio, orientation). The study’s empirical framework primarily focused on statistical correlations rather than dynamic simulations of vegetation transpiration processes and building thermal inertia effects. Notably, anthropogenic heat emissions and traffic density heterogeneity have been identified as critical drivers of nocturnal urban heat island (UHI) formation. However, operational implementation of these parameters faces methodological barriers due to challenges in acquiring high-resolution temporal-spatial datasets. This data limitation may introduce systematic biases in simulations of urban thermal environment dynamics, particularly in high-heat-load zones such as commercial centers and transportation hubs. To address these challenges, we recommend developing spatially explicit anthropogenic heat inventories through multi-source data fusion techniques. Integration of hyperspectral remote sensing platforms, vehicle-borne mobile LiDAR systems, and smart grid electricity consumption records would substantially enhance both mechanistic understanding and predictive accuracy of UHI simulations across heterogeneous urban landscapes.
Despite achieving an overall accuracy of 79%, the LCZ classification model employed in this study exhibits certain limitations in street-level thermal environment analysis. Classification errors may lead to measurement routes not fully capturing the thermal characteristics of target LCZs, thereby introducing biases in model-simulated temperature outputs. Additionally, misclassified GVI and temperature data could potentially compromise the accuracy of correlation conclusions.
Advanced modeling frameworks like ENVI-met V5.7 or UTCI should be integrated in subsequent studies to quantify green shading and transpiration effects on sensible/latent heat fluxes, thereby unraveling GVI’s cooling pathways through physical process simulation. Such advancements would significantly enhance our mechanistic understanding of urban thermal dynamics while informing more nuanced climate-responsive design strategies.
5. Conclusions
This study takes the main urban area of Hangzhou as the research object and systematically explores the mechanism of street GVI on urban thermal environment and its improvement strategies from a human-oriented perspective. Against the backdrop of urban thermal environment deterioration during urbanization, we clarify the critical role of street greening in microclimate regulation. By reviewing domestic and international research progress on the relationships between GVI, street morphology, and thermal environment, we propose to quantify the dynamic relationship between GVI and thermal environment, providing scientific evidence for human-centered green urban design.
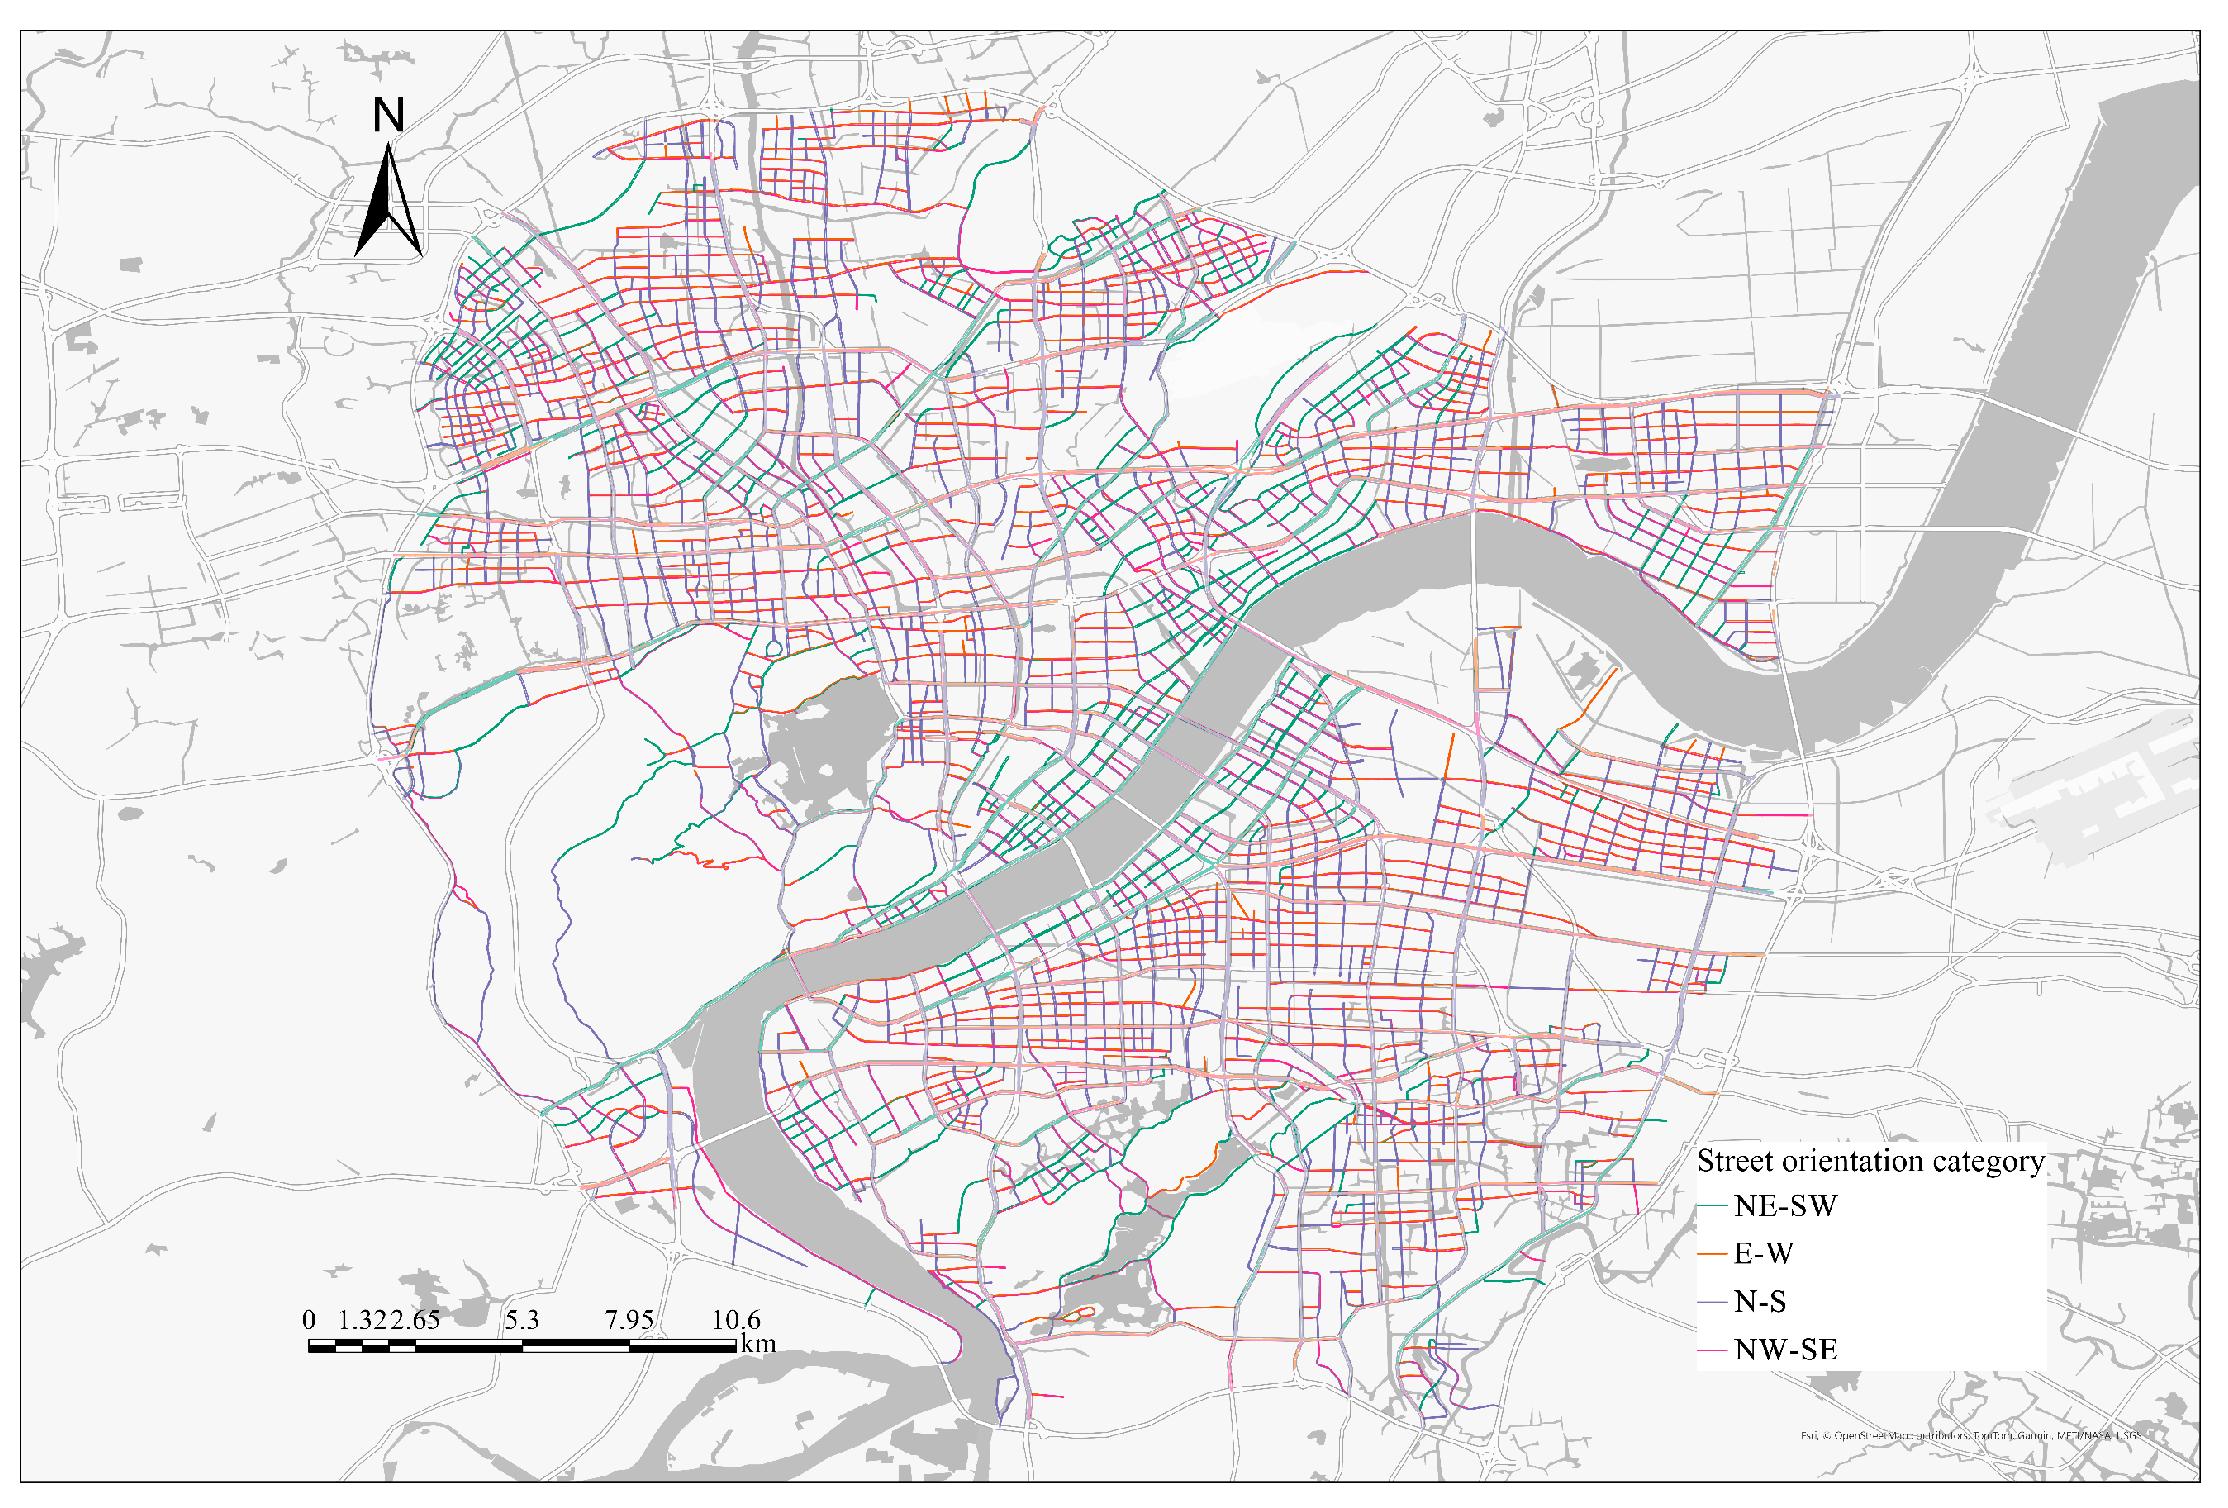
The study adopts a multi-source data fusion approach. Through 3D morphological data collection (including road networks, building height-to-width ratios, street orientations), WUDAPT Local Climate Zone classification, and mobile measurement of street microclimate parameters (temperature, humidity), combined with machine learning models (Random Forest), we constructed a thermal environment prediction model to reveal spatio-temporal differentiation patterns of street thermal environment. Furthermore, using street view imagery and machine learning techniques, we extracted GVI data to analyze its spatial distribution characteristics and cold/hot spot patterns. Based on multiple regression models, we explored the differential impacts of GVI on thermal environment under varying time periods, street orientations, height-to-width ratios, and urban–rural gradients. Key findings are as follows:
(1) GVI’s regulatory effect on thermal environment shows significant spatio-temporal heterogeneity. Its cooling effect is significantly stronger during daytime (14:00–15:00) than nighttime (23:00–24:00). At night, the correlation weakens significantly (r = −0.12, p > 0.05), with cooling efficiency reduced to 29.2% of daytime values. Vegetation transpiration and shading dominate daytime cooling in summer, while nighttime urban heat island effect, driven by building thermal inertia and anthropogenic heat sources, diminishes GVI’s regulatory role.
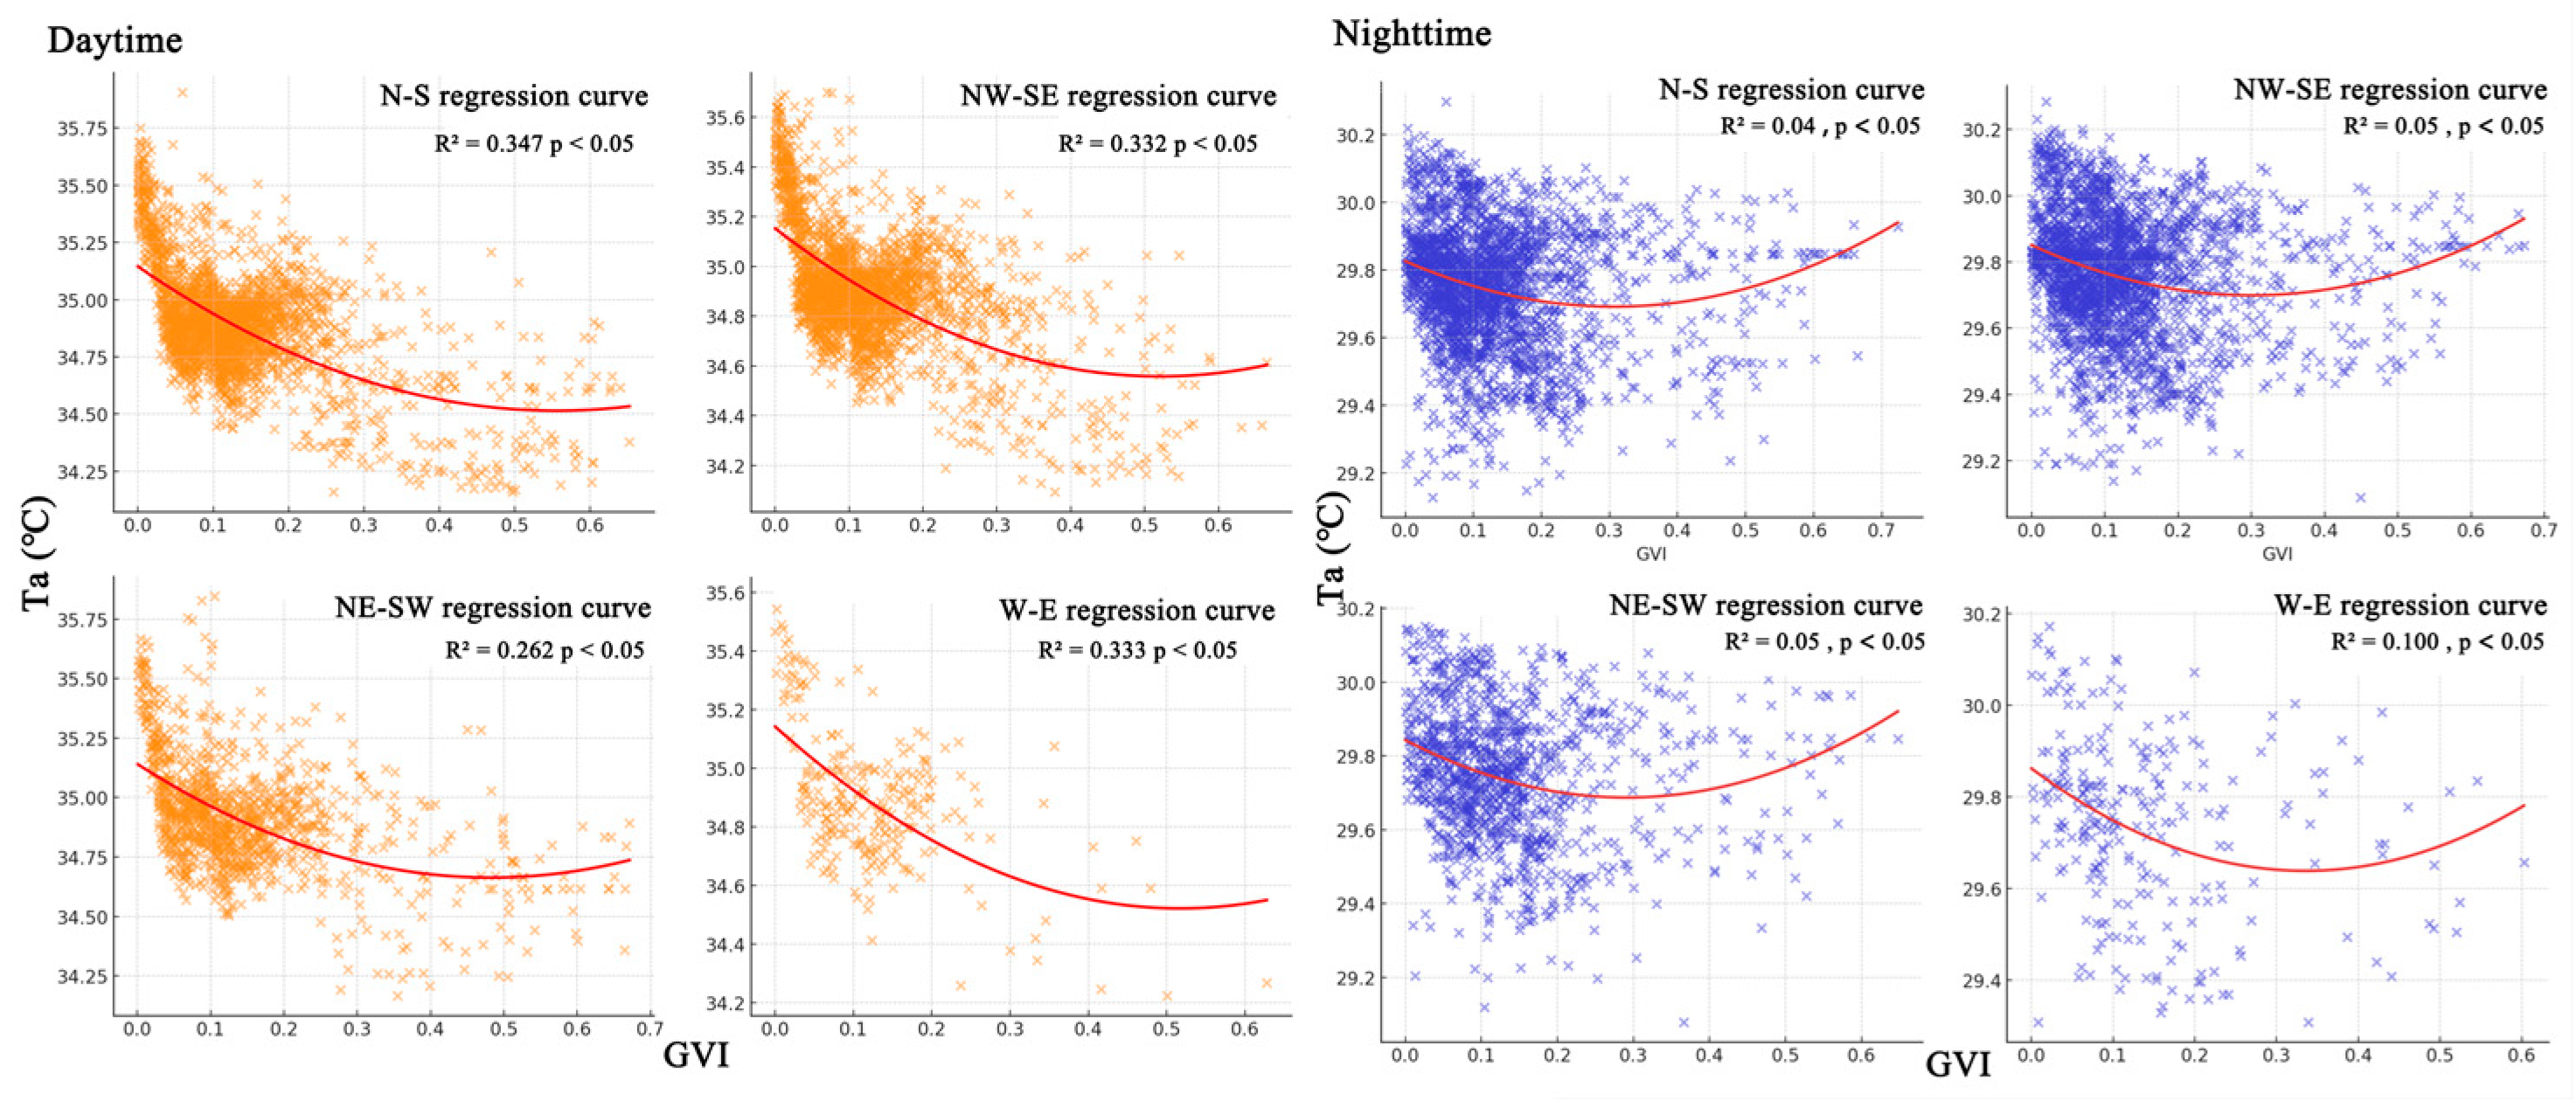
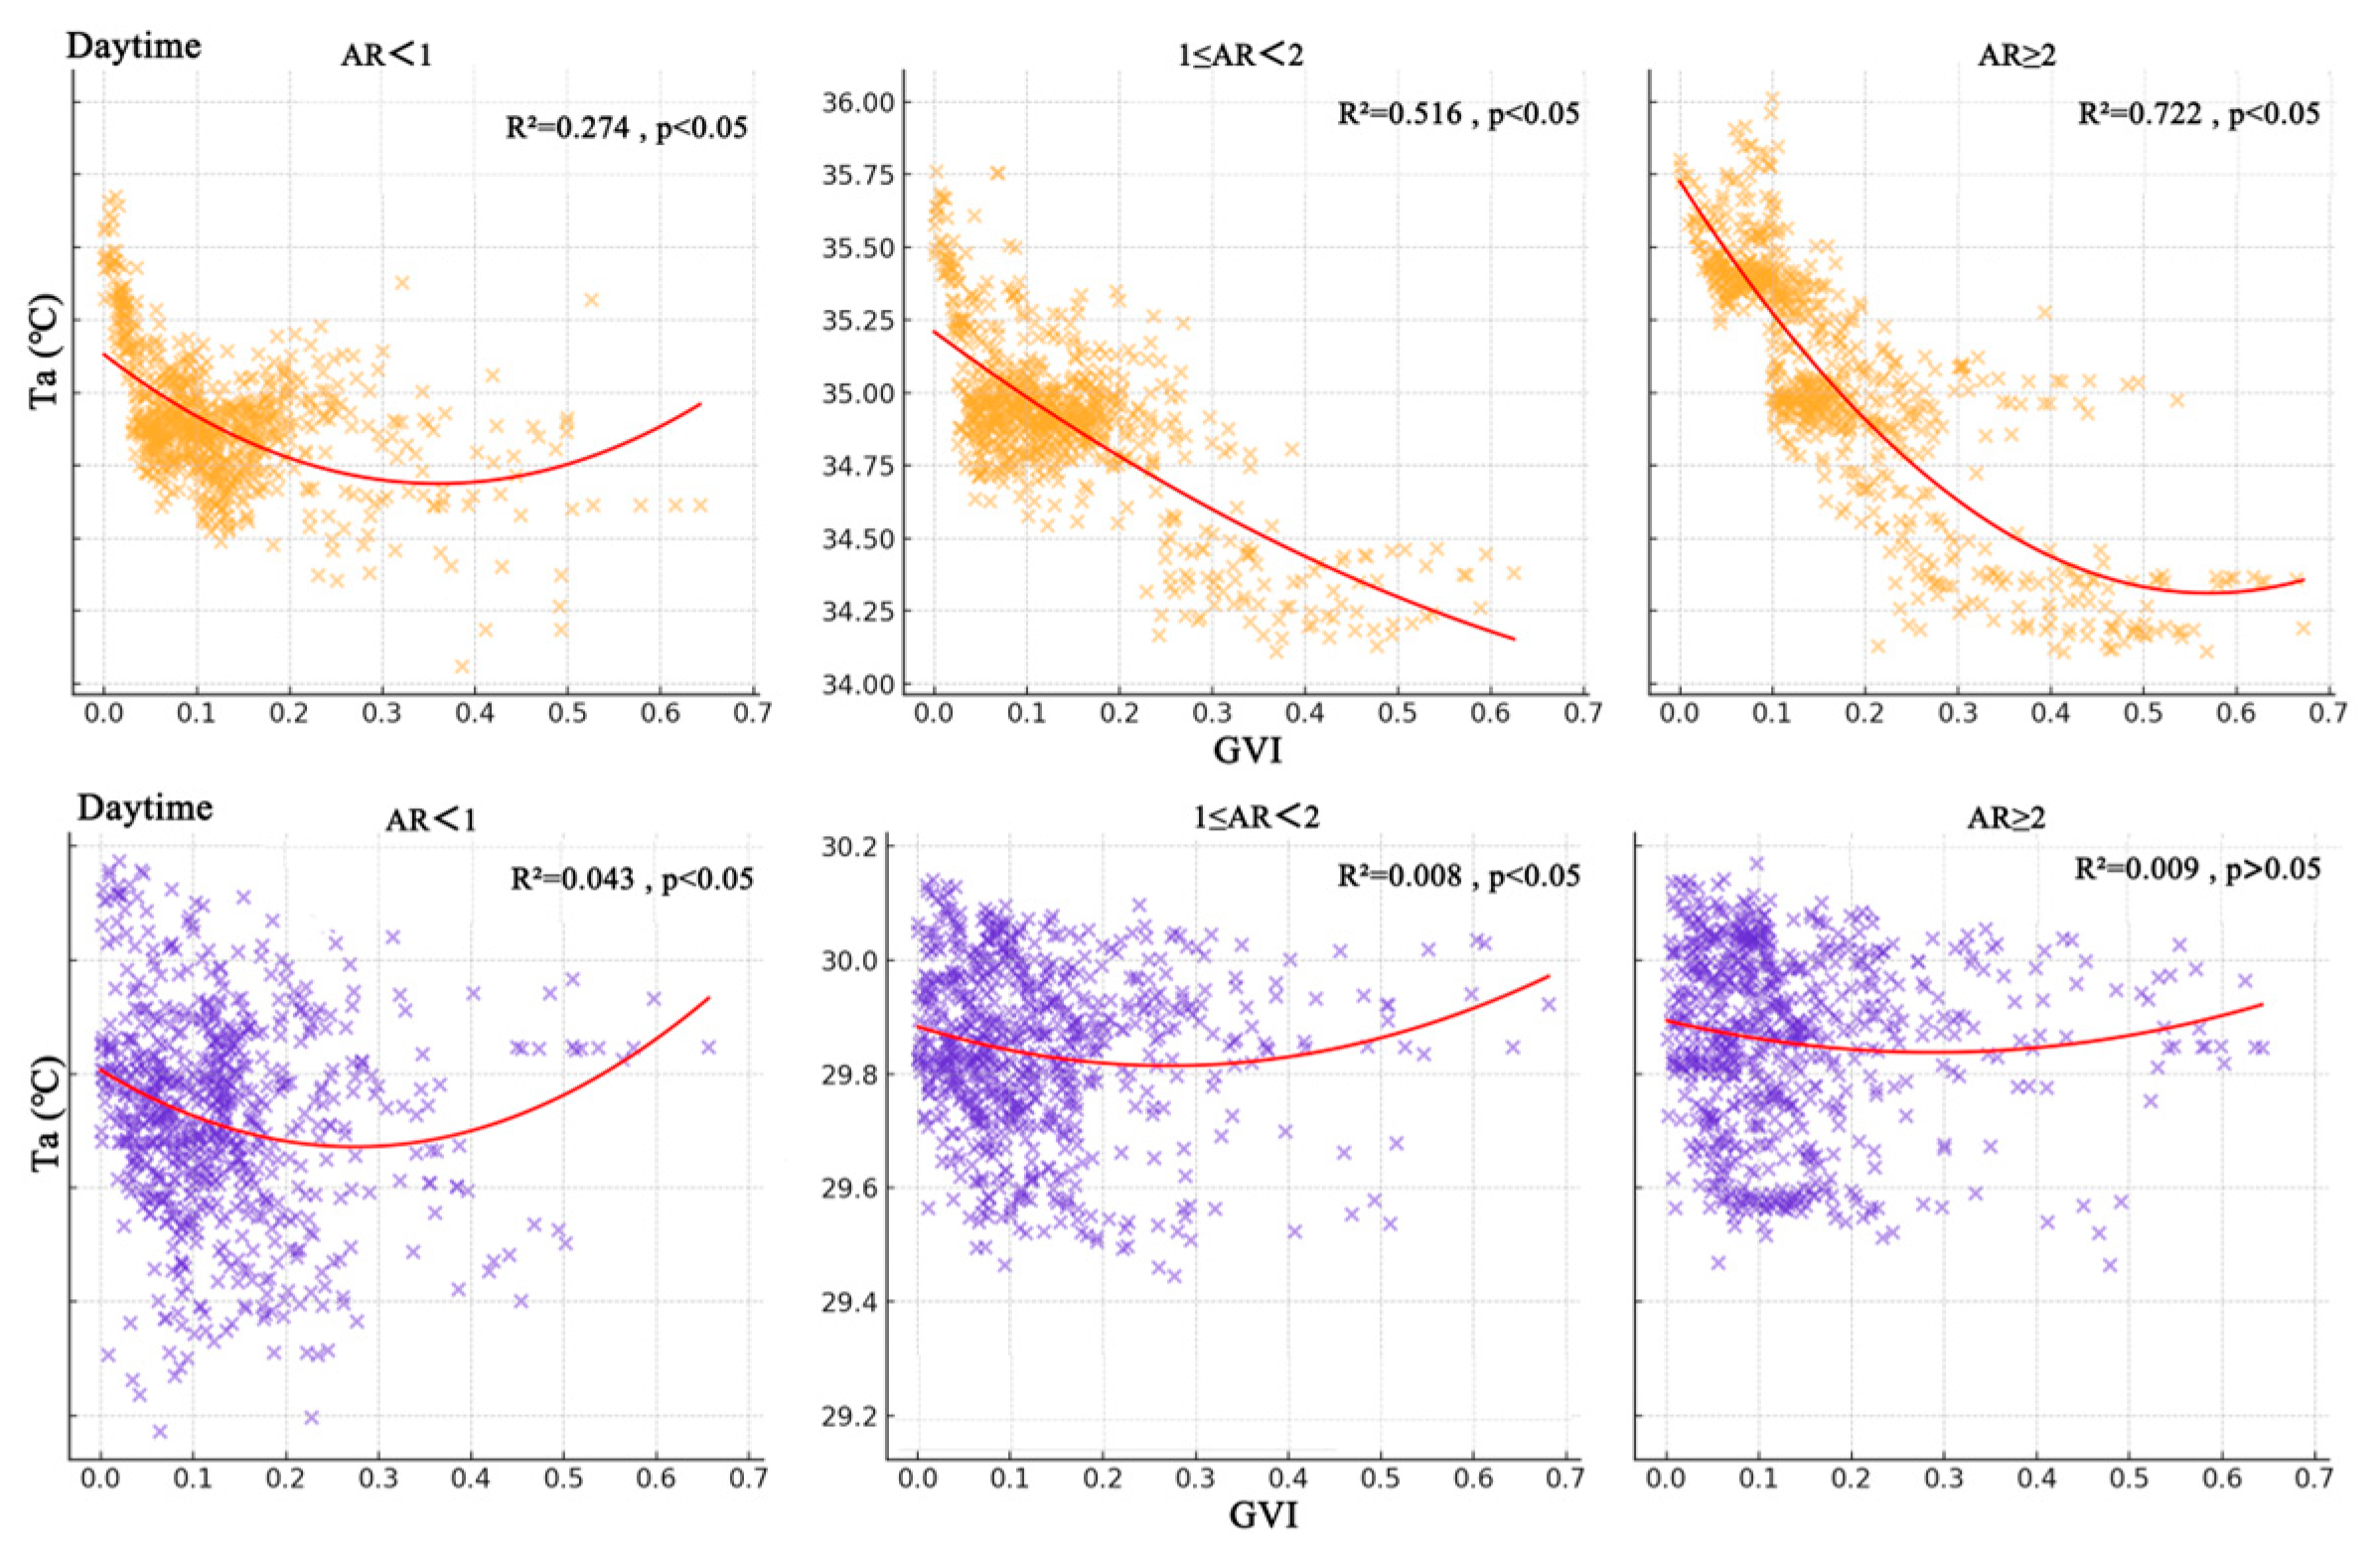
(2) Street morphological parameters significantly influence GVI’s cooling efficacy. North–south oriented streets show the strongest explanatory power of GVI on daytime temperature (R2 = 0.3474), followed by northwest–southeast (R2 = 0.3315) and east–west (R2 = 0.3325), with northeast–southwest streets having the weakest effect (R2 = 0.2618). At night, east–west streets exhibit the most significant GVI impact (R2 = 0.1003). During the daytime, high height-to-width ratio streets (H/W > 2) show the most pronounced GVI cooling (quadratic coefficient = 4.3487), possibly due to amplified transpiration in confined environments. Low H/W streets (H/W < 1) rank second (3.4224), while medium H/W streets (1 < H/W < 2) show weaker effects. At night, low H/W streets demonstrate optimal GVI cooling (R2 = 0.0399), while high H/W streets exhibit minimal regulation due to heat retention (R2 = 0.0526).
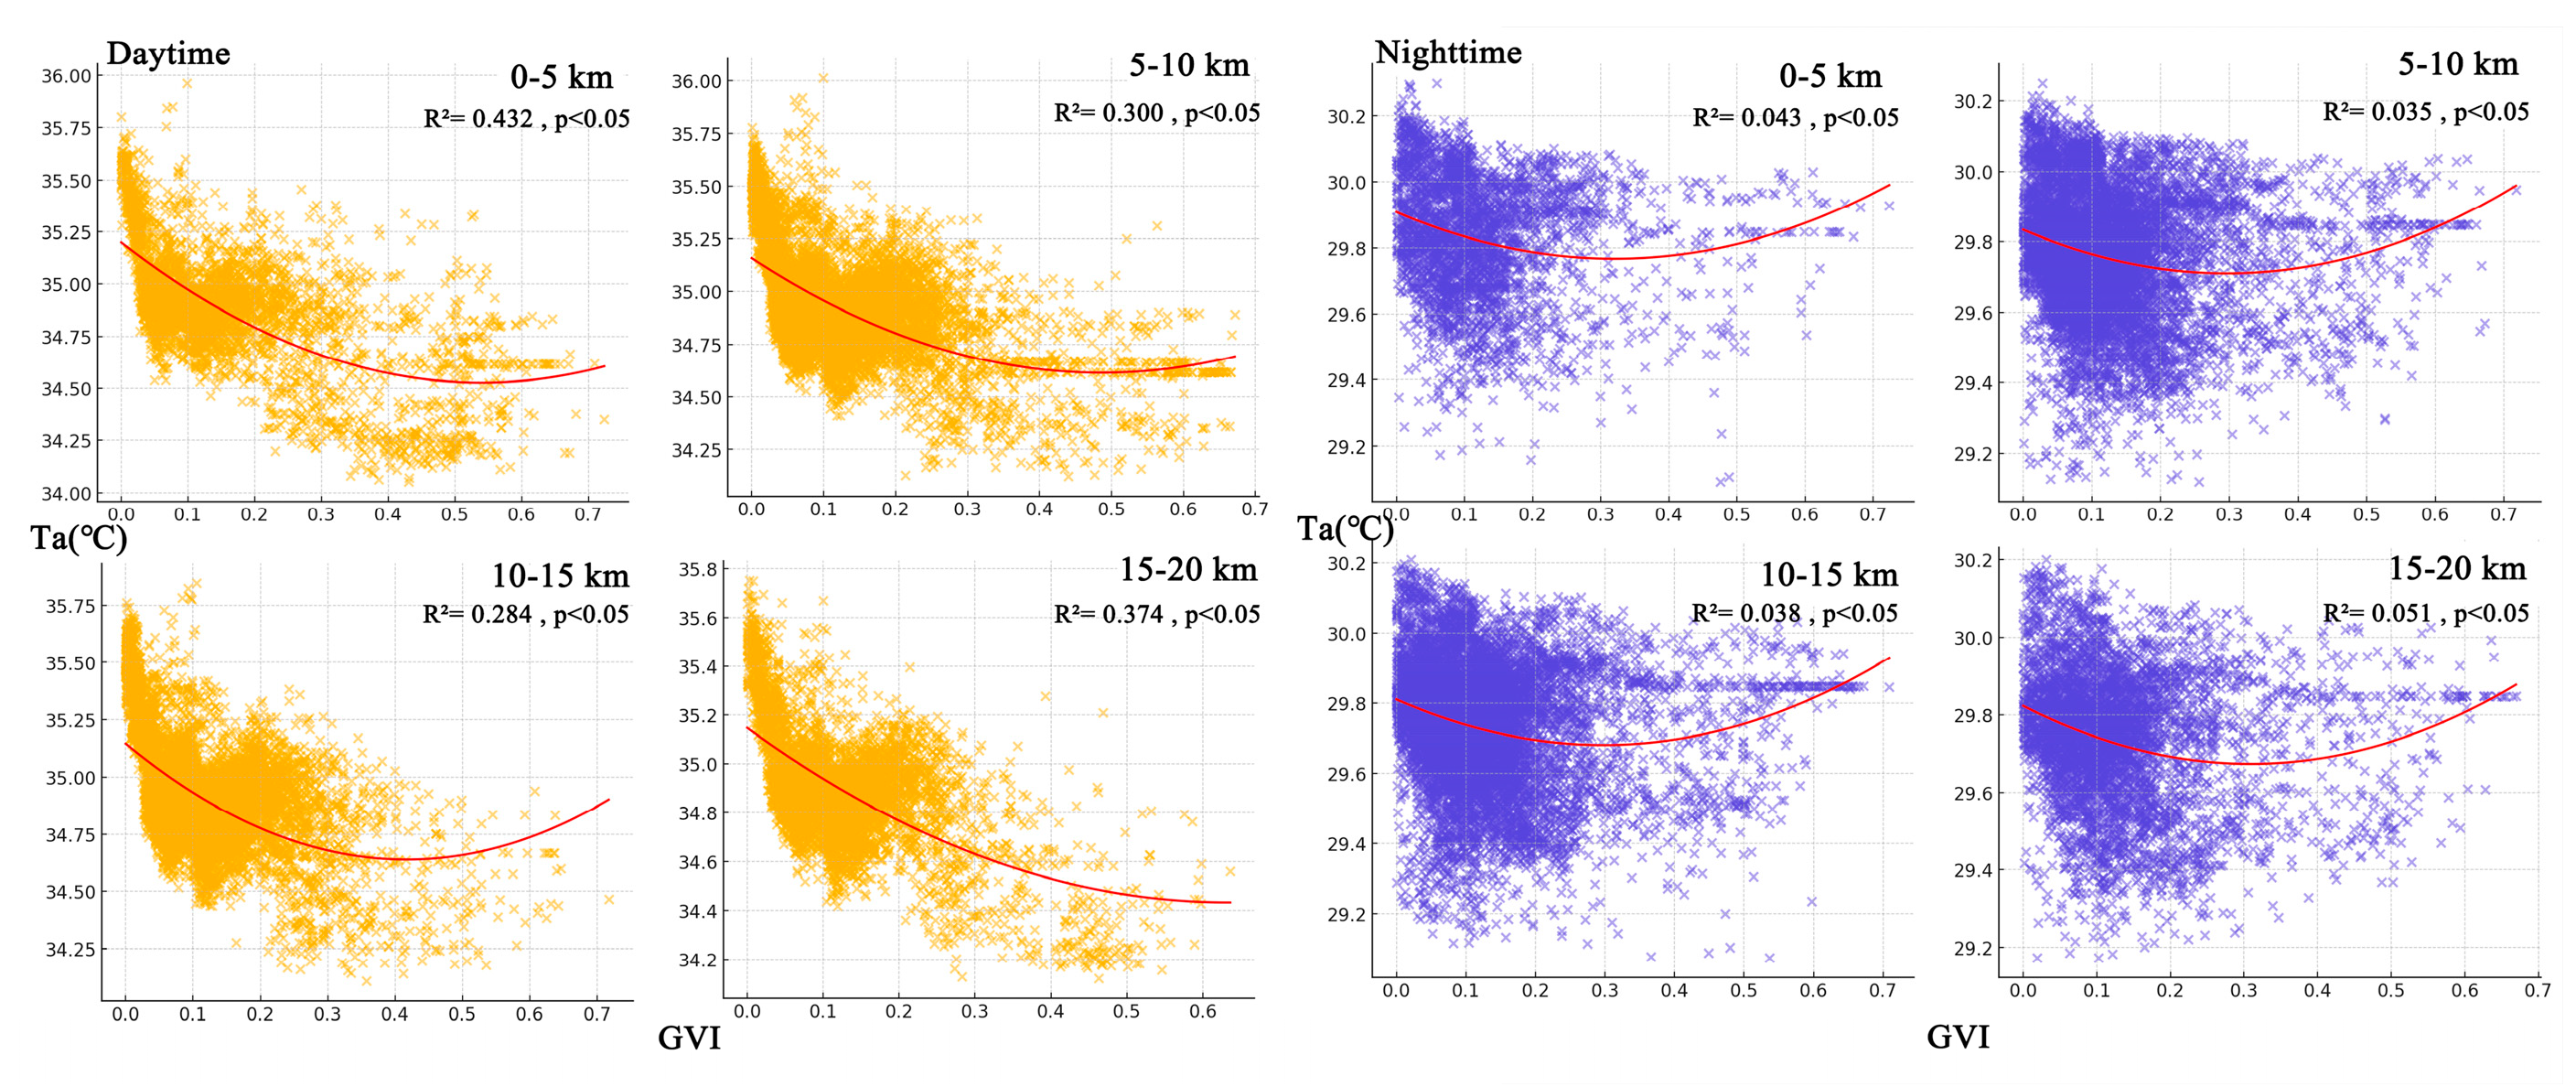
(3) GVI’s regulatory effect on urban temperature presents significant spatio-temporal heterogeneity and nonlinear characteristics. The 10–15 km gradient zone shows the most prominent daytime cooling, attributed to synergistic effects of moderate development intensity and function-oriented green space configuration. At night, the 15–20 km gradient zone exhibits enhanced vegetation cooling in exurban areas, relying on radiative cooling from intact vegetation patches and low anthropogenic disturbance. In the 0–5 km urban core, thermal regulation by GVI is significantly suppressed due to high-density building heat retention, street canyon effects, and hardened surfaces.
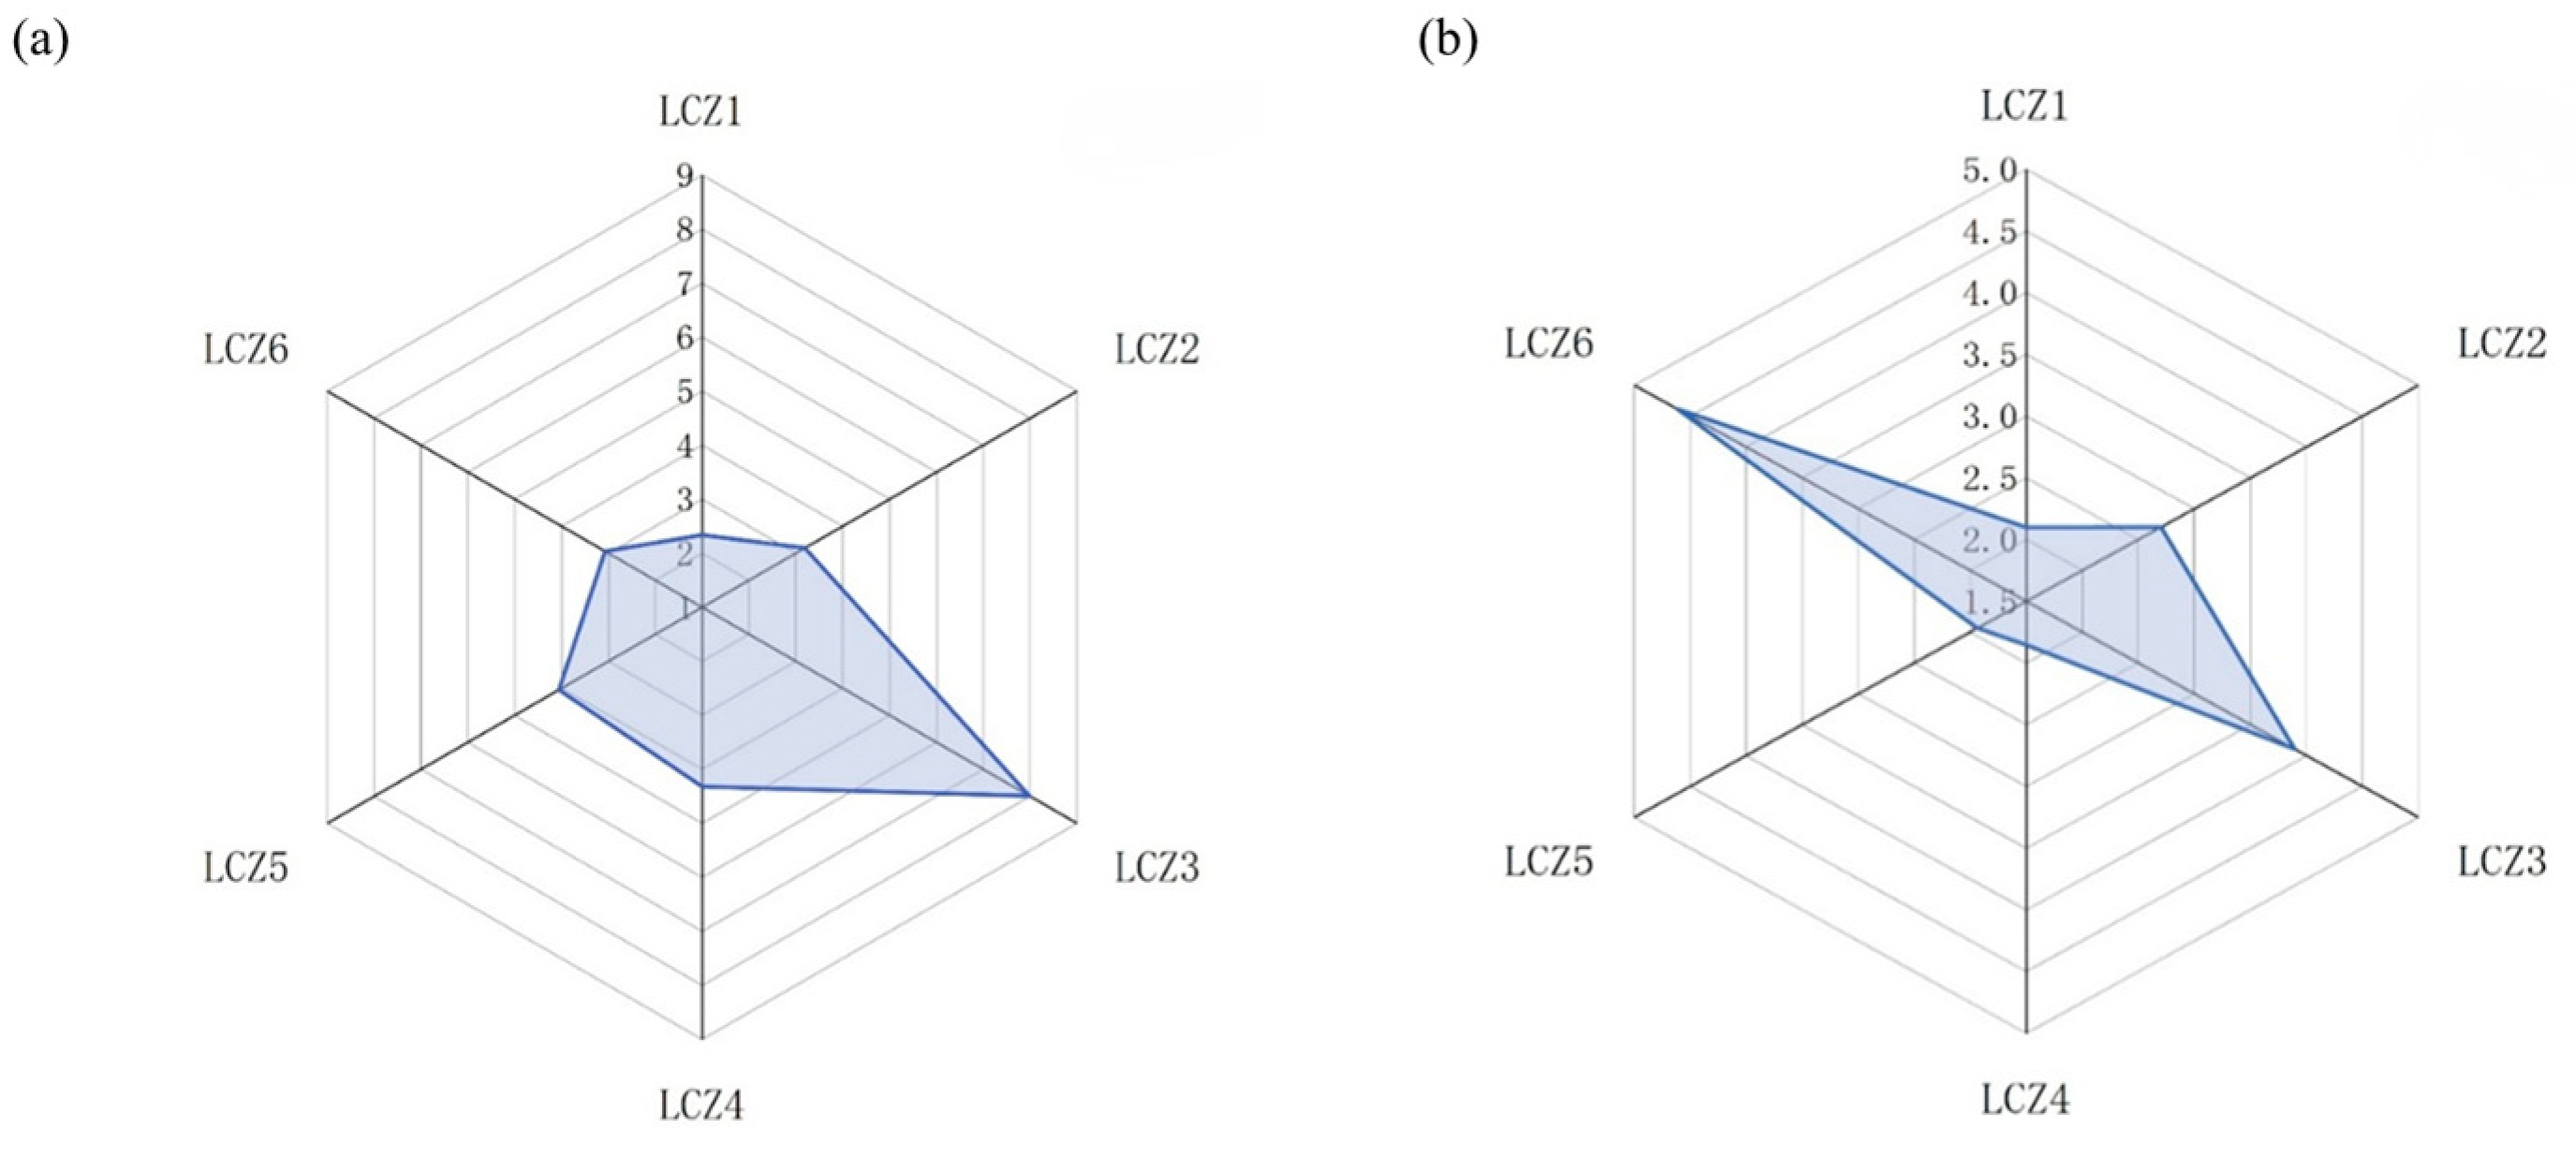
(4) Cooling intensity of GVI on air temperature varies significantly between LCZs: During daytime, LCZ3 (compact low-rise) demonstrates the strongest cooling due to synergistic effects of 3D green networks and shading, while LCZ1 (compact high-rise) performs weakest due to green space compression by high-density buildings. At night, LCZ6 (open low-rise) becomes the optimal cooling zone through rapid heat release from low-density permeable surfaces, whereas LCZ4 (sparse low-rise) shows the weakest cooling due to thermal inertia of hardened surfaces and sparse vegetation. Diurnal differences indicate that greening strategies must adapt to LCZ morphological characteristics.
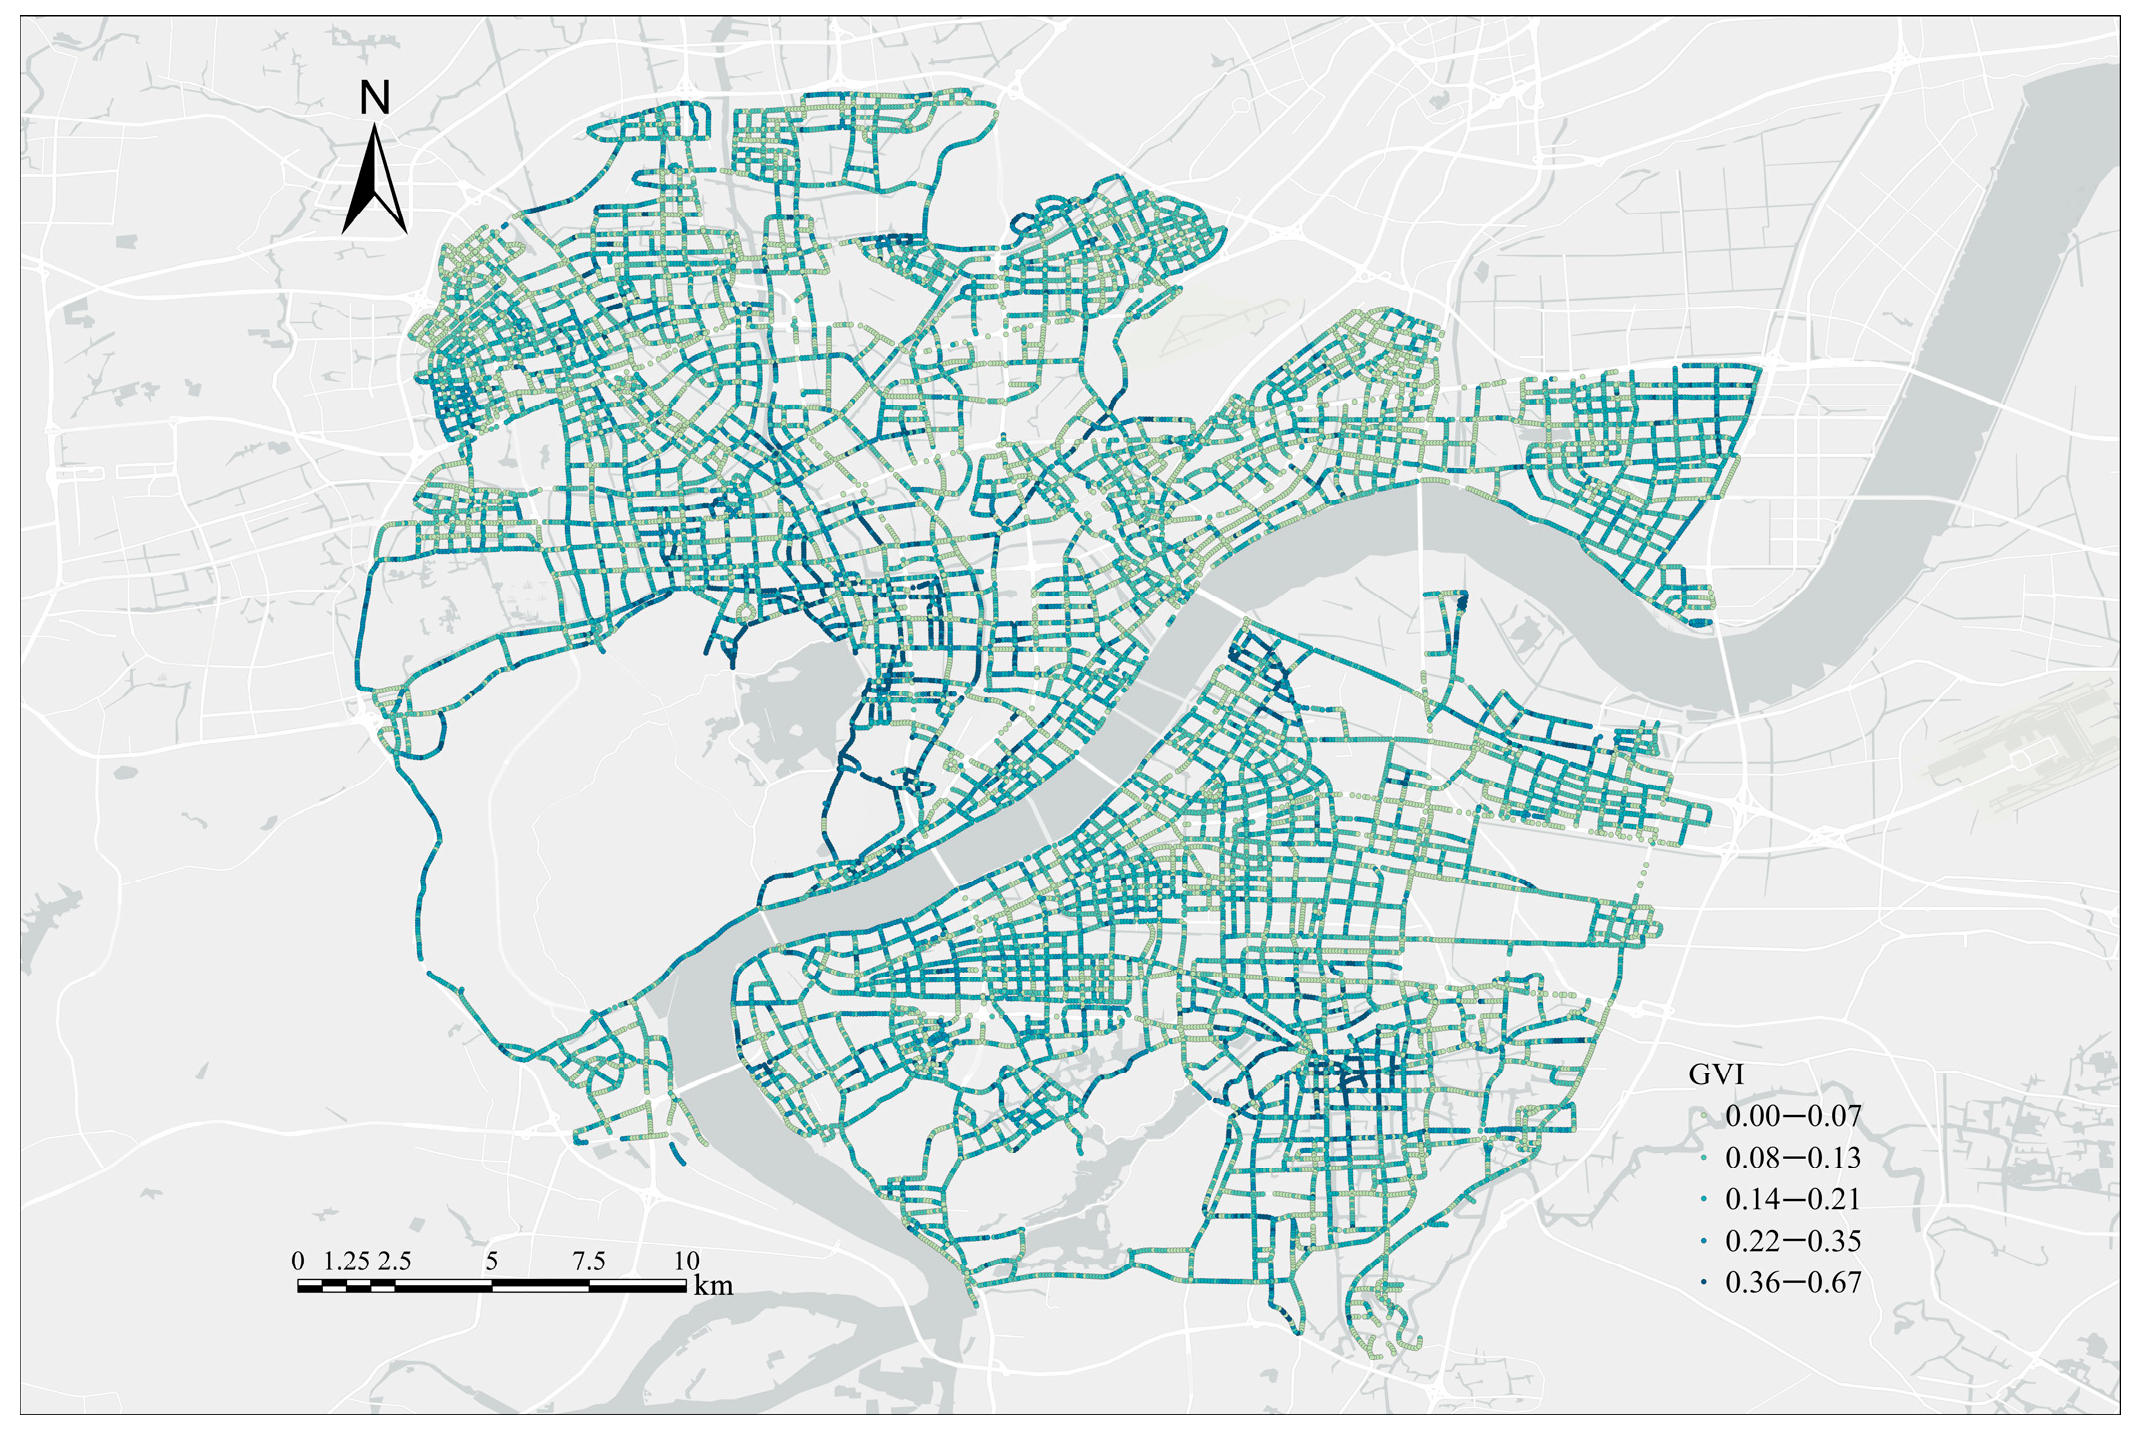
(5) The average GVI in Hangzhou’s main urban area is 0.133. Low-GVI areas (<15%) and high-GVI areas (≥35%) collectively account for 74.07%, highlighting severe spatial heterogeneity in green resource allocation. GVI hotspots concentrate around large green spaces like West Lake Scenic Area and Xixi Wetland (Moran’s I = 0.37, p < 0.01), while cold spots are distributed in old towns, industrial zones, and commercial centers (e.g., Sandun Town, Jiangcun Subdistrict).
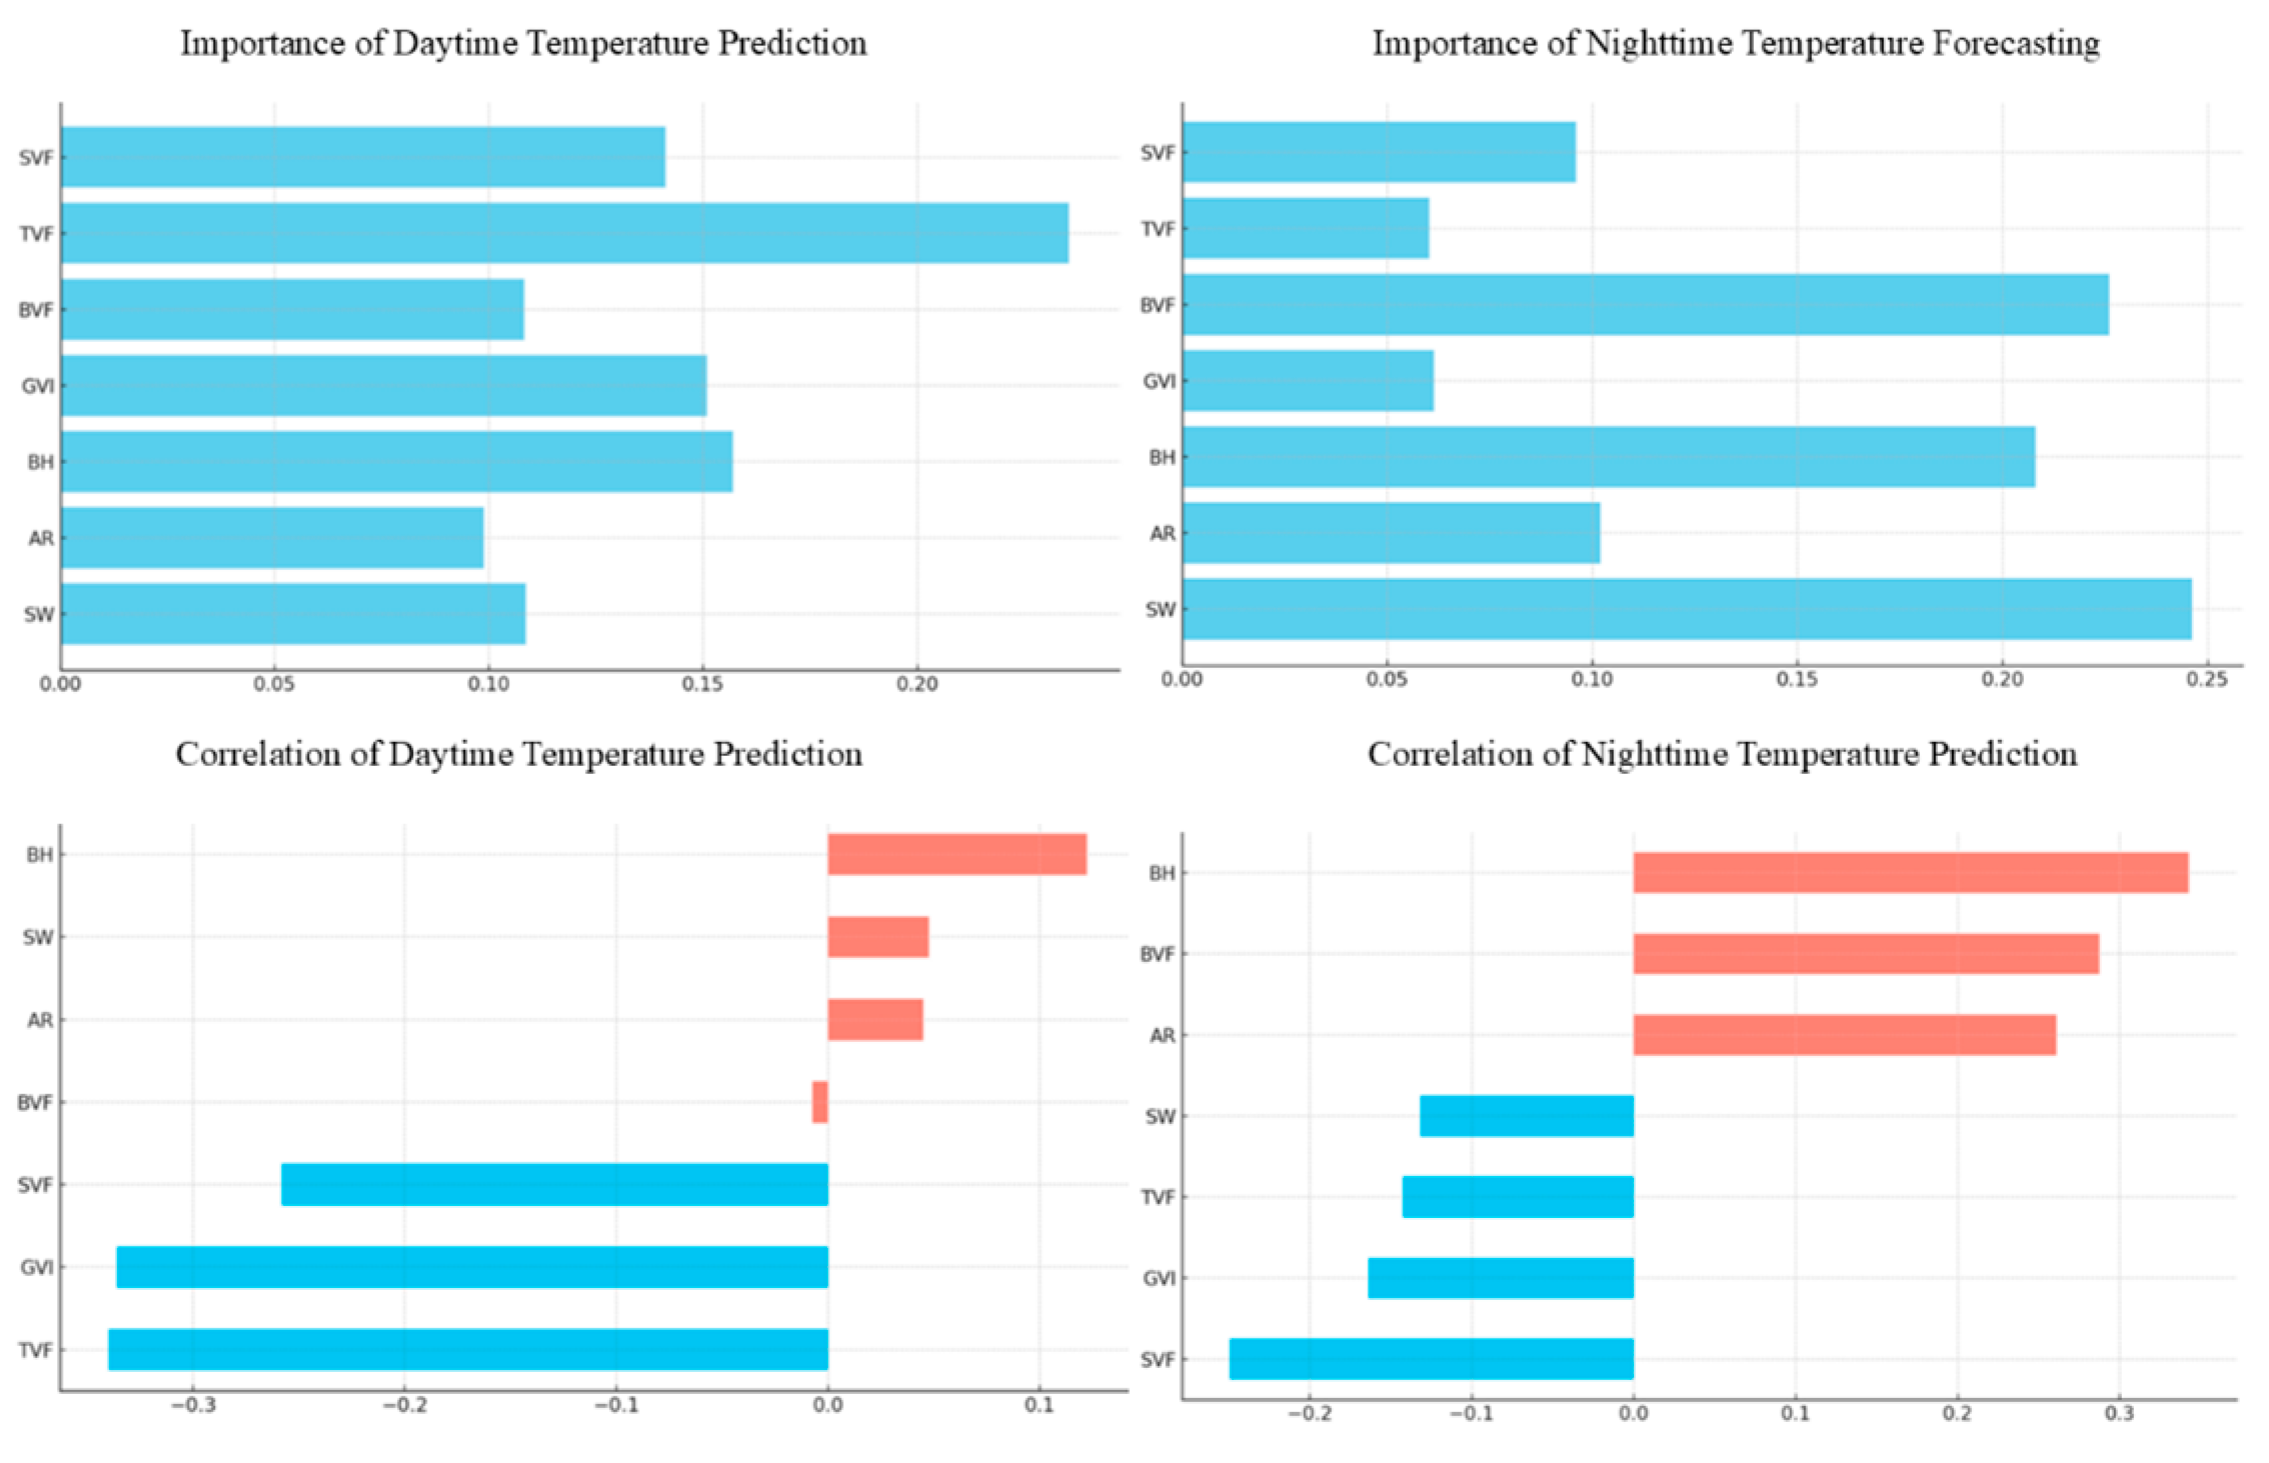
(6) Three-dimensional morphological indicators such as Building Visibility Factor (BVF) and Tree Visibility Factor (TVF) show diurnal differences in temperature contributions: TVF and building height (BH) dominate daytime, while street width (SW) and BH dominate nighttime.

