
Disparities in Fine Particulate Matter Air Pollution Exposures at the US–Mexico Border: The Intersection of Race/Ethnicity and Older Age


Abstract
1. Introduction
2. Materials and Methods
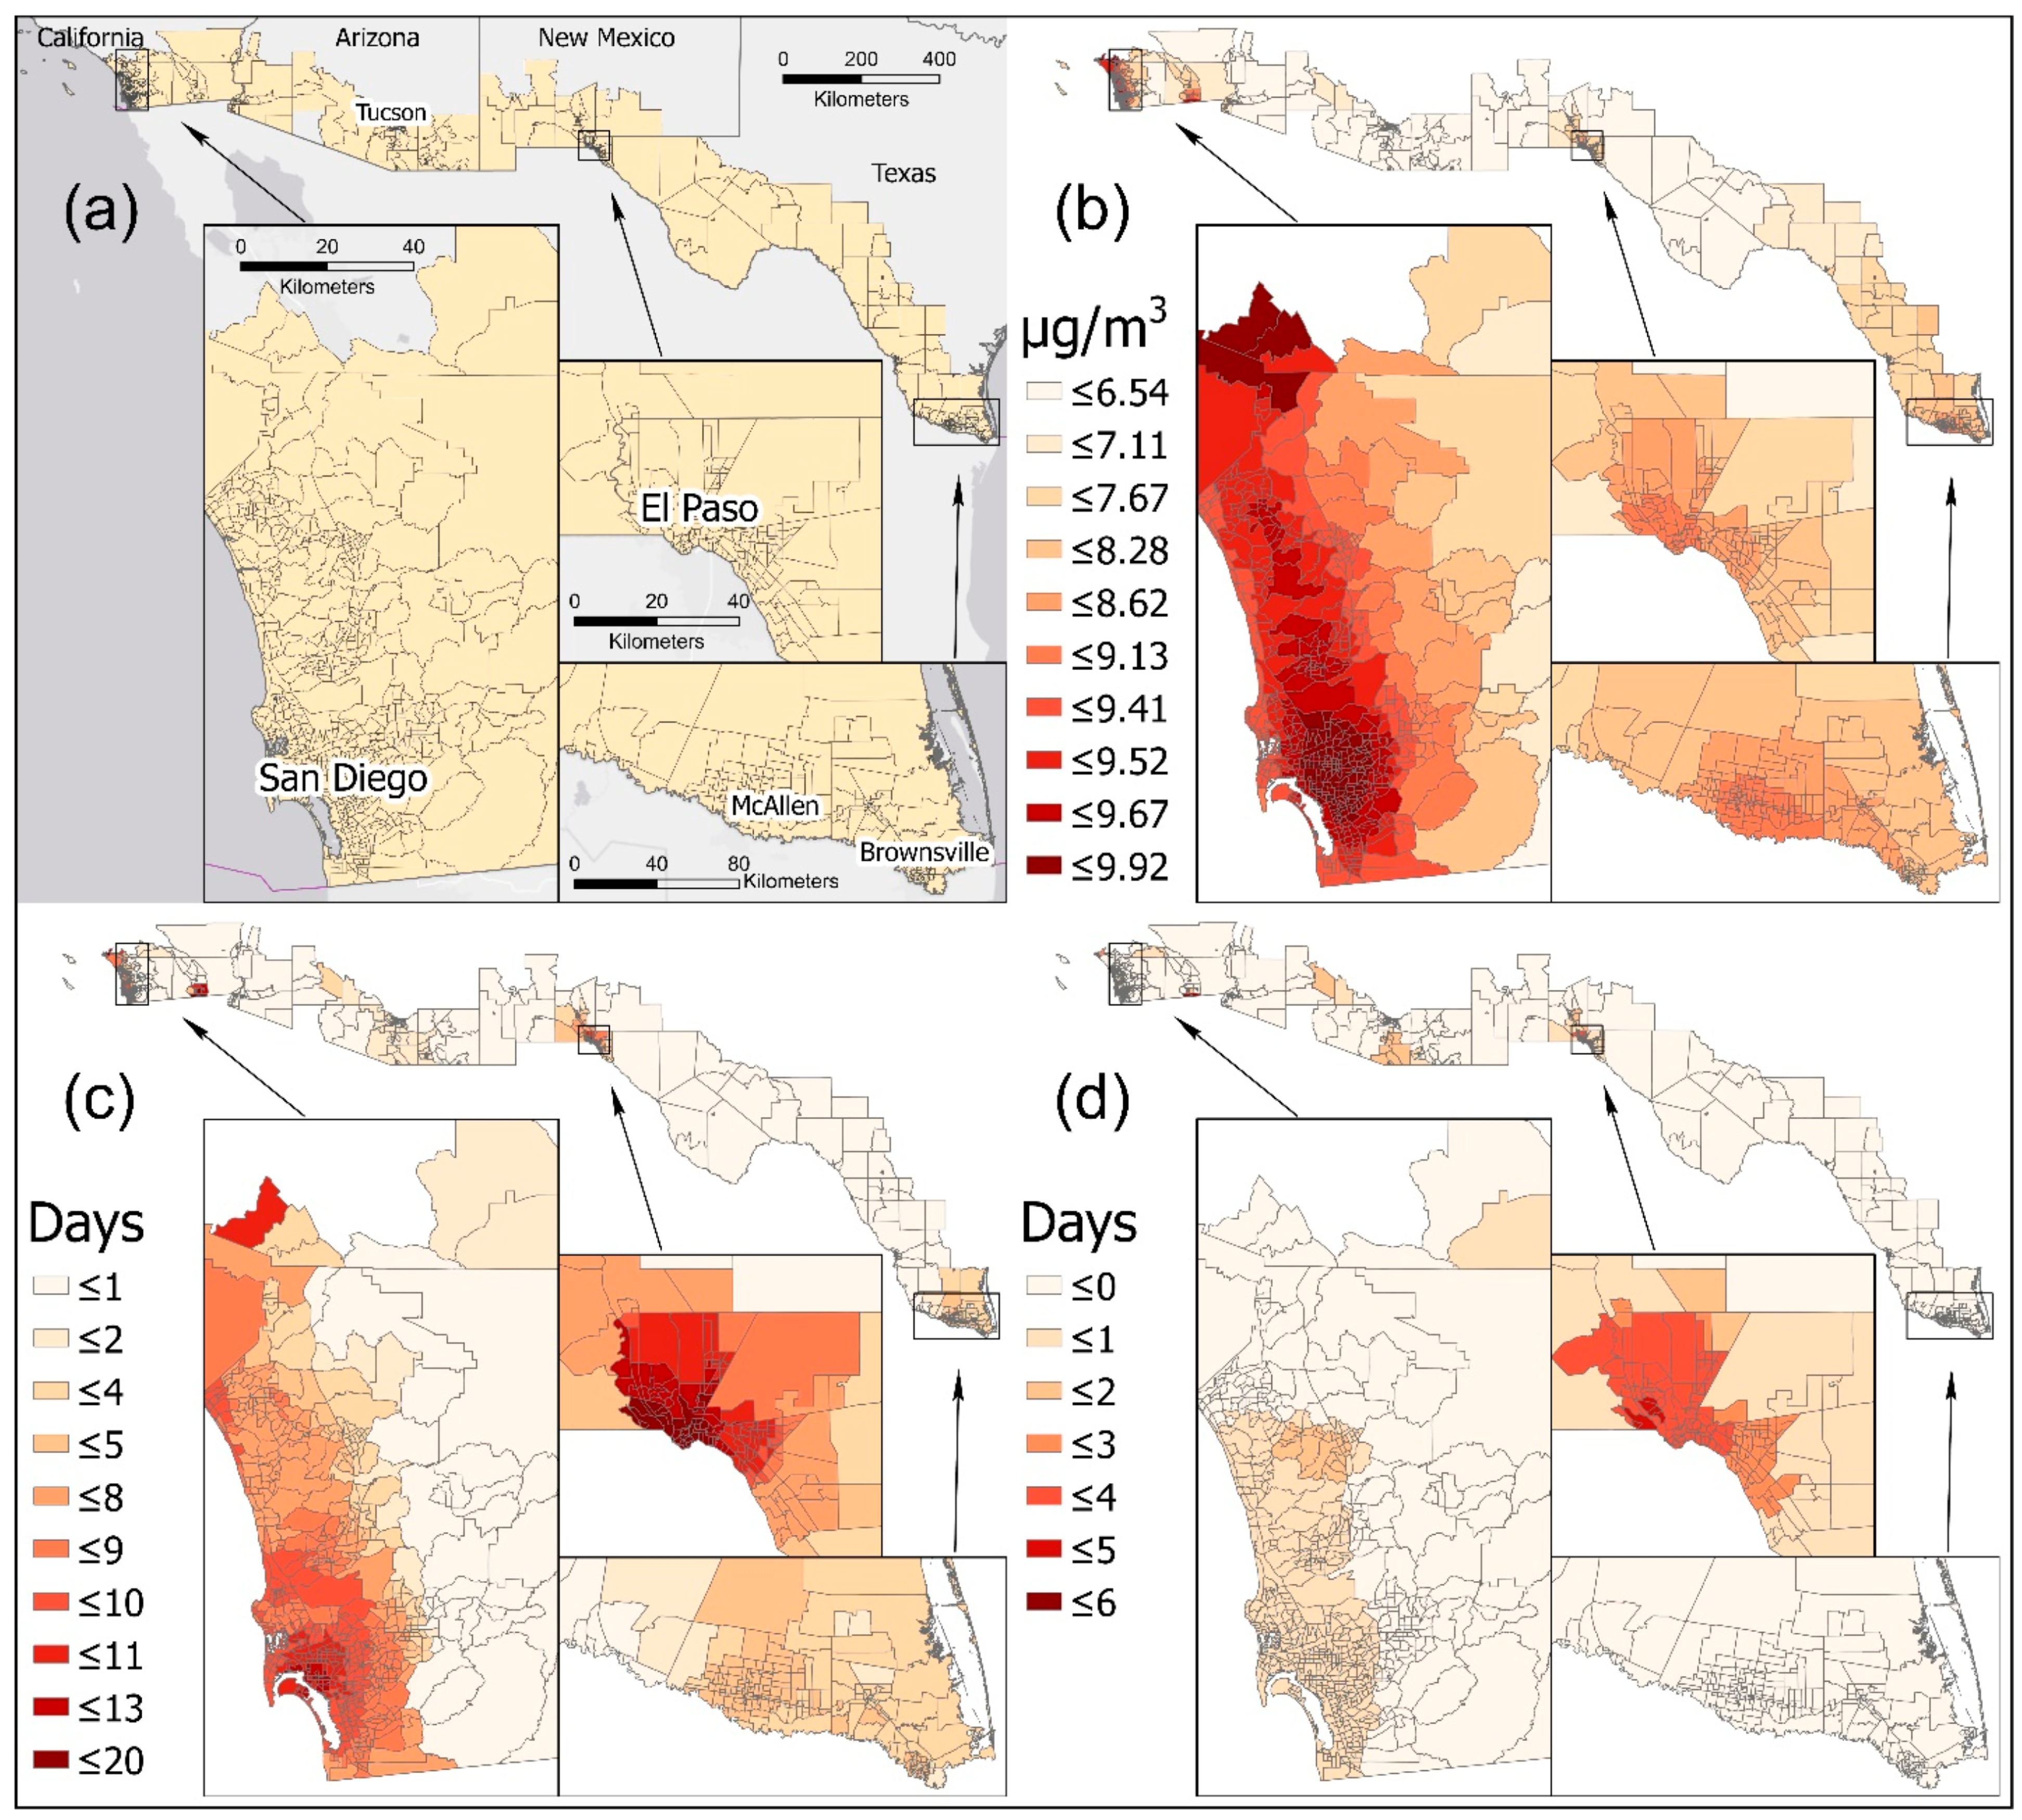
2.1. Study Area
2.2. Dependent Variables
2.3. Independent Variables
2.4. Analysis Approach
3. Results
3.1. Univariate Results
3.2. Population-Weighted Mean PM2.5 Exposure Results
3.3. Multivariable GEE Model Results
4. Discussion
5. Conclusions
Author Contributions
Funding
Institutional Review Board Statement
Informed Consent Statement
Data Availability Statement
Acknowledgments
Conflicts of Interest
References
- IHME (Institute for Health Metrics and Evaluation). Global Burden of Disease Study 2021 Results. 2021. Available online: http://ghdx.healthdata.org/gbd-results-tool (accessed on 11 April 2025).
- Manisalidis, I.; Stavropoulou, E.; Stavropoulos, A.; Bezirtzoglou, E. Environmental and health impacts of air pollution: A review. Front. Public Health 2020, 8, 14. [Google Scholar] [CrossRef] [PubMed]
- Tavella, R.A.; Penteado, J.O.; de Lima Brum, R.; da Silva Bonifácio, A.; Martin, M.C.S.; Saes-Silva, E.; Brum, A.N.; Buffarini, R.; Filho, W.L.F.C.; Adamatti, D.F.; et al. An exploratory study on the association between air pollution and health problems (ICD-10) with an emphasis on respiratory diseases. Atmos. Pollut. Res. 2025, 16, 102377. [Google Scholar] [CrossRef]
- Brulle, R.J.; Pellow, D.N. Environmental justice: Human health and environmental inequalities. Annu. Rev. Public Health 2006, 27, 103–124. [Google Scholar] [CrossRef]
- Collins, T.W.; Grineski, S.E.; Shaker, Y.; Mullen, C.J. Communities of color are disproportionately exposed to long-term and short-term PM2.5 in metropolitan America. Environ. Res. 2022, 214, 114038. [Google Scholar] [CrossRef]
- Collins, T.W.; Grineski, S.E. Racial/ethnic disparities in short-term PM2.5 air pollution exposures in the United States. Environ. Health Perspect. 2022, 130, 087701. [Google Scholar] [CrossRef] [PubMed]
- Colmer, J.; Hardman, I.; Shimshack, J.; Voorheis, J. Disparities in PM2.5 air pollution in the United States. Science 2020, 369, 575–578. [Google Scholar] [CrossRef]
- Jbaily, A.; Zhou, X.; Liu, J.; Lee, T.H.; Kamareddine, L.; Verguet, S.; Dominici, F. Air pollution exposure disparities across US population and income groups. Nature 2022, 601, 228–233. [Google Scholar] [CrossRef] [PubMed]
- Tessum, C.W.; Paolella, D.A.; Chambliss, S.E.; Apte, J.S.; Hill, J.D.; Marshall, J.D. PM2.5 polluters disproportionately and systemically affect people of color in the United States. Sci. Adv. 2021, 7, eabf4491. [Google Scholar] [CrossRef]
- Mohai, P.; Pellow, D.; Roberts, J.T. Environmental justice. Annu. Rev. Environ. Resour. 2009, 34, 405–430. [Google Scholar] [CrossRef]
- Nadybal, S.; Grineski, S.; Collins, T.; Castor, A.; Flores, A.; Griego, A.; Mullen, C.; Rubio, R. Environmental justice in the US and beyond: Frameworks, evidence, and social action. In Geographies of Behavioral Health, Crime, and Disorder; Lersch, K., Chakraborty, J., Eds.; Springer: New York, NY, USA, 2020; pp. 187–209. [Google Scholar]
- Bowe, B.; Xie, Y.; Yan, Y.; Al-Aly, Z. Burden of cause-specific mortality associated with PM2.5 air pollution in the United States. JAMA Netw. Open 2019, 2, e1915834. [Google Scholar] [CrossRef]
- Di, Q.; Wang, Y.; Zanobetti, A.; Wang, Y.; Koutrakis, P.; Choirat, C.; Dominici, F.; Schwartz, J.D. Air pollution and mortality in the Medicare population. N. Engl. J. Med. 2017, 376, 2513–2522. [Google Scholar] [CrossRef] [PubMed]
- Geldsetzer, P.; Fridljand, D.; Kiang, M.V.; Bendavid, E.; Heft-Neal, S.; Burke, M.; Thieme, A.H.; Benmarhnia, T. Disparities in air pollution attributable mortality in the US population by race/ethnicity and sociodemographic factors. Nat. Med. 2024, 30, 2821–2829. [Google Scholar] [CrossRef] [PubMed]
- Josey, K.P.; Delaney, S.W.; Wu, X.; Nethery, R.C.; DeSouza, P.; Braun, D.; Dominici, F. Air pollution and mortality at the intersection of race and social class. N. Engl. J. Med. 2023, 388, 1396–1404. [Google Scholar] [CrossRef]
- Ma, Y.; Zang, E.; Opara, I.; Lu, Y.; Krumholz, H.M.; Chen, K. Racial/ethnic disparities in PM2.5-attributable cardiovascular mortality burden in the United States. Nat. Hum. Behav. 2023, 7, 2074–2083. [Google Scholar] [CrossRef] [PubMed]
- Power, M.C.; Weisskopf, M.G.; Alexeeff, S.E.; Coull, B.A.; Spiro, A., III; Schwartz, J. Traffic-related air pollution and cognitive function in a cohort of older men. Environ. Health Perspect. 2011, 119, 682–687. [Google Scholar] [CrossRef]
- Pun, V.C.; Kazemiparkouhi, F.; Manjourides, J.; Suh, H.H. Long-term PM2.5 exposure and respiratory, cancer, and cardiovascular mortality in older US adults. Am. J. Epidemiol. 2017, 186, 961–969. [Google Scholar] [CrossRef]
- Spiller, E.; Proville, J.; Roy, A.; Muller, N.Z. Mortality risk from PM2.5: A comparison of modeling approaches to identify disparities across racial/ethnic groups in policy outcomes. Environ. Health Perspect. 2021, 129, 127004. [Google Scholar] [CrossRef]
- Weuve, J.; Puett, R.C.; Schwartz, J.; Yanosky, J.D.; Laden, F.; Grodstein, F. Exposure to particulate air pollution and cognitive decline in older women. Arch. Intern. Med. 2012, 172, 219–227. [Google Scholar] [CrossRef]
- Yin, H.; Brauer, M.; Zhang, J.; Cai, W.; Navrud, S.; Burnett, R.; Howard, C.; Deng, Z.; Kammen, D.M.; Schellnhuber, H.J.; et al. Population ageing and deaths attributable to ambient PM2.5 pollution: A global analysis of economic cost. Lancet Planet. Health 2021, 5, e356–e367. [Google Scholar] [CrossRef]
- Malin, S.A.; Ryder, S.S. Developing deeply intersectional environmental justice scholarship. Environ. Sociol. 2018, 4, 1–7. [Google Scholar] [CrossRef]
- Liévanos, R.S. Race, deprivation, and immigrant isolation: The spatial demography of air-toxic clusters in the continental United States. Soc. Sci. Res. 2015, 54, 50–67. [Google Scholar] [CrossRef] [PubMed]
- Rubio, R.; Grineski, S.; Collins, T.; Morales, D.X. Ancestry-based intracategorical injustices in carcinogenic air pollution exposures in the United States. Soc. Nat. Resour. 2020, 33, 987–1005. [Google Scholar] [CrossRef] [PubMed]
- Collins, T.W.; Grineski, S.E.; Chakraborty, J.; McDonald, Y.J. Understanding environmental health inequalities through comparative intracategorical analysis: Racial/ethnic disparities in cancer risks from air toxics in El Paso County, Texas. Health Place 2011, 17, 335–344. [Google Scholar] [CrossRef] [PubMed]
- Loustaunau, M.G.; Chakraborty, J. Vehicular air pollution in Houston, Texas: An intra-categorical analysis of environmental injustice. Int. J. Environ. Res. Public Health 2019, 16, 2968. [Google Scholar] [CrossRef]
- Grineski, S.E.; Collins, T.W. Environmental injustices in transnational context: Urbanization and industrial hazards in El Paso/Ciudad Juárez. Environ. Plan. A 2010, 42, 1308–1327. [Google Scholar] [CrossRef]
- Lara-Valencia, F.; Declet-Barreto, J.; Keys, E. Spatial equity and transportation hazard along cross-border trade corridors: The case of Ambos Nogales. J. Borderl. Stud. 2008, 23, 1–18. [Google Scholar] [CrossRef]
- Lara-Valencia, F.; Harlow, S.D.; Lemos, M.C.; Denman, C.A. Equity dimensions of hazardous waste generation in rapidly industrialising cities along the United States–Mexico border. J. Environ. Plan. Manag. 2009, 52, 195–216. [Google Scholar] [CrossRef]
- Rubio, R.; Grineski, S.; Collins, T. Carcinogenic air pollution along the United States’ southern border: Neighborhood inequities in risk. Environ. Res. 2022, 212, 113251. [Google Scholar] [CrossRef]
- Kelly, K.E.; Jaramillo, I.C.; Quintero-Núñez, M.; Wagner, D.A.; Collins, K.; Meuzelaar, H.L.; Lighty, J.S. Low-wind/high particulate matter episodes in the Calexico/Mexicali region. J. Air Waste Manag. Assoc. 2010, 60, 1476–1486. [Google Scholar] [CrossRef]
- Lauer, F.T.; Mitchell, L.A.; Bedrick, E.; McDonald, J.D.; Lee, W.-Y.; Li, W.-W.; Olvera, H.; Amaya, M.A.; Berwick, M.; Gonzales, M.; et al. Temporal–spatial analysis of US–Mexico border environmental fine and coarse PM air sample extract activity in human bronchial epithelial cells. Toxicol. Appl. Pharmacol. 2009, 238, 1–10. [Google Scholar] [CrossRef]
- Ordieres, J.B.; Vergara, E.P.; Capuz, R.S.; Salazar, R.E. Neural network prediction model for fine particulate matter (PM2.5) on the US–Mexico border in El Paso (Texas) and Ciudad Juárez (Chihuahua). Environ. Model. Softw. 2005, 20, 547–559. [Google Scholar] [CrossRef]
- Quintana, P.J.; Dumbauld, J.J.; Garnica, L.; Chowdhury, M.Z.; Velascosoltero, J.; Mota-Raigoza, A.; Flores, D.; Panagon, N.; Gamble, J. Traffic-related air pollution in the community of San Ysidro, CA, in relation to northbound vehicle wait times at the US–Mexico border Port of Entry. Atmos. Environ. 2014, 88, 353–361. [Google Scholar] [CrossRef]
- Chen, C.; Zhu, P.; Lan, L.; Zhou, L.; Liu, R.; Sun, Q.; Ban, J.; Wang, W.; Xu, D.; Li, T. Short-term exposures to PM2.5 and cause-specific mortality of cardiovascular health in China. Environ. Res. 2018, 161, 188–194. [Google Scholar] [CrossRef] [PubMed]
- Fajersztajn, L.; Saldiva, P.; Pereira, L.A.A.; Leite, V.F.; Buehler, A.M. Short-term effects of fine particulate matter pollution on daily health events in Latin America: A systematic review and meta-analysis. Int. J. Public Health 2017, 2, 729–738. [Google Scholar] [CrossRef]
- Orellano, P.; Reynoso, J.; Quaranta, N.; Bardach, A.; Ciapponi, A. Short-term exposure to particulate matter (PM10 and PM2.5), nitrogen dioxide (NO2), and ozone (O3) and all-cause and cause-specific mortality: Systematic review and meta-analysis. Environ. Int. 2020, 142, 105876. [Google Scholar] [CrossRef]
- Yu, W.; Xu, R.; Ye, T.; Abramson, M.J.; Morawska, L.; Jalaludin, B.; Johnston, F.H.; Henderson, S.B.; Knibbs, L.D.; Morgan, G.G.; et al. Estimates of global mortality burden associated with short-term exposure to fine particulate matter (PM2.5). Lancet Planet. Health 2024, 8, e146–e155. [Google Scholar] [CrossRef]
- USDA (United States Department of Agriculture). 2010 Rural-Urban Commuting Area Codes. 2019. Available online: https://www.ers.usda.gov/data-products/rural-urban-commuting-area-codes/ (accessed on 11 April 2025).
- Spielman, S.E.; Folch, D.; Nagle, N. Patterns and causes of uncertainty in the American Community Survey. Appl. Geogr. 2014, 46, 147–157. [Google Scholar] [CrossRef]
- WHO (World Health Organization). Air Quality Guidelines for Particulate Matter, Ozone, Nitrogen Dioxide and Sulfur Dioxide: Global update 2005—Summary of Risk Assessment; World Health Organization: Copenhagen, Denmark, 2006. [Google Scholar]
- USEPA (United States Environmental Protection Agency). Revised Air Quality Standards for Particle Pollution and Updates to the Air Quality Index (AQI). Office of Air Quality Planning and Standards. 2012. Available online: https://www.epa.gov/sites/production/files/2016-04/documents/2012_aqi_factsheet.pdf (accessed on 11 April 2025).
- USEPA (United States Environmental Protection Agency). Fused Air Quality Surface Using Downscaling (FAQSD) Files, Downscaling Output Files. 2025. Available online: https://www.epa.gov/hesc/rsig-related-downloadable-data-files (accessed on 11 April 2025).
- Berrocal, V.J.; Gelfand, A.E.; Holland, D.M. A spatio-temporal downscaler for output from numerical models. J. Agric. Biol. Environ. Stat. 2010, 15, 176–197. [Google Scholar] [CrossRef]
- Berrocal, V.J.; Guan, Y.; Muyskens, A.; Wang, H.; Reich, B.J.; Mulholland, J.A.; Chang, H.H. A comparison of statistical and machine learning methods for creating national daily maps of ambient PM2.5 concentration. Atmos. Environ. 2020, 222, 117130. [Google Scholar] [CrossRef]
- Jin, X.; Fiore, A.M.; Civerolo, K.; Bi, J.; Liu, Y.; Van Donkelaar, A.; Martin, R.V.; Al-Hamdan, M.; Zhang, Y.; Insaf, T.Z.; et al. Comparison of multiple PM2.5 exposure products for estimating health benefits of emission controls over New York State, USA. Environ. Res. Lett. 2019, 14, 084023. [Google Scholar] [CrossRef]
- Kelly, J.T.; Jang, C.; Timin, B.; Di, Q.; Schwartz, J.; Liu, Y.; van Donkelaar, A.; Martin, R.V.; Berrocal, V.; Bell, M.L. Examining PM2.5 concentrations and exposure using multiple models. Environ. Res. 2021, 196, 110432. [Google Scholar] [CrossRef] [PubMed]
- Bravo, M.A.; Ebisu, K.; Dominici, F.; Wang, Y.; Peng, R.D.; Bell, M.L. Airborne fine particles and risk of hospital admissions for understudied populations: Effects by urbanicity and short-term cumulative exposures in 708 US counties. Environ. Health Perspect. 2017, 125, 594–601. [Google Scholar] [CrossRef] [PubMed]
- Grineski, S.E.; Renteria, R.A.; Collins, T.W.; Bakian, A.V.; Bilder, D.; VanDerslice, J.A.; Fraser, A.; Gomez, J.; Ramos, K.D. PM2.5 threshold exceedances during the prenatal period and risk of intellectual disability. J. Expo. Sci. Environ. Epidemiol. 2024, 34, 861–867. [Google Scholar] [CrossRef]
- Son, J.Y.; Lane, K.J.; Miranda, M.L.; Bell, M.L. Health disparities attributable to air pollutant exposure in North Carolina: Influence of residential environmental and social factors. Health Place 2020, 62, 102287. [Google Scholar] [CrossRef] [PubMed]
- O’Dell, K.; Ford, B.; Fischer, E.V.; Pierce, J.R. Contribution of wildland-fire smoke to US PM2.5 and its influence on recent trends. Environ. Sci. Technol. 2019, 53, 1797–1804. [Google Scholar] [CrossRef]
- Collins, T.W.; Grineski, S.E.; Morales, D.X. Sexual orientation, gender, and environmental injustice: Unequal carcinogenic air pollution risks in greater Houston. Ann. Am. Assoc. Geogr. 2017, 107, 72–92. [Google Scholar] [CrossRef]
- Liu, J.; Clark, L.P.; Bechle, M.J.; Hajat, A.; Kim, S.-Y.; Robinson, A.L.; Sheppard, L.; Szpiro, A.A.; Marshall, J.D. Disparities in air pollution exposure in the United States by race/ethnicity and income, 1990–2010. Environ. Health Perspect. 2021, 129, 127005. [Google Scholar] [CrossRef]
- Pope, R.; Wu, J.; Boone, C. Spatial patterns of air pollutants and social groups: A distributive environmental justice study in the phoenix metropolitan region of USA. Environ. Manag. 2016, 58, 753–766. [Google Scholar] [CrossRef]
- Pulido, L. Rethinking environmental racism: White privilege and urban development in Southern California. Ann. Assoc. Am. Geogr. 2000, 90, 12–40. [Google Scholar] [CrossRef]
- Brauer, M.; Brook, J.R.; Christidis, T.; Chu, Y.; Crouse, D.L.; Erickson, A.; Hystad, P.; Li, C.; Martin, R.V.; Meng, J.; et al. Mortality–air pollution associations in low exposure environments (MAPLE): Phase 2. Res. Rep. Health Eff. Inst. 2022, 2022, 212. Available online: https://pmc.ncbi.nlm.nih.gov/articles/PMC9556709/pdf/hei-2022-212.pdf (accessed on 11 April 2025).
- Brunekreef, B.; Strak, M.; Chen, J.; Andersen, Z.J.; Atkinson, R.; Bauwelinck, M.; Bellander, T.; Boutron, M.-C.; Brandt, J.; Carey, I.; et al. Mortality and morbidity effects of long-term exposure to low-level PM2.5, BC, NO2, and O3: An analysis of European cohorts in the ELAPSE project. Res. Rep. Health Eff. Inst. 2021, 2021, 208. Available online: https://pmc.ncbi.nlm.nih.gov/articles/PMC9476567/pdf/hei-2021-208.pdf (accessed on 11 April 2025). [PubMed]
- Burnett, R.; Chen, H.; Szyszkowicz, M.; Fann, N.; Hubbell, B.; Pope, C.A., III; Apte, J.S.; Brauer, M.; Cohen, A.; Weichenthal, S.; et al. Global estimates of mortality associated with long-term exposure to outdoor fine particulate matter. Proc. Natl. Acad. Sci. USA 2018, 115, 9592–9597. [Google Scholar] [CrossRef] [PubMed]
- Dominici, F.; Zanobetti, A.; Schwartz, J.; Braun, D.; Sabath, B.; Wu, X. Assessing adverse health effects of long-term exposure to low levels of ambient air pollution: Implementation of causal inference methods. Res. Rep. Health Eff. Inst. 2022, 2022, 211. Available online: https://pmc.ncbi.nlm.nih.gov/articles/PMC9530797/pdf/hei-2022-211.pdf (accessed on 11 April 2025). [PubMed]
- Pope, C.A., III; Burnett, R.T.; Krewski, D.; Jerrett, M.; Shi, Y.; Calle, E.E.; Thun, M.J. Cardiovascular mortality and exposure to airborne fine particulate matter and cigarette smoke: Shape of the exposure-response relationship. Circulation 2009, 120, 941–948. [Google Scholar] [CrossRef]
- Yazdi, M.D.; Wang, Y.; Di, Q.; Requia, W.J.; Wei, Y.; Shi, L.; Sabath, M.B.; Dominici, F.; Coull, B.; Evans, J.S.; et al. Long-term effect of exposure to lower concentrations of air pollution on mortality among US Medicare participants and vulnerable subgroups: A doubly-robust approach. Lancet Planet. Health 2021, 5, e689–e697. [Google Scholar] [CrossRef]
- Chen, L.W.A.; Tropp, R.J.; Li, W.W.; Zhu, D.; Chow, J.C.; Watson, J.G.; Zielinska, B. Aerosol and air toxics exposure in El Paso, Texas: A pilot study. Aerosol Air Qual. Res. 2012, 12, 169–179. [Google Scholar] [CrossRef]


| Analysis Variable | Min.–Max. | Mean (Std. Dev.) |
|---|---|---|
| Dependent Variables | ||
| Mean PM2.5 (μg/m3) | 5.735–9.916 | 8.675 (1.023) |
| Number of days with PM2.5 ≥ 25 µg/m3 | 0–20 | 7.010 (3.983) |
| Number of days with PM2.5 ≥ 35 µg/m3 | 0–6 | 0.950 (1.189) |
| Independent Variables | ||
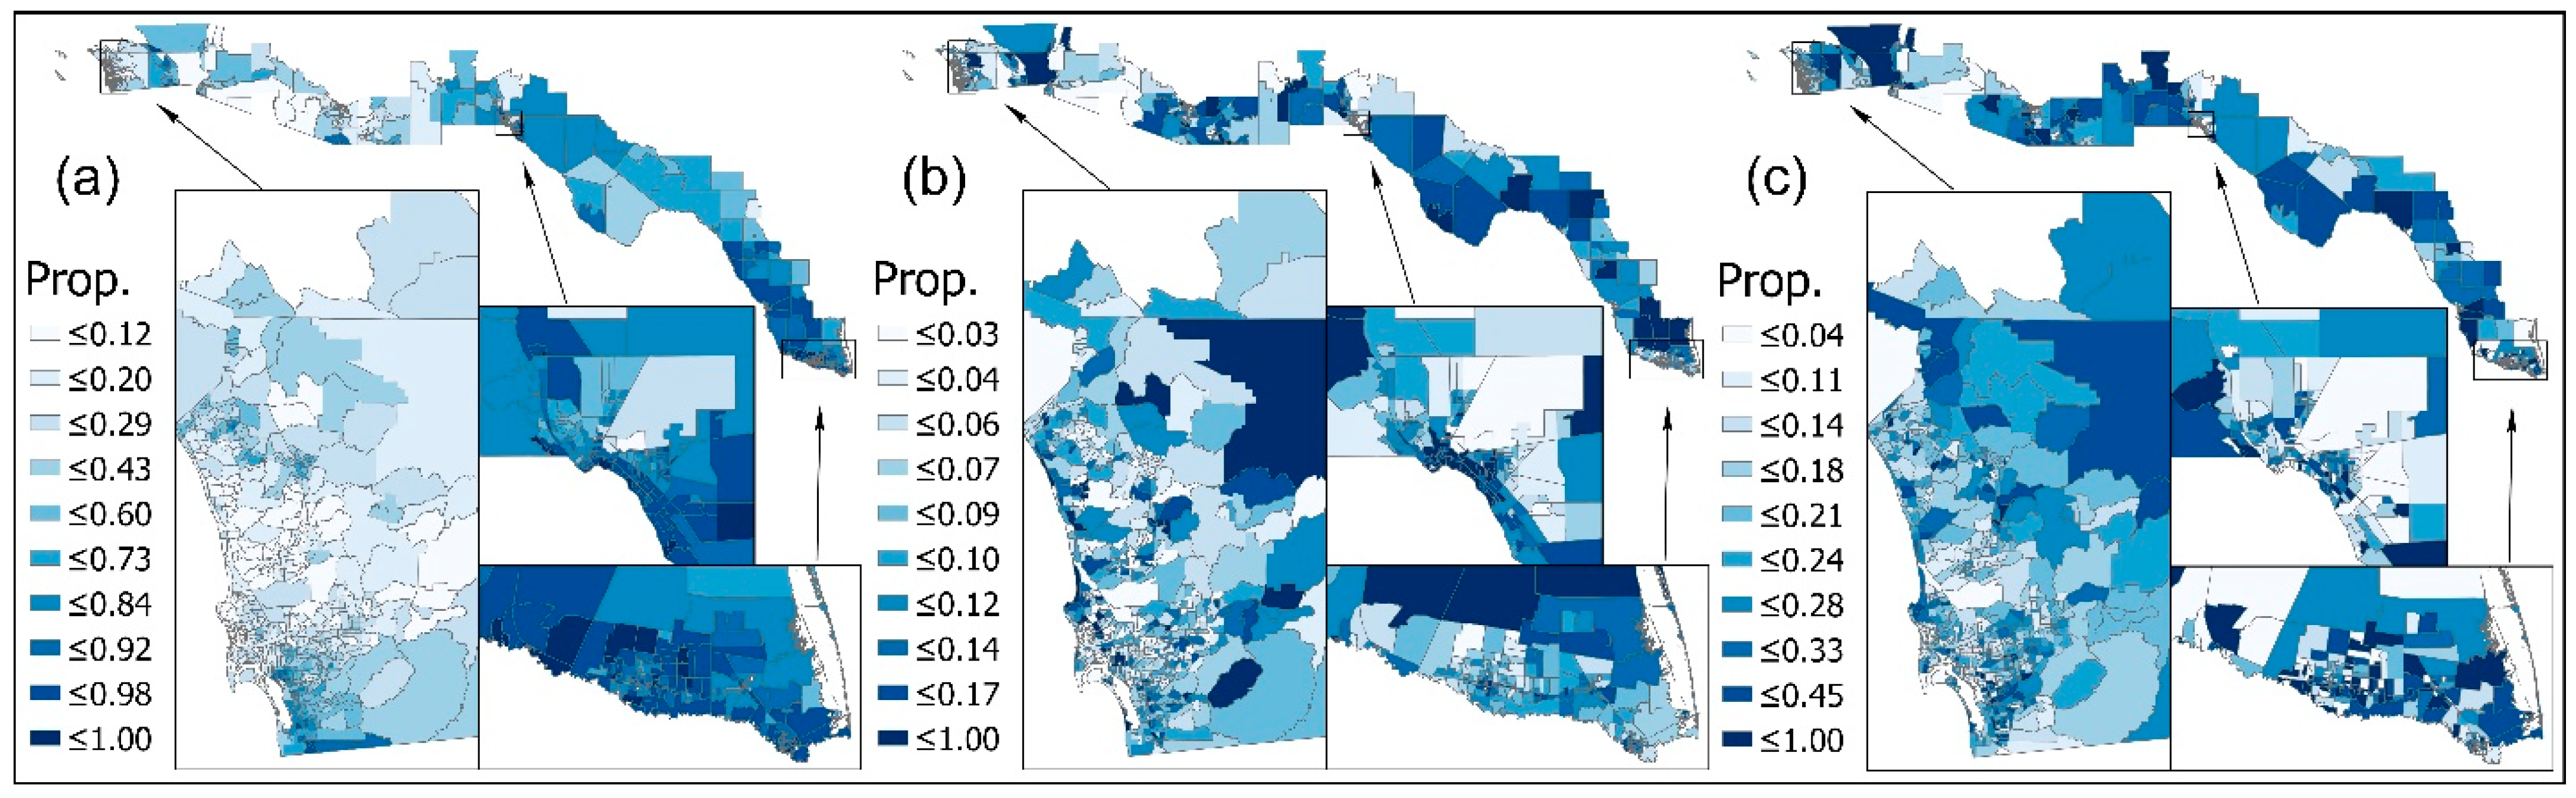
| Prop. Hispanic/Latino ≥ 65 years of age | 0.000–0.694 | 0.092 (0.057) |
| Prop. White ≥ 65 years of age | 0.000–1.000 | 0.234 (0.167) |
| Prop. Hispanic/Latino | 0.014–1.000 | 0.546 (0.323) |
| Prop. White (non-Hispanic) | 0.000–0.918 | 0.336 (0.275) |
| Prop. Black (non-Hispanic) | 0.000–0.373 | 0.031 (0.044) |
| Prop. American Indian (non-Hispanic) a | 0.000–0.646 | 0.005 (0.029) |
| Prop. Asian (non-Hispanic) | 0.000–0.717 | 0.058 (0.095) |
| Prop. Pacific Islander (non-Hispanic) b | 0.000–0.074 | 0.002 (0.007) |
| Prop. Other/Multi-Race (non-Hispanic) | 0.000–0.112 | 0.021 (0.021) |
| Prop. Total Population ≥ 65 Years of Age | 0.011–0.753 | 0.143 (0.077) |
| Median Household Income (2016, USD) | 11,497–185,724 | 56,144.073 (29,464.540) |
| Prop. Renter Occupancy | 0.034–0.945 | 0.428 (0.216) |
| Population Density (People per Sq. Mile) | 7.740–50,077.918 | 5544.455 (4820.609) |
| Focal Group by State | Mean PM2.5 (μg/m3) | Number of Days PM2.5 ≥ 25 µg/m3 | Number of Days PM2.5 ≥ 35 µg/m3 |
|---|---|---|---|
| California | |||
| Total Population | 9.470 | 8.239 | 0.822 |
| White | 9.438 | 7.846 | 0.756 |
| Hispanic/Latino | 9.479 | 8.602 | 0.925 |
| White ≥ 65 years | 9.432 | 7.745 | 0.751 |
| Hispanic/Latino ≥ 65 years | 9.465 | 9.102 | 1.071 |
| Arizona | |||
| Total Population | 6.489 | 1.838 | 0.451 |
| White | 6.342 | 1.771 | 0.373 |
| Hispanic/Latino | 6.631 | 1.914 | 0.541 |
| White ≥ 65 years | 6.284 | 1.689 | 0.533 |
| Hispanic/Latino ≥ 65 years | 6.600 | 1.912 | 0.602 |
| New Mexico | |||
| Total Population | 7.199 | 4.273 | 1.490 |
| White | 7.018 | 3.298 | 1.260 |
| Hispanic/Latino | 7.277 | 4.736 | 1.587 |
| White ≥ 65 years | 6.911 | 3.078 | 1.160 |
| Hispanic/Latino ≥ 65 years | 7.254 | 4.677 | 1.542 |
| Texas | |||
| Total Population | 8.166 | 5.556 | 0.961 |
| White | 8.086 | 6.299 | 1.353 |
| Hispanic/Latino | 8.173 | 5.412 | 0.890 |
| White ≥ 65 years | 8.143 | 5.701 | 0.994 |
| Hispanic/Latino ≥ 65 years | 8.175 | 5.708 | 1.033 |
| (a) Mean PM2.5 (μg/m3) b | (b) Number of Days PM2.5 ≥ 25 µg/m3 c | (c) Number of Days PM2.5 ≥ 35 µg/m3 c | |||||||
|---|---|---|---|---|---|---|---|---|---|
| Parameter a | B (95% CI) | Exp(B) | p | B (95% CI) | Exp(B) | p | B (95% CI) | Exp(B) | p |
| Base Model Variables | |||||||||
| Intercept | 2.093 (2.060, 2.125) | 8.108 | <0.001 | 1.871 (1.716, 2.026) | 6.493 | <0.001 | 0.063 (−0.210, 0.337) | 1.065 | 0.649 |
| Prop. Hispanic/Latino | 0.015 (0.008, 0.022) | 1.015 | <0.001 | 0.210 (0.123, 0.297) | 1.234 | <0.001 | 0.329 (0.200, 0.457) | 1.389 | <0.001 |
| Prop Black | 0.006 (0.003, 0.008) | 1.006 | <0.001 | 0.053 (0.020, 0.087) | 1.055 | 0.002 | 0.027 (−0.017, 0.072) | 1.028 | 0.230 |
| Prop. American Indian | −0.003 (−0.009, 0.002) | 0.997 | 0.242 | −0.034 (−0.095, 0.027) | 0.967 | 0.277 | 0.012 (−0.048, 0.071) | 1.012 | 0.697 |
| Prop. Asian | 0.007 (0.006, 0.009) | 1.007 | <0.001 | 0.070 (0.052, 0.088) | 1.073 | <0.001 | 0.120 (0.080, 0.159) | 1.127 | <0.001 |
| Prop. Pacific Islander | 0.000 (−0.001, 0.001) | 1.000 | 0.557 | 0.013 (0.002, 0.024) | 1.013 | 0.016 | −0.019 (−0.045, 0.007) | 0.981 | 0.147 |
| Prop. Other/Multi-Race | 0.000 (−0.004, 0.005) | 1.000 | 0.850 | −0.006 (−0.054, 0.042) | 0.994 | 0.794 | −0.060 (−0.131, 0.011) | 0.942 | 0.096 |
| Prop. Total Pop. ≥ 65 years | 0.002 (−0.001, 0.005) | 1.002 | 0.182 | 0.057 (0.019, 0.094) | 1.058 | 0.003 | 0.076 (0.031, 0.120) | 1.079 | 0.001 |
| Med. Household Income | 0.015 (0.0062, 0.003) | 1.016 | 0.013 | 0.471 (0.303, 0.639) | 1.602 | <0.001 | 0.458 (0.250, 0.665) | 1.580 | <0.001 |
| Med. Household Income (sq.) | −0.006 (−0.014, 0.002) | 0.994 | 0.119 | −0.186 (−0.305, −0.067) | 0.830 | 0.002 | −0.126 (−0.256, 0.004) | 0.881 | 0.058 |
| Prop. Renter Occupancy | 0.008 (0.004, 0.012) | 1.008 | <0.001 | 0.197 (0.141, 0.253) | 1.218 | <0.001 | 0.221 (0.162, 0.280) | 1.247 | <0.001 |
| Population Density | 0.000 (−0.001, 0.002) | 1.000 | 0.841 | 0.041 (0.001, 0.081) | 1.042 | 0.044 | 0.041 (0.002, 0.081) | 1.042 | 0.039 |
| Older Hispanic/Latino Variables d | |||||||||
| Prop. Hispanic/Latino ≥ 65 e | 0.001 (0.000, 0.002) | 1.001 | 0.031 | 0.058 (0.032, 0.084) | 1.059 | <0.001 | 0.050 (0.016, 0.083) | 1.051 | 0.004 |
| Prop White e | −0.011 (−0.017, −0.006) | 0.989 | <0.001 | −0.150 (−0.22, −0.080) | 0.861 | <0.001 | −0.241 (−0.341, −0.142) | 0.786 | <0.001 |
| Older White Variable f | |||||||||
| Prop. White ≥ 65 g | 0.002 (0.000, 0.004) | 0.060 | 0.025 (−0.004, 0.055) | 0.093 | 0.044 (−0.003, 0.090) | 0.066 | |||
Disclaimer/Publisher’s Note: The statements, opinions and data contained in all publications are solely those of the individual author(s) and contributor(s) and not of MDPI and/or the editor(s). MDPI and/or the editor(s) disclaim responsibility for any injury to people or property resulting from any ideas, methods, instructions or products referred to in the content. |
© 2025 by the authors. Licensee MDPI, Basel, Switzerland. This article is an open access article distributed under the terms and conditions of the Creative Commons Attribution (CC BY) license (https://creativecommons.org/licenses/by/4.0/).
Share and Cite
Collins, T.W.; Child, C.M.; Grineski, S.E.; Scott, M. Disparities in Fine Particulate Matter Air Pollution Exposures at the US–Mexico Border: The Intersection of Race/Ethnicity and Older Age. Atmosphere 2025, 16, 610. https://doi.org/10.3390/atmos16050610
Collins TW, Child CM, Grineski SE, Scott M. Disparities in Fine Particulate Matter Air Pollution Exposures at the US–Mexico Border: The Intersection of Race/Ethnicity and Older Age. Atmosphere. 2025; 16(5):610. https://doi.org/10.3390/atmos16050610
Chicago/Turabian StyleCollins, Timothy W., Colby M. Child, Sara E. Grineski, and Mathilda Scott. 2025. "Disparities in Fine Particulate Matter Air Pollution Exposures at the US–Mexico Border: The Intersection of Race/Ethnicity and Older Age" Atmosphere 16, no. 5: 610. https://doi.org/10.3390/atmos16050610
APA StyleCollins, T. W., Child, C. M., Grineski, S. E., & Scott, M. (2025). Disparities in Fine Particulate Matter Air Pollution Exposures at the US–Mexico Border: The Intersection of Race/Ethnicity and Older Age. Atmosphere, 16(5), 610. https://doi.org/10.3390/atmos16050610