Characteristics of Meteorological Droughts Across Different Climatic Zones in Benin


 , , ,
, , ,
Abstract
1. Introduction
2. Research Data and Methods
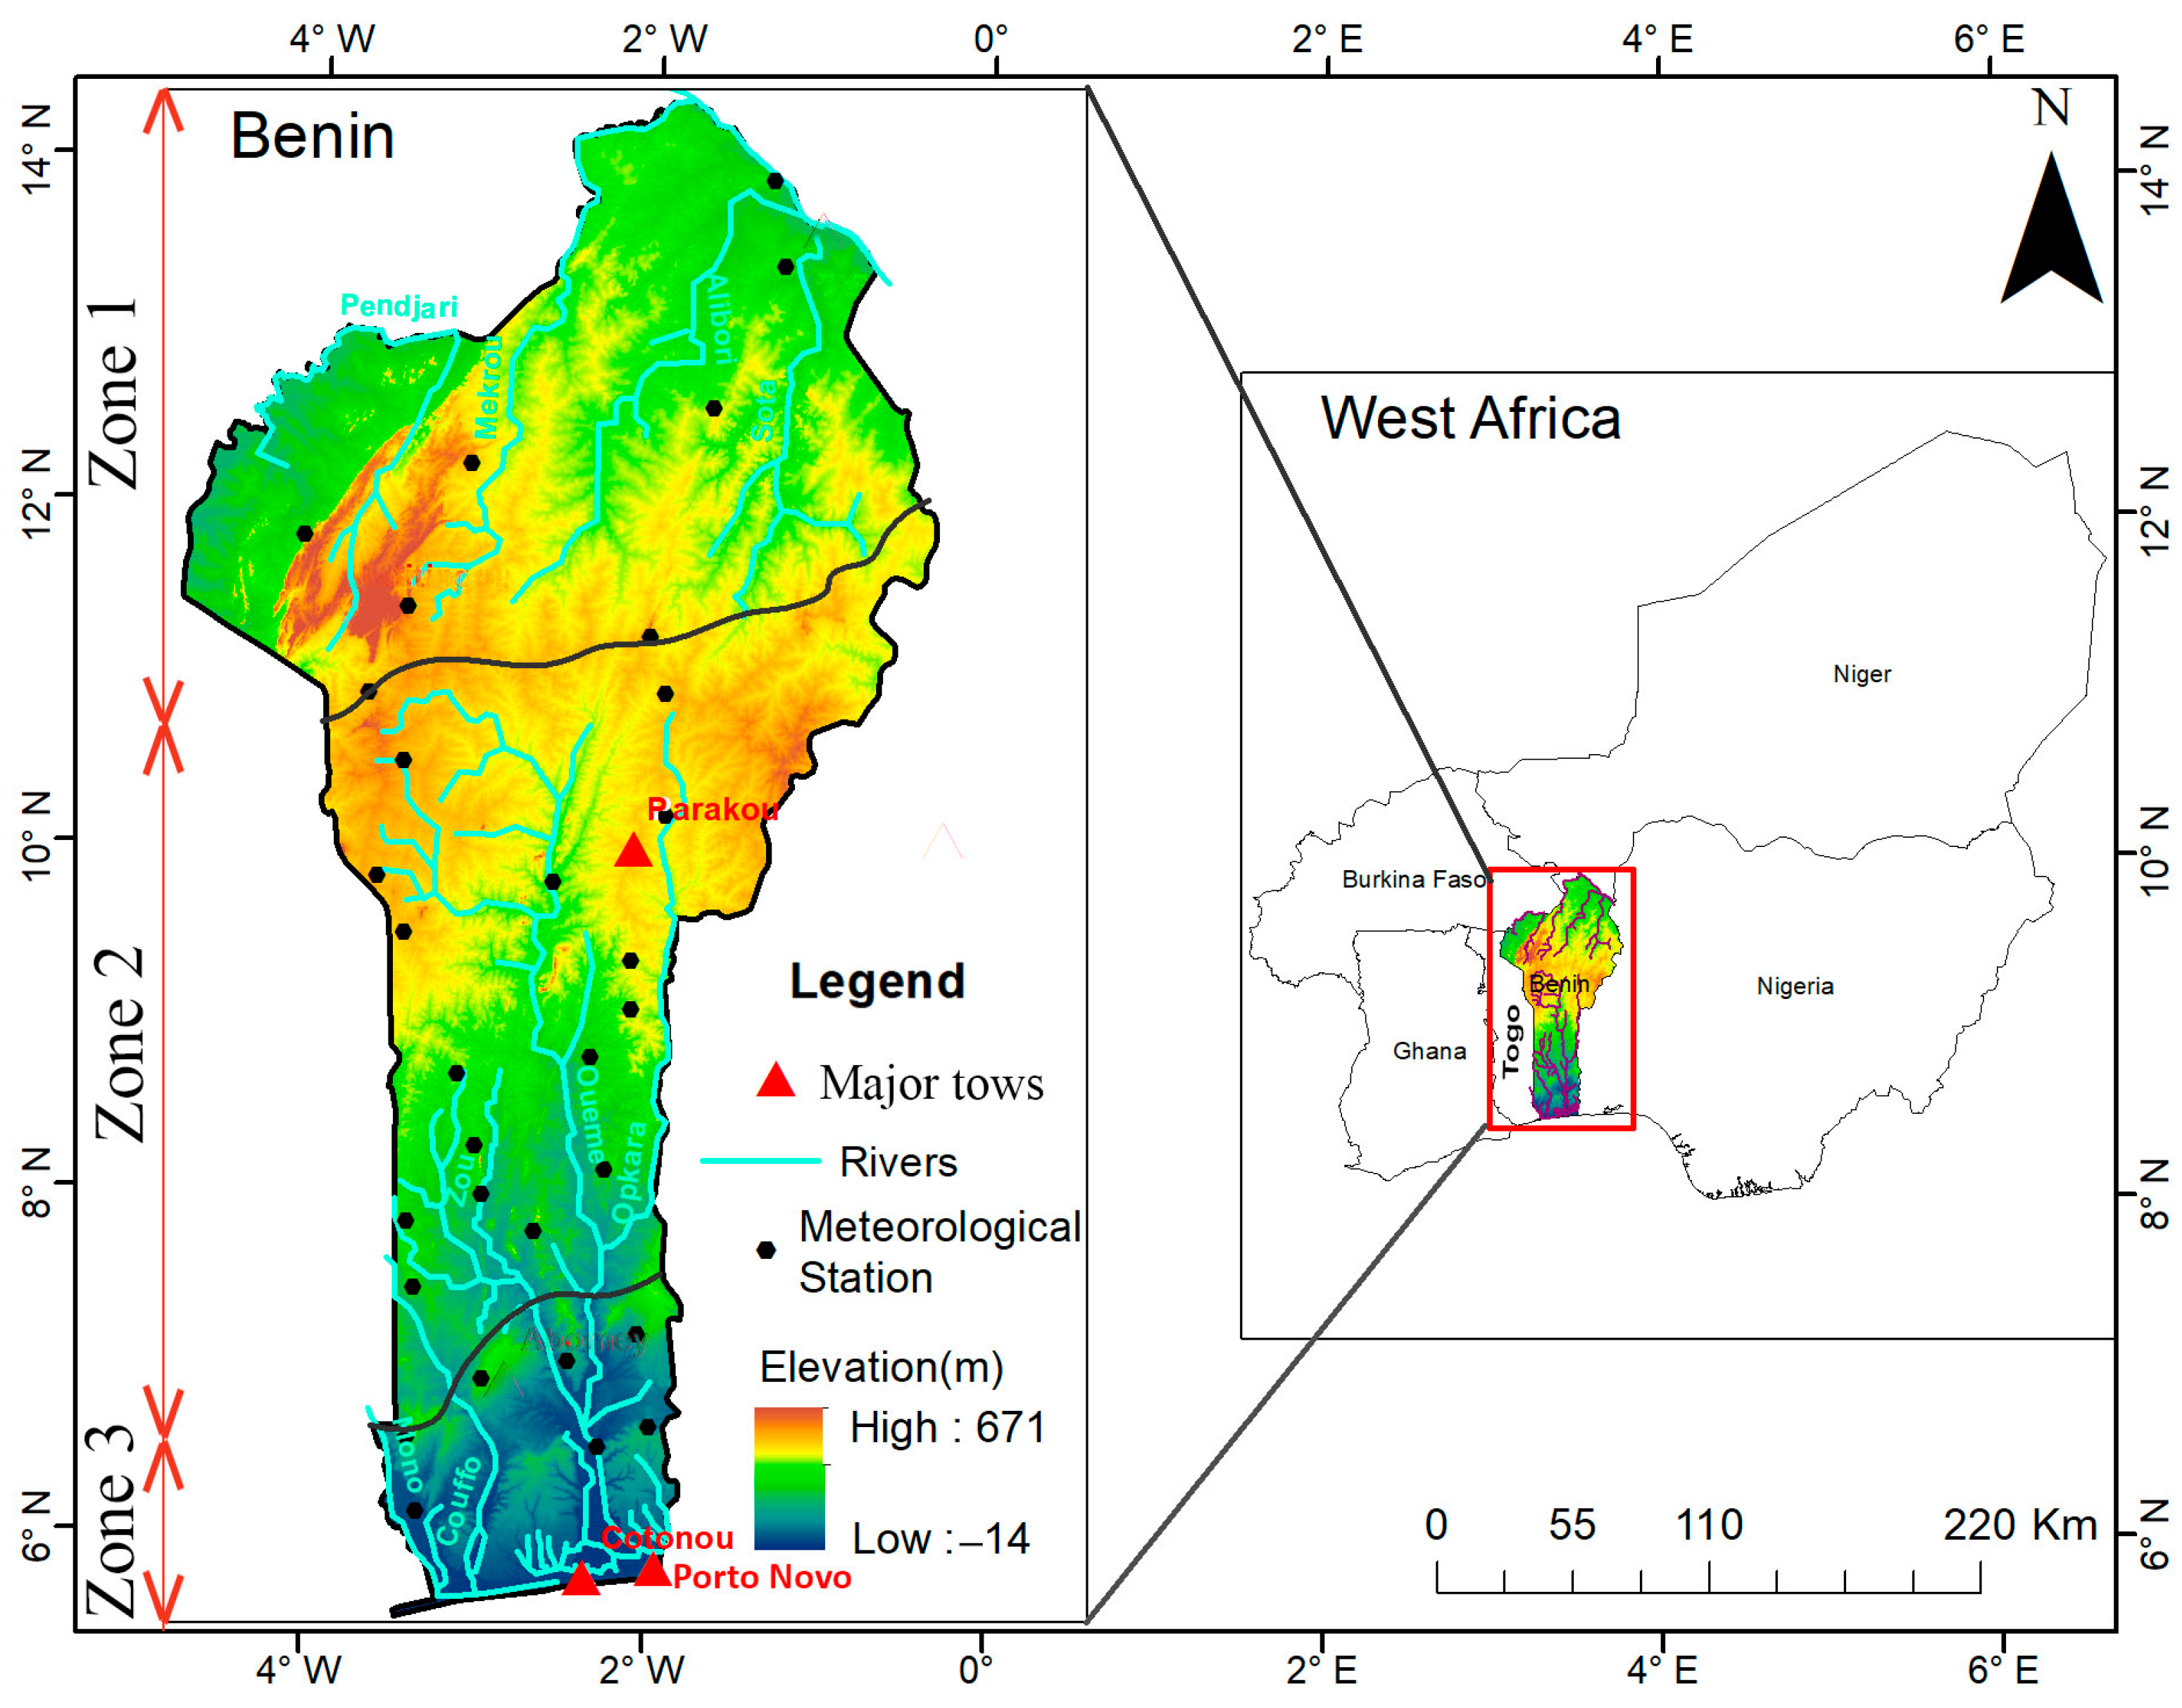
2.1. Study Area
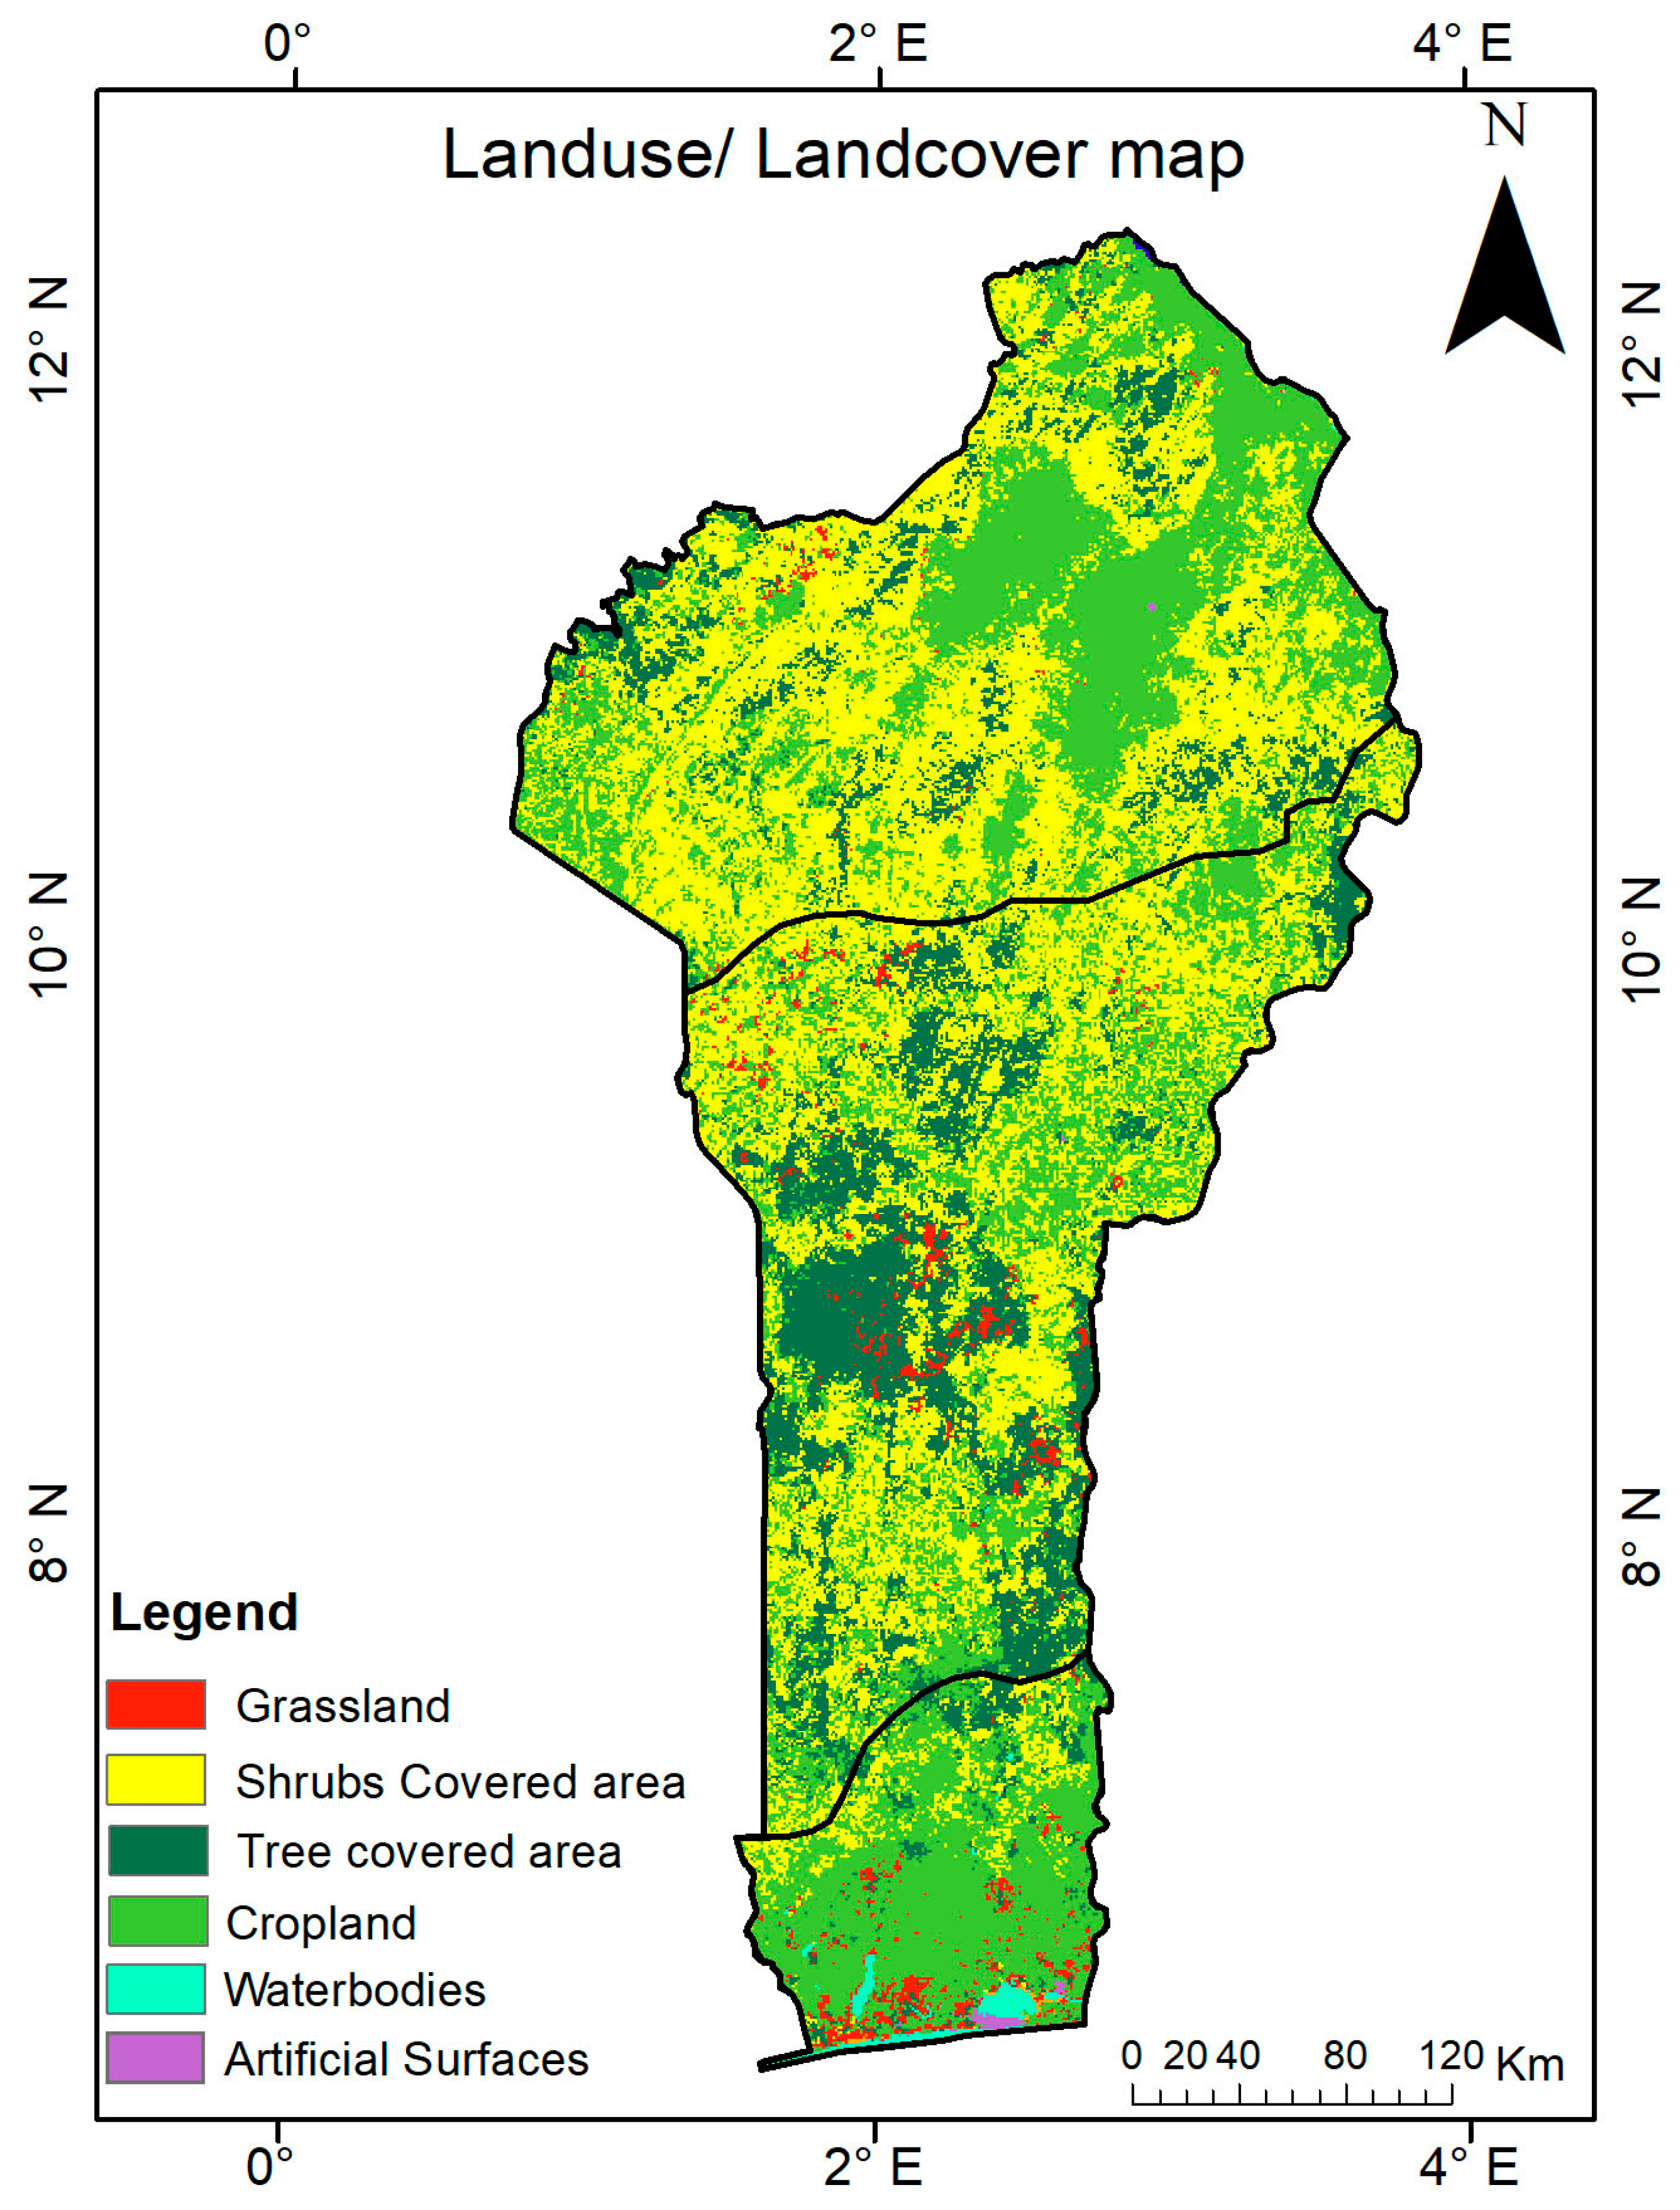
Land-Use/Land-Cover
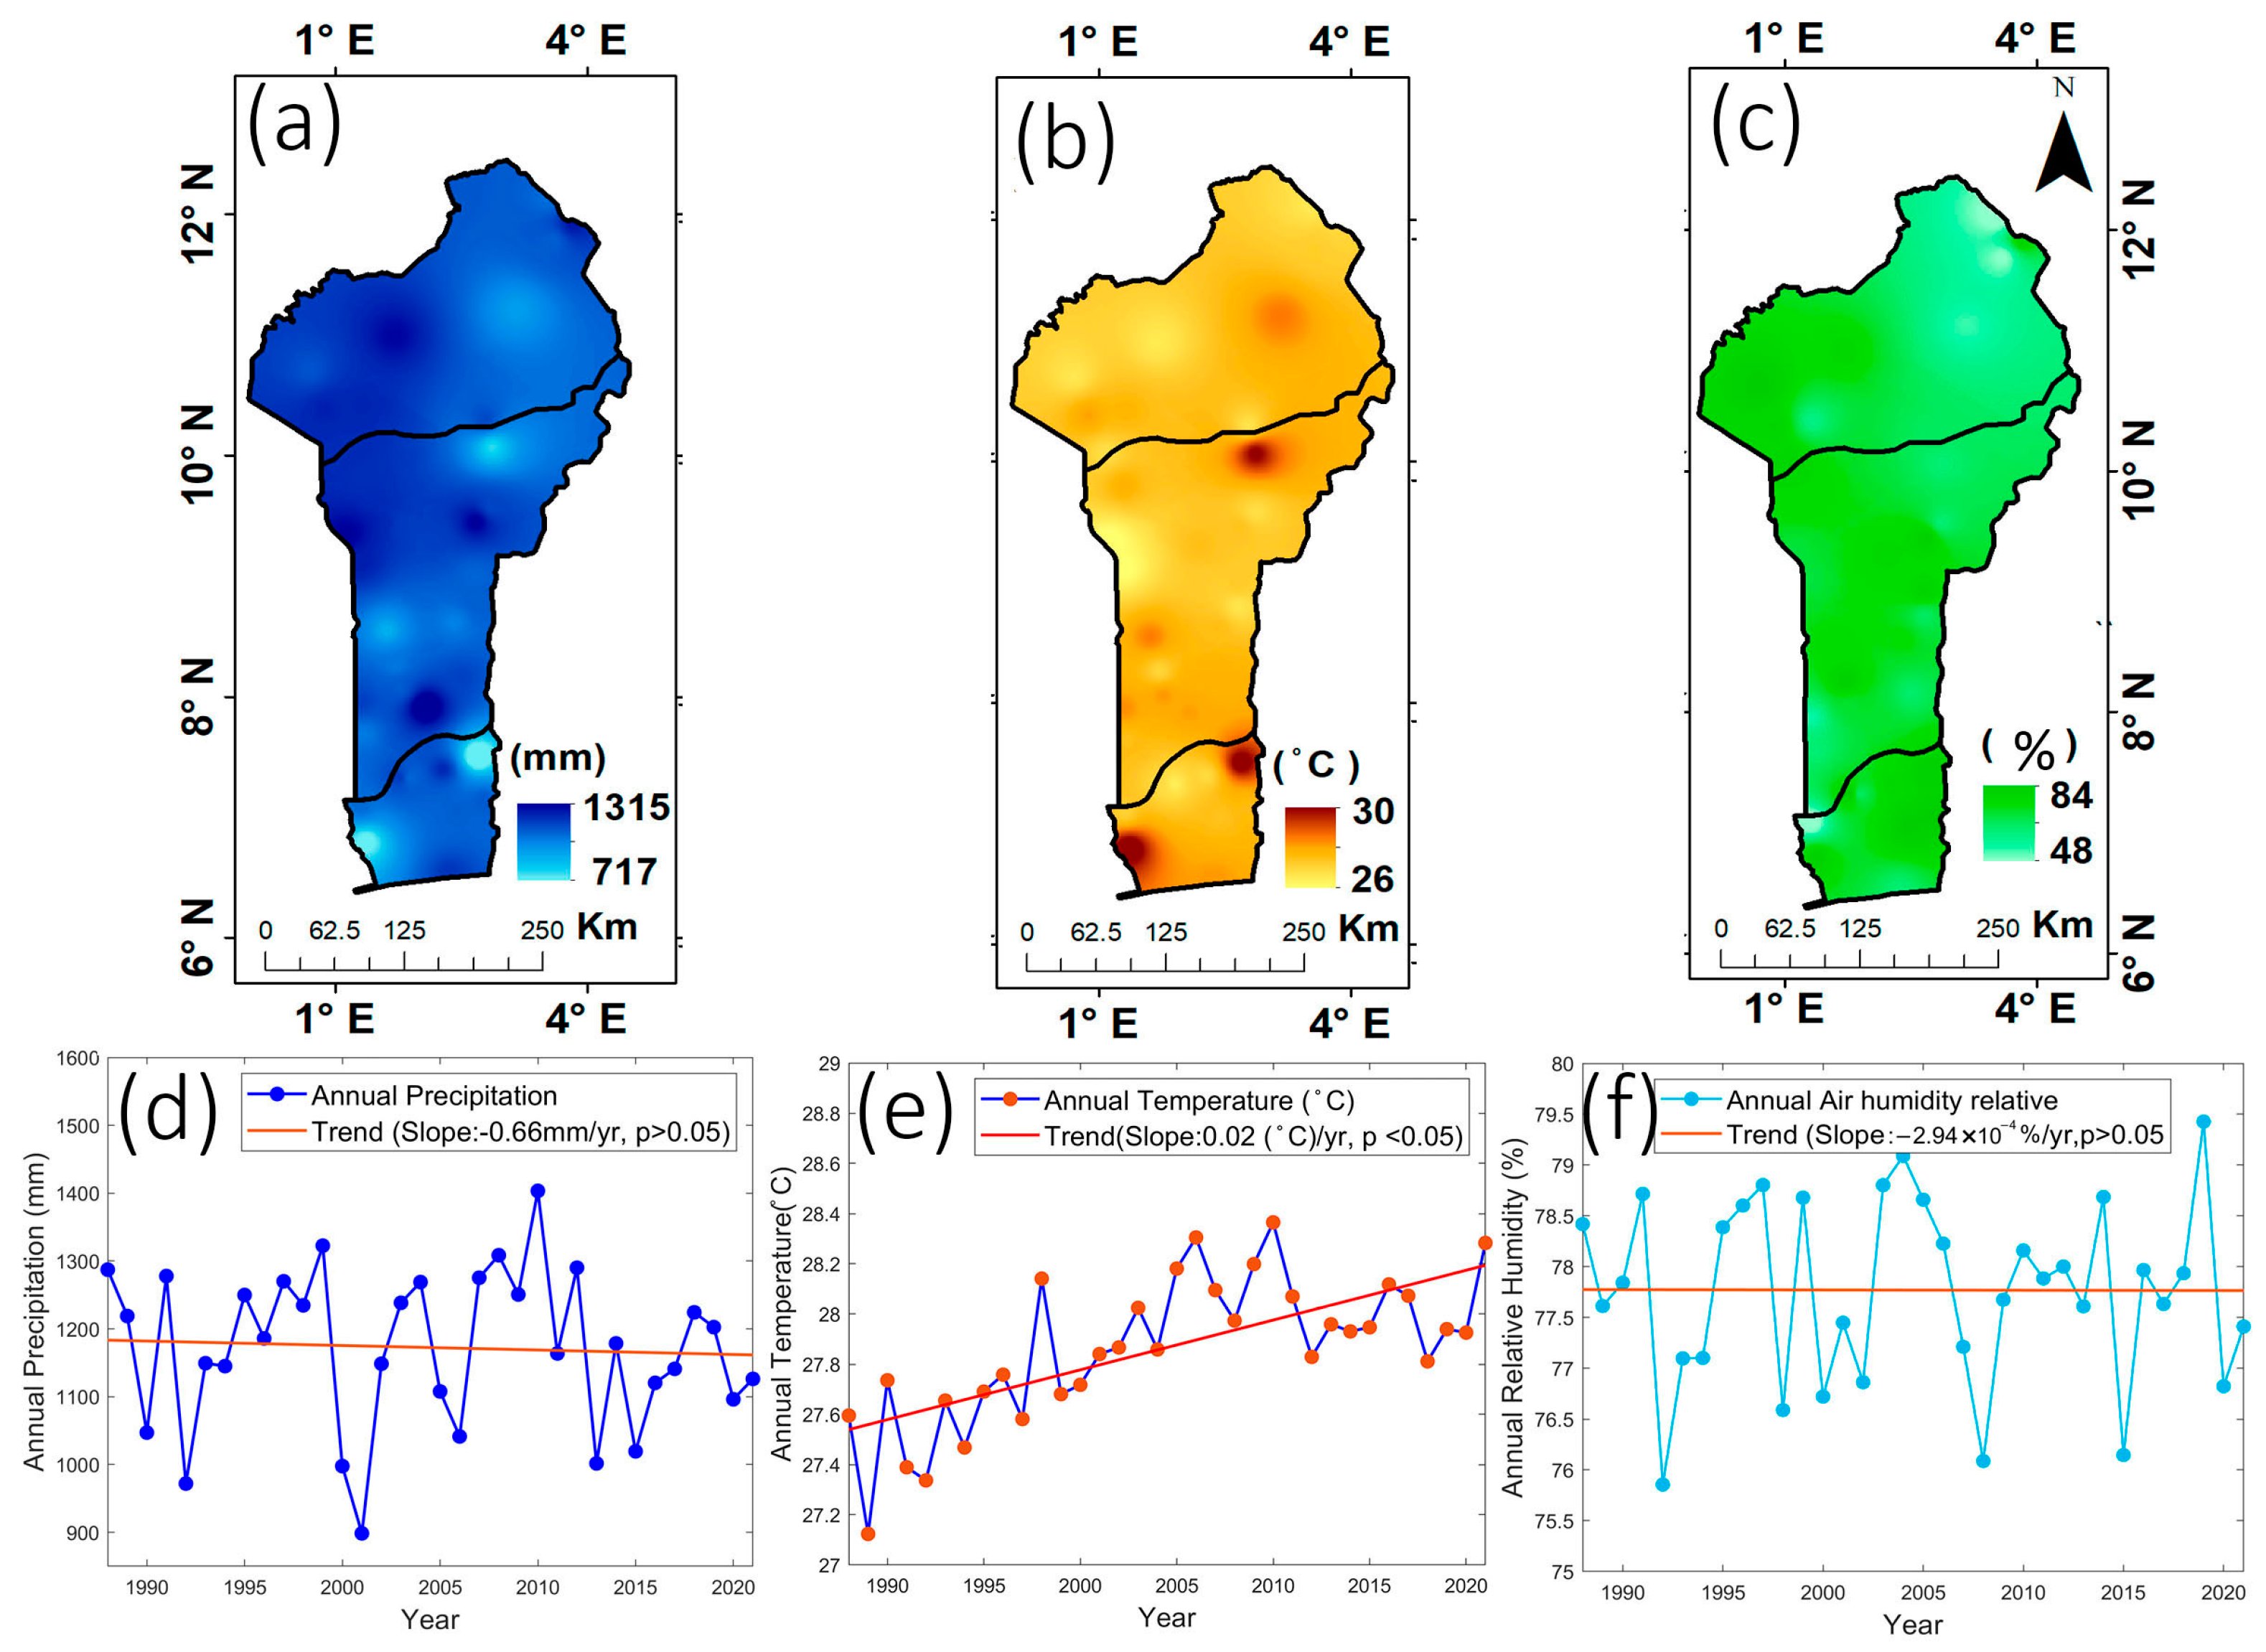
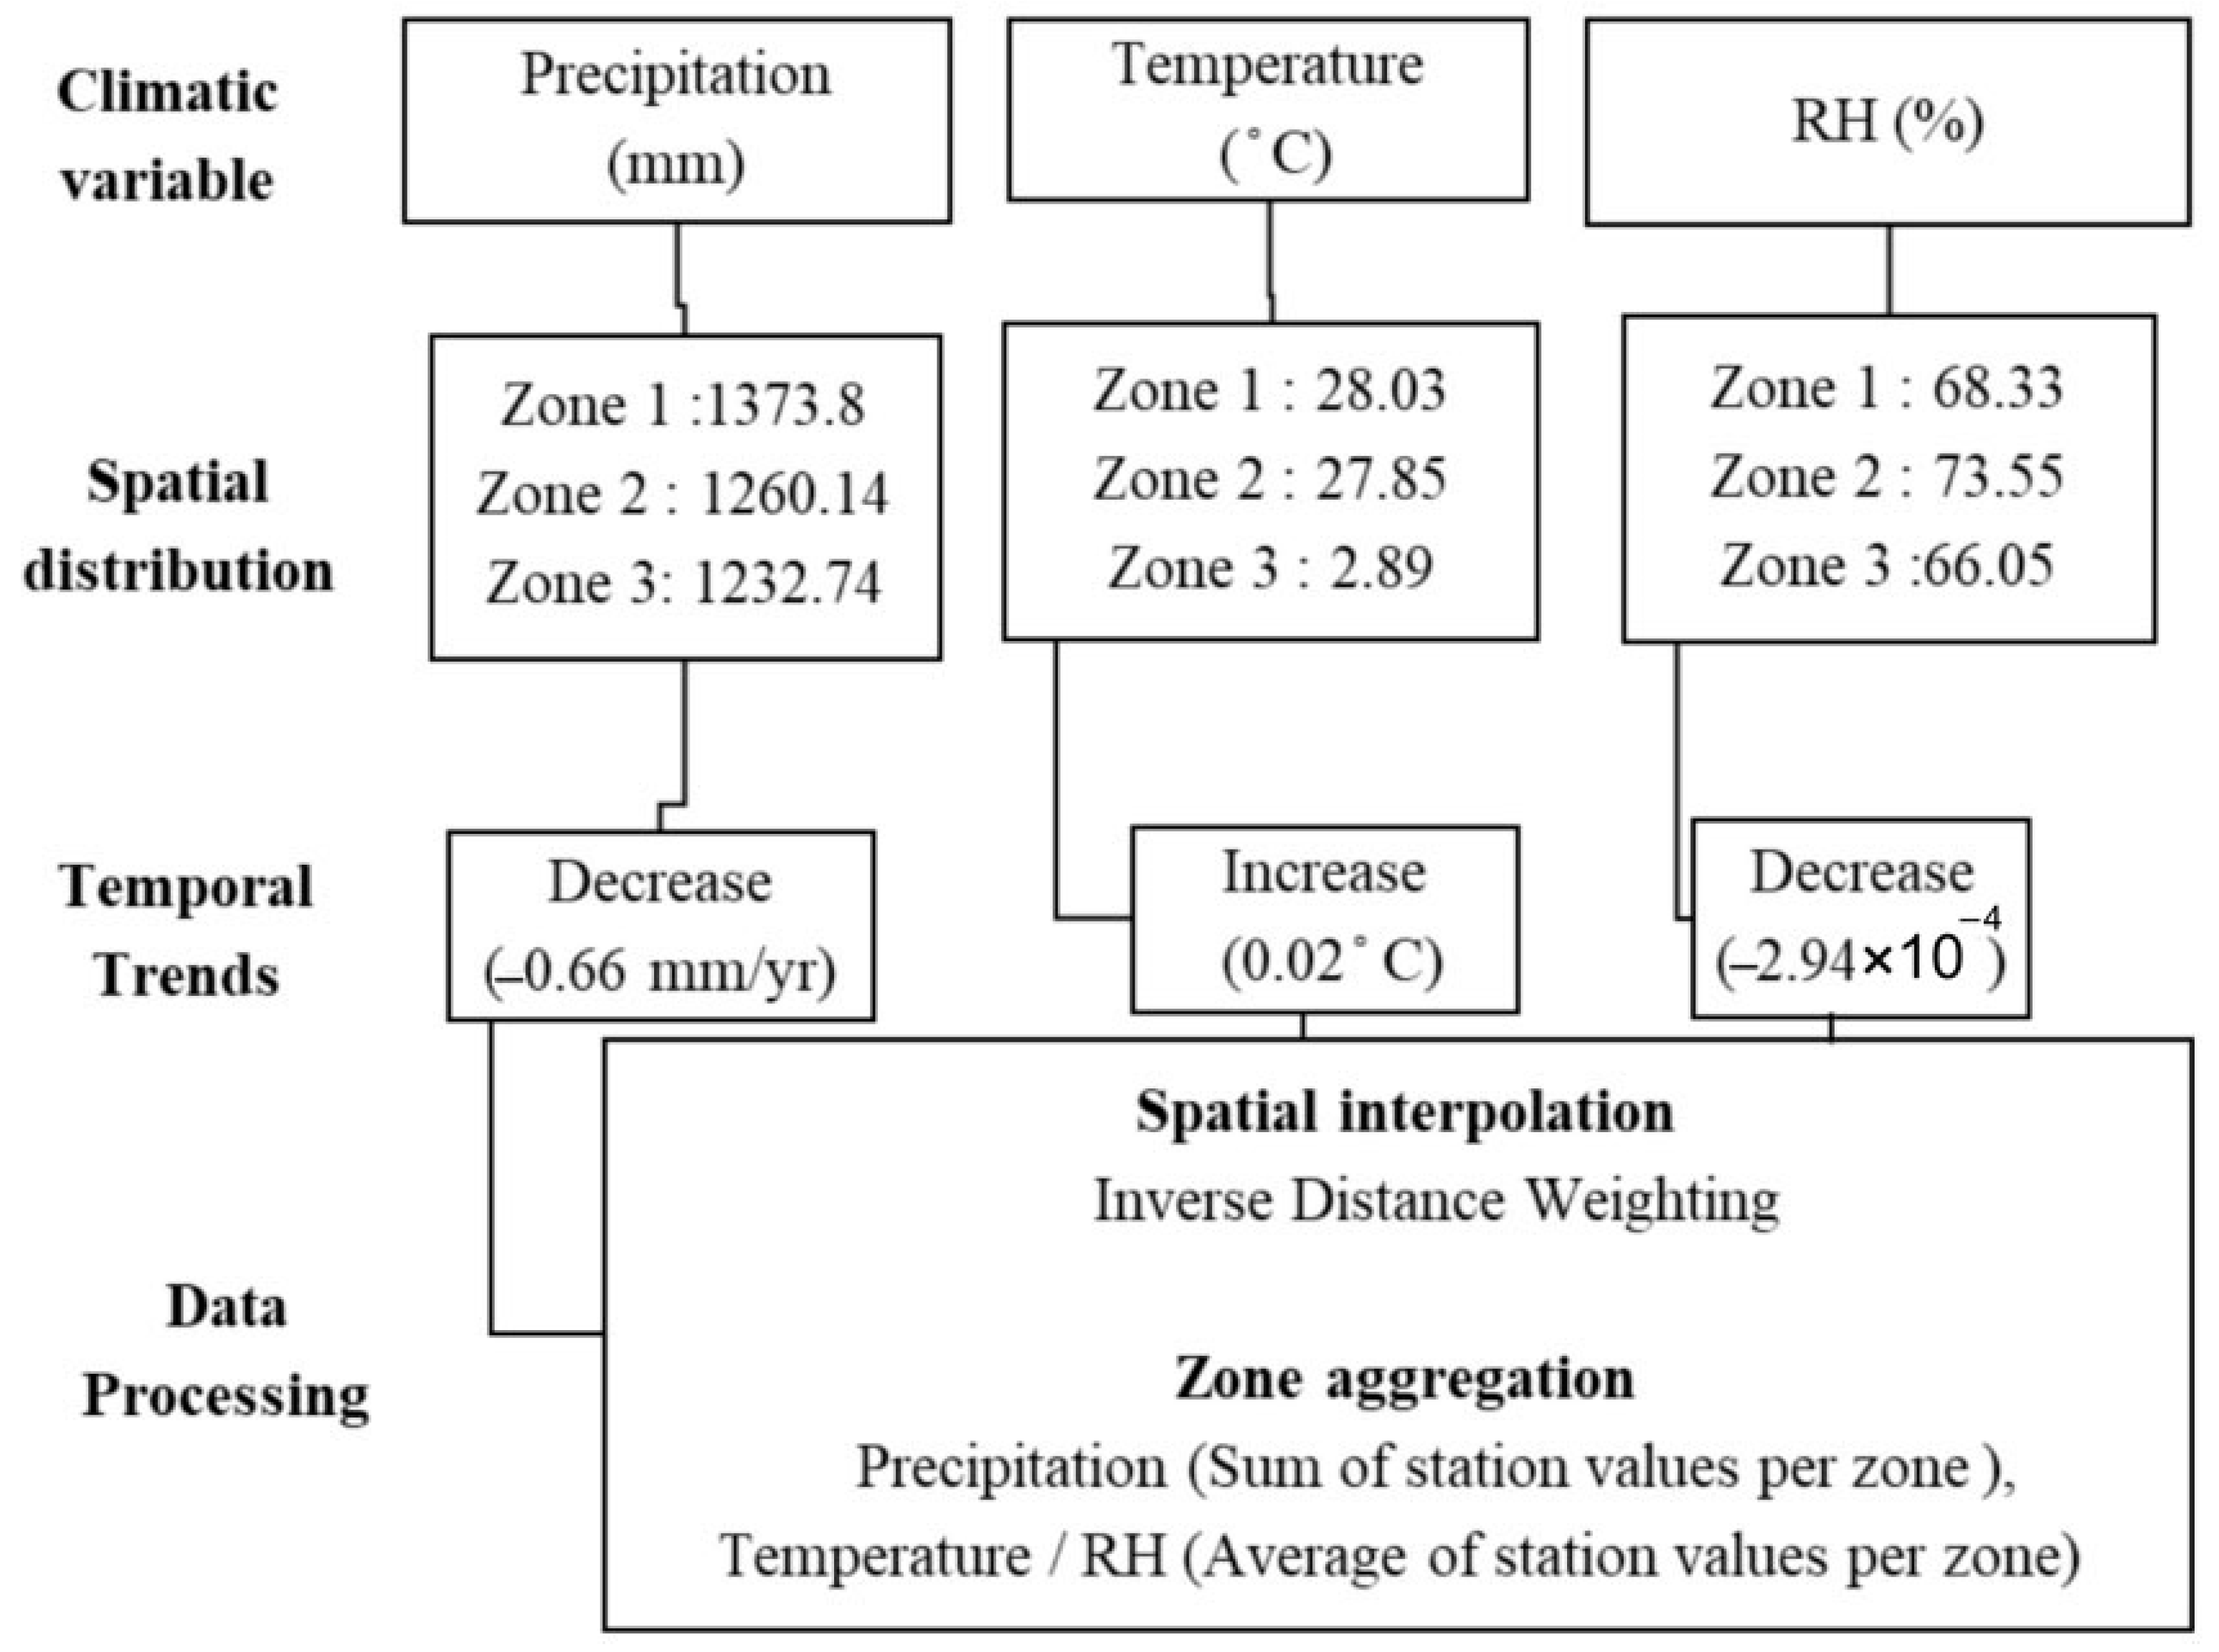
2.2. Spatial Patterns and Temporal Trends in Precipitation, Temperature, and Relative Air Humidity (RH)
2.3. Methodology
2.3.1. Data Source and Processing
2.3.2. Calculation of the SPI and SPEI
2.3.3. Mann–Kendall (MK) Trend Test
2.3.4. Duration and Intensity of Drought Events
2.3.5. The Cross-Wavelet Transform Method
2.3.6. Standardized Relative Humidity Index (SRHI)
3. Results
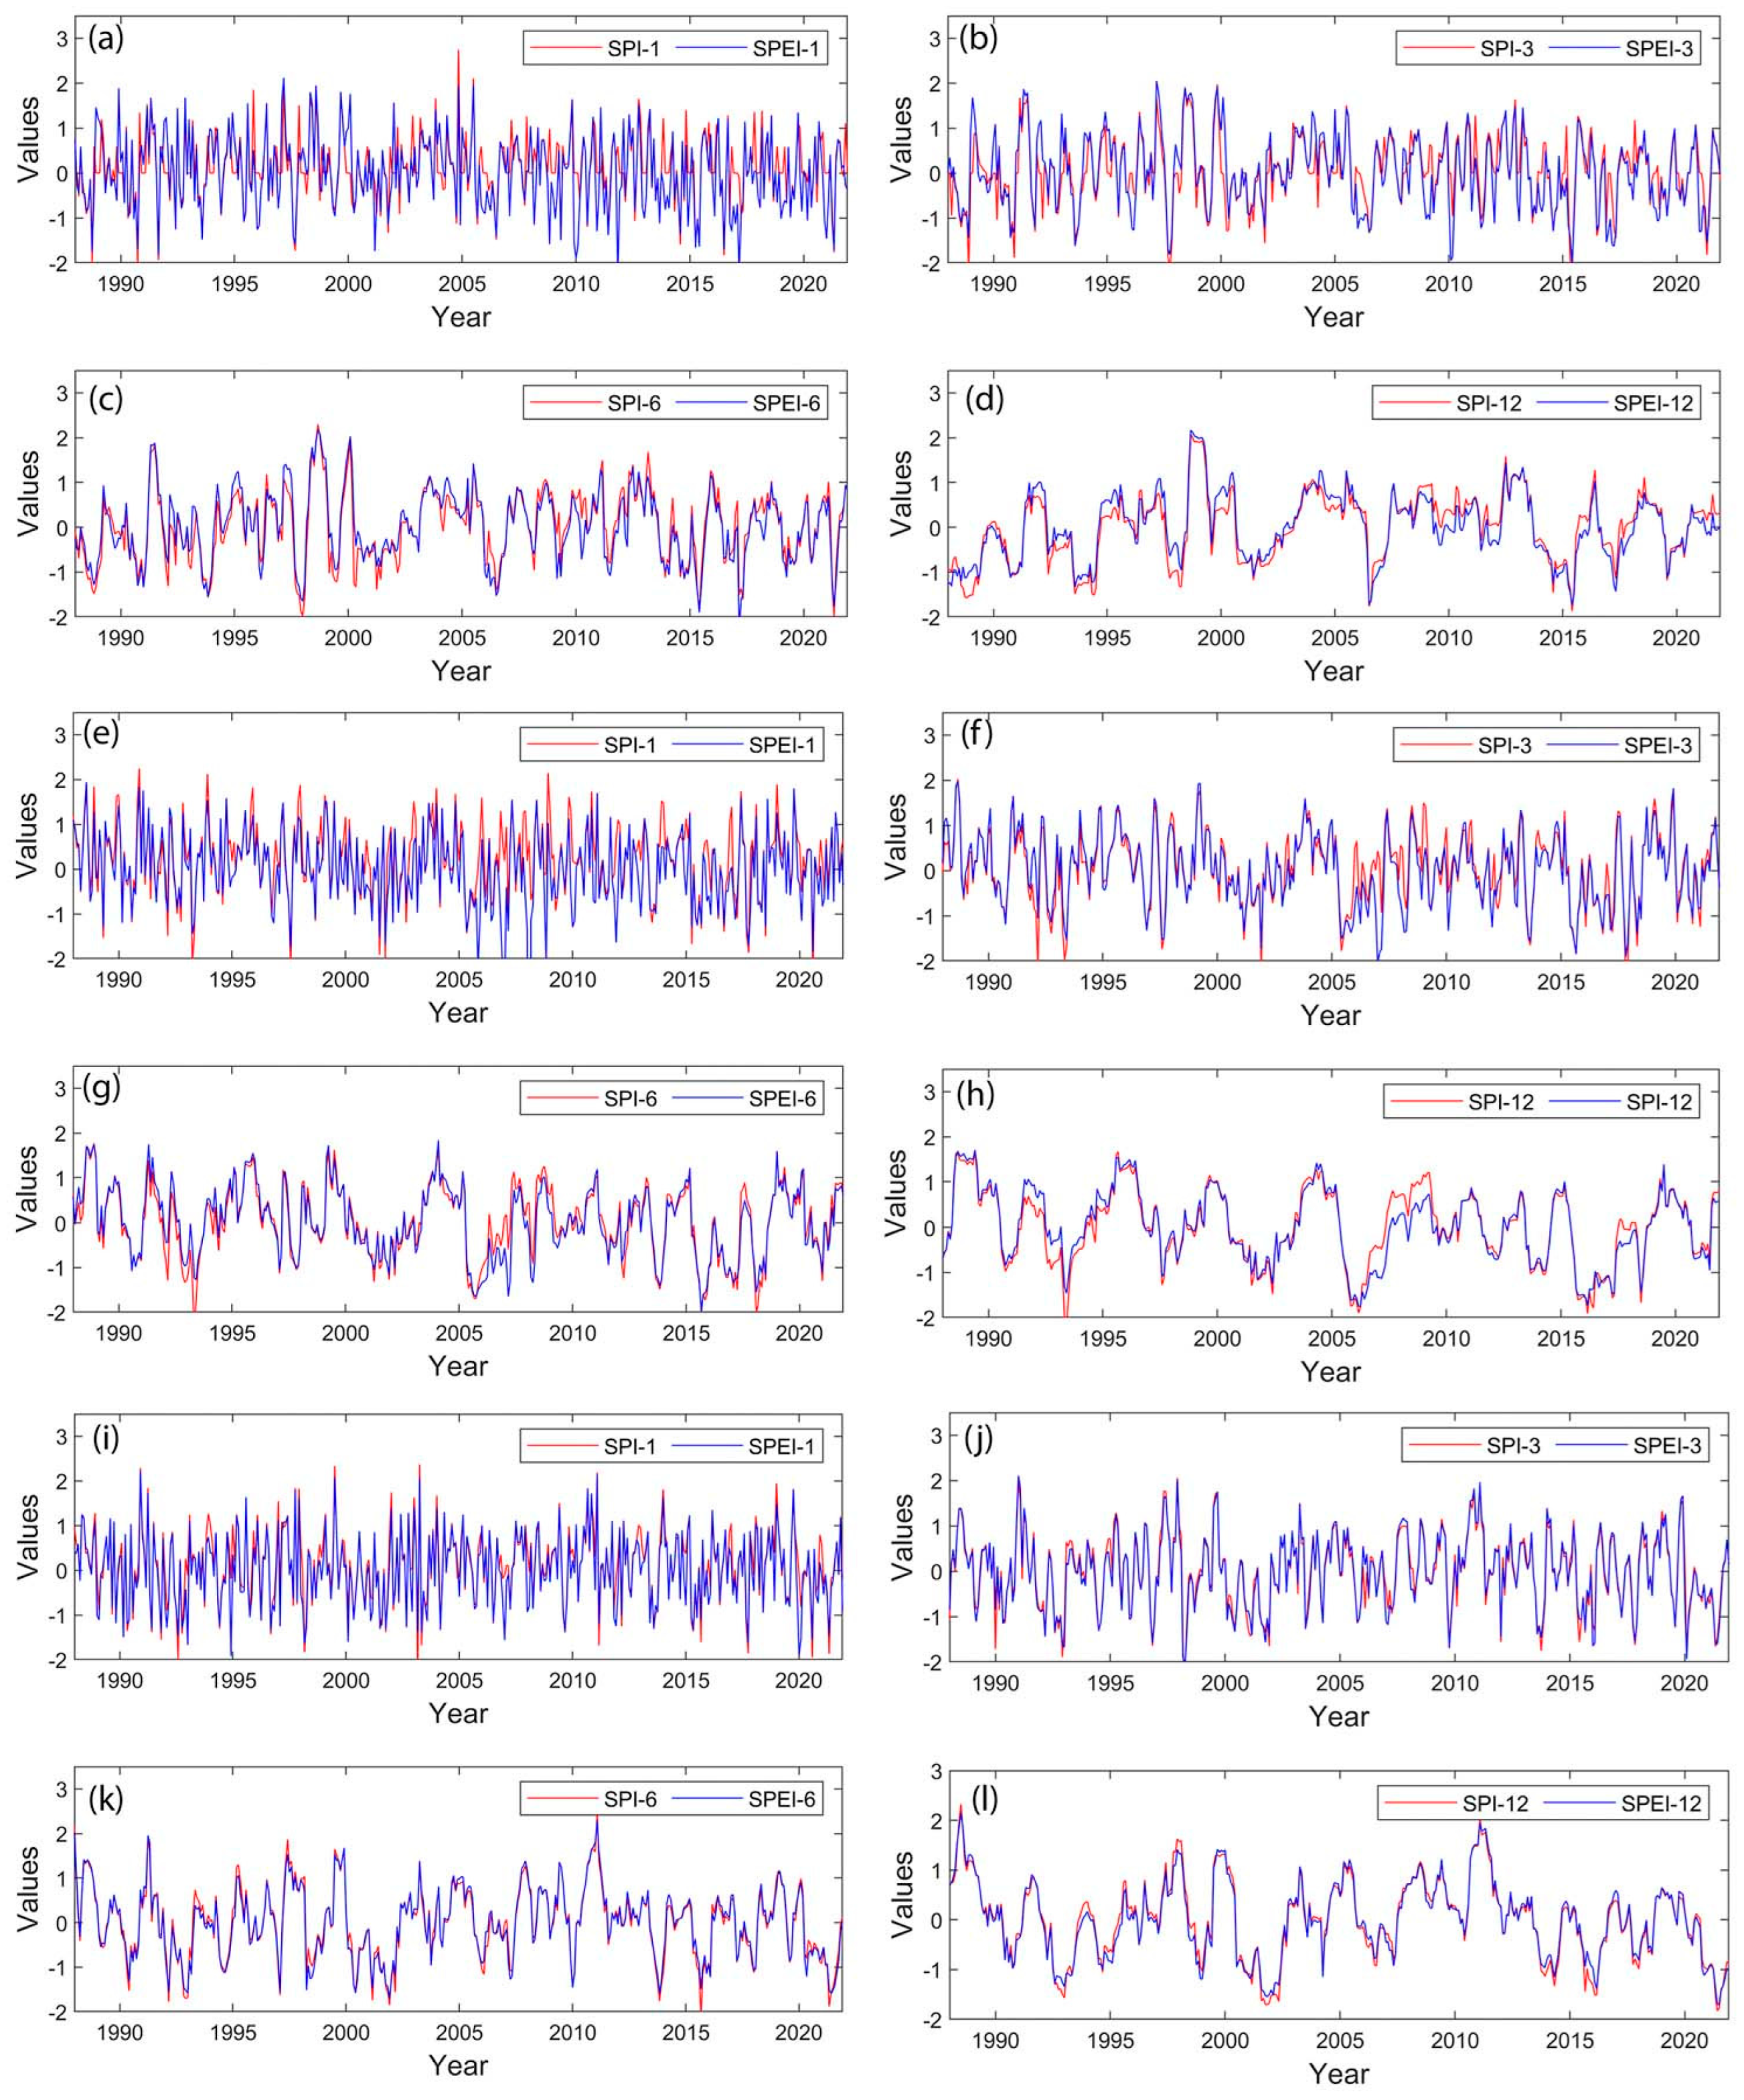
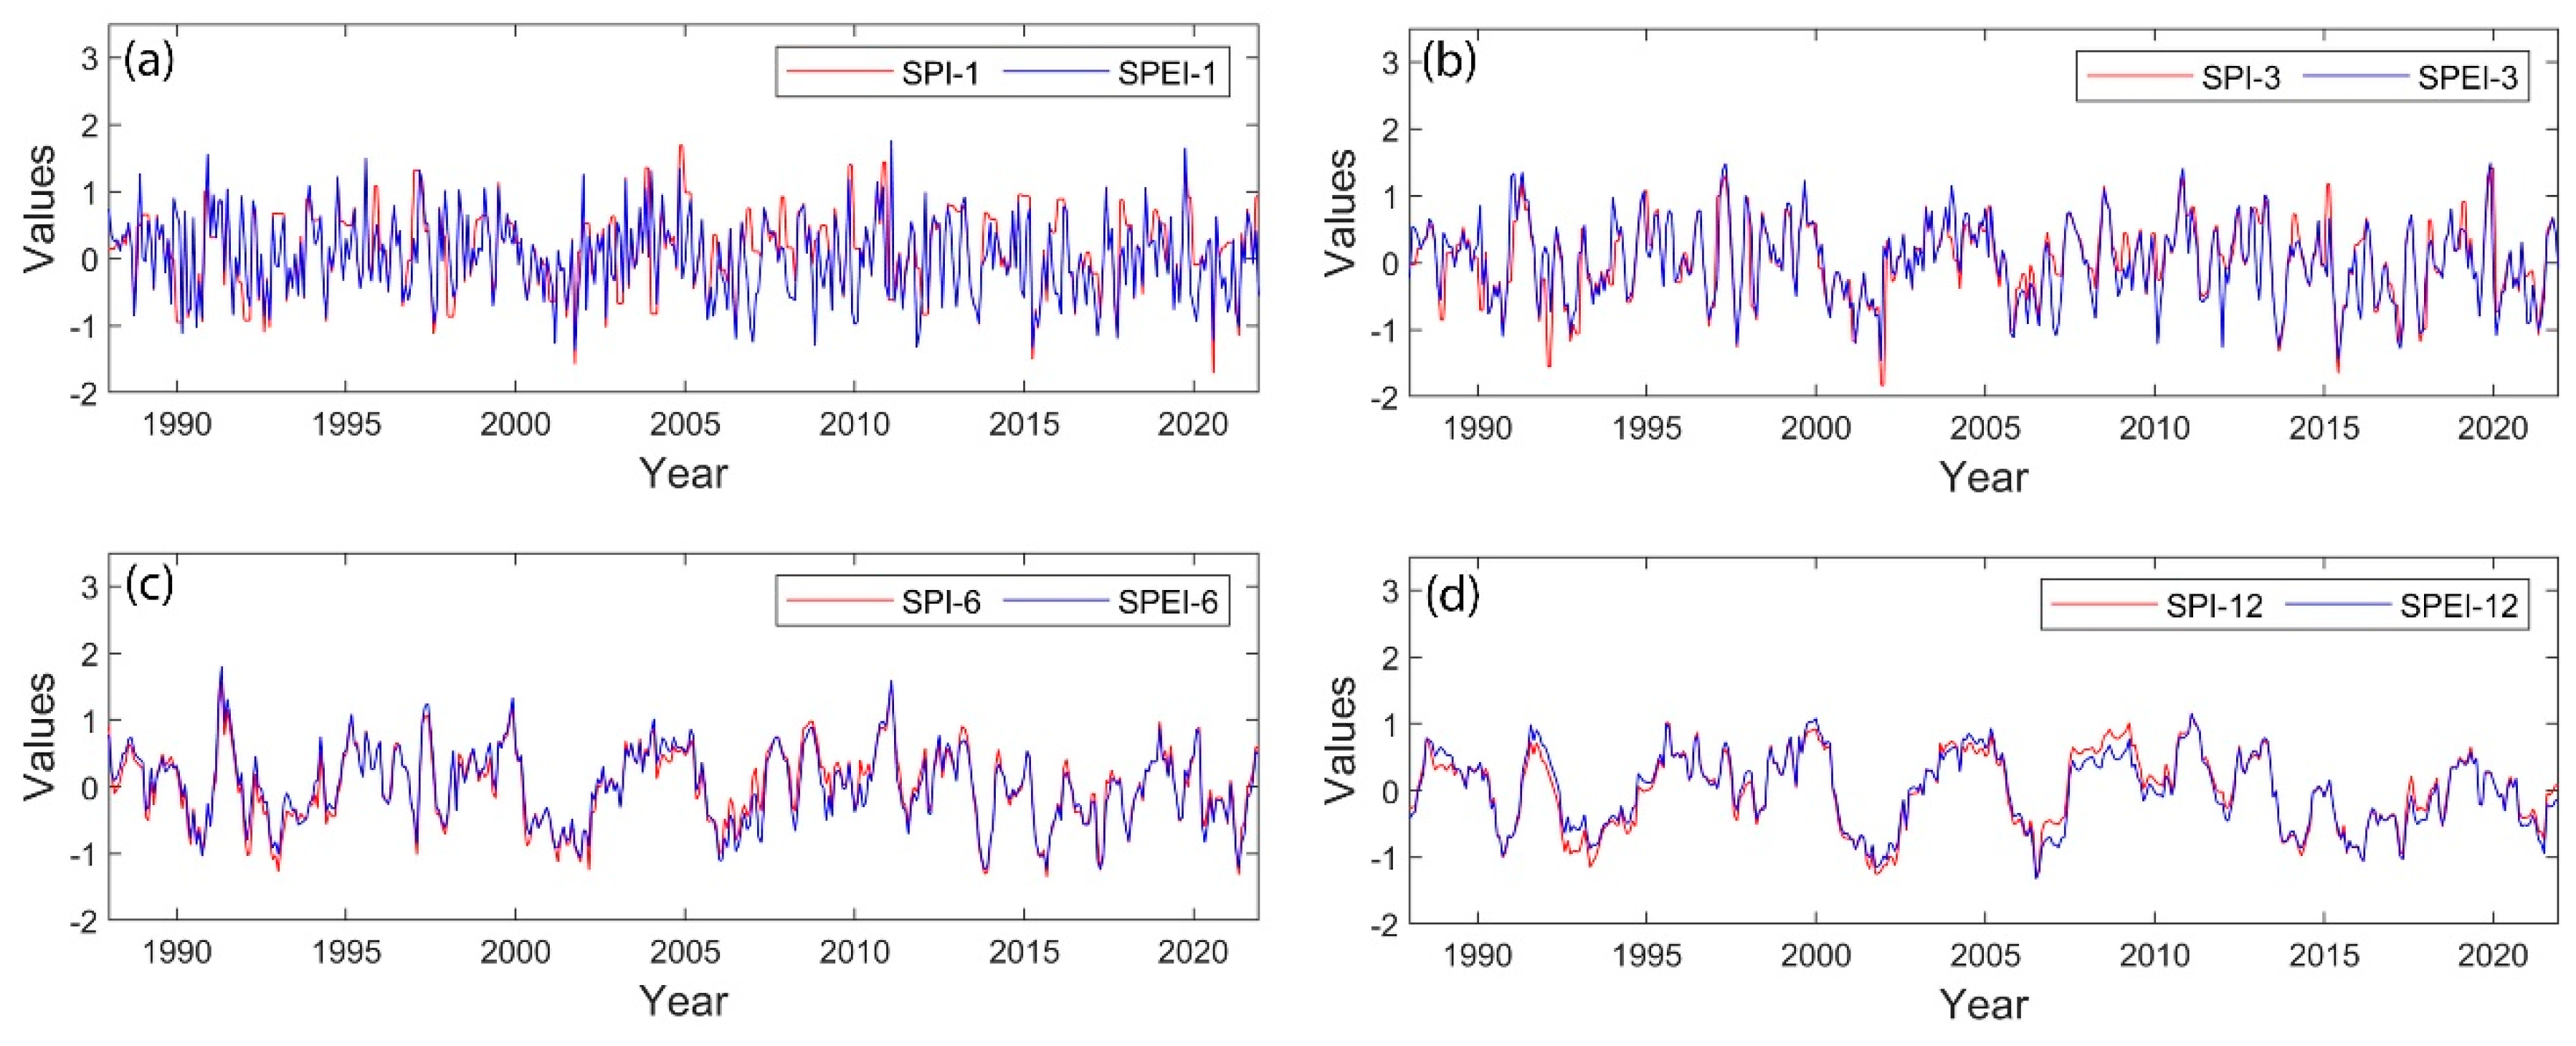
3.1. Analysis of Temporal Variations in SPI and SPEI
3.2. Man–Kendall Trend Analysis
3.3. Characteristics of Drought Events: Duration and Intensity
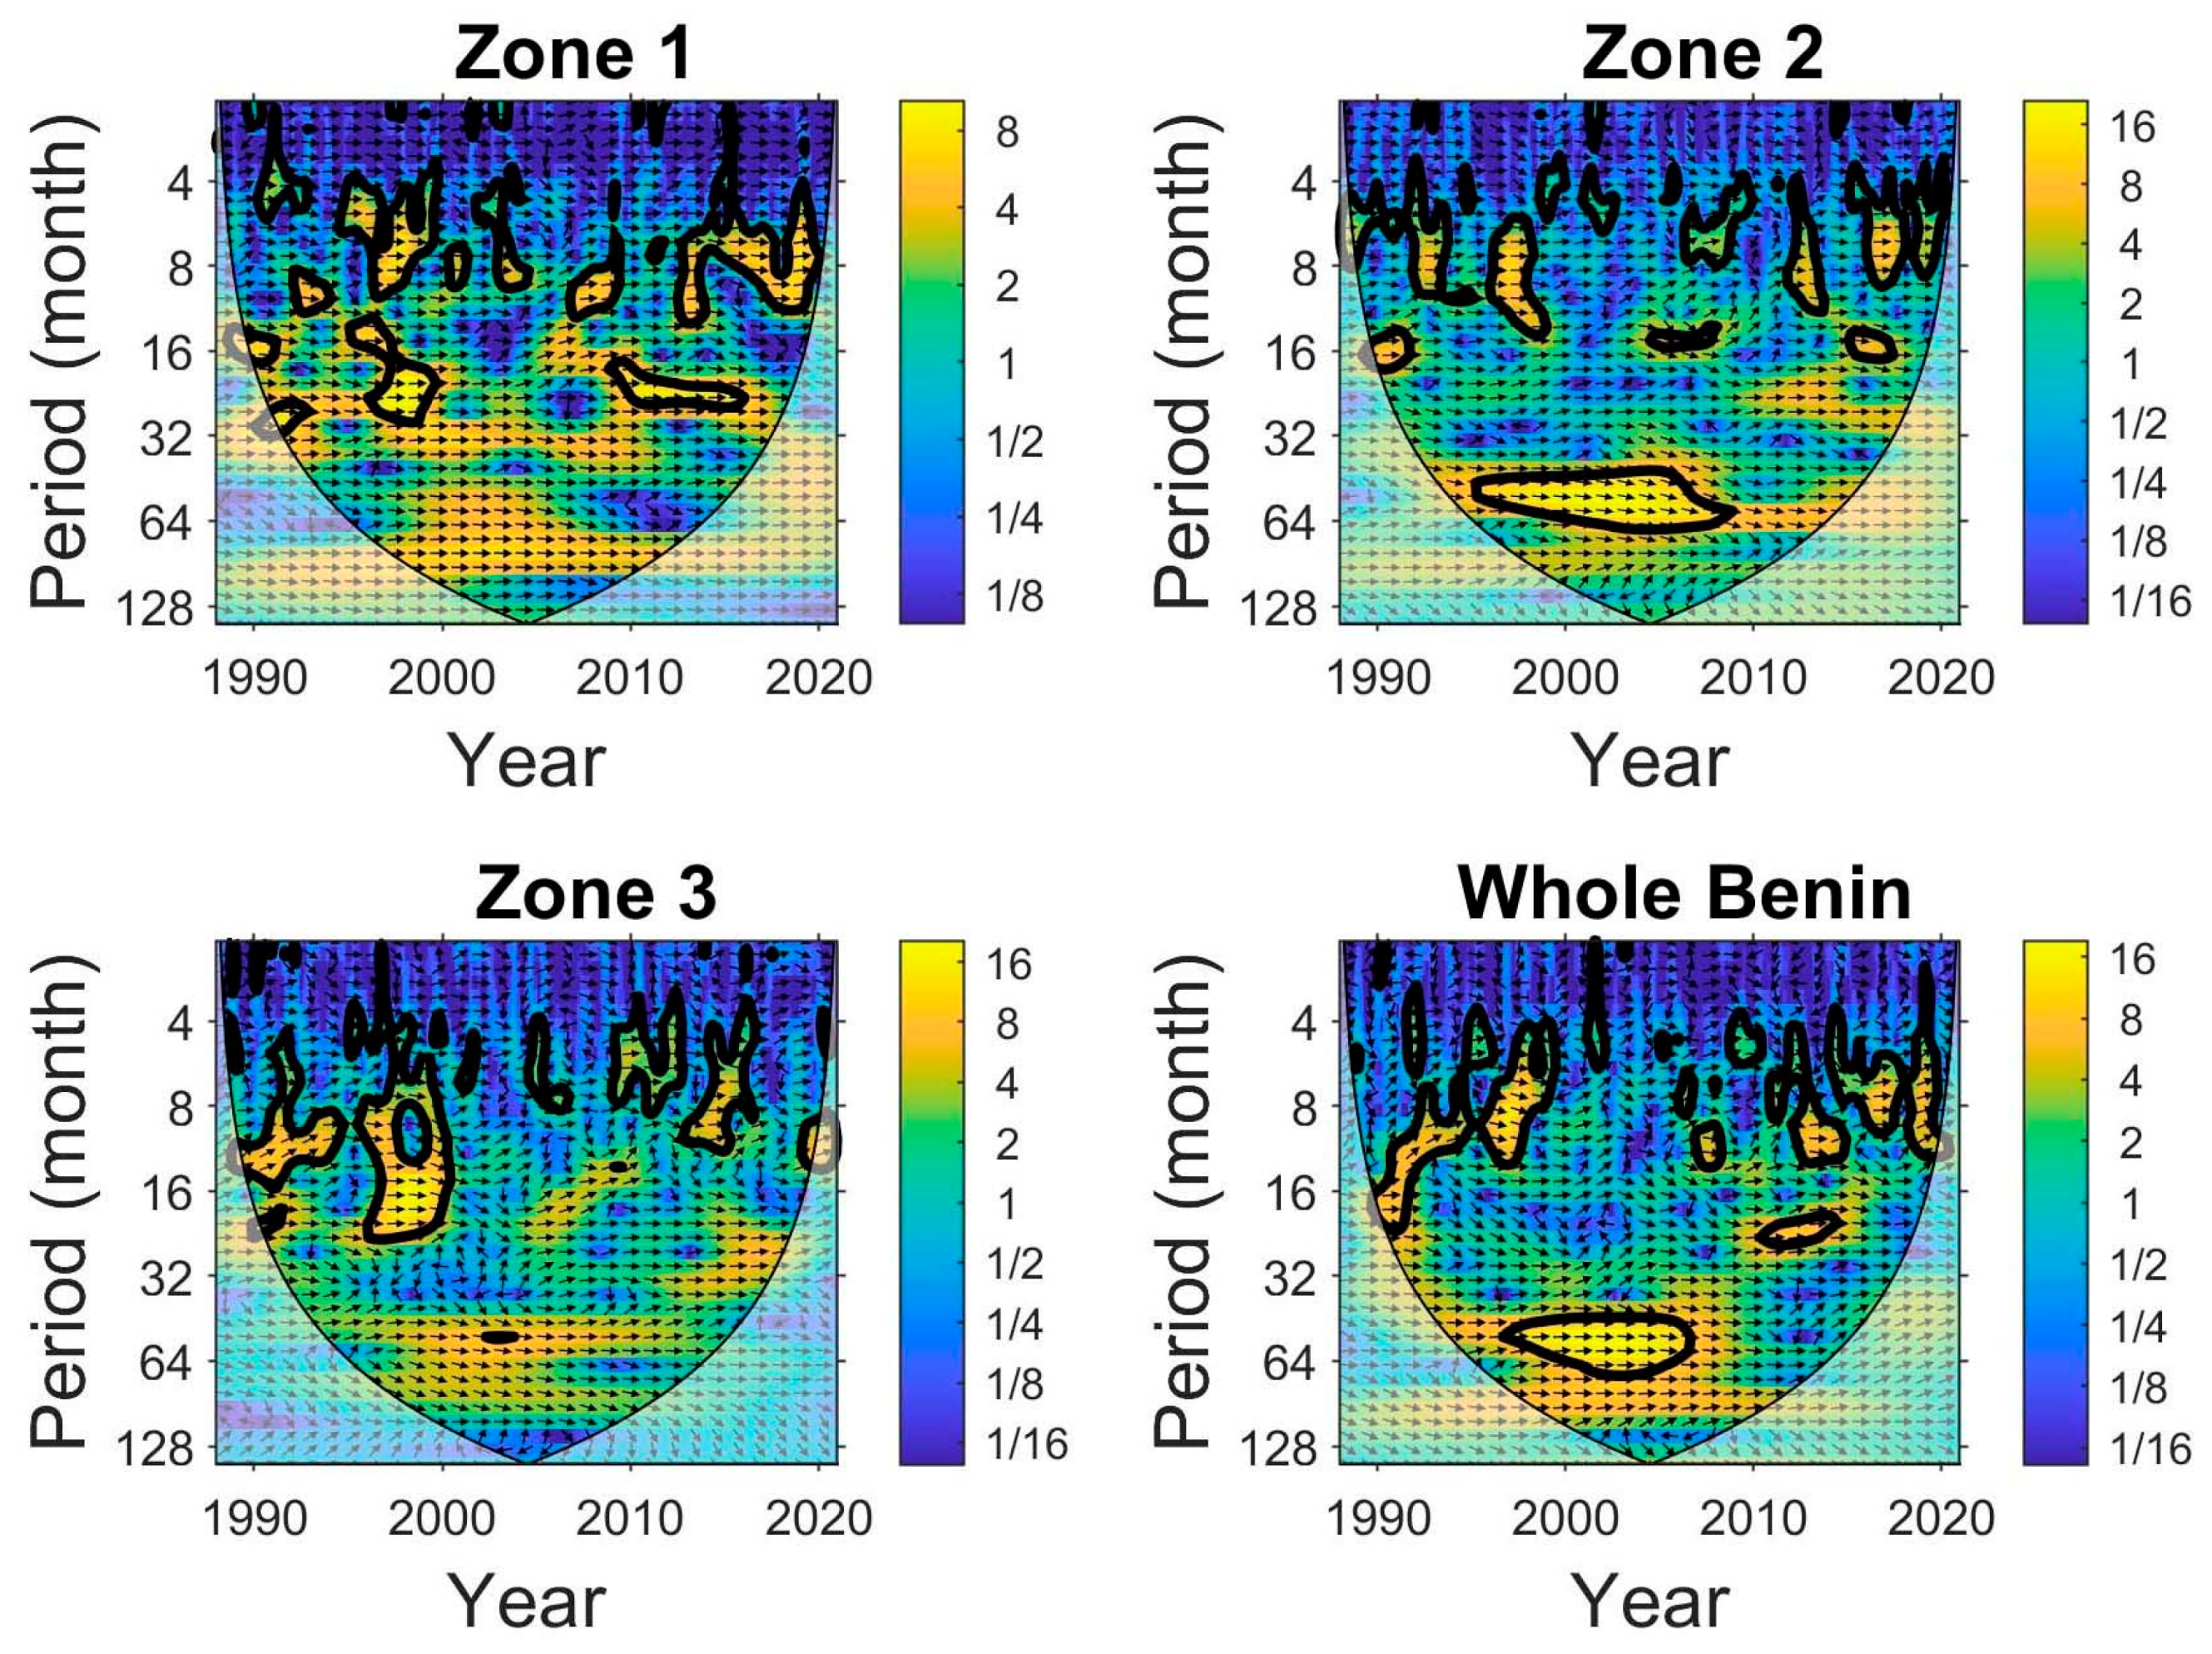
3.4. Examining the Correlation Between SPI and SPEI Using Cross-Wavelet Transform Analysis
3.5. Investigating the Correlation of SPI with SRHI and SPEI with SRHI
4. Discussion
5. Conclusions
Author Contributions
Funding
Institutional Review Board Statement
Informed Consent Statement
Data Availability Statement
Acknowledgments
Conflicts of Interest
References
- Hailesilassie, W.T.; Ayenew, T.; Tekleab, S. A Comparative Study of Drought Characteristics Using Meteorological Drought Indices over the Central Main Ethiopian Rift. Hydrol. Res. 2023, 54, 313–329. [Google Scholar] [CrossRef]
- Abu Arra, A.; Şişman, E. Characteristics of Hydrological and Meteorological Drought Based on Intensity-Duration-Frequency (IDF) Curves. Water 2023, 15, 3142. [Google Scholar] [CrossRef]
- Science, E. Exposure to Drought: Duration, Severity and Intensity (Java, Bali and Nusa Tenggara). IOP Conf. Ser. Earth Environ. Sci. 2017, 58, 012040. [Google Scholar]
- Du, J.; Fang, J.; Xu, W.; Shi, P. Analysis of Dry/Wet Conditions Using the Standardized Precipitation Index and Its Potential Usefulness for Drought/Flood Monitoring in Hunan Province, China. Stoch. Environ. Res. Risk Assess. 2013, 27, 377–387. [Google Scholar] [CrossRef]
- Liu, Y.; Yang, Y.; Song, J. Variations in Global Soil Moisture During the Past Decades: Climate or Human Causes? Water Resour. Res. 2023, 59, e2023WR034915. [Google Scholar] [CrossRef]
- Faye, C. Comparative Analysis of Meteorological Drought Based on the SPI and SPEI Indices. HighTech Innov. J. 2022, 3, 15–27. [Google Scholar] [CrossRef]
- Fuentes, I.; Padarian, J.; Vervoort, R.W. Spatial and Temporal Global Patterns of Drought Propagation. Front. Environ. Sci. 2022, 10, 788248. [Google Scholar] [CrossRef]
- Kibreab, G. Climate Change And Human Migration: A Tenuous Relationship? Fordham Environ. Law Rev. 2009, 20, 357–401. [Google Scholar]
- Ahokpossi, Y. Analysis of the Rainfall Variability and Change in the Republic of Benin (West Africa). Hydrol. Sci. J. 2019, 63, 2097–2123. [Google Scholar] [CrossRef]
- Luo, H.; Ma, Z.; Wu, H.; Li, Y.; Liu, B.; Li, Y.; He, L. Validation Analysis of Drought Monitoring Based on FY-4 Satellite. Appl. Sci. 2023, 13, 9122. [Google Scholar] [CrossRef]
- Stone, R. Agricultural Drought Indices Proceedings. In Proceedings of the an Expert Meeting, Murcia, Spain, 2–4 June 2010. [Google Scholar]
- Palmer, W. Meteorological Drought; US Weather Bureau: Washington, DC, USA, 1965. [Google Scholar]
- Beguería, S.; Vicente-Serrano, S.M.; Reig, F.; Latorre, B. Standardized Precipitation Evapotranspiration Index (SPEI) Revisited: Parameter Fitting, Evapotranspiration Models, Tools, Datasets and Drought Monitoring. Int. J. Climatol. 2014, 34, 3001–3023. [Google Scholar] [CrossRef]
- Vicente-Serrano, S.M.; Beguería, S.; López-Moreno, J.I. A Multiscalar Drought Index Sensitive to Global Warming: The Standardized Precipitation Evapotranspiration Index. J. Clim. 2010, 23, 1696–1718. [Google Scholar] [CrossRef]
- Farahmand, A.; AghaKouchak, A.; Teixeira, J. A Vantage from Space Can Detect Earlier Drought Onset: An Approach Using Relative Humidity. Sci. Rep. 2015, 5, 855. [Google Scholar] [CrossRef] [PubMed]
- Guo, E.; Liu, X.; Zhang, J.; Wang, Y.; Wang, C.; Wang, R.; Li, D. Assessing Spatiotemporal Variation of Drought and Its Impact on Maize Yield in Northeast China. J. Hydrol. 2017, 553, 231–247. [Google Scholar] [CrossRef]
- Wu, R.; Li, Q. Assessing the Soil Moisture Drought Index for Agricultural Drought Monitoring Based on Green Vegetation Fraction Retrieval Methods. Nat. Hazards 2021, 108, 499–518. [Google Scholar] [CrossRef]
- Oguntunde, P.G.; Lischeid, G.; Abiodun, B.J. Impacts of Climate Variability and Change on Drought Characteristics in the Niger River Basin, West Africa. Stoch. Environ. Res. Risk Assess. 2018, 32, 1017–1034. [Google Scholar] [CrossRef]
- Cintia, A.A.K.K.; Luc, S.O.; Maurice, A.M.; Euloge, A.K. Spatial and Temporal Variation of Rainfall from 1970 to 2016 in the Lower Ouémé Valley in Benin. Int. J. Eng. Res. Appl. 2021, 11, 27–40. [Google Scholar]
- Katipoğlu, O.M.; Acar, R.; Sengul, S. Comparison of Meteorological Indices for Drought Monitoring and Evaluating: A Case Study from Euphrates Basin, Turkey. J. Water Clim. Change 2020, 11, 29–43. [Google Scholar] [CrossRef]
- Wu, X.; Wang, P.; Ma, Y.; Gong, Y.; Wu, D.; Yang, J.; Huo, Z. Standardized Relative Humidity Index Can Be Used to Identify Agricultural Drought for Summer Maize in the Huang-Huai-Hai Plain, China. Ecol. Indic. 2021, 131, 108222. [Google Scholar] [CrossRef]
- Mostafazadeh, R.; Zabihi, M. Comparison of SPI and SPEI Indices to Meteorological Drought Assessment Using R Programming (Case Study: Kurdistan Province). J. Earth Sp. Phys. 2016, 42, 633–643. [Google Scholar]
- Pei, Z.; Fang, S.; Wang, L.; Yang, W. Comparative Analysis of Drought Indicated by the SPI and SPEI at Various Timescales in Inner Mongolia, China. Water 2020, 12, 1925. [Google Scholar] [CrossRef]
- Ojha, S.S.; Singh, V.; Roshni, T. Comparison of Meteorological Drought Using SPI and SPEI. Civ. Eng. J. 2021, 7, 2130–2149. [Google Scholar] [CrossRef]
- Uddin, J.; Hu, J.; Reza, A.; Islam, T. A Comprehensive Statistical Assessment of Drought Indices to Monitor Drought Status in Bangladesh. Arab. J. Geosci. 2020, 13, 323. [Google Scholar] [CrossRef]
- Oguntunde, P.G.; Abiodun, B.J.; Lischeid, G. Impacts of Climate Change on Hydro-Meteorological Drought over the Volta Basin, West Africa. Glob. Planet. Change 2017, 155, 121–132. [Google Scholar] [CrossRef]
- Ajayi, V.O.; Ilori, O.W. Projected Drought Events over West Africa Using RCA4 Regional Climate Model. Earth Syst. Environ. 2020, 4, 329–348. [Google Scholar] [CrossRef]
- Dibi-Anoh, P.A.; Koné, M.; Gerdener, H.; Kusche, J.; N’Da, C.K. Hydrometeorological Extreme Events in West Africa: Droughts. Surv. Geophys. 2023, 44, 173–195. [Google Scholar] [CrossRef]
- Ogolo, E.O.; Ojo, O.S.; Akinwande, D.D. Comparative Analysis of Characteristics of Drought over Some West Africa Regions Based On Selected Drought Assessment Indices. J. Appl. Sci. Environ. Manag. 2024, 28, 1781–1788. [Google Scholar] [CrossRef]
- Akinwande, D.; Ogolo, E.; Ojo, O. West Africa’s Drought Dynamics: An Investigation of Spi and Spei Indices (1979–2021). Int. J. Phys. Res. Appl. 2024, 7, 108–118. [Google Scholar] [CrossRef]
- Zarei, A.R.; Shabani, A.; Moghimi, M.M. Accuracy Assessment of the SPEI, RDI and SPI Drought Indices in Regions of Iran with Different Climate Conditions. Pure Appl. Geophys. 2021, 178, 1387–1403. [Google Scholar] [CrossRef]
- Dikici, M.; Aksel, M. Comparison of Spi, Spei and Sri Drought Indices for Seyhan Basin. Int. J. Electron. Mech. Mechatron. Eng. 2019, 9, 1751–1762. [Google Scholar]
- Lee, S.; Moriasi, D.N.; Danandeh Mehr, A.; Mirchi, A. Sensitivity of Standardized Precipitation and Evapotranspiration Index (SPEI) to the Choice of SPEI Probability Distribution and Evapotranspiration Method. J. Hydrol. Reg. Stud. 2024, 53, 101761. [Google Scholar] [CrossRef]
- Titilope Oyerinde, G.; Olowookere, T. Observed Shift and Merge of Hydrological Regimes in the Sota Catchment, Benin; Evidence of Climate Change. Artic. Int. J. Res. 2018, 6, 205–211. [Google Scholar]
- Liu, C.; Yang, C.; Yang, Q.; Wang, J. Spatiotemporal Drought Analysis by the Standardized Precipitation Index (SPI) and Standardized Precipitation Evapotranspiration Index (SPEI) in Sichuan Province, China. Sci. Rep. 2021, 11, 1–14. [Google Scholar] [CrossRef] [PubMed]
- Peng, L.; Sheffield, J.; Wei, Z.; Ek, M.; Wood, E.F. An Enhanced Standardized Precipitation-Evapotranspiration Index (SPEI) Drought-Monitoring Method Integrating Land Surface Characteristics. Earth Syst. Dyn. 2024, 15, 1277–1300. [Google Scholar] [CrossRef]
- Gnanglè, C.P.; Glèlè Kakaï, R.; Assogbadjo, A.E.; Vodounnon, S.; Yabi, J.A.; Sokpon, N. Tendances Climatiques Passées, Modélisation, Perceptions et Adaptations Locales Au Benin. Climatologie 2011, 8, 27–40. [Google Scholar] [CrossRef]
- Toko Imorou, I. Spatial Distribution and Ecological Niche Modelling of Triplochiton Scleroxylon K. Schum., in the Guineo-Congolese Region of Benin (West Africa). Int. J. Biol. Chem. Sci. 2020, 14, 32–44. [Google Scholar] [CrossRef]
- Tahir, Z.; Haseeb, M.; Mahmood, S.A.; Batool, S.; Abdullah-Al-Wadud, M.; Ullah, S.; Tariq, A. Predicting Land Use and Land Cover Changes for Sustainable Land Management Using CA-Markov Modelling and GIS Techniques. Sci. Rep. 2025, 15, 3271. [Google Scholar] [CrossRef]
- Vicente-Serrano, S.M.; Gouveia, C.; Julio, J.; Beguería, S.; Trigo, R.; López-Moreno, J.I.; Azorín-Molina, C.; Pasho, E.; Lorenzo-Lacruz, J.; Revuelto, J.; et al. Response of Vegetation to Drought Time-Scales across Global Land Biomes. Proc. Natl. Acad. Sci. USA 2012, 110, 52–57. [Google Scholar] [CrossRef]
- Hargreaves, G.H.; Samani, Z.A. Reference Crop Evapotranspiration from Temperature. Appl. Eng. Agric. 1985, 1, 96–99. [Google Scholar] [CrossRef]
- He, Q.; Wang, M.; Liu, K.; Wang, B. High-Resolution Standardized Precipitation Evapotranspiration Index (SPEI) Reveals Trends in Drought and Vegetation Water Availability in China. Geogr. Sustain. 2025, 6, 100228. [Google Scholar] [CrossRef]
- Tan, C.; Yang, J.; Li, M. Temporal-Spatial Variation of Drought Indicated by SPI and SPEI in Ningxia Hui Autonomous Region, China. Atmosphere 2015, 6, 1399–1421. [Google Scholar] [CrossRef]
- Lawin, A.E.; Hounguè, N.R.; Biaou, C.A.; Badou, D.F. Statistical Analysis of Recent and Future Rainfall and Temperature Variability in the Mono River Watershed (Benin, Togo). Climate 2019, 7, 8. [Google Scholar] [CrossRef]
- Ogunrinde, A.T.; Oguntunde, P.G.; Akinwumiju, A.S.; Fasinmirin, J.T.; Adawa, I.S.; Ajayi, T.A. Effects of Climate Change and Drought Attributes in Nigeria Based on RCP 8.5 Climate Scenario. Phys. Chem. Earth Parts A/B/C 2023, 129, 103339. [Google Scholar] [CrossRef]
- Wang, X.; Zhuo, L.; Li, C.; Engel, B.A.; Sun, S.; Wang, Y. Temporal and Spatial Evolution Trends of Drought in Northern Shaanxi of China: 1960–2100. Theor. Appl. Climatol. 2019, 139, 965–979. [Google Scholar] [CrossRef]
- Grinsted, A.; Moore, J.C.; Jevrejeva, S. Application of the Cross Wavelet Transform and Wavelet Coherence to Geophysical Time Series Nonlinear Processes in Geophysics Application of the Cross Wavelet Transform and Wavelet Coherence to Geophysical Time Series. Eur. Geosci. Union 2004, 11, 561–566. [Google Scholar]
- Wang, F.; Wang, Z.; Yang, H.; Di, D.; Zhao, Y.; Liang, Q. Utilizing GRACE-Based Groundwater Drought Index for Drought Characterization and Teleconnection Factors Analysis in the North China Plain. J. Hydrol. 2020, 585, 124849. [Google Scholar] [CrossRef]
- Hounkpè, J.; Diekkrüger, B.; Badou, D.F.; Afouda, A.A. Change in Heavy Rainfall Characteristics over the Ouémé River Basin, Benin Republic, West Africa. Climate 2016, 4, 15. [Google Scholar] [CrossRef]
- Whannou, H.R.V.; Afatondji, C.U.; Ahozonlin, M.C.; Spanoghe, M.; Lanterbecq, D.; Demblon, D.; Houinato, M.R.B.; Dossa, L.H. Morphological Variability within the Indigenous Sheep Population of Benin. PLoS ONE 2021, 16, e0258761. [Google Scholar] [CrossRef]
- Wang, L.; Yu, H.; Yang, M.; Yang, R.; Gao, R.; Wang, Y. A Drought Index: The Standardized Precipitation Evapotranspiration Runoff Index. J. Hydrol. 2019, 571, 651–668. [Google Scholar] [CrossRef]
- Wu, W. Application de La Geomatique Au Suivi de La Dynamique Environnementale En Zones Arides; Sciences de l’Homme et Société; Université Panthéon-Sorbonne—Paris I: Paris, France, 2003. [Google Scholar]
- Bey, T.; Bodley, A.; Bowman, T.; Carr, S.M.; Cocchi, M.; Ebongom, J.; Etukeren, M.; Fombang, M.; Gasanbekova, A.; Gassikia, G.; et al. Africa. In Climate Change 2022: Impacts, Adaptation and Vulnerability. Contribution of Working Group II to the Sixth Assessment Report of the Intergovernmental Panel on Climate Change; Cambridge University Press: Cambridge, UK; New York, NY, USA, 2023; pp. 1285–1455. [Google Scholar] [CrossRef]
- Adeyeri, O.E.; Lamptey, B.L.; Lawin, A.E.; Sanda, I.S. Spatio-Temporal Precipitation Trend and Homogeneity Analysis in Komadugu-Yobe Basin, Lake Chad Region. J. Climatol. Weather Forecast. 2017, 5, 3. [Google Scholar]
- Nicholson, S.E.; Some, B.; Kone, B. An Analysis of Recent Rainfall Conditions in West Africa, Including the Rainy Seasons of the 1997 El Nino and the 1998 La Nina Years. J. Clim. 2000, 13, 2628–2640. [Google Scholar] [CrossRef]


| Zones | Trend (Year−1) | Z | P | Sen’s Slope | |
|---|---|---|---|---|---|
| Precipitation | Zone 1 | 0.09000614 | 1.39349767 | 0.16346935 | 0.0843 |
| Zone 2 | −0.06952210 | −0.5929777 | 0.55319605 | −0.0838 | |
| Zone 3 | −0.03985643 | −0.2964888 | 0.76685677 | −0.079 | |
| Temperature | Zone 1 | 0.02339217 | 5.30715071 | 0.00000011 | 0.0124 |
| Zone 2 | 0.03364282 | 4.65487520 | 0.00000324 | 0.0326 | |
| Zone 3 | 0.01186139 | 2.10507095 | 0.03528513 | 0.0235 |
| SPI | Trend (Year−1) | Z | P | SPEI | Trend (Year−1) | Z | P | |
|---|---|---|---|---|---|---|---|---|
| Zone 1 | SPI-1 | 0.000286 | 1.398 | 0.162 | SPEI-1 | −0.00105 | −2.873 | 0.004 |
| SPI-3 | 0.000602 | 1.968 | 0.048 | SPEI-3 | −0.00085 | −2.387 | 0.016 | |
| SPI-6 | 0.000979 | 2.785 | 0.005 | SPEI-6 | −0.00014 | −0.413 | 0.679 | |
| SPI-12 | 0.001554 | 4.916 | 0.000 | SPEI-12 | 0.000432 | 1.1987 | 0.230 | |
| Zone 2 | SPI-1 | −0.00016 | −0.618 | 0.535 | SPEI-1 | −0.00104 | −2.988 | 0.002 |
| SPI-3 | −0.00040 | −1.196 | 0.231 | SPEI-3 | −0.00117 | −3.379 | 0.000 | |
| SPI-6 | −0.00056 | −1.598 | 0.109 | SPEI-6 | −0.00132 | −3.865 | 0.000 | |
| SPI-12 | −0.00112 | −2.940 | 0.080 | SPEI-12 | −0.00188 | −5.350 | 0.000 | |
| Zone 3 | SPI-1 | 0.00003 | 0.216 | 0.888 | SPEI-1 | 0.00005 | 0.142 | 0.887 |
| SPI-3 | −0.00016 | −0.426 | 0.669 | SPEI-3 | −0.00004 | −0.116 | 0.907 | |
| SPI-6 | −0.00051 | −1.508 | 0.131 | SPEI-6 | −0.00029 | −0.841 | 0.399 | |
| SPI-12 | −0.00107 | −3.081 | 0.002 | SPEI-12 | −0.00069 | −2.017 | 0.043 | |
| Whole Benin | SPI-1 | 0.000224 | 0.933 | 0.350 | SPEI-1 | 0.000224 | 0.9334 | 0.350 |
| SPI-3 | 0.000115 | 0.484 | 0.627 | SPEI-3 | −0.00073 | −2.847 | 0.004 | |
| SPI-6 | −0.000146 | −0.602 | 0.547 | SPEI-6 | −0.00065 | −2.591 | 0.009 | |
| SPI-12 | −0.000241 | −0.945 | 0.344 | SPEI-12 | −0.00080 | −3.280 | 0.001 |
| Zones | Times Scales | Longest | Highest | Times Scales | Longest | Highest | ||||
|---|---|---|---|---|---|---|---|---|---|---|
| Year | D | Year | I | Year | D | Year | I | |||
| Zone 1 | SPI-1 | 1990 | 4 | 2020 | −1.91 | SPEI-1 | 1992 2001 2015 | 4 | 2020 | −1.67 |
| SPI-3 | 2001 | 8 | 2012 | −1.55 | SPEI-3 | 1992 2001 2015 | 4 | 2020 | −1.94 | |
| SPI-6 | 2001 | 6 | 1993 | −1.68 | SPEI-6 | 2001 | 6 | 1997 | −1.57 | |
| SPI-12 | 2001 | 8 | 2021 | −1.48 | SPEI-12 | 2001 | 8 | 2001 | −1.35 | |
| Zone 2 | SPI-1 | 2015 | 4 | 2020 | −2.53 | SPEI-1 | 2005 2006 2008 2015 | 4 | 2020 | −2.53 |
| SPI-3 | 2005 | 5 | 2001 | −1.9 | SPEI-3 | 2010 | 4 | 2001 | −1.9 | |
| SPI-6 | 2005 | 8 | 2015 | −1.56 | SPEI-6 | 2003 | 7 | 2015 | −1.5 | |
| SPI-12 | 2016 | 12 | 1993 | −1.58 | SPEI-12 | 2016 | 11 | 2006 | −1.49 | |
| Zone 3 | SPI-1 | 2015 | 3 | 1988 | −2 | SPEI-1 | 2010 | 4 | 1991 | −1.86 |
| SPI-3 | 1990 | 4 | 2015 | −2 | SPEI-3 | 2006 | 6 | 2010 | −1.90 | |
| SPI-6 | 1988 1993 | 5 | 1998 | −1.75 | SPEI-6 | 2006 | 8 | 2017 | −1.78 | |
| SPI-12 | 1988 1989 1994 | 6 | 2005 | −1.69 | SPEI-12 | 1988 | 7 | 2015 | −1.49 | |
| Zones | Relationship | Correlation Coefficient | Relationship | Correlation Coefficient |
|---|---|---|---|---|
| Zone 1 | SPI-1 and SRHI-1 | 0.40 | SPEI-1 and SRHI-1 | 0.25 |
| SPI-3 and SRHI-3 | 0.29 | SPEI-3 and SRHI-3 | 0.15 | |
| SPI-6 and SRHI-6 | 0.29 | SPEI-6 and SRHI-6 | 0.25 | |
| SPI-12 and SRHI-12 | 0.39 | SPEI-12 and SRHI-12 | 0.36 | |
| Zone 2 | SPI-1 and SRHI-1 | 0.34 | SPEI-1 and SRHI-1 | 0.18 |
| SPI-3 and SRHI-3 | 0.27 | SPEI-3 and SRHI-3 | 0.28 | |
| SPI-6 and SRHI-6 | 0.13 | SPEI-6 and SRHI-6 | 0.14 | |
| SPI-12 and SRHI-12 | 0.07 | SPEI-12 and SRHI-12 | 0.08 | |
| Zone 3 | SPI-1 and SRHI-1 | 0.45 | SPEI-1 and SRHI-1 | 0.55 |
| SPI-3 and SRHI-3 | 0.42 | SPEI-3 and SRHI-3 | 0.52 | |
| SPI-6 and SRHI-6 | 0.36 | SPEI-6 and SRHI-6 | 0.44 | |
| SPI-12 and SRHI-12 | 0.38 | SPEI-12 and SRHI-12 | 0.41 | |
| Benin | SPI-1 and SRHI-1 | 0.41 | SPEI-1 and SRHI-1 | 0.50 |
| SPI-3 and SRHI-3 | 0.48 | SPEI-3 and SRHI-3 | 0.43 | |
| SPI-6 and SRHI-6 | 0.38 | SPEI-6 and SRHI-6 | 0.37 | |
| SPI-12 and SRHI-12 | 0.30 | SPEI-12 and SRHI-12 | 0.26 |
Disclaimer/Publisher’s Note: The statements, opinions and data contained in all publications are solely those of the individual author(s) and contributor(s) and not of MDPI and/or the editor(s). MDPI and/or the editor(s) disclaim responsibility for any injury to people or property resulting from any ideas, methods, instructions or products referred to in the content. |
© 2025 by the authors. Licensee MDPI, Basel, Switzerland. This article is an open access article distributed under the terms and conditions of the Creative Commons Attribution (CC BY) license (https://creativecommons.org/licenses/by/4.0/).
Share and Cite
Bio Sidi D. Bouko, A.-A.; Gao, B.; Abubakar, J.; Annan, R.F.; Djessou, R.D.; Mutelo, A.M.; El-Saadani, Z.; Dehah, L. Characteristics of Meteorological Droughts Across Different Climatic Zones in Benin. Atmosphere 2025, 16, 611. https://doi.org/10.3390/atmos16050611
Bio Sidi D. Bouko A-A, Gao B, Abubakar J, Annan RF, Djessou RD, Mutelo AM, El-Saadani Z, Dehah L. Characteristics of Meteorological Droughts Across Different Climatic Zones in Benin. Atmosphere. 2025; 16(5):611. https://doi.org/10.3390/atmos16050611
Chicago/Turabian StyleBio Sidi D. Bouko, Abdoul-Aziz, Bing Gao, Jabir Abubakar, Richard F. Annan, Randal D. Djessou, Admire M. Mutelo, Zozo El-Saadani, and Lekoueiry Dehah. 2025. "Characteristics of Meteorological Droughts Across Different Climatic Zones in Benin" Atmosphere 16, no. 5: 611. https://doi.org/10.3390/atmos16050611
APA StyleBio Sidi D. Bouko, A.-A., Gao, B., Abubakar, J., Annan, R. F., Djessou, R. D., Mutelo, A. M., El-Saadani, Z., & Dehah, L. (2025). Characteristics of Meteorological Droughts Across Different Climatic Zones in Benin. Atmosphere, 16(5), 611. https://doi.org/10.3390/atmos16050611