Article

Runaway Climate Across the Wider Caribbean and Eastern Tropical Pacific in the Anthropocene: Threats to Coral Reef Conservation, Restoration, and Social–Ecological Resilience

by
Edwin A. Hernández-Delgado
* and
Yanina M. Rodríguez-González
Sociedad Ambiente Marino, San Juan 00931-2158, Puerto Rico
*
Author to whom correspondence should be addressed.
Atmosphere 2025, 16(5), 575; https://doi.org/10.3390/atmos16050575
Submission received: 14 February 2025 / Revised: 3 May 2025 / Accepted: 9 May 2025 / Published: 11 May 2025

Abstract

:
Marine heatwaves (MHWs) are increasingly affecting tropical seas, causing mass coral bleaching and mortality in the wider Caribbean (WC) and eastern tropical Pacific (ETP). This leads to significant coral loss, reduced biodiversity, and impaired ecological functions. Climate models forecast a troubling future for Latin American coral reefs, but downscaled projections for the WC and ETP remain limited. Understanding regional temperature thresholds that threaten coral reef futures and restoration efforts is critical. Our goals included analyzing historical trends in July–August–September–October (JASO) temperature anomalies and exploring future projections at subregional and country levels. From 1940 to 2023, JASO air and ocean temperature anomalies showed significant increases. Projections indicate that even under optimistic scenario 4.5, temperatures may exceed the +1.5 °C air threshold beyond pre-industrial levels by the 2040s and the +1.0 °C ocean threshold beyond historical annual maximums by the 2030s, resulting in severe coral bleaching and mortality. Business-as-usual scenario 8.5 suggests conditions will become intolerable for coral conservation and restoration by the 2030s, with decadal warming trends largely surpassing historical rates, under unbearable conditions for corals. The immediate development of regional and local adaptive coral reef conservation and restoration plans, along with climate change adaptation and mitigation strategies, is essential to provide time for optimistic scenarios to materialize.

1. Introduction

The Intergovernmental Panel on Climate Change (IPCC)’s Sixth Assessment Report characterizes marine heatwaves (MHWs) as periods during which water temperatures are abnormally warm for the time of year, relative to historical temperatures, with such extreme warmth persisting for days to months [1]. These events can occur anywhere in the ocean and span areas up to thousands of kilometers. A MHW is defined as a discrete, prolonged event of anomalously warm sea surface temperatures (SST) that persists for five or more consecutive days, during which the SST exceeds the 90th percentile relative to a 30-year historical baseline for that region and time of year [2]. MHWs have surged in tropical seas over recent decades [3], with 2023 and 2024 setting numerous temperature records [4,5]. Sea surface warming trends have doubled per decade [6], projecting widespread coral population declines as temperatures exceed +2 °C [7]. Recent prolonged MHWs have caused significant coral reef habitat modifications, leading to long-term consequences for ecological functions and resilience [8,9]. Local stressors synergize with rising temperatures to kill corals [10] by increasing their vulnerability to bleaching and diseases [11,12,13,14,15], while also heightening genetic susceptibility to warming [16]. These rapidly changing conditions signal the potential onset of a runaway climate scenario, threatening unprecedented impacts across the wider Caribbean (WC) and eastern tropical Pacific (ETP).
Severe regional extreme events may trigger tipping points in both ecosystems and human systems due to climate drivers [17]. Interactions among tipping elements beyond +2 °C could result in unprecedented cascading impacts [18,19,20], potentially leading to runaway climate conditions characterized by permanent MHWs. MHWs significantly affect marine ecosystems, particularly in tropical regions, impacting even highly migratory species and top predators [21]. Varying in duration and intensity, MHWs are particularly concerning in tropical and subtropical waters. Their frequency has increased more than 20-fold due to anthropogenic climate change [22].
Elevated SST during prolonged MHWs causes corals to expel their endosymbiotic algae, leading to mass bleaching [23,24,25,26] (Figure 1). This not only jeopardizes coral health but also diminishes their nutrient acquisition [27]. Extended bleaching can result in high coral mortality rates, severely impacting reef structure and biodiversity [28,29]. Many marine species may migrate to cooler waters, disrupt local ecosystems, and alter species composition [30], which can result in a loss of biodiversity and changes in predator–prey dynamics. Vulnerable species face heightened extinction risks due to their inability to adapt to rapid temperature changes and chronic MHW conditions [31,32,33,34,35,36,37], ultimately reshaping reef functionality [38]. Projections indicate that by 2080, coral bleaching will likely begin on most reefs in spring, with year-round bleaching risks remaining high for some low-latitude reefs, regardless of global greenhouse gas (GHG) mitigation efforts [39]. Consequently, understanding regional SST changes across the WC and ETP has become increasingly crucial.
Warmer waters significantly impact primary productivity, particularly phytoplankton growth—the foundation of the marine food web [40,41,42]. Changes in phytoplankton dynamics can cascade through trophic levels, altering tropical coastal productivity and fisheries [43,44,45]. MHWs disrupt nutrient cycling, affecting the availability of essential nutrients and dissolved oxygen for marine life [46,47,48]. They can also impact seagrass community structure and ecosystem processes [49]. Changes in fish behavior, migration, and breeding patterns due to rising temperatures can lead to declines in fish stocks, affecting local fisheries and dependent communities. Long-term consequences, such as reef flattening from sea surface warming and stronger hurricanes, may result in further habitat homogenization and loss of fish diversity [50,51,52]. This decline in fisheries can severely impact the economies of coastal communities reliant on fishing [53]. Additionally, warmer SST can facilitate pathogen growth, increasing disease outbreaks in marine species, especially corals and fish [54,55,56]. The degradation of marine ecosystems due to increasing MHWs compromises essential services, such as coastal protection, tourism, and recreational opportunities. Communities dependent on marine resources may face food insecurity as fish populations decline and ecosystems are disrupted. Overall, MHWs pose a significant threat to tropical marine ecosystems, with far-reaching implications for biodiversity, fisheries, and coastal livelihoods. Addressing runaway climate change and mitigating its impacts are critical for enhancing ecosystem resilience and protecting these communities.
Runaway climate refers to a scenario in which climate change accelerates uncontrollably, resulting in severe and potentially irreversible alterations to the Earth’s climate system. This phenomenon is marked by feedback loops that exacerbate warming, such as GHG release from melting permafrost and the loss of reflective ice cover. It typically occurs when climate tipping points are exceeded, causing changes in large parts of the climate system—known as tipping elements—to become self-perpetuating beyond a certain warming threshold [57]. This process creates a self-reinforcing cycle where initial warming triggers further warming, pushing the climate system into a state of extreme change [58,59], with potentially long-term dire global consequences [60]. Runaway climate can manifest when specific thresholds or tipping points are crossed, leading to abrupt climate shifts that are challenging to reverse.
Rising SST and record accumulated degree heating weeks (DHWs) during 2023 and 2024 resulted in widespread catastrophic coral bleaching, diminishing coral health, biodiversity, and in the long-term project to affect the structural integrity of reef ecosystems. Coral reefs support a vast array of marine life, and their collapse can lead to significant habitat loss for numerous species. Increased SST and habitat changes can facilitate the spread of invasive species, further stressing native marine life. Runaway climate impacts phytoplankton productivity, which is essential for marine food webs. Variations in nutrient availability and SST can disrupt phytoplankton growth and distribution, affecting higher trophic levels. Changes in fish populations due to temperature shifts and habitat loss can lead to declines in fisheries, jeopardizing food security for coastal communities. Additionally, elevated CO2 atmospheric concentration can lead to higher absorption by oceans, resulting in ocean acidification. This negatively impacts calcareous organisms, such as corals and shellfish, compromising their ability to build and maintain structures. Acidification can disrupt the functions and services of marine ecosystems, including nutrient cycling and habitat provision. Runaway climate also contributes to rising sea levels, threatening coastal habitats like mangroves, seagrasses, and salt marshes. These ecosystems are vital for coastal protection and biodiversity, making their conservation and restoration increasingly complex and expensive, particularly in small island developing states (SIDS) and the least-developed countries [61].
Runaway climate poses severe risks to tropical marine ecosystems, leading to degradation, loss of biodiversity, and altered ecological dynamics. The impacts extend beyond marine life; human communities that rely on healthy oceans for their livelihoods and well-being are also affected. More intense storms can increase coastal erosion and habitat destruction, further threatening marine and coastal social–ecological systems. Changes in temperature gradients disrupt ocean currents, affecting the distribution of nutrients and dissolved oxygen, as well as marine-life migration patterns. The increased frequency of extreme weather events—such as marine heatwaves, coral bleaching, mass coral mortality, hypoxic/anoxic events, and harmful algal blooms—can cause significant disruptions to marine ecosystems, including habitat destruction and increased sedimentation, leading to ecological collapses. The bleaching events of 2023 and 2024 resulted in catastrophic mortality, affecting nursery-raised and out-planted colonies across various locations across the WC and ETP, decimating coral populations and reducing biodiversity and habitat complexity. The rising frequency and greater spatial and temporal extent of extreme events can limit the success of coral restoration projects, as newly restored corals struggle to survive repeated stress events, hindering their growth and survival. In the long term, exceeding key tipping points that lead to a runaway climate can incur profound socioeconomic costs [62], increasing confidence in the physical and socioeconomic impacts of compound extreme events [63]. Estimates indicate over $3.1 billion in indirect losses of ecosystem services over multiple years [64]. Additionally, studies suggest a regional or global increase in the number and intensity of hurricanes due to climate change [65,66], making large economic shocks more frequent and exacerbating runaway climate threats. Addressing climate change and its drivers is essential to prevent a runaway climate scenario and to safeguard marine ecosystems for future generations.
Coral reefs provide essential services, including coastal protection, fisheries, and tourism. Their degradation results in increased coastal erosion, the loss of fish habitats, and a decline in tourism revenues. This decline significantly impacts fish populations, leading to reduced catches and affecting local livelihoods, which can result in food insecurity and economic losses for communities [67]. As major tourist attractions, coral reefs’ degradation leads to fewer tourist arrivals, causing further economic challenges for communities reliant on tourism. Weakening coral reefs make coastal areas more susceptible to storm surges and erosion, exacerbating the impacts of hurricanes and sea-level rise (SLR).
Recent climate-model projections from the IPCC indicate a troubling future of global-scale warming for Latin American coral reefs. However, downscaled climate projections for the WC and ETP are limited. There is an urgent need to understand the projected spatio-temporal scales of future temperature thresholds that could jeopardize coral reef futures and the success of restoration efforts in the Anthropocene.
Our primary goals include (1) understanding historical trends: we aim to analyze historical changes in July–August–September–October (JASO) air temperature and sea surface temperature (SST) across the region; (2) exploring fluctuations: we explore subregional and country-level spatio-temporal fluctuations in projected JASO temperature thresholds that could threaten coral reefs in the future; (3) local-level recommendations: we discuss important recommendations at the local level to adapt to projected climate changes. To achieve these goals, we used the European Centre for Medium-Range Weather Forecasts (ECMWF) ERA5 climate database to reconstruct historical climate trends across 30 different countries and subregions of the WC and ETP, focusing on the spatio-temporal variation from 1940 to 2023 for surface (2 m) air temperature and SST. We also employed climate models from the CMIP6 SSP245 and SSP585 ensemble averages to project future regional warming trends from 1851 to 2100, based on two contrasting scenarios defined by the IPCC [1]. This information will be paramount for developing adaptive regional and local-scale coral reef restoration plans, as well as for formulating environmental planning and sustainable development strategies to adapt to projected changes.
Addressing the increased challenges posed by projected extreme weather events and runaway climate changes across the WC and ETP throughout the Anthropocene necessitates a deeper, downscaled approach. This involves focusing on regional, subregional, and national scales to better understand the projected impacts on coral reef futures. It also requires a profound understanding of the spatio-temporal patterns of projected increases in surface (2 m) temperature anomalies beyond +1.5 °C compared to pre-industrial times, as well as projected increases over +1.0 °C above mean annual maximums in SST. Key aspects include (1) critical thresholds: gaining insights into these vital temperature thresholds is essential for understanding the limits to which coral reefs can adapt and survive; (2) adaptive management: an enhanced comprehension of temperature impacts will improve our ability to plan and implement adaptive management approaches tailored to local conditions; (3) coral restoration planning: understanding these patterns will inform effective coral restoration strategies, identifying specific needs and interventions required for recovery; (4) increased funding strategies: awareness of the urgency surrounding these temperature thresholds can help secure increased local and regional funding for resilience-building initiatives; and (5) international cooperation: promoting collaboration among WC and ETP countries will be vital for enhancing the resilience of Latin American coral reefs and supporting the communities that depend on them. By deepening our understanding of these dynamics, we can better prepare for future challenges and work towards sustainable solutions for coral reef conservation and restoration and community livelihoods.

2. Materials and Methods

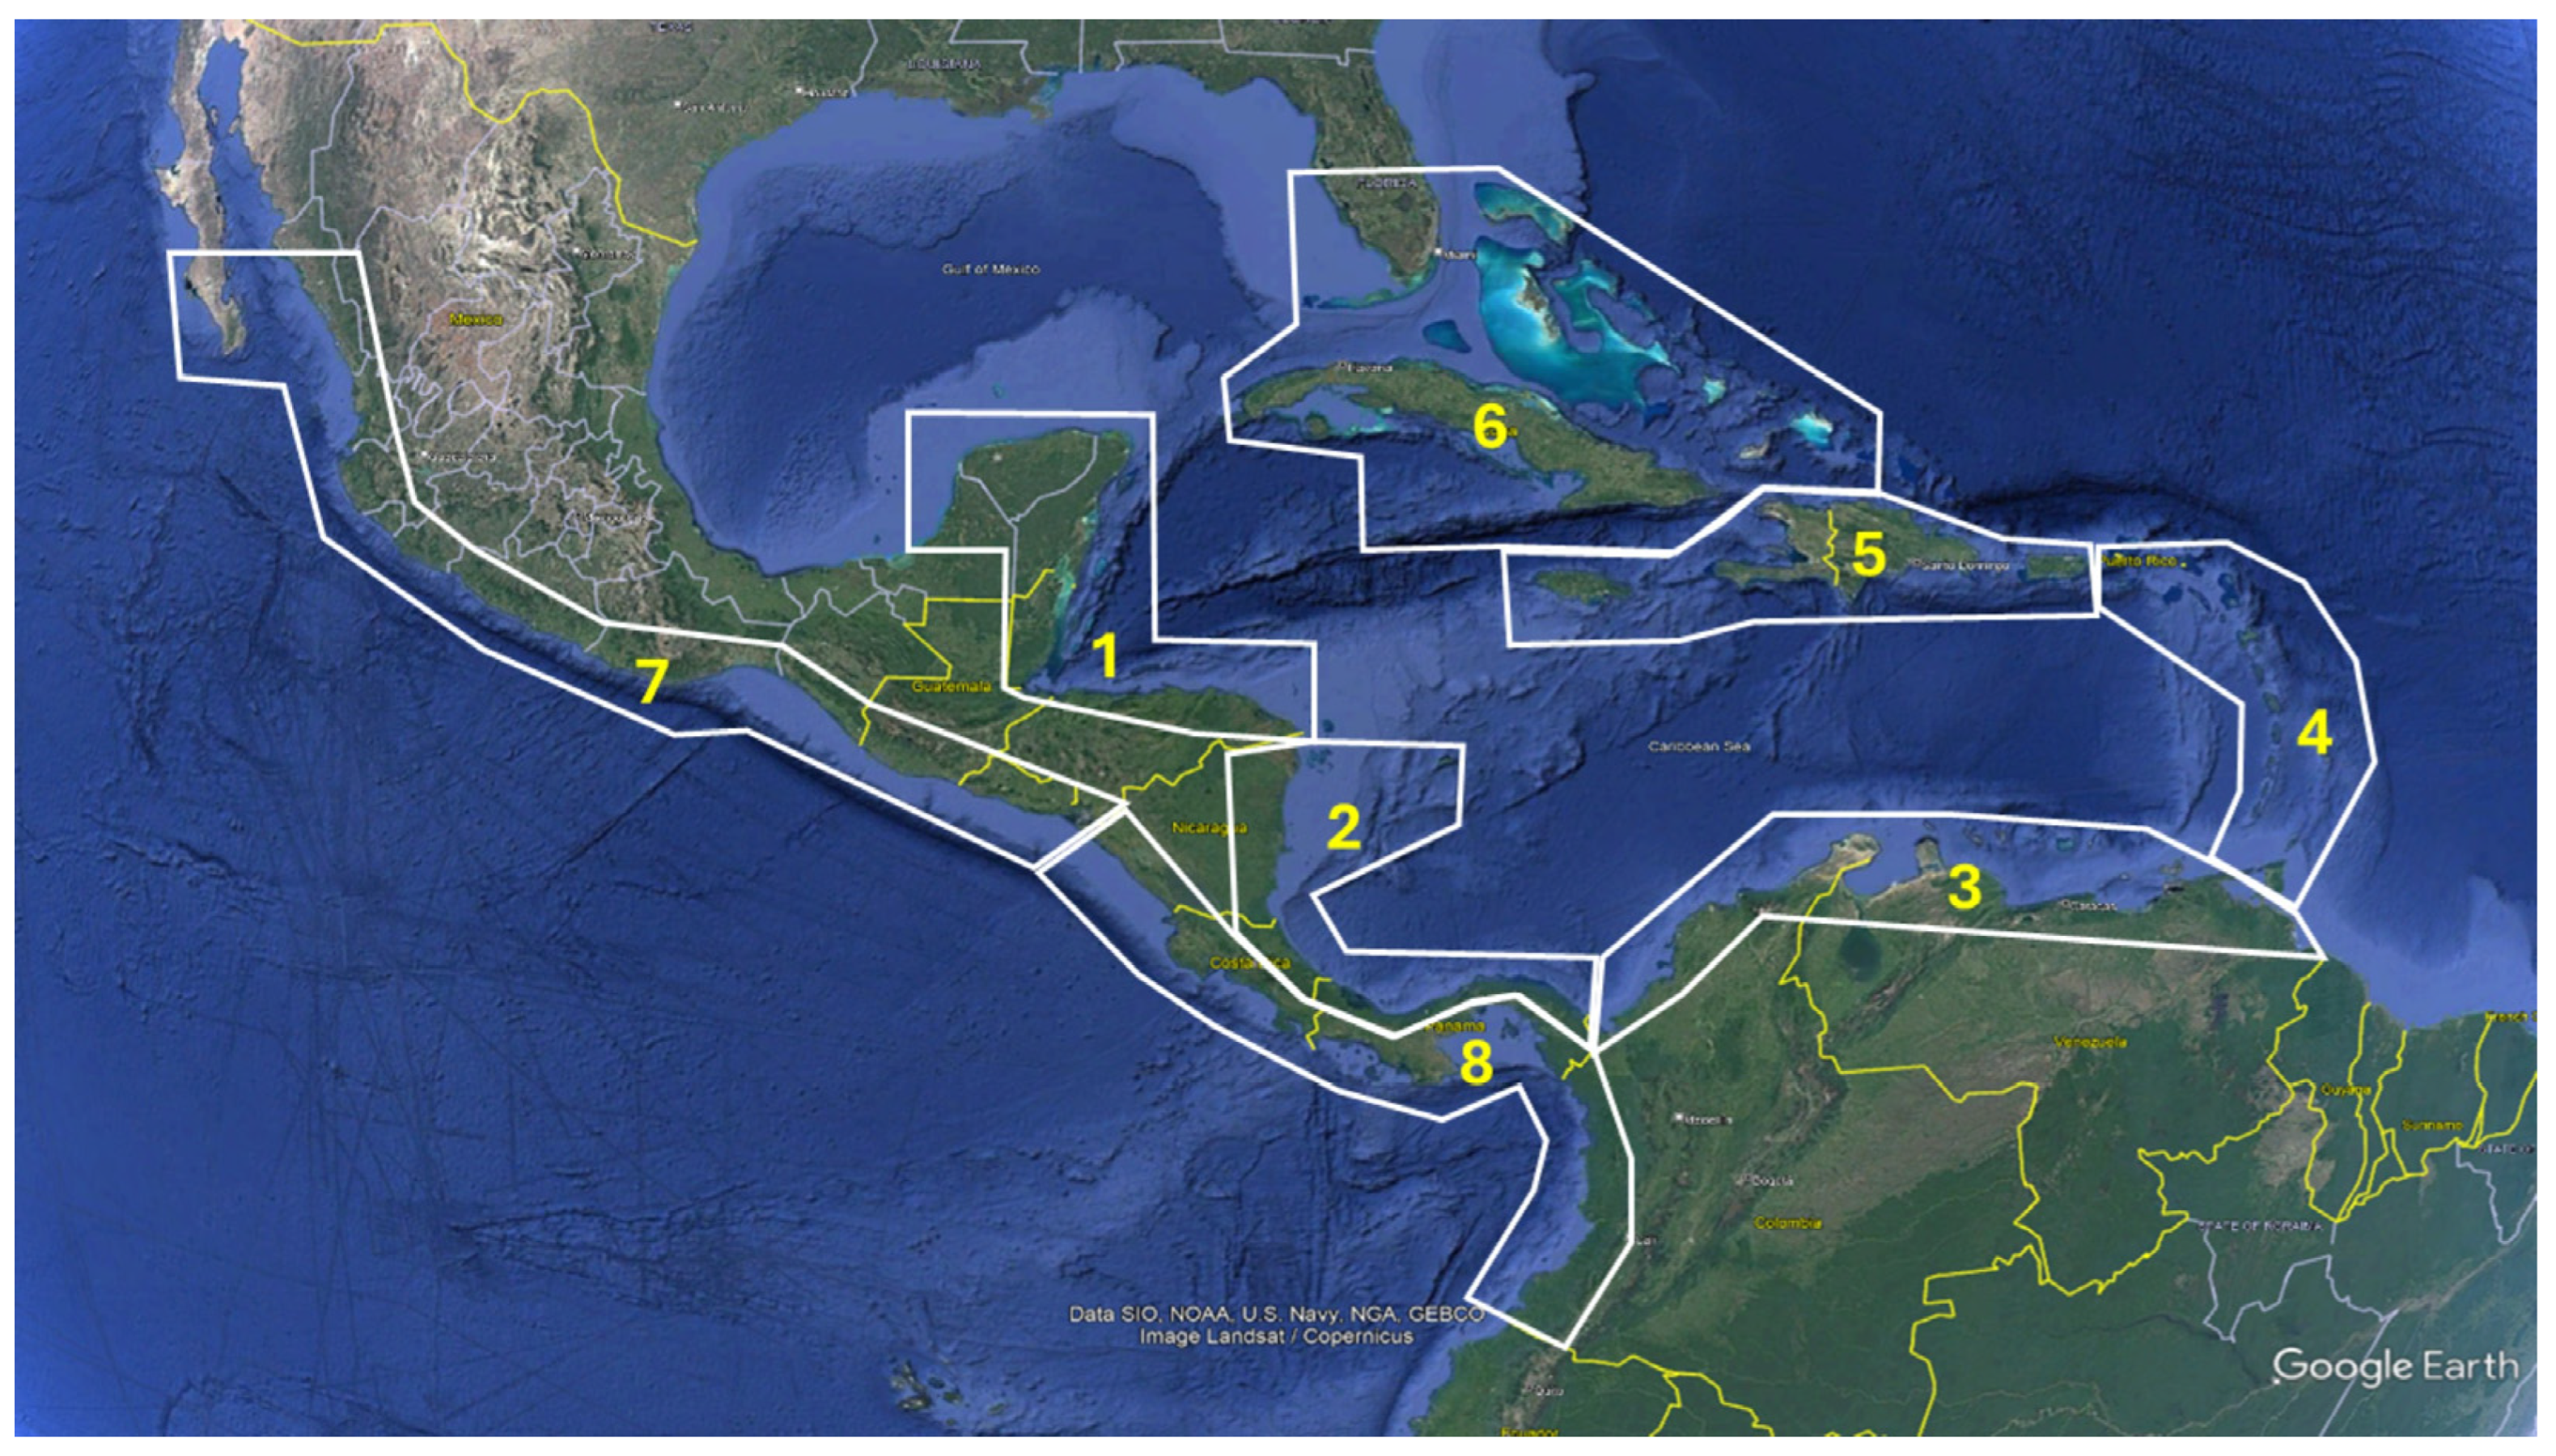
This study aimed to analyze historical changes in JASO air temperature and SST anomalies across the WC and ETP region. Regional, subregional and country-level spatio-temporal fluctuations in projected JASO temperature thresholds that could threaten coral reefs in the future were also explored under two contrasting climate scenarios. The Climate Reanalyzer tool (https://climatereanalyzer.org) served as the primary source for historical JASO surface (2 m) temperature and SST anomaly (SST-a) data across 30 countries and subregions in the WC and ETP [68]. Polygons were specifically drawn for each country or subregion to extract historical datasets (Figure 2, Table S1). Data were derived from the ECMWF ERA5 climate database [69], which is the fifth generation of ECMWF atmospheric reanalysis, covering the global climate since January 1940. JASO temperature anomaly data were obtained from 1940 to 2023 from each selected area. To project future climate scenarios, we utilized the International Coupled Model Intercomparison Project 6 (CMIP6) developed by the World Climate Research Programme (WCRP), which provides a new set of climate scenarios [70]. These scenarios encompass various socio-economic developments and pathways of atmospheric GHG concentrations. For this project, two scenarios were selected: (1) SSP245: This is the optimistic model, representing a medium pathway of future GHG emissions. It assumes that climate protection measures are being implemented, with an additional radiative forcing of 4.5 W/m2 by the year 2100; (2) SSP585: This business-as-usual model represents the upper boundary of climate scenarios, predicting an additional radiative forcing of 8.5 W/m2 by the year 2100. It reflects a scenario where no significant climate protection measures are taken. These models and datasets are fundamental for understanding historical trends and projecting future impacts on coral reef ecosystems in the region.
The ensemble averages of climate models CMIP6 SSP245 and CMIP6 SSP585 were utilized to project future JASO warming trends at regional, subregional, and country levels, using historical data and modeling from 1851 to 2100 under both optimistic (4.5 W/m2) and business-as-usual (8.5 W/m2) scenarios based on IPCC criteria [1]. Decadal variation analysis was conducted using a one-way permutational analysis of variance (PERMANOVA) on normalized annual temperature anomalies (based on the 1951–1980 climatology) to assess temporal variations in JASO surface (2 m) temperature and SST-a [71]. Linear regression was employed to quantify the relationship between JASO surface (2 m) temperature and SST-a using historical datasets from 1940 to 2023 to parameterize the model, organized by country and subregion. Individual regressed formulas were used to calculate future SST-a trends based on projected surface (2 m) temperature anomalies under both scenarios.
Table S1 summarizes the study locations by subregion, including the coordinates of sampling polygons and the linear regression results between normalized JASO surface (2 m) temperature and SST-a for the period of 1940 to 2023, using the 1951–1980 climatology as a baseline. A one-way analysis of similitude (ANOSIM) was implemented to test significant variations between observed and modeled temperatures from 2015 to 2024, contrasting observed versus modeled JASO temperature trends [72]. All multivariate tests used 9999 permutations and normalized temperature anomalies. Principal components analysis (PCA) was used to project decadal variation in temperature anomalies [72]. Projected temperature anomaly variation between 1851 and 2100 under scenarios 4.5 and 8.5 at the country level were summarized in the Supplementary Materials section (Figures S1–S8). This comprehensive approach allowed for a nuanced understanding of temperature trends and their potential impacts on coral reef futures in the face of climate change.

3. Results

3.1. Regional Temperature Anomaly Patterns 1940–2023

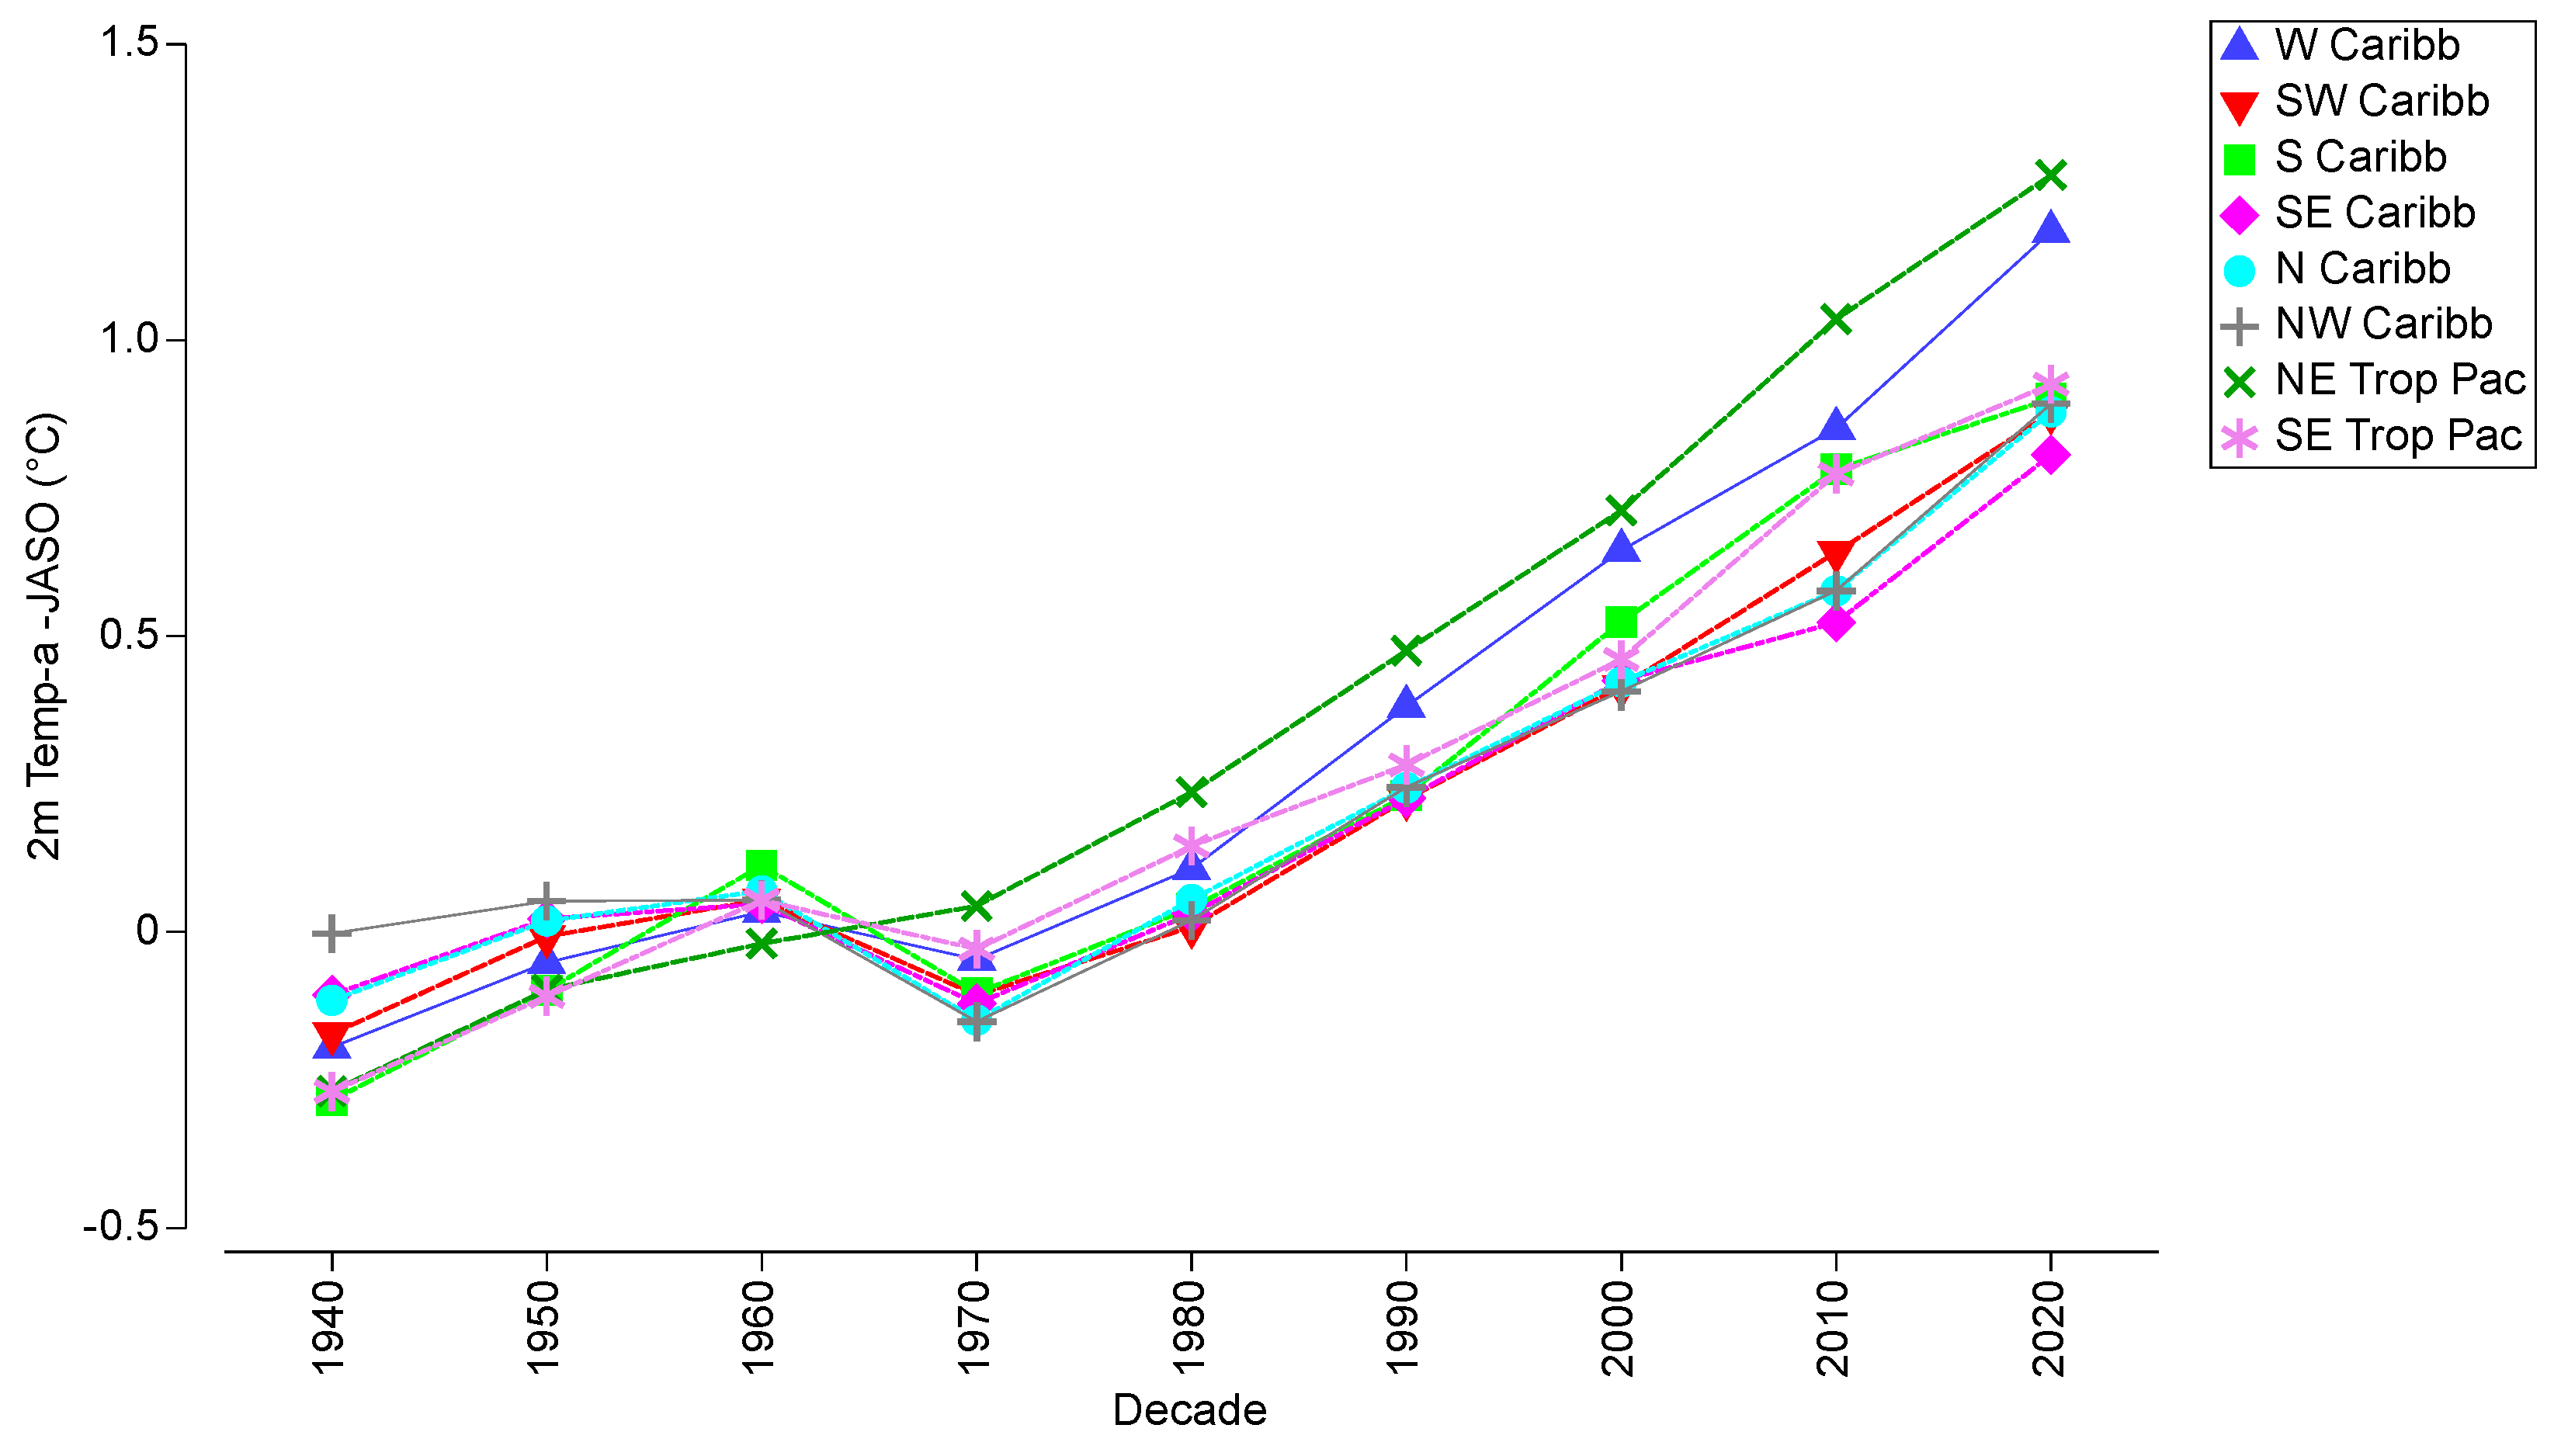
The analysis of regional spatio-temporal trends in JASO temperature anomalies between 1940 and 2023 revealed significant warming patterns. There was a significant increase in JASO surface (2 m) temperature anomalies (p < 0.0001) (Figure 3, Table 1). There was a regional average of −0.1767 °C during the 1940s and of +0.9680 °C during the 2020s, or an average warming trend of ~0.1431 °C per decade. Pairwise analyses showed that regional surface (2 m) temperature anomalies showed a significant increase during the 1960s, a marginal increase during the 1970s and sustained an irreversible increase since the 1980s (Table 1).
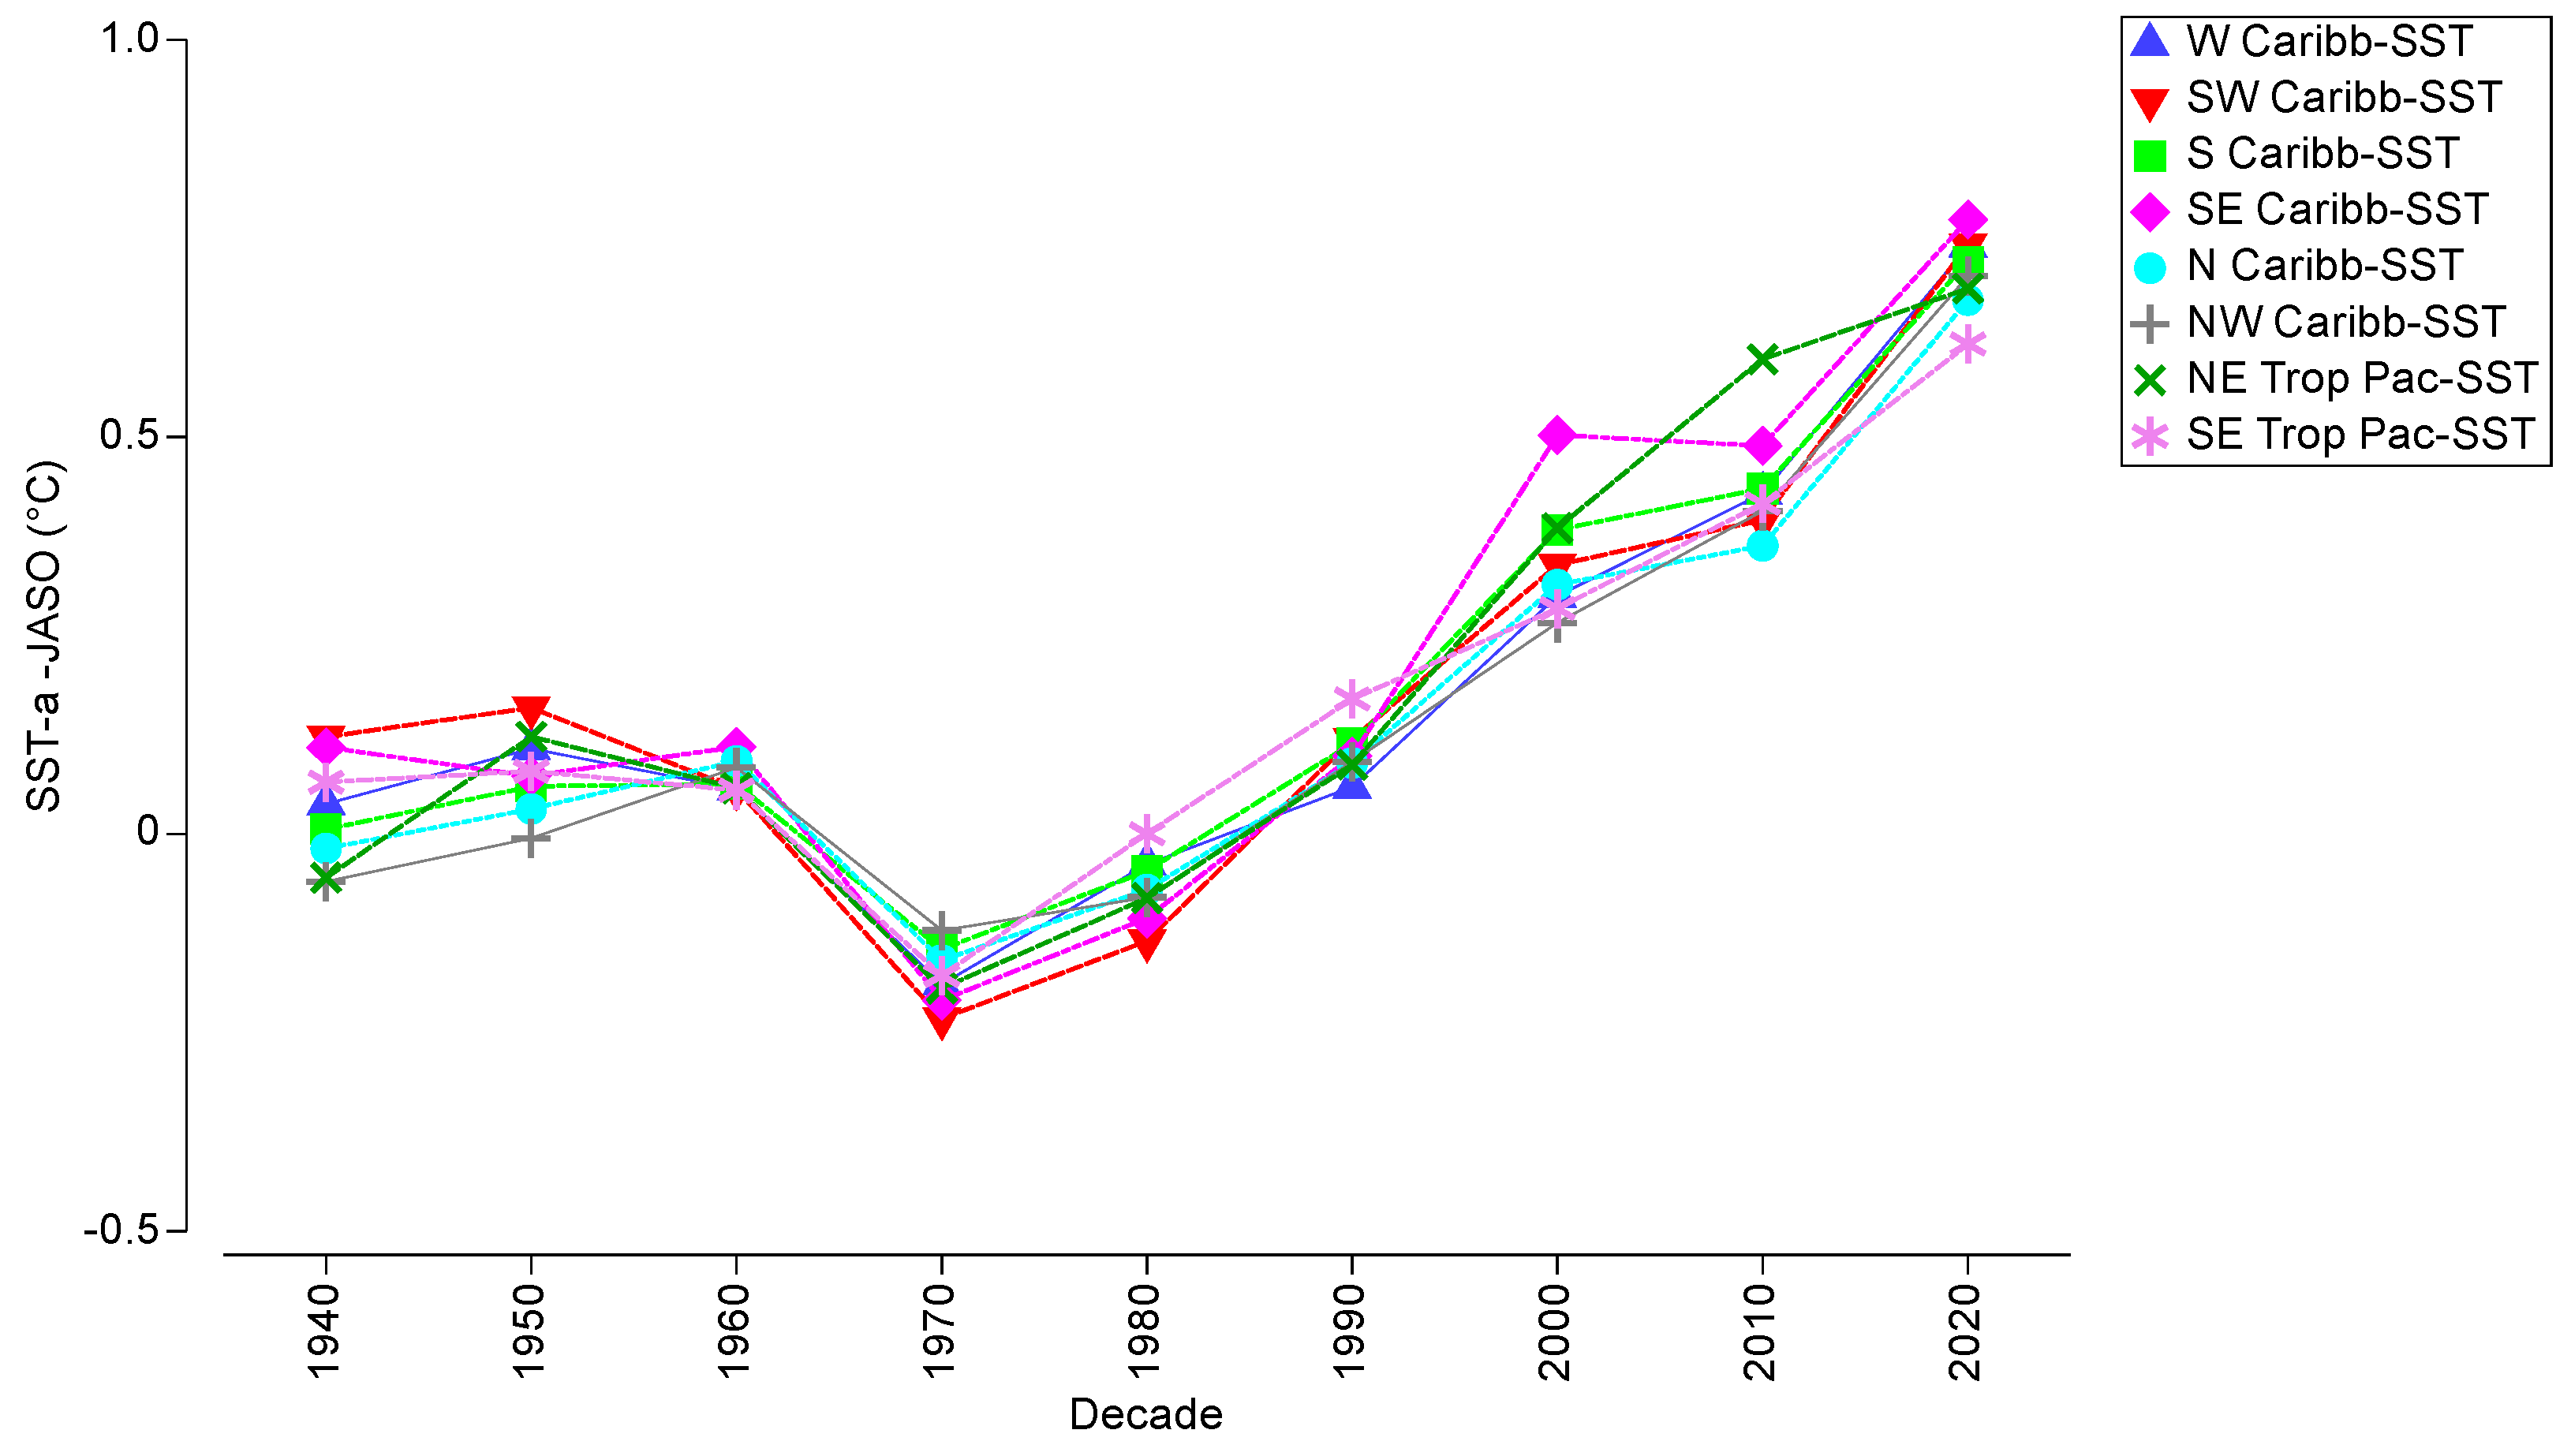
A significant increase in SST anomalies (SST-a) was also observed (p < 0.0001) (Figure 4, Table 2). A regional mean SST-a of +0.0259 °C during the 1940s and of +0.7071 °C during the 2020s was documented, or an average warming trend of ~0.0916 °C per decade. Pairwise analysis showed a significant increase in regional SST-a during the 1970s, and then a irreversible increase after the 2000s.

3.2. Country-Level Temperature Anomaly Patterns 1940–2023

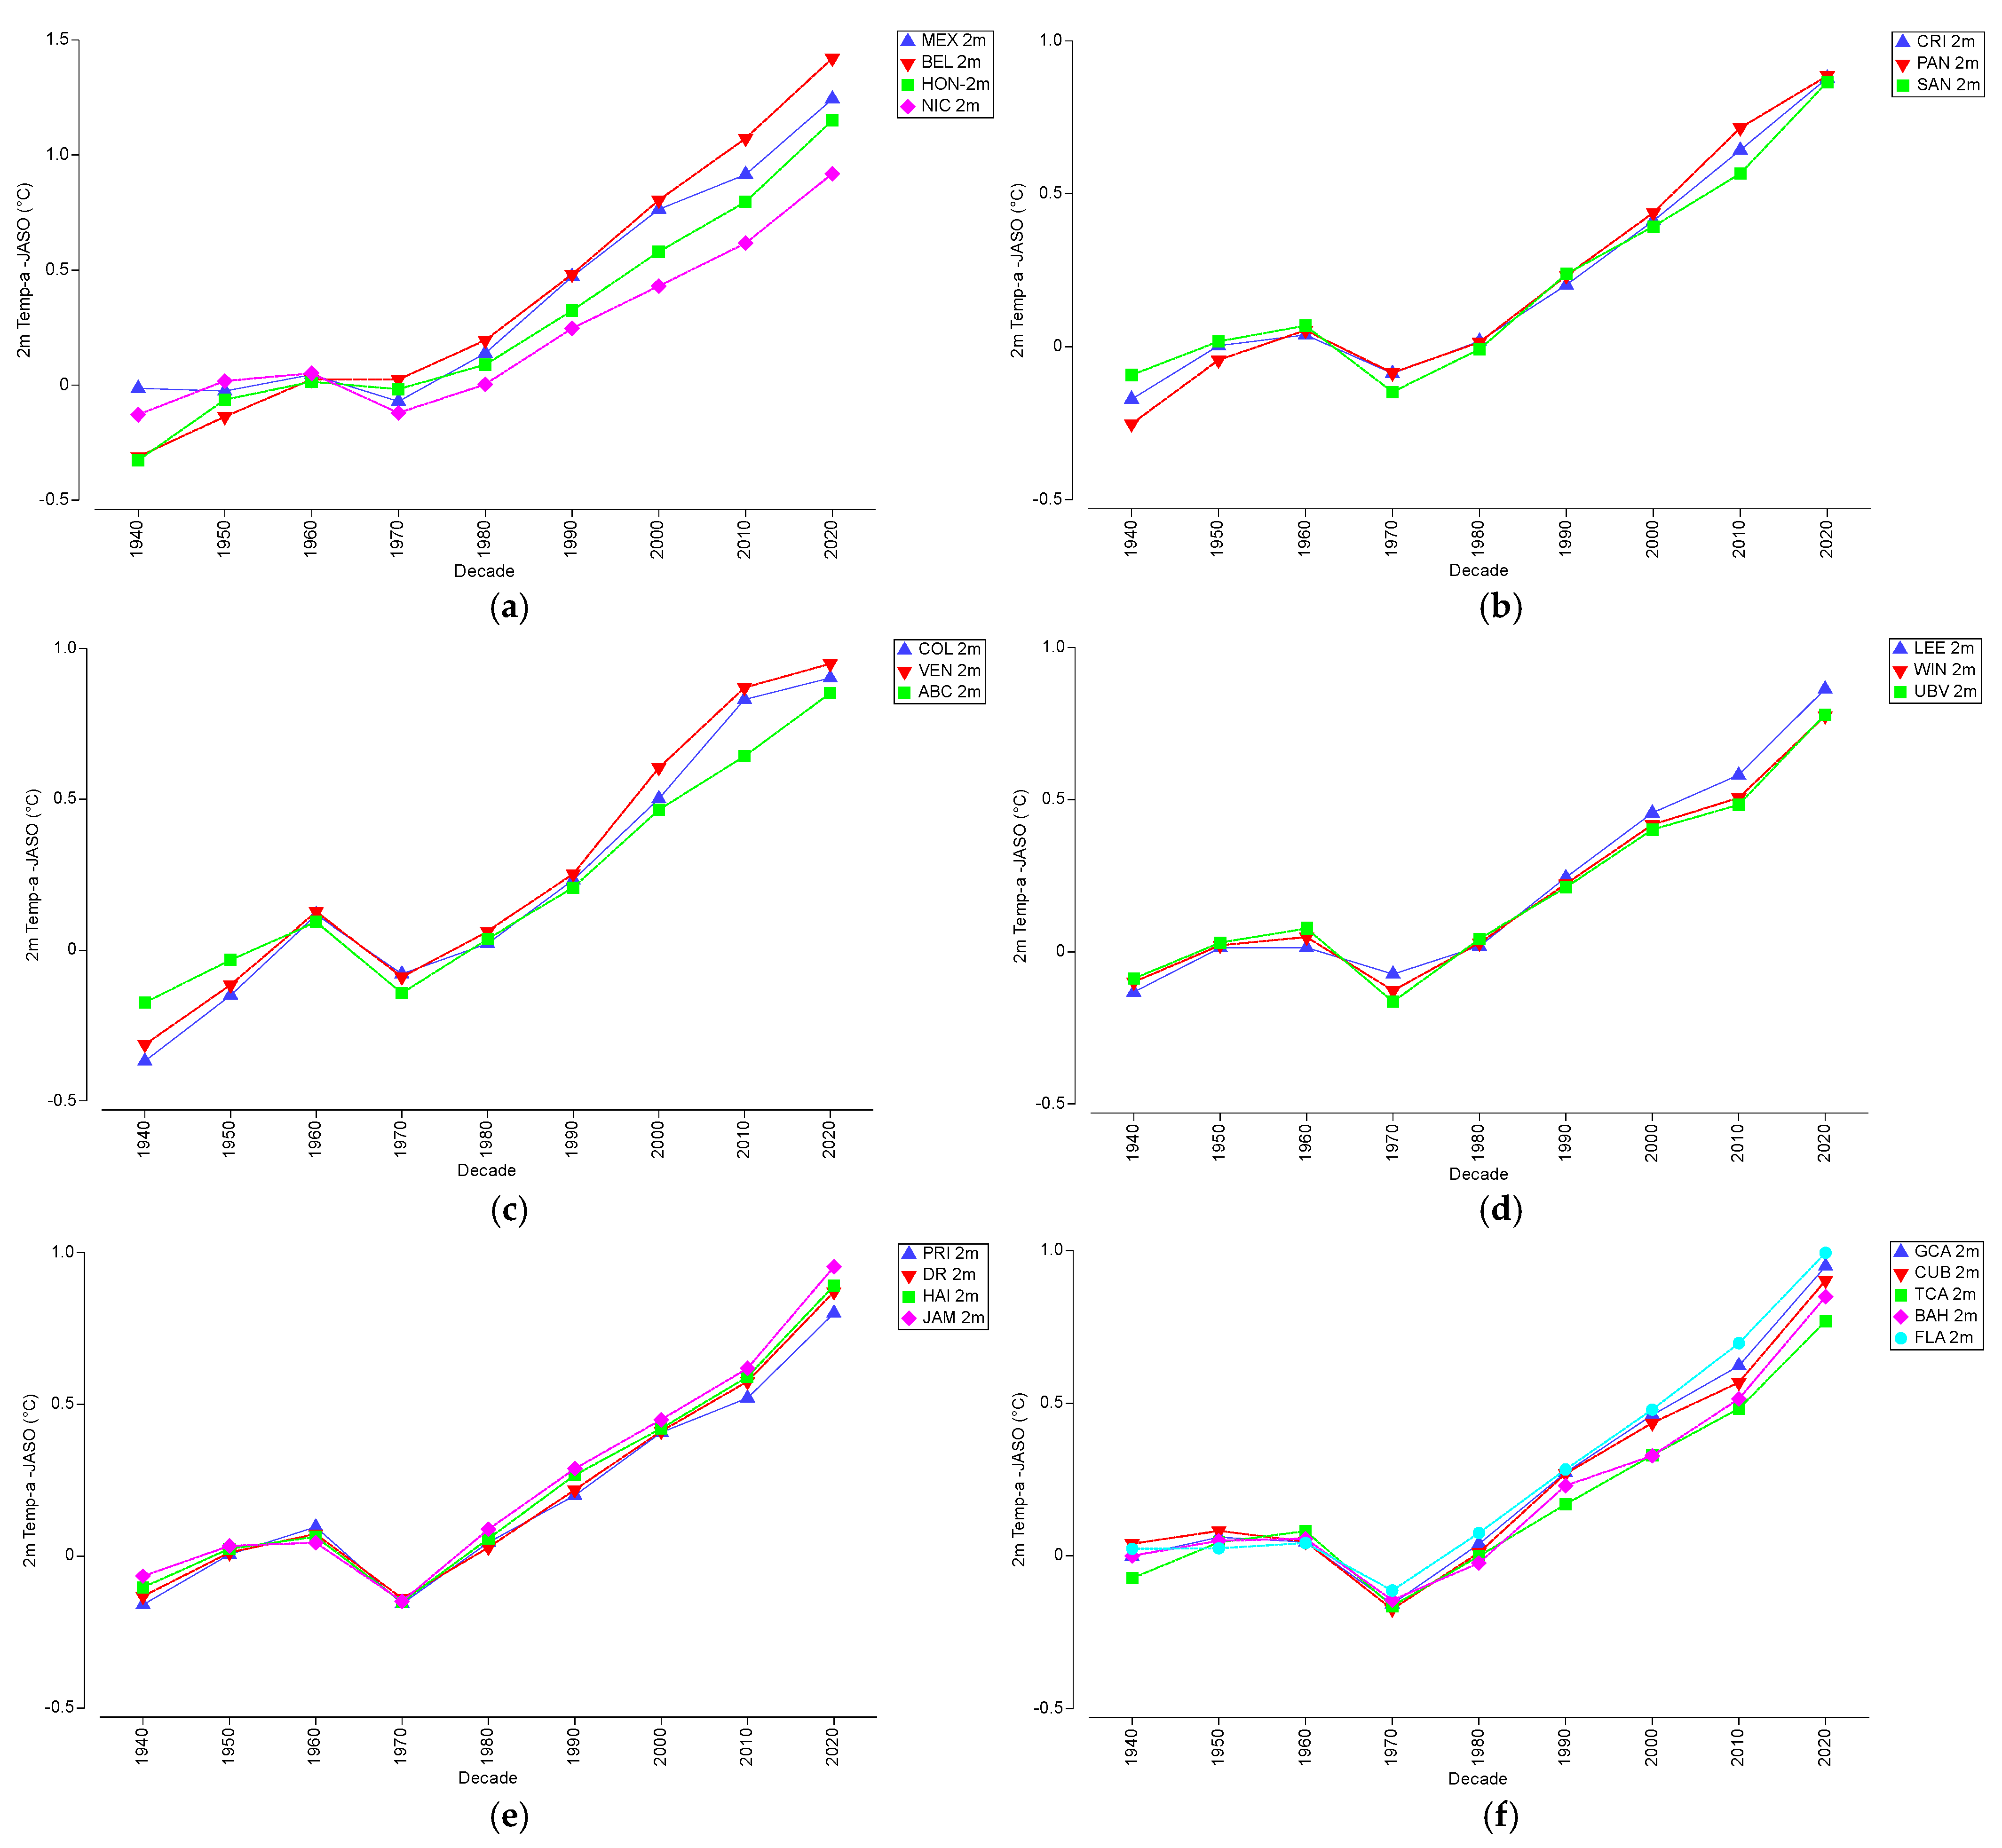
All 30 countries and subregions analyzed exhibited a significant increase (p < 0.0001) in JASO surface (2 m) temperature anomalies (Table 3, Figure 5). The temperature anomaly across the western Caribbean countries showed a mean rate of increase of 0.1723 °C/decade, 0.1311 °C/decade across the southwestern Caribbean, 0.1482 °C/decade across the southern Caribbean, and 0.1140 °C/decade across the eastern Caribbean. The temperature anomaly across the northern Caribbean showed a mean rate of increase of 0.1243 °C/decade, a mean rate of 0.1119 °C/decade across the northwestern Caribbean, 0.1935 °C/decade across the northeastern tropical Pacific, and 0.1494 °C/decade across the southeastern tropical Pacific. The data indicate a consistent warming trend across all subregions, with profound implications for the conservation and restoration of coral reefs.
Significant observed changes in JASO surface (2 m) temperature anomalies across Belize/Guatemala, Colombia, Venezuela, the southern Mexican Pacific, Guatemala Pacific, El Salvador/Honduras Pacific, and the Colombian Pacific became permanent after the decade of 1960. In the case of Panamá, Aruba, Bonaire and Curaçao (ABC Islands), Puerto Rico, Haiti, the northern Mexican Pacific, Nicaragua Pacific, Costa Rica Pacific, and the Panamá Pacific, significant increases in JASO surface (2 m) temperature anomalies became permanent during the 1980s. Elsewhere, increases became significant during the 1990s, except for South Florida in the 2000s.
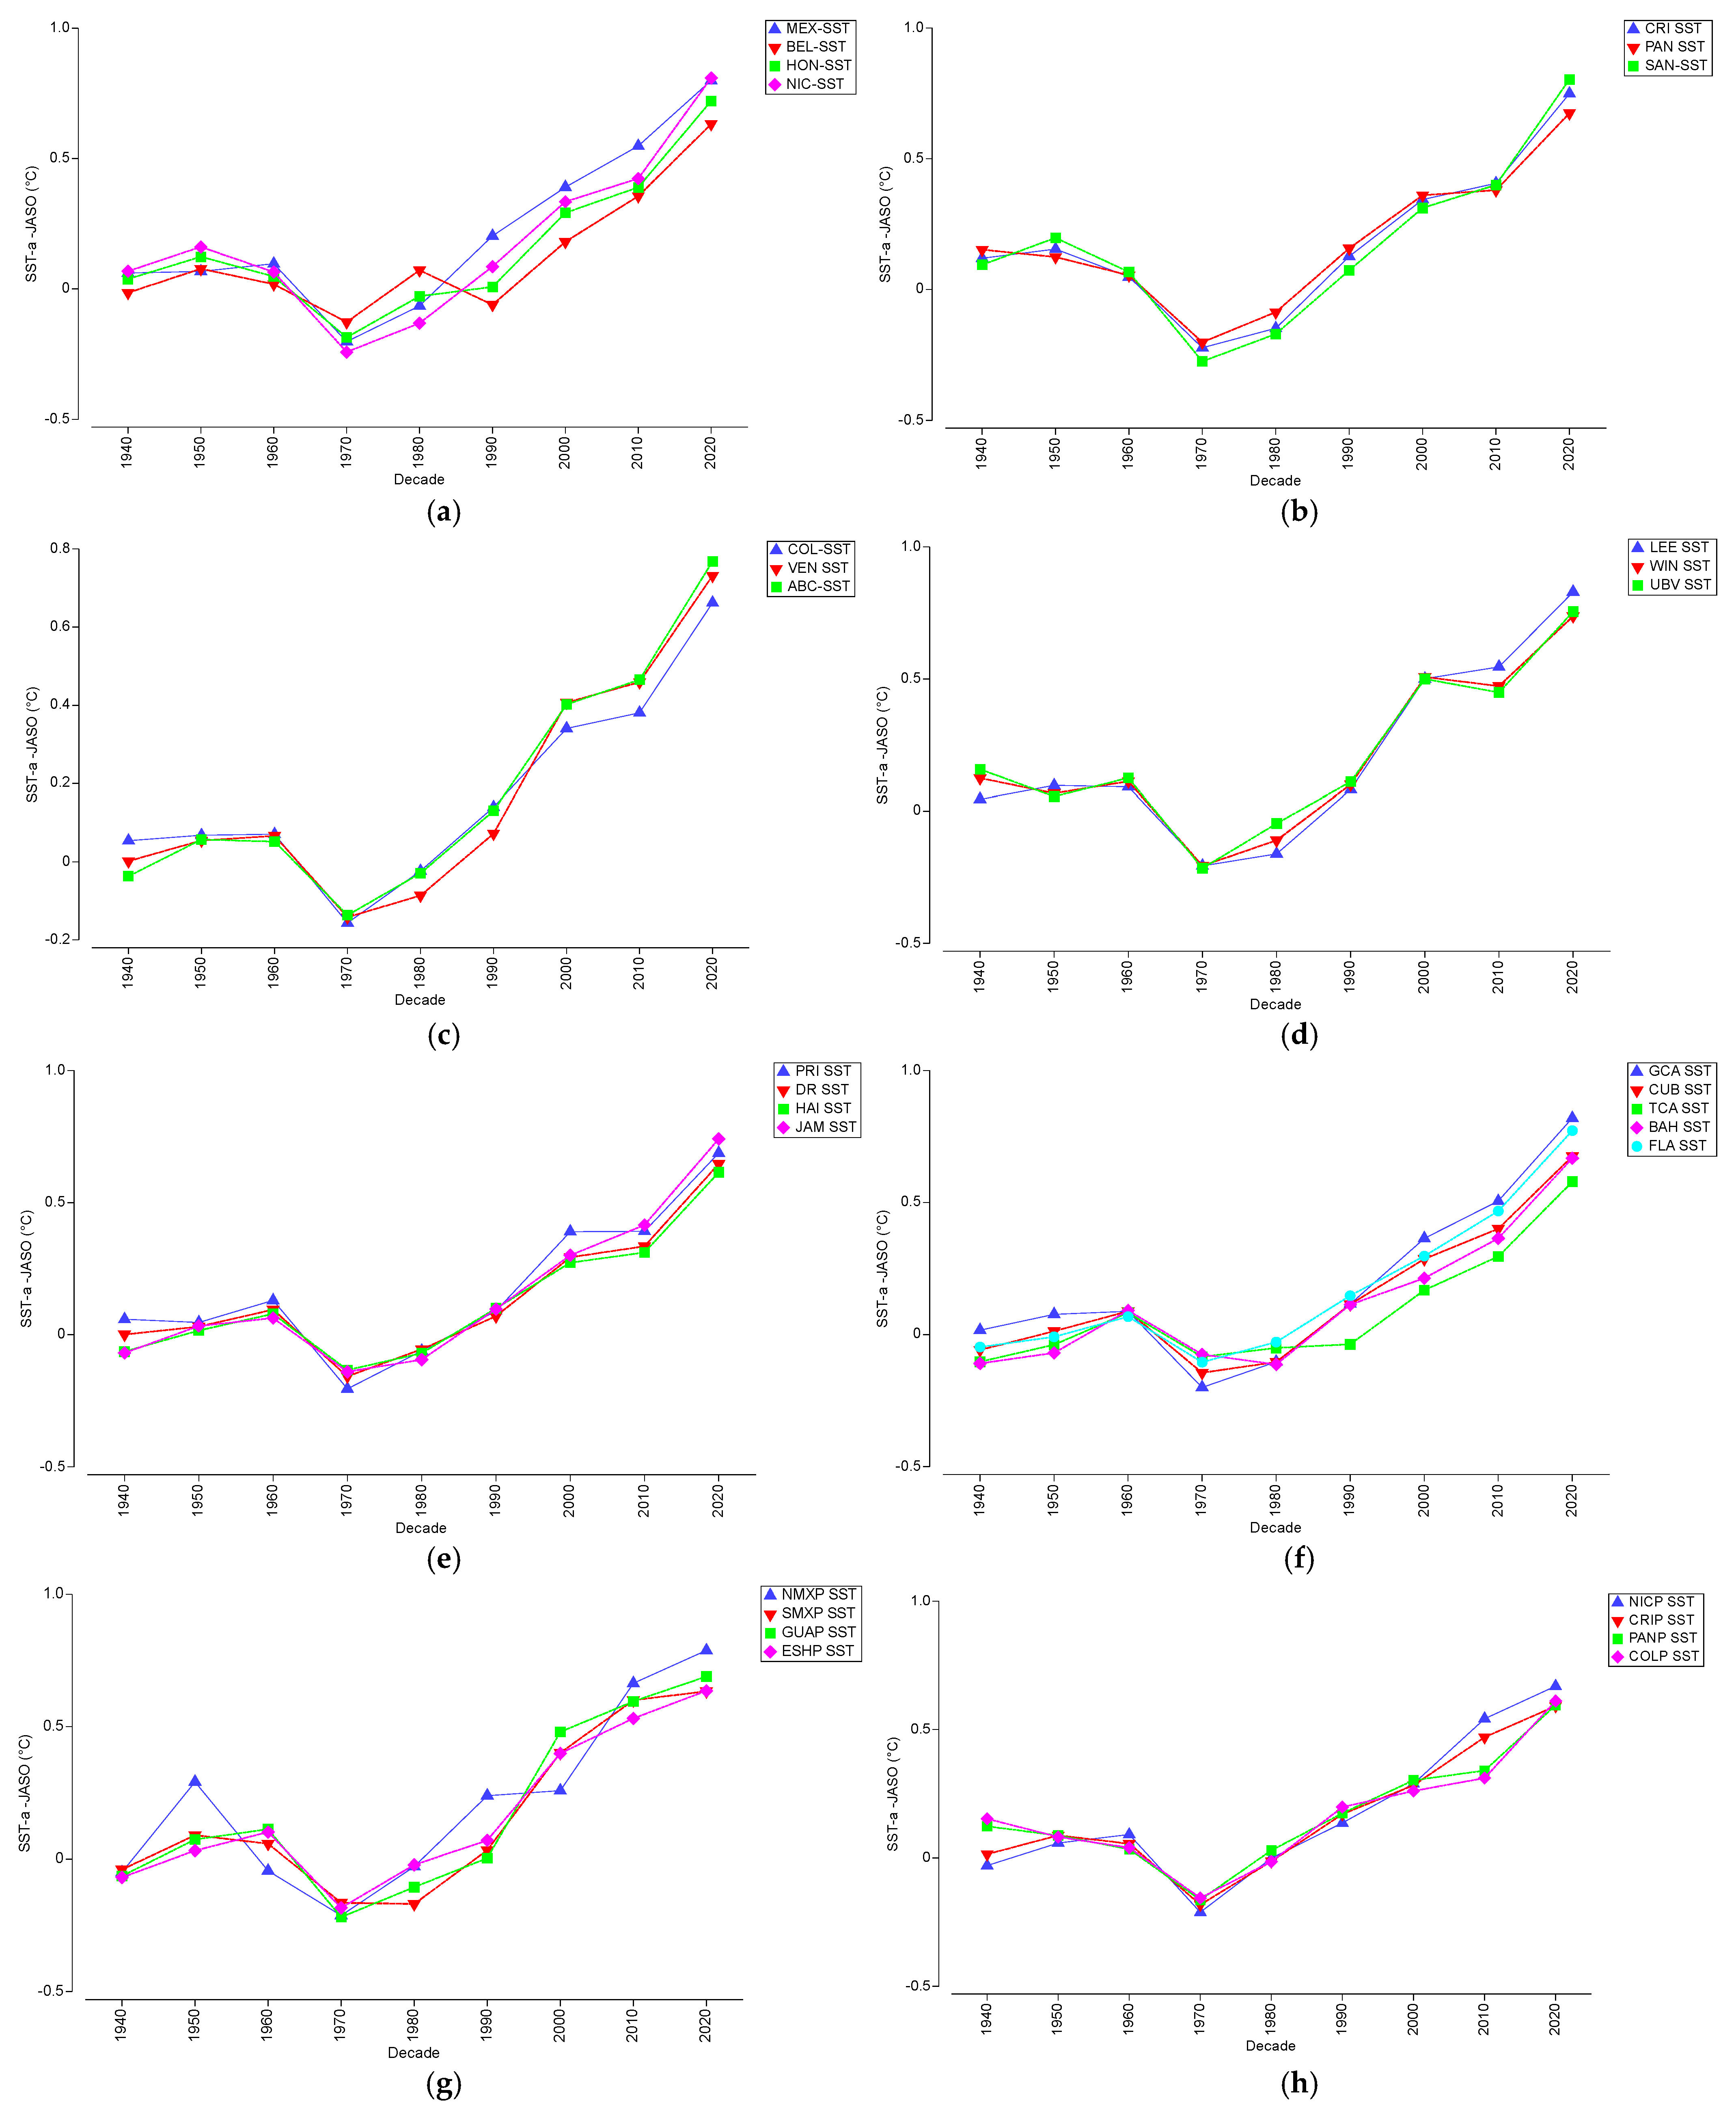
All 30 countries and subregions analyzed also exhibited a significant increase (p = 0.0123 to p < 0.0001) in JASO SST-a (Table 4, Figure 6). SST-a across the western Caribbean exhibited a mean rate of increase of 0.0878 °C/decade. The southwestern Caribbean averaged 0.0775 °C/decade, with 0.0894 °C/decade across the southern Caribbean, and 0.0831 °C/decade for the eastern Caribbean. SST-a across the northern Caribbean increased at a rate of 0.0863 °C/decade, 0.0954 °C/decade across the northwestern Caribbean, 0.0928 °C/decade across northeastern tropical Pacific, and 0.0690 °C/decade across the southeastern tropical Pacific.
The data show a consistent upward trend in SST-a across all regions, indicating significant warming through 1940–2023. The northwestern Caribbean experienced the highest mean rate of increase at 0.0954 °C/decade, while the southeastern tropical Pacific had the lowest at 0.0690 °C/decade. These warming trends have critical implications for marine ecosystems, particularly coral reefs, and highlight the need for effective climate adaptation and management strategies.
Significant observed changes in JASO SST-a across the Bahamas and southern Florida became permanent after the decade of 1990. Elsewhere, increases in JASO SST-a became significant during the 2000s, except for the northeastern Mexican Pacific and Costa Rica Pacific, which became significant during the 2010s, and the Panamá Pacific and Colombian Pacific, which became significant during the 2020s.

3.3. Modeled Historical Variation in Temperature Anomalies 1851–2100—Scenario 4.5

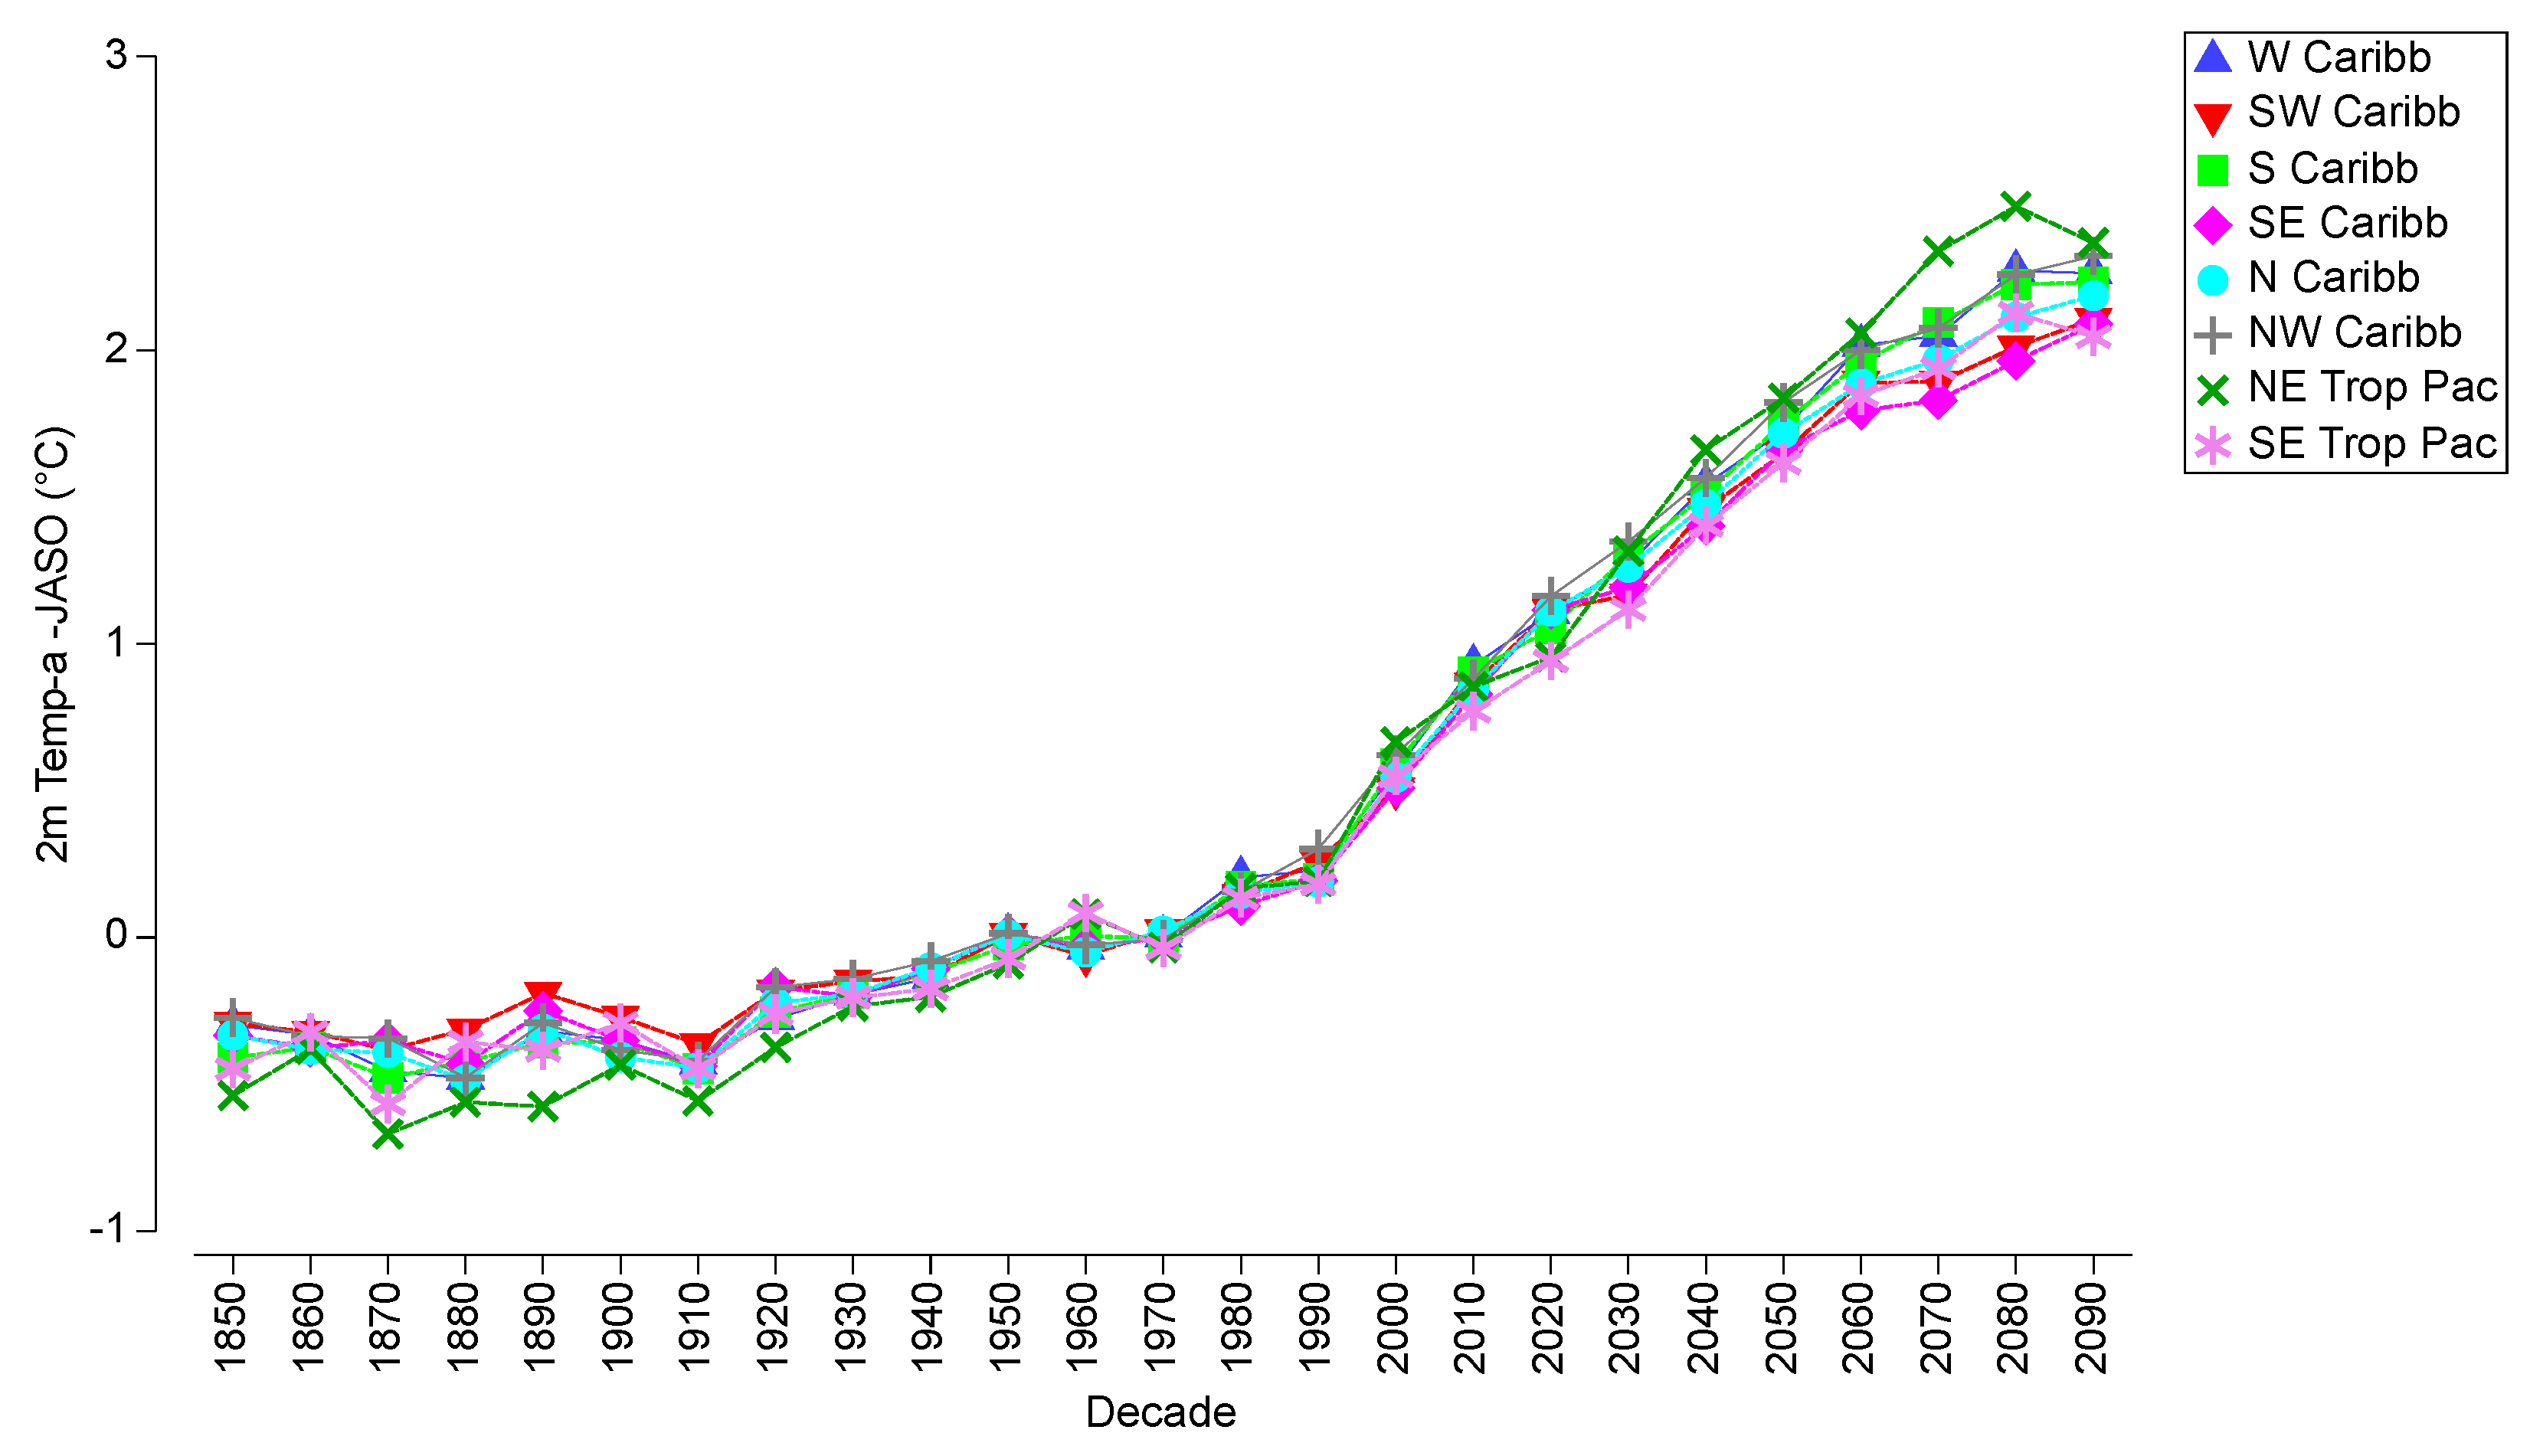
There was a highly significant decadal-scale increase (p < 0.0001) in JASO surface (2 m) temperature anomaly projections across each of the eight different subregions in the WC and ETP for the period from 1851 to 2100 under the optimistic scenario 4.5, compared to pre-industrial temperatures of the 1850s (Figure 7, Table 5). Pairwise PERMANOVA analyses revealed significant permanent increases in temperature anomalies across the northeastern tropical Pacific after the 1930s, southern, northern and northwestern Caribbean after the 1940s, western and eastern Caribbean after the 1950s, southeastern tropical Pacific across the 1960s, and across the southwestern Caribbean after the 1970s.
The analysis indicates a clear trend of increasing temperature anomalies across all subregions over the decades, with each region experiencing significant changes at different times. These findings highlight the ongoing impacts of climate change in these regions and underscore the urgency for adaptive management and conservation strategies to mitigate these effects on marine ecosystems, even under the optimistic scenario 4.5.
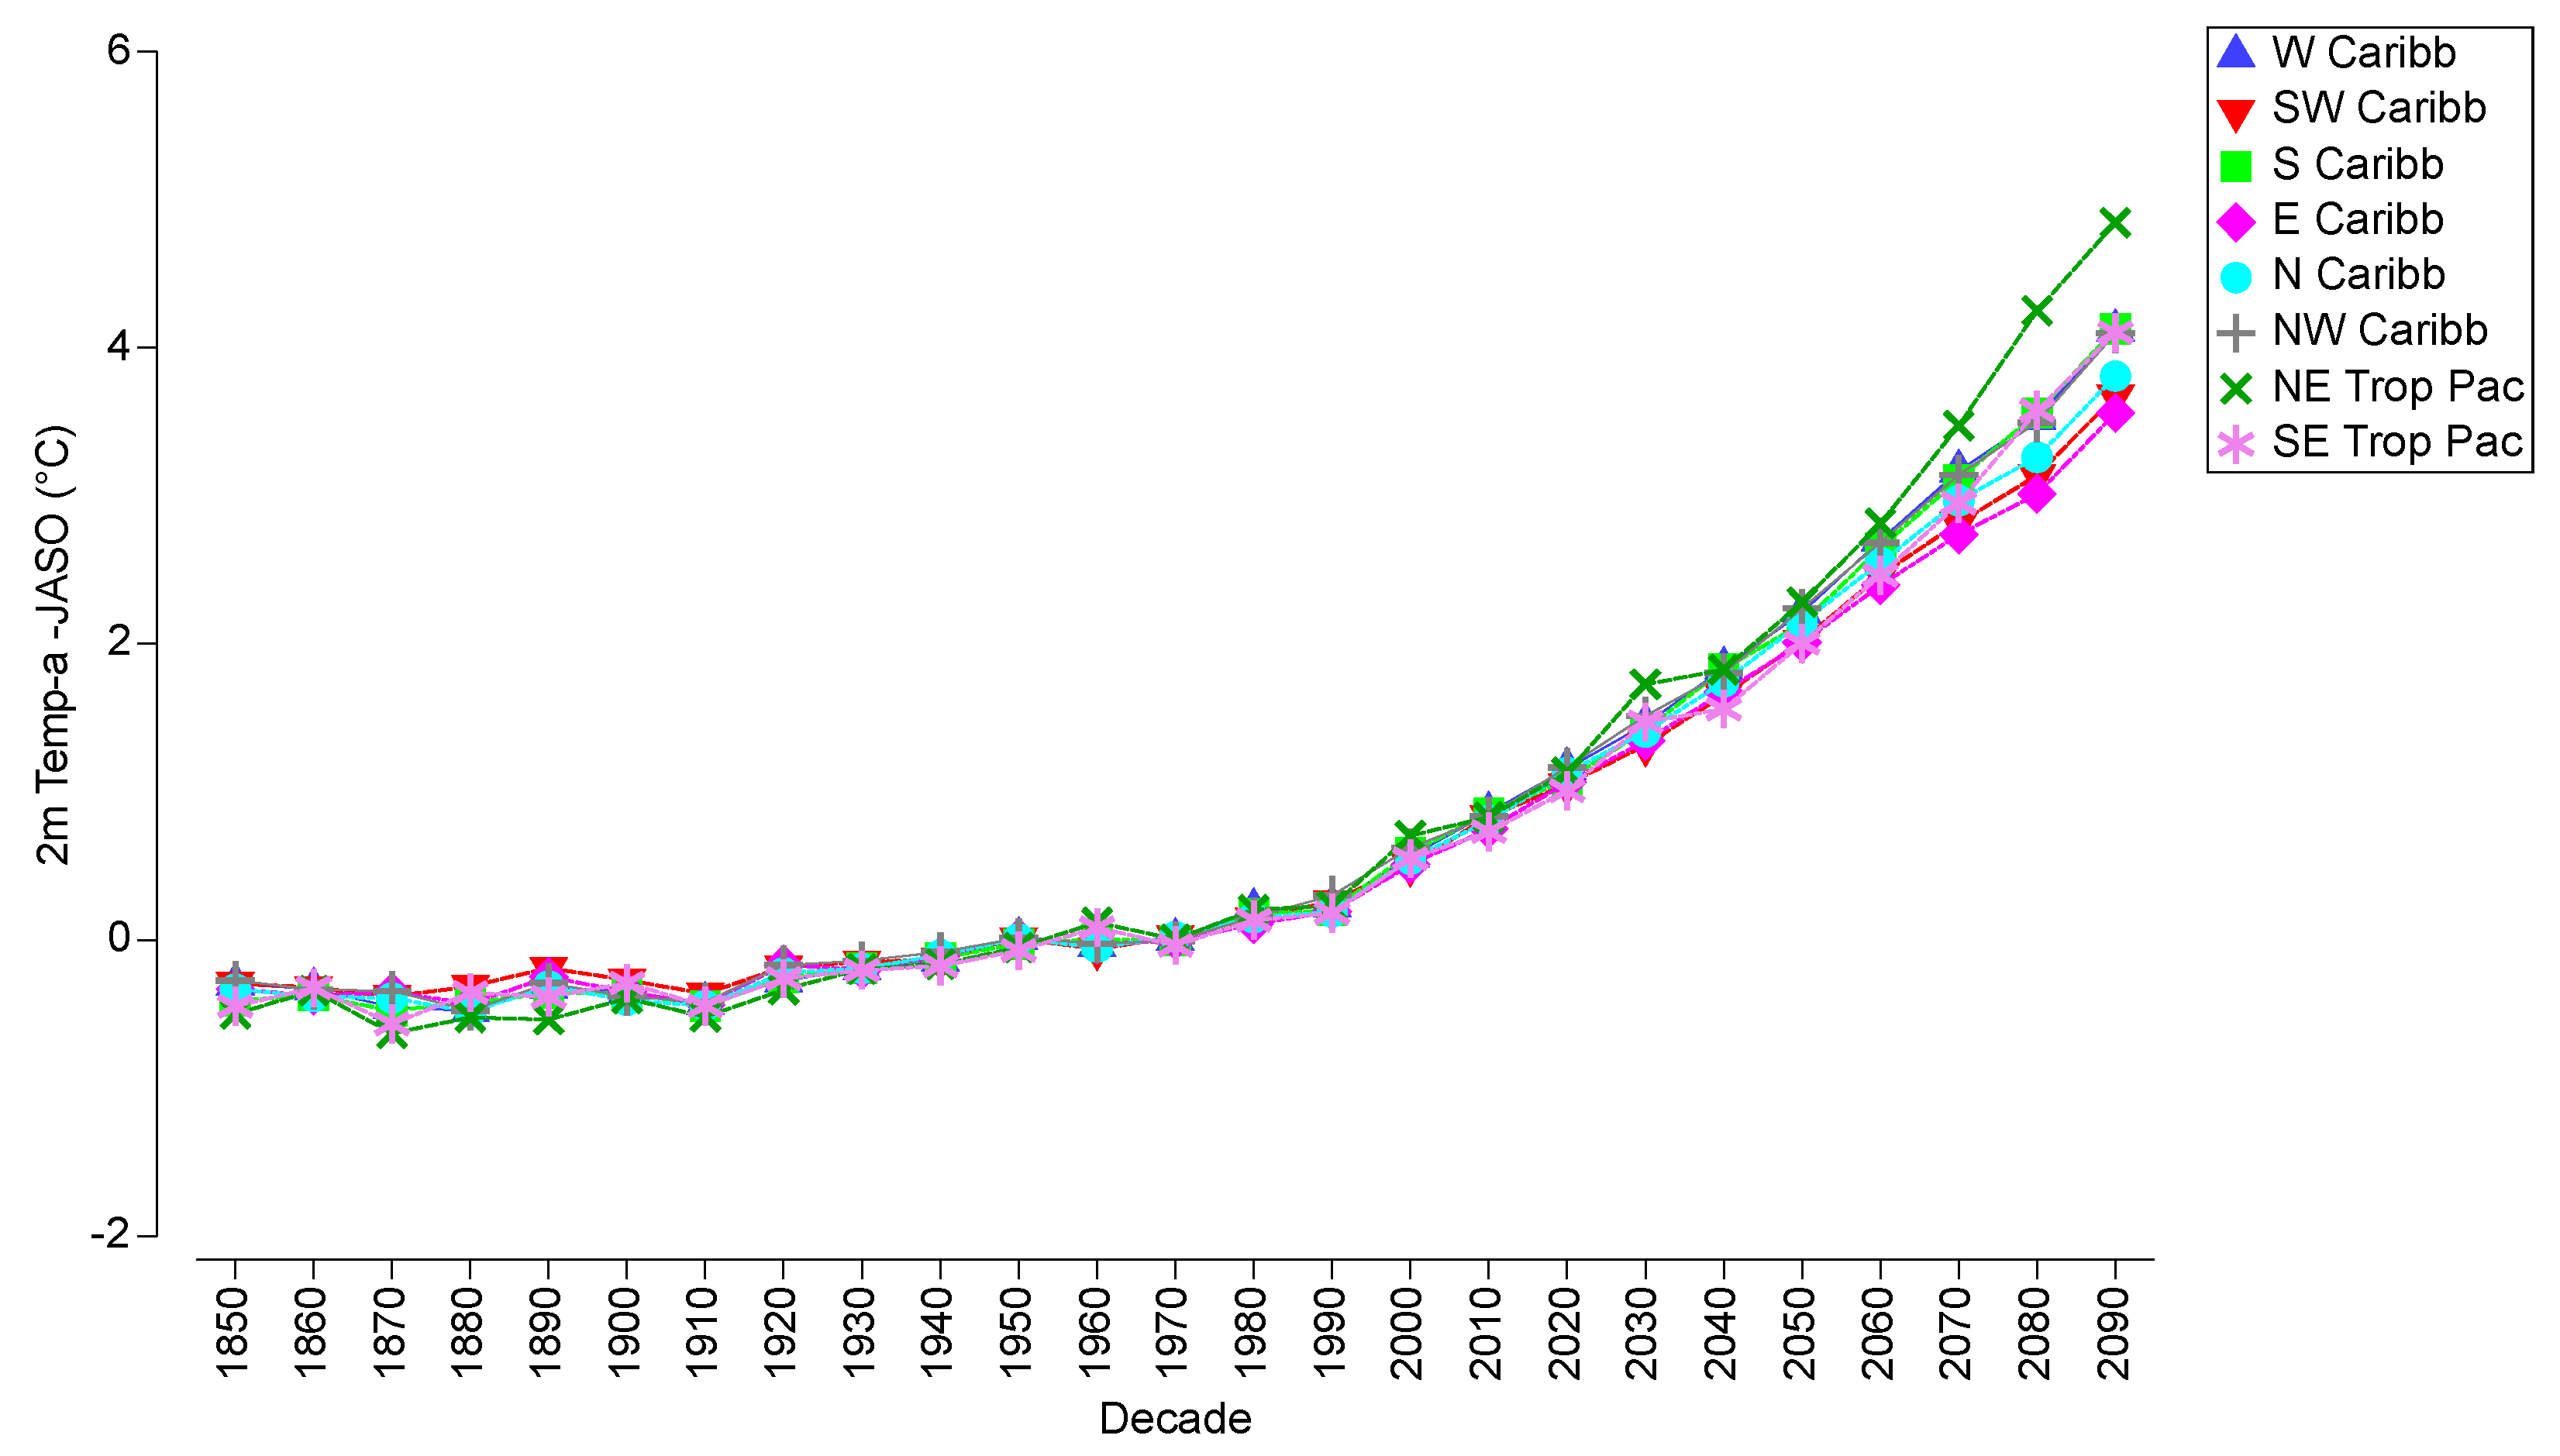
The projected trends in JASO surface (2 m) temperature and SST anomalies under scenarios 4.5 and 8.5 indicate significant warming across the WC and ETP (Figures S1–S8). Modeled JASO surface (2 m) temperature anomalies across the western Caribbean averaged −0.2981 °C during the 1850s, +1.1063 °C during the 2020s, and are projected to rise to +2.2623 °C during the 2090s under scenario 4.5, an average increase of 0.1170 °C/decade until the 2020s, and a projected increase of 0.1651 °C/decade between the 2020s and 2090s (Figure 7, Table 6). The southwestern Caribbean average anomaly was −0.2918 °C in the 1850s, +1.1131 °C in the 2020s, and is projected to increase to +2.1057 °C in the 2090s, an average of 0.1171 °C/decade until the 2020s, and a projection of 0.1418 °C/decade between the 2020s and 2090s. There was an average of −0.4090 °C in the 1850s and +1.0517 °C in the 2020s across the southern Caribbean, with a projected rise of +2.2318 °C by the 2090s, which represents an average rise of 0.1217 °C/decade until the 2020s and a projected shift of 0.1686 °C/decade between the 2020s and 2090s. Modeled JASO surface (2 m) temperature anomalies across the eastern Caribbean averaged −0.3334 °C during the 1850s, +1.1159 °C during the 2020s, and are projected to rise to +2.0885 °C during the 2090s under scenario 4.5, an average increase of 0.1208 °C/decade until the 2020s and a projected increase of 0.1389 °C/decade between the 2020s and 2090s
The projected trends in JASO surface (2 m) temperature anomalies under scenario 4.5 indicate significant warming also across the northern Caribbean, with −0.3329 °C during the 1850s, +1.1115 °C during the 2020s, and a projected rise to +2.1857 °C during the 2090s, or an average increase of 0.1204 °C/decade until the 2020s, and a projected shift of 0.1535 °C/decade between the 2020s and 2090s (Figure 7, Table 6). The northwestern Caribbean averaged −0.2733 °C in the 1850s, +1.1629 °C in the 2020s, and has a projected rise of +2.3208 °C by the 2090s, an average of 0.0798 °C/decade until the 2020s, and a projected rise of 0.1654 °C/decade between the 2020s and 2090s. An average of −0.5379 °C in the 1850s and of +0.9555 °C in the 2020s was observed in the northeastern tropical Pacific, with a projected rise of +2.3655 °C by the 2090s, an average of 0.0830 °C/decade until the 2020s, and a projected rise to 0.2014 °C/decade between the 2020s and 2090s. The southeastern tropical Pacific averaged −0.4475 °C in the 1850s, +0.9415 °C in the 2020s, and has a projected rise of +2.0457 °C by the 2090s, an average of 0.0772 °C/decade until the 2020s, and a projected increase of 0.1577 °C/decade between the 2020s and 2090s.
All regions exhibit significant warming trends, with the northeastern tropical Pacific showing the highest projected increase of 0.2014 °C/decade between the 2020s and 2090s. These trends are essential for understanding the potential impacts on marine ecosystems, emphasizing the need for proactive climate adaptation measures in these vulnerable regions.
The modeled trends in JASO surface (2 m) temperature anomalies reveal significant regional increases across the WC and ETP, particularly in recent decades, as well as concerning warming projections, even under optimistic scenario 4.5. The regional average increase between 1850 and 2020 was 0.1196 °C/decade; however, the sub-period of 2000–2020 averaged 0.2504 °C per decade (Table 6). This rate is 2.5 times the global average. The projected average temperature anomaly rise for 2020–2100 under scenario 4.5 is 0.1616 °C/decade (1.6 times the global average), but with a projected average of 0.2175 °C/decade for the sub-period of 2020–2050, and 0.1196 °C/decade for the sub-period of 2050–2100. The data indicate a marked projected increase in regional temperature anomalies, with the most significant rise occurring in the 2000–2020 period. The projections under scenario 4.5 suggest continued warming, particularly in the first half of the 21st century, emphasizing the need for urgent climate action and adaptation strategies in the region.
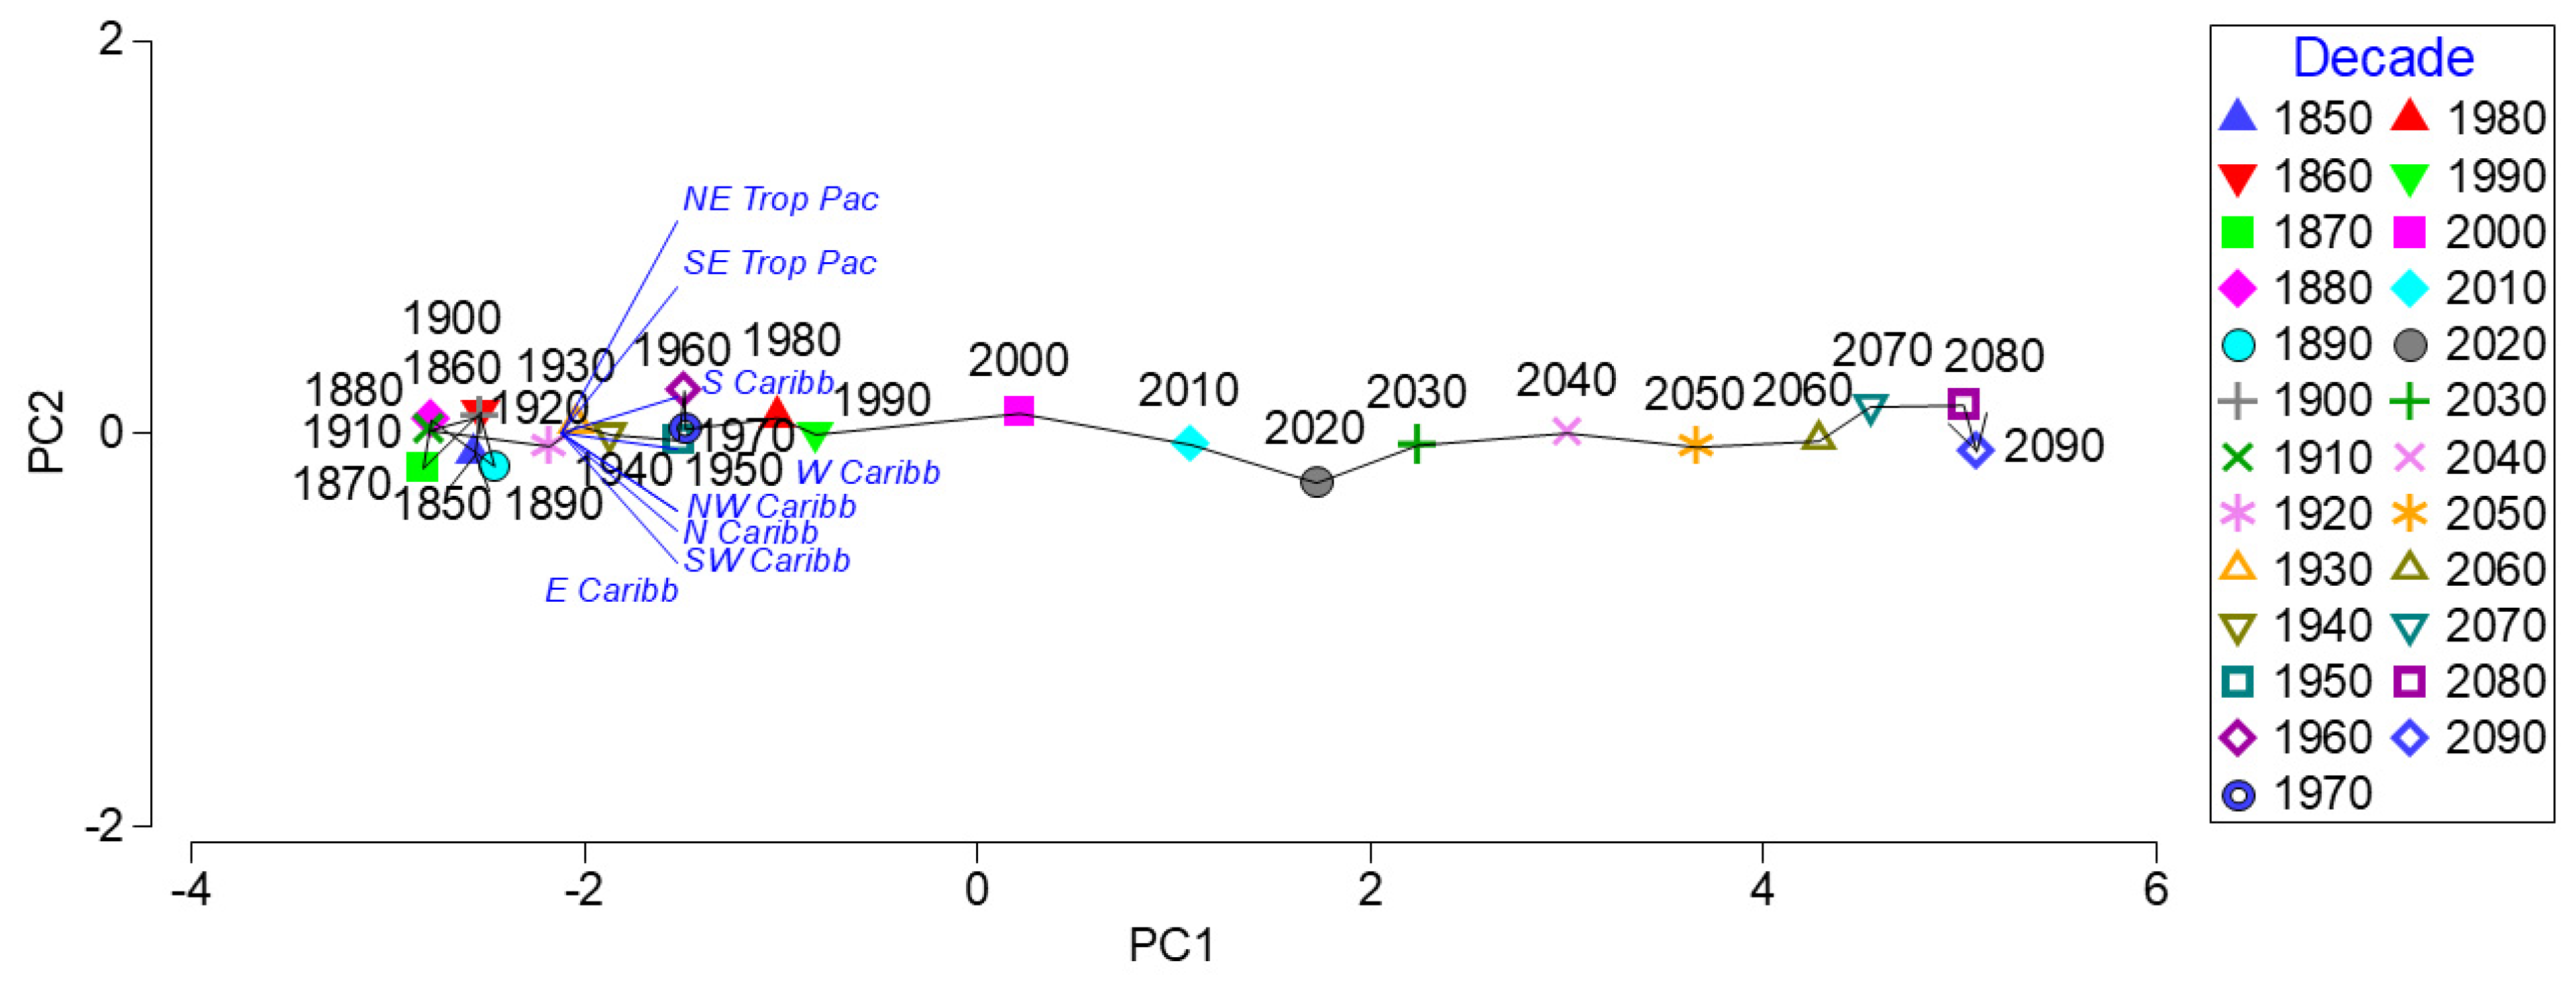
The results from the pairwise PERMANOVA analysis and principal component analysis (PCA) provide important insights into projected changes in JASO surface (2 m) temperature anomalies across the WC and ETP under scenario 4.5. Significant increases in temperature anomalies are projected across the southern Caribbean by the 2030s (t = 2.32, p = 0.0326). Significant increases in temperature anomaly by the 2040s are projected to occur across the western (t = 3.35, p = 0.0008), southwestern (t = 2.78, p = 0.0059), eastern (t = 2.28, p = 0.0233), northern (t = 3.27, p = 0.0005), and northwestern Caribbean (t = 4.04, p < 0.0001), and across the northeastern tropical Pacific (t = 4.17, p = 0.0006) and the southeastern tropical Pacific (t = 2.80, p = 0.0056). PCA showed that after the 1990s, JASO surface (2 m) temperature anomalies are projected to exceed a +1.5 °C anomaly compared to pre-industrial temperatures, even under the optimistic scenario 4.5 (Figure 8). The analyses indicate a concerning trend of increasing temperature anomalies across all assessed subregions even under an optimistic scenario, with significant increments anticipated as early as the 2030s and 2040s.
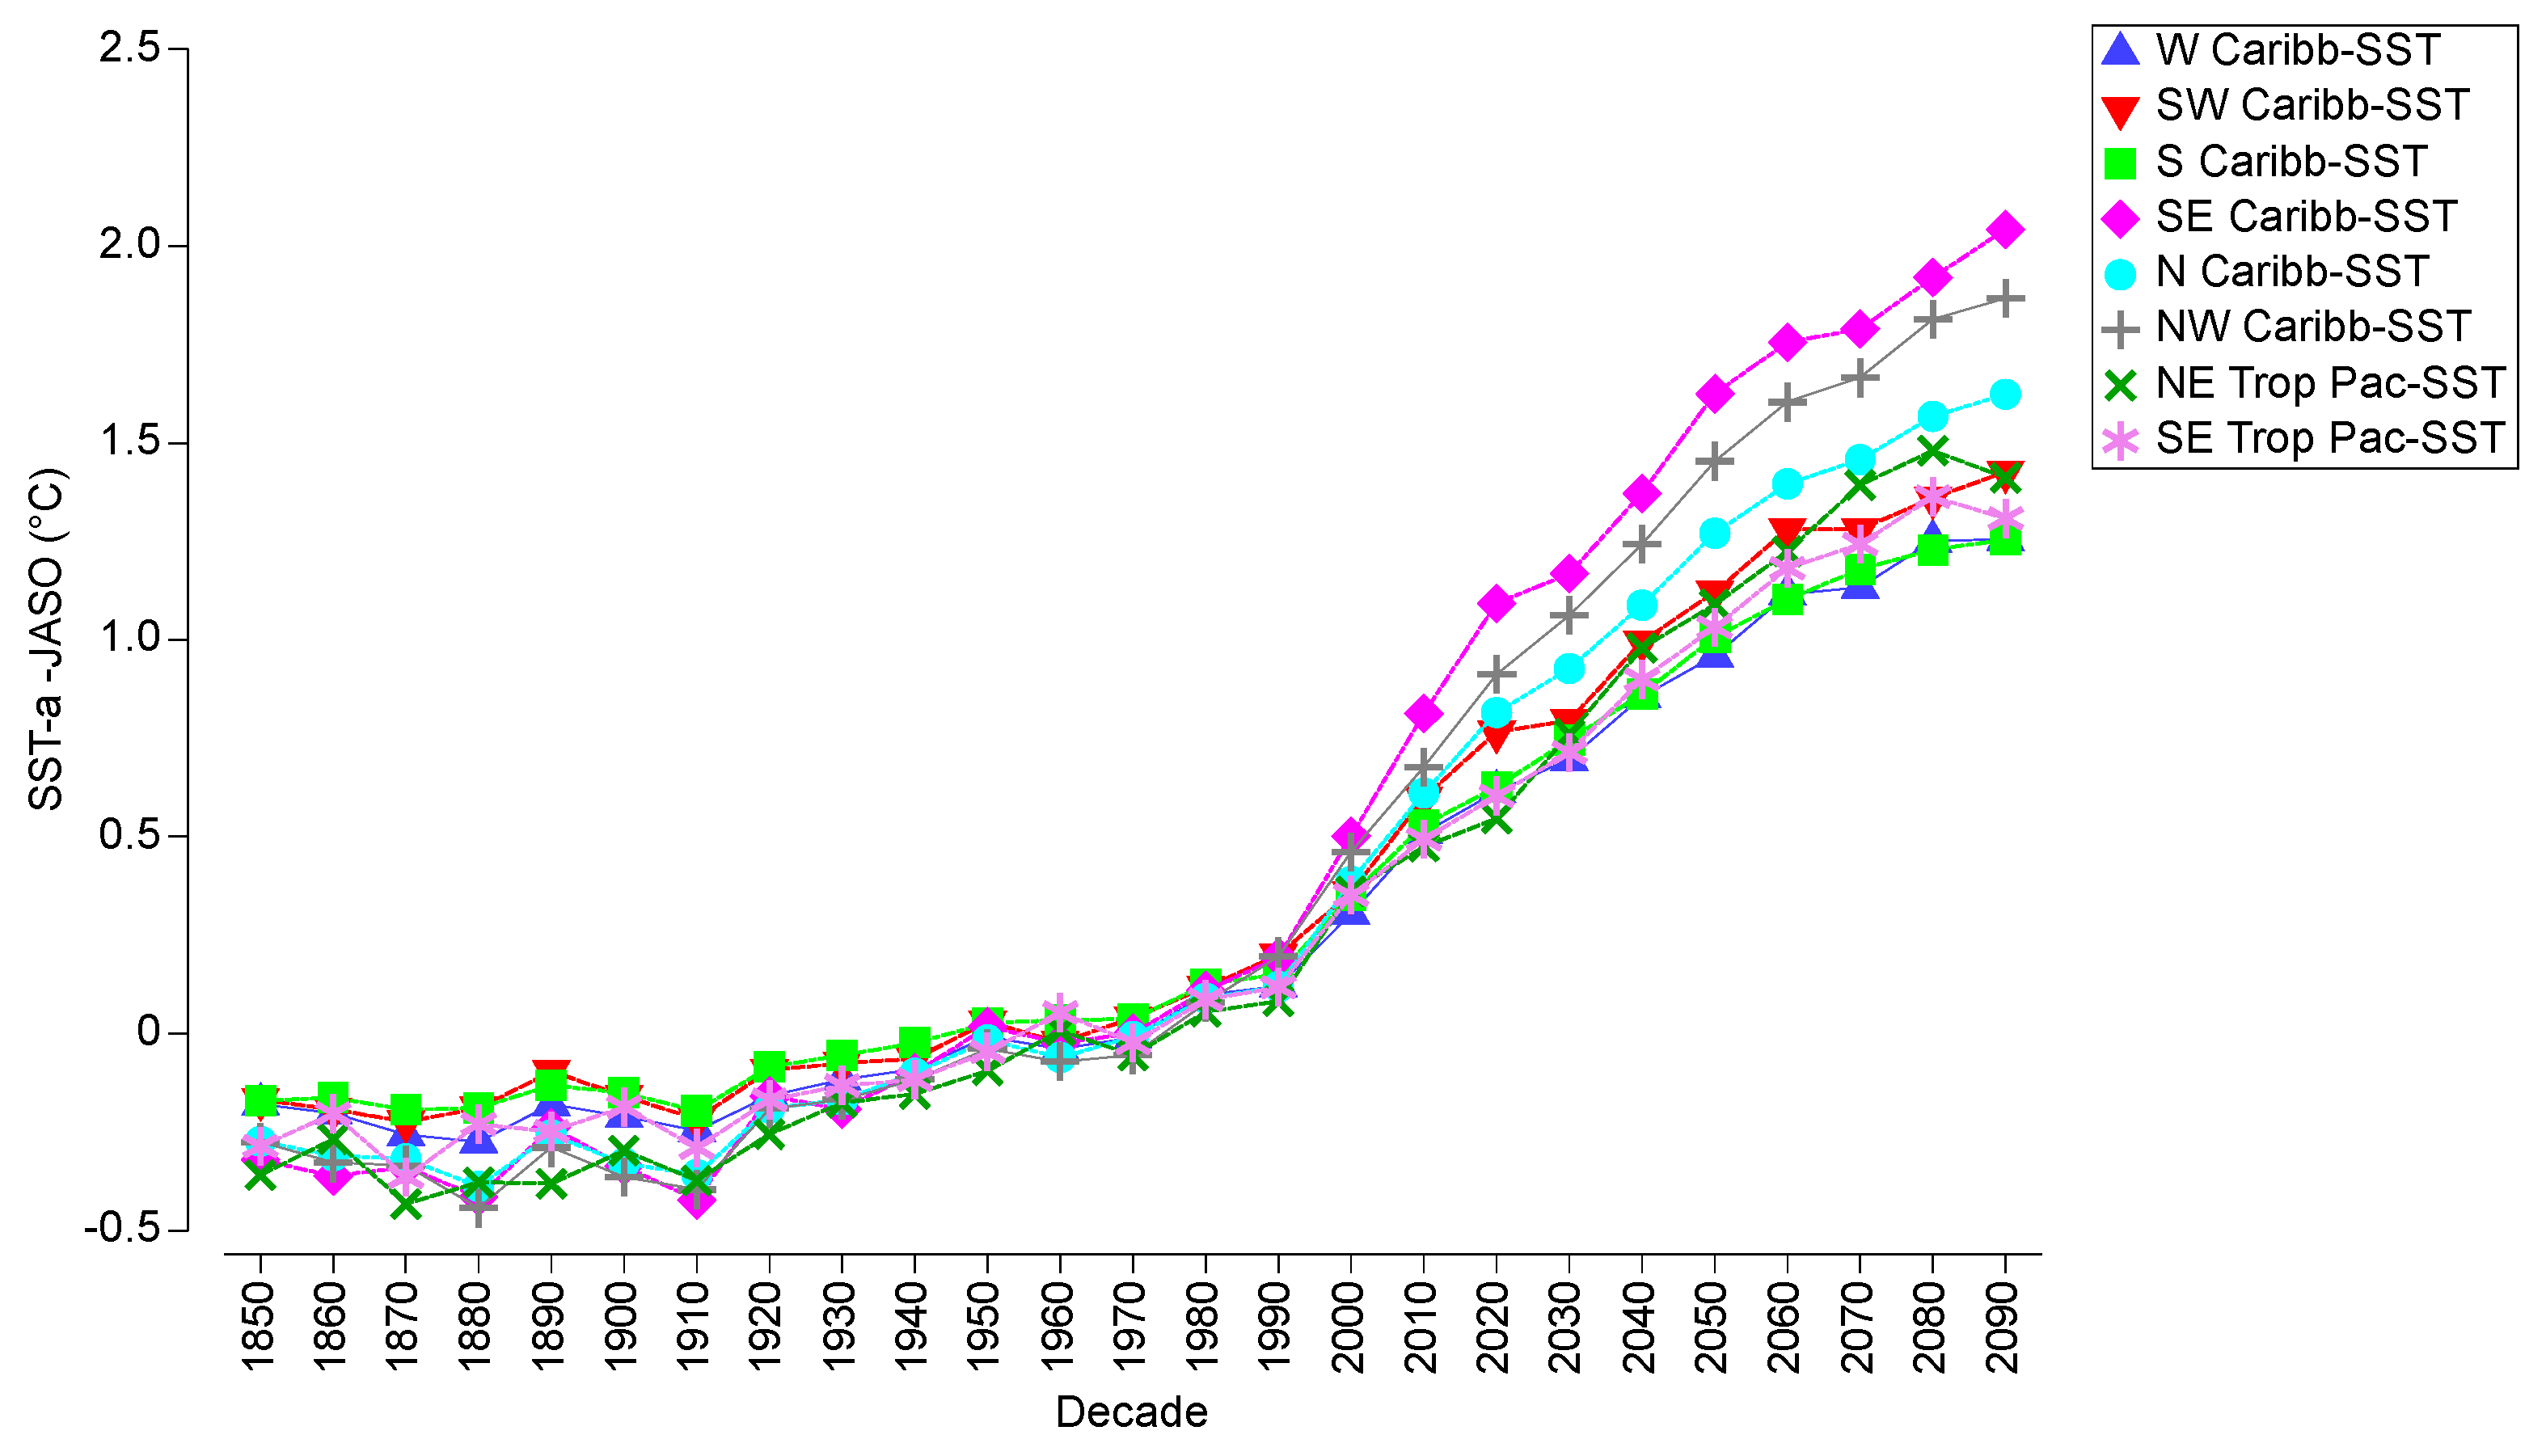
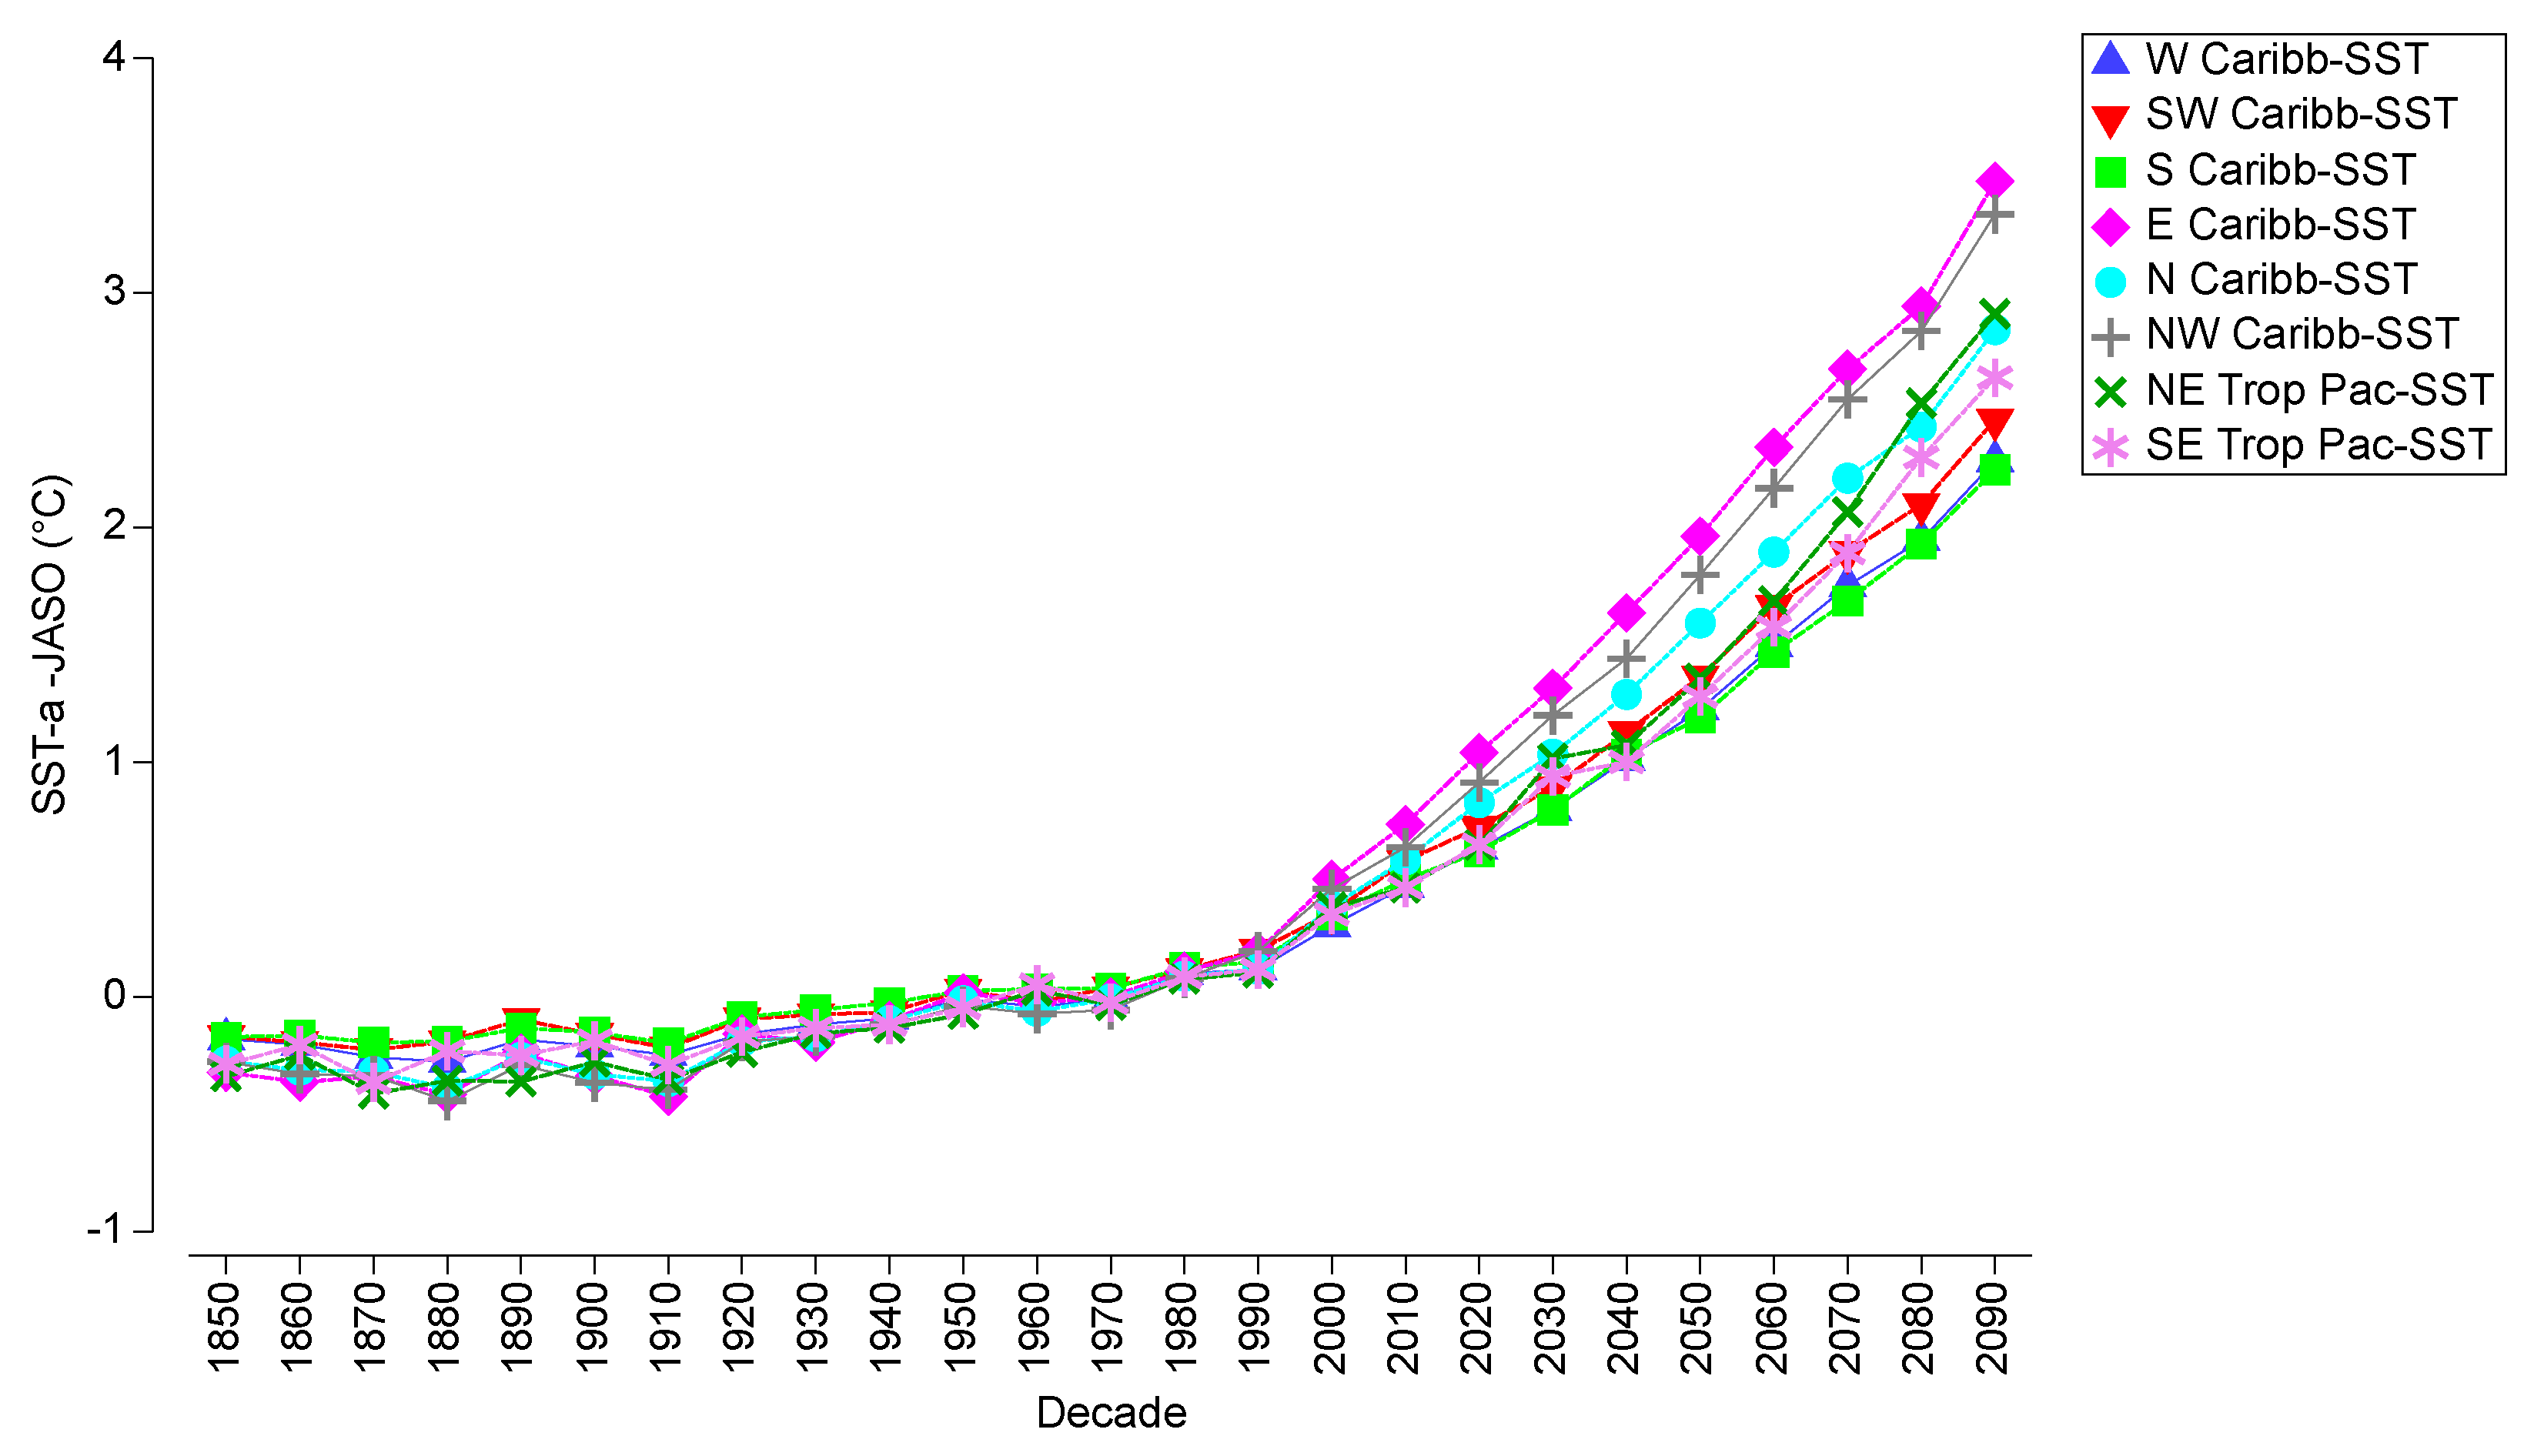
The analysis of JASO SST-a projections also reveals significant rising trends (p < 0.0001) across all eight subregions of WC and ETP for the period of 1851 to 2100, compared to pre-industrial temperatures of the 1850s (Figure 9, Table 5). Permanent increases in SST-a were documented by the 1930s across the northeastern tropical Pacific, by the 1940s across the southern, northern, and northwestern Caribbean, by the 1950s across the western and eastern Caribbean, by the 1960s across the southeastern tropical Pacific, and by the 1970s across the southwestern Caribbean. The findings illustrate a clear trend of increasing SST anomalies across all subregions, indicating significant warming over the decades. This warming has important implications for marine ecosystems, influencing species distribution, coral health, and overall biodiversity.
The projected trends in JASO SST-a under scenario 4.5 reflect significant warming across various subregions. Observed JASO SST-a across the western Caribbean averaged −0.1796 °C in the 1850s and +0.6141 °C in the 2020s, with a projected rise of +1.2549 °C by the 2090s, and average increase of 0.0661 °C/decade by the 2020s, and a projected shift of 0.0915 °C/decade between the 2020s and 2090s (Figure 9, Table 7). The southwestern Caribbean averaged −0.1678 °C during the 1850s and +0.7661 °C in the 2020s, with a projection of +1.4264 °C during the 2090s, an average rise of 0.0778 °C/decade until the 2020s, and a projection of 0.0943 °C/decade between the 2020s and 2090s. The SST-a across the southern Caribbean averaged −0.1709 °C in the 1850s and +0.6266 °C in the 2020s, with a projection of +1.2540 °C by the 2090s, an average rise of 0.0665 °C/decade until the 2020s, and a projection of 0.0896 °C/decade between the 2020s and 2090s. Average SST-a was −0.3209 °C in the 1850s and +1.0931 °C in the 2020s across the eastern Caribbean, with a projection of +2.0421 °C by the 2090s, an average increase of 0.1178 °C/decade until the 2020s, and a projection of 0.1356 °C/decade between the 2020s and 2090s.
The modeled trends in JASO SST-a under scenario 4.5 also indicate notable warming across other subregions (Figure 9, Table 7). The northern Caribbean averaged −0.2736 °C during the 1850s and +0.8151 °C during the 2020s, with a projected rise of +1.6236 °C by the 2090s, an average increase of 0.0907 °C/decade until the 2020s, and a projected increase of 0.1155 °C/decade between the 2020s and 2090s. Average JASO SST-a was −0.2758 °C in the 1850s and +0.9123 °C in the 2020s across the northwestern Caribbean, with a projection of +1.8674 °C by the 2090s, an average rise of 0.0990 °C/decade until the 2020s, and a projection of 0.1364 °C/decade by the 2090s. JASO SST-a across the northeastern tropical Pacific averaged −0.3592 °C in the 1850s and +0.5461 °C in the 2020s, with projections of +1.4121 °C by the 2090s, an average increment of 0.0754 °C/decade until the 2020s, and a projection of 0.1237 °C/decade by the 2090s. The southeastern tropical Pacific averaged −0.2862 °C in the 1850s and +0.6035 °C in the 2020s, with a projection of +1.3082 °C by the 2090s, an average rise of 0.0741 °C/decade until the 2020s, and a projection of 0.1007 °C/decade by the 2090s.
Even under scenario 4.5, all subregions show significant warming trends, with projections indicating increases in SST-a becoming more pronounced as we approach the end of the century. The eastern, northwestern, and northern Caribbean exhibit the highest projected increases in mean SST-a between the 2020s and 2090s, highlighting it as a crucial area for monitoring. These temperature increases are likely to have substantial effects on marine ecosystems, necessitating proactive climate strategies to mitigate potential impacts on biodiversity, fisheries, and livelihoods.
Mean regional average increase in JASO SST-a was 0.0865 °C/decade for the period of 1850–2020, but 0.1813 °C/decade for the sub-period of 2000–2020, which was 1.8 times the global ocean average (Table 7). The projected regional average for the period of 2020–2100 under scenario 4.5 is 0.1109 °C/decade. However, for the sub-period of 2020–2050, the projection is 0.1492 °C/decade, while the sub-period of 2050–2100 is 0.0823 °C/decade. This suggests a significant overshoot beyond average ocean warming trends and then a gradual moderate leveling, but not a reversal in warming trends.
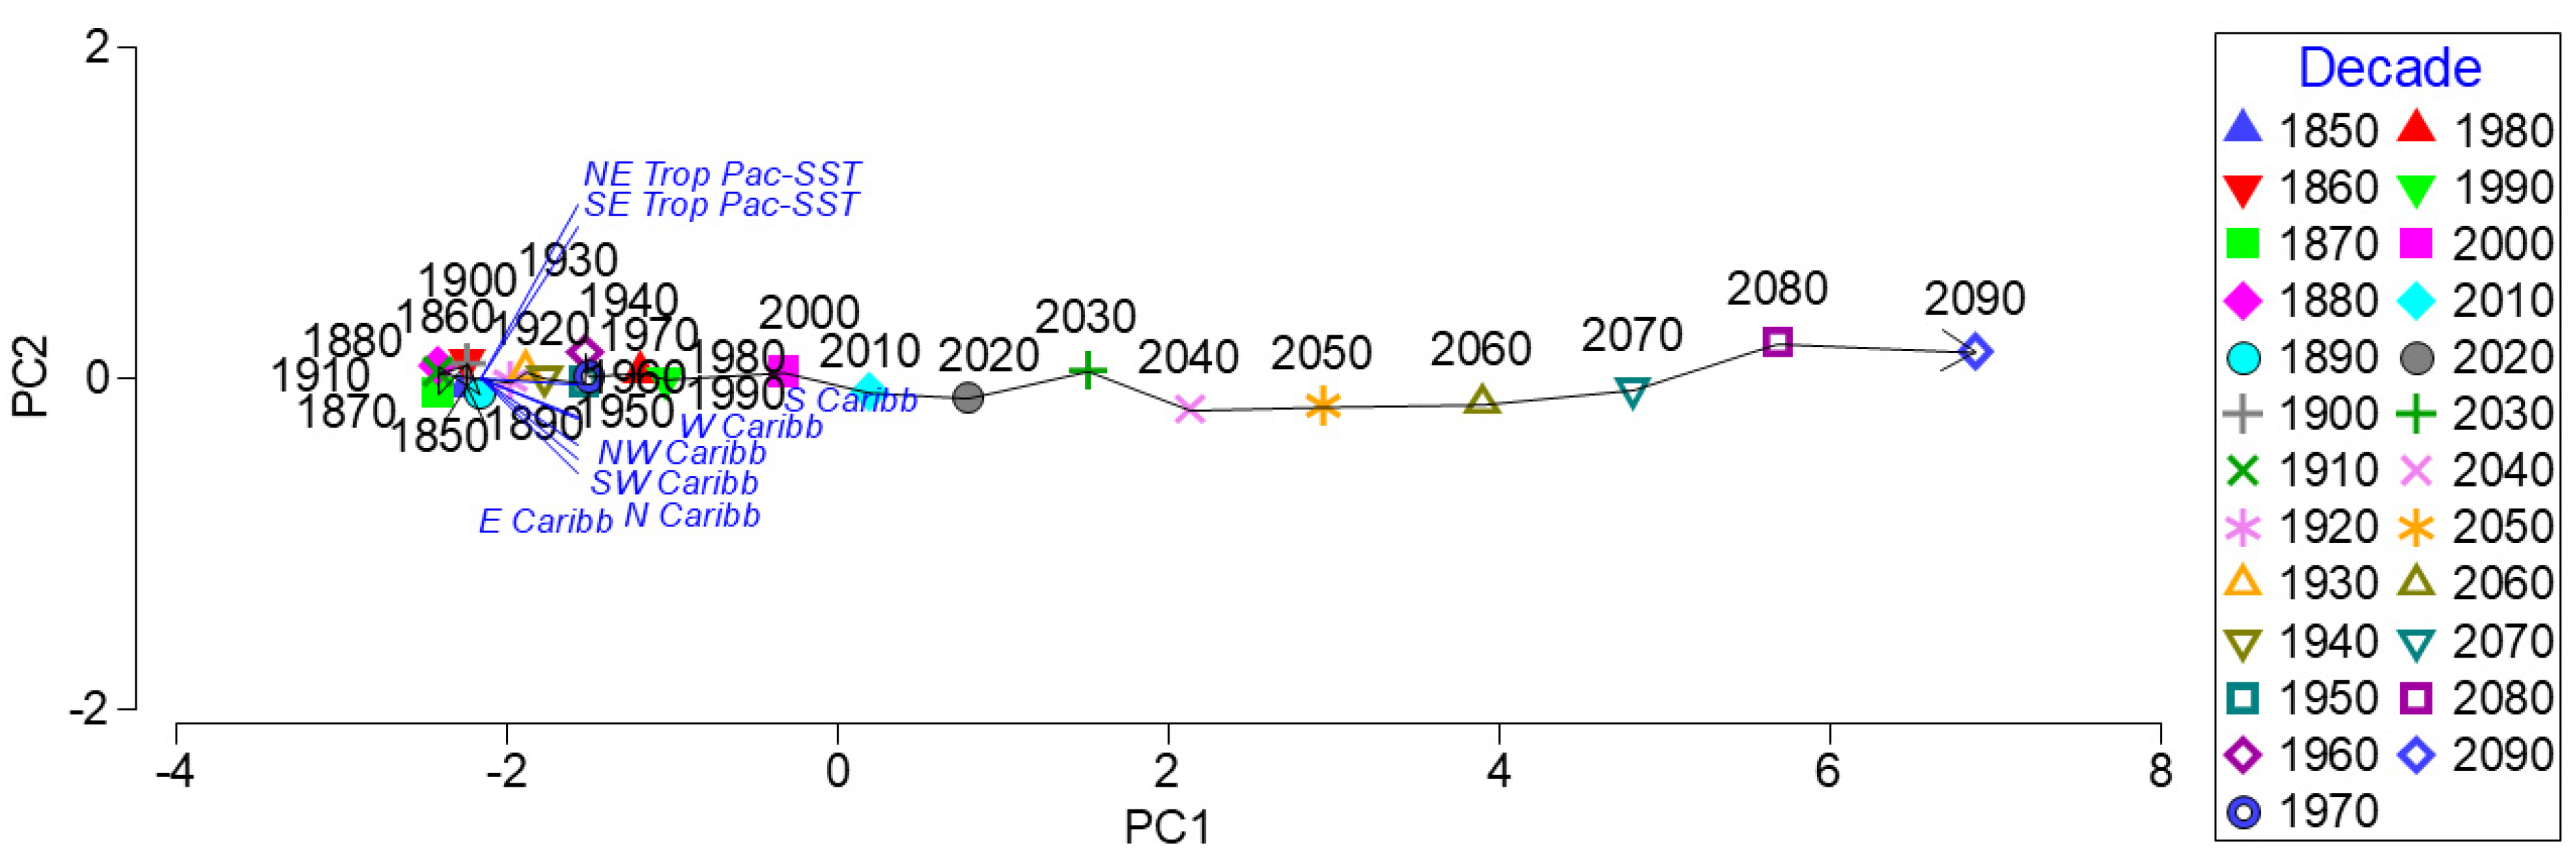
When JASO SST-a during the 2020s was compared to projected changes under scenario 4.5, a significant increase was projected by the 2040s across the western (t = 3.39, p = 0.0010), southwestern (t = 2.74, p = 0.0071), southern (t = 3.45, p = 0.0016), eastern (t = 2.28, p = 0.0244), northern (t = 3.25, p = 0.0007) and northwestern Caribbean (t = 4.01, p = 0.0002), and across the northeastern (t = 4.29, p = 0.0002) and the southeastern tropical Pacific (t = 2.80, p = 0.0070). PCA showed that following the 1990s, SST anomaly is also projected to curve well beyond the +1.0 °C anomaly when compared to historical maximum JASO temperatures, even under optimistic scenario 4.5 (Figure 10). This variation is projected to respond to generalized increases in SST-a across all subregions.

3.4. Modeled Historical Variation in Temperature Anomalies 1851–2100—Scenario 8.5

There was a highly significant decadal-scale increase (p < 0.0001) in JASO surface (2 m) temperature anomaly projections across each of the eight different WC and ETP subregions for the period of 1851 to 2100 under business-as-usual scenario 8.5 when compared to pre-industrial temperatures of the 1850s (Figure 11, Table 8).
Pairwise PERMANOVA analyses showed a significant permanent increase in temperature anomaly after the 1930s across the southern Caribbean and the northeastern tropical Pacific, after the 1940s across the northern and northwestern Caribbean, after the 1950s across the western and eastern Caribbean and across the southeastern tropical Pacific, and after the 1970s across the southwestern Caribbean.
The modeled JASO surface (2 m) temperature anomaly under scenario 8.5 averaged −0.2981 °C across the western Caribbean during 1850s, +1.1561 °C during the 2020s, and +4.1161 °C during the 2090s (Figure 11, Table 9), an average increase of 0.1212 °C/decade until the 2020s, and a projected increase of 0.4229 °C/decade between the 2020s and 2090s. Temperature anomaly averaged −0.2918 °C in the 1850s across the southwestern Caribbean, +1.0504 °C in the 2020s, and +3.6753 °C in the 2090s, an average increase of 0.1119 °C/decade until the 2020s, and a projected increase of 0.3750 °C/decade between the 2020s and 2090s. The southern Caribbean averaged −0.4090 °C in the 1850s and +1.0808 °C in the 2020s, with a projection of +4.1277 °C by the 2090s, an average of 0.1242 °C/decade until the 2020s, and a projection of 0.4353 °C/decade between the 2020s and 2090s. The eastern Caribbean averaged −0.3334 °C during the 1850s and +1.0634 °C during the 2020s, with a projected rise of +3.5575 °C by the 2090s, an average of 0.1164 °C/decade until the 2020s, and a projection of 0.3563 °C/decade between the 2020s and 2090s.
Mean JASO surface (2 m) temperature anomaly across the northern Caribbean averaged −0.3329 °C during the 1850s and +1.1302 °C during the 2020s, with projections of +3.8079 °C during the 2090s, averaging 0.1219 °C/decade until the 2020s, and a projection of 0.3825 °C/decade between the 2020s and 2090s under scenario 8.5. Temperature anomaly across the northwestern Caribbean averaged −0.2733 °C in the 1850s and +1.1664 °C in the 2020s, with projected +4.0969 °C during the 2090s, averaging 0.1200 °C/decade until the 2020s, and a projection of 0.4178 °C/decade between the 2020s and 2090s. The northeastern tropical Pacific averaged −0.5000 °C in the 1850s and +1.1309 °C in the 2020s, with projected +4.8434 °C during the 2090s, averaging 0.1359 °C/decade until the 2020s, and a projection of 0.5304 °C/decade between the 2020s and 2090s. JASO surface (2 m) temperature anomaly averaged −0.4475 °C in the 1850s across the southeastern tropical Pacific and +1.0079 °C in the 2020s, with projected +4.1014 °C by the 2090s, averaging 0.1213 °C/decade until the 2020s and a projection of 0.4419 °C/decade between the 2020s and 2090s.
Mean regional average increase in JASO surface (2 m) temperature anomaly was 0.1216 °C/decade for the period of 1850–2020, but 0.2597 °C/decade for the sub-period of 2000–2020, which was 2.6 times the global average (Table 9). Projected average for the period of 2020–2100 under scenario 8.5 is 0.4203 °C/decade, or 4.2 times the global average. However, for the sub-period of 2020–2050, the projection is 0.3440 °C/decade, while for the sub-period of 2050–2100 it is 0.4776 °C/decade.
Pairwise PERMANOVA analysis showed that when JASO surface (2 m) temperature anomaly during the 2020s was compared to projected changes under a business-as-usual scenario 8.5, a significant increase was projected by the 2030s across the western (t = 2.51, p = 0.0250), southwestern (t = 2.31, p = 0.0342), southern (t = 2.81, p = 0.0125), eastern (t = 2.27, p = 0.0381), northern (t = 2.39, p = 0.0284) and northwestern Caribbean (t = 2.93, p = 0.0077), and across the northeastern tropical Pacific (t = 2.41, p = 0.0272), and by the 2040s across the southeastern tropical Pacific (t = 2.83, p = 0.0139). PCA showed that following the 2000s, JASO surface (2 m) temperature anomaly is projected to increase well beyond the +1.5 °C anomaly when compared to pre-industrial temperatures under business-as-usual scenario 8.5 (Figure 12). This variation is predicted to respond to generalized increases in JASO 2 m temperature anomaly across all subregions.
The analyses reveal a worrying trend of increasing temperature anomalies under business-as-usual scenario 8.5, with significant warming expected as early as the 2030s. The projections highlight the urgency of addressing climate change impacts, as sustained increases in temperature anomalies could lead to severe ecological and socio-economic consequences in the affected regions. This information underscores the need for robust climate policies and adaptive strategies to mitigate the effects of rising temperatures on marine ecosystems and communities.
There was also a highly significant decadal-scale increase (p < 0.0001) in JASO SST-a projections across each of the eight different WC and ETP subregions for the period of 1851 to 2100 under business-as-usual scenario 8.5 when compared to pre-industrial temperatures of the 1850s (Figure 13). Pairwise PERMANOVA analyses showed a significant permanent increase in JASO SST-a after the 1930s across the northeastern tropical Pacific subregion, and after the 1940s across the southern, northern, and northwestern Caribbean subregions. A permanent increase in SST anomaly was also observed after the 1950s across the western, southwestern, and eastern Caribbean, and across the southeastern tropical Pacific.
The modeled JASO SST-a under scenario 8.5 averaged −0.1796 °C across the western Caribbean during 1850s and +0.6325 °C during the 2020s, with projected +2.2839 °C by the 2090s (Figure 13, Table 10), an average rise of 0.0677 °C/decade until the 2020s, and a projection of 0.2359 °C/decade between the 2020s and 2090s. SST-a averaged −0.1678 °C in the 1850s across the southwestern Caribbean and +0.7229 °C in the 2020s, and a projection of +2.4593 °C during the 2090s, averaging 0.0742 °C/decade until the 2020s, and 0.2481 °C/decade between the 2020s and 2090s. An average anomaly of −0.1709 °C was observed during the 1850s in the southern Caribbean and +0.6181 °C during the 2020s, with a projection of +2.2473 °C by the 2090s, averaging 0.0658 °C/decade until the 2020s, and 0.2327 °C/decade between the 2020s and 2090s. Mean JASO SST-a was −0.3209 °C in the 1850s across the eastern Caribbean and +1.0418 °C in the 2020s, with a projection of +3.4757 °C during the 2090s, averaging 0.1136 °C/decade until the 2020s, and a projection of 0.3477 °C/decade between the 2020s and 2090s.
The northern Caribbean averaged a mean JASO SST-a of −0.2736 °C during the 1850s and +0.8287 °C during the 2020s, with projected +2.8440 °C during the 2090s, an average rise of 0.0919 °C/decade until the 2020s and a projection of 0.2879 °C/decade between the 2020s and 2090s under scenario 8.5. The northwestern Caribbean averaged −0.2758 °C in the 1850s and +0.9144 °C in the 2020s, with projections of +3.3358 °C during the 2090s, an average increase of 0.0992 °C/decade until the 2020s, and a projection of 0.3459 °C/decade between the 2020s and 2090s. There was an average JASO SST-a of −0.3380 °C in the 1850s across the northeastern tropical Pacific and +0.6473 °C in the 2020s, with projections of +2.9107 °C by the 2090s, averaging 0.0821 °C/decade until the 2020s, and a projection of 0.3233 °C/decade between the 2020s and 2090s. The southeastern tropical Pacific averaged −0.2862 °C in the 1850s and +0.6491 °C in the 2020s, with projected +2.6390 °C during the 2090s, averaging 0.0779 °C/decade until the 2020s, and a projection of 0.2843 °C/decade between the 2020s and 2090s.
Mean regional average increase in JASO SST-a was 0.0841 °C/decade for the period of 1850–2020, but 0.1849 °C/decade for the sub-period of 2000–2020, which was 1.8 times the global ocean average (Table 10). The projected average for the period of 2020–2100 under scenario 8.5 is 0.3021 °C/decade. However, for the sub-period of 2020–2050, the projection is 0.2371 °C/decade, while for the sub-period of 2050–2100, it is 0.3258 °C/decade.
Pairwise PERMANOVA analysis showed that when JASO SST-a during the 2020s was compared to the projected change under scenario 8.5, a significant increase was expected by the 2030s across the western Caribbean (t = 2.59, p = 0.0203), southwestern Caribbean (t = 2.22, p = 0.0371), southern Caribbean (t = 2.60, p = 0.0169), eastern Caribbean (t = 2.27, p = 0.0381), northern Caribbean (t = 2.38, p = 0.0305), northwestern Caribbean (t = 2.91, p = 0.0082), and the northeastern tropical Pacific (t = 2.60, p = 0.0200), and by the 2040s across the southeastern tropical Pacific (t = 2.81, p = 0.0132). PCA also showed that following the 2000s, SST-a is also likely ascend well beyond the +1.0 °C anomaly when compared to historical maximum JASO SST-a under business-as-usual scenario 8.5 (Figure 14).
There is a significant upward trend in SST-a scenario 8.5, with notable changes expected as early as the 2030s. The projected warming underscores the urgent need for climate action and coral reef conservation and restoration adaptative strategies, as rising temperatures could severely impact marine ecosystems, biodiversity, and coastal communities. This information highlights the importance of monitoring and addressing climate change effects to mitigate potential adverse outcomes across the WC and ETP.

3.5. Observed Vs. Modeled Variation in JASO Temperature Anomalies in 2015–2024

The analysis of observed versus modeled deviations in JASO surface (2 m) and SST anomalies for the decade spanning 2015 to 2024 across the WC and ETP regions revealed significant findings. An ANOSIM test showed that the observed surface (2 m) temperature anomaly was significantly higher than modeled anomalies across the WC and ETP regions (R = 0.128, p = 0.0015), with a particular deviation from scenario 4.5 (R = 0.274, p = 0.0050) (Table 11). No significant deviation from scenario 8.5 or between scenarios 4.5 and 8.5 was documented. Observed SST-a were significantly higher than modeled anomalies (R = 0.152, p = 0.0030), with significantly higher observations than modeled scenarios 4.5 (R = 0.292, p = 0.0010) and 8.5 (R = 0.119, p = 0.0260). No significant difference between scenarios 4.5 and 8.5 was observed.
The results indicate that observed temperature anomalies in the WC and ETP regions are significantly higher than those projected by the models, particularly under scenario 4.5. The lack of significant differences between scenarios 4.5 and 8.5 suggests that both scenarios may not fully capture the observed extremes. These findings highlight potential shortcomings in climate models and the need for further refinement to better predict future temperature anomalies, which are fundamental for understanding climate change impacts on marine ecosystems and regional climates.
Subregional patterns of observed vs. modeled deviations in JASO surface (2 m) temperature anomaly during 2015–2024 were determined. Observed anomalies were significantly higher than modeled outcomes across the western Caribbean (R = 0.083, p = 0.0480), with significant deviations from scenario 4.5 (R = 0.198, p = 0.0030) (Table 12). Observed JASO surface (2 m) temperature anomaly was also significantly different from scenario 4.5 projections across the southwestern Caribbean (R = 0.182, p = 0.0190), across the eastern Caribbean (R = 0.179, p = 0.0080), with significant deviations from scenarios 4.5 (R = 0.324, p = 0.0050) and 8.5 (R = 0.072, p = 0.0011), and marginally across the northern Caribbean (R = 0.083, p = 0.0590), but significantly higher than under projected scenario 4.5 (R = 0.198, p = 0.0150). Observed JASO surface (2 m) temperature anomaly was significantly different from scenario 4.5 projections across the NW Caribbean (R = 0.198, p = 0.0260), and across the northeastern tropical Pacific (R = 0.098, p = 0.0340), with significant deviations from scenarios 4.5 (R = 0.167, p = 0.0210) and 8.5 (R = 0.185, p = 0.0150). No significant difference between observed and modeled temperature anomaly was observed either across the southern Caribbean or across the southeastern tropical Pacific. No significant differences were observed between scenarios 4.5 and 8.5 for 2015–2024 across any of the subregions.
Subregional patterns of observed vs. modeled deviations in JASO SST-a during 2015–2024 were also quantified. Observed anomalies were significantly higher across WC and ETP (R = 0.152, p = 0.0030), with significant deviations from scenarios 4.5 (R = 0.292, p = 0.0010) and 8.5 (R = 0.119. p = 0.0260) (Table 11). Variation between observed and modeled outcomes was found to be significant within the western Caribbean subregion under scenario 4.5 (R = 0.254, p = 0.0010) and under scenario 8.5 (R = 0.131, p = 0.0210) (Table 13). There were also significant deviations from scenarios 4.5 (R = 0.331, p = 0.0050) and 8.5 (R = 0.132, p = 0.0310) across the eastern Caribbean. Significant differences from scenarios 4.5 (R = 0.239, p = 0.0090) and 8.5 (R = 0.128, p = 0.0470) were also observed across the northern Caribbean. Only marginal deviations from scenario 4.5 were documented within the southern Caribbean (R = 0.076, p = 0.0670) and within the northeastern tropical Pacific (R = 0.115, p = 0.0520). Differences between observed SST-a and scenario 4.5 were also significant within the southwestern Caribbean (R = 0.193, p = 0.0080) and the northwestern Caribbean (R = 0.211, p = 0.0150). No significant deviation between observed and both modeled scenarios was observed across the southeastern tropical Pacific.

4. Discussion

4.1. Spatio-Temporal Variation in JASO Temperature Anomalies 1940–2023

Significant increases in mean JASO surface (2 m) temperature anomalies (0.1431 °C/decade) and JASO SST-a (0.0916 °C/decade) were observed from 1940 to 2023 across the WC and ETP. Decadal increases in surface temperature anomalies varied by subregion, ranging from 0.1119 °C/decade in the northwestern Caribbean to 0.1935 °C/decade in the northeastern tropical Pacific. These warming trends were 1.1 to 1.9 times the global average. There was notable spatio-temporal variability among countries, with significant increases recorded in the 1940s and 1960s in Belize/Guatemala, Colombia, Venezuela, and ETP subregions. Additionally, significant variations occurred between the 1940s and 1980s in Panamá, Aruba–Bonaire–Curaçao, Puerto Rico, Haiti, and Panamá Pacific. From the 1940s to the 1990s, significant temperature variations were noted in México, Costa Rica, the Leeward and Windward Islands, and the Bahamas, while changes from the 1940s to the 2000s were significant in south Florida.
Decadal increases in JASO SST-a from 1940 to 2023 varied by subregion, ranging from 0.0690 °C/decade in the southeastern tropical Pacific to 0.0954 °C/decade in the northwestern Caribbean, reflecting rates from just below average to average global ocean warming. Significant increases were recorded in the Bahamas and south Florida from the 1940s to 1990s, in the northeastern Mexican Pacific and Costa Rica Pacific from the 1940s to 2010s, and in the Panamá and Colombian Pacific from the 1940s to 2020s. Additionally, significant increases were observed in other regions from the 1940s to 2000s.
These results indicate a consistent warming trend across all regions from 1940 to 2023, with decadal warming rates matching or exceeding global averages. Significant coral bleaching and mortality have occurred on regional and global scales, jeopardizing coral reef conservation and restoration efforts. These changes highlight the imperative need for adaptive management and conservation strategies to protect coral reefs and their associated ecosystems.

4.2. Spatio-Temporal Variation in JASO Temperature Anomalies 1851–2100—Scenario 4.5

A significant increase in JASO surface (2 m) temperature anomalies is projected from 1851 to 2100 under optimistic scenario 4.5. Increases were noted after the 1930s in the northeastern tropical Pacific, after the 1940s in the southern, northern, and northwestern Caribbean, after the 1950s in the western and eastern Caribbean, after the 1960s in the southeastern tropical Pacific, and after the 1970s in the southwestern Caribbean. The average increase across the region was 0.1196 °C/decade from the 1850s to 2020s, rising to 0.2504 °C/decade in the 2000s–2020s. Projected increases for 2020s–2100s under scenario 4.5 average 0.1616 °C/decade, with 0.2175 °C/decade for 2020s–2050s and 0.1196 °C/decade for 2050s–2100s. This indicates a likely overshoot of JASO surface temperature anomalies lasting three to four decades, with warming trends persisting regardless of scenario. Projected increases compared to the 2020s baseline suggest significant warming by the 2030s in the southern Caribbean and by the 2040s elsewhere. Even under scenario 4.5, these trends will quickly exceed the +1.5 °C threshold above pre-industrial levels, emphasizing a narrow window for regional action, mitigation, and adaptation.
A significant increase in JASO SST-a is also projected from 1851 to 2100 even under optimistic scenario 4.5, aligning with surface (2 m) temperature warming trends. The average increase in SST-a was 0.0865 °C/decade from the 1850s to 2020s, rising to 0.1813 °C/decade in the 2000s–2020s. Projected increases for 2020s–2100s under scenario 4.5 average 0.1109 °C/decade, with 0.1492 °C/decade for 2020s–2050s and 0.0823 °C/decade for 2050s–2100s. This suggests a moderate overshoot of JASO SST-a lasting three to four decades, with trends continuing in line with current global patterns. Comparison to the 2020s baseline indicates significant increases by the 2040s across all subregions. Even under scenario 4.5, expected SST warming trends will exceed the +1.0 °C threshold above maximum annual temperatures, likely leading to recurrent mass coral bleaching and mortality events by the 2040s, threatening coral reef conservation and restoration efforts in the WC and ETP. This underscores the limited window for regional action, mitigation, and adaptation.

4.3. Spatio-Temporal Variation in JASO Temperature Anomalies 1851–2100—Scenario 8.5

JASO surface (2 m) temperature anomalies are projected to show significant increases from 1851 to 2100 under a business-as-usual scenario (8.5). Noteworthy increases were observed from the 1850s to the 1930s in the southern Caribbean and northeastern tropical Pacific, after the 1940s in the northern and northwestern Caribbean, after the 1950s in the western and eastern Caribbean, and after the 1970s in the southwestern Caribbean. Under scenario 8.5, the average rate of increase in JASO surface (2 m) temperature anomaly was 0.1216 °C/decade from the 1850s to 2020s, escalating to 0.2597 °C/decade in the 2000s–2020s. Projected increases for 2020s–2100s average 0.4203 °C/decade, with 0.3440 °C/decade for 2020s–2050s and 0.4776 °C/decade for 2050s–2100s. This indicates a significant overshoot of JASO surface (2 m) temperature anomalies, with projected warming rates 4.2 times higher than the global average. Comparing predicted JASO surface temperature anomalies to the 2020s baseline suggests significant increases by the 2040s in the southeastern tropical Pacific and by the 2030s elsewhere. These trends under scenario 8.5 will rapidly exceed the +1.5 °C threshold above pre-industrial levels, stressing a minimal temporal window for regional action, mitigation, and adaptation.
A significant increase in JASO SST-a is projected from 1851 to 2100 under a business-as-usual scenario (8.5). Prominent increases were observed from the 1850s to the 1930s in the northeastern tropical Pacific, after the 1940s across the southern, northern, and northwestern Caribbean, and after the 1950s elsewhere. The average rate of increase in SST-a across the region was 0.0841 °C/decade from the 1850s to 2020s, rising to 0.1849 °C/decade in the 2000s–2020s. Projected increases for 2020s–2100s under scenario 8.5 average 0.3021 °C/decade, with 0.2371 °C/decade for 2020s–2050s and 0.3258 °C/decade for 2050s–2100s. This indicates a significant overshoot of JASO SST-a of 2–3X the global average. When compared to the 2020s baseline, significant increases are expected by the 2040s in the western, southwestern, and southern Caribbean, as well as the southeastern tropical Pacific. Remarkable warming is also projected by the 2030s in the northern and northwestern Caribbean, and the northeastern tropical Pacific, with increases anticipated before the end of the 2020s in the eastern Caribbean. These projected SST-a warming trends under scenario 8.5 will promptly exceed the +1.0 °C threshold above maximum annual temperatures, leading to recurrent mass coral bleaching and mortality events as early as the 2030s. This puts coral reef conservation and restoration attempts in the WC and ETP at risk, underlining an extremely narrow window for regional action, mitigation, and adaptation.

4.4. Factors Explaining Regional SST Warming Trends

Several natural climate teleconnections can influence sea surface warming across the WC and ETP. These teleconnections are large-scale climate patterns that may affect weather and climate variability over extensive areas. Key teleconnections affecting these regions include the El Niño–Southern Oscillation (ENSO). ENSO is one of the most influential teleconnections, characterized by periodic warming (El Niño) or cooling (La Niña) of SST in the central and eastern Pacific [73]. Warmer SSTs in the ETP often result in the weakening of the trade winds and SST increase in the WC due to weakened mixing and increasing ocean heat content (OHC). This can reduce rainfall and increase drought risk in the WC. Cooler SST in the ETP during La Niña is typically associated with lower wave heights [74], and warmer-than-normal SST in the WC, potentially leading to increased rainfall and hurricane activity due to reduced windshear across the WC [75,76].
The North Atlantic Oscillation (NAO) is another significant factor and refers to fluctuations in atmospheric pressure between the Icelandic Low and the Azores High in the North Atlantic. NAO also affects the ocean through changes in OHC, gyre circulations, mixed-layer depth fluctuations, salinity variability, high-latitude deep water formation, and sea ice cover [77], therefore strongly influencing marine ecosystem processes. The interaction between NAO and ENSO dynamics can significantly influence WC climate and SST [78]. A positive NAO phase strengthens the trade winds, which can cool the SST in the WC by enhancing evaporation and ocean mixing. A negative NAO phase weakens the trade winds, allowing SST to warm up, leading to an enhanced mass coral bleaching risk, and potentially intensifying tropical cyclone development in the region. The interaction of NAO and ENSO dynamics can also influence regional rainfall patterns [79,80], potentially leading to enhanced sediment-laden and nutrient-loaded runoff pulses to coastal environments, further stressing out corals.
The Atlantic Multidecadal Oscillation (AMO) is a long-term oscillation of SST in the North Atlantic, with phases lasting several decades. AMO dynamics correlates with other indices and can have a significant influence on WC SST [81], although evidence of this correlation is ambiguous. During the warm phase of the AMO, the WC tends to experience warmer conditions, enhanced risk of coral bleaching and mortality [82], and greater hurricane activity and regional rainfall [83]. The cool phase typically brings cooler SST and reduced hurricane activity. Significant negative relationships between star coral, Orbicella faveolata, skeletal density and mean SST, maximum SST, AMO, and accumulated degree heating months have been documented [84], suggesting that AMO may increasingly affect coral growth under projected warming trends.
The Madden–Julian Oscillation (MJO) is an intra-seasonal climate pattern characterized by a large-scale eastward-moving disturbance of clouds, rainfall, and winds across the tropics, with cycles of around 30–60 days. It can influence SST variability across the WC and ETP by modulating convection and wind patterns [85]. It can increase or suppress rainfall and tropical cyclone activity, affecting SST in those regions over short timescales.
The Pacific Decadal Oscillation (PDO) is a long-term fluctuation in SST in the North Pacific, with warm and cool phases that can last for decades [86]. A warm phase of the PDO can lead to increased SST in the ETP, which might enhance the influence of El Niño on SST variability in the ETP [87]. A cool phase typically has the opposite effect, cooling SST and interacting with La Niña conditions to reduce temperatures in the ETP, though potentially enhancing SST warming across the WC, augmenting coral bleaching risk.
The Intertropical Convergence Zone (ITCZ) is a belt of low pressure that circles the Earth near the equator, where trade winds converge, and it is associated with convective rainfall and cloud formation. Variations in the position of the ITCZ can directly influence SST patterns in the tropical Atlantic and ETP by altering cloud cover, precipitation, and wind patterns [88]. A more northerly ITCZ position can enhance SST warming in the WC.
The Caribbean Low-Level Jet (CLLJ) is a strong wind current that flows from east to west across the WC, typically peaking during summer. The intensity of the CLLJ affects evaporation and ocean mixing, which can either cool or warm SST, affecting regional OHC and hurricane formation [89]. A stronger jet generally cools SST in the WC, while a weaker jet allows SST to warm and accumulate OHC more easily [90,91]. Interannual variability in OHC is also related with ENSO events which modulate the CLLJ [92], and may influence SST and tropical cyclogenesis [93], potentially affecting coral bleaching risk.
These complex teleconnections do not act independently; they often interact in compounded ways, creating compound spatio-temporal patterns of SST variability across the WC and ETP. For example, ENSO and the AMO may simultaneously influence the WC’s climate, with one pattern amplifying or moderating the other’s effects. Understanding these natural teleconnections is key to predicting climate variability, including hurricane activity and droughts, across the region, and mass coral bleaching and mortality events. However, projected regional and global warming trends, despite the scenario, suggest that conditions like a combination of teleconnections leading to strong warming are likely to be dominant across the region through the Anthropocene. Such complex interactions may also trigger potential regional runaway climate effects with paramount consequences for WC and ETP coral reefs and coastal human communities.

4.5. Regional Consequences of Projected Warming Trends

Our findings are consistent with previous studies that have documented strong warming patterns across all subregions of the WC, particularly since the 1970s [94]. The only decades warmer than the 1970s were the 1960s for the northern Caribbean, the 1950s for the western Caribbean, and the 1940s for the eastern and southern Caribbean [94]. But historical warming patterns have been geographically consistent across the region and projected warming trends are widespread and concerning under both optimistic and business-as-usual scenarios. Numerous studies have documented trends of increasing atmospheric temperature anomalies of ~0.10–0.12 °C/decade across extensive geographic areas on global or regional scales throughout the 20th century to present [95,96,97,98,99,100,101,102,103]. However, warming rates of up to 0.16 °C/decade were documented during the summer months in China between 1900 and 2006 [104]. Similar findings were observed in Israel [105]. Warming rates of up to 0.29 °C/decade were projected for the period of 2011–2040 and of up to 0.14 °C/decade for the period of 2061–2090 under scenario 4.5, and rates of up to 0.43 °C/decade were anticipated for the period of 2011–2040 and of up to 0.72 °C/decade for the period of 2061–2090 under scenario 8.5 in China [106]. Areas over the permafrost are projected to warm at even faster rates [107]. These findings highlight that warming trends during the early 21st century have accelerated when compared to historical trends.
Global oceans have also warmed at a general rate of 0.10 °C/decade [1]. The WC basin warmed at a rate of 0.04 °C/decade between 1871 and 2020, and at rates of 0.17 °C/decade between 1981 and 2020, and 0.20 °C/decade between 1994 and 2020 [108]. Other accounts have estimated WC sea surface warming trends of 0.108 °C/decade for the combined periods of 1906–1969 and 1972–2005, and of 0.118 °C/decade for the sub-period of 1972–2005 [109]. However, The Gulf of Mexico warmed at rates of up to 0.32 °C/decade during the period of 2000 to 2021, and the south Florida estuaries up to 0.42 °C/decade during the same period [110]. Areas across the southwestern Pacific warmed 0.10–0.20 °C/decade between 1982 and 2016 [111]. Coral proxy paleoclimate reconstructions have also shown significant WC SST warming trends through the 20th century, particularly after the 1950s [78,112]. SST-a was projected to increase by a factor of +1.92 to +3.01 °C by 2071–2100 in contrast to the 1976–2005 climatology [113]. Similar projections were found for the WC and ETP [114].
Observations of increasing atmospheric and ocean temperatures across the WC since at least the 1980s have strongly correlated with the AMO [81,109]. The AMO is a North Atlantic SST signal that influences decadal-scale variability in Caribbean precipitation [115] and SST [116]. The AMO signal was more pronounced on temperature during the end of the summer (i.e., JASO) than for other periods of the year [81]. However, recent evidence regarding the role of AMO as a main driver of sea surface warming trends is increasingly ambiguous, exhibiting high spatio-temporal variability and not always correlated to ocean warming [117,118,119,120,121,122], so it may not necessarily directly affect observed temperature patterns. There is evidence suggesting that AMOs respond to mixed anthropogenic GHG and sulfate aerosol forcing, with long-term modeling evidence pointing at the influence of volcanic forcing [123]. Observed sea surface warming trends have accelerated during recent decades through a complex combination of mechanisms, raising major concerns for the socio-economic and ecological resiliency of SIDS and of low-lying areas of numerous developing countries across the WC and ETP.
An increase of 0.10 °C/decade in global temperatures is considered a critical threshold in climate change due to its significant cumulative impact over time and the associated risks of surpassing internationally agreed-upon temperature limits. While 0.10 °C/decade may seem modest, over a century, this rate results in a total increase of 1 °C. Such a rise contributes to the intensification of climate-related phenomena, including more frequent and prolonged MHWs, altered precipitation patterns, rapid hurricane intensification, increased SST and OHC, and accelerated SLR. Model projections point out an increasing risk of surpassing regional dangerous temperature thresholds within only a decade or two. Higher decadal rates of increase will rapidly reach or exceed the 1 °C threshold above the maximum annual SST. Reaching or exceeding a total increase of 1 °C above annual maximum temperatures will result in continuously reaching hot-spot temperatures, which will lead to mass coral bleaching after 8 weeks and potential mass coral mortalities beyond 12 weeks. These changes can disrupt coastal ecosystems, but also agriculture, food and water security, and human societies.
There is mounting evidence that under current projections, warming trends may lead to runaway climate conditions, which would lead to temperature anomalies of +2 to +5 °C by 2100 [124,125,126,127,128,129], with outcomes depending on projected pathways [130]. Other modeling efforts have suggested that temperature anomalies may range from +1.6 to +6.9 °C by 2100, depending on global emissions pathways, but with likely conditions of reaching +4 °C during the early 2060s under business-as-usual scenarios [131]. These changes may lead to important spatio-temporal variations in storm tracks and in storm intensity at both hemispheres [132], to significant spatio-temporal variability in river flows [133], altered fisheries productivity [53,134,135,136], declining agriculture [137,138,139], and to significant soil warming, which may alter temperature/moisture-sensitive soil processes and productivity [140]. In the long term, this might jeopardize water and food security on regional to global scales, and will lead to enhanced carbon loss from soils, which would further contribute to runaway climates [141,142,143]. Furthermore, climate models project substantial changes across the WC, including significant warming and drying trends [144,145], increasing threats by SLR [146], and the projected degradation of coastal ecosystems, their ecological functions, and productivity [67,147]. Islands may also experience increased impacts on tropical forests by stronger hurricanes [148] and potential runaway climate effects, with some models predicting warming beyond 4.5 °C [137]. This might have potential adverse impacts on future regional socio-economic development [149]. México and Central America will also be affected by warming and a decrease in precipitation [150,151] and runoff [152], with adverse impacts to agriculture [153] and fisheries and livestock [137], and a decline in tropical forest cover and productivity [154].
Under such projected conditions, despite the global emissions scenario, conditions for the conservation and restoration of coral reefs will be severely compromised as early as the 2030s or 2040s, which warrant the need for rapid action. The 2015 Paris Agreement aims to limit global warming to well below 2 °C above pre-industrial levels, with efforts to cap the increase at 1.5 °C [1]. Exceeding these thresholds significantly heightens the risk of severe climate impacts, particularly on coral reef ecosystems. Current observations indicate that global temperatures have already risen by approximately 1 to 1.5 °C since the late 19th century. This study has shown that continuing at a warming rate of 0.10 °C/decade or higher could lead to rapidly surpassing the 1.5 °C threshold within the 2040s even under optimistic scenario 4.5, and within the 2030s under business-as-usual scenario 8.5, intensifying the urgency for mitigation and adaptation efforts. A sustained increase of 0.10 °C/decade or higher is alarming because it contributes to the cumulative rise in global temperatures, rapidly bringing us closer to, and potentially beyond, thresholds that are associated with severe and potentially irreversible runaway climate conditions. Recognizing and addressing this rate of change is essential for effective climate policy and action.

4.6. SOS for Coral Reefs—The Urgency for Adaptive Coral Conservation and Restoration Strategies

Projected warming trends across the WC and ETP, regardless of the climate scenario, will very likely result in annual mass coral bleaching and mortality, adversely affecting coral conservation and restoration efforts as soon as the 2030s or earlier. This represents an important warning signal to promote the rapid development and implementation of regional and country-specific adaptive coral restoration strategies. Creating an adaptive coral restoration plan for the WC and ETP in the face of projected climate change, sea surface warming, and extreme events requires a multifaceted approach. Important considerations include the following components.

4.6.1. Select and Cultivate Climate-Resilient Coral Species

This requires prioritizing the selection and cultivation of coral species that have shown resilience to higher temperatures and acidification [155,156,157], and that have shown adaptive molecular and physiological survival mechanisms [158,159,160,161,162,163], enhancing genetic diversity in restoration efforts to increase the adaptive potential of coral populations across regional and subregional scales, and improving strategies for site selection [164,165].

4.6.2. Increase Restoration Efficiency, Focusing on Scale and Cost Effectiveness of Deployment

The use of cost-effective restoration approaches is essential to enhance the scale of interventions in developing countries and SIDS, where resources are most likely limited [166,167,168,169].

4.6.3. Advanced Coral Propagation Techniques

Micro-fragmentation [170,171], larval rearing [172], methods to enhance coral recruitment, growth and survival [169], genotyping [173], gene banking [174], assisted gene flow and cryopreservation [175,176], and rapid growth techniques are vital to accelerating the growth of slow-growing coral species and implementing larval rearing and settlement techniques to boost natural recruitment processes.

4.6.4. Ensure the Restoration of Endangered Coral Species Proceeds Within a Population-Genetics Management Context

Develop a population-genetics management plan to promote enhanced genetic diversity and disease resistance in future coral restoration efforts [170,177]. This would improve resilience against future thermal disturbances.

4.6.5. Dynamic Site Selection

Use predictive modeling to identify sites less likely to be affected by future climate impacts (i.e., deeper water refugia, sites under stronger circulation and oxygenation, sites with remnant populations of rare, threatened, or endangered corals with population λ > 1). The rotation of restoration sites, such as the Reef of Hope initiative [178], should be based on the real-time monitoring of environmental conditions (i.e., stronger circulation, cooler temperatures) to maximize coral survival rates [61].

4.6.6. Enhanced Monitoring and Rapid Response

Implement consistent ecological [179], environmental DNA (eDNA) [180], and epigenetics monitoring [181,182], as well as remote sensing technologies [183,184,185] to track coral health and develop early warning systems to identify stress [162,186,187]. Establish teams for rapid intervention during extreme events to protect and stabilize affected coral populations (i.e., implementing shadowing techniques, rotating coral nurseries to deeper waters or areas of strong circulation, collecting fragments or colonies of highly depleted species and placing them in upland nurseries for future propagation and restoration).

4.6.7. Thermal Tolerance and Pre-Stress Conditioning

Expose corals to controlled sub-lethal stress levels to build resilience against future temperature spikes (i.e., through restoration rotation strategies) [188,189]. Explore the potential of assisted evolution techniques to enhance thermal tolerance in corals [190,191,192,193].

4.6.8. Support a Holistic Approach to Coral Reef Ecosystem Restoration [194,195]

It is critical to consider the integration of restoring fish assemblages [61] and herbivory [196,197,198]. The integration of multifaceted cost-effective nature-based strategies to enhance coastal resilience and provide protection against wave energy, runup, and coastal erosion is paramount under projected stronger storm swells and SLR [199,200,201,202].

4.6.9. Integration of Local and Traditional Knowledge

Involve local communities and stakeholders in restoration efforts, leveraging traditional ecological knowledge and practices, and providing capacity building, training, hands on experiences and resources to local stakeholders to empower them in coral conservation and restoration activities. The integration of community-based solutions has been paramount in achieving restoration success in numerous examples [203,204,205,206,207,208].

4.6.10. Restoration of Adjacent Ecosystems

Restore and protect mangrove forests, seagrass beds, and other green coastal infrastructure that support coral reef health and provide additional coastal protection, climate change adaptation and mitigation, and socio-economic benefits [199]. Implement holistic/integrated coastal zone management plans that address the health of all coastal ecosystems, not just coral reefs.

4.6.11. Innovation in Restoration Techniques

Develop artificial and hybrid reef structures that can serve as nurseries and habitat for coral and other marine life, and depending on the material, location, design and configuration, these reef structures can also provide long-term protection against shoreline erosion [200,201,202,209]. Employ eco-engineering approaches to design reef structures that enhance coral resilience and biodiversity [210,211,212,213].

4.6.12. Climate-Ready Infrastructure

Use natural, artificial, and hybrid structures to promote wave energy and runup attenuation and protect reefs from storm damage [191,192,193,194,195,196,197,198,199,200,201,202,214,215,216,217,218]. Experiment with shading devices and localized cooling systems to protect corals during heatwaves [219,220].

4.6.13. Policy, Funding, International Cooperation, and Governance

Advocate for dedicated funding streams from international climate funds, NGOs, and recurrent governmental sources to support long-term restoration projects. Foster regional cooperation and knowledge exchange among WC and ETP nations to enhance collective restoration efforts. Ensure coral restoration and conservation are integrated into national and regional climate adaptation and biodiversity strategies and policies [221] to foster improved governance and sustainable success [222,223,224].

4.6.14. Adaptive Management and Continuous Learning

Implement adaptive management frameworks that allow for flexibility and the continuous improvement of restoration strategies based on new scientific insights and monitoring data [211,225]. Continuously support research to develop innovative restoration techniques and improve understanding of coral resilience mechanisms. Promote, support, and strengthen community-based restoration efforts.

4.6.15. Develop and Promote the Use of Standardized Terms and Metrics for Coral Reef Restoration

Using uniform strategies tailored to local realities and needs, similar terms and a set of standard operating procedures and metrics is vital to improve outcome comparativeness among projects [169,179].

4.6.16. Support Coral Reef Restoration Practitioners Working in Diverse Geographic Locations

Supporting projects across WC and ETP developing countries and SIDS requires international cooperation strategies, novel partnerships among regional governments, private sectors, hospitality industry, tourism businesses, creating local cooperatives and other strategic partnerships involving base communities, fishing villages, etc. It will also require recognizing and providing access to international funding sources for colonial states (i.e., Puerto Rico, U.S. Virgin Islands).

4.6.17. Public Awareness and Education

Develop public awareness campaigns and outreach programs to highlight the importance of coral reefs in the context of climate change and the need for adapting restoration strategies. Integrate coral reef conservation and restoration into school curricula and community education programs to build a culture of stewardship from a young age.
A regional adaptive coral restoration plan for the WC and ETP must be comprehensive, incorporating resilient species selection, advanced propagation techniques, dynamic site management, enhanced monitoring, rapid response strategies, community-based capacity building, and providing access to recurrent funding sources. Integrating local knowledge, restoring adjacent ecosystems, and fostering regional collaboration are also crucial. Securing funding, building public awareness, and continuously adapting strategies based on new data will enhance the success and sustainability of coral restoration efforts in the face of mounting climate challenges.

4.7. Timely Adaptation and Mitigation Strategies for Developing Nations and Small Island Developing States Across the WC and ETP

Regardless of the climate scenario, projected warming trends across the WC and ETP warrant the rapid development and implementation of climate change adaptation and mitigation strategies to minimize the risk of runaway climate impacts in the future. The following list provides potential alternative solutions for developing nations and SIDS.

4.7.1. Promote National–Regional Lobbying, Activism and Advocacy Actions for Change

These will play crucial roles in advocating for the protection of the environment and promoting sustainable practices, including influencing policy and legislation, raising awareness, encouraging corporate responsibility, supporting renewable energy, agroecology practices, mobilizing communities (grassroots, empowering individuals), protecting and restoring biodiversity, addressing climate change, and water and food security (advocating for action, raising public consciousness), promoting environmental justice (addressing inequities, community support), research and innovation, workforce development, and building global–regional–national networks, such as a Latin American Coral Restoration Network (international collaboration, shared best practices and lessons learned).

4.7.2. Promote Sustainable Development

A participatory/fair ocean economy is vital to promote integration, equity, and a fair inclusion of base communities and local businesses in a participatory ocean economy. A massive reforestation campaign is instrumental to manage microclimates, promote greener cities, improve water catchment, reduce runoff, and lead to food and water security, while protecting coastal ecosystems from excessive sediment and nutrient loads and pollution. In addition, greener and sustainable hospitality and food and beverage industries are paramount to promote fresher operations, reduce their carbon footprint, mitigate and compensate environmental impacts, promote sustainable food and seafood consumption, promote consumption from local markets and food sources, reduce waste production, eliminate single-use plastics, and promote and support coastal ecosystem restoration, reforestation, agroecological practices, composting, recycling, and other sustainable practices.

4.7.3. Water Resource Management

Rainwater harvesting practices are becoming increasingly important. Implement systems to capture and store rainwater, reducing dependence on overexploited freshwater sources. Promote reforestation for enhanced aquifer recharge. Explore renewable energy-powered desalination technologies to provide potable water, especially in arid regions and SIDS.

4.7.4. Integrated Waste Management Systems

Solid waste management is a vital concern across the WC and ETP nations and will require a multifaceted approach. Inappropriate waste disposal is a mounting source of GHG emissions and should be a top priority in the bucket list of recommended actions for climate adaptation and mitigation practices. Encourage practices that minimize waste generation at the source. This includes promoting reusable products, reducing packaging, and implementing policies that discourage single-use plastics. Implement public awareness campaigns to educate residents and businesses about the benefits of reducing waste and how to implement waste-reducing practices. Establish efficient recycling programs that target common recyclable materials such as paper, plastics, glass, and metals. Provide accessible recycling bins and regular collection services, and economic or tax incentives to businesses that achieve meaningful recycling levels. Promote organic waste composting at both household and community levels, provide incentives to the hospitality and food beverage industries that achieve successful composting practices. This can significantly reduce the volume of waste sent to landfills while producing valuable compost for gardening and landscaping. Implement an integrated/holistic waste management system that combines waste reduction, recycling, composting, and safe disposal methods. This approach ensures that all waste types are managed effectively. Engage local communities in the planning and implementation of waste management strategies, and through the creation of community-owned waste management businesses and cooperatives to ensure they meet the specific needs and capacities of local communities.

4.7.5. Ecosystem-Based Adaptation

Invest in restoring mangroves, wetlands, sand dunes, seagrasses, and coral reefs, which provide natural barriers against storm surges and erosion while supporting biodiversity. Promote sustainable agricultural practices that integrate trees with crops and livestock, enhancing resilience to climate-related shocks, and promoting water and food security. Implement widespread reforestation programs to promote greener cities, enhance runoff control, manage microclimates, enhance carbon sequestration, and further promote water and food security.

4.7.6. Restore Shallow Coral Reef Resilience

Promote coral gardening and transplantation to restore resilient coral species to degraded areas. This can include using coral nurseries to grow coral in controlled conditions before reintroducing them to the wild (i.e., promoting restoration rotation strategies). Focus on enhancing genetic diversity in coral populations to increase resilience to diseases and sea surface warming. Establish long-term monitoring programs to assess changes in coral health, biodiversity, the impact of invasive species, and changing environmental conditions. These data can inform innovative regional management strategies. Invest in research to understand the mechanisms of coral resilience and identify species and genotypes that are more adaptable to changing conditions, as well as quantify coral demographic performance under variable environmental conditions.

4.7.7. Sustainable Fisheries Management

Implement community-based, local management practices that involve communities in decision making, helping to ensure sustainable fish stocks and livelihoods [61]. Establish marine protected areas (MPAs) under participatory, cooperative management models to protect key habitats and replenish fish populations, supporting both ecological health and local economies. Integrate coral, seagrass, and mangrove restoration strategies with community-based sustainable fisheries management to enhance coastal essential fish habitats.

4.7.8. Sustainable Tourism

Non-sustainable massive tourism across the WC and ETP is important for the regional economy but can generate significant adverse impacts to natural resources [226]. Sustainable tourism practices are essential for preserving the natural and cultural heritage of the WC and ETP while promoting economic development. Promote tourism development practices that eliminate the displacement and gentrification of base communities. Support eco-certification programs for tourism operators that meet environmental and sustainability standards and equity. Encourage activities that emphasize the natural environment; while ensuring they are conducted responsibly to minimize impacts and reduce carbon footprints. Involving local communities in tourism planning and decision making and management to ensure their needs and perspectives are considered. Promote cultural tourism that highlights local traditions, crafts, and folklore, providing economic benefits to communities while preserving cultural identity. Encourage green building practices, such as green roofs, rain gardens, and the use of sustainable materials and energy-efficient designs in new tourism developments, including hotels and resorts. Invest in public transportation options and promote non-motorized transport (bicycles, walking) when feasible to reduce carbon footprints. Implement recycling initiatives in tourist areas to minimize waste generation and promote responsible waste disposal practices. Encourage businesses to reduce single-use plastics by providing alternatives and promoting reusable products. Support the establishment and effective management of MPAs and coastal natural reserves to conserve biodiversity and support sustainable fishing and tourism practices. Implement measures to protect local wildlife and habitats, including regulations against poaching and habitat destruction, and by supporting local breeding of rare and endangered species, including corals, and by restoring degraded habitats. Develop educational programs for tourists that promote awareness of local ecosystems, cultural heritage, and sustainable practices. Provide education, capacity-building and hands-on training for tourism operators and local businesses on sustainable practices, conservation and restoration efforts, and customer engagement. Provide incentives and encourage tourists to visit during off-peak seasons to reduce overcrowding and pressure on local resources. Market green-certified, eco-friendly accommodations, businesses, and activities that prioritize local food consumption and sustainability. Develop and monitor sustainability indicators to assess the environmental, social, and economic impacts of tourism. Implement systems for feedback from tourists and local communities to inform ongoing improvements in sustainable tourism practices. Foster regional collaboration among WC and ETP nations to share best practices, resources, and strategies for sustainable tourism. Encourage partnerships between the government, NGOs, and the private sector to develop and promote local, subregional, and regional standardized sustainable tourism initiatives. Develop strategies to enhance the climate resilience of tourism infrastructure and ecosystems, ensuring long-term sustainability in the face of climate change. Implement disaster preparedness plans for tourism operators to ensure safety and minimize impact during extreme weather events.

4.7.9. Renewable Energy Development

Invest in solar and wind energy, and in hydroelectric if viable river sources are available, leveraging abundant natural resources to reduce reliance on fossil fuels and enhance energy security. Develop decentralized energy systems (i.e., microgrids) to provide reliable electricity to remote communities, reducing vulnerability to climate impacts. Avoid costly/irreversible socio-economic and environmental tradeoffs (i.e., impacts on vital agricultural lands, protected areas, watersheds, etc.), maximizing the use of existing built infrastructure.

4.7.10. Climate Resilient Infrastructure

Promote the use of sustainable materials and designs that enhance resilience to climate impacts, such as elevated structures in flood-prone areas, green roofs, rain gardens, passive cooling structures, etc. Upgrade and maintain transportation infrastructure to withstand extreme weather events, ensuring access to essential services.

4.7.11. Disaster Risk Reduction

Invest in technology and training for early warning systems to prepare communities for extreme weather events, minimizing loss of life and property. Foster community engagement in disaster planning, response strategies, and preparedness programs, ensuring local knowledge is incorporated.

4.7.12. Education and Capacity Building of Different Societal Sectors

Develop educational, hands-on training initiatives focused on sustainable practices, climate adaptation, and resilience building within communities. Promote local research and development initiatives to innovate climate adaptation and mitigation strategies tailored to specific regional, subregional, and local challenges.
By adopting many of these recommendations, the WC and ETP can promote and enhance socio-economic and environmental sustainability and promote critical conservation and restoration practices on their coastal ecosystems, which should enhance social–ecological resilience to projected climate changes.

5. Conclusions

MHWs are increasingly affecting tropical seas, causing recurrent mass coral bleaching and mortality across the WC and ETP. This leads to significant coral loss, reduced biodiversity, and impaired ecological functions, increasing regional threats to social-ecological and economic resilience. Climate models forecast a troubling future for Latin American coral reefs. From 1940 to 2023, JASO air and ocean temperature anomalies showed significant decadal increases. Projections indicate that even under optimistic scenario 4.5, temperatures may exceed the +1.5 °C air threshold beyond pre-industrial levels by the 2040s and the +1.0 °C ocean threshold beyond historical annual maximums by the 2030s, resulting in severe coral bleaching and mortality. Business-as-usual scenario 8.5 suggests SST-a will become intolerable for coral conservation and restoration by 2030, with decadal warming trends largely surpassing historical rates, leading to unbearable conditions for corals. Given these alarming trends, immediate and coordinated climate action across the WC and ETP is imperative. This includes not only the development of regional, subregional, and local adaptive coral reef conservation and restoration plans that should incorporate novel, cost-effective strategies but also robust multifaceted climate change adaptation and mitigation strategies to minimize losing the social-ecological and economic resilience of human coastal communities.
However, critical challenges are still ahead. Projected runaway climates suggest an unavoidable need to rapidly expand the spatial scale of restoration interventions and the monetary costs associated with such broad-scale coral reef restoration are massive, making widespread implementation challenging, especially in the context of least developed countries and SIDS, often characterized with a lack of coordinated and ecologicallyinformed planning [227]. Secondly, most WC and ETP localities will have a high and severe bleaching risk earlier than the middle of this century, with more than half of recently restored sites already affected by significant coral mortality. By prioritizing climate action now, we can create a more resilient marine environment and human coastal communities, providing the necessary burrowed time for optimistic scenarios to materialize and ensure the survival of these vital ecosystems for future generations.

Supplementary Materials

The following supporting information can be downloaded at: https://www.mdpi.com/article/10.3390/atmos16050575/s1, Table S1. Summary of study locations by region, with coordinates of sampling polygons and the linear regression results between normalized JASO 2 m temperature and sea surface temperature (SST) anomalies for the period of 1940 to 2023 on each location, using the 1951–1980 climatology as baseline. Figure S1. Projection of 2 m temperature and SST anomalies across the Mesoamerican Barrier System (MSA), western Caribbean, into the year 2100 under scenarios 4.5 and 8.5: (a) México; (b) Belize/Guatemala; (c) Honduras, (d) Nicaragua. Figure S2. Projection of 2 m temperature and SST anomalies across the Caribbean and Central America into the year 2100 under scenarios 4.5 and 8.5: (a) Costa Rica; (b) Panamá; (c) San Andrés-Providencia, Colombia. Figure S3. Projection of 2 m temperature and SST anomalies across the southern Caribbean into the year 2100 under scenarios 4.5 and 8.5: (a) Colombia; (b) Venezuela; (c) ABC Islands (Aruba, Bonaire, Curaçao). Figure S4. Projection of 2 m temperature and SST anomalies across the eastern Caribbean into the year 2100 under scenarios 4.5 and 8.5: (a) Leeward Islands; (b) Windward Islands; (c) U.S./British Virgin Islands (UBV). Figure S5. Projection of 2 m temperature and SST anomalies across the northern Caribbean into the year 2100 under scenarios 4.5 and 8.5: (a) Puerto Rico; (b) Dominican Republic; (c) Haiti; (d) Jamaica. Figure S6. Projection of 2 m temperature and SST anomalies across the northwestern Caribbean into the year 2100 under scenarios 4.5 and 8.5: (a) Grand Cayman; (b) Cuba; (c) Turks and Caicos; (d) Bahamas; (e) Florida. Figure S7. Projection of 2 m temperature and SST anomalies across the eastern Pacific into the year 2100 under scenarios 4.5 and 8.5: (a) Northern México; (b) Southern México; (c) Guatemala; (d) El Salvador/Honduras. Figure S8. Projection of 2 m temperature and SST anomalies across the eastern Pacific into the year 2100 under scenarios 4.5 and 8.5: (a) Nicaragua; (b) Costa Rica; (c) Panamá; (d) Colombia.

Author Contributions

Conceptualization, E.A.H.-D. and Y.M.R.-G.; methodology, E.A.H.-D.; validation, E.A.H.-D.; formal analysis, E.A.H.-D.; investigation, E.A.H.-D. and Y.M.R.-G.; resources, E.A.H.-D. and Y.M.R.-G.; data curation, E.A.H.-D.; writing—original draft preparation, E.A.H.-D. and Y.M.R.-G.; writing—review and editing, E.A.H.-D. and Y.M.R.-G.; visualization, E.A.H.-D.; supervision, E.A.H.-D.; project administration, E.A.H.-D. All authors have read and agreed to the published version of the manuscript.

Funding

This research received no external funding.

Institutional Review Board Statement

Not applicable.

Informed Consent Statement

Not applicable.

Data Availability Statement

Data supporting the reported results can be found in the Supplementary Materials section in “Hernandez&Rodriguez_data.xlsx” file.

Acknowledgments

This publication was the first peer-reviewed contribution of Sociedad Ambiente Marino’s Climate Science Division. The study was fully conducted under in-kind contributions by both authors. E.A.H.D. is a Certified Ecological Restoration Practitioner (CERP #0670) by the Society for Ecological Restoration.

Conflicts of Interest

The authors declare no conflicts of interest.

References

  1. IPCC. Climate change 2021: The physical science basis. In Contribution of Working Group I to the Sixth Assessment Report of the Intergovernmental Panel on Climate Change; Cambridge University Press: Cambridge, UK, 2021; Available online: www.ipcc.ch/report/ar6/wg1/ (accessed on 15 October 2024).
  2. Hobday, A.J.; Alexander, L.V.; Perkins, S.E.; Smale, D.A.; Straub, S.C.; Oliver, E.C.; Benthuysen, J.A.; Burrows, M.T.; Donat, M.G.; Feng, M.; et al. A hierarchical approach to defining marine heatwaves. Prog. Oceanogr. 2016, 141, 227–238. [Google Scholar] [CrossRef]
  3. Dutheil, C.; Lal, S.; Lengaigne, M.; Cravatte, S.; Menkès, C.; Receveur, A.; Börgel, F.; Gröger, M.; Houlbreque, F.; Le Gendre, R.; et al. The massive 2016 marine heatwave in the Southwest Pacific: An “El Niño–Madden-Julian Oscillation” compound event. Sci. Adv. 2024, 10, eadp2948. [Google Scholar] [CrossRef]
  4. Hoegh-Guldberg, O.; Skirving, W.; Dove, S.G.; Spady, B.L.; Norrie, A.; Geiger, E.F.; Liu, G.; De La Cour, J.L.; Manzello, D.P. Coral reefs in peril in a record-breaking year. Science 2023, 382, 1238–1240. [Google Scholar] [CrossRef]
  5. Goessling, H.F.; Rackow, T.; Jung, T. Recent global temperature surge intensified by record-low planetary albedo. Science 2025, 387, 68–73. [Google Scholar] [CrossRef] [PubMed]
  6. Mejias-Rivera, C.L.; Courtney, T.A. Ocean warming, heat stress, and coral bleaching in Puerto Rico. Caribb. J. Sci. 2024, 54, 132–149. [Google Scholar] [CrossRef]
  7. Lachs, L.; Bozec, Y.M.; Bythell, J.C.; Donner, S.D.; East, H.K.; Edwards, A.J.; Golbuu, Y.; Gouezo, M.; Guest, J.R.; Humanes, A.; et al. Natural selection could determine whether Acropora corals persist under expected climate change. Science 2024, 386, 1289–1294. [Google Scholar] [CrossRef] [PubMed]
  8. Baum, J.K.; Claar, D.C.; Tietjen, K.L.; Magel, J.M.; Maucieri, D.G.; Cobb, K.M.; McDevitt-Irwin, J.M. Transformation of coral communities subjected to an unprecedented heatwave is modulated by local disturbance. Sci. Adv. 2023, 9, eabq5615. [Google Scholar] [CrossRef]
  9. Wang, S.; Foster, A.; Lenz, E.A.; Kessler, J.D.; Stroeve, J.C.; Anderson, L.O.; Turetsky, M.; Betts, R.; Zou, S.; Liu, W.; et al. Mechanisms and impacts of Earth system tipping elements. Rev. Geophys. 2023, 61, e2021RG000757. [Google Scholar] [CrossRef]
  10. Donovan, M.K.; Burkepile, D.E.; Kratochwill, C.; Shlesinger, T.; Sully, S.; Oliver, T.A.; Hodgson, G.; Freiwald, J.; van Woesik, R. Local conditions magnify coral loss after marine heatwaves. Science 2021, 372, 977–980. [Google Scholar] [CrossRef]
  11. Wiedenmann, J.; D’Angelo, C.; Smith, E.G.; Hunt, A.N.; Legiret, F.E.; Postle, A.D.; Achterberg, E.P. Nutrient enrichment can increase the susceptibility of reef corals to bleaching. Nat. Clim. Change 2013, 3, 160–164. [Google Scholar] [CrossRef]
  12. Vega Thurber, R.L.; Burkepile, D.E.; Fuchs, C.; Shantz, A.A.; McMinds, R.; Zaneveld, J.R. Chronic nutrient enrichment increases prevalence and severity of coral disease and bleaching. Global Change Biol. 2014, 20, 544–554. [Google Scholar] [CrossRef]
  13. Burkepile, D.E.; Shantz, A.A.; Adam, T.C.; Munsterman, K.S.; Speare, K.E.; Ladd, M.C.; Rice, M.M.; Ezzat, L.; McIlroy, S.; Wong, J.C.; et al. Nitrogen identity drives differential impacts of nutrients on coral bleaching and mortality. Ecosystems 2020, 23, 798–811. [Google Scholar] [CrossRef]
  14. Fernandes de Barros Marangoni, L.; Ferrier-Pagès, C.; Rottier, C.; Bianchini, A.; Grover, R. Unravelling the different causes of nitrate and ammonium effects on coral bleaching. Sci. Rep. 2020, 10, 11975. [Google Scholar] [CrossRef] [PubMed]
  15. Lesser, M.P. Eutrophication on coral reefs: What is the evidence for phase shifts, nutrient limitation and coral bleaching. BioScience 2021, 71, 1216–1233. [Google Scholar] [CrossRef]
  16. Starko, S.; Fifer, J.E.; Claar, D.C.; Davies, S.W.; Cunning, R.; Baker, A.C.; Baum, J.K. Marine heatwaves threaten cryptic coral diversity and erode associations among coevolving partners. Sci. Adv. 2023, 9, eadf0954. [Google Scholar] [CrossRef]
  17. Romanou, A.; Hegerl, G.; Seneviratne, S.; Abis, B.; Bastos, A.; Conversi, A.; Landolfi, A.; Kim, H.; Lerner, P.; Mekus, J.; et al. Extreme events contributing to tipping elements and tipping points. Surv. Geophys. 2024, 2024, 1–46. [Google Scholar] [CrossRef]
  18. Wunderling, N.; Donges, J.F.; Kurths, J.; Winkelmann, R. Interacting tipping elements increase risk of climate domino effects under global warming. Earth Syst. Dyn. Disc. 2021, 12, 601–619. [Google Scholar] [CrossRef]
  19. Wunderling, N.; Winkelmann, R.; Rockström, J.; Loriani, S.; Armstrong McKay, D.I.; Ritchie, P.D.; Sakschewski, B.; Donges, J.F. Global warming overshoots increase risks of climate tipping cascades in a network model. Nature Clim. Change. 2023, 13, 75–82. [Google Scholar] [CrossRef]
  20. Wunderling, N.; von der Heydt, A.S.; Aksenov, Y.; Barker, S.; Bastiaansen, R.; Brovkin, V.; Brunetti, M.; Couplet, V.; Kleinen, T.; Lear, C.H.; et al. Climate tipping point interactions and cascades: A review. Earth Syst. Dyn. 2024, 15, 41–74. [Google Scholar] [CrossRef]
  21. Braun, C.D.; Lezama-Ochoa, N.; Farchadi, N.; Arostegui, M.C.; Alexander, M.; Allyn, A.; Bograd, S.J.; Brodie, S.; Crear, D.P.; Curtis, T.H.; et al. Widespread habitat loss and redistribution of marine top predators in a changing ocean. Sci. Adv. 2023, 9, eadi2718. [Google Scholar] [CrossRef]
  22. Laufkötter, C.; Zscheischler, J.; Frölicher, T.L. High-impact marine heatwaves attributable to human-induced global warming. Science 2020, 369, 1621–1625. [Google Scholar] [CrossRef] [PubMed]
  23. Dalton, S.J.; Carroll, A.G.; Sampayo, E.; Roff, G.; Harrison, P.L.; Entwistle, K.; Huang, Z.; Salih, A.; Diamond, S.L. Successive marine heatwaves cause disproportionate coral bleaching during a fast phase transition from El Niño to La Niña. Sci. Total Environ. 2020, 715, 136951. [Google Scholar] [CrossRef]
  24. Asner, G.P.; Vaughn, N.R.; Martin, R.E.; Foo, S.A.; Heckler, J.; Neilson, B.J.; Gove, J.M. Mapped coral mortality and refugia in an archipelago-scale marine heat wave. Proc. Natl. Acad. Sci. USA 2022, 119, e2123331119. [Google Scholar] [CrossRef] [PubMed]
  25. Shlesinger, T.; van Woesik, R. Oceanic differences in coral-bleaching responses to marine heatwaves. Sci. Total Environ. 2023, 871, 162113. [Google Scholar] [CrossRef]
  26. Goreau, T.J.; Hayes, R.L. 2023 Record marine heat waves: Coral reef bleaching HotSpot maps reveal global sea surface temperature extremes, coral mortality, and ocean circulation changes. Oxf. Open Clim. Change 2024, 4, kgae005. [Google Scholar] [CrossRef]
  27. Godinot, C.; Houlbrèque, F.; Grover, R.; Ferrier-Pagès, C. Coral uptake of inorganic phosphorus and nitrogen negatively affected by simultaneous changes in temperature and pH. PLoS ONE 2011, 6, e25024. [Google Scholar] [CrossRef]
  28. Hughes, T.P.; Rodrigues, M.J.; Bellwood, D.R.; Ceccarelli, D.; Hoegh-Guldberg, O.; McCook, L.; Moltschaniwskyj, N.; Pratchett, M.S.; Steneck, R.S.; Willis, B. Phase shifts, herbivory, and the resilience of coral reefs to climate change. Current Biol. 2007, 17, 360–365. [Google Scholar] [CrossRef]
  29. Leggat, W.P.; Camp, E.F.; Suggett, D.J.; Heron, S.F.; Fordyce, A.J.; Gardner, S.; Deakin, L.; Turner, M.; Beeching, L.J.; Kuzhiumparambil, U.; et al. Rapid coral decay is associated with marine heatwave mortality events on reefs. Curr. Biol. 2019, 29, 2723–2730. [Google Scholar] [CrossRef]
  30. Anderson, J.J.; Gurarie, E.; Bracis, C.; Burke, B.J.; Laidre, K.L. Modeling climate change impacts on phenology and population dynamics of migratory marine species. Ecol. Mod. 2013, 264, 83–97. [Google Scholar] [CrossRef]
  31. Alvarez-Filip, L.; Estrada-Saldívar, N.; Pérez-Cervantes, E.; Molina-Hernández, A.; González-Barrios, F.J. A rapid spread of the stony coral tissue loss disease outbreak in the Mexican Caribbean. PeerJ 2019, 7, e8069. [Google Scholar] [CrossRef]
  32. Bernal-Sotelo, K.; Acosta, A.; Cortés, J. Decadal change in the population of Dendrogyra cylindrus (Scleractinia: Meandrinidae) in old providence and St. Catalina Islands, Colombian Caribbean. Front. Mar. Sci. 2019, 5, 513. [Google Scholar] [CrossRef]
  33. Chan, A.N.; Lewis, C.L.; Neely, K.L.; Baums, I.B. Fallen pillars: The past, present, and future population dynamics of a rare, specialist coral–algal symbiosis. Front. Mar. Sci. 2019, 6, 218. [Google Scholar] [CrossRef]
  34. Estrada-Saldívar, N.; Molina-Hernández, A.; Pérez-Cervantes, E.; Medellín-Maldonado, F.; González-Barrios, F.J.; Alvarez-Filip, L. Reef-scale impacts of the stony coral tissue loss disease outbreak. Coral Reefs 2020, 39, 861–866. [Google Scholar] [CrossRef]
  35. Estrada-Saldívar, N.; Quiroga-García, B.A.; Pérez-Cervantes, E.; Rivera-Garibay, O.O.; Alvarez-Filip, L. Effects of the stony coral tissue loss disease outbreak on coral communities and the benthic composition of Cozumel reefs. Front. Mar. Sci. 2021, 8, 632777. [Google Scholar] [CrossRef]
  36. Jones, N.P.; Kabay, L.; Semon Lunz, K.; Gilliam, D.S. Temperature stress and disease drives the extirpation of the threatened pillar coral, Dendrogyra cylindrus, in southeast Florida. Sci. Rep. 2021, 11, 14113. [Google Scholar] [CrossRef]
  37. Cavada-Blanco, F.; Croquer, A.; Vermeij, M.; Goergen, L.; Rodriguez, R. Dendrogyra cylindrus: Extinction risk assessment. In The Red List of Threatened Species; IUCN: Gland, Switzerland, 2022. [Google Scholar]
  38. Alvarez-Filip, L.; González-Barrios, F.J.; Pérez-Cervantes, E.; Molina-Hernández, A.; Estrada-Saldívar, N. Stony coral tissue loss disease decimated Caribbean coral populations and reshaped reef functionality. Commun. Biol. 2022, 5, 440. [Google Scholar] [CrossRef]
  39. Mellin, C.; Brown, S.; Cantin, N.; Klein-Salas, E.; Mouillot, D.; Heron, S.F.; Fordham, D.A. Cumulative risk of future bleaching for the world’s coral reefs. Sci. Adv. 2024, 10, eadn9660. [Google Scholar] [CrossRef] [PubMed]
  40. Hays, G.C.; Richardson, A.J.; Robinson, C. Climate change and marine plankton. Trends Ecol. Evol. 2005, 20, 337–344. [Google Scholar] [CrossRef]
  41. Pesce, M.; Critto, A.; Torresan, S.; Giubilato, E.; Santini, M.; Zirino, A.; Ouyang, W.; Marcomini, A. Modelling climate change impacts on nutrients and primary production in coastal waters. Sci. Total Environ. 2018, 628, 919–937. [Google Scholar] [CrossRef]
  42. Raven, J.A.; Beardall, J. Influence of global environmental change on plankton. J. Plankton Res. 2021, 43, 779–800. [Google Scholar] [CrossRef]
  43. Möllmann, C.; Müller-Karulis, B.; Kornilovs, G.; St. John, M.A. Effects of climate and overfishing on zooplankton dynamics and ecosystem structure: Regime shifts, trophic cascade, and feedback loops in a simple ecosystem. ICES J. Mar. Sci. 2008, 65, 302–310. [Google Scholar] [CrossRef]
  44. Kirby, R.R.; Beaugrand, G.; Lindley, J.A. Synergistic effects of climate and fishing in a marine ecosystem. Ecosystems 2009, 12, 48–61. [Google Scholar] [CrossRef]
  45. Pratchett, M.S.; Munday, P.L.; Graham, N.A.; Kronen, M.; Pinca, S.; Friedman, K.; Brewer, T.D.; Bell, J.D.; Wilson, S.K.; Cinner, J.E.; et al. Vulnerability of coastal fisheries in the tropical Pacific to climate change. In Vulnerability of Tropical Pacific Fisheries and Aquaculture to Climate Change; Bell, J.D., Johnson, J.E., Hobday, A.J., Eds.; Secretariat of the Pacific Community: Noumea, New Caledonia, 2011; Chapter 9; pp. 167–185. [Google Scholar]
  46. Hayashida, H.; Matear, R.J.; Strutton, P.G. Background nutrient concentration determines phytoplankton bloom response to marine heatwaves. Global Change Biol. 2020, 26, 4800–4811. [Google Scholar] [CrossRef]
  47. Wyatt, A.M.; Resplandy, L.; Marchetti, A. Ecosystem impacts of marine heat waves in the Northeast Pacific. Biogeosciences 2022, 19, 5689–5705. [Google Scholar] [CrossRef]
  48. Kauppi, L.; Göbeler, N.; Norkko, J.; Norkko, A.; Romero-Ramirez, A.; Bernard, G. Changes in macrofauna bioturbation during repeated heatwaves mediate changes in biogeochemical cycling of nutrients. Front. Mar. Sci. 2023, 9, 1070377. [Google Scholar] [CrossRef]
  49. Serrano, O.; Arias-Ortiz, A.; Duarte, C.M.; Kendrick, G.A.; Lavery, P.S. Impact of marine heatwaves on seagrass ecosystems. In Ecosystem Collapse and Climate Change; Springer International Publishing: Cham, Switzerland, 2021; pp. 345–364. [Google Scholar]
  50. Alvarez-Filip, L.; Dulvy, N.K.; Gill, J.A.; Côté, I.M.; Watkinson, A.R. Flattening of Caribbean coral reefs: Region-wide declines in architectural complexity. Proc. R. Soc. B: Biol. Sci. 2009, 276, 3019–3025. [Google Scholar] [CrossRef]
  51. Alvarez-Filip, L.; Paddack, M.J.; Collen, B.; Robertson, D.R.; Côté, I.M. Simplification of Caribbean reef-fish assemblages over decades of coral reef degradation. PLoS ONE 2015, 10, e0126004. [Google Scholar] [CrossRef]
  52. Hernández-Delgado, E.A.; Alejandro-Camis, P.; Cabrera-Beauchamp, G.; Fonseca-Miranda, J.S.; Gómez-Andújar, N.X.; Gómez, P.; Guzmán-Rodríguez, R.; Olivo-Maldonado, I.; Suleimán-Ramos, S.E. Stronger hurricanes and climate change in the Caribbean Sea: Threats to the sustainability of endangered coral species. Sustainability 2024, 16, 1506. [Google Scholar] [CrossRef]
  53. Allison, E.H.; Perry, A.L.; Badjeck, M.C.; Adger, W.N.; Brown, K.; Conway, D.; Halls, A.S.; Pilling, G.M.; Reynolds, J.D.; Andrew, N.L.; et al. Vulnerability of national economies to the impacts of climate change on fisheries. Fish Fish. 2009, 10, 173–196. [Google Scholar] [CrossRef]
  54. Burge, C.A.; Eakin, C.M.; Friedman, C.S.; Froelich, B.; Hershberger, P.K.; Hofmann, E.E.; Petes, L.E.; Prager, K.C.; Weil, E.; Willis, B.L.; et al. Climate change influences on marine infectious diseases: Implications for management and society. Annu. Rev. Mar. Sci. 2014, 6, 249–277. [Google Scholar] [CrossRef]
  55. Tracy, A.M.; Pielmeier, M.L.; Yoshioka, R.M.; Heron, S.F.; Harvell, C.D. Increases and decreases in marine disease reports in an era of global change. Proc. R. Soc. B 2019, 286, 20191718. [Google Scholar] [CrossRef] [PubMed]
  56. Byers, J.E. Marine parasites and disease in the era of global climate change. Annu. Rev. Mar. Sci. 2021, 13, 397–420. [Google Scholar] [CrossRef] [PubMed]
  57. Armstrong McKay, D.I.; Staal, A.; Abrams, J.F.; Winkelmann, R.; Sakschewski, B.; Loriani, S.; Fetzer, I.; Cornell, S.E.; Rockström, J.; Lenton, T.M. Exceeding 1.5 °C global warming could trigger multiple climate tipping points. Science 2022, 377, eabn7950. [Google Scholar] [CrossRef]
  58. Lenton, T.M.; Held, H.; Kriegler, E.; Hall, J.W.; Lucht, W.; Rahmstorf, S.; Schellnhuber, H.J. Tipping elements in the Earth’s climate system. Proc. Natl. Acad. Sci. USA 2008, 105, 1786–1793. [Google Scholar] [CrossRef]
  59. Lenton, T.M. Environmental tipping points. Annu. Rev. Environ. Resour. 2013, 38, 1–29. [Google Scholar] [CrossRef]
  60. Goldblatt, C.; Watson, A.J. The runaway greenhouse: Implications for future climate change, geoengineering and planetary atmospheres. Philos. Trans. Royal Soc. A Math. Phys. Eng. Sci. 2012, 370, 4197–4216. [Google Scholar] [CrossRef]
  61. Hernández-Delgado, E.A.; Laureano, R. Bringing back the fish: Sustainable success of community-based restoration of Elkhorn coral (Acropora palmata) in Vega Baja, Puerto Rico (2008–2023). Sustainability 2024, 16, 5985. [Google Scholar] [CrossRef]
  62. Dietz, S.; Rising, J.; Stoerk, T.; Wagner, G. Economic impacts of tipping points in the climate system. Proc. Natl. Acad. Sci. USA 2021, 118, e2103081118. [Google Scholar] [CrossRef] [PubMed]
  63. Kopp, R.E.; Hayhoe, K.; Easterling, D.R.; Hall, T.; Horton, R.; Kunkel, K.E.; LeGrande, A.N. Potential surprises—Compound extremes and tipping elements. In Climate Science Special Report: Fourth National Climate Assessment; Wuebbles, D.J., Fahey, D.W., Hibbard, K.A., Dokken, D.J., Stewart, B.C., Maycock, T.K., Eds.; US Global Change Research Program: Washington, DC, USA, 2017; Volume 1, pp. 411–429. [Google Scholar]
  64. Smith, K.E.; Burrows, M.T.; Hobday, A.J.; Sen Gupta, A.; Moore, P.J.; Thomsen, M.; Wernberg, T.; Smale, D.A. Socioeconomic impacts of marine heatwaves: Global issues and opportunities. Science 2021, 374, eabj3593. [Google Scholar] [CrossRef]
  65. Emanuel, K.A. Downscaling CMIP5 climate models shows increased tropical cyclone activity over the 21st century. Proc. Natl. Acad. Sci. USA 2013, 110, 12219–12224. [Google Scholar] [CrossRef]
  66. Knutson, T.R.; Sirutis, J.J.; Vecchi, G.A.; Garner, S.; Zhao, M.; Kim, H.-S.; Bender, M.; Tuleya, R.E.; Held, I.M.; Villarini, G. Dynamical downscaling projections of twenty-first-century Atlantic Hurricane activity: CMIP3 and CMIP5 model-based scenarios. J. Clim. 2013, 26, 6591–6617. [Google Scholar] [CrossRef]
  67. Hernández-Delgado, E.A. The emerging threats of climate change on tropical coastal ecosystem services, public health, local economies and livelihood sustainability of small islands: Cumulative impacts and synergies. Mar. Pollut. Bull. 2015, 101, 5–28. [Google Scholar] [CrossRef] [PubMed]
  68. Climate Reanalyzer (n.d.). [Monthly Reanalysis Timeseries]. Climate Change Institute, University of Maine. Available online: https://climatereanalyzer.org/ (accessed on 10 November 2024).
  69. Hersbach, H.; Bell, B.; Berrisford, P.; Biavati, G.; Horányi, A.; Muñoz Sabater, J.; Nicolas, J.; Peubey, C.; Radu, R.; Rozum, I.; et al. ERA5 Monthly Averaged Data on Single Levels from 1940 to Present. Copernicus Climate Change Service (C3S) Climate Data Store (CDS). 2023. Available online: https://cds.climate.copernicus.eu/datasets/reanalysis-era5-single-levels-monthly-means?tab=overview (accessed on 1 October 2024).
  70. Eyring, V.; Bony, S.; Meehl, G.A.; Senior, C.A.; Stevens, B.; Stouffer, R.J.; Taylor, K.E. Overview of the Coupled Model Intercomparison Project Phase 6 (CMIP6) experimental design and organization. Geosci. Model Dev. 2016, 9, 1937–1958. [Google Scholar] [CrossRef]
  71. Anderson, M.J.; Gorley, R.N.; Clarke, K.R. PERMANOVA+ for PRIMER: Guide to Software and Statistical Methods; Massey University: Auckland, New Zealand; PRIMER-e Ltd.: Plymouth, UK, 2008. [Google Scholar]
  72. Clarke, K.R.; Gorley, R.N.; Somerfield, P.J.; Warwick, R.M. Change in Marine Communities: An Approach to Statistical Analysis and Interpretation, 3rd ed.; PRIMER-E: Plymouth, UK, 2014. [Google Scholar]
  73. Philander, S.G.; Rasmusson, E.M. The southern oscillation and El Niño. Adv. Geophys. 1985, 28, 197–215. [Google Scholar]
  74. Vega, M.J.; Alvarez-Silva, O.; Restrepo, J.C.; Ortiz, J.C.; Otero, L.J. Interannual variability of wave climate in the Caribbean Sea. Ocean Dyn. 2020, 70, 965–976. [Google Scholar] [CrossRef]
  75. Tartaglione, C.A.; Smith, S.R.; O’Brien, J.J. ENSO impact on hurricane landfall probabilities for the Caribbean. J. Clim. 2003, 16, 2925–2931. [Google Scholar] [CrossRef]
  76. Klotzbach, P.J. The influence of El Niño–Southern Oscillation and the Atlantic multidecadal oscillation on Caribbean tropical cyclone activity. J. Clim. 2011, 24, 721–731. [Google Scholar] [CrossRef]
  77. Hurrell, J.W.; Deser, C. North Atlantic climate variability: The role of the North Atlantic Oscillation. J. Mar. Syst. 2010, 79, 231–244. [Google Scholar] [CrossRef]
  78. Hetzinger, S.; Pfeiffer, M.; Dullo, W.C.; Garbe-Schönberg, D.; Halfar, J. Rapid 20th century warming in the Caribbean and impact of remote forcing on climate in the northern tropical Atlantic as recorded in a Guadeloupe coral. Palaeogeogr. Palaeoclimatol. Palaeoecol. 2010, 296, 111–124. [Google Scholar] [CrossRef]
  79. Jury, M.; Malmgren, B.A.; Winter, A. Subregional precipitation climate of the Caribbean and relationships with ENSO and NAO. J. Geophys. Res. Atmos. 2007, 112, D16107. [Google Scholar] [CrossRef]
  80. Moron, V.; Gouirand, I.; Taylor, M. Weather types across the Caribbean basin and their relationship with rainfall and sea surface temperature. Clim. Dyn. 2016, 47, 601–621. [Google Scholar] [CrossRef]
  81. Stephenson, T.S.; Vincent, L.A.; Allen, T.; Van Meerbeeck, C.J.; McLean, N.; Peterson, T.C.; Taylor, M.A.; Aaron-Morrison, A.P.; Auguste, T.; Bernard, D.; et al. Changes in extreme temperature and precipitation in the Caribbean region, 1961–2010. Int. J. Climatol. 2014, 34, 2957–2971. [Google Scholar] [CrossRef]
  82. Simonti, A.L.; Eastman, J.R. 2005 Caribbean mass coral bleaching event: A sea surface temperature empirical orthogonal teleconnection analysis. J. Geophys. Res. Ocean. 2010, 115, C11009. [Google Scholar] [CrossRef]
  83. Vimont, D.J.; Kossin, J.P. The Atlantic meridional mode and hurricane activity. Geophys. Res. Lett. 2007, 34, L07709. [Google Scholar] [CrossRef]
  84. Lizcano-Sandoval, L.D.; Marulanda-Gómez, Á.; López-Victoria, M.; Rodriguez-Ramirez, A. Climate change and Atlantic Multidecadal Oscillation as drivers of recent declines in coral growth rates in the Southwestern Caribbean. Front. Mar. Sci. 2019, 6, 38. [Google Scholar] [CrossRef]
  85. Jury, M.R. MJO influence in the Caribbean. Theor. Appl. Climatol. 2020, 139, 1559–1567. [Google Scholar] [CrossRef]
  86. Mantua, N.J.; Hare, S.R. The Pacific decadal oscillation. J. Oceanogr. 2002, 58, 35–44. [Google Scholar] [CrossRef]
  87. Nidheesh, A.G.; Lengaigne, M.; Vialard, J.; Izumo, T.; Unnikrishnan, A.S.; Cassou, C. Influence of ENSO on the Pacific decadal oscillation in CMIP models. Clim. Dyn. 2017, 49, 3309–3326. [Google Scholar] [CrossRef]
  88. Pierrehumbert, R.T. Thermostats, radiator fins, and the local runaway greenhouse. J. Atm. Sci. 1995, 52, 1784–1806. [Google Scholar] [CrossRef]
  89. Wang, C. Variability of the Caribbean low-level jet and its relations to climate. Clim. Dyn. 2007, 29, 411–422. [Google Scholar] [CrossRef]
  90. Wang, C.; Lee, S.K. Atlantic warm pool, Caribbean low-level jet, and their potential impact on Atlantic hurricanes. Geophys. Res. Lett. 2007, 34, L02703. [Google Scholar] [CrossRef]
  91. Li, H.; Misra, V. Thirty-two-year ocean–atmosphere coupled downscaling of global reanalysis over the Intra-American Seas. Clim. Dyn. 2014, 43, 2471–2489. [Google Scholar] [CrossRef]
  92. Montoya-Sánchez, R.A.; Devis-Morales, A.; Bernal, G.; Poveda, G. Seasonal and interannual variability of the mixed layer heat budget in the Caribbean Sea. J. Mar. Syst. 2018, 187, 111–127. [Google Scholar] [CrossRef]
  93. Rajasree, V.P.; Cao, X.; Ramsay, H.; Ocasio, K.M.; Kilroy, G.; Alvey, G.R., III; Chang, M.; Nam, C.C.; Fudeyasu, H.; Teng, H.F.; et al. Tropical cyclogenesis: Controlling factors and physical mechanisms. Trop. Cyclone Res. Rev. 2023, 12, 165–181. [Google Scholar] [CrossRef]
  94. Jones, P.D.; Harpham, C.; Harris, I.; Goodess, C.M.; Burton, A.; Centella-Artola, A.; Taylor, M.A.; Bezanilla-Morlot, A.; Campbell, J.D.; Stephenson, T.S.; et al. Long-term trends in precipitation and temperature across the Caribbean. Int. J. Climatol. 2016, 36, 3314–3333. [Google Scholar] [CrossRef]
  95. Zhao, L.; Xu, J.; Powell, A.M.; Jiang, Z. Uncertainties of the global-to-regional temperature and precipitation simulations in CMIP5 models for past and future 100 years. Theor. Appl. Climatol. 2015, 122, 259–270. [Google Scholar] [CrossRef]
  96. Zhou, C.; Wang, K. Land surface temperature over global deserts: Means, variability, and trends. J. Geophys. Res. Atmos. 2016, 121, 14344–14357. [Google Scholar] [CrossRef]
  97. Sun, X.; Ren, G.; Xu, W.; Li, Q.; Ren, Y. Global land-surface air temperature change based on the new CMA GLSAT data set. Sci. Bull. 2017, 62, 236–238. [Google Scholar] [CrossRef] [PubMed]
  98. Sun, C.; Jiang, Z.; Li, W.; Hou, Q.; Li, L. Changes in extreme temperature over China when global warming stabilized at 1.5 °C and 2.0 °C. Sci. Rep. 2019, 9, 14982. [Google Scholar] [CrossRef]
  99. Sun, X.; Ren, G.; Ren, Y.; Lin, W.; Zhang, P.; Zhang, S.; Xue, X. Asian climate warming since 1901: Observation and simulation. Clim. Res. 2023, 91, 67–82. [Google Scholar] [CrossRef]
  100. Duan, J.; Li, L.; Chen, L.; Zhang, H. Time-dependent warming amplification over the Tibetan Plateau during the past few decades. Atm. Sci. Lett. 2020, 21, e998. [Google Scholar] [CrossRef]
  101. Nita, I.A.; Sfîcă, L.; Voiculescu, M.; Birsan, M.V.; Micheu, M.M. Changes in the global mean air temperature over land since 1980. Atm. Res. 2022, 279, 106392. [Google Scholar] [CrossRef]
  102. Ren, G.; Zhan, Y.; Ren, Y.; Wen, K.; Zhang, Y.; Sun, X.; Zhang, P.; Zheng, X.; Qin, Y.; Zhang, S.; et al. Observed changes in temperature and precipitation over Asia, 1901–2020. Clim. Res. 2023, 90, 31–43. [Google Scholar] [CrossRef]
  103. Gautam, R.; Pathak, B.; Bhuyan, P.K.; Borgohain, A.; Kundu, S.S. Long-term trend analysis of surface temperature over North-East India and adjoining regions based on CRU and ERA5 reanalysis. J. Earth Syst. Sci. 2024, 133, 141. [Google Scholar] [CrossRef]
  104. Li, Q.; Dong, W.; Li, W.; Gao, X.; Jones, P.; Kennedy, J.; Parker, D. Assessment of the uncertainties in temperature change in China during the last century. Chin. Sci. Bull. 2010, 55, 1974–1982. [Google Scholar] [CrossRef]
  105. Yosef, Y.; Aguilar, E.; Alpert, P. Detecting and adjusting artificial biases of long-term temperature records in Israel. Int. J. Climatol. 2018, 38, 3273–3289. [Google Scholar] [CrossRef]
  106. You, Q.; Min, J.; Fraedrich, K.; Zhang, W.; Kang, S.; Zhang, L.; Meng, X. Projected trends in mean, maximum, and minimum surface temperature in China from simulations. Glob. Planet Change 2014, 112, 53–63. [Google Scholar] [CrossRef]
  107. Hu, G.; Zhao, L.; Wu, T.; Wu, X.; Park, H.; Li, R.; Zhu, X.; Ni, J.; Zou, D.; Hao, J.; et al. Continued warming of the permafrost regions over the Northern Hemisphere under future climate change. Earth’s Future 2022, 10, e2022EF002835. [Google Scholar] [CrossRef]
  108. Bove, C.B.; Mudge, L.; Bruno, J.F. A century of warming on Caribbean reefs. PloS Clim. 2022, 1, e0000002. [Google Scholar] [CrossRef]
  109. Antuña-Marrero, J.C.; Otterå, O.H.; Robock, A.; Mesquita, M.D. Modelled and observed sea surface temperature trends for the Caribbean and Antilles. Int. J. Climatol. 2016, 36, 1873–1886. [Google Scholar] [CrossRef]
  110. Shi, J.; Hu, C. South Florida estuaries are warming faster than global oceans. Environ. Res. Lett. 2022, 18, 014003. [Google Scholar] [CrossRef]
  111. Shears, N.T.; Bowen, M.M. Half a century of coastal temperature records reveal complex warming trends in western boundary currents. Sci. Rep. 2017, 7, 14527. [Google Scholar] [CrossRef] [PubMed]
  112. Alpert, A.E.; Cohen, A.L.; Oppo, D.W.; DeCarlo, T.M.; Gaetani, G.A.; Hernández-Delgado, E.A.; Winter, A.; Gonneea, M.E. Twentieth century warming of the tropical Atlantic captured by Sr-U paleothermometry. Paleoceanography 2017, 32, 146–160. [Google Scholar] [CrossRef]
  113. Bustos Usta, D.F.; Torres Parra, R.R. Ocean and atmosphere changes in the Caribbean Sea during the twenty-first century using CMIP5 models. Ocean Dyn. 2021, 71, 757–777. [Google Scholar] [CrossRef]
  114. Karmalkar, A.V.; Taylor, M.A.; Campbell, J.; Stephenson, T.; New, M.; Centella, A.; Benzanilla, A.; Charlery, J. A review of observed and projected changes in climate for the islands in the Caribbean. Atmósfera 2013, 26, 283–309. [Google Scholar] [CrossRef]
  115. Enfield, D.B.; Mestas-Nuñez, A.M.; Trimble, P.J. The Atlantic multidecadal oscillation and its relation to rainfall and river flows in the continental US. Geophys. Res. Lett. 2001, 28, 2077–2080. [Google Scholar] [CrossRef]
  116. Alexander, M.A.; Kilbourne, K.H.; Nye, J.A. Climate variability during warm and cold phases of the Atlantic Multidecadal Oscillation (AMO) 1871–2008. J. Mar. Syst. 2014, 133, 14–26. [Google Scholar] [CrossRef]
  117. Delworth, T.L.; Zhang, R.; Mann, M.E. Decadal to centennial variability of the Atlantic from observations and models. Ocean Circ.: Mech. Impacts 2007, 173, 131–148. [Google Scholar]
  118. Kavvada, A.; Ruiz-Barradas, A.; Nigam, S. AMO’s structure and climate footprint in observations and IPCC AR5 climate simulations. Clim. Dyn. 2013, 41, 1345–1364. [Google Scholar] [CrossRef]
  119. Mann, M.E.; Steinman, B.A.; Miller, S.K. On forced temperature changes, internal variability, and the AMO. Geophys. Res. Lett. 2014, 41, 3211–3219. [Google Scholar] [CrossRef]
  120. Steinman, B.A.; Mann, M.E.; Miller, S.K. Atlantic and Pacific multidecadal oscillations and Northern Hemisphere temperatures. Science 2015, 347, 988–991. [Google Scholar] [CrossRef] [PubMed]
  121. Mann, M.E.; Steinman, B.A.; Miller, S.K. Absence of internal multidecadal and interdecadal oscillations in climate model simulations. Nat. Comm. 2020, 11, 49. [Google Scholar] [CrossRef] [PubMed]
  122. Zhang, W.; Mei, X.; Geng, X.; Turner, A.G.; Jin, F.F. A nonstationary ENSO–NAO relationship due to AMO modulation. J. Clim. 2019, 32, 33–43. [Google Scholar] [CrossRef]
  123. Mann, M.E.; Steinman, B.A.; Brouillette, D.J.; Miller, S.K. Multidecadal climate oscillations during the past millennium driven by volcanic forcing. Science 2021, 371, 1014–1019. [Google Scholar] [CrossRef]
  124. Houghton, J. The science of global warming. Int. Sci. Rev. 2001, 26, 247–257. [Google Scholar] [CrossRef]
  125. Sanderson, M.G.; Hemming, D.L.; Betts, R.A. Regional temperature and precipitation changes under high-end (≥4 °C) global warming. Phil. Trans. Royal Soc. A Math. Phys. Eng. Sci. 2011, 369, 85–98. [Google Scholar] [CrossRef]
  126. Donnelly, C.; Greuell, W.; Andersson, J.; Gerten, D.; Pisacane, G.; Roudier, P.; Ludwig, F. Impacts of climate change on European hydrology at 1.5, 2 and 3 degrees mean global warming above preindustrial level. Clim. Change 2017, 143, 13–26. [Google Scholar] [CrossRef]
  127. Raftery, A.E.; Zimmer, A.; Frierson, D.M.; Startz, R.; Liu, P. Less than 2 °C warming by 2100 unlikely. Nat. Clim. Change 2017, 7, 637–641. [Google Scholar] [CrossRef]
  128. Wang, X.; Jiang, D.; Lang, X. Climate change of 4 °C global warming above pre-industrial levels. Adv. Atm. Sci. 2018, 35, 757–770. [Google Scholar] [CrossRef]
  129. Pielke, R., Jr.; Burgess, M.G.; Ritchie, J. Plausible 2005-2050 emissions scenarios project between 2 and 3 degrees C of warming by 2100. Environ. Res. Lett. 2022, 17, 024027. [Google Scholar] [CrossRef]
  130. Bärring, L.; Strandberg, G. Does the projected pathway to global warming targets matter? Environ. Res. Lett. 2018, 13, 024029. [Google Scholar] [CrossRef]
  131. Betts, R.A.; Collins, M.; Hemming, D.L.; Jones, C.D.; Lowe, J.A.; Sanderson, M.G. When could global warming reach 4 °C? Phil. Trans. Royal Soc. A Math. Phys. Eng. Sci. 2011, 369, 67–84. [Google Scholar] [CrossRef] [PubMed]
  132. Chang, E.K.; Guo, Y.; Xia, X. CMIP5 multimodel ensemble projection of storm track change under global warming. J. Geophys. Res. Atmos. 2012, 117, D23118. [Google Scholar] [CrossRef]
  133. Arnell, N.W.; Gosling, S.N. The impacts of climate change on river flow regimes at the global scale. J. Hydrol. 2013, 486, 351–364. [Google Scholar] [CrossRef]
  134. Brander, K. Impacts of climate change on fisheries. J. Mar. Syst. 2010, 79, 389–402. [Google Scholar] [CrossRef]
  135. Hollowed, A.B.; Barange, M.; Beamish, R.J.; Brander, K.; Cochrane, K.; Drinkwater, K.; Foreman, M.G.; Hare, J.A.; Holt, J.; Ito, S.I.; et al. Projected impacts of climate change on marine fish and fisheries. ICES J. Mar. Sci. 2013, 70, 1023–1037. [Google Scholar] [CrossRef]
  136. Erauskin-Extramiana, M.; Arrizabalaga, H.; Hobday, A.J.; Cabré, A.; Ibaibarriaga, L.; Arregui, I.; Murua, H.; Chust, G. Large-scale distribution of tuna species in a warming ocean. Global Change Biol. 2019, 25, 2043–2060. [Google Scholar] [CrossRef] [PubMed]
  137. Reyer, C.P.; Adams, S.; Albrecht, T.; Baarsch, F.; Boit, A.; Canales Trujillo, N.; Cartsburg, M.; Coumou, D.; Eden, A.; Fernandes, E.; et al. Climate change impacts in Latin America and the Caribbean and their implications for development. Reg. Environ. Change 2017, 17, 1601–1621. [Google Scholar] [CrossRef]
  138. Prager, S.D.; Ríos, A.R.; Schiek, B.; Almeida, J.S.; González, C.E. Climate change vulnerability and economic impacts in the agricultural sector in Latin America and the Caribbean. In IDB Technical Note IDB-TN-01915, Inter-American Development Bank (IDB); International Center for Tropical Agriculture (CIAT): Cali, Colombia, 2020. [Google Scholar]
  139. Lachaud, M.A.; Bravo-Ureta, B.E.; Ludena, C.E. Economic effects of climate change on agricultural production and productivity in Latin America and the Caribbean (LAC). Agric. Econ. 2022, 53, 321–332. [Google Scholar] [CrossRef]
  140. Soong, J.L.; Phillips, C.L.; Ledna, C.; Koven, C.D.; Torn, M.S. CMIP5 models predict rapid and deep soil warming over the 21st century. J. Geophys. Res: Biogeosci. 2020, 125, e2019JG005266. [Google Scholar] [CrossRef]
  141. Brienen, R.J.; Phillips, O.L.; Feldpausch, T.R.; Gloor, E.; Baker, T.R.; Lloyd, J.; López-González, G.; Monteagudo-Mendoza, A.; Malhi, Y.; Lewis, S.L.; et al. Long-term decline of the Amazon carbon sink. Nature 2015, 519, 344–348. [Google Scholar] [CrossRef]
  142. Crowther, T.W.; Todd-Brown, K.E.; Rowe, C.W.; Wieder, W.R.; Carey, J.C.; Machmuller, M.B.; Snoek, B.L.; Fang, S.; Zhou, G.; Allison, S.D.; et al. Quantifying global soil carbon losses in response to warming. Nature 2016, 540, 104–108. [Google Scholar] [CrossRef] [PubMed]
  143. Qin, Y.; Xiao, X.; Wigneron, J.P.; Ciais, P.; Brandt, M.; Fan, L.; Li, X.; Crowell, S.; Wu, X.; Doughty, R.; et al. Carbon loss from forest degradation exceeds that from deforestation in the Brazilian Amazon. Nat. Clim. Change 2021, 11, 442–448. [Google Scholar] [CrossRef]
  144. Neelin, J.D.; Münnich, M.; Su, H.; Meyerson, J.E.; Holloway, C.E. Tropical drying trends in global warming models and observations. Proc. Natl. Acad. Sci. USA 2006, 103, 6110–6115. [Google Scholar] [CrossRef] [PubMed]
  145. Cashman, A.; Nurse, L.; John, C. Climate change in the Caribbean: The water management implications. J. Environ. Dev. 2010, 19, 42–67. [Google Scholar] [CrossRef]
  146. Taylor, M.A.; Stephenson, T.S.; Chen, A.A.; Stephenson, K.A. Climate change and the Caribbean: Review and response. Caribb. Stud. 2012, 40, 169–200. [Google Scholar] [CrossRef]
  147. Hernández-Delgado, E.A. Climate change impacts on Caribbean coastal ecosystems: Emergent ecological and environmental geography challenges. In Routledge Handbook of Latin America and the Environment; Routledge: London, UK, 2023; pp. 36–50. [Google Scholar]
  148. Lugo, A.E. Effects and outcomes of Caribbean hurricanes in a climate change scenario. Sci. Total Environ. 2000, 262, 243–251. [Google Scholar] [CrossRef]
  149. Bishop, M.L.; Payne, A. Climate change and the future of Caribbean development. J. Dev. Stud. 2012, 48, 1536–1553. [Google Scholar] [CrossRef]
  150. Karmalkar, A.V.; Bradley, R.S.; Díaz, H.F. Climate change in Central America and Mexico: Regional climate model validation and climate change projections. Clim. Dyn. 2011, 37, 605–629. [Google Scholar] [CrossRef]
  151. Imbach, P.; Chou, S.C.; Lyra, A.; Rodrigues, D.; Rodriguez, D.; Latinovic, D.; Siqueira, G.; Silva, A.; Garofolo, L.; Georgiou, S. Future climate change scenarios in Central America at high spatial resolution. PLoS ONE 2018, 13, e0193570. [Google Scholar] [CrossRef]
  152. Hidalgo León, H.G.; Amador Astúa, J.A.; Alfaro Martínez, E.J.; Quesada, B. Hydrological climate change projections for Central America. J. Hydrol. 2013, 495, 94–112. [Google Scholar] [CrossRef]
  153. Harvey, C.A.; Saborio-Rodríguez, M.; Martínez-Rodríguez, M.R.; Viguera, B.; Chain-Guadarrama, A.; Vignola, R.; Alpizar, F. Climate change impacts and adaptation among smallholder farmers in Central America. Agric. Food Secur. 2018, 7, 57. [Google Scholar] [CrossRef]
  154. Lyra, A.; Imbach, P.; Rodríguez, D.; Chou, S.C.; Georgiou, S.; Garofolo, L. Projections of climate change impacts on Central America tropical rainforest. Clim. Change 2017, 141, 93–105. [Google Scholar] [CrossRef]
  155. Caruso, C.; Hughes, K.; Drury, C. Selecting heat-tolerant corals for proactive reef restoration. Front. Mar. Sci. 2021, 8, 632027. [Google Scholar] [CrossRef]
  156. Quigley, K.M. Breeding and selecting corals resilient to global warming. Annu. Rev. Anim. Biosci. 2024, 12, 209–332. [Google Scholar] [CrossRef]
  157. Humanes, A.; Lachs, L.; Beauchamp, E.; Bukurou, L.; Buzzoni, D.; Bythell, J.; Craggs, J.R.; de la Torre Cerro, R.; Edwards, A.J.; Golbuu, Y.; et al. Selective breeding enhances coral heat tolerance to marine heatwaves. Nature Commun. 2024, 15, 8703. [Google Scholar] [CrossRef] [PubMed]
  158. Palumbi, S.R.; Barshis, D.J.; Traylor-Knowles, N.; Bay, R.A. Mechanisms of reef coral resistance to future climate change. Science 2014, 344, 895–898. [Google Scholar] [CrossRef]
  159. Smith, E.G.; Hazzouri, K.M.; Choi, J.Y.; Delaney, P.; Al-Kharafi, M.; Howells, E.J.; Aranda, M.; Burt, J.A. Signatures of selection underpinning rapid coral adaptation to the world’s warmest reefs. Sci. Adv. 2022, 8, eabl7287. [Google Scholar] [CrossRef] [PubMed]
  160. Lachs, L.; Donner, S.D.; Mumby, P.J.; Bythell, J.C.; Humanes, A.; East, H.K.; Guest, J.R. Emergent increase in coral thermal tolerance reduces mass bleaching under climate change. Nature Commun. 2023, 14, 4939. [Google Scholar] [CrossRef]
  161. Selmoni, O.; Bay, L.K.; Exposito-Alonso, M.; Cleves, P.A. Finding genes and pathways that underlie coral adaptation. Trends Genet. 2024, 40, 213–227. [Google Scholar] [CrossRef]
  162. Nunn, B.L.; Brown, T.; Timmins-Schiffman, E.; Mudge, M.C.; Riffle, M.; Axworthy, J.B.; Dilworth, J.; Kenkel, C.D.; Zaneveld, J.; Rodrigues, L.J.; et al. Protein signatures predict coral resilience and survival to thermal bleaching events. Commun. Earth Environ. 2025, 6, 191. [Google Scholar] [CrossRef]
  163. Huang, W.; Chen, J.; Yang, E.; Meng, L.; Feng, Y.; Chen, Y.; Huang, Z.; Tan, R.; Xiao, Z.; Zhou, Y.; et al. Heat-tolerant subtropical Porites lutea may be better adapted to future climate change than tropical one in the South China Sea. Sci. Total Environ. 2025, 962, 178381. [Google Scholar] [CrossRef] [PubMed]
  164. Baums, I.B.; Baker, A.C.; Davies, S.W.; Grottoli, A.G.; Kenkel, C.D.; Kitchen, S.A.; Kuffner, I.B.; LaJeunesse, T.C.; Matz, M.V.; Miller, M.W.; et al. Considerations for maximizing the adaptive potential of restored coral populations in the western Atlantic. Ecol. Appl. 2019, 29, e01978. [Google Scholar] [CrossRef] [PubMed]
  165. Shaver, E.C.; McLeod, E.; Hein, M.Y.; Palumbi, S.R.; Quigley, K.; Vardi, T.; Mumby, P.J.; Smith, D.; Montoya-Maya, P.; Muller, E.M.; et al. A roadmap to integrating resilience into the practice of coral reef restoration. Global Change Biol. 2022, 28, 4751–4764. [Google Scholar] [CrossRef]
  166. Montoya Maya, P.H.; Smit, K.P.; Burt, A.J.; Frias-Torres, S. Large-scale coral reef restoration could assist natural recovery in Seychelles, Indian Ocean. Nature Conserv. 2016, 16, 1–7. [Google Scholar] [CrossRef]
  167. Doropoulos, C.; Vons, F.; Elzinga, J.; Ter Hofstede, R.; Salee, K.; Van Koningsveld, M.; Babcock, R.C. Testing industrial-scale coral restoration techniques: Harvesting and culturing wild coral-spawn slicks. Front. Mar. Sci. 2019, 6, 658. [Google Scholar] [CrossRef]
  168. McLeod, I.M.; Hein, M.Y.; Babcock, R.; Bay, L.; Bourne, D.G.; Cook, N.; Doropoulos, C.; Gibbs, M.; Harrison, P.; Lockie, S.; et al. Coral restoration and adaptation in Australia: The first five years. PLoS ONE 2022, 17, e0273325. [Google Scholar] [CrossRef]
  169. Vardi, T.; Hoot, W.C.; Levy, J.; Shaver, E.; Winters, R.S.; Banaszak, A.T.; Baums, I.B.; Chamberland, V.F.; Cook, N.; Gulko, D.; et al. Six priorities to advance the science and practice of coral reef restoration worldwide. Restor. Ecol. 2021, 29, e13498. [Google Scholar] [CrossRef]
  170. Page, C.A.; Muller, E.M.; Vaughan, D.E. Microfragmenting for the successful restoration of slow growing massive corals. Ecol. Eng. 2018, 123, 86–94. [Google Scholar] [CrossRef]
  171. Tortolero-Langarica, J.A.; Rodríguez-Troncoso, A.P.; Cupul-Magaña, A.L.; Rinkevich, B. Micro-fragmentation as an effective and applied tool to restore remote reefs in the Eastern Tropical Pacific. Int. J. Environ. Res. Public Health 2020, 17, 6574. [Google Scholar] [CrossRef]
  172. Banaszak, A.T.; Marhaver, K.L.; Miller, M.W.; Hartmann, A.C.; Albright, R.; Hagedorn, M.; Harrison, P.L.; Latijnhouwers, K.R.; Mendoza Quiroz, S.; Pizarro, V.; et al. Applying coral breeding to reef restoration: Best practices, knowledge gaps, and priority actions in a rapidly-evolving field. Restor. Ecol. 2023, 31, e13913. [Google Scholar] [CrossRef]
  173. Blanco-Pimentel, M.; Kenkel, C.D.; Kitchen, S.A.; Calle-Triviño, J.; Baums, I.B.; Cortés-Useche, C.; Morikawa, M.K. Overcoming barriers to reef restoration: Field-based method for approximate genotyping of Acropora cervicornis. Restor. Ecol. 2024, 32, e14073. [Google Scholar] [CrossRef]
  174. Hobbs, R.J.; O’Brien, J.K.; Bay, L.K.; Severati, A.; Spindler, R.; Henley, E.M.; Quigley, K.M.; Randall, C.J.; van Oppen, M.J.; Carter, V.; et al. A decade of coral biobanking science in Australia-transitioning into applied reef restoration. Front. Mar. Sci. 2022, 9, 960470. [Google Scholar] [CrossRef]
  175. Daly, J.; Zuchowicz, N.; Nuñez Lendo, C.I.; Khosla, K.; Lager, C.; Henley, E.M.; Bischof, J.; Kleinhans, F.W.; Lin, C.; Peters, E.C.; et al. Successful cryopreservation of coral larvae using vitrification and laser warming. Sci. Rep. 2018, 8, 15714. [Google Scholar] [CrossRef]
  176. Hagedorn, M.; Page, C.A.; O’Neil, K.L.; Flores, D.M.; Tichy, L.; Conn, T.; Chamberland, V.F.; Lager, C.; Zuchowicz, N.; Lohr, K.; et al. Assisted gene flow using cryopreserved sperm in critically endangered coral. Proc. Natl. Acad. Sci. USA 2021, 118, e2110559118. [Google Scholar] [CrossRef]
  177. Brown, A.L.; Anastasiou, D.E.; Schul, M.; MacVittie, S.; Spiers, L.J.; Meyer, J.L.; Manfrino, C.; Frazer, T.K. Mixtures of genotypes increase disease resistance in a coral nursery. Sci. Rep. 2022, 12, 19286. [Google Scholar] [CrossRef]
  178. Bowden-Kerby, A. Coral-focused climate change adaptation and restoration based on accelerating natural processes: Launching the “Reefs of Hope” paradigm. Oceans 2022, 4, 13–26. [Google Scholar] [CrossRef]
  179. Goergen, E.A.; Schopmeyer, S.; Moulding, A.L.; Moura, A.; Kramer, P.; Viehman, T.S. Coral Reef Restoration Monitoring Guide: Methods to Evaluate Restoration Success from Local to Ecosystem Scales; NOAA Technical Memorandum NOS NCCOS 279; NOAA: Silver Spring, MD, USA, 2020; p. 145. [Google Scholar] [CrossRef]
  180. Alexander, J.B.; Bunce, M.; White, N.; Wilkinson, S.P.; Adam, A.A.; Berry, T.; Stat, M.; Thomas, L.; Newman, S.J.; Dugal, L.; et al. Development of a multi-assay approach for monitoring coral diversity using eDNA metabarcoding. Coral Reefs 2020, 39, 159–171. [Google Scholar] [CrossRef]
  181. Rodríguez-Casariego, J.A.; Mercado-Molina, A.E.; García-Souto, D.; Ortiz-Rivera, I.M.; Lopes, C.; Baums, I.B.; Sabat, A.M.; Eirin-López, J.M. Genome-wide DNA methylation analysis reveals a conserved epigenetic response to seasonal environmental variation in the staghorn coral Acropora cervicornis. Front. Mar. Sci. 2020, 7, 560424. [Google Scholar] [CrossRef]
  182. Eirin-López, J.M.; Putnam, H. Marine environmental epigenetics. Front. Mar. Sci. 2021, 8, 685075. [Google Scholar] [CrossRef]
  183. Xu, J.; Zhao, D. Review of coral reef ecosystem remote sensing. Acta Ecol. Sin. 2014, 34, 19–25. [Google Scholar] [CrossRef]
  184. Hedley, J.D.; Roelfsema, C.M.; Chollett, I.; Harborne, A.R.; Heron, S.F.; Weeks, S.; Skirving, W.J.; Strong, A.E.; Eakin, C.M.; Christensen, T.R.; et al. Remote sensing of coral reefs for monitoring and management: A review. Remote Sens. 2016, 8, 118. [Google Scholar] [CrossRef]
  185. Foo, S.A.; Asner, G.P. Scaling up coral reef restoration using remote sensing technology. Front. Mar. Sci. 2019, 6, 79. [Google Scholar] [CrossRef]
  186. Eakin, C.M.; Lough, J.M.; Heron, S.F. Climate variability and change: Monitoring data and evidence for increased coral bleaching stress. In Coral Bleaching: Patterns, Processes, Causes and Consequences; Springer: Berlin/Heidelberg, Germany, 2009; pp. 41–67. [Google Scholar]
  187. Flower, J.; Ortiz, J.C.; Chollett, I.; Abdullah, S.; Castro-Sanguino, C.; Hock, K.; Lam, V.; Mumby, P.J. Interpreting coral reef monitoring data: A guide for improved management decisions. Ecol. Indic. 2017, 72, 848–869. [Google Scholar] [CrossRef]
  188. Bellantuono, A.J.; Granados-Cifuentes, C.; Miller, D.J.; Hoegh-Guldberg, O.; Rodríguez-Lanetty, M. Coral thermal tolerance: Tuning gene expression to resist thermal stress. PLoS ONE 2012, 7, e50685. [Google Scholar] [CrossRef]
  189. Page, C.E.; Leggat, W.; Heron, S.F.; Fordyce, A.J.; Ainsworth, T.D. High flow conditions mediate damaging impacts of sub-lethal thermal stress on corals’ endosymbiotic algae. Conserv. Physiol. 2021, 9, coab046. [Google Scholar] [CrossRef] [PubMed]
  190. van Oppen, M.J.; Oliver, J.K.; Putnam, H.M.; Gates, R.D. Building coral reef resilience through assisted evolution. Proc. Natl. Acad. Sci. USA 2015, 112, 2307–2313. [Google Scholar] [CrossRef] [PubMed]
  191. van Oppen, M.J.; Oakeshott, J.G. A breakthrough in understanding the molecular basis of coral heat tolerance. Proc. Natl. Acad. Sci. USA 2020, 117, 28546–28548. [Google Scholar] [CrossRef]
  192. Humanes, A.; Beauchamp, E.A.; Bythell, J.C.; Carl, M.K.; Craggs, J.R.; Edwards, A.J.; Golbuu, Y.; Lachs, L.; Martínez, H.M.; Palmowski, P.; et al. An experimental framework for selectively breeding corals for assisted evolution. Front. Mar. Sci. 2021, 8, 669995. [Google Scholar] [CrossRef]
  193. DeFilippo, L.B.; McManus, L.C.; Schindler, D.E.; Pinsky, M.L.; Colton, M.A.; Fox, H.E.; Tekwa, E.W.; Palumbi, S.R.; Essington, T.E.; Webster, M.M. Assessing the potential for demographic restoration and assisted evolution to build climate resilience in coral reefs. Ecol. Appl. 2022, 32, e2650. [Google Scholar] [CrossRef]
  194. Boström-Einarsson, L.; Babcock, R.C.; Bayraktarov, E.; Ceccarelli, D.; Cook, N.; Ferse, S.C.; Hancock, B.; Harrison, P.; Hein, M.; Shaver, E.; et al. Coral restoration–A systematic review of current methods, successes, failures and future directions. PLoS ONE 2020, 15, e0226631. [Google Scholar] [CrossRef] [PubMed]
  195. Watt-Pringle, R.; Razak, T.B.; Jompa, J.; Ambo-Rappe, R.; Kostaman, A.N.; Smith, D.J. Coral reef restoration in Indonesia: Lessons learnt from the world’s largest coral restoration nation. Biodivers. Conserv. 2024, 33, 2675–2707. [Google Scholar] [CrossRef]
  196. Cano, I.; Sellares-Blasco, R.I.; Lefcheck, J.S.; Villalpando, M.F.; Croquer, A. Effects of herbivory by the urchin Diadema antillarum on early restoration success of the coral Acropora cervicornis in the central Caribbean. J. Exp. Mar. Biol. Ecol. 2021, 539, 151541. [Google Scholar] [CrossRef]
  197. Williams, S.M. The reduction of harmful algae on Caribbean coral reefs through the reintroduction of a keystone herbivore, the long-spined sea urchin Diadema antillarum. Restor. Ecol. 2022, 30, e13475. [Google Scholar] [CrossRef]
  198. Butler, M.J., IV; Durán, A.; Feehan, C.J.; Harborne, A.R.; Hykema, A.; Patterson, J.T.; Sharp, W.C.; Spadaro, A.J.; Wijers, T.; Williams, S.M. Restoration of herbivory on Caribbean coral reefs: Are fishes, urchins, or crabs the solution? Front. Mar. Sci. 2024, 11, 1329028. [Google Scholar] [CrossRef]
  199. Viehman, T.S.; Reguero, B.G.; Lenihan, H.S.; Rosman, J.H.; Storlazzi, C.D.; Goergen, E.A.; Canals Silander, M.F.; Groves, S.H.; Holstein, D.M.; Bruckner, A.W.; et al. Coral restoration for coastal resilience: Integrating ecology, hydrodynamics, and engineering at multiple scales. Ecosphere 2023, 14, e4517. [Google Scholar] [CrossRef]
  200. Hernández-Delgado, E.A. Coastal restoration challenges and strategies for small island developing states in the face of sea level rise and climate change. Coasts 2024, 4, 235–286. [Google Scholar] [CrossRef]
  201. Storlazzi, C.D.; Reguero, B.G.; Alkins, K.C.; Shope, J.B.; Gaido-Lassarre, C.; Viehman, T.S.; Beck, M.W. Hybrid coral reef restoration can be a cost-effective nature-based solution to provide protection to vulnerable coastal populations. Sci. Adv. 2025, 11, eadn4004. [Google Scholar] [CrossRef]
  202. Familkhalili, R.; Storlazzi, C.D.; Nemeth, M.; Viehman, S. Assessing the effect of coral reef restoration location on coastal flood hazard along the San Juan Coastline, Puerto Rico. Front. Mar. Sci. 2025, 12, 1528460. [Google Scholar] [CrossRef]
  203. dela Cruz, D.W.; Rinkevich, B.; Gomez, E.D.; Yap, H.T. Assessing an abridged nursery phase for slow growing corals used in coral restoration. Ecol. Eng. 2015, 84, 408–415. [Google Scholar] [CrossRef]
  204. Frey, J.B.; Berkes, F. Can partnerships and community-based conservation reverse the decline of coral reef social-ecological systems? Int. J. Commons 2014, 8, 26–46. [Google Scholar] [CrossRef]
  205. Hernández-Delgado, E.A.; Mercado-Molina, A.E.; Suleimán-Ramos, S.E. Multi-disciplinary lessons learned from low-tech coral farming and reef rehabilitation practices. I. Best management practices. In Corals in a Changing World; Duque-Beltrán, C., Tello-Camacho, E., Eds.; InTech Publications: London, UK, 2018; pp. 213–243. [Google Scholar]
  206. Hernández-Delgado, E.A.; Mercado-Molina, A.E.; Suleimán-Ramos, S.E.; Lucking, M.A. Multi-disciplinary lessons learned from low-tech coral farming and reef rehabilitation practices. II. Coral demography and social-ecological benefits. In Corals in a Changing World; Duque-Beltrán, C., Tello-Camacho, E., Eds.; InTech Publications: London, UK, 2018; pp. 245–268. [Google Scholar]
  207. Hein, M.Y.; Birtles, A.; Willis, B.L.; Gardiner, N.; Beeden, R.; Marshall, N.A. Coral restoration: Socio-ecological perspectives of benefits and limitations. Biol. Conserv. 2019, 229, 14–25. [Google Scholar] [CrossRef]
  208. Bayraktarov, E.; Banaszak, A.T.; Montoya Maya, P.; Kleypas, J.; Arias-González, J.E.; Blanco, M.; Calle-Triviño, J.; Charuvi, N.; Cortés-Useche, C.; Galván, V.; et al. Coral reef restoration efforts in Latin American countries and territories. PLoS ONE 2020, 15, e0228477. [Google Scholar] [CrossRef]
  209. Norris, B.K.; Storlazzi, C.D.; Pomeroy, A.W.; Reguero, B.G. Optimizing infragravity wave attenuation to improve coral reef restoration design for coastal defense. J. Mar. Sci. Eng. 2024, 12, 768. [Google Scholar] [CrossRef]
  210. Rinkevich, B. Climate change and active reef restoration—Ways of constructing the “reefs of tomorrow”. J. Mar. Sci. Eng. 2015, 3, 111–127. [Google Scholar] [CrossRef]
  211. Rinkevich, B. The active reef restoration toolbox is a vehicle for coral resilience and adaptation in a changing world. J. Mar. Sci. Eng. 2019, 7, 201. [Google Scholar] [CrossRef]
  212. Rinkevich, B. Ecological engineering approaches in coral reef restoration. ICES J. Mar. Sci. 2021, 78, 410–420. [Google Scholar] [CrossRef]
  213. Kim, T.; Baek, S.; Kwon, Y.; Lee, J.; Cha, S.M.; Kwon, S. Improved coastal erosion prevention using a hybrid method with an artificial coral reef: Large-scale 3D hydraulic experiment. Water 2020, 12, 2801. [Google Scholar] [CrossRef]
  214. Roelvink, F.E.; Storlazzi, C.D.; Van Dongeren, A.R.; Pearson, S.G. Coral reef restorations can be optimized to reduce coastal flooding hazards. Front. Mar. Sci. 2021, 8, 653945. [Google Scholar] [CrossRef]
  215. Brathwaite, A.; Clua, E.; Roach, R.; Pascal, N. Coral reef restoration for coastal protection: Crafting technical and financial solutions. J. Environ. Manag. 2022, 310, 114718. [Google Scholar] [CrossRef]
  216. Geldard, J.; Lowe, R.; Draper, S.; Ghisalberti, M.; Westera, S.; Ellwood, G.; Cuttler, M.; Smith, D.; McArdle, A. Effectiveness of coral reef restoration in wave attenuation applications. Coast. Eng. Proc. 2022, 37, 90–91. [Google Scholar] [CrossRef]
  217. Norris, B.K.; Storlazzi, C.D.; Pomeroy, A.W.; Rosenberger, K.J.; Logan, J.B.; Cheriton, O.M. Combining field observations and high-resolution numerical modeling to demonstrate the effect of coral reef roughness on turbulence and its implications for reef restoration design. Coast. Eng. 2023, 184, 104331. [Google Scholar] [CrossRef]
  218. Norris, B.K.; Reguero, B.; Beck, M.; Bartolai, J.; Yukish, M.A.; Rhode-Barbarigos, L.; Haus, B.K.; Barajas, G.; Maza, M.; Lara, J.L. Designing modular, artificial reefs for both coastal defense and coral restoration. Coast. Eng. 2024, 199, 104742. [Google Scholar] [CrossRef]
  219. Tagliafico, A.; Baker, P.; Kelaher, B.; Ellis, S.; Harrison, D. The effects of shade and light on corals in the context of coral bleaching and shading technologies. Front. Mar. Sci. 2022, 9, 919382. [Google Scholar] [CrossRef]
  220. Butcherine, P.; Tagliafico, A.; Ellis, S.L.; Kelaher, B.P.; Hendrickson, C.; Harrison, D. Intermittent shading can moderate coral bleaching on shallow reefs. Front. Mar. Sci. 2023, 10, 1162896. [Google Scholar] [CrossRef]
  221. Razak, T.B.; Boström-Einarsson, L.; Alisa, C.A.; Vida, R.T.; Lamont, T.A. Coral reef restoration in Indonesia: A review of policies and projects. Mar. Policy 2022, 137, 104940. [Google Scholar] [CrossRef]
  222. Morrison, T.H.; Adger, N.; Barnett, J.; Brown, K.; Possingham, H.; Hughes, T. Advancing coral reef governance into the Anthropocene. One Earth 2020, 2, 64–74. [Google Scholar] [CrossRef]
  223. Westoby, R.; Becken, S.; Laria, A.P. Perspectives on the human dimensions of coral restoration. Reg. Environ. Change 2020, 20, 109. [Google Scholar] [CrossRef]
  224. Shumway, N.; Foster, R.; Fidelman, P. The governance of marine and coral reef restoration, lessons and paths forward for novel interventions. Environ. Sci. Pol. 2025, 164, 103999. [Google Scholar] [CrossRef]
  225. Rinkevich, B. Novel tradable instruments in the conservation of coral reefs, based on the coral gardening concept for reef restoration. J. Environ. Manag. 2015, 162, 199–205. [Google Scholar] [CrossRef]
  226. Hernández-Delgado, E.A.; Ramos-Scharrón, C.E.; Guerrero, C.; Lucking, M.A.; Laureano, R.; Méndez-Lázaro, P.A.; Meléndez-Díaz, J.O. Long-term impacts of tourism and urban development in tropical coastal habitats in a changing climate: Lessons learned from Puerto Rico. In Visions from Global Tourism Industry-Creating and Sustaining Competitive Strategies; Kasimoglu, M., Ed.; Intech Publications: Rikeja, Croatia, 2012; pp. 357–398. [Google Scholar]
  227. Mulà, C.; Bradshaw, C.J.; Cabeza, M.; Manca, F.; Montano, S.; Strona, G. Restoration cannot be scaled up globally to save reefs from loss and degradation. Nature Ecol. Evol. 2025, 9, 822–832. [Google Scholar] [CrossRef] [PubMed]
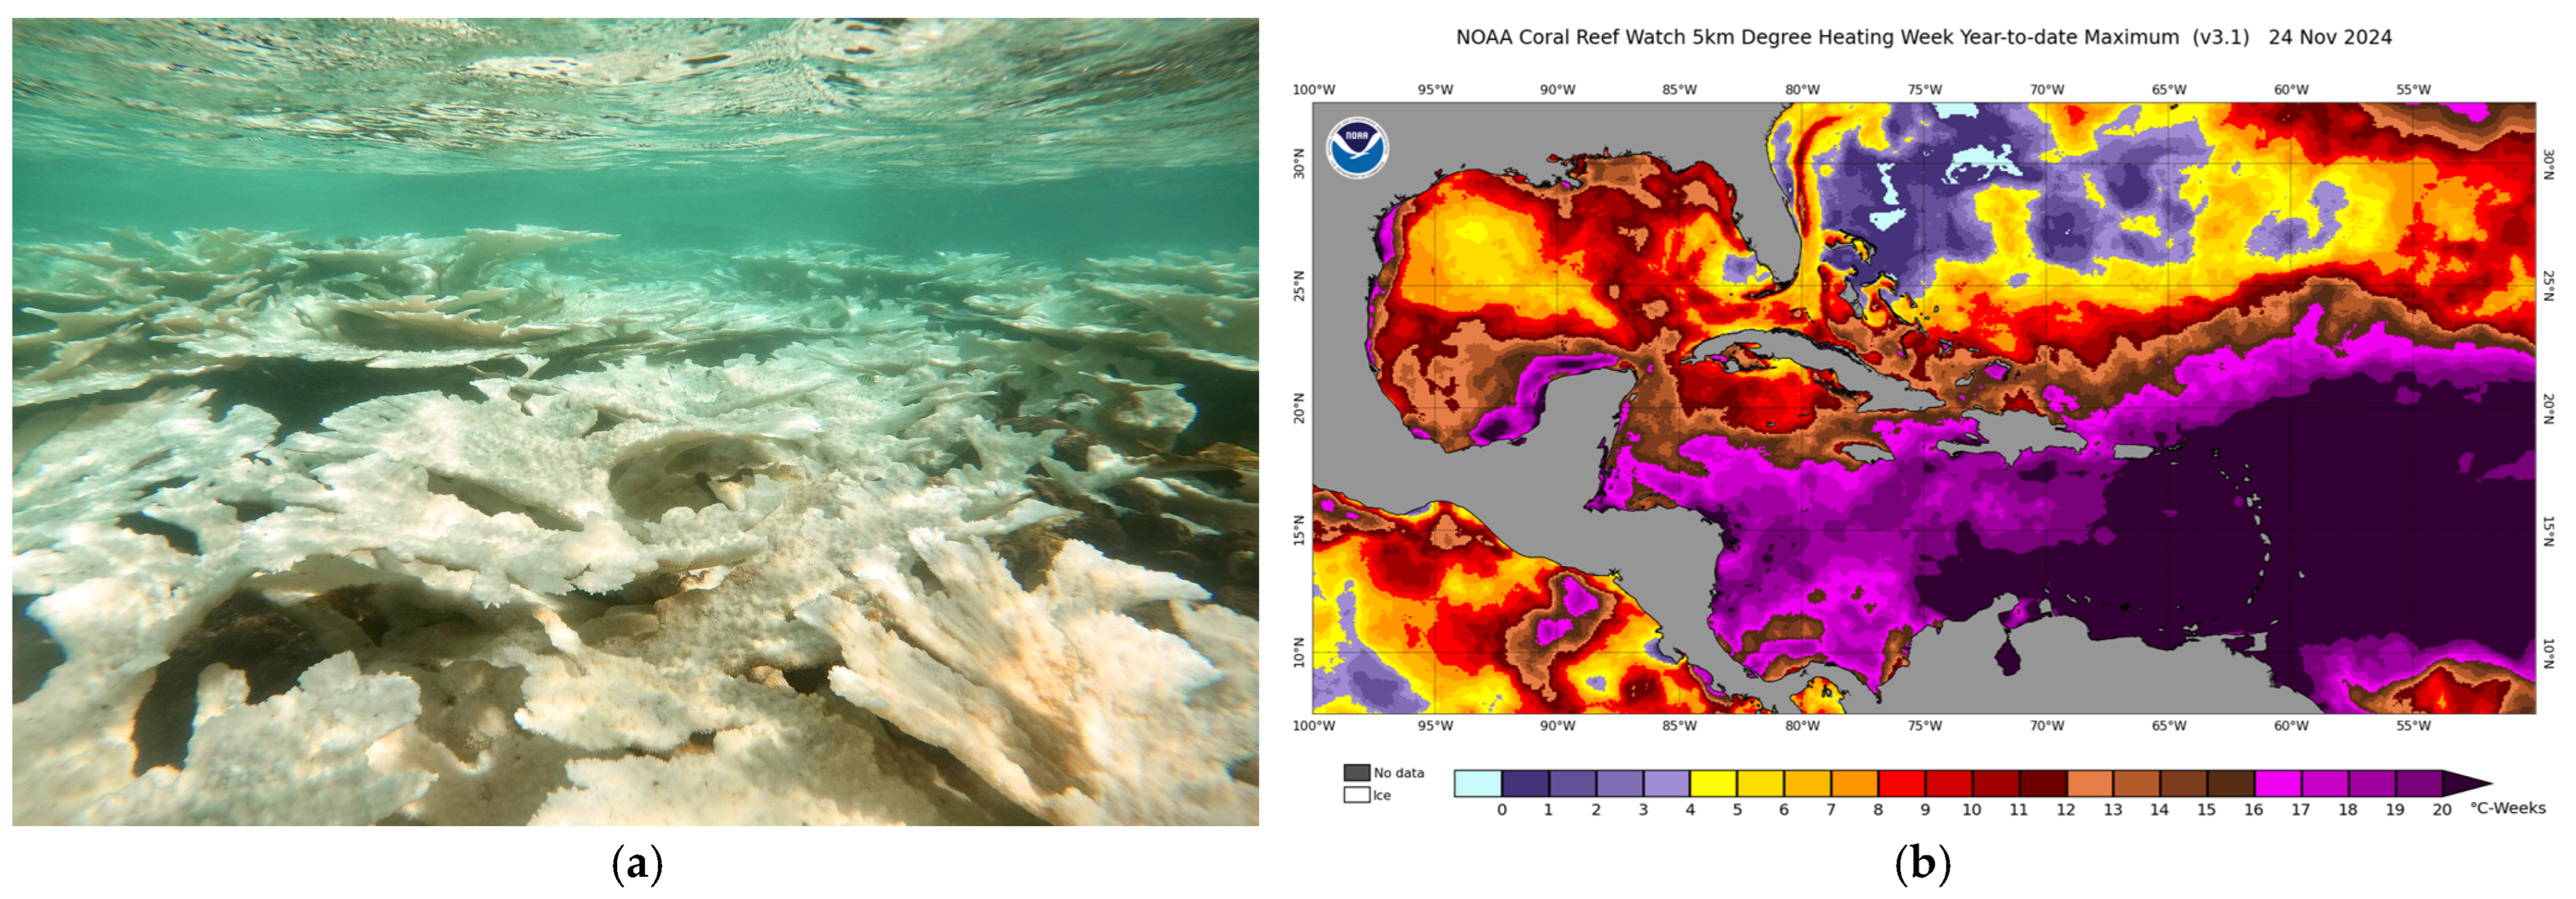
Figure 1. (a) Example of severe bleaching and recent mass mortality on a remnant patch of endangered Elkhorn coral (Acropora palmata) in Puerto Rico, 2024; (b) NOAA Coral Reef Watch 5 km degree heating week (DHW) year-to-date maximum (as of 24 November 2024), showing an unprecedented accumulation of over 20 DHWs across the eastern Caribbean and the spatial extent of the 2024 marine heatwave.
Atmosphere 16 00575 g001
Figure 2. Spatial distribution of studied subregions: 1. Western Caribbean (WCa); 2. Southwestern Caribbean (SWC); 3. Southern Caribbean (SCa); 4. Eastern Caribbean (ECa); 5. Northern Caribbean (NCa); 6. Northwestern Caribbean (NWC); 7. Northeastern Tropical Pacific (NETP); 8. Southeastern Tropical Pacific (SETP). Image source: Google Earth.
Atmosphere 16 00575 g002
Figure 3. Spatio-temporal variation in decadal JASO regional mean surface (2 m) temperature anomaly across the wider Caribbean (Caribb), northeastern and southeastern Pacific regions (NE, SE Trop Pac) between 1940 and 2023.
Atmosphere 16 00575 g003
Figure 4. Spatio-temporal variation in decadal JASO regional mean sea surface temperature anomaly (SST-a) across the wider Caribbean (Caribb), northeastern and southeastern Pacific regions (NE, SE Trop Pac) between 1940 and 2023.
Atmosphere 16 00575 g004
Figure 5. Spatio-temporal variation in country-level decadal means of JASO surface (2 m) temperature anomalies: (a) western Caribbean; (b) southwestern Caribbean; (c) southern Caribbean; (d) eastern Caribbean; (e) northern Caribbean; (f) northwestern Caribbean; (g) northeastern tropical Pacific; (h) southeastern tropical Pacific. Country acronyms described in Table S1.
Atmosphere 16 00575 g005aAtmosphere 16 00575 g005b
Figure 6. Spatio-temporal variation in country-level decadal means of JASO sea surface temperature anomalies: (a) western Caribbean; (b) southwestern Caribbean; (c) southern Caribbean; (d) eastern Caribbean; (e) northern Caribbean; (f) northwestern Caribbean; (g) northeastern tropical Pacific; (h) southeastern tropical Pacific. Country acronyms described in Table S1.
Atmosphere 16 00575 g006
Figure 7. Projected spatio-temporal variation in decadal JASO regional mean 2 m temperature anomaly across the wider Caribbean (Caribb), northeastern and southeastern Pacific regions (NE, SE Trop Pac) between 1851 and 2100 based on Scenario 4.5.
Atmosphere 16 00575 g007
Figure 8. Principal component analysis (PCA) of the projected mean decadal variation in JASO 2 m temperature anomaly across the wider Caribbean (Caribb), northeastern and southeastern Pacific regions (NE, SE Trop Pac) between 1851 and 2100 based on Scenario 4.5. This solution explains 99.9% of the observed decadal variation.
Atmosphere 16 00575 g008
Figure 9. Projected spatio-temporal variation in decadal JASO regional mean sea surface temperature anomaly across the wider Caribbean (Caribb), northeastern and southeastern Pacific regions (NE, SE Trop Pac) between 1851 and 2100 based on Scenario 4.5.
Atmosphere 16 00575 g009
Figure 10. Principal component analysis (PCA) of the projected mean decadal variation in JASO sea surface temperature anomaly across the wider Caribbean (Caribb), northeastern and southeastern Pacific regions (NE, SE Trop Pac) between 1851 and 2100 based on Scenario 4.5. This solution explains 99.9% of the observed variation.
Atmosphere 16 00575 g010
Figure 11. Projected spatio-temporal variation in decadal JASO regional mean 2 m temperature anomaly across the wider Caribbean (Caribb), northeastern and southeastern Pacific regions (NE, SE Trop Pac) between 1851 and 2100 based on Scenario 8.5.
Atmosphere 16 00575 g011
Figure 12. Principal component analysis (PCA) of the projected mean decadal variation in JASO 2 m temperature anomaly across the wider Caribbean (Caribb), northeastern and southeastern Pacific regions (NE, SE Trop Pac) between 1851 and 2100 based on Scenario 8.5. This solution explains 100% of the observed variation.
Atmosphere 16 00575 g012
Figure 13. Projected spatio-temporal variation in decadal JASO regional mean sea surface temperature anomaly across the wider Caribbean (Caribb), northeastern and southeastern Pacific regions (NE, SE Trop Pac) between 1851 and 2100 based on Scenario 8.5.
Atmosphere 16 00575 g013
Figure 14. Principal component analysis (PCA) of the projected mean decadal variation in JASO sea surface temperature anomaly across the wider Caribbean (Caribb), northeastern and southeastern Pacific regions (NE, SE Trop Pac) between 1851 and 2100 based on Scenario 8.5. This solution explains 100% of the observed variation.
Atmosphere 16 00575 g014
Table 1. Summary of a one-way PERMANOVA test of the spatio-temporal variation in JASO regional normalized surface (2 m) temperature anomaly.
Source 1dfSSMSPseudo-Fp
Region8452.356.520.03<0.0001
Residual75211.72.8
Pairwise groupstp
1940 vs. 19501.440.1507
1940 vs. 19603.430.0003
1940 vs. 19701.770.0586
1940 vs. 19802.820.0045
1940 vs. 19904.84<0.0001
1940 vs. 20008.14<0.0001
1940 vs. 201010.58<0.0001
1940 vs. 20207.360.0012
1 Based on 9999 permutations; df = degrees of freedom; SS = sum of squares; MS = mean squares; data = pseudo-F statistic, p value.
Table 2. Summary of a one-way PERMANOVA test of the spatio-temporal variation in JASO regional normalized sea surface temperature anomaly.
Source 1dfSSMSPseudo-Fp
Region8324.640.68.97<0.0001
Residual75339.44.5
Pairwise groupstp
1940 vs. 19500.730.5969
1940 vs. 19601.010.3599
1940 vs. 19702.580.0018
1940 vs. 19801.190.2391
1940 vs. 19900.860.4941
1940 vs. 20003.720.0002
1940 vs. 20104.230.0002
1940 vs. 20204.590.0011
1 Based on 9999 permutations; df = degrees of freedom; SS = sum of squares; MS = mean squares; data = pseudo-F statistic, p value.
Table 3. Summary of a one-way PERMANOVA test of the spatio-temporal variation in JASO country-level normalized surface (2 m) temperature anomaly.
Country 1Pseudo-FpCountryPseudo-FpCountryPseudo-Fp
México25.15<0.0001Leeward Is.18.24<0.0001Bahamas15.97<0.0001
Belize/Guatemala40.68<0.0001Windward Is.16.28<0.0001Florida14.78<0.0001
Honduras32.07<0.0001US/British Vis15.67<0.0001N. Méx. Pacific10.61<0.0001
Nicaragua20.41<0.0001Puerto Rico18.82<0.0001S. Méx. Pacific26.59<0.0001
Costa Rica18.85<0.0001Dom. Rep.19.51<0.0001Guatemala Pacific45.28<0.0001
Panamá17.70<0.0001Haiti19.54<0.0001El Salv./Hond. Pac17.21<0.0001
San Andrés16.40<0.0001Jamaica20.01<0.0001Nicaragua Pacific5.60<0.0001
Colombia19.06<0.0001Gr. Cayman19.96<0.0001Costa Rica Pacific10.05<0.0001
Venezuela25.40<0.0001Cuba19.61<0.0001Panamá Pacific12.64<0.0001
ABC Islands17.60<0.0001Turks–Caicos13.81<0.0001Colombia Pacific19.18<0.0001
1 Based on 9999 permutations; data = pseudo-F statistic, p value; d.f. = 8, 75.
Table 4. Summary of a one-way PERMANOVA test of the spatio-temporal variation in JASO country-level normalized sea surface temperature anomaly.
Country 1Pseudo-FpCountryPseudo-FpCountryPseudo-Fp
México14.85<0.0001Leeward Is.11.71<0.0001Bahamas8.39<0.0001
Belize/Guatemala6.39<0.0001Windward Is.12.09<0.0001Florida12.64<0.0001
Honduras9.94<0.0001US/British Vis11.58<0.0001N. Méx. Pacific4.030.0005
Nicaragua10.31<0.0001Puerto Rico11.43<0.0001S. Méx. Pacific9.22<0.0001
Costa Rica11.51<0.0001Dom. Rep.8.84<0.0001Guatemala Pacific9.55<0.0001
Panamá11.80<0.0001Haiti8.33<0.0001El Salv./Hond. Pac6.12<0.0001
San Andrés8.88<0.0001Jamaica10.26<0.0001Nicaragua Pacific3.460.0017
Colombia6.86<0.0001Gr. Cayman11.29<0.0001Costa Rica Pacific2.720.0123
Venezuela9.07<0.0001Cuba10.07<0.0001Panamá Pacific3.460.0021
ABC Islands7.36<0.0001Turks–Caicos5.640.0002Colombia Pacific4.210.0003
1 Based on 9999 permutations; data = pseudo-F statistic, p value; d.f. = 8, 75.
Table 5. Summary of a one-way PERMANOVA test of the spatio-temporal variation in modeled JASO normalized surface (2 m) temperature and sea surface temperature anomalies 1851–2100 under scenario 4.5, and the projected onsetting of +1.5 °C beyond pre-industrial JASO 2 m temperature anomalies and of +1.0 °C beyond maximum JASO SST anomalies.
Region 1Pseudo-FpPseudo-Fp2 m Temp
≥1.5 °C
SST
≥1.0 °C
2 m temp SST
W Caribbean152.9<0.0001158.5s<0.000120802060
SW Caribbean110.5<0.0001109.8<0.000120602050
S Caribbean145.0<0.0001138.5<0.000120602060
E Caribbean106.2<0.0001106.2<0.000120302020
N Caribbean148.4<0.0001147.2<0.000120502040
NW Caribbean210.5<0.0001209.6<0.000120402030
NE Tropical Pacific74.4<0.000180.2<0.000120402040
SE Tropical Pacific60.6<0.000161.2<0.000120602050
1 Based on 9999 permutations; data = pseudo-F statistic, p value; d.f. = 8, 75.
Table 6. Summary of observed and modeled decadal changes in JASO surface (2 m) temperature anomaly under scenario 4.5. Units: °C/decade.
Region1850–20202020–21002000–20202020–20502050–2100
W Caribbean0.11700.16510.27040.20640.1342
SW Caribbean0.11710.14180.30380.17840.1144
S Caribbean0.12170.16860.23090.23370.1198
E Caribbean0.12080.13890.30330.18170.1069
N Caribbean0.12040.15350.28320.20180.1172
NW Caribbean0.11970.16540.27080.21960.1248
NE Tropical Pacific0.12450.20140.14470.29380.1322
SE Tropical Pacific0.11580.15770.19600.22460.1076
Regional average0.11960.16160.25040.21750.1196
Table 7. Summary of observed and modeled decadal changes in JASO sea surface temperature anomaly under scenario 4.5. Units: °C/decade.
Region1850–20202020–21002000–20202020–20502050–2100
W Caribbean0.06610.09150.15500.11490.0740
SW Caribbean0.07780.09430.20390.11830.0764
S Caribbean0.06650.08960.13780.12660.0619
E Caribbean0.11780.13560.29580.17740.1042
N Caribbean0.11550.11550.21420.15170.0883
NW Caribbean0.09900.13640.22560.18050.1034
NE Tropical Pacific0.07540.12370.09250.18130.0806
SE Tropical Pacific0.07410.10070.12590.14270.0692
Regional average0.08650.11090.18130.14920.0823
Table 8. Summary of a one-way PERMANOVA test of the spatio-temporal variation in modeled JASO normalized surface (2 m) temperature and sea surface temperature anomalies 1851–2100 under scenario 8.5, and projected onsetting of +1.5 °C beyond pre-industrial JASO 2 m temperature anomalies and of +1.0 °C beyond maximum JASO SST anomalies.
Region 1Pseudo-FpPseudo-Fp2 m Temp
≥1.5 °C
SST
≥1.0 °C
2 m temp SST
W Caribbean350.0<0.0001356.9<0.000120302040
SW Caribbean231.6<0.0001227.7<0.000120302040
S Caribbean299.0<0.0001263.6<0.000120302040
E Caribbean208.5<0.0001208.6<0.000120302020
N Caribbean302.9<0.0001300.3<0.000120302030
NW Caribbean385.0<0.0001385.8<0.000120302030
NE Tropical Pacific161.5<0.0001171.6<0.000120202030
SE Tropical Pacific129.7<0.0001131.5<0.000120302040
1 Based on 9999 permutations; data = pseudo-F statistic, p value; d.f. = 8, 75.
Table 9. Summary of observed and modeled decadal changes in JASO surface (2 m) temperature anomaly under scenario 8.5. Units: °C/decade.
Region1850–20202020–21002000–20202020–20502050–2100
W Caribbean0.12120.42290.27480.35210.4756
SW Caribbean0.11190.37500.27240.32250.4144
S Caribbean0.12420.43530.24550.35130.4983
E Caribbean0.11640.35630.27700.31480.3874
N Caribbean0.12190.38250.29250.33870.4154
NW Caribbean0.12000.41780.27260.35750.4645
NE Tropical Pacific0.13590.53040.21340.38330.6406
SE Tropical Pacific0.12130.44190.22930.33180.5245
Regional average0.12160.42030.25970.34400.4776
Table 10. Summary of observed and modeled decadal changes in JASO sea surface temperature anomaly under scenario 8.5. Units: °C/decade.
Region1850–20202020–21002000–20202020–20502050–2100
W Caribbean0.06770.23590.16430.19790.2645
SW Caribbean0.07420.24810.18230.21390.2737
S Caribbean0.06580.23270.13350.19020.2647
E Caribbean0.11360.34770.27010.29820.3781
N Caribbean0.09190.28790.22090.25490.3127
NW Caribbean0.09920.34590.22670.29470.3843
NE Tropical Pacific0.08210.32330.13250.23660.3884
SE Tropical Pacific0.07790.28430.14870.21050.3396
Regional average0.08410.30210.18490.23710.3258
Table 11. Summary of a one-way ANOSIM test of the observed vs. modeled regional variation in JASO normalized surface (2 m) temperature and sea surface temperature anomalies in 2015–2024 under scenarios 4.5 and 8.5.
Region 1Global RpObs vs. 4.5 RpObs vs. 8.5 Rp4.5 vs. 8.5 Rp
Surface (2 m) temperature0.1280.00150.2740.00500.0760.10500.0240.2710
Sea surface temperature0.1520.00300.2920.00100.1190.02600.0210.2930
1 Based on 9999 permutations; data = R statistic, p value.
Table 12. Summary of a one-way ANOSIM test of the observed vs. modeled subregional variation in JASO normalized surface (2 m) temperature anomaly 2015–2024 under scenarios 4.5 and 8.5.
Region 1Global RpObs vs. 4.5 RpObs vs. 8.5 Rp4.5 vs. 8.5 Rp
W Caribbean0.0830.04800.1980.00300.0550.1660−0.0070.4480
SW Caribbean0.0640.09600.1820.0190−0.0100.46300.0190.2940
S Caribbean−0.0080.51500.0230.2830−0.0380.7010−0.0110.4690
E Caribbean0.1790.00800.3240.00500.0720.00110.1070.0890
N Caribbean0.0830.05900.1980.01500.0320.2450−0.0050.4150
NW Caribbean0.0760.07000.1980.02600.0500.1790−0.0240.5760
NE Tropical Pacific0.0980.03400.1670.02100.1850.0150−0.0600.8930
SE Tropical Pacific0.0100.33300.0320.24400.0310.2430−0.0230.5170
1 Based on 9999 permutations; data = R statistic, p value.
Table 13. Summary of a one-way ANOSIM test of the observed vs. modeled subregional variation in JASO normalized sea surface temperature anomaly 2015–2024 under scenarios 4.5 and 8.5.
Region 1Global RpObs vs. 4.5 RpObs vs. 8.5 Rp4.5 vs. 8.5 Rp
W Caribbean0.1300.00500.2540.00100.1310.02100.0150.4900
SW Caribbean0.0990.02900.1930.00800.0630.14200.0220.2840
S Caribbean0.0270.23900.0760.06700.0110.3710−0.0180.5290
E Caribbean0.1990.00200.3310.00500.1320.03100.1080.0700
N Caribbean0.1340.00800.2390.00900.1280.0470−0.0020.3880
NW Caribbean0.0850.04700.2110.01500.0660.1260−0.0210.5600
NE Tropical Pacific0.0580.09100.1150.05200.1060.0730−0.0620.9100
SE Tropical Pacific−0.0150.53500.0320.2170−0.0400.7390−0.0280.5320
1 Based on 9999 permutations; Data= R statistic, p value.
Disclaimer/Publisher’s Note: The statements, opinions and data contained in all publications are solely those of the individual author(s) and contributor(s) and not of MDPI and/or the editor(s). MDPI and/or the editor(s) disclaim responsibility for any injury to people or property resulting from any ideas, methods, instructions or products referred to in the content.