Article

Indoor Air Quality Assessment Through IoT Sensor Technology: A Montreal–Qatar Case Study

1
Department of Building, Civil, and Environmental Engineering, Concordia University, Montreal, QC H3G 1M8, Canada
2
Environmental Science Centre, Qatar University, Doha P.O. Box 2713, Qatar
3
Department of Engineering, University of New Brunswick, Saint John, NB E2K 5E2, Canada
*
Authors to whom correspondence should be addressed.
Atmosphere 2025, 16(5), 574; https://doi.org/10.3390/atmos16050574
Submission received: 26 March 2025 / Revised: 5 May 2025 / Accepted: 7 May 2025 / Published: 11 May 2025

Abstract

This study addresses the need for effective, real-time monitoring of indoor air quality, a critical factor for health and environmental well-being. The aim is to develop an affordable, Arduino-based IoT sensor system capable of continuous measurement of key air pollutants, including CO2, PM2.5, NO2, and VOCs. The system integrates multiple sensors and transmits data to an online server, where it is stored in a MySQL database for analysis and visualization. Validation studies conducted at Concordia University and Qatar University confirm the system’s accuracy and reliability, with discrepancies reduced to under 15% through calibration and adjustment techniques. Comparative analysis with commercial monitoring instruments reveals strong correlations and negligible deviations, supporting the system’s validity for real-time air quality monitoring. The system also includes a user-friendly interface that displays real-time data through intuitive charts and tables, along with an indoor air quality index to help users assess and address air pollution levels. The system demonstrates a 90% cost reduction versus commercial tools while maintaining a mean deviation of <15% across climatic extremes. Its combination of comprehensive sensors, data visualization tools, and an air quality index makes it an effective tool for environmental monitoring and decision-making.

1. Introduction

The quality of indoor air in various environments, including working spaces and living spaces, plays a crucial role in public health. Pollutants such as particulate matter (PM), volatile organic compounds (VOCs), and nitrogen dioxide (NO2), which can originate from sources like inadequate ventilation, building materials, cleaning agents, and combustion processes, can significantly impact the well-being of individuals in these environments. Therefore, monitoring and maintaining optimal indoor air quality is vital for ensuring a healthy and safe environment for both work and living spaces [1]. To carry out the monitoring and measurement, different techniques like passively collecting samples to be analyzed in a laboratory, sophisticated devices and professional instruments for daily measuring, or large and expensive monitoring stations that constantly sample the pollutants in fixed locations are the strategies being used frequently. According to Kumar et al. (2019) [2], the Internet of Things (IoT)-based systems have emerged as a cost-effective and scalable solution for real-time environmental monitoring, offering benefits such as remote sensing, data transmission, and analysis capabilities.
Recent evaluations of low-cost monitoring systems reveal three persistent challenges: (1) only 18% of studies validate sensors across multiple environments [3,4,5], (2) 78% of Arduino-based solutions monitor ≤2 pollutants, and (3) typical data latency exceeds 15 min [4,6,7]. These limitations motivate our integrated approach.
Rapid desertification, along with rapid urbanization and industrialization in the Middle East (ME), demands a lookout for maintaining air quality standards [3]. Covering a larger area to monitor fine particulate matter (PM2.5) and pollutants such as nitrogen dioxide (NO2) and sulfur dioxide (SO2) poses demands for a reliable IoT sensor network in the region [4]. It is interesting to note that the ME region has been monitoring air quality since the early 1990s, such as sensor networks established by Bahrain in 1993 and Egypt in 1998 at the city scale [5]. Similarly, Israel, Jordan, Morocco, Qatar, Saudi Arabia, and UAE have also initiated working at a larger scale to monitor regional air quality [6,7,8,9]. Qatar is expanding its network for air quality monitoring under the mandate of the Qatar Ministry of Municipality and Environment.
Kalia and Ansari (2020) [10] presented an IoT-based PM monitoring system utilizing the PMS5003 sensor (Manufacturer: Plantower; Beijing, China), NodeMCU ESP8266 12E Board (Manufacturer: AI-Thinker, Shenzhen, China) as the microcontroller, and the ThingSpeak website as an open-source IoT platform for data recording and visualization. The result shows that the city’s air quality index (AQI) falls within the range of 33.56–51.88 ppm (parts per million), indicating good to satisfactory air quality with minimal impact. Additionally, the observed values obtained from the literature data for PM2.5 (35–80 µg/m3) and PM10 (62–196 µg/m3) categorize the city as satisfactory to moderately polluted in terms of particulate matter pollution [10,11,12]. Yang et al. (2019) [13] designed a low-cost, portable device for measuring methane composition in biogas. The device utilized an MQ-4 methane sensor (sourced from Hanwei Electronics Co., Ltd., Zhengzhou, China) and other sensors to accurately measure methane content. The results showed good accordance with the reference, and the device provided reliable and cost-effective measurements of methane content in biogas samples. Recent mobile monitoring paradigms like vehicle sensor networks [14] demonstrate how IoT devices can complement regulatory stations through real-time spatial mapping, particularly when integrated with official reference data as implemented in our cross-border study.
Considering that individuals dedicate over 80% of their time indoors, including in residential structures, vehicles, public transportation, and public facilities, it becomes critically important to acknowledge and mitigate the impacts of indoor air quality (IAQ) on human health and overall wellness [15]. Pourkiaei and Romain (2023) [16] presented a scoping review of indoor air quality indices, aiming to characterize and explore their applications. The review covers various IAQ indices with different definitions and indicators used for different aims and applications. After investigating IAQ-related issues, the health effects, energy efficiency, and economic impacts were significantly explored. The review highlights the prevalence of objective approaches in IAQ index development and emphasizes the importance of mechanical and natural ventilation in IAQ studies. Saravanan and Kumar (2022) [17] presented an IoT-based hybrid model that integrates Factor Analysis (FA), Artificial Neural Networks (ANN), and Auto-Regressive Moving Average (ARMA) methods to predict the air quality index (AQI). The study focuses on extracting polluting components from air quality data using FA, regressing the projected rate with ANN, and employing ARMA for prediction. The proposed model demonstrates improved accuracy, highlighting its potential for estimating the proportion of polluting components in the air. Sun et al. (2022) [18] proposed a new model for evaluating indoor air quality based on childhood allergic and respiratory diseases. The model incorporates data collection from residential buildings in Shanghai and employs logistic regression analyses to determine health-related pollutant indicators. The method forecasts indoor air quality using a discrete-time Markov chain (DTMC) and an adaptive neuro-fuzzy inference system (ANFIS). The authors suggest including specific pollutants like di(2-ethylhexyl) phthalate (DEHP) in IAQ standards based on their observed associations with respiratory illnesses in children [18].
The implementation of IoT-based sensor monitoring systems for environmental management represents the future of air quality monitoring. These systems enable the efficient maintenance of fine air quality by monitoring and managing toxic gases such as formaldehyde, volatile organic compounds, and carbon monoxide. With real-time data and automated responses, these systems provide timely information to make quick decisions and ensure a safe and healthy environment for individuals. The integration of IoT technology in environmental management holds great potential for enhancing air quality and improving the overall quality of life.

2. Literature Review

2.1. System Architecture

A review of the recent literature highlights several critical gaps in the development and deployment of air quality monitoring systems. First, there is a notable lack of multi-environment validation, with only a small proportion of studies, approximately 23% conducting sensor evaluations across both indoor and outdoor settings [3]. Many existing studies, such as those by Kalia and Ansari (2020) [10] and Yang et al. (2019) [13], rely exclusively on laboratory conditions or single-site deployments. Recent findings by Demanega et al. [19] demonstrate that even consumer-grade multi-parameter monitors can exhibit substantial inaccuracies under variable thermodynamic conditions, with PM2.5 concentrations underestimated by up to 50% at 70% relative humidity. These limitations highlight the critical need for environmental sensing systems capable of delivering reliable performance across diverse climatic contexts. To address this challenge, the proposed system has been subjected to dual-climate validation, encompassing field deployments in both Montreal’s temperate environment and Doha’s arid climate.
Secondly, real-time performance limitations are prevalent in most current systems. Many sensor platforms depend on cloud infrastructure for data processing, resulting in latency exceeding 15 min [8,14,17]. Bluetooth-based communication strategies, as explored in [19], attempt to mitigate transmission delays but frequently fall short of enabling continuous real-time analysis. Montrucchio et al. [20] demonstrated the feasibility of achieving a 1 Hz sampling rate within densely deployed sensor networks; however, their approach was hindered by persistent bottlenecks associated with cloud-based processing. The present system addresses these limitations by leveraging edge computing architectures, thereby reducing end-to-end latency to under five seconds while preserving compatibility with high-frequency sampling requirements.
A persistent limitation of many low-cost air quality monitoring systems is their restricted scope of multi-pollutant detection. A substantial proportion, approximately 82% of Arduino-based implementations focus on only one or two pollutants, most commonly particulate matter (PM2.5) or methane [13,14,21]. While Wang et al. [22] demonstrated the potential of MQ-series gas sensors for indoor versus outdoor classification, their system did not support comprehensive, quantitative multi-pollutant analysis. To address this shortcoming, the current system in this research incorporates both SPEC electrochemical sensors (targeting NO2 and VOCs) and a laser-based PM2.5 module, enabling simultaneous monitoring of four distinct air quality parameters. Cross-sensitivity errors remain below 20%, representing a notable improvement in multi-pollutant sensing performance within cost-constrained hardware. This design choice responds directly to unresolved challenges identified in recent systematic reviews [23], which underscore the enduring trade-offs between affordability, accuracy, and maintenance in IoT-based environmental monitoring platforms.

2.2. Regional Implementation

Middle Eastern countries have made significant strides in air quality monitoring networks, though important limitations remain evident across the region. In Qatar, wireless sensor network deployments have successfully achieved approximately 85% coverage in urban areas, as demonstrated by Yaacoub et al. [7]. However, these systems primarily focus on outdoor monitoring scenarios, leaving indoor environments largely unaddressed. Meanwhile, Morocco’s coastal monitoring network in Agadir, documented by Chirmata et al. [6], has shown promising results with ±15% accuracy for PM2.5 measurements in high-humidity conditions. The Gulf Cooperation Council’s comprehensive air quality assessment by Omidvarborna et al. [9] further identified PM2.5 and volatile organic compounds as the most pressing pollutant challenges across the region, particularly in rapidly developing urban centers where indoor and outdoor air quality concerns intersect. Thus, in this research, dual-university deployment at Concordia and Qatar University explicitly targets these concerns, with indoor validations spanning classrooms, laboratories, and underground garages—environments neglected in prior regional studies [7,9].

2.3. Research Goal

This study aims to develop and validate a low-cost, IoT-based air quality monitoring system that addresses key limitations of conventional approaches, which typically rely on infrastructure-intensive, laboratory-grade instruments costing between USD 15,000 and USD 50,000 per unit [9,17]. The proposed system achieves comparable multi-pollutant sensing capabilities at a cost of less than USD 500 per node, making it suitable for scalable deployment in resource-constrained environments.
The system architecture aligns with Low-Power Wide-Area (LPWA) IoT frameworks [24], combining hybrid connectivity protocols to optimize energy efficiency without compromising data transmission reliability, even under extreme environmental conditions. In response to recent reviews, such as Liang et al. [23], which highlight the growing reliance on machine learning for sensor calibration but also the prohibitive computational demands associated with such methods, the present system adopts hardware-optimized linear regression. This enables accurate, real-time calibration with significantly reduced power and processing requirements. The system’s design focuses on three core objectives:
  • Cost-effective multi-pollutant sensing: Unlike single-parameter MQ-sensor systems [22], the proposed design quantifies four pollutants simultaneously, achieving <15% deviation from β-radiation standards.
  • Climate-resilient performance: Field validation was conducted in both Montreal’s temperate winter climate and Doha’s arid summer conditions, ensuring consistent accuracy across a wide range of thermodynamic environments. This dual-environment testing addresses humidity-related sensitivity issues reported in prior evaluations of low-cost sensors [19].
  • Real-time, energy-efficient edge processing: The system utilizes a hybrid architecture combining Arduino and Raspberry Pi platforms to support localized data analysis. Hardware-optimized linear regression is employed for sensor calibration, reducing computational overhead and power consumption by 40% relative to cloud-based machine-learning approaches. End-to-end data processing latency is reduced to under five seconds, a 70% improvement over comparable cloud-centric frameworks [20].
Through this integrated approach, the research contributes a scalable, energy-efficient, and economically viable solution for real-time air quality monitoring with practical applications in urban environments, public health surveillance, and extreme climate zones.

3. Materials and Methods

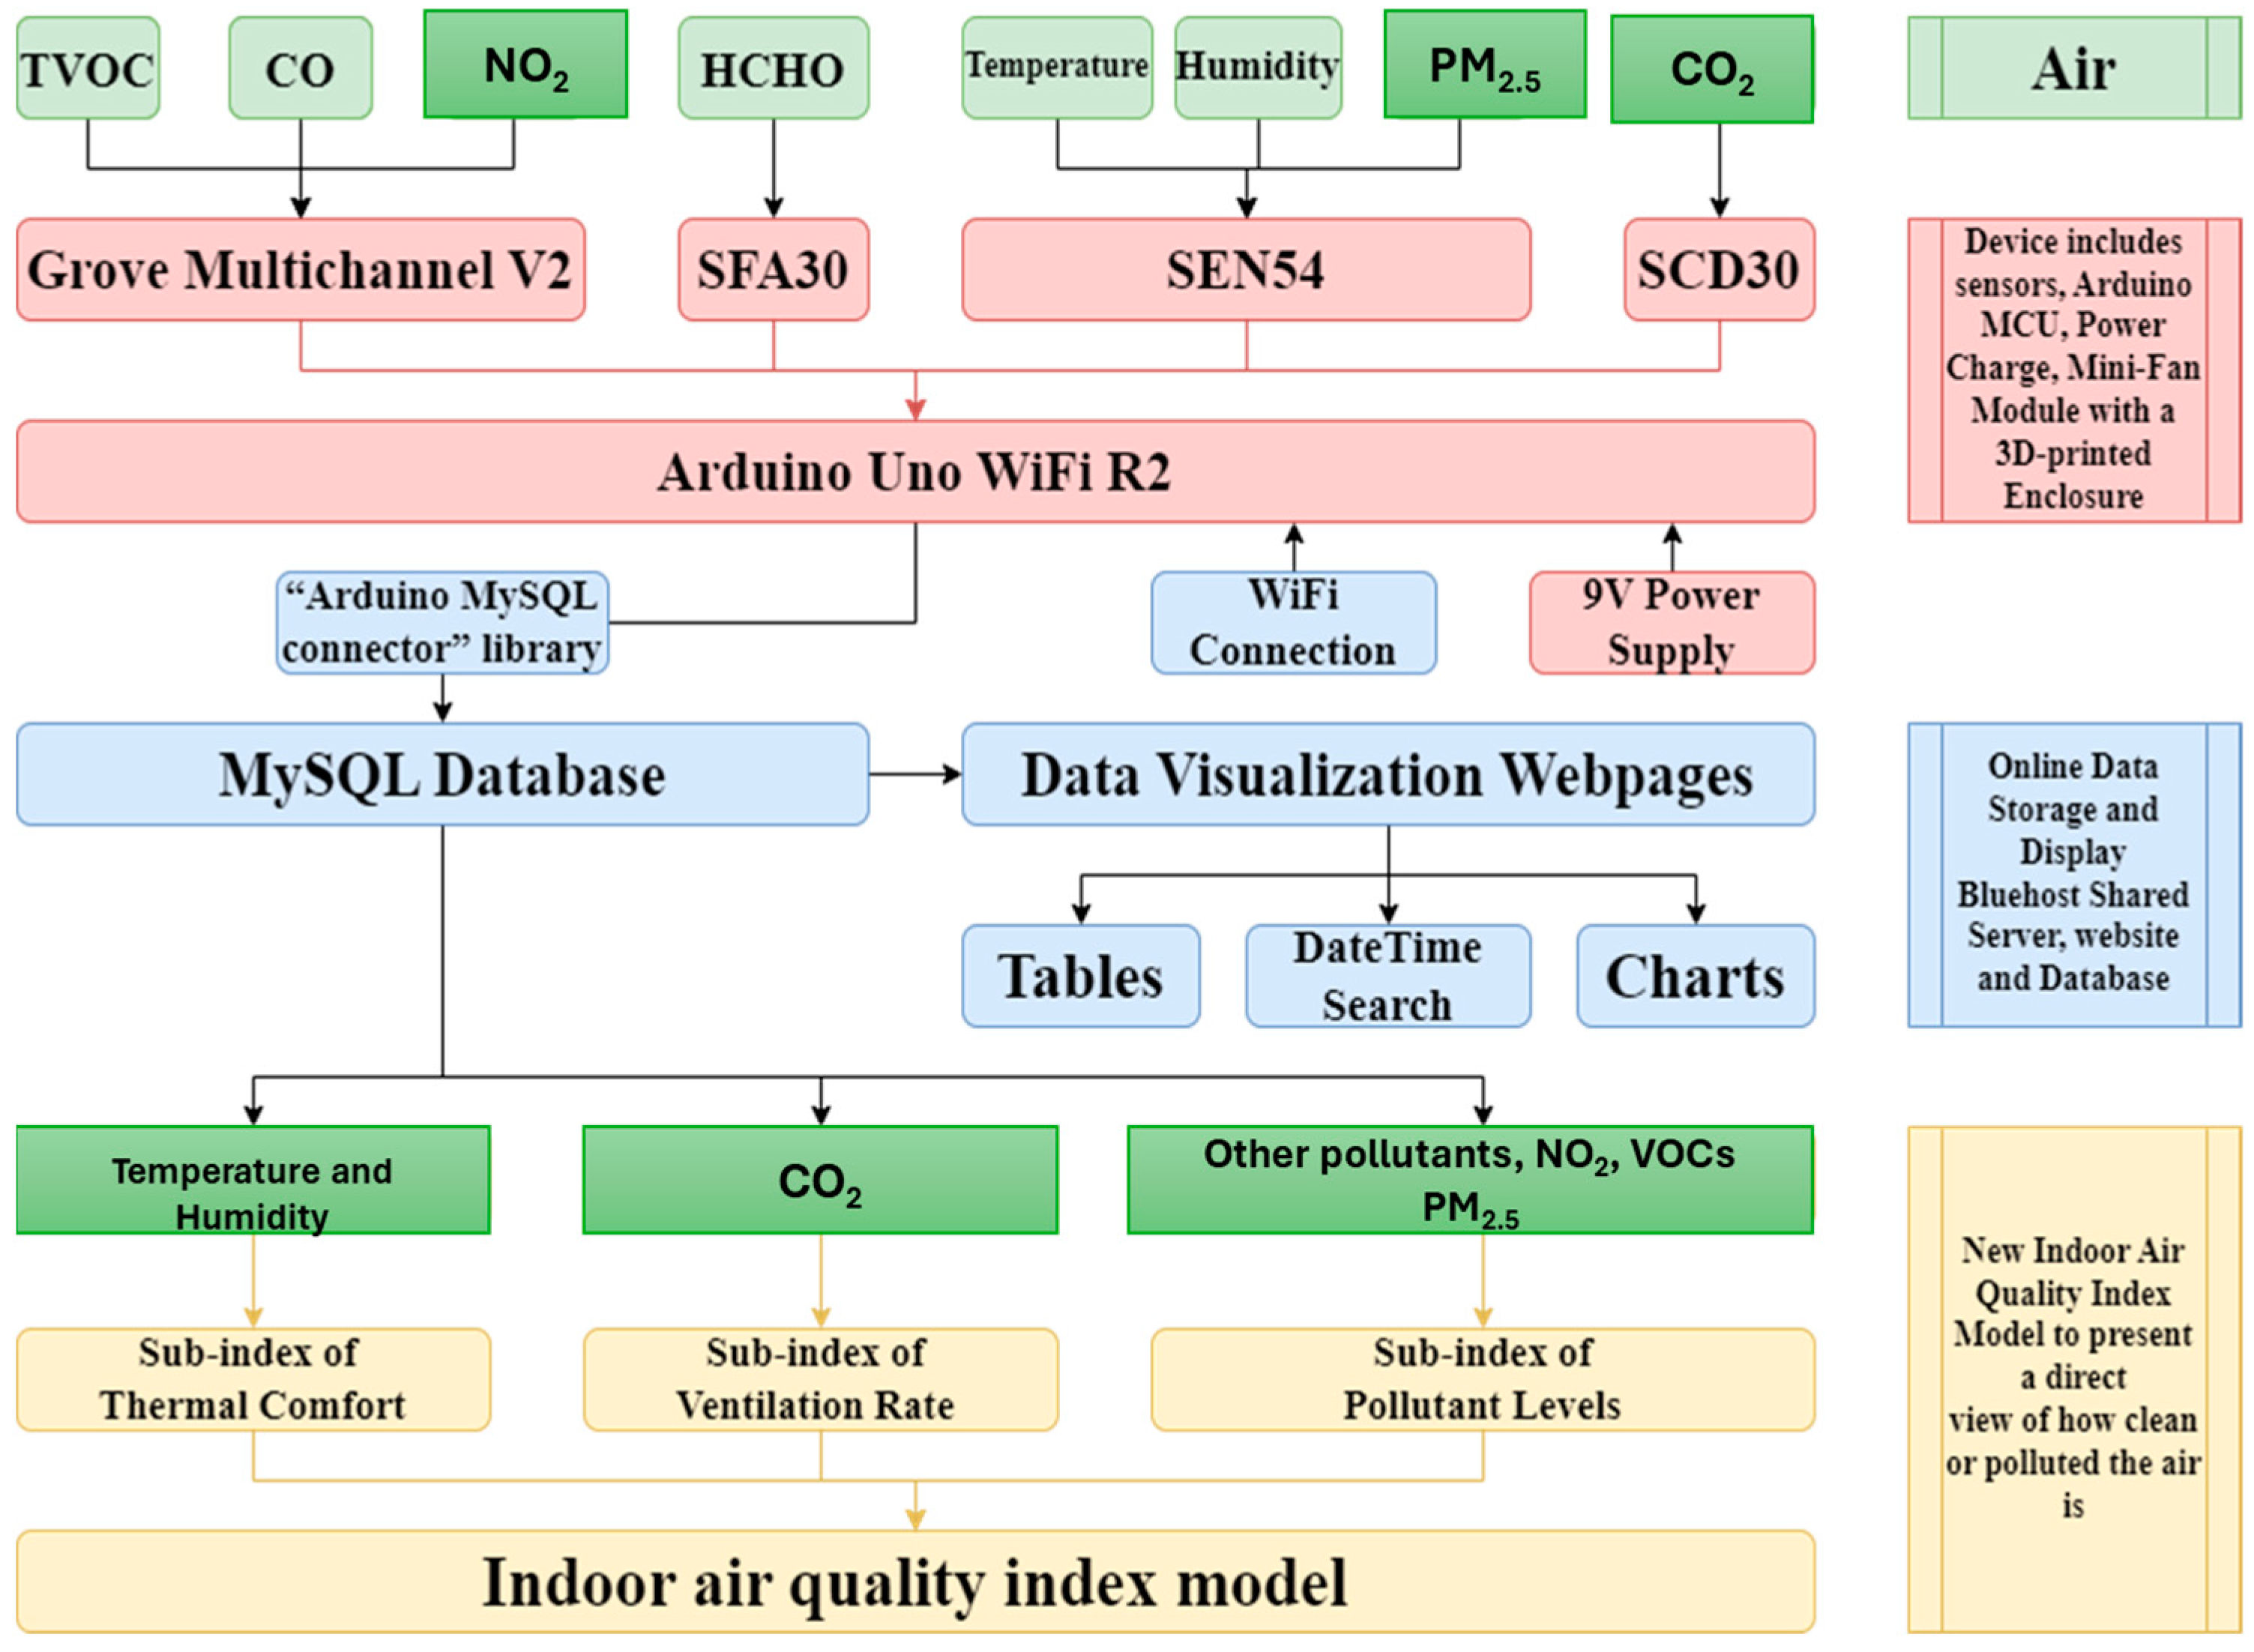
The system comprises compact, remotely managed sensor units suitable for both fixed and mobile deployments. These devices collect air quality data and transmit them wirelessly using either Arduino Wi-Fi for indoor scenarios [25] or Raspberry Pi 4 gateways [26] for outdoor environments to a MySQL database [27] hosted on a secure web server. Data are visualized in real-time through PHP-based dashboards, enabling users to interpret readings in table or chart form and compute an air quality index (AQI). At its core, the system employs Arduino microcontroller units (MCUs) for sensor data acquisition, local processing, and transmission, as shown in Figure 1. A modular sensor suite includes the SCD30 (CO2), SEN54 (PM2.5, temperature, humidity) (Manufacturer: Manufacturer: Sensirion AG; Stäfa, Switzerland) [28], and a multichannel gas module (NO2, VOCs) (Manufacturer: Hanwei Electronics Co., Ltd, Zhengzhou, China). Components are enclosed in custom 3D-printed housings with airflow-optimized designs (Supplementary Figure S1).
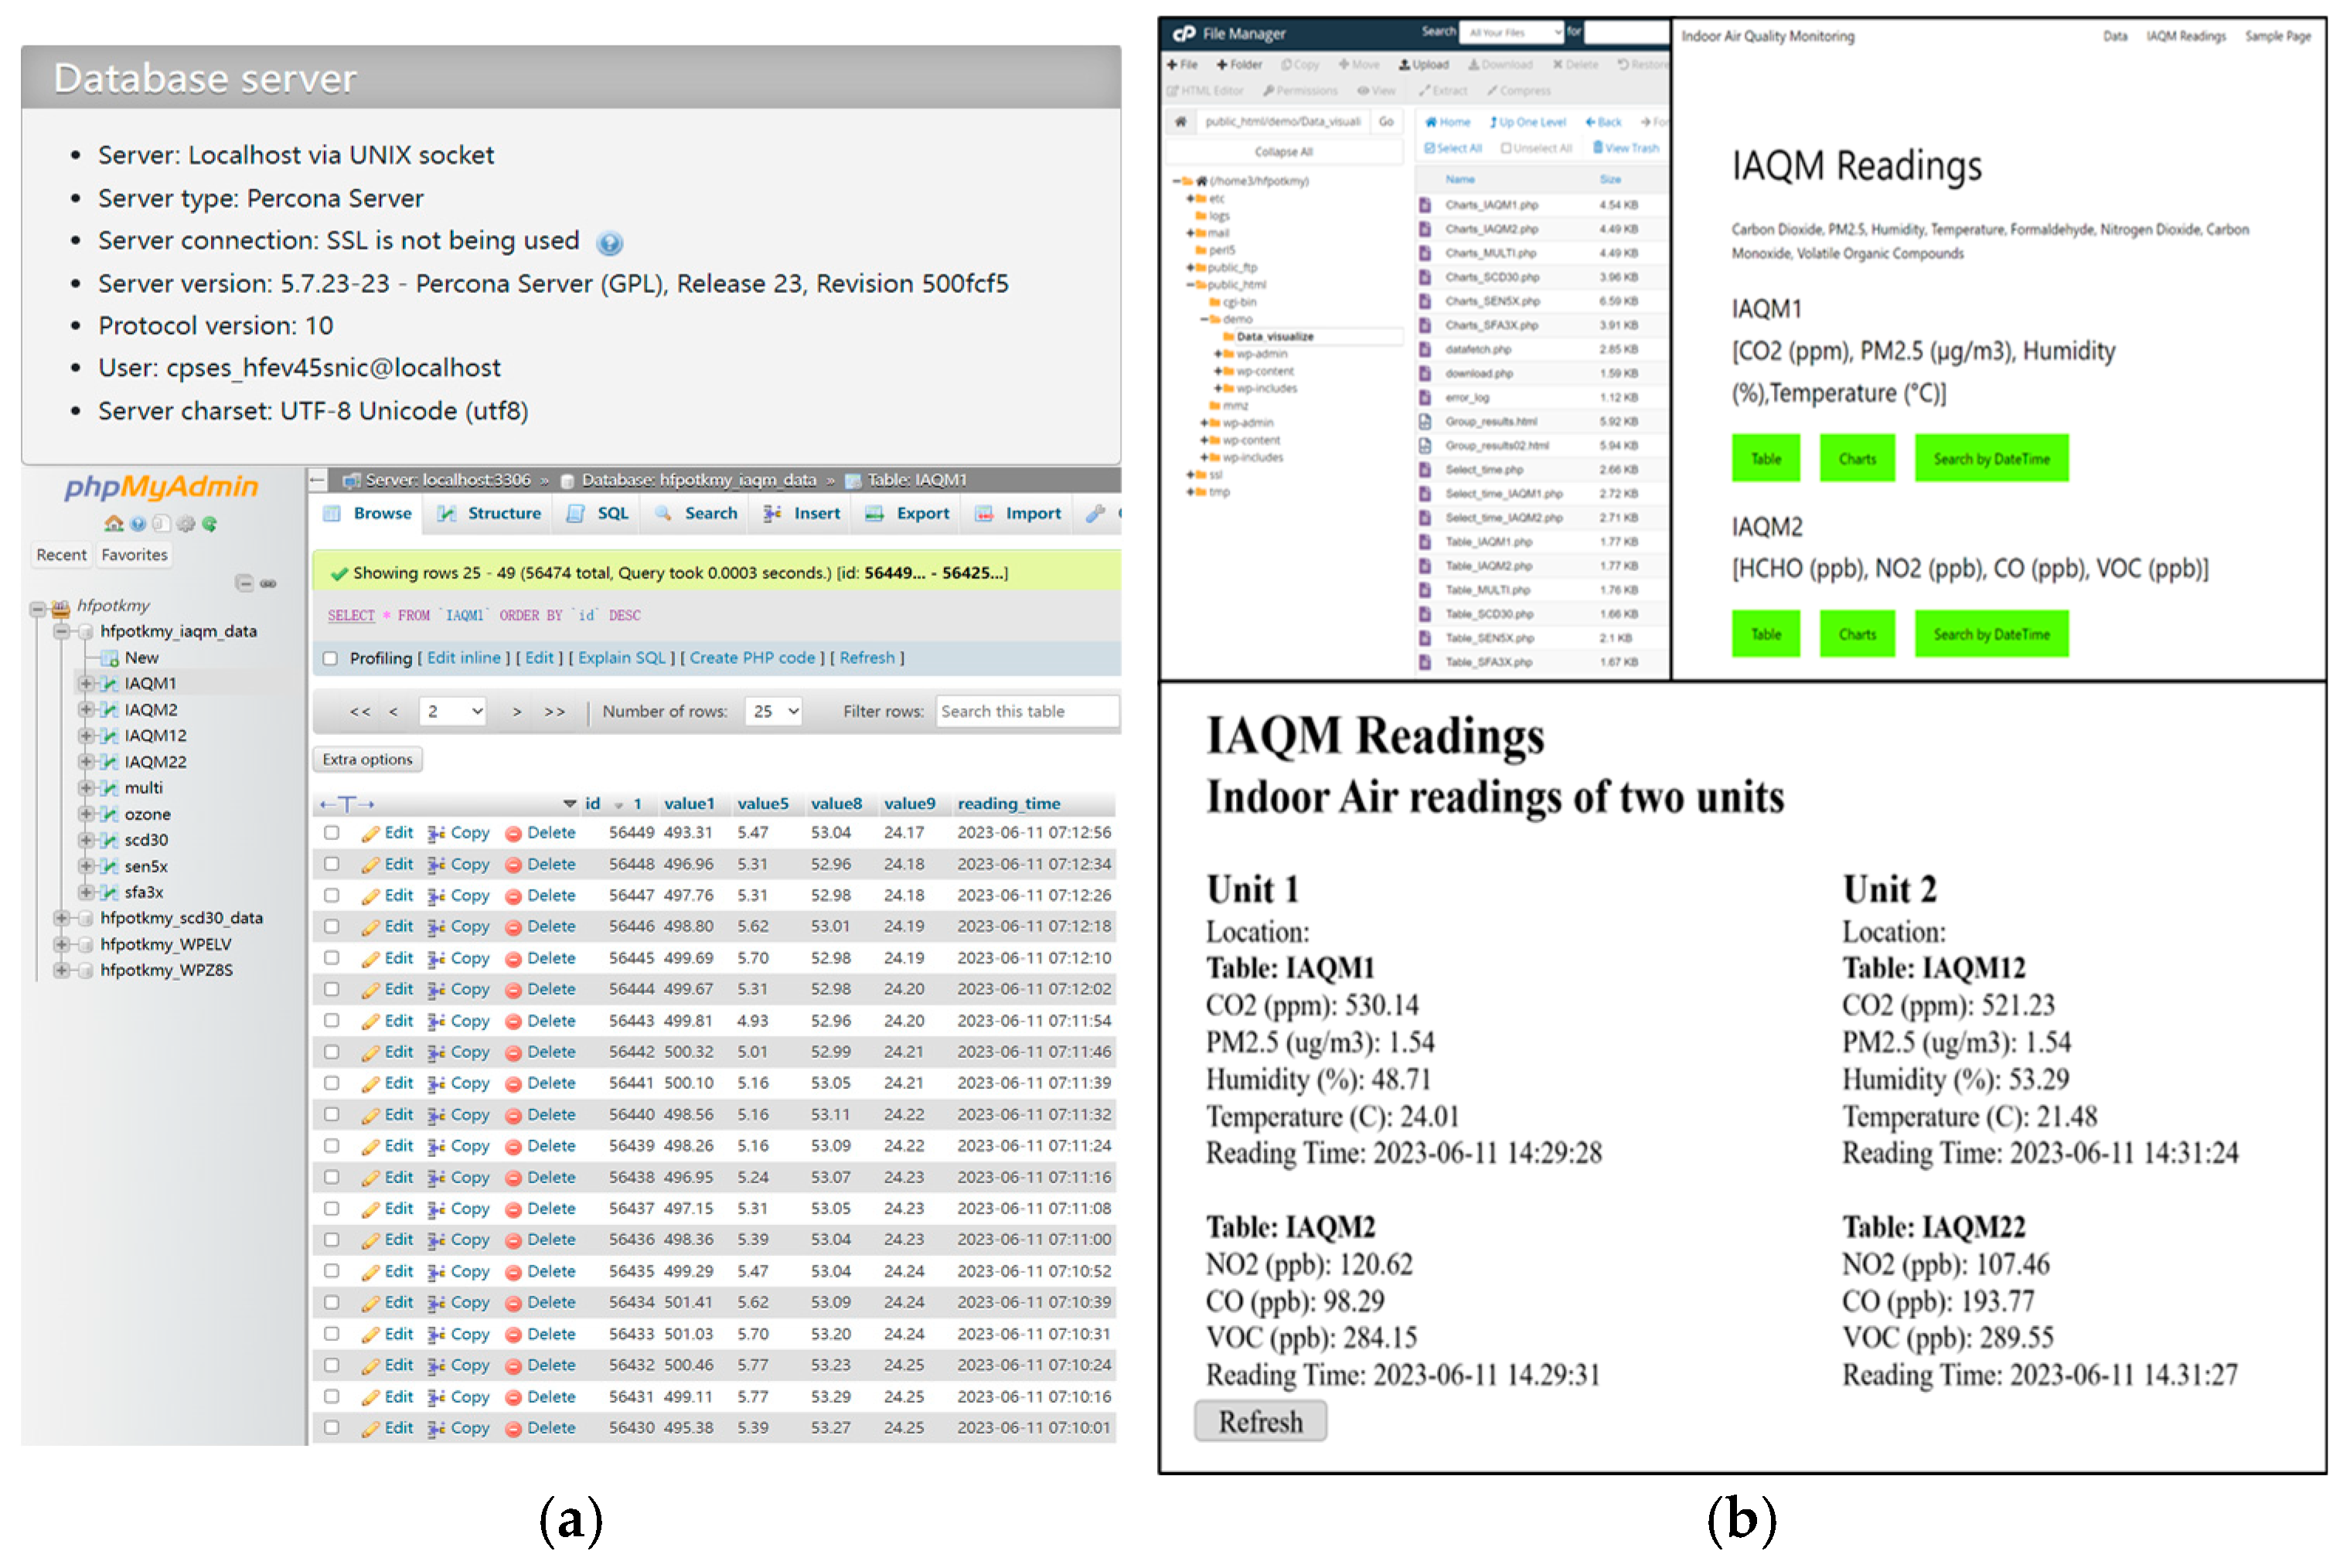
For outdoor deployments, the Raspberry Pi 4 serves as both a video processor and communication gateway, supporting adaptive transmission via Wi-Fi (802.11ac), Bluetooth, and USB-based cellular, offering significantly improved resilience during adverse conditions like sandstorms. Indoors, Arduino Uno Wi-Fi Rev2 is used as a standalone wireless microcontroller. All collected data are transmitted to a shared online MySQL server using the “Arduino MySQL Connector” library. The system architecture includes a secure database design with timestamped records and structured tables (e.g., IAQM1 and IAQM2). Timezone conversions are applied for end-user consistency (Figure 2). The platform ensures data integrity and security using multi-layered encryption: TLS 1.2+ for server-side communication, SSL certificate pinning for Arduino devices, and TLS 1.3 for Raspberry Pi clients, aligned with IoT best practices and validated through monthly security audits.

3.1. Device Features

Each unit is designed to be modular and customizable, allowing sensor and connectivity modules to be tailored to the deployment environment (e.g., office rooms, buses, metro systems). Raspberry Pi [26] units support full remote management via Python scripts [29] for calibration and diagnostics. Arduino-based units, while simpler, serve effectively as data transmitters. A central web server hosts real-time data dashboards, user interfaces, and backend PHP scripts for data visualization, filtering, and AQI computation. Users can explore live data, perform historical queries, and compare readings across multiple deployed devices. Visualization options include time-series charts, heat maps, and summary tables (Supplementary Figures S2–S4). Additional features, such as alert notifications and multi-device comparison views, are supported.

3.1.1. Sensors and MCUs

Sensors are fundamental components in Arduino-based IoT air quality monitoring systems. The SCD30 sensor is widely used for indoor CO2 monitoring due to its broad detection range and high accuracy. The SEN54 all-in-one sensor supports particulate matter (PM), temperature, and humidity measurements, making it suitable for indoor and outdoor air quality assessments. Future iterations could integrate power-optimized PM sensors [28,30] that reduce energy consumption by 94% while maintaining sub-1 μg/m3 RMSE, which is particularly beneficial for solar-powered deployments. For detecting harmful gases such as NO2, CO, and total volatile organic compounds (TVOCs), the Multichannel V2 sensor is utilized, particularly for monitoring emissions in industrial and enclosed environments.
In addition to the primary sensors listed in Table 1, other specialized modules are also integrated for comprehensive monitoring. For instance, the SFA30 sensor [28] detects formaldehyde (HCHO) concentrations, which is critical for ensuring indoor air safety. The MQ131 low-concentration ozone sensor provides sensitive detection capabilities for ozone, supporting precise environmental monitoring applications. Together, these sensors enable a robust framework for collecting detailed air quality data, which is essential for evaluating environmental health in both residential and occupational settings [31].

3.1.2. Microcontroller Unit (MCU)

Arduino-based microcontrollers serve as the core of the system, managing data collection and transmission. Their responsibilities include (1) receiving commands, (2) triggering sensor data acquisition, (3) processing and converting raw sensor outputs into pollutant levels, and (4) transmitting the processed data via a wireless module to a remote database server.
The Arduino Uno R3 and Mega 2560 are widely adopted for prototyping, with the Mega offering enhanced memory and I/O capabilities. For wireless communication, the Arduino Uno Wi-Fi Rev2—featuring integrated Wi-Fi—is employed for indoor deployments. In outdoor scenarios, where more intensive data handling is needed, the Raspberry Pi 4 microcomputer is primarily for gateway functions in hybrid deployments. The Raspberry Pi provides higher computational power, multiple RAM options, and versatile connectivity features, making it suitable for complex and multi-sensor configurations.

3.1.3. Web Hosting Service

A well-regarded web hosting service is recognized for providing diverse services to individuals, offering dependable hosting solutions for their websites. With a user-friendly control panel and website builder, users can seamlessly manage their websites and establish a polished online presence. This service also offers robust capabilities for managing databases, enabling users to efficiently store and retrieve data [23].

3.1.4. Database

The system employs the Arduino MySQL Connector library to facilitate direct communication between microcontroller units and a MySQL database via Wi-Fi. Sensor data are securely transmitted and stored in two main tables: “IAQM1” (recording CO2, PM2.5, humidity, and temperature (Supplementary Figure S5) and “IAQM2” (recording CO, HCHO, NO2, and VOCs), along with timestamps indicating when the data were received, as shown in Figure 2.
Timestamps are stored based on the server’s time zone but adjusted in the user interface to reflect the local time accurately. The database is hosted on BlueHost [30], offering an enterprise-grade environment with several layers of protection. These include TLS 1.2 encryption for remote connections, DDoS protection via Imunify360, brute-force defense mechanisms, and application-layer security measures such as least-privilege database access and IP whitelisting.
End-to-end encryption is implemented using a multi-tiered strategy. Arduino devices utilize SSL certificate pinning with a pre-shared DigiCert root certificate, ensuring secure MySQL connections within hardware constraints. Meanwhile, Raspberry Pi gateways apply TLS 1.3 encryption with ECDHE-ECDSA-AES256-GCM ciphers via Python’s SSL libraries, achieving perfect forward secrecy. Monthly SSL Labs audits are conducted to validate security performance and ensure ongoing protection of data integrity.
The current security design aligns with NIST IoT Device Cybersecurity Core Baseline [27] in three aspects: (1) encrypted communications: TLS 1.3 for RPi and SSL certificate pinning for Arduino ensure end-to-end data confidentiality; (2) access control: MAC address whitelisting and write-only database accounts restrict unauthorized operations; (3) device identity: pre-shared credentials (username/password) authenticate each MCU before data submission. However, as highlighted in [28,29,30], direct database access remains a residual risk despite these measures, primarily due to the absence of an intermediate API gateway for request validation and rate limiting.

3.1.5. Data Visualization

The web server supports real-time data visualization through dynamically generated PHP pages. Sensor readings are displayed in tables and time-series charts, enabling users to monitor trends, compare multiple devices across locations, and filter results by date or time. Users can query specific data ranges, with results shown in a structured table format (Figures S2–S4).
The PHP files serve dual purposes: they present interactive data views to users and support backend data processing for other scripts. These web pages are accessible via desktop and mobile browsers, offering a user-friendly and responsive experience. When multiple sensor units are deployed, the system allows simultaneous monitoring and comparison across devices, supporting large-scale environmental assessments. Additional features, such as email alerts and search functions, further enhance user interaction.

3.2. Enclosure Design

The enclosures are custom-sized to fit specific component configurations. Each variant scales proportionally based on the number of microcontroller boards, sensors, and optional camera modules.
Airflow is managed through a single 40 mm fan opposite vents. This creates directional airflow that replaces internal air every 2–3 min while avoiding turbulence in sensor measurement zones. The SEN54’s optical chamber remains undisturbed due to strategic placement. Testing showed less than 3% deviation from open-air reference measurements under all operating conditions.

3.3. Device Validation Tests

Several tests were conducted to validate the functionality of sensors intended for use in a device. These sensors were designed to measure various air quality parameters, including NO2, PM2.5, TVOC, CO, CO2, temperature, and humidity. The reference instruments employed in this study, EVM-7 (TSI), Tiger XT (Ion Science), and Aeroqual Series 500, were selected for their adherence to internationally recognized performance standards and their calibration traceability to certified protocols. The calibration strategy combines field adjustments with principles from cloud-based distant calibration [24,31], which has demonstrated EU Class 1 accuracy for PM/NO2 sensors through automated gain and offset corrections.
The validation process involved conducting tests in different environments, such as indoor and outdoor settings. For most parameters, direct measurements of indoor and outdoor concentrations were taken. However, since the concentrations of certain pollutants are typically too low under normal circumstances or fall within safe levels, additional tests were performed in specialized environments. For example, measurements were taken near traffic to capture higher levels of air pollutants, CO readings were obtained in an underground garage to obtain elevated CO values, and PM2.5 measurements were conducted using lighting candles to increase PM2.5 concentrations. Each parameter was tested individually to compare the results with those obtained from commercial-grade instruments. This process helped evaluate the performance of different sensor modules available for each parameter.
Two case studies were carried out, one at Concordia University, Montreal, and another at Qatar University, Doha. At Concordia University, the sensors were tested in various environments, such as offices, classrooms, garages, and outdoor spaces, to validate their applicability in different settings. At Qatar University, two units of the device, equipped with integrated sensors and an online display system, were deployed. Multiple locations within the Qatar University Environment Science Center were tested to assess the consistency of sensor readings and their correlation with measurements obtained from commercial instruments. These comprehensive tests aimed to verify the suitability of the sensors for accurate air quality monitoring in diverse environments and to identify the sensor modules that exhibited superior performance for each parameter. 
Time synchronization between the proposed system and reference instruments was achieved through timestamp alignment. All devices recorded measurements with internal timestamps, and data streams were aligned post hoc using linear interpolation with reference to EVM-7 as the temporal baseline. Points with >2 s timestamp deviation were excluded (<5% of total data). This approach maintained sufficient synchronization given the maximum observed clock drift of 0.8 s over 24 h (laboratory test) and pollutant dynamics occurring at minute-level timescales.

3.4. Air Quality Index Model for Indoor (3 Sub-Index)

The concept of the indoor air quality index is to assess and evaluate the quality of air within enclosed spaces, such as buildings or homes. It aims to provide a comprehensive measure of indoor air quality by considering several factors that contribute to the overall environment. Rastogi and Lohani (2022) [31] developed an adaptive neuro-fuzzy inference system (ANFIS) to assess IAQ in enclosed spaces, specifically focusing on classroom environments. The ANFIS model utilizes three key indicators—percent of dissatisfied people (PPD), ventilation rate (VR), and air quality index (AQI) data as sub-indices to evaluate IAQ. In this study, the methodology proposed by [31] is used, utilizing the three sub-indices, namely thermal comfort, ventilation rate, and pollutant concentrations, as the fundamental indicators for evaluating the air quality within enclosed spaces (Figure 3).
  • Thermal Comfort.
Thermal comfort refers to the condition of mind or sensation that indicates satisfaction with the thermal environment (ASHRAE Standard 55-2023, Thermal Environmental Conditions for Human Occupancy, 2023) [32]. This sub-index assesses the level of comfort experienced by predicted mean vote (PMV) and predicted percentage dissatisfied (PPD), which are determined by two main factors: temperature and humidity. PMV is a measure of the average thermal sensation experienced by a group of individuals in a particular indoor environment (ASHRAE Standard 55, 2023) [32]. It considers numerous factors such as air temperature, mean radiant temperature, air velocity, humidity, and clothing insulation. The PMV scale ranges from −3 (feeling very cold) to +3 (feeling very hot), with 0 representing a thermally neutral state.
The equation for calculating PMV is as follows [17]:
P M V = 0.303 e 0.036 M + 0.028 M W 3.96 10 8 f F c l 1 T c l + 273 4 T r + 273 4 f c l h c T c l T a P
In Equation (1), 0.303 e 0.036 M + 0.028 M W represents heat production and heat loss from the human body. It considers the metabolic rate (M) of the individual, which is a measure of the person’s heat production, and the external work performed (W) by the individual. The equation uses the metabolic rate to calculate the amount of heat produced by the body.
In Equation (1), { 3.96 10 8 f F c l 1 T c l + 273 4 T r + 273 4 } represents the heat exchange between the body and the surrounding environment. It considers factors such as air velocity (f), clothing insulation (Fcl), and the temperature difference between the average clothing surface temperature (Tcl) and the mean radiant temperature (Tr). The equation calculates the convective and radiative heat transfer between the body and the environment.
In Equation (1), [ f c l h c T c l T a ] represents the convective heat transfer between the body and the air. It considers the clothing area factor (fcl), the convective heat transfer coefficient (hc), and the temperature difference between the average clothing surface temperature (Tcl) and the air temperature (Ta). In Equation (1), P represents the heat loss due to water vaporization. It considers the water vapor pressure (P) in the environment.
PPD represents the percentage of individuals within a group who are expected to feel dissatisfied with their thermal comfort conditions. Equation (2) for calculating PPD is as follows [21]:
P P D = 100 95 e 0.03353 P M V 4 0.2179 P M V 2
It is calculated based on the difference between an individual’s thermal sensation vote (on a seven-point thermal sensation scale) and the PMV value. Table 2 shows the relationship between PPD and thermal comfort.
  • Ventilation rate.
The practice of using indoor CO2 concentrations is a widely adopted approach for estimating ventilation rates per person by applying a single-zone mass balance model of CO2 [29]. ASHRAE-62 standard has discussed the relationship between the ventilation rate and CO2 concentration under steady-state conditions [33] (Table 3). By giving constant values for the generation rate, ventilation rate, and outdoor CO2 concentration throughout the mass balance analysis period, the steady-state equation can be represented as follows:
Q O = G C i n , s s C o u t
For indoor environments, air for ventilation is recommended as more than or equal to 15 cfm.
  • Pollutant concentrations.
The pollutant concentrations sub-index evaluates the levels of various pollutants present in the indoor air. This includes pollutants such as particulate matter, VOCs, CO2, CO, and other potentially harmful gases like Ozone and HCHO if they are available. Monitoring pollutant concentrations helps identify potential health risks and enables appropriate measures to be taken to reduce exposure. For different pollutants, different standard and index calculation methods may be applied. For example, we can use the AQHI standard from the Canada National Standard to calculate particulate matter and Nitrogen Dioxide [34] and the VOC level from the WHO standards [35]. After setting the hazardous level of each pollutant, the large index value is taken for this sub-index value. AQHI from Canada National Standard (assuming indoor zero-level ozone) [34]:
  P M 2.5 A Q H I = 10 10.4 × 100 × e 0.000871 × N O 2 1 + e 0.000487 × P M 2.5 1
Note: While this study cites the 2023 edition of ASHRAE Standard 55, the PMV/PPD calculations remain consistent with previous versions for steady-state conditions.
4. Results

Validation of each sensor against commercially available sensors is conducted across selected places with varying human traffic and environmental conditions in Concordia and Qatar universities. The readings recorded are compared between two locations, and both sites have significantly different climates. All sensors were mounted around 1.5 m (adult breathing zone) with ≥1 m clearance from walls/ventilation outlets.

4.1. Case Study—Concordia University

The first case study focused on evaluating the performance of individual sensors to determine which parameters provided reliable readings and which sensors were suitable for integration under Canadian environmental conditions. To assess reliability, sensor outputs were compared with commercial-grade instruments across various indoor and outdoor locations at and around Concordia University (Figure 4). Monitoring sites were strategically selected to achieve two primary objectives: validating sensor performance under diverse conditions (indoor vs. outdoor, static vs. dynamic pollutant sources) and ensuring measurable pollutant variations even in low-concentration environments. Outdoor locations, such as sidewalks and open spaces, served as baseline reference points for ambient levels. High-emission zones, including underground garages for carbon monoxide (CO), metro stations for fine particulate matter (PM2.5), and traffic intersections for nitrogen dioxide (NO2), were chosen to test sensor response to elevated pollutant levels. Additionally, occupied indoor spaces like classrooms and offices were selected to monitor carbon dioxide (CO2) and volatile organic compounds (VOCs) generated from typical human activities.

4.1.1. Carbon Dioxide

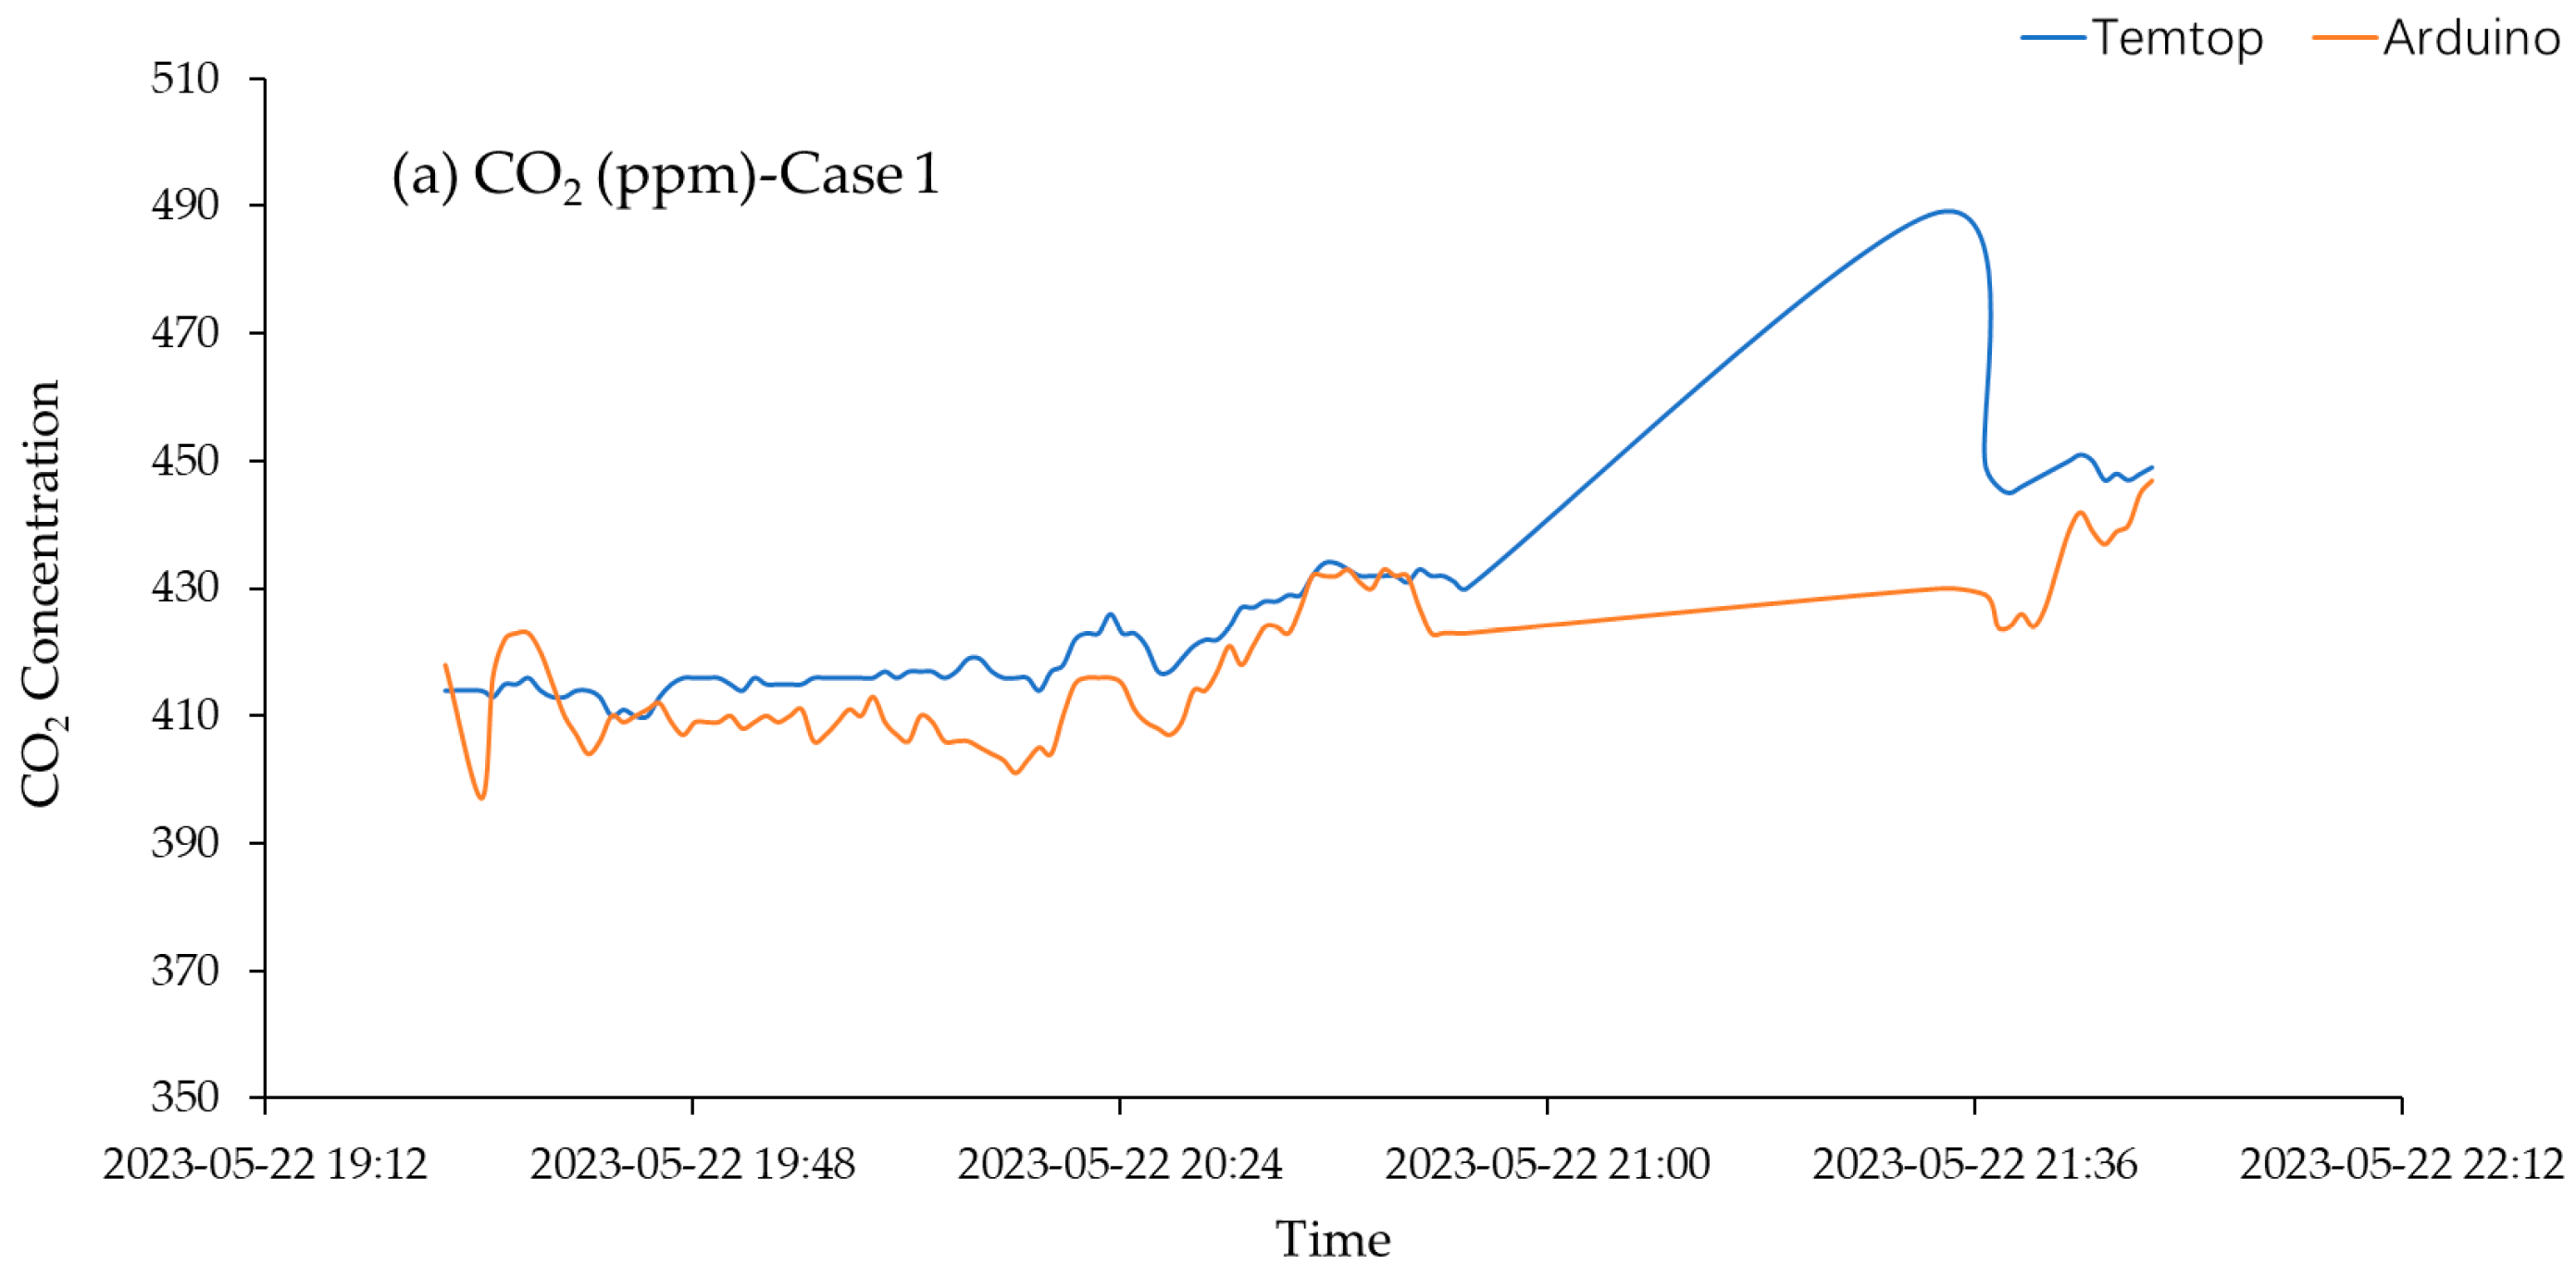
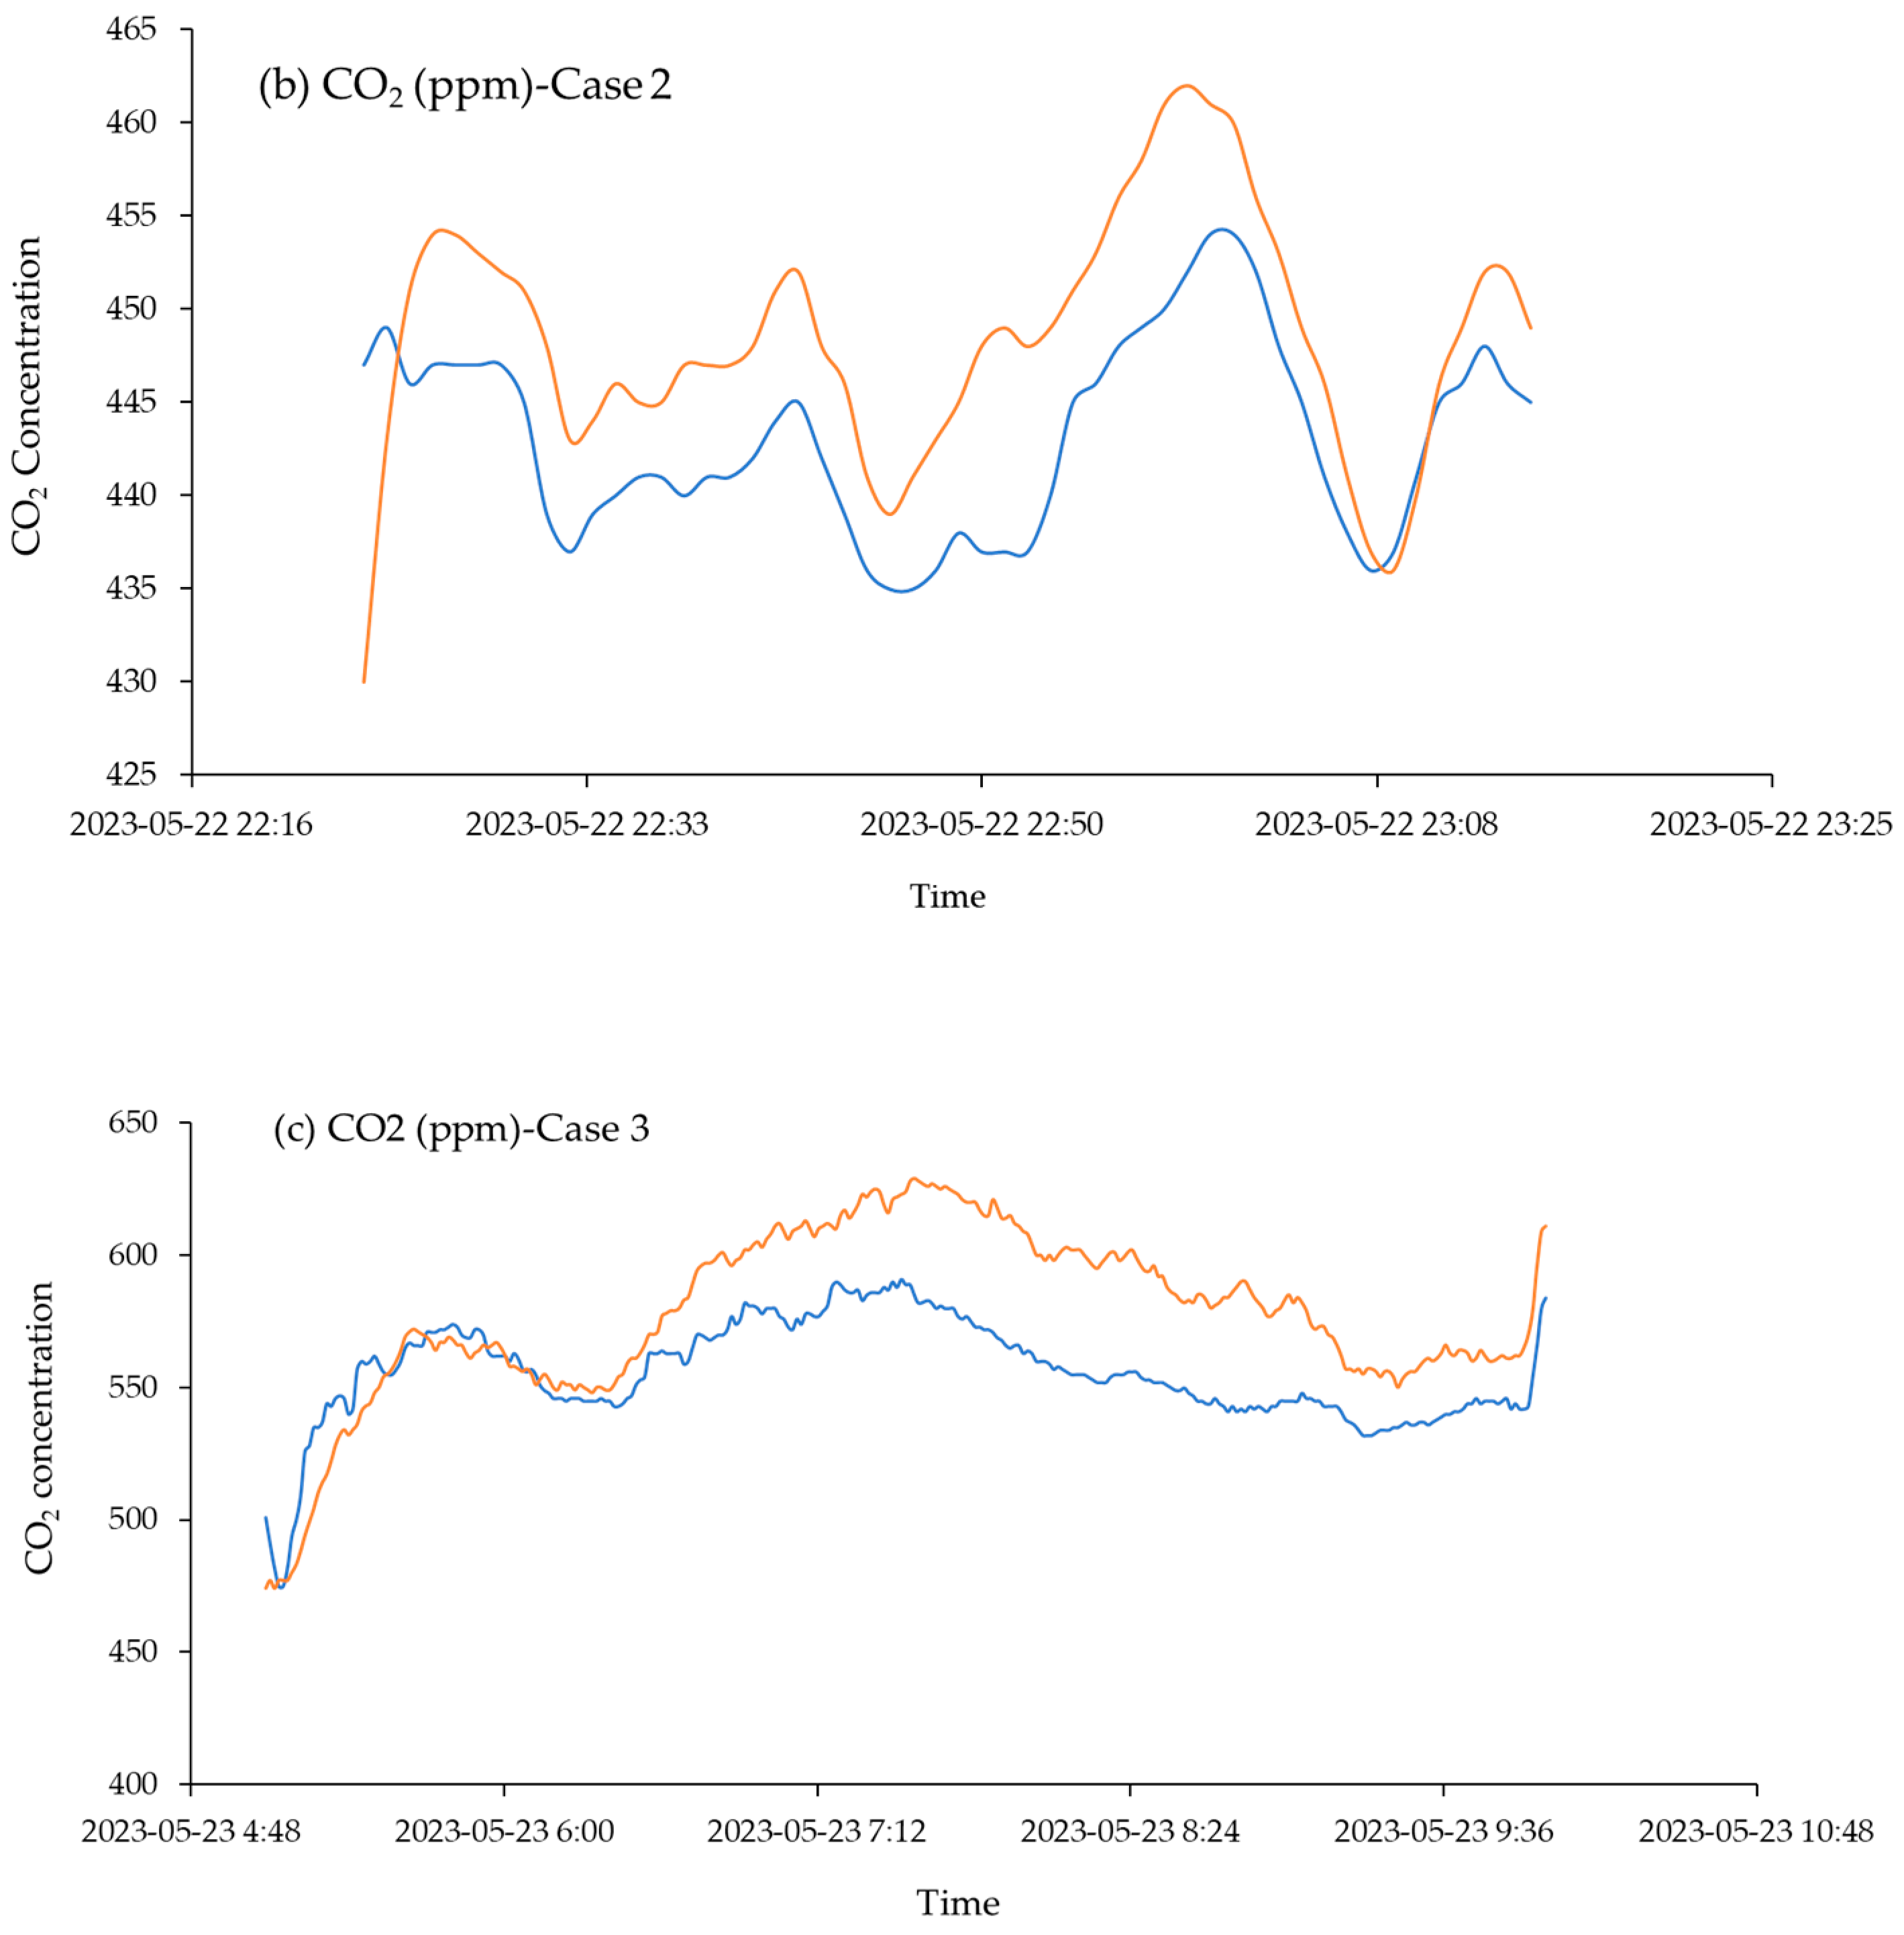
CO2 readings were recorded across multiple locations to evaluate the real-time performance of sensors at three different sites within Concordia University. Figure 5 presents the results of these measurements.
Case 1 took place on 5 May 2023, from 19:27 to 21:50 local time at the EV Building, Guy Street, Montreal. The SCD30 CO2 sensor (Arduino) was compared with a commercial air detector. The average CO2 concentration recorded by the air detector was 421.25 ppm, while the Arduino sensor recorded 414.92 ppm on average. The percentage difference between the two sensors ranged from 1.5% to 3.6%, with the air detector slightly outperforming the Arduino sensor in terms of higher readings. A correlation of 0.87 was observed, indicating a consistent trend between both devices. Despite this, a significant spike was noted in the air detector’s data between 21:00 and 21:36 local time, likely due to erroneous readings at 21:33 due to sudden human activity (e.g., door opening). These data, influenced by human respiration (recording 2114 ppm), were excluded from further analysis as they did not reflect typical indoor conditions. The Arduino sensor maintained consistent readings throughout this period. After the spike, the air detector’s readings gradually returned to normal levels, realigning with those recorded by the Arduino sensor. This observation suggests that the Arduino sensor was less susceptible to erratic environmental factors compared to the commercial device. Case 2, conducted on 22 May 2023, from 22:23 to 23:14 local time, at the 9th-floor corridor of the EV Building, again utilized both sensors. The air detector recorded an average CO2 concentration of 442.69 ppm, while the Arduino sensor measured 448.96 ppm. The percentage difference between the sensors ranged from 1.4% to 2.4%, with a similar trend of slightly higher readings from the Arduino sensor. The correlation coefficient of 0.91 suggests a robust linear relationship between the two devices. Notably, an initial offset of approximately +15 ppm in the air detector readings at the start of the measurement period was observed, which could suggest a potential calibration or sensor adjustment issue upon startup. However, the Arduino sensor exhibited consistent and stable readings throughout the test period, reinforcing its reliability.
Case 3 took place on 23 May 2023, from 05:05 to 09:59 local time, at an apartment in Le 2100 Maisonneuve, Montreal, a location with potential sources of anthropogenic CO2 emissions beyond human respiration. The test duration of five hours revealed consistently elevated CO2 levels, reflective of poor ventilation. The air detector recorded an average CO2 concentration of 555.75 ppm, while the Arduino sensor recorded 577.12 ppm on average. The percentage difference between the two sensors ranged from 6.1% to 9.1%, with the Arduino sensor again providing higher readings. A positive correlation of 0.81 further supports the general consistency of both sensors. However, a discrepancy was noted at 04:49 local time, when the air detector readings started to increase, diverging from the Arduino sensor. This deviation could be attributed to environmental factors or calibration issues, requiring further investigation in future studies.

4.1.2. Particulate Matter (PM2.5)

PM2.5 readings were recorded at several locations to compare the real-time performances of sensors at three different locations in Concordia University (Figure 6).
Case 1 (Figure 6a) was conducted on 7 May 2022, from 19:27 to 21:50 local time in office EV15.119, located in the EV Building, to record PM2.5 concentrations. The SEN54 PM sensor (Arduino) was compared with a commercial air detector. Both sensors recorded low PM2.5 levels, ranging from 2 to 3 µg/m3, consistent with well-ventilated room conditions. Over time, both sensors exhibited similar trends and variations. However, a slight upward shift in the air detector’s readings was observed at the start of the test period, suggesting a minor calibration offset or initial sensor adjustment.
Case 2 (Figure 6b) was conducted on 8 May 2022, from 16:40 to 03:09 local time at an apartment in Le 2100 Maisonneuve, Montreal, using the same sensors. In this case, the PM2.5 sensor was tested in a domestic environment with a controlled PM source. Since the outdoor and well-ventilated university office environments recorded low PM levels (below 5 µg/m3), a candle was used in a small room to artificially increase the PM levels. The recorded PM levels exhibited volatile fluctuations due to the burning of the candle and intermittent ventilation by opening windows. As shown in the charts, the readings from both sensors varied considerably over the observed period. The percentage difference between the two sensors ranged from −45% to 22.3%. However, the majority of data points (97%) showed a difference of less than 20%, with 86% falling within a 15% difference range. Despite the broader fluctuations, a positive correlation of 0.96 was observed between the two sensors, indicating that both sensors followed similar trends. The Arduino sensor demonstrated greater sensitivity to transient variations in PM loading compared to the commercial air detector, suggesting its higher responsiveness to environmental changes.

4.1.3. Nitrogen Dioxide (NO2)

NO2 readings were recorded on the 6th floor of the EV Building on 11 April 2023, from 09:24 to 21:24 local time, to compare the real-time performances of the sensors (Supplementary Figure S6). Approximately 400 observations were collected during this period. The commercial instrument recorded steady readings between 115 and 135 ppb, while the Arduino sensor showed more variability in its readings, with average values of 125.68 ppb and 129.56 ppb. The absolute percentage difference between the two sensors’ readings remained below 25%. Despite the fluctuations observed in the Arduino sensor, both devices demonstrated comparable average readings, indicating a reasonable level of agreement. The variation in the Arduino sensor’s readings may be attributed to its sensitivity to environmental factors or potential calibration differences between the two sensors.

4.1.4. Volatile Organic Compounds (VOCs)

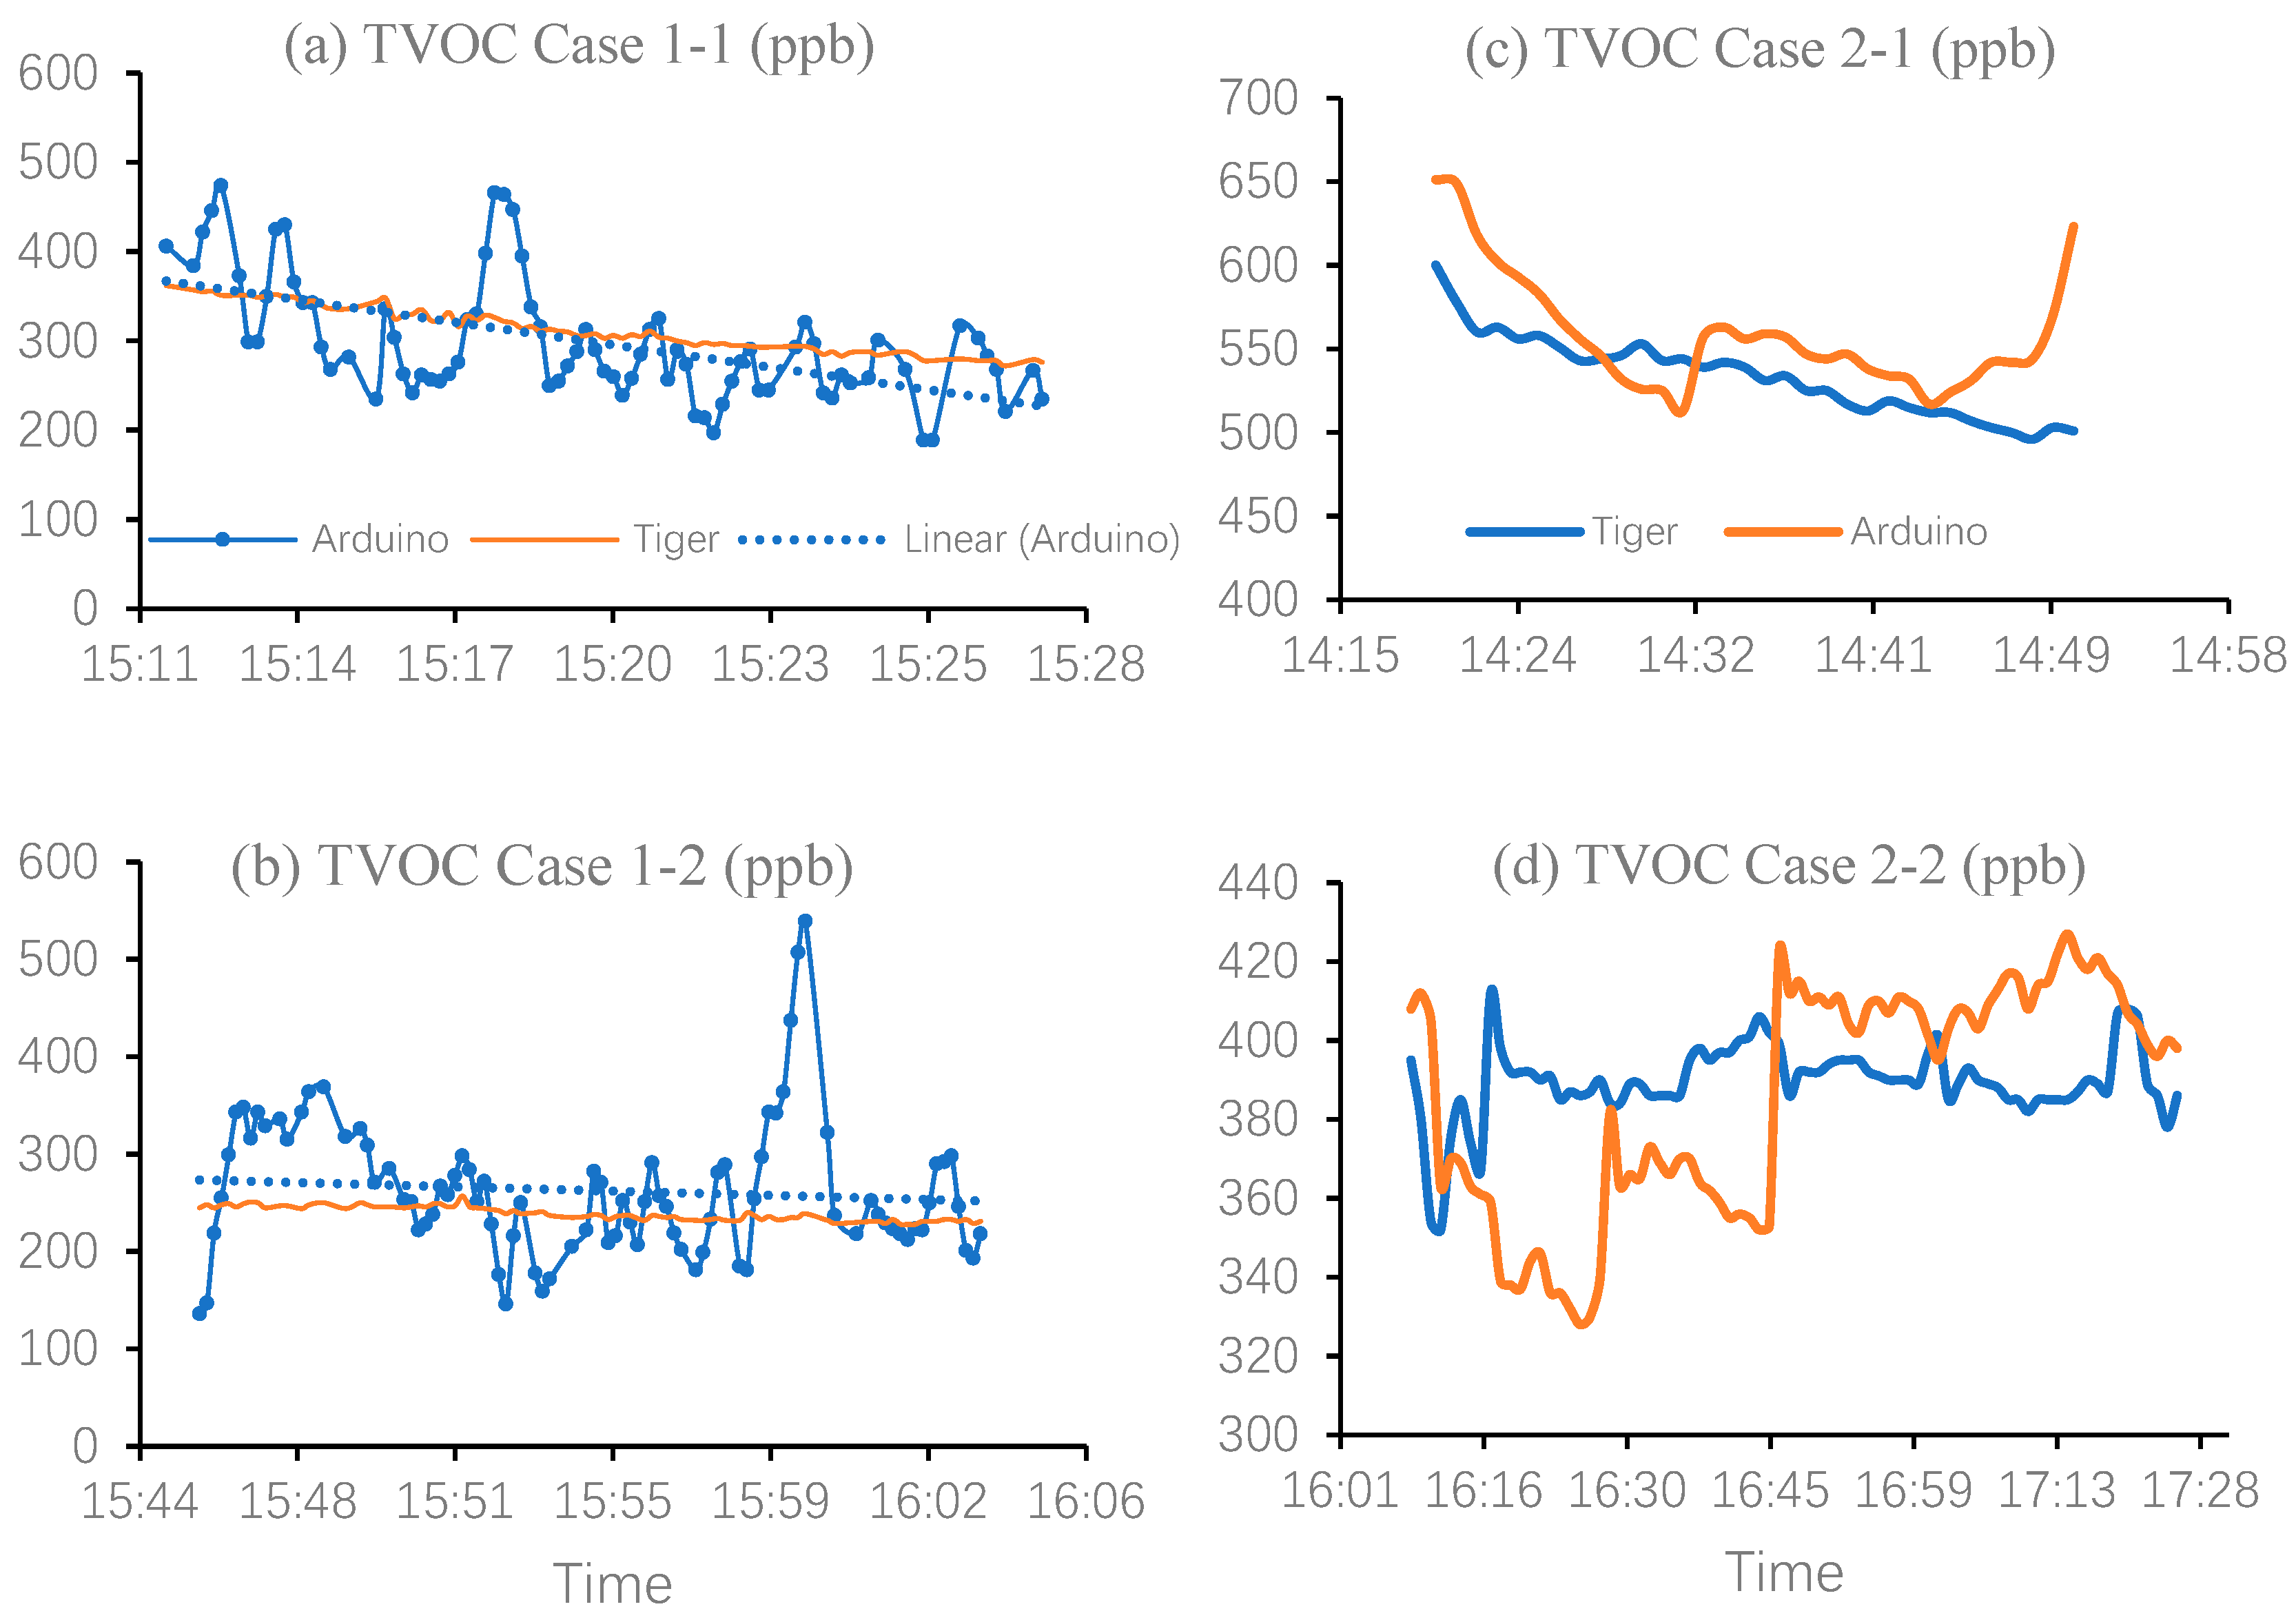
Case 1-1 and Case 1-2 were conducted to record TVOC concentrations on 15 May 2023, from 15:11 to 16:04 local time, outside the Concordia University GM Building, Montreal, to compare the real-time performances of the sensors (Figure 7a,b). The Arduino-based SGP30 TVOC sensor was compared with a commercial TVOC instrument. The readings from the Arduino sensor exhibited a cyclic pattern with varying magnitude and period, showing periodic rises and falls. In contrast, the commercial instrument maintained a steady declining trend without exhibiting the fluctuations observed with the Arduino sensor. Despite the variations, the linear trend of the Arduino sensor closely followed the commercial instrument’s readings. The average reading from the Arduino sensor was 236.86 ppb, while the commercial TVOC detector recorded an average of 228.35 ppb. The percentage difference between the two sensors ranged from 15% to 30%, with an overall difference of 3.73%.
On 22 May 2023, another test was conducted with the same devices deployed on the 6th floor of the EV Building from 14:20 to 17:20 local time (Figure 7c,d). For this indoor test, the GM502B sensor module was used. The commercial TVOC instrument consistently recorded values between 500 and 600 ppb, while the Arduino sensor readings fluctuated between 325 and 650 ppb, showing a broader range of values. The Arduino sensor exhibited more variability, with occasional spikes up to 650 ppb. The average reading from the commercial TVOC instrument was approximately 533.5 ppb, while the Arduino sensor recorded an average of 559.03 ppb. The absolute percentage difference between the two sensors’ readings in this case was less than 15%, indicating a relatively consistent performance between the two sensors in terms of overall trends.

4.1.5. Temperature and Humidity

The temperature and humidity readings were recorded on 22 May 2023, from 21:00 to 22:00 local time, in room EV15.119 in the EV building office at Concordia University to compare the real-time performances of a commercial air detector and the Arduino SEN54 sensor (Figure 8). These measurements were collected during each PM test, and the data presented here were randomly selected from longer-term observations. The Arduino sensor consistently overestimated both the temperature and humidity readings. In most instances, the temperature difference between the two sensors was less than 2 °C, and the humidity difference was less than 5%. Notably, the commercial air detector recorded temperature and humidity values in integer format, whereas the Arduino sensor provided readings with two decimal places. Despite these differences in precision, both sensors exhibited similar trends, with the temperature increasing and the humidity decreasing over time, as shown in the charts.

4.2. Case Study—Qatar University

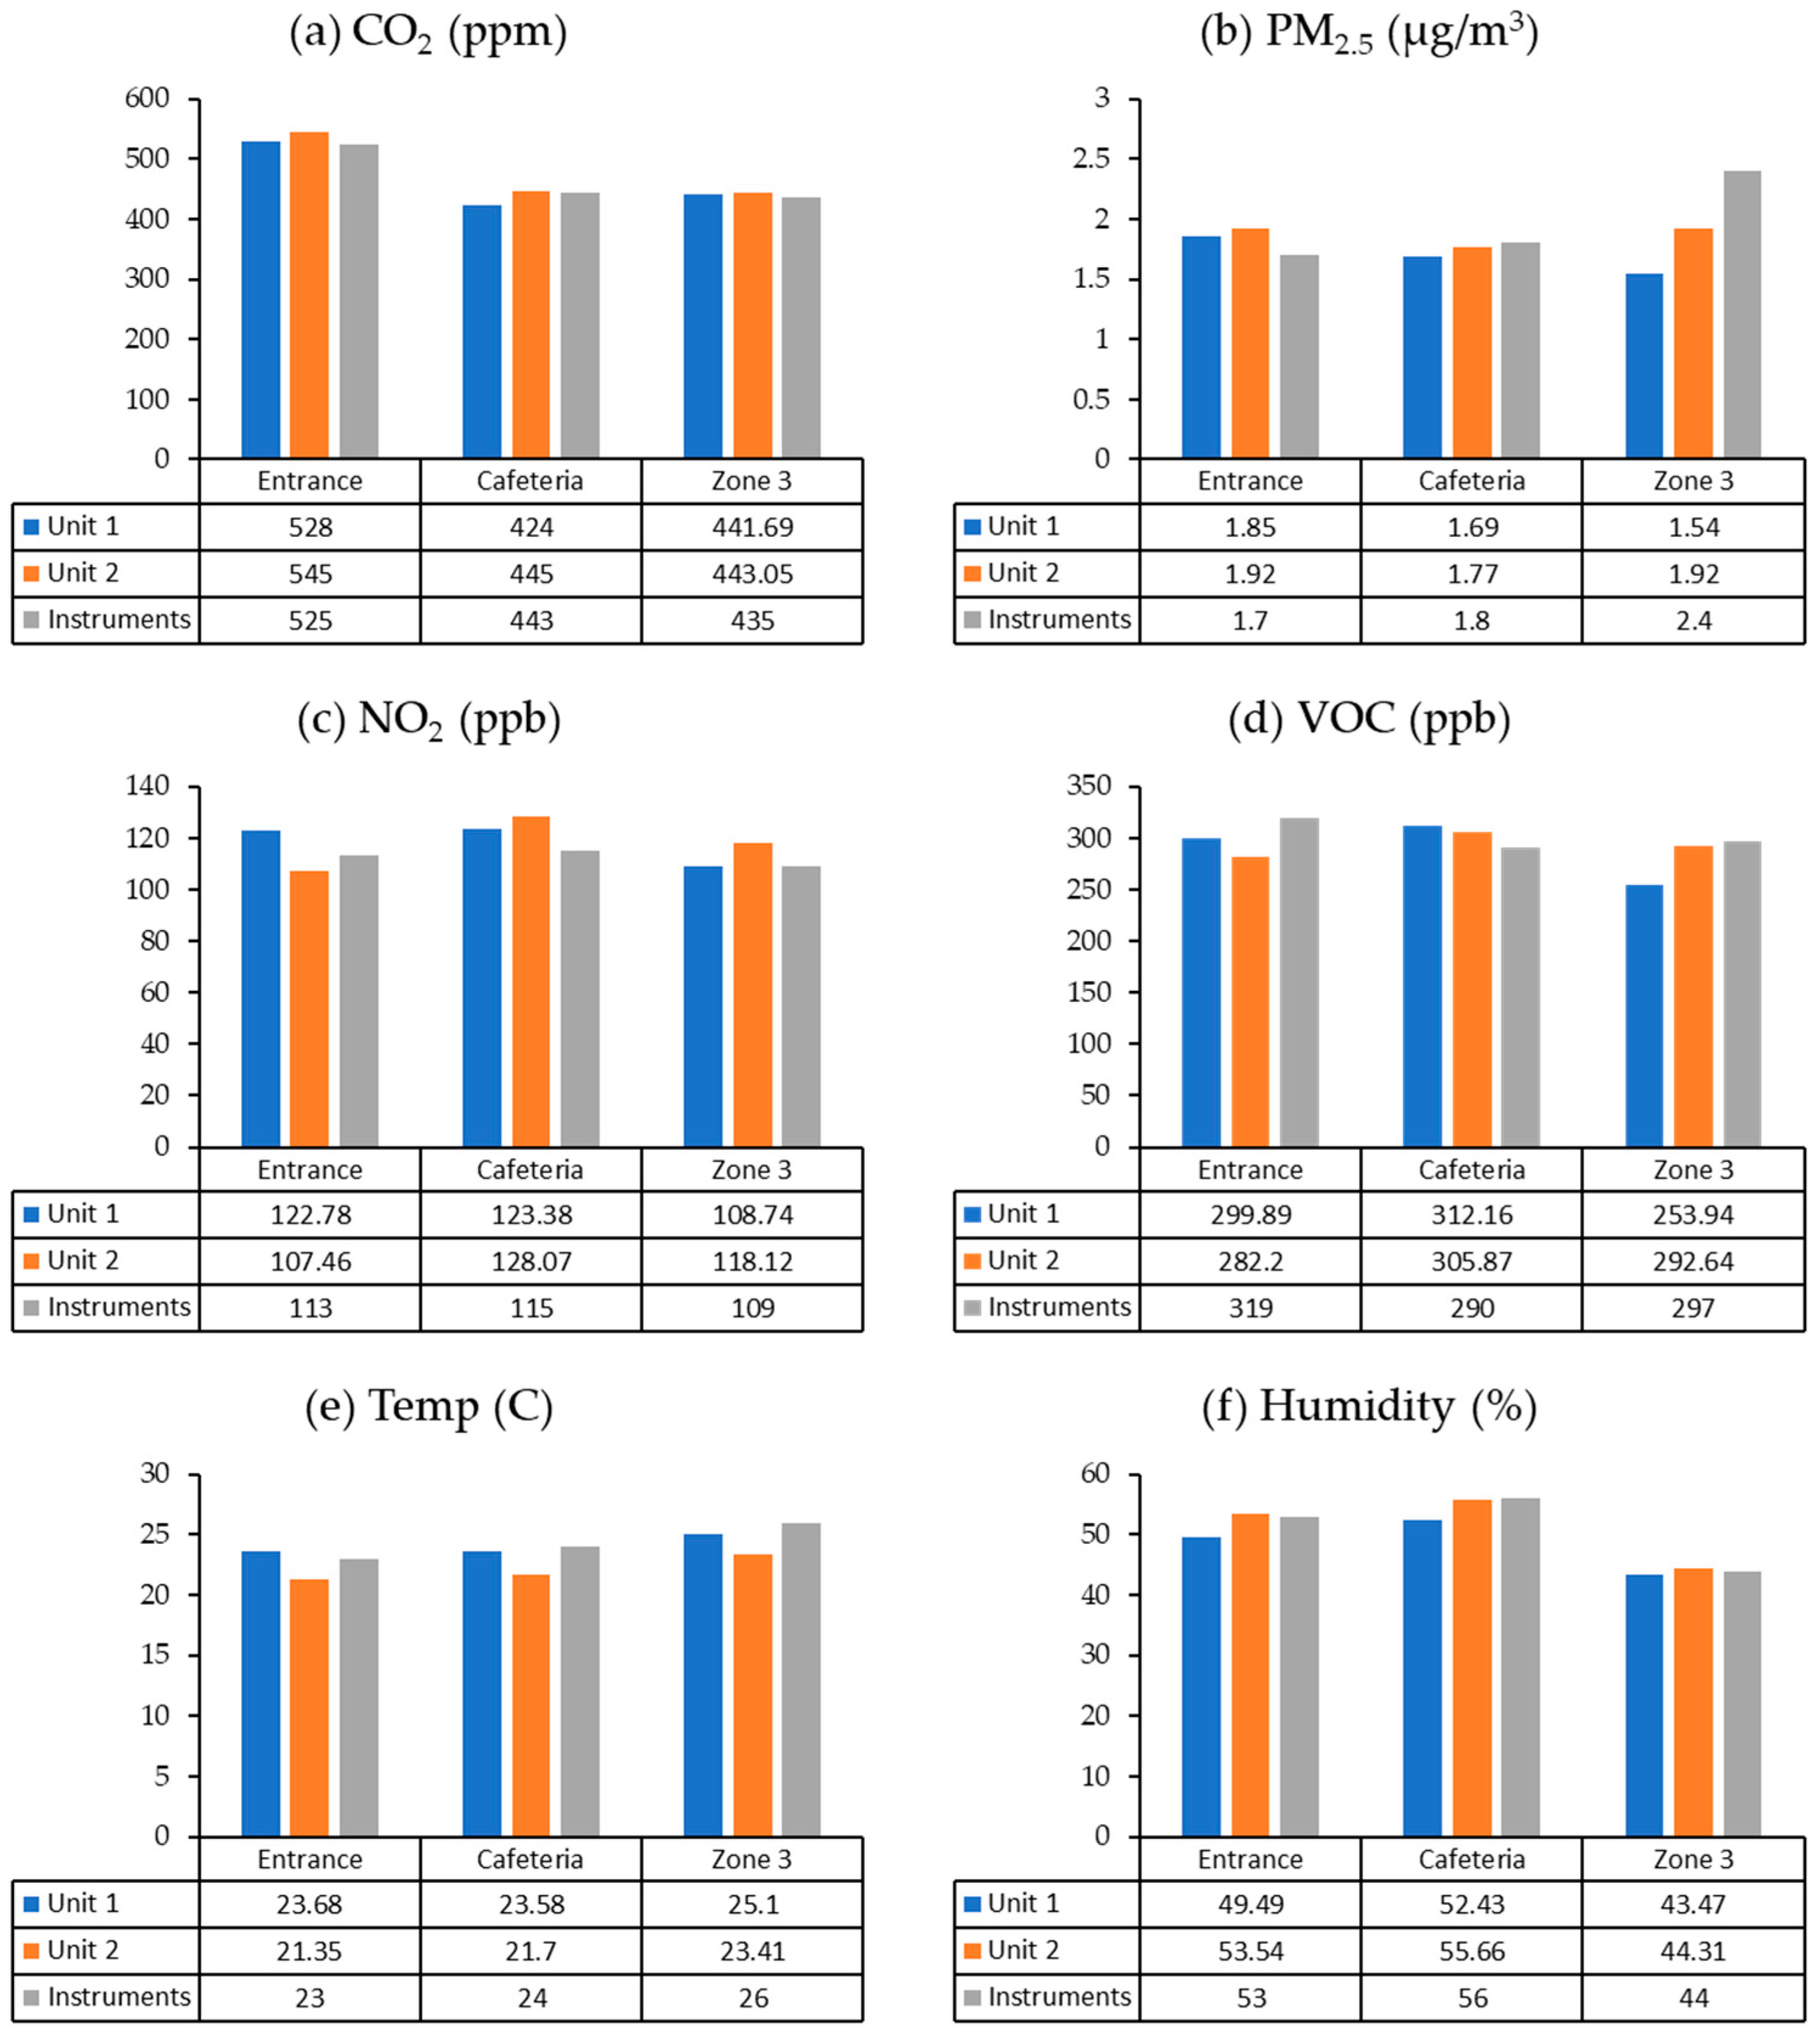
The deployment of the integrated sensor device at Qatar University validates the system’s performance in a completely different climatic environment. The integrated sensor device, which includes all the sensors tested in the Concordia case study, was deployed in two units (unit 1 and unit 2) to simultaneously monitor CO2, PM2.5, NO2, VOCs, temperature, and humidity at indoor locations within the Environmental Science Center (ESC) at Qatar University on 10 June 2023 (Figure 9). Three high-traffic indoor locations were selected at Qatar University based on their relevance to occupant exposure and practical constraints on deployment time. These included the following: (a) the main entrance of the Environmental Science Center (ESC) to capture intermittent pollutant ingress due to frequent door openings; (b) the cafeteria to monitor periodic spikes in VOCs and particulate matter (PM) resulting from cooking activities; and (c) the main lobby of the Research Complex in Zone 3, to assess continuous indoor air quality variations, particularly CO2 build-up from sustained occupancy. These locations were chosen to represent diverse microenvironments that align with WHO monitoring priorities. Real-time data from the two deployed sensor devices were collected via the project’s web interface and compared against readings from commercial-grade instruments for performance evaluation.
Table 4 illustrates the average value of each parameter at 3 locations for two devices and instruments. Figure 10 compares the PM2.5 data in µg/m3 obtained from the units and the instrument. The data exhibits varying levels of PM2.5 concentrations between the units and the instrument. Unit 2 consistently records higher PM2.5 values compared to Unit 1, with the largest difference between the unit and the instrument observed at 18%. Since the three locations tested had clean, well-ventilated room conditions, both devices and the instrument recorded low PM2.5 levels, leading to increased percentage differences. The main differences between Unit 1 and Unit 2 ranged from 1.67% to 15%. The correlation coefficient for this dataset is 0.93. The chart presents the NO2 data in ppb obtained from the units and the instrument. The differences between Unit 1 and Unit 2 range from 0.45% to 7.81%, suggesting discrepancies in their readings. The primary source of the observed differences appears to be the influence of temperature. The correlation coefficient for NO2 readings is 0.70, indicating moderate agreement between the units and the instrument.
VOC readings from the two units were similar to the instrument at the main entrance and cafeteria. However, in Zone 3, the results from Unit 1 were lower than those of Unit 2 and the TVOC instrument. This discrepancy may be due to the influence of temperature or errors in sensor calibration. The largest difference between the units and the instrument was observed at 20%, with major differences ranging from 1.47% to 14.5%. The correlation coefficient for VOC readings is 0.62, indicating moderate variability and lower consistency in performance, especially under varying temperature conditions.
Temperature readings showed that Unit 2 was consistently lower than both Unit 1 and the instrument. This could be due to the different impact-resistant materials used in the two units, suggesting that the new sensor in Unit 2 may still require pre-heating and calibration. Humidity differences remained below 5%, indicating good agreement between the units and the instrument.

4.3. Case Study of Indoor Air Quality Index Model

The thermal comfort sub-index and the ventilation rate sub-index are based on the ASHRAE standard [32], while the pollutant sub-index is based on the parameters that can be collected by the integrated device and related protocols. To illustrate the model, the AQHI from the Canada National Standard [34] and the VOC index level from the World Health Organization (WHO) [35] were adjusted to fit the model (see Supplementary Table S1).
As an example, the data were collected on 23 March 2023, in an office room with occupancy of only one person at Concordia SAE Office, from 14:16 to 14:20 local time (Table S2).

4.3.1. Sub-Index Thermal Comfort (ASHRAE Standard)

A person is working in front of a computer, so the metabolic rate, airspeed, and clothing insulation are set with temperature around 23 °C and humidity around 32% (Table 5 and Supplementary Table S2) for ASHRAE—55 standard [32] where computed values of PMV = −0.4315 and PPD = 14.48, indicate a slightly cool thermal sensation due to lack of ventilation indicated by ACH 0.7, leading to a severely deteriorated air quality with pollutant index exceeding 12 at Concordia SAE Office. A poor thermal environment is observed as the room temperature is slightly cool for normal working conditions, particularly during the cold weather in March in the office.

4.3.2. Sub-Index Ventilation Rate (ASHRAE Standard)

The room area is 396 ft2, with a ceiling height of around 10 ft, occupied by one person, nearly 30 years old, working in front of a desktop. Assuming the outdoor CO2 level is fixed at 400 ppm, the air changes per hour are nearly 0.7 for this case [32].
A i r   c h a n g e s   p e r   h o u r = C l e a n   a i r   r a t e f t 3 / h o u r R o o m   v o l u m e f t 3 = C u b i c   f e e t   p e r   h o u r R o o m   l e n g t h w i d t h h e i g h t f t
An air change per hour of 0.7 refers to inadequate ventilation. The room lacks windows or an operational ventilation system, leading to elevated CO2 levels and ineffective removal of other pollutants. The only means of ventilation is by opening the door.

4.3.3. Sub-Index Pollutant Concentrations

Based on recorded values of NO2 140 ppb, PM2.5 3.3 µg/m3, and VOC 467 ppb, the AQHI = 12.64 is determined by the Canada National Standard [34] with the assumption of indoor zero-level ozone (Table 6). Elevated levels of NO2, VOC, and CO2 can be attributed to poor ventilation and human activities. However, the presence of NO2 and VOC may arise from sources such as tobacco smoke, building materials, or unvented heaters commonly used in cold environments. While the PM value is low, the likelihood of tobacco smoke is reduced unless there is a PM purifier to eliminate cigarette smoke.
Due to the absence of an air quality index (AQI) specifically based on VOC (volatile organic compounds) values, the hazardous level of VOC has been adjusted by the World Health Organization (WHO) [35] into an index value. When multiple parameters are utilized to determine this sub-index, the higher value takes precedence. The air quality level is classified as severe (Table 6). Overall, the indoor air quality in this room is exceedingly poor and requires immediate attention. Prolonged exposure to such conditions can increase the risk of lung problems, respiratory diseases, and even cancers among individuals working in this space.

5. Discussion

The case study focused on comparing indoor air quality measurements for CO2, NO2, VOC, PM2.5, temperature, and humidity between consumer-grade sensors (Arduino-based) and commercial-grade instruments (Table 7).

5.1. Sensors Performance

The Arduino device generally recorded higher values than the air detector device, suggesting a different standard of calibration or sensitivity of the sensors used in each device. Furthermore, when examining the overall range of values recorded by the two devices, it is observed that the Arduino device has a wider range compared to the air detector device. This broader range of values captured by the Arduino device implies its ability to detect a wider spectrum of air quality variations.
Quantitative error analysis demonstrated environment-dependent variations in sensor accuracy. For CO2 monitoring, root mean square error (RMSE) ranged from 4.8 ppm (stable offices) to 29.2 ppm (high-occupancy scenarios), while PM2.5 errors increased from 0.17 µg/m3 (clean air) to 16.4 µg/m3 (candle tests). Similarly, for NO2, the Arduino sensor showed a 15–20% difference post-calibration compared to reference readings. One-way ANOVA (Analysis of Variance) on absolute errors revealed statistically significant differences across environments (CO2: F-statistic (F) (2,6) = 8.37, p-value (p) = 0.012, Eta squared (η2) = 0.74; PM2.5: F(2,6) = 6.94, p = 0.021, η2 = 0.70), with Tukey Honestly Significant Difference (Tukey HSD) tests confirming elevated errors during peak events (p < 0.05). Despite these variations, device trends remained strongly correlated (slope = 0.93 ± 0.05, coefficient of determination (R2) > 0.90). While machine learning calibration [19] can achieve R2 > 0.9 for microenvironment-specific deployments, our hardware-level corrections prioritize operational simplicity across diverse climates from Montreal to Doha.
The air detector device consistently recorded lower values compared to the Arduino device, and the observed differences could arise from varying calibration methods, distinct sensitivities to CO2 levels, or disparities in sensor quality and manufacturing. In most prior studies, a different CO2 sensor variant, such as the K30 model, was used due to its broader detection range (0–5000 ppm) [36,37]. However, given the indoor application context in this study, the SCD30 sensor, with a minimum threshold of 400 ppm, proved adequate and delivered satisfactory results.
Despite minor differences between the Air Detector and Arduino devices, most readings showed less than a 10% difference, highlighting a high level of agreement. For PM2.5, consumer-grade readings closely matched the commercial air detector at low concentrations but diverged slightly (within 20%) at higher levels due to time-sensitive fluctuations and ventilation effects. A correlation coefficient of 0.94254 still indicates strong alignment.
For NO2 analysis, the Arduino sensor, post-calibration, showed a 20% error margin compared to commercial-grade readings, though some temperature sensitivity was noted. Thus, while the readings are directionally consistent, interpretation should consider ambient temperature effects. VOC readings from the SGP30 module averaged within 3.73% of the commercial detector, with long-term differences remaining between 2.46% and 5.34%, although real-time data were more volatile due to environmental and self-calibration influences. These fluctuations, reaching up to 30%, suggest caution in interpreting absolute values, a finding supported by the existing literature that discourages using absolute VOC readings due to a lack of standardization [37,38,39]. Temperature and humidity differences were minimal, less than 2 °C for temperature and under 5% for humidity, indicating good agreement in these parameters [40]. These results suggest that the Arduino system is suitable for low-cost, indicative air quality monitoring.
The overall system performance was influenced not only by sensor behavior but also by data transmission constraints. Due to limitations in the MCU, Wi-Fi module, and server bandwidth, the system architecture uses multiple MySQL tables with a cap of six columns each. While this enables structured data storage, it places some restrictions on real-time transmission formats. Data visualization tools offer real-time and historical views via PHP-driven web interfaces, though data interpretation complexity may vary depending on the user’s technical familiarity.
Whether employing a custom cloud-based framework as in this study or leveraging off-the-shelf IoT platforms like ThingSpeak [41,42,43]. Each approach presents trade-offs. Although developing a dedicated physical server from scratch could resolve data structure and latency issues, such a solution requires substantial financial and technical investment. Thus, selecting a suitable deployment method should be based on user needs, technical capacity, and long-term maintenance feasibility.

5.2. Indoor Air Quality Index Model

In this case, the process utilized to determine these sub-indices demonstrates the application of an indoor air quality index model to the system. Each sub-index can be used independently or collectively. Users may choose to rely on the worst sub-index as an indicator of air quality or assign weights or importance values to each sub-index based on their specific requirements. For instance, spaces situated in relatively clean air environments may prioritize thermal comfort, while industrial settings may place greater emphasis on pollutant levels in unmanned areas.
While microsensors offer tremendous potential for advancing air quality monitoring, it is essential to recognize the inherent limitations and uncertainties associated with them. These challenges include sensor variability, environmental factors, sensor drift, limited sensor lifespan, and data interpretation complexities. To ensure reliable and accurate data, it is crucial to address these issues proactively.
Monitoring air quality poses several challenges that demand careful consideration. Sensor variability, resulting from differences in accuracy and sensitivity among sensor models, can introduce measurement discrepancies, underscoring the importance of meticulous sensor selection and validation [44]. Furthermore, environmental factors such as temperature, humidity, and pollutant exposure can lead to sensor drift and degradation over time, necessitating regular maintenance and calibration [45,46]. Moreover, the limited lifespan of sensors, typically around 1 year, highlights the need for planned replacements. Additionally, certain microsensors, especially those employing MOS technology, require significant heat-up time before delivering accurate measurements, with this duration ranging from hours to days. The interpretation of data itself presents complexity due to the reliance on algorithms and models that may not perfectly mirror real-world conditions and the intricate interactions between pollutants and environmental factors [47,48]. Lastly, the choice of sampling time can influence data representativeness, with shorter intervals potentially missing brief pollution spikes and longer intervals smoothing out fluctuations. Effectively addressing these challenges involves leveraging technical expertise, conducting careful sensor selection, prioritizing maintenance and calibration, and fostering a deep understanding of sensor limitations and environmental influences. In comparison to commercial instruments, microsensor devices offer a more cost-effective solution for air quality monitoring [49,50,51,52,53]. Nevertheless, akin to commercial counterparts found in both market and lab settings, microsensors entail expenses related to calibration and replacement over extended periods. Additionally, costs are intricately tied to scalability, as expanding the monitoring network to cover larger areas or additional pollutants may necessitate further investments. It is also crucial to communicate these limitations to ensure accurate data interpretation and informed decision-making.

5.3. Webserver

The current PHP/MySQL interface prioritizes functional minimalism over aesthetic refinement, as the study’s primary objective was validating sensor reliability and data pipeline feasibility. While the interface lacks advanced commercial features, it fulfills all critical research needs: real-time data visualization (Figure 2), time-range queries, and cross-device comparisons. The total platform cost was constrained to BlueHost basic hosting (USD 19.99/month) to align with the project’s hardware-focused budget. Future studies may integrate modular front-end frameworks (e.g., Vue.js) pending collaborator expertise [54].
To address the gateway security gap identified in [55], we propose a three-phase enhancement strategy: Beginning with Phase I, a lightweight API gateway (e.g., Eclipse Kura) will be deployed to decouple devices from the database, integrating OAuth2.0 authentication for device identity verification and SQL injection filtering to establish baseline security controls. Subsequently, Phase II will enhance cryptographic protections by embedding hardware security modules (HSMs) into Raspberry Pi gateways, ensuring secure key storage and management as mandated by [26,55]. Finally, Phase III will implement blockchain-powered audit trails via Hyperledger Fabric to create immutable transaction records, exceeding the tamper-evident logging requirements outlined in [53] while establishing end-to-end accountability across the gateway ecosystem. This phased approach systematically addresses authentication, encryption, and auditability gaps while aligning with evolving security standards.

5.4. Long-Term Deployment Considerations

While the proposed system demonstrates clear cost-effectiveness and operational reliability for short-term monitoring, its long-term scalability remains subject to several intrinsic challenges associated with low-cost sensor technologies. These challenges, if unaddressed, can compromise data accuracy, system uptime, and deployment viability over extended periods.
First, maintenance requirements differ substantially by sensor type. The integrated Sensirion SEN54 particulate matter module requires quarterly cleaning of the optical chamber to maintain its specified ±10% accuracy threshold under high-humidity conditions in accordance with manufacturer guidelines [28]. Without adherence to this maintenance schedule, particle build-up can degrade both laser and airflow consistency, undermining measurement fidelity. Second, electrochemical sensors used for nitrogen dioxide (NO2) and volatile organic compounds (VOCs) exhibit progressive baseline drift. Field studies indicate typical drift rates between 0.8 and 1.2 ppb/day in indoor environments [5], necessitating monthly recalibration using certified zero-air gas to prevent false-positive trends. This imposes a recurring operational burden, especially in large-scale networks. Third, although the SCD30 NDIR-based CO2 sensor demonstrates promising longevity, exceeding three years, as confirmed by longitudinal evaluations [42], its absolute accuracy still deteriorates at an average rate of 50 ppm per year without periodic span calibration. Manufacturer recommendations call for biennial recalibration to maintain data reliability within acceptable error bounds.
These limitations are consistent with broader systemic constraints of low-cost air quality monitoring. For example, Wang et al. [22] report that elevated relative humidity levels (≥70%) accelerate sensor degradation by up to 40% across most metal-oxide-semiconductor (MOS) gas sensors, posing a critical challenge for tropical or maritime deployments. Similarly, Demanega et al. [19] found that 82% of Arduino-compatible PM sensors experienced accuracy losses exceeding 25% within six months when deployed without maintenance protocols in place, particularly under variable thermodynamic conditions. To mitigate these degradation pathways, the current system incorporates two key strategies: (1) Automated baseline correction using nighttime data, leveraging periods of minimal human activity to recalibrate sensors dynamically and reduce the impact of sensor drift. (2) Modular sensor design, which allows for rapid component replacement without altering the system architecture or requiring specialized tools. Despite these mitigation efforts, further advancements are necessary to fully support long-term autonomous operations. Future work should explore the integration of self-cleaning mechanisms, such as ultrasonic vibration or hydrophobic coatings, for optical sensors, especially in dust-prone regions like Qatar, where particulate accumulation has been shown to triple maintenance frequency [7]. Additionally, real-time drift modeling using embedded machine learning could reduce calibration frequency while preserving data quality.
Overall, while low-cost platforms offer significant advantages in terms of affordability and scalability, sustaining high-fidelity environmental monitoring over long durations will require a combination of design innovation, predictive maintenance algorithms, and periodic field recalibration.

6. Conclusions

This study developed an Arduino-based IoT sensor system for automatic air quality monitoring, offering continuous measurement, visualization, and data analysis. The system is cost-effective and adaptable for both stationary installations and mobile deployments. Its modular design allows flexibility in sensor and component selection, enabling customization for specific environmental conditions. Integration with an online server and MySQL database supports remote access and long-term data storage, while real-time AQI computation and web-based visualization facilitate user-friendly interpretation of air quality. Field deployments at Concordia University and Qatar University demonstrated the system’s effectiveness, though certain sensors showed sensitivity to temperature and environmental factors, influencing accuracy. These findings suggest that while the system is robust, further refinement, particularly in sensor calibration and data processing, will improve reliability. Transitioning to cloud-based processing and enhanced calibration techniques is proposed for future work. Overall, the system presents a significant step toward accessible air quality monitoring, with clear potential for broader applications following additional field validation.

Supplementary Materials

The following supporting information can be downloaded at: https://www.mdpi.com/article/10.3390/atmos16050574/s1, Figure S1: View of 3D print of sensors; Figure S2: Pollutant data by date and time; Figure S3: Example of Web Page—Sensor Readings; Figure S4: Example of Database—Table List; Figure S5: Graphical depiction of real-time measurements of CO2, PM2.5, humidity, and temperature; Figure S6: NO2 at Concordia University for EV Building 6th Floor on Apr 11, 2023; Table S1: AQHI and VOC Index; Table S2: Air Parameters for Concordia SAE Office.

Author Contributions

Conceptualization, Z.W. and Z.C.; methodology, Z.C. and I.S.; software, Z.W.; validation, I.S.; writing—original draft preparation, Z.W.; writing—review and editing, Z.A. and F.H.; supervision, Z.C. and I.S. All authors have read and agreed to the published version of the manuscript.

Funding

This research work was conducted jointly by Concordia University and Qatar University under an international collaborative grant ID # IRCC-2023-152.

Institutional Review Board Statement

Not applicable.

Informed Consent Statement

Not applicable.

Data Availability Statement

The datasets generated during the current study are provided within the manuscript and Supplementary File.

Acknowledgments

We sincerely acknowledge all reviewers and editors for their valuable feedback, which has greatly contributed to the improvement of this paper.

Conflicts of Interest

The authors declare no conflicts of interest.

References

  1. Saini, J.; Dutta, M.; Marques, G. Indoor Air Pollution: A Comprehensive Review of Public Health Challenges and Prevention Policies. In Current Trends and Advances in Computer-Aided Intelligent Environmental Data Engineering; Elsevier: Amsterdam, The Netherlands, 2022. [Google Scholar] [CrossRef]
  2. Kumar Sai, K.B.; Mukherjee, S.; Parveen Sultana, H. Low Cost IoT Based Air Quality Monitoring Setup Using Arduino and MQ Series Sensors with Dataset Analysis. Procedia Comput. Sci. 2019, 165, 322–327. [Google Scholar] [CrossRef]
  3. Barkjohn, K.K.; Gantt, B.; Clements, A.L. Development and application of a United States-wide correction for PM2.5 data collected with the PurpleAir sensor. Atmos. Meas. Tech. 2021, 14, 4617–4637. [Google Scholar] [CrossRef]
  4. Awadh, S.M. Impact of North African Sand and Dust Storms on the Middle East Using Iraq as an Example: Causes, Sources, and Mitigation. Atmosphere 2023, 14, 180. [Google Scholar] [CrossRef]
  5. Shahid, I.; Shahzad, M.I.; Tutsak, E.; Mahfouz, M.M.K.; Al Adba, M.S.; Abbasi, S.A.; Rathore, H.A.; Asif, Z.; Chen, Z. Carbon Based Sensors for Air Quality Monitoring Networks; Middle East Perspective. Front. Chem. 2024, 12, 1391409. [Google Scholar] [CrossRef]
  6. Chirmata, A.; Leghrib, R.; Ichou, I.A. Implementation of the Air Quality Monitoring Network at Agadir City in Morocco. J. Environ. Prot. 2017, 8, 540–567. [Google Scholar] [CrossRef]
  7. Yaacoub, E.; Kadri, A.; Mushtaha, M.; Abu-Dayya, A. Air Quality Monitoring and Analysis in Qatar Using a Wireless Sensor Network Deployment. In Proceedings of the 2013 9th International Wireless Communications and Mobile Computing Conference, IWCMC 2013, Sardinia, Italy, 1–5 July 2013. [Google Scholar] [CrossRef]
  8. Raheja, G.; Nimo, J.; Appoh, E.K.; Essien, B.; Sunu, M.; Nyante, J.; Amegah, M.; Quansah, R.; Arku, R.E.; Penn, S.L.; et al. Low-Cost sensor performance intercomparison, correction factor development, and 2+ years of ambient PM2.5 monitoring in Accra, Ghana. Environ. Sci. Technol. 2023, 57, 10708–10720. [Google Scholar] [CrossRef]
  9. Omidvarborna, H.; Baawain, M.; Al-Mamun, A. Ambient Air Quality and Exposure Assessment Study of the Gulf Cooperation Council Countries: A Critical Review. Sci. Total Environ. 2018, 636, 437–448. [Google Scholar] [CrossRef]
  10. Kalia, P.; Ansari, M.A. IOT Based Air Quality and Particulate Matter Concentration Monitoring System. Mater. Today Proc. 2020, 32, 468–475. [Google Scholar] [CrossRef]
  11. Abdel-Salam, M.M.M. Investigation of Indoor Air Quality at Urban Schools in Qatar. Indoor Built Environ. 2019, 28, 278–288. [Google Scholar] [CrossRef]
  12. Farag, E.; Nour, M.; Islam, M.M.; Mustafa, A.; Khalid, M.; Sikkema, R.S.; Alhajri, F.; Bu-Sayaa, A.; Haroun, M.; Van Kerkhove, M.D.; et al. Qatar Experience on One Health Approach for Middle-East Respiratory Syndrome Coronavirus, 2012–2017: A Viewpoint. One Health 2019, 7, 100090. [Google Scholar] [CrossRef]
  13. Yang, S.; Liu, Y.; Wu, N.; Zhang, Y.; Svoronos, S.; Pullammanappallil, P. Low-Cost, Arduino-Based, Portable Device for Measurement of Methane Composition in Biogas. Renew. Energy 2019, 138, 224–229. [Google Scholar] [CrossRef]
  14. Diviacco, P.; Iurcev, M.; Carbajales, R.J.; Potleca, N.; Viola, A.; Burca, M.; Busato, A. Monitoring air quality in urban areas using a Vehicle Sensor Network (VSN) crowdsensing paradigm. Remote Sens. 2022, 14, 5576. [Google Scholar] [CrossRef]
  15. Asif, Z.; Chen, Z.; Haghighat, F.; Nasiri, F.; Dong, J. Estimation of Anthropogenic VOCs Emission Based on Volatile Chemical Products: A Canadian Perspective. Environ. Manag. 2023, 71, 685–703. [Google Scholar] [CrossRef] [PubMed]
  16. Pourkiaei, M.; Romain, A.C. Scoping Review of Indoor Air Quality Indexes: Characterization and Applications. J. Build. Eng. 2023, 75, 106703. [Google Scholar] [CrossRef]
  17. Saravanan, D.; Kumar, K.S. IoT Based Improved Air Quality Index Prediction Using Hybrid FA-ANN-ARMA Model. Mater. Today Proc. 2022, 56, 1809–1819. [Google Scholar] [CrossRef]
  18. Sun, C.; Huang, X.; Zhang, J.; Lu, R.; Su, C.; Huang, C. The New Model for Evaluating Indoor Air Quality Based on Childhood Allergic and Respiratory Diseases in Shanghai. Build. Environ. 2022, 207, 108410. [Google Scholar] [CrossRef]
  19. Demanega, I.; Mujan, I.; Singer, B.C.; Anđelković, A.S.; Babich, F.; Licina, D. Performance assessment of low-cost environmental monitors and single sensors under variable indoor air quality and thermal conditions. Build. Environ. 2020, 187, 107415. [Google Scholar] [CrossRef]
  20. Montrucchio, B.; Giusto, E.; Vakili, M.G.; Quer, S.; Ferrero, R.; Fornaro, C. A Densely-deployed, high sampling rate, Open-Source Air Pollution Monitoring WSN. IEEE Trans. Veh. Technol. 2020, 69, 15786–15799. [Google Scholar] [CrossRef]
  21. Chojer, H.; Branco, P.T.B.S.; Martins, F.G.; Alvim-Ferraz, M.C.M.; Sousa, S.I.V. Development of low-cost indoor air quality monitoring devices: Recent advancements. Sci. Total Environ. 2020, 727, 138385. [Google Scholar] [CrossRef]
  22. Wang, J.; Viciano-Tudela, S.; Parra, L.; Lacuesta, R.; Lloret, J. Evaluation of suitability of Low-Cost gas sensors for monitoring indoor and outdoor urban areas. IEEE Sens. J. 2023, 23, 20968–20975. [Google Scholar] [CrossRef]
  23. Liang, L. Calibrating low-cost sensors for ambient air monitoring: Techniques, trends, and challenges. Environ. Res. 2021, 197, 111163. [Google Scholar] [CrossRef] [PubMed]
  24. Paithankar, D.N.; Pabale, A.R.; Kolhe, R.V.; William, P.; Yawalkar, P.M. Framework for implementing air quality monitoring system using LPWA-based IoT technique. Meas. Sens. 2023, 26, 100709. [Google Scholar] [CrossRef]
  25. Arduino. Arduino Software Tools. Available online: https://www.arduino.cc (accessed on 10 February 2025).
  26. Raspberry Pi Foundation. Raspberry Pi Resources. Available online: https://www.raspberrypi.com (accessed on 12 April 2025).
  27. Oracle Corporation. MySQL Database Software. Available online: https://www.mysql.com (accessed on 16 February 2025).
  28. Sensirion Datasheet: Sensirion SCD30 Sensor Module. Datasheet. 2022. Available online: https://sensirion.com/media/documents/4EAF6AF8/61652C3C/Sensirion_CO2_Sensors_SCD30_Datasheet.pdf (accessed on 15 January 2025).
  29. Python Software Foundation. Python Language Reference, Version 3.x. Available online: https://www.python.org (accessed on 22 December 2024).
  30. Bluehost for WordPress Hosting, from WordPress Experts. Best WordPress Hosting: Recommended by Wordpress. 2024. Available online: https://www.bluehost.ca/wordpress/wordpress-hosting (accessed on 17 March 2025).
  31. Rastogi, K.; Lohani, D. Context-Aware IoT-Enabled Framework to Analyse and Predict Indoor Air Quality. Intell. Syst. Appl. 2022, 16, 200132. [Google Scholar] [CrossRef]
  32. ANSI/ASHRAE 55-2023; Thermal Environmental Conditions for Human Occupancy—ANSI Blog. American National Standards Institute (ANSI): Washington, DC, USA, 2024. Available online: https://blog.ansi.org/ansi-ashrae-55-2023-thermal-environmental-conditions/ (accessed on 13 December 2024).
  33. ASHRAE ANSI/ASHRAE Standard 62.1-2022; ASHRAE Standard. Acceptable Ventilation Indoor Air Quality. ANSI: Washington, DC, USA, 2022.
  34. Government of Canada. Air Quality Health Index (AQHI). Available online: https://www.canada.ca/en/environment-climate-change/services/air-quality-health-index.html (accessed on 9 April 2025).
  35. World Health Organization. WHO Guidelines for Indoor Air Quality: Selected Pollutants. Available online: https://www.who.int/publications/i/item/9789289002134 (accessed on 24 March 2025).
  36. Persily, A.; de Jonge, L. Carbon Dioxide Generation Rates for Building Occupants. Indoor Air 2017, 27, 868–879. [Google Scholar] [CrossRef]
  37. Government of Canada. National Pollutant Release Inventory Data Search. 2022. Available online: https://pollution-waste.canada.ca/national-release-inventory/?fromYear=2020&toYear=2020&substance=14242&category=2&direction=ascending&order=NPRI_Id&filter=sarnia&length=10&page=1 (accessed on 21 September 2022).
  38. Tang, X.; Misztal, P.K.; Nazaroff, W.W.; Goldstein, A.H. Volatile Organic Compound Emissions from Humans Indoors. Environ. Sci. Technol. 2016, 50, 12686–12694. [Google Scholar] [CrossRef]
  39. Qian, H.; Miao, T.; Liu, L.; Zheng, X.; Luo, D.; Li, Y. Indoor Transmission of SARS-CoV-2. Indoor Air 2020, 31, 639–645. [Google Scholar] [CrossRef]
  40. Asif, Z.; Chen, Z.; Stranges, S.; Zhao, X.; Sadiq, R.; Olea-Popelka, F.; Peng, C.; Haghighat, F.; Yu, T. Dynamics of SARS-CoV-2 Spreading under the Influence of Environmental Factors and Strategies to Tackle the Pandemic: A Systematic Review. Sustain. Cities Soc. 2022, 81, 103840. [Google Scholar] [CrossRef] [PubMed]
  41. Brown, S.L.; Goulsbra, C.S.; Evans, M.G.; Heath, T.; Shuttleworth, E. Low Cost CO2 Sensing: A Simple Microcontroller Approach with Calibration and Field Use. Hardw. X 2020, 8, e00136. [Google Scholar] [CrossRef]
  42. Pereira, P.F.; Ramos, N.M.M. Low-Cost Arduino-Based Temperature, Relative Humidity and CO2 Sensors—An Assessment of Their Suitability for Indoor Built Environments. J. Build. Eng. 2022, 60, 105151. [Google Scholar] [CrossRef]
  43. Hofman, J.; Nikolaou, M.; Shantharam, S.P.; Stroobants, C.; Weijs, S.; La Manna, V.P. Distant calibration of low-cost PM and NO2 sensors; evidence from multiple sensor testbeds. Atmos. Pollut. Res. 2021, 13, 101246. [Google Scholar] [CrossRef]
  44. Chojer, H.; Branco, P.T.B.S.; Martins, F.G.; Alvim-Ferraz, M.C.M.; Sousa, S.I.V. Can data reliability of low-cost sensor devices for indoor air particulate matter monitoring be improved?—An approach using machine learning. Atmos. Environ. 2022, 286, 119251. [Google Scholar] [CrossRef]
  45. Parashar, V.; Parashar, A. Design and Development of Copper Based Low-Cost Sensor for Monitoring Moisture in the Fields. Mater. Today Proc. 2020, 47, 7115–7120. [Google Scholar] [CrossRef]
  46. Ferrer-Cid, P.; Barcelo-Ordinas, J.M.; Garcia-Vidal, J. Data Reconstruction Applications for IoT Air Pollution Sensor Networks Using Graph Signal Processing. J. Netw. Comput. Appl. 2022, 205, 103434. [Google Scholar] [CrossRef]
  47. Castells-Quintana, D.; Dienesch, E.; Krause, M. Air pollution in an urban world: A global view on density, cities and emissions. Ecol. Econ. 2021, 189, 107153. [Google Scholar] [CrossRef]
  48. Searcy, R.T.; Boehm, A.B. A Day at the Beach: Enabling Coastal Water Quality Prediction with High-Frequency Sampling and Data-Driven Models. Environ. Sci. Technol. 2021, 55, 1908–1918. [Google Scholar] [CrossRef]
  49. Baba-Cheikh, Z.; El-Boussaidi, G.; Gascon-Samson, J.; Mili, H.; Guéhéneuc, Y.G. A preliminary study of open-source IoT development frameworks. In Proceedings of the IEEE/ACM 42nd International Conference on Software Engineering Workshops, Seoul, Republic of Korea, 27 June–19 July 2020; pp. 679–686. [Google Scholar] [CrossRef]
  50. Silva, E.M.; Jardim-Goncalves, R. IoT Ecosystems Design: A multimethod, multicriteria assessment methodology. IEEE Internet Things J. 2020, 7, 10150–10159. [Google Scholar] [CrossRef]
  51. Silva, C.; Cunha, V.A.; Barraca, J.P.; Aguiar, R.L. Analysis of the cryptographic algorithms in IoT communications. Inf. Syst. Front. 2023, 26, 1243–1260. [Google Scholar] [CrossRef]
  52. Air Lins, F.A.; Vieira, M. Security Requirements and Solutions for IoT gateways: A Comprehensive study. IEEE Internet Things J. 2020, 8, 8667–8679. [Google Scholar] [CrossRef]
  53. Fagan, M.; Megas, K.N.; Scarfone, K.; Smith, M. IoT Device Cybersecurity Capability Core Baseline; NIST: Gaithersburg, MD, USA, 2020. [Google Scholar] [CrossRef]
  54. Buelvas, J.; Múnera, D.; Tobón, D.P.V.; Aguirre, J.; Gaviria, N. Data Quality in IoT-Based Air Quality Monitoring Systems: A Systematic Mapping Study. Water Air Soil Pollut. 2023, 234, 248. [Google Scholar] [CrossRef]
  55. Das, P.; Ghosh, S.; Chatterjee, S.; De, S. A low-cost outdoor air pollution monitoring device with power-controlled Built-In PM sensor. IEEE Sens. J. 2022, 22, 13682–13695. [Google Scholar] [CrossRef]
Figure 1. Flowchart of the Arduino Wi-Fi-based indoor air quality monitoring system.
Atmosphere 16 00574 g001
Figure 2. (a) Database and tables (IAQM1) (left); (b) user interface and web page (right).
Atmosphere 16 00574 g002
Figure 3. Indoor air quality index model based on three sub-indices that depict thermal comfort, ventilation rate, and concentration of pollutants.
Atmosphere 16 00574 g003
Figure 4. Shows an indoor installation of air quality monitoring sensors at Concordia University.
Atmosphere 16 00574 g004
Figure 5. CO2 readings recorded at Concordia University: (a) Case 1: Guy Street; (b) Case 2: EV Building, Floor 9 Corridor; (c) Case 3: Le 2100 Maisonneuve, Apartment.
Atmosphere 16 00574 g005aAtmosphere 16 00574 g005b
Figure 6. PM2.5 case readings recorded: (a) Concordia University at the EV building, EV15.119; (b) Le 2100 Maisonneuve Apartment.
Atmosphere 16 00574 g006
Figure 7. VOC recorded at Concordia University at the intersection outside the GM building at different times: (a) Case 1-1; (b) Case 1-2. VOC recorded at the engineering building, EV 6th floor: (c) Case 2-1; (d) Case 2-2.
Atmosphere 16 00574 g007
Figure 8. Data of (a) humidity and (b) temperature concerning time.
Atmosphere 16 00574 g008
Figure 9. Monitoring stations installed at Qatar University locations: (Left) main entrance of the campus; (Right) café/dining area of the campus.
Atmosphere 16 00574 g009
Figure 10. Pollutants and temperature recorded at three locations in Qatar University on 10 June 2023: (a) CO2; (b) PM2.5; (c) NO2; (d) VOC; (e)T; (f) RH.
Atmosphere 16 00574 g010
Table 1. List of sensor modules to monitor the air quality parameters at specific ranges.
Sensor ModuleMeasured ParameterDetection RangeAccuracyResolutionResponse Time (T90)
SCD30CO20–40,000 ppm±(30 ppm + 3% of reading)1 ppm<20 s
Temperature−40–70 °C±(0.4 °C)0.1 °C<20 s
Relative Humidity0–100% RH±(3% RH)0.1% RH<20 s
SEN54PM2.50–1000 μg/m3±10 μg/m3 or ±10% (whichever greater)1 μg/m3<15 s
Temperature−40–85 °C±0.8 °C0.1 °C~10 s
Relative Humidity0–100% RH±4.5% RH0.1% RH~8 s
Multichannel V2 (SPEC Sensors)NO2100–10,000 ppb±(15–20%) typical (with calibration)~10 ppb~30–60 s
CO5–5000 ppm±(15%) typical (with calibration)~5 ppm~30–60 s
TVOC (MOX-based)10–20,000 ppbSensor-specific (qualitative trends)~10–50 ppb~30–60 s
Table 2. ASHRAE thermal comfort index [32].
PPDCategory
100–75Satisfactory
75–50Moderate
50–25Poor
25–10Very Poor
10–0Severe
Table 3. ASHRAE VR category [33].
RangeVR Category
>15Satisfactory
13–15Moderate
11–13Poor
9–11Very Poor
<9Severe
Table 4. Descriptive statistics measurements of air pollutants and environmental conditions recorded at three locations at Qatar University.
ParametersMajor Statistical DifferenceMaximum Statistical DifferenceCorrelation Coefficient
CO20.45% to 3.81%4.15%0.9711
PM2.51.67% to 15%18%0.9324
NO20.45% to 7.81%15%0.6979
VOCS1.47% to 14.5%20%0.6145
Table 5. Parameters used to discuss the sub-index of thermal comfort.
M W f F c l T c l T r f c l h c T a P
1 met0 met0.20.6123231.78691 W/(m2K)230.7478
Table 6. Indoor air quality index category.
CategoryPPDVRPollutants (AQHI)
Satisfactory100–75>151–2
Moderate75–5013–152–5
Poor50–2511–135–7
Very Poor25–109–117–10
Severe10–0<9Above 10
Table 7. Salient features of performance measurements for each sensor and parameters.
ParameterSensorPerformance
CO2SCD30While the SCD30 overestimated CO2 by 6.1% at >700 ppm (Case 3), this is a significant observation in contrast to the MQ-135’s 15–20% error reported in [14]. The correlation coefficient is close to 1. A new sensor may have a large difference, but it can be calibrated by mitigating the difference simply. However, the difference may increase when the CO2 level increases after the CO2 level reaches 700 ppm. This can be modified by a calibration code set with several stages with several equations.
PM2.5SEN54PM2.5 from SEN54 is almost the same as the Air Detector sensor. The correlation coefficient is close to 1. After verification, the calibration of the sensor is simple.
HumiditySEN54Humidity difference is less than 5%.
TemperatureSEN54Temperature difference is less than 2 degrees.
NO2GM-102BThe Multichannel sensor gives better performance in indoor areas. At fixed locations, readings are close to commercial instruments, with most of the difference between 10% and 20%. The sensor is strongly influenced by temperature. It takes more than 2 days for the first setting, and every time, it needs a long-time heat-up process, which may take 2 to 6 h until it obtains a stable reading. The potential reason is that most of the gas sensors are specified only for a certain temperature. Further improvements, like a temperature-control module only for this sensor, may be tested and validated.
VOCGM-502B
Disclaimer/Publisher’s Note: The statements, opinions and data contained in all publications are solely those of the individual author(s) and contributor(s) and not of MDPI and/or the editor(s). MDPI and/or the editor(s) disclaim responsibility for any injury to people or property resulting from any ideas, methods, instructions or products referred to in the content.