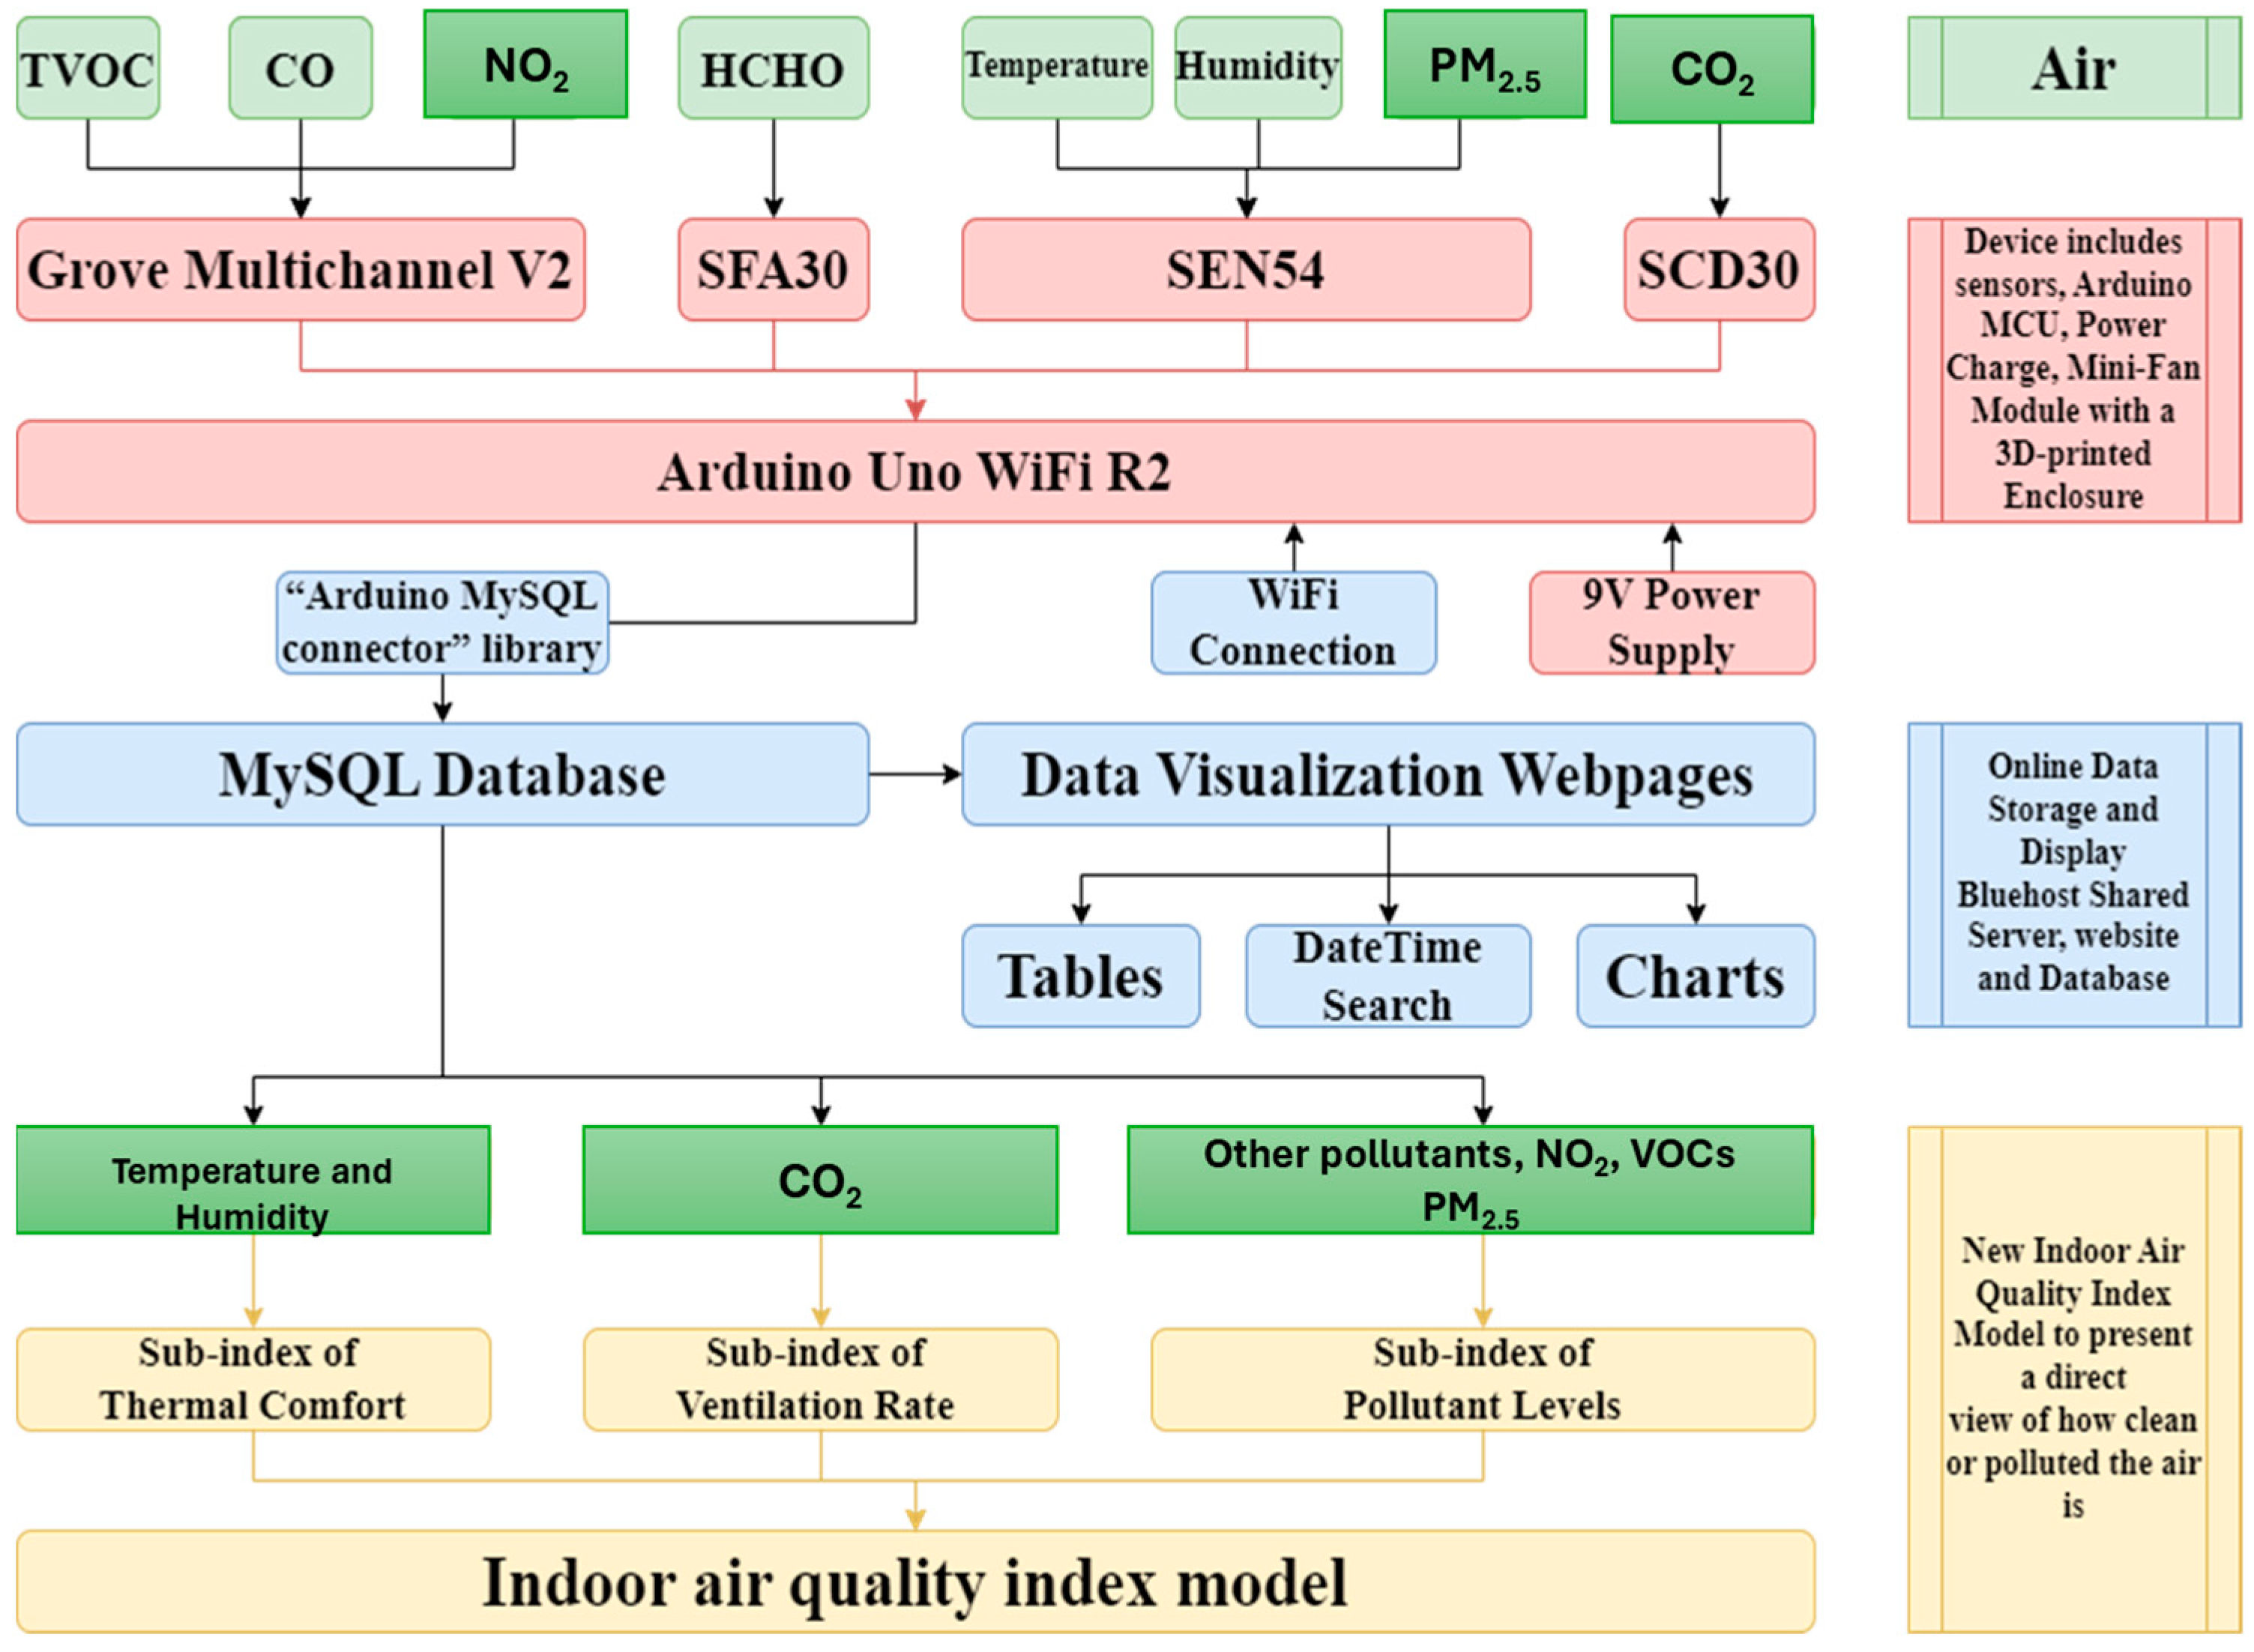
The system comprises compact, remotely managed sensor units suitable for both fixed and mobile deployments. These devices collect air quality data and transmit them wirelessly using either Arduino Wi-Fi for indoor scenarios [
25] or Raspberry Pi 4 gateways [
26] for outdoor environments to a MySQL database [
27] hosted on a secure web server. Data are visualized in real-time through PHP-based dashboards, enabling users to interpret readings in table or chart form and compute an air quality index (AQI). At its core, the system employs Arduino microcontroller units (MCUs) for sensor data acquisition, local processing, and transmission, as shown in
Figure 1. A modular sensor suite includes the SCD30 (CO
2), SEN54 (PM
2.5, temperature, humidity) (Manufacturer: Manufacturer: Sensirion AG; Stäfa, Switzerland) [
28], and a multichannel gas module (NO
2, VOCs) (Manufacturer: Hanwei Electronics Co., Ltd, Zhengzhou, China). Components are enclosed in custom 3D-printed housings with airflow-optimized designs (
Supplementary Figure S1).
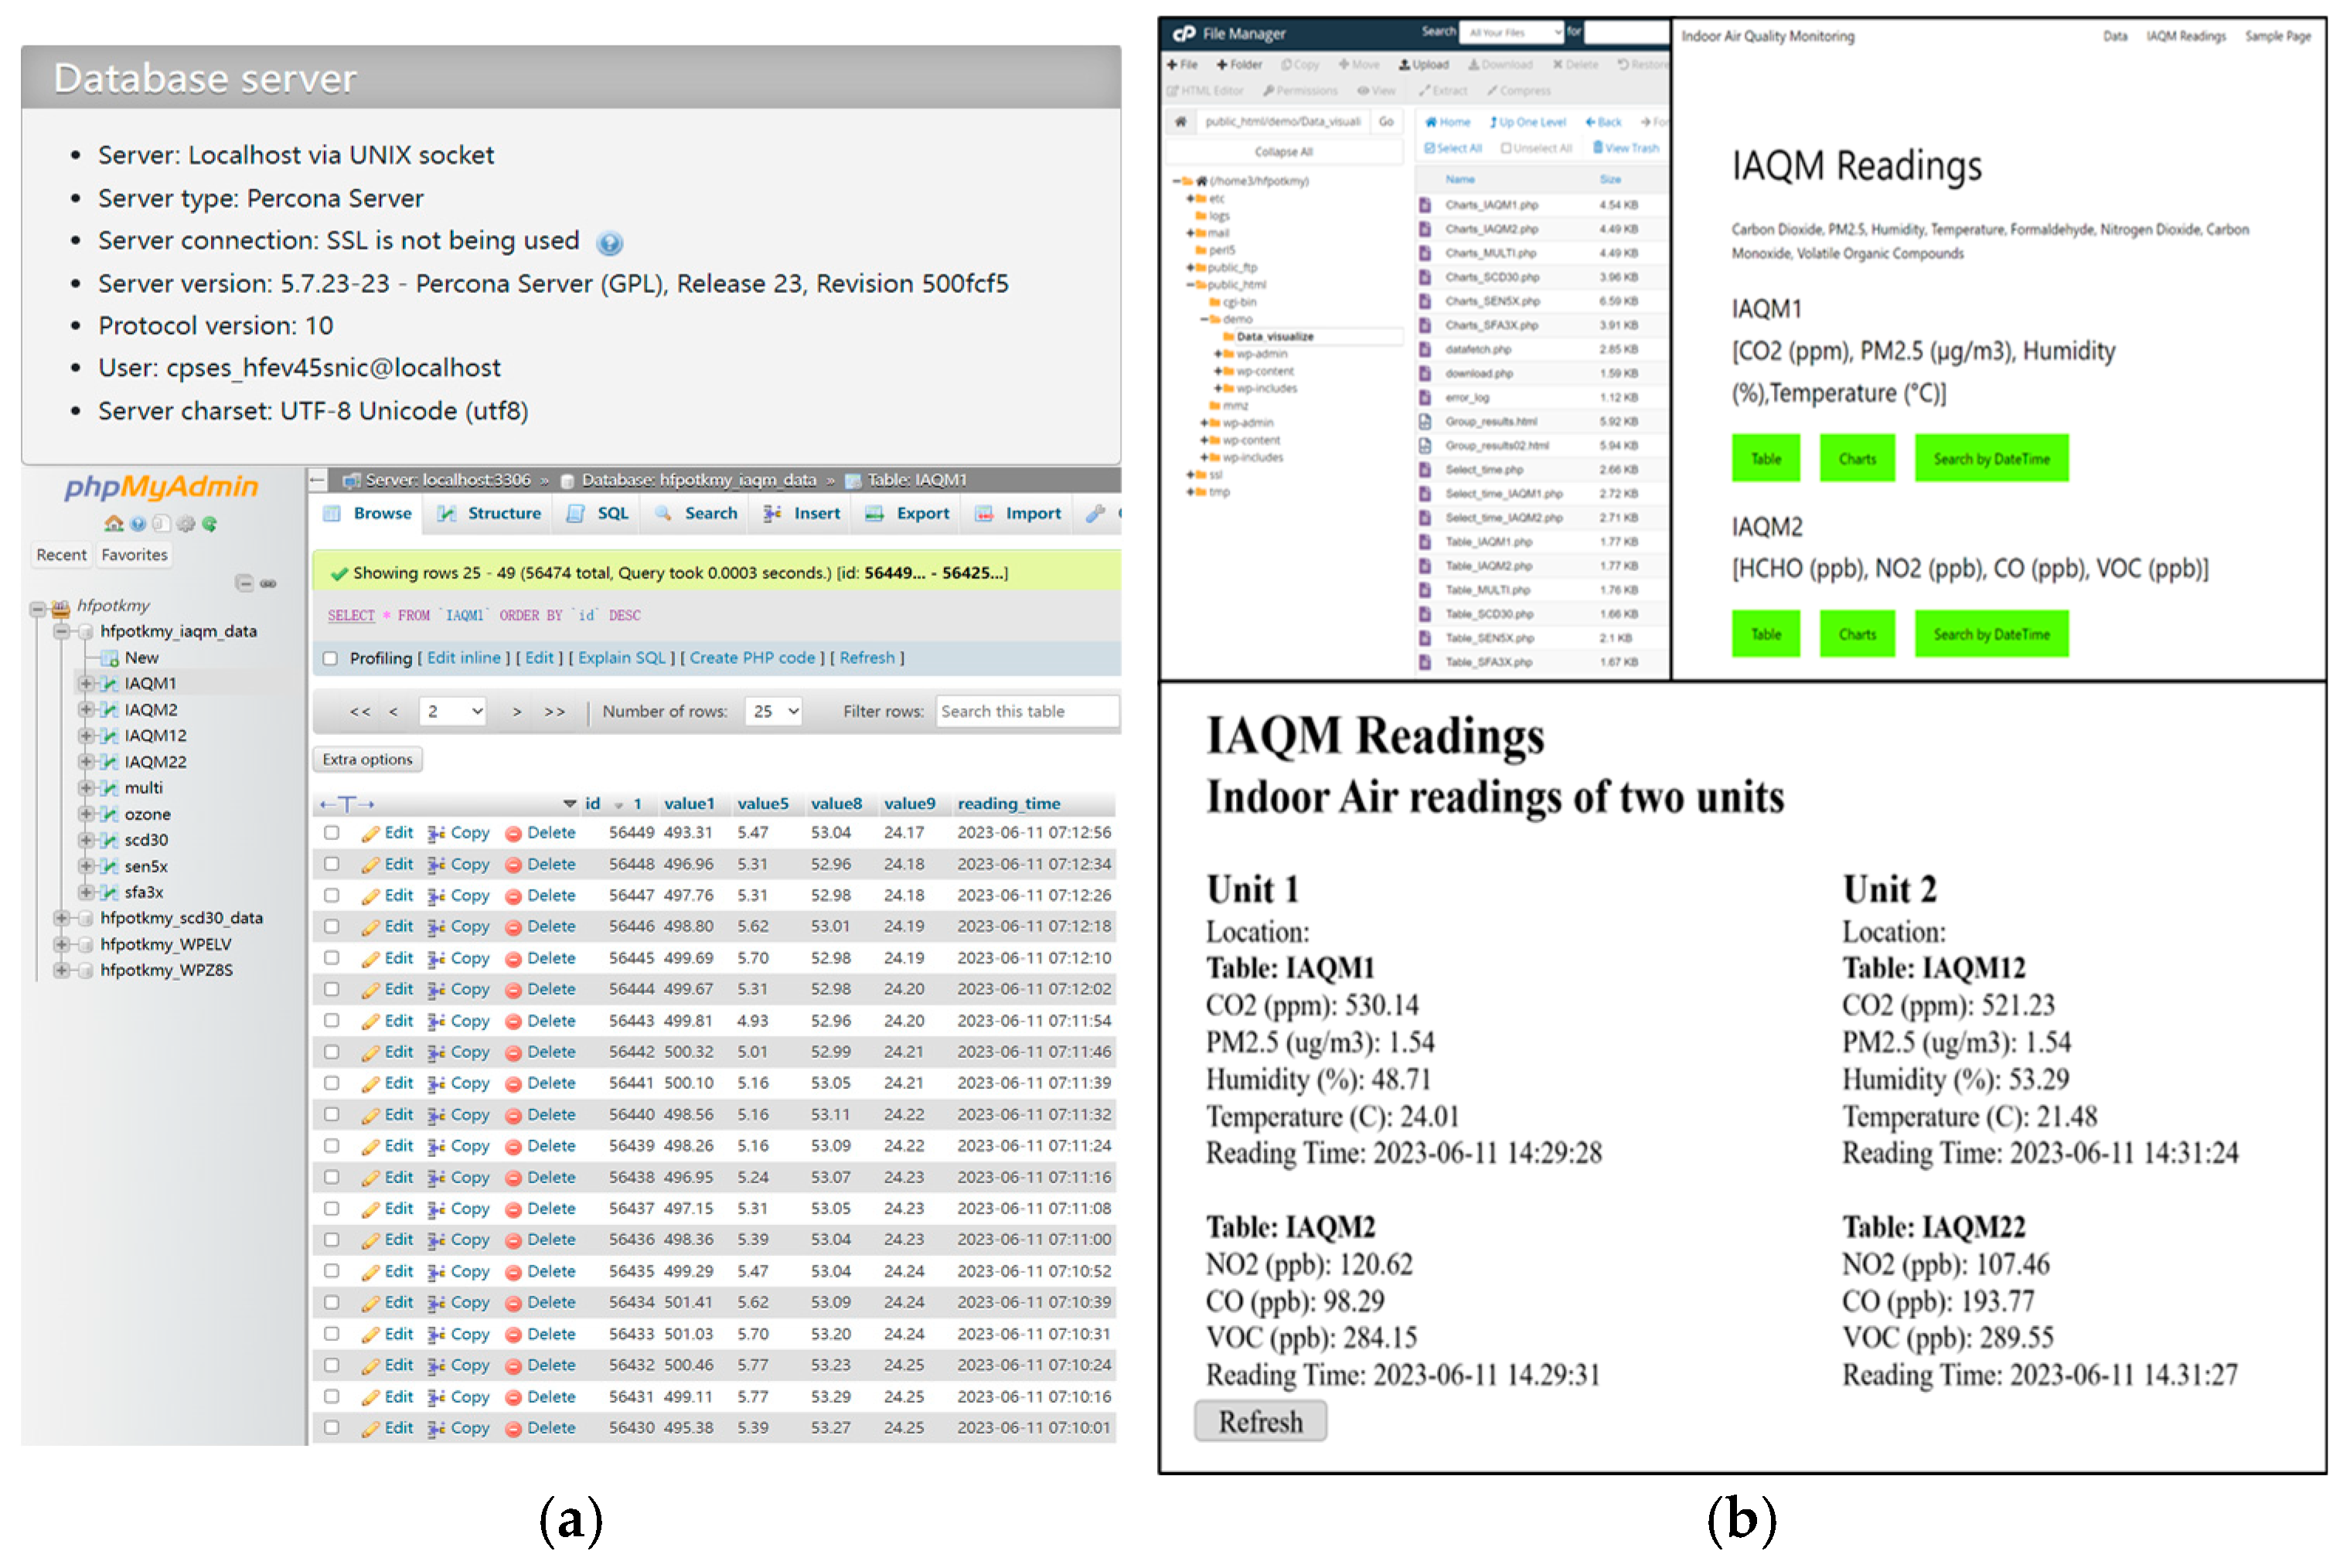
For outdoor deployments, the Raspberry Pi 4 serves as both a video processor and communication gateway, supporting adaptive transmission via Wi-Fi (802.11ac), Bluetooth, and USB-based cellular, offering significantly improved resilience during adverse conditions like sandstorms. Indoors, Arduino Uno Wi-Fi Rev2 is used as a standalone wireless microcontroller. All collected data are transmitted to a shared online MySQL server using the “Arduino MySQL Connector” library. The system architecture includes a secure database design with timestamped records and structured tables (e.g., IAQM1 and IAQM2). Timezone conversions are applied for end-user consistency (
Figure 2). The platform ensures data integrity and security using multi-layered encryption: TLS 1.2+ for server-side communication, SSL certificate pinning for Arduino devices, and TLS 1.3 for Raspberry Pi clients, aligned with IoT best practices and validated through monthly security audits.
3.1. Device Features
Each unit is designed to be modular and customizable, allowing sensor and connectivity modules to be tailored to the deployment environment (e.g., office rooms, buses, metro systems). Raspberry Pi [
26] units support full remote management via Python scripts [
29] for calibration and diagnostics. Arduino-based units, while simpler, serve effectively as data transmitters. A central web server hosts real-time data dashboards, user interfaces, and backend PHP scripts for data visualization, filtering, and AQI computation. Users can explore live data, perform historical queries, and compare readings across multiple deployed devices. Visualization options include time-series charts, heat maps, and summary tables (
Supplementary Figures S2–S4). Additional features, such as alert notifications and multi-device comparison views, are supported.
3.1.1. Sensors and MCUs
Sensors are fundamental components in Arduino-based IoT air quality monitoring systems. The SCD30 sensor is widely used for indoor CO
2 monitoring due to its broad detection range and high accuracy. The SEN54 all-in-one sensor supports particulate matter (PM), temperature, and humidity measurements, making it suitable for indoor and outdoor air quality assessments. Future iterations could integrate power-optimized PM sensors [
28,
30] that reduce energy consumption by 94% while maintaining sub-1 μg/m
3 RMSE, which is particularly beneficial for solar-powered deployments. For detecting harmful gases such as NO
2, CO, and total volatile organic compounds (TVOCs), the Multichannel V2 sensor is utilized, particularly for monitoring emissions in industrial and enclosed environments.
In addition to the primary sensors listed in
Table 1, other specialized modules are also integrated for comprehensive monitoring. For instance, the SFA30 sensor [
28] detects formaldehyde (HCHO) concentrations, which is critical for ensuring indoor air safety. The MQ131 low-concentration ozone sensor provides sensitive detection capabilities for ozone, supporting precise environmental monitoring applications. Together, these sensors enable a robust framework for collecting detailed air quality data, which is essential for evaluating environmental health in both residential and occupational settings [
31].
3.1.2. Microcontroller Unit (MCU)
Arduino-based microcontrollers serve as the core of the system, managing data collection and transmission. Their responsibilities include (1) receiving commands, (2) triggering sensor data acquisition, (3) processing and converting raw sensor outputs into pollutant levels, and (4) transmitting the processed data via a wireless module to a remote database server.
The Arduino Uno R3 and Mega 2560 are widely adopted for prototyping, with the Mega offering enhanced memory and I/O capabilities. For wireless communication, the Arduino Uno Wi-Fi Rev2—featuring integrated Wi-Fi—is employed for indoor deployments. In outdoor scenarios, where more intensive data handling is needed, the Raspberry Pi 4 microcomputer is primarily for gateway functions in hybrid deployments. The Raspberry Pi provides higher computational power, multiple RAM options, and versatile connectivity features, making it suitable for complex and multi-sensor configurations.
3.1.3. Web Hosting Service
A well-regarded web hosting service is recognized for providing diverse services to individuals, offering dependable hosting solutions for their websites. With a user-friendly control panel and website builder, users can seamlessly manage their websites and establish a polished online presence. This service also offers robust capabilities for managing databases, enabling users to efficiently store and retrieve data [
23].
3.1.4. Database
The system employs the Arduino MySQL Connector library to facilitate direct communication between microcontroller units and a MySQL database via Wi-Fi. Sensor data are securely transmitted and stored in two main tables: “IAQM1” (recording CO
2, PM
2.5, humidity, and temperature (
Supplementary Figure S5) and “IAQM2” (recording CO, HCHO, NO
2, and VOCs), along with timestamps indicating when the data were received, as shown in
Figure 2.
Timestamps are stored based on the server’s time zone but adjusted in the user interface to reflect the local time accurately. The database is hosted on BlueHost [
30], offering an enterprise-grade environment with several layers of protection. These include TLS 1.2 encryption for remote connections, DDoS protection via Imunify360, brute-force defense mechanisms, and application-layer security measures such as least-privilege database access and IP whitelisting.
End-to-end encryption is implemented using a multi-tiered strategy. Arduino devices utilize SSL certificate pinning with a pre-shared DigiCert root certificate, ensuring secure MySQL connections within hardware constraints. Meanwhile, Raspberry Pi gateways apply TLS 1.3 encryption with ECDHE-ECDSA-AES256-GCM ciphers via Python’s SSL libraries, achieving perfect forward secrecy. Monthly SSL Labs audits are conducted to validate security performance and ensure ongoing protection of data integrity.
The current security design aligns with NIST IoT Device Cybersecurity Core Baseline [
27] in three aspects: (1) encrypted communications: TLS 1.3 for RPi and SSL certificate pinning for Arduino ensure end-to-end data confidentiality; (2) access control: MAC address whitelisting and write-only database accounts restrict unauthorized operations; (3) device identity: pre-shared credentials (username/password) authenticate each MCU before data submission. However, as highlighted in [
28,
29,
30], direct database access remains a residual risk despite these measures, primarily due to the absence of an intermediate API gateway for request validation and rate limiting.
3.1.5. Data Visualization
The web server supports real-time data visualization through dynamically generated PHP pages. Sensor readings are displayed in tables and time-series charts, enabling users to monitor trends, compare multiple devices across locations, and filter results by date or time. Users can query specific data ranges, with results shown in a structured table format (
Figures S2–S4).
The PHP files serve dual purposes: they present interactive data views to users and support backend data processing for other scripts. These web pages are accessible via desktop and mobile browsers, offering a user-friendly and responsive experience. When multiple sensor units are deployed, the system allows simultaneous monitoring and comparison across devices, supporting large-scale environmental assessments. Additional features, such as email alerts and search functions, further enhance user interaction.
3.3. Device Validation Tests
Several tests were conducted to validate the functionality of sensors intended for use in a device. These sensors were designed to measure various air quality parameters, including NO
2, PM
2.5, TVOC, CO, CO
2, temperature, and humidity. The reference instruments employed in this study, EVM-7 (TSI), Tiger XT (Ion Science), and Aeroqual Series 500, were selected for their adherence to internationally recognized performance standards and their calibration traceability to certified protocols. The calibration strategy combines field adjustments with principles from cloud-based distant calibration [
24,
31], which has demonstrated EU Class 1 accuracy for PM/NO
2 sensors through automated gain and offset corrections.
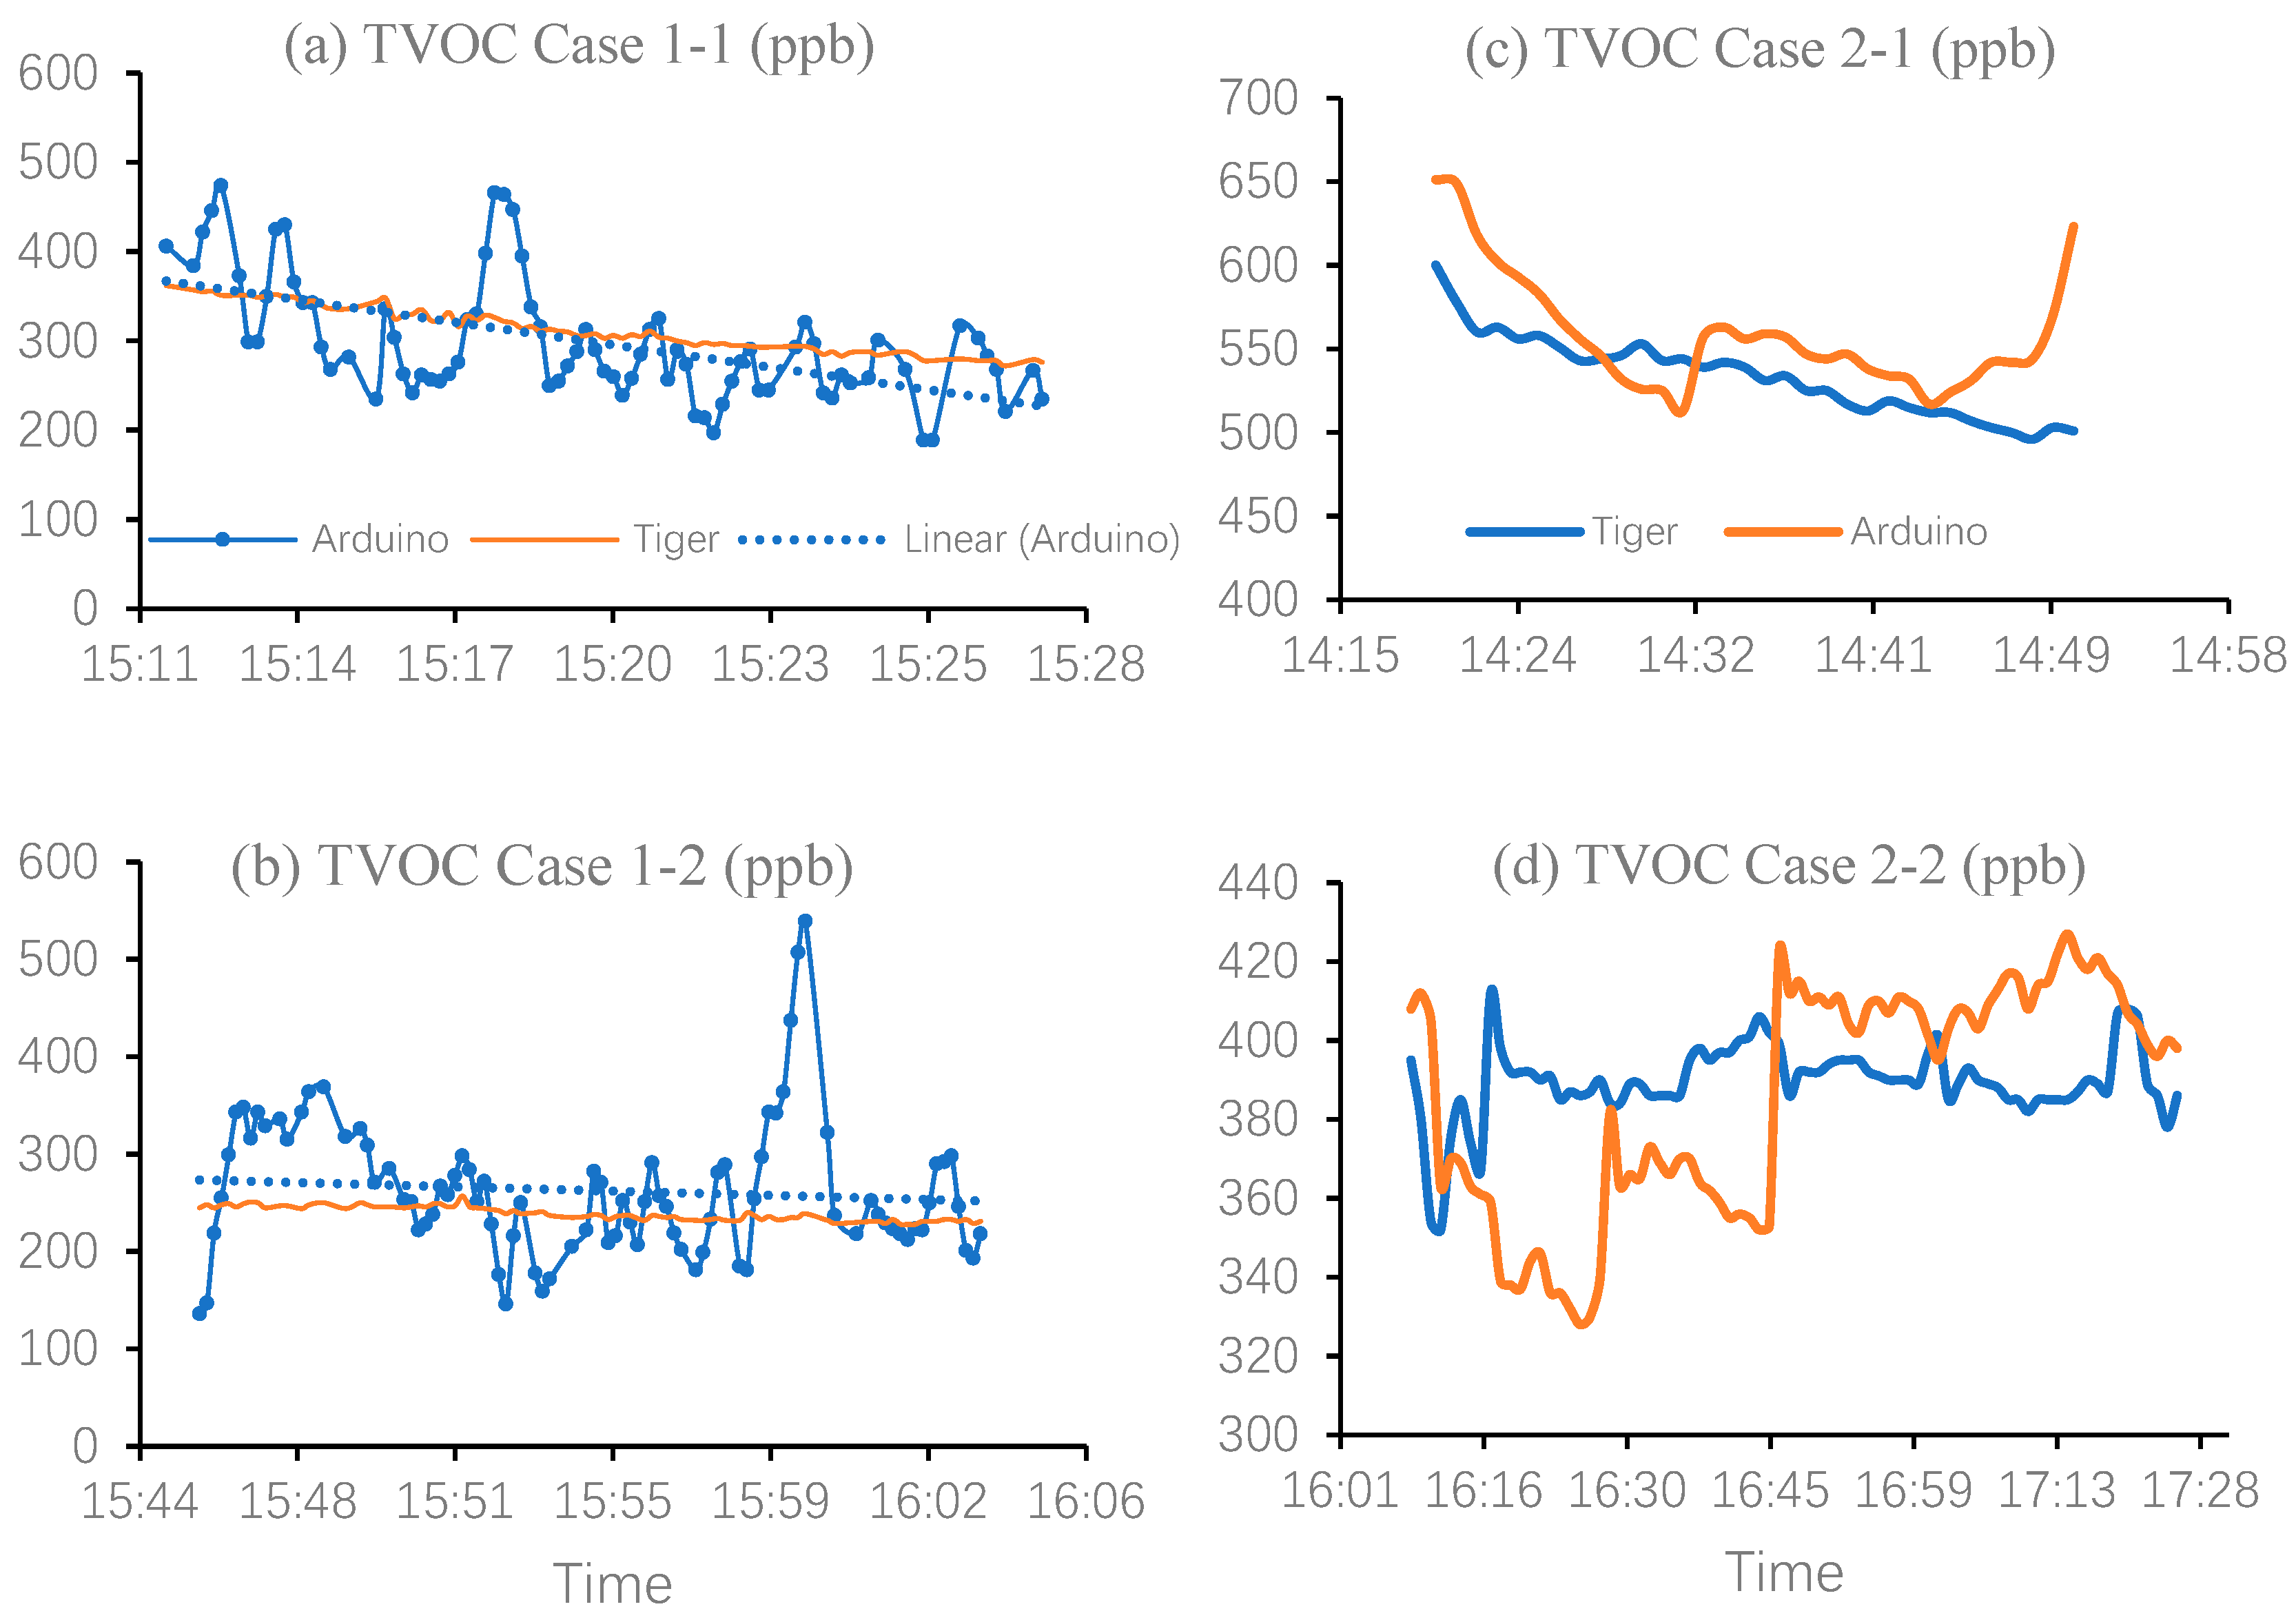
The validation process involved conducting tests in different environments, such as indoor and outdoor settings. For most parameters, direct measurements of indoor and outdoor concentrations were taken. However, since the concentrations of certain pollutants are typically too low under normal circumstances or fall within safe levels, additional tests were performed in specialized environments. For example, measurements were taken near traffic to capture higher levels of air pollutants, CO readings were obtained in an underground garage to obtain elevated CO values, and PM2.5 measurements were conducted using lighting candles to increase PM2.5 concentrations. Each parameter was tested individually to compare the results with those obtained from commercial-grade instruments. This process helped evaluate the performance of different sensor modules available for each parameter.
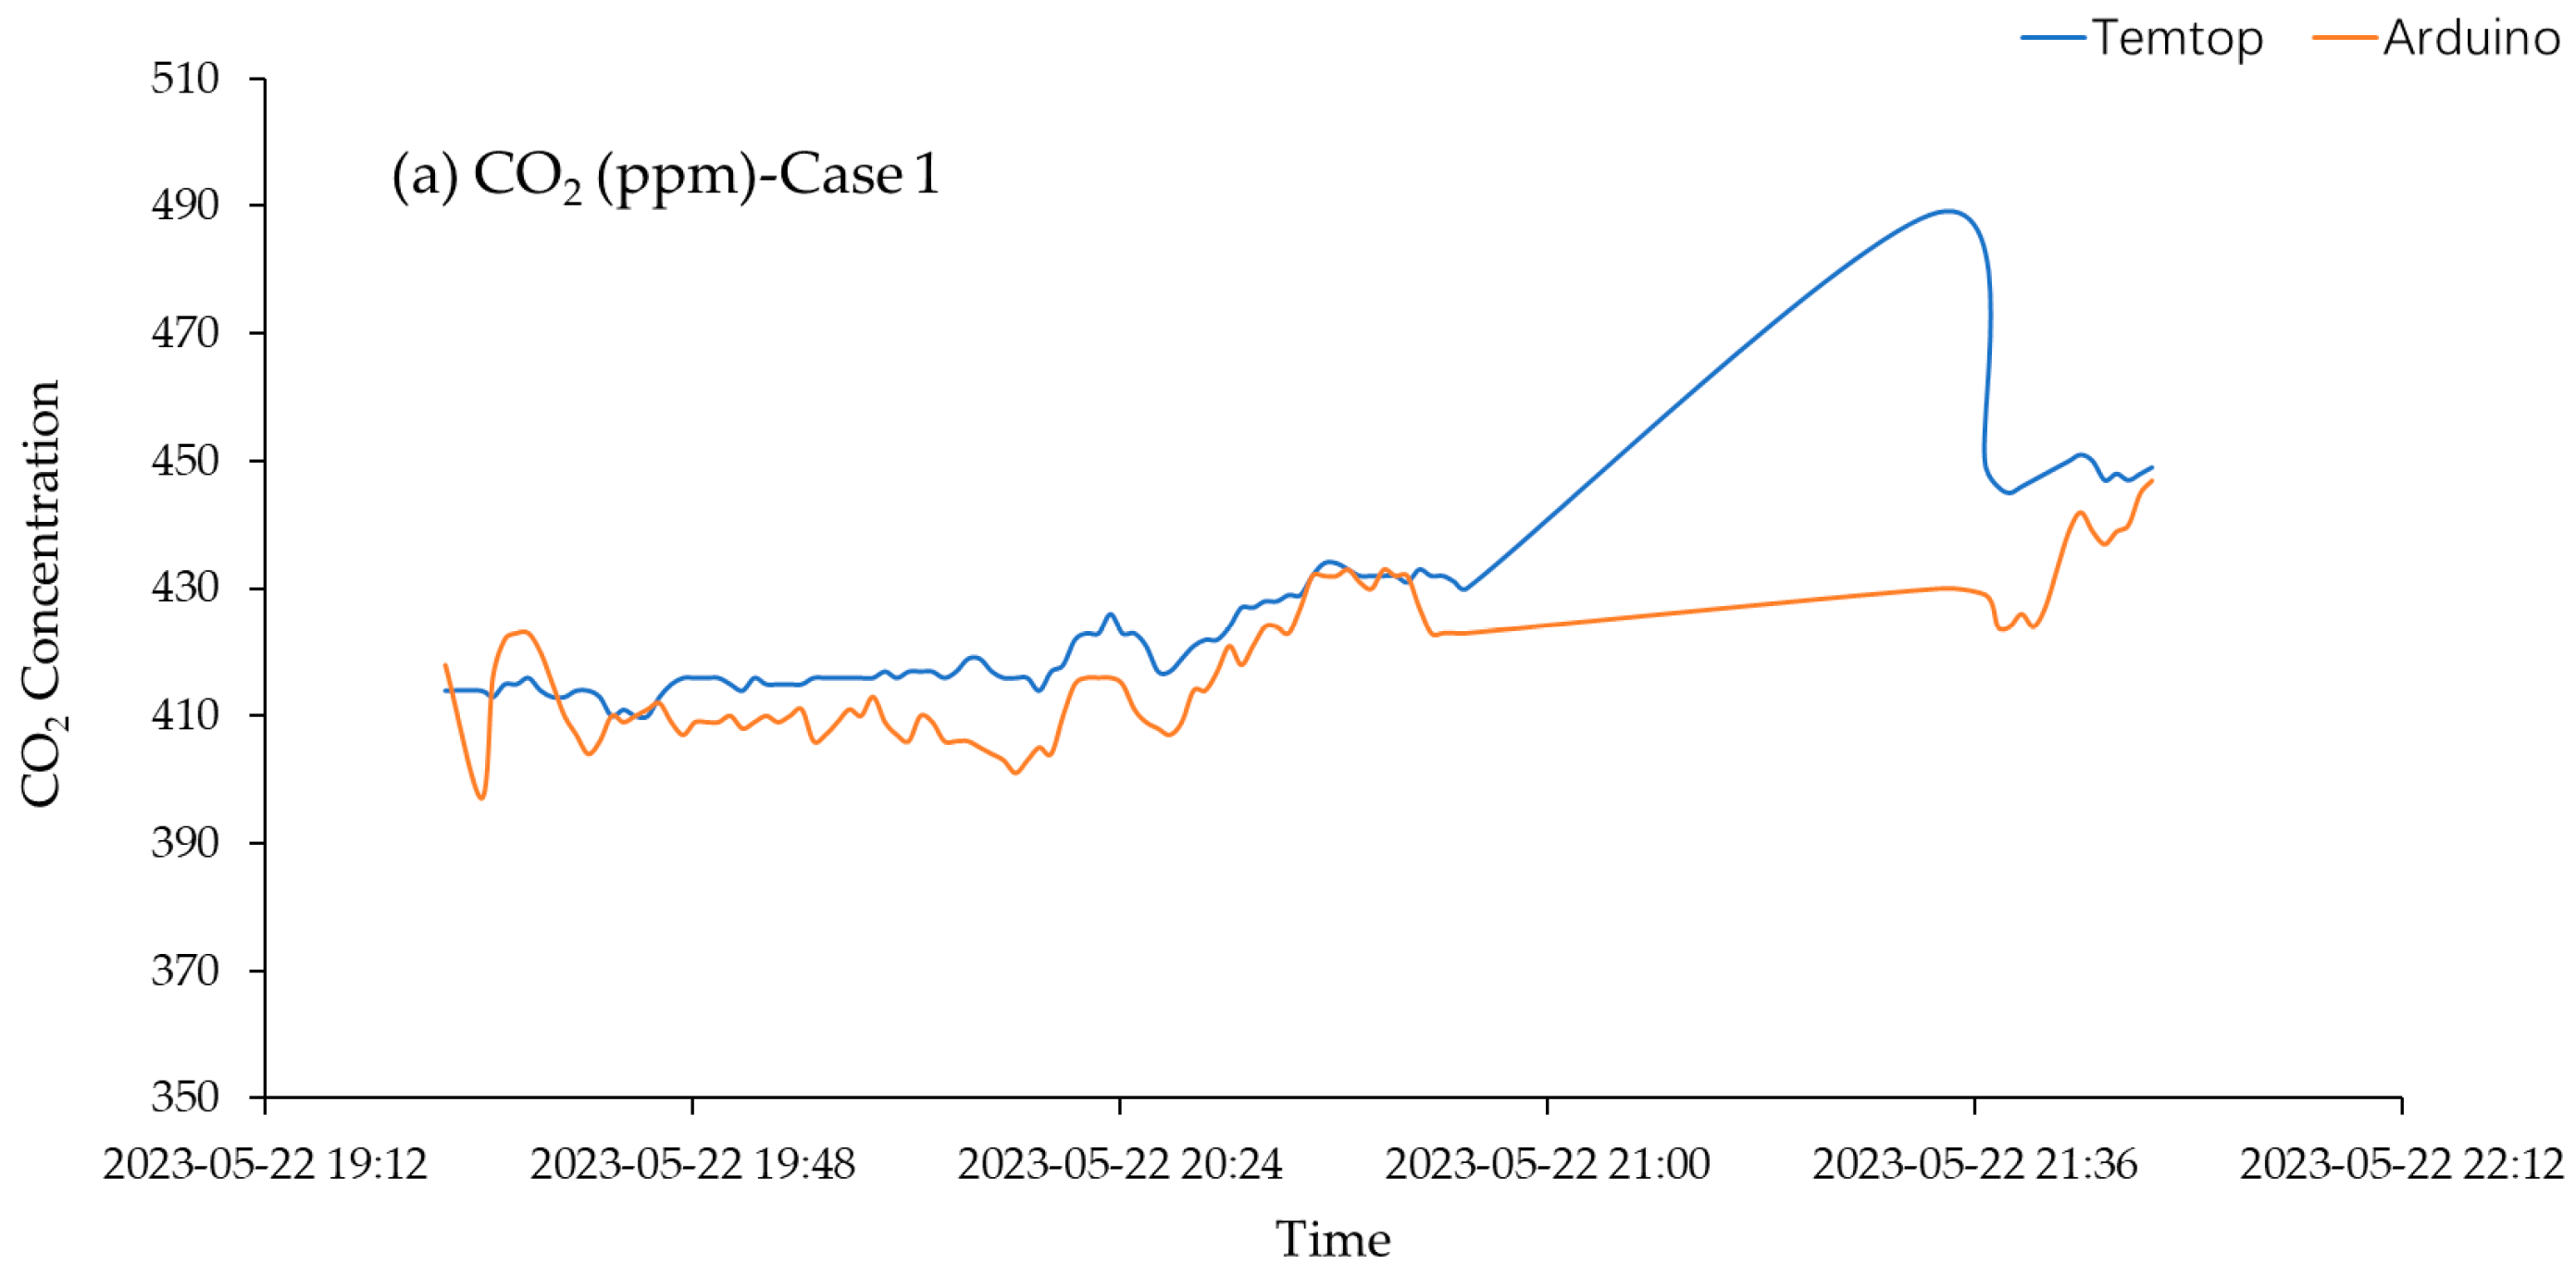
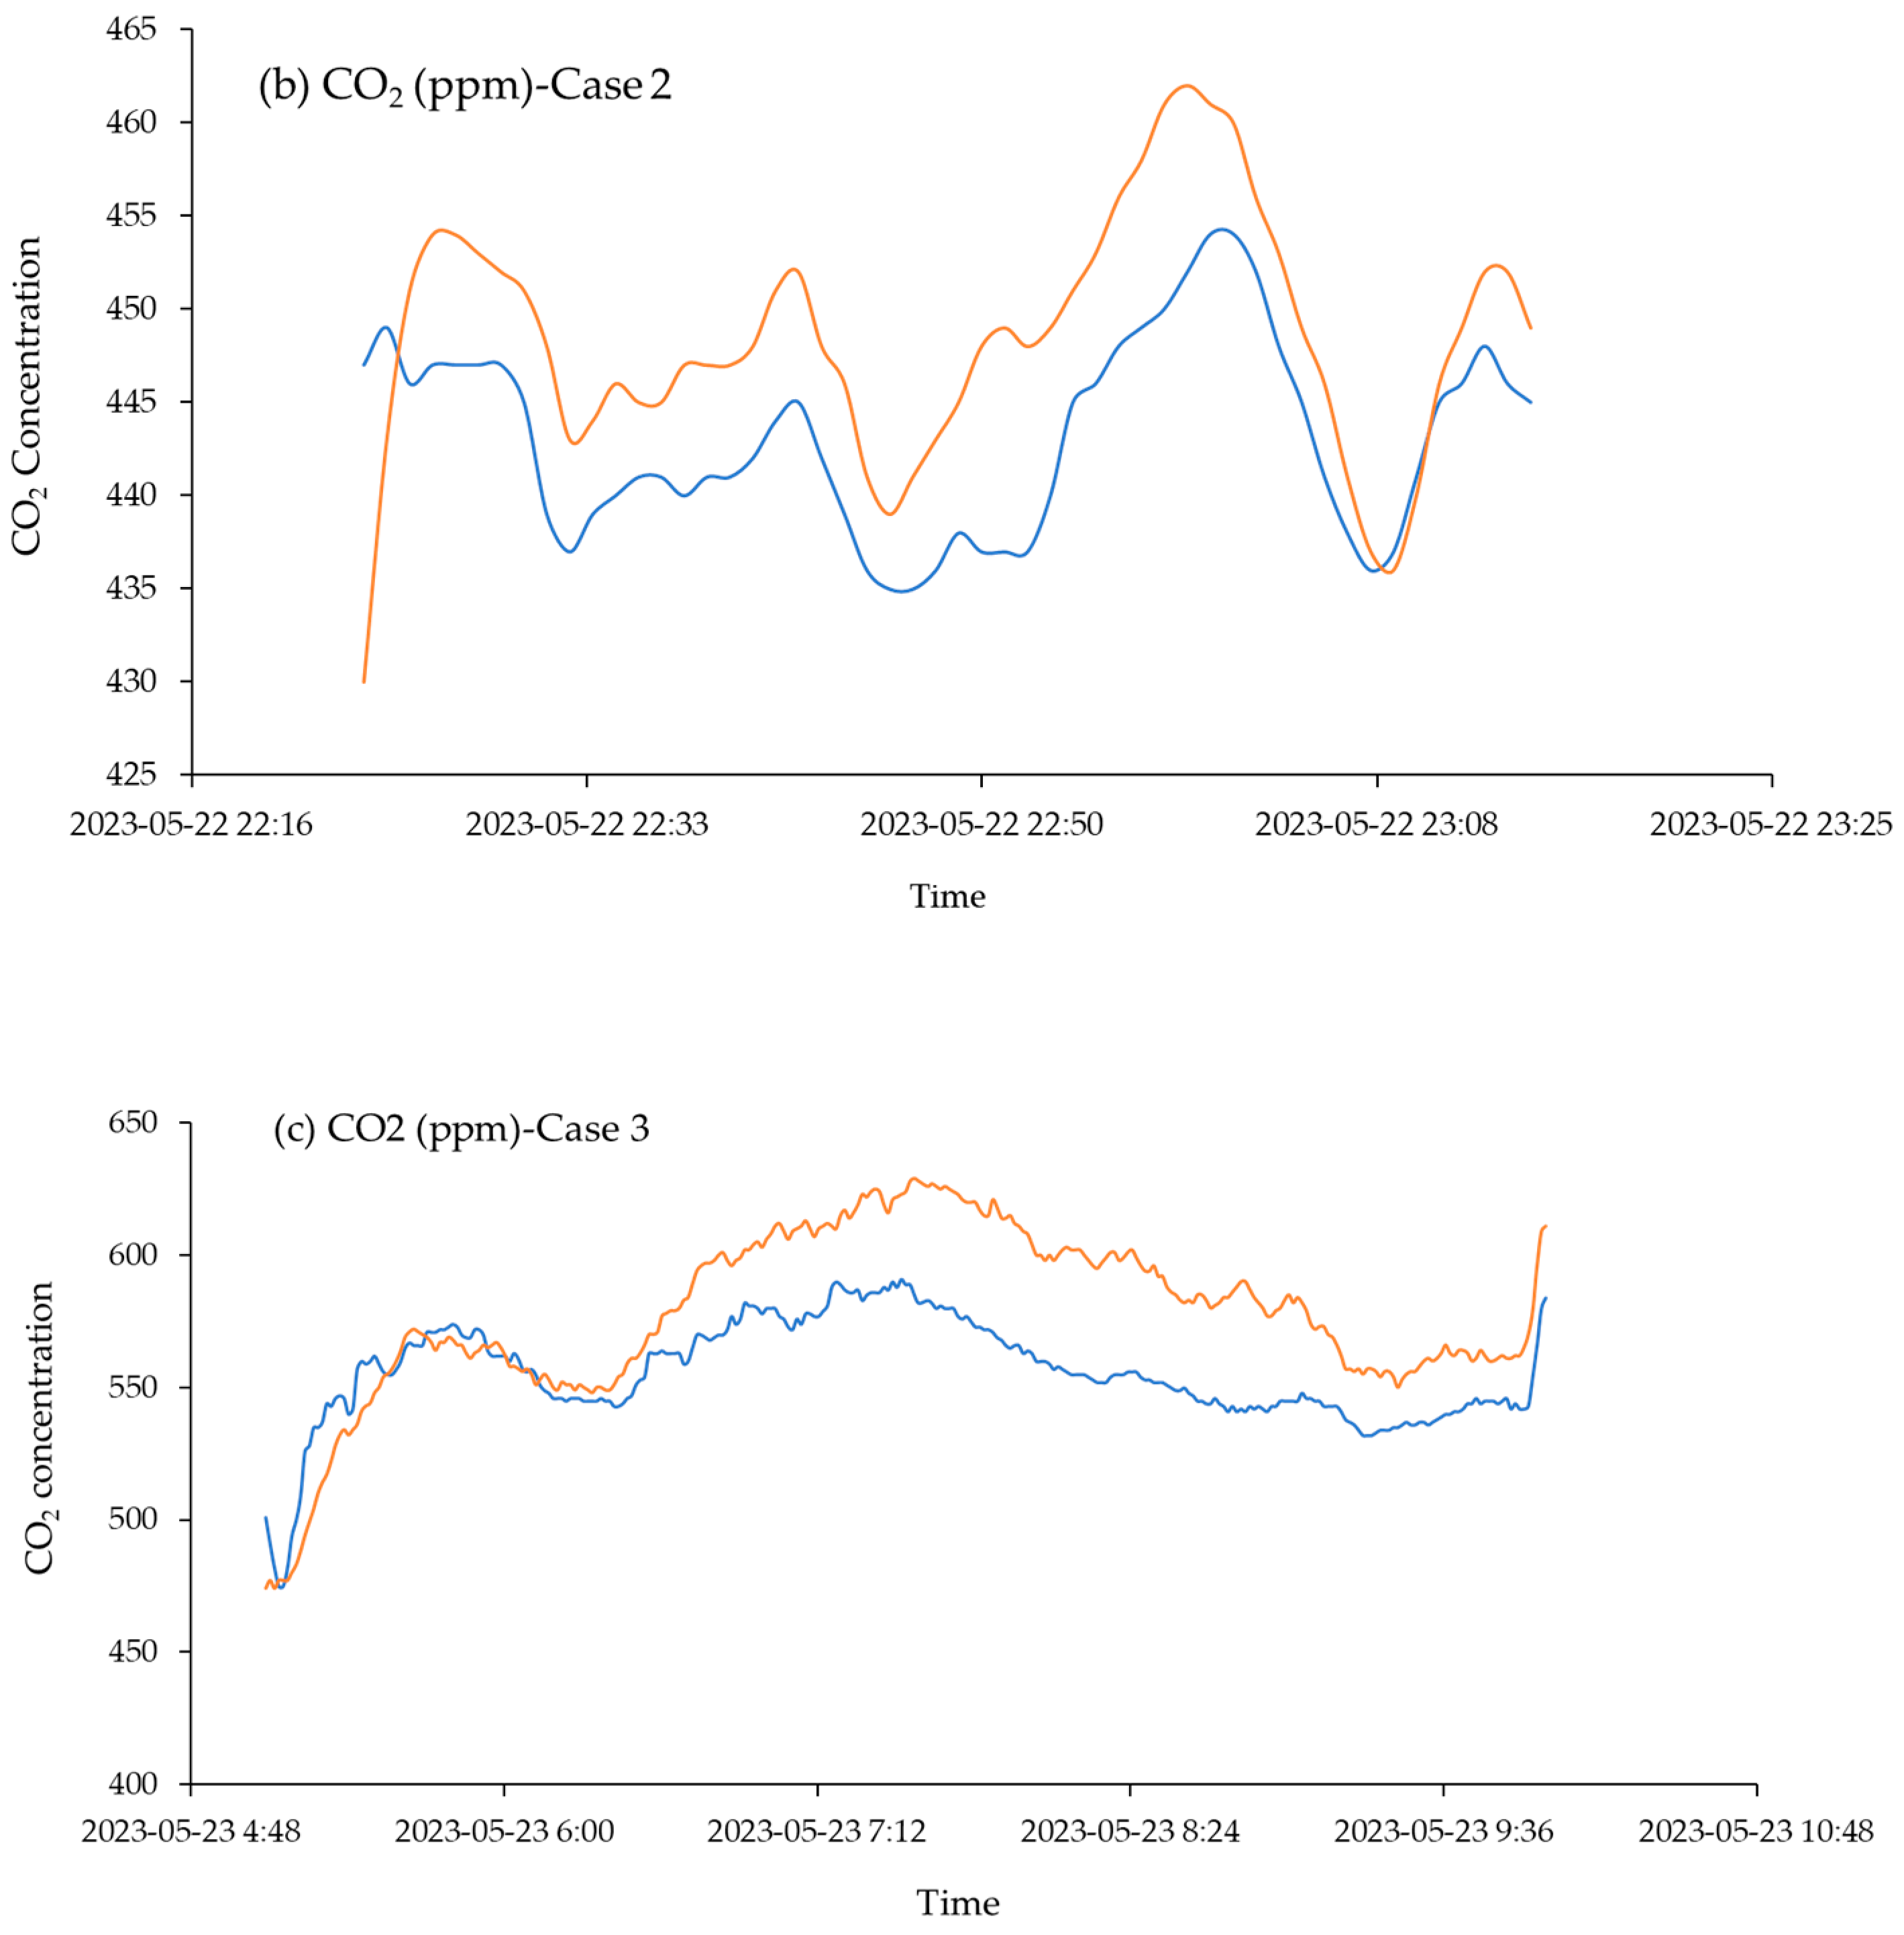
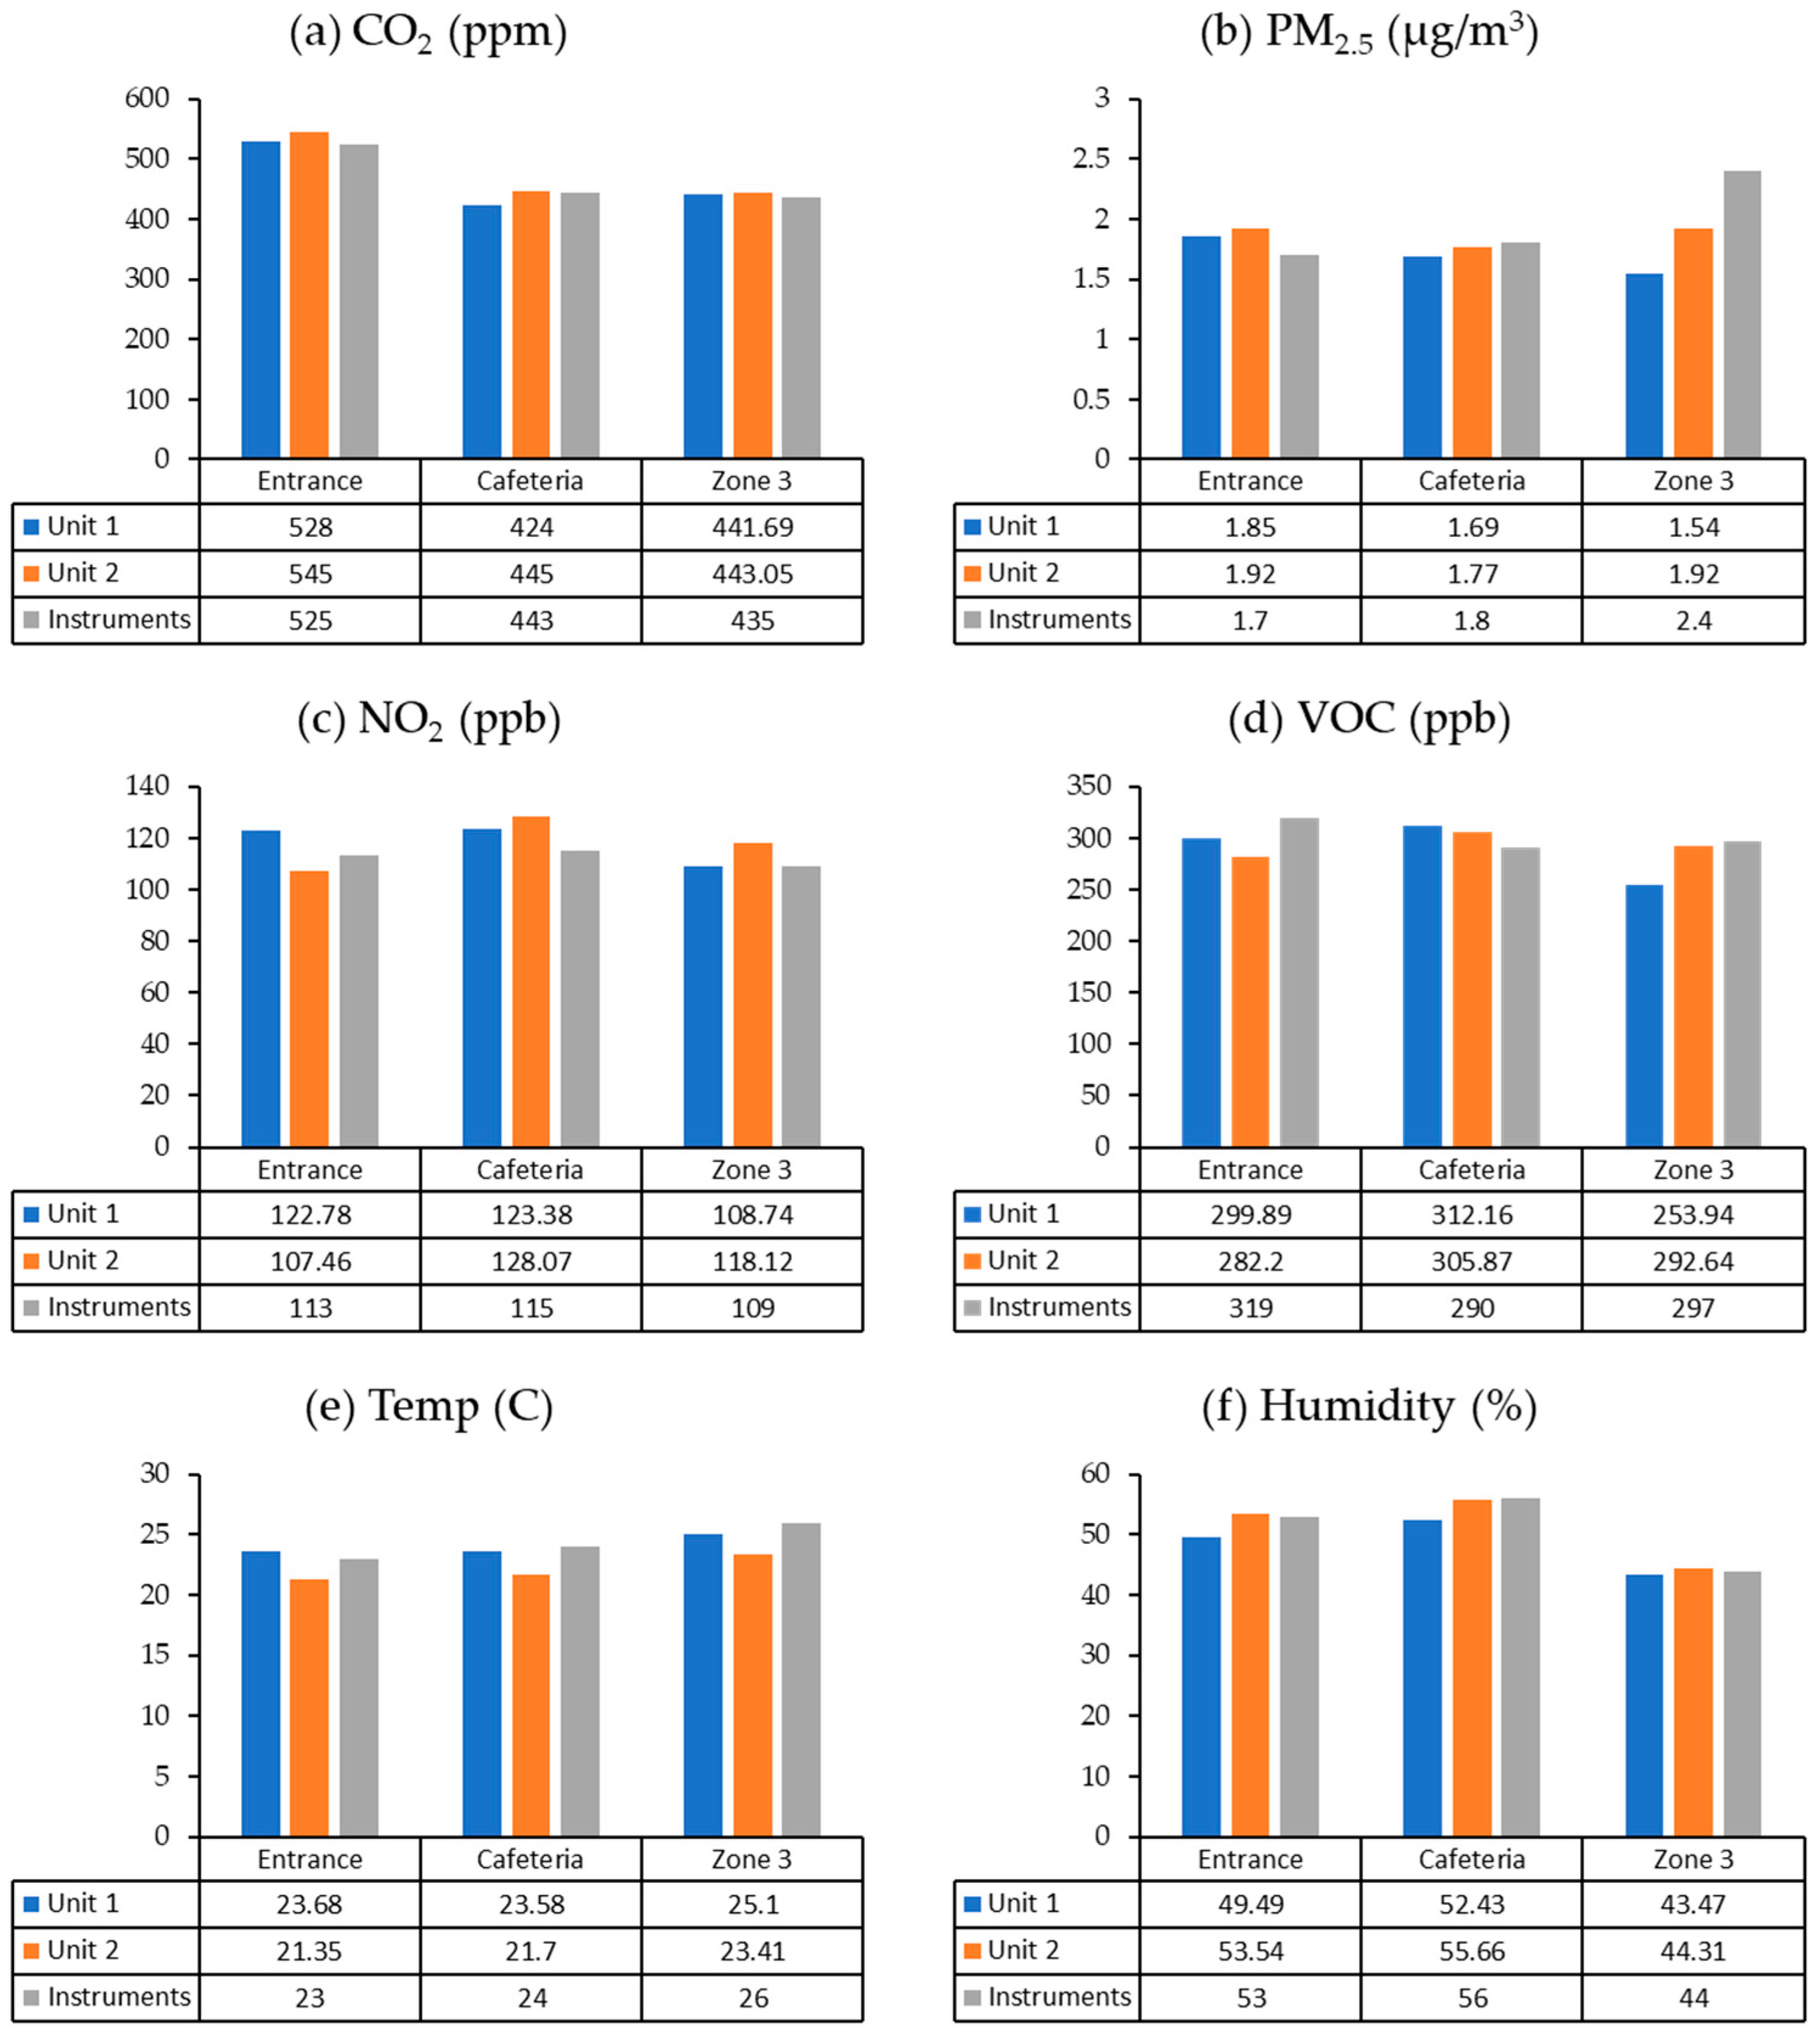
Two case studies were carried out, one at Concordia University, Montreal, and another at Qatar University, Doha. At Concordia University, the sensors were tested in various environments, such as offices, classrooms, garages, and outdoor spaces, to validate their applicability in different settings. At Qatar University, two units of the device, equipped with integrated sensors and an online display system, were deployed. Multiple locations within the Qatar University Environment Science Center were tested to assess the consistency of sensor readings and their correlation with measurements obtained from commercial instruments. These comprehensive tests aimed to verify the suitability of the sensors for accurate air quality monitoring in diverse environments and to identify the sensor modules that exhibited superior performance for each parameter.
Time synchronization between the proposed system and reference instruments was achieved through timestamp alignment. All devices recorded measurements with internal timestamps, and data streams were aligned post hoc using linear interpolation with reference to EVM-7 as the temporal baseline. Points with >2 s timestamp deviation were excluded (<5% of total data). This approach maintained sufficient synchronization given the maximum observed clock drift of 0.8 s over 24 h (laboratory test) and pollutant dynamics occurring at minute-level timescales.
3.4. Air Quality Index Model for Indoor (3 Sub-Index)
The concept of the indoor air quality index is to assess and evaluate the quality of air within enclosed spaces, such as buildings or homes. It aims to provide a comprehensive measure of indoor air quality by considering several factors that contribute to the overall environment. Rastogi and Lohani (2022) [
31] developed an adaptive neuro-fuzzy inference system (ANFIS) to assess IAQ in enclosed spaces, specifically focusing on classroom environments. The ANFIS model utilizes three key indicators—percent of dissatisfied people (PPD), ventilation rate (VR), and air quality index (AQI) data as sub-indices to evaluate IAQ. In this study, the methodology proposed by [
31] is used, utilizing the three sub-indices, namely thermal comfort, ventilation rate, and pollutant concentrations, as the fundamental indicators for evaluating the air quality within enclosed spaces (
Figure 3).
Thermal comfort refers to the condition of mind or sensation that indicates satisfaction with the thermal environment (ASHRAE Standard 55-2023, Thermal Environmental Conditions for Human Occupancy, 2023) [
32]. This sub-index assesses the level of comfort experienced by predicted mean vote (PMV) and predicted percentage dissatisfied (PPD), which are determined by two main factors: temperature and humidity. PMV is a measure of the average thermal sensation experienced by a group of individuals in a particular indoor environment (ASHRAE Standard 55, 2023) [
32]. It considers numerous factors such as air temperature, mean radiant temperature, air velocity, humidity, and clothing insulation. The PMV scale ranges from −3 (feeling very cold) to +3 (feeling very hot), with 0 representing a thermally neutral state.
The equation for calculating PMV is as follows [
17]:
In Equation (1), represents heat production and heat loss from the human body. It considers the metabolic rate (M) of the individual, which is a measure of the person’s heat production, and the external work performed (W) by the individual. The equation uses the metabolic rate to calculate the amount of heat produced by the body.
In Equation (1), represents the heat exchange between the body and the surrounding environment. It considers factors such as air velocity (f), clothing insulation (Fcl), and the temperature difference between the average clothing surface temperature (Tcl) and the mean radiant temperature (Tr). The equation calculates the convective and radiative heat transfer between the body and the environment.
In Equation (1), represents the convective heat transfer between the body and the air. It considers the clothing area factor (fcl), the convective heat transfer coefficient (hc), and the temperature difference between the average clothing surface temperature (Tcl) and the air temperature (Ta). In Equation (1), represents the heat loss due to water vaporization. It considers the water vapor pressure (P) in the environment.
PPD represents the percentage of individuals within a group who are expected to feel dissatisfied with their thermal comfort conditions. Equation (2) for calculating PPD is as follows [
21]:
It is calculated based on the difference between an individual’s thermal sensation vote (on a seven-point thermal sensation scale) and the PMV value.
Table 2 shows the relationship between PPD and thermal comfort.
The practice of using indoor CO
2 concentrations is a widely adopted approach for estimating ventilation rates per person by applying a single-zone mass balance model of CO
2 [
29]. ASHRAE-62 standard has discussed the relationship between the ventilation rate and CO
2 concentration under steady-state conditions [
33] (
Table 3). By giving constant values for the generation rate, ventilation rate, and outdoor CO
2 concentration throughout the mass balance analysis period, the steady-state equation can be represented as follows:
For indoor environments, air for ventilation is recommended as more than or equal to 15 cfm.
The pollutant concentrations sub-index evaluates the levels of various pollutants present in the indoor air. This includes pollutants such as particulate matter, VOCs, CO
2, CO, and other potentially harmful gases like Ozone and HCHO if they are available. Monitoring pollutant concentrations helps identify potential health risks and enables appropriate measures to be taken to reduce exposure. For different pollutants, different standard and index calculation methods may be applied. For example, we can use the AQHI standard from the Canada National Standard to calculate particulate matter and Nitrogen Dioxide [
34] and the VOC level from the WHO standards [
35]. After setting the hazardous level of each pollutant, the large index value is taken for this sub-index value. AQHI from Canada National Standard (assuming indoor zero-level ozone) [
34]:
Note: While this study cites the 2023 edition of ASHRAE Standard 55, the PMV/PPD calculations remain consistent with previous versions for steady-state conditions.
