Article

Spatiotemporal Variation of Compound Drought and Heatwave Events in Semi-Arid and Semi-Humid Regions of China

1
Key Laboratory of Water Cycle and Related Land Surface Processes, Institute of Geographic Sciences and Natural Resources Research, Chinese Academy of Sciences, Beijing 100101, China
2
College of Resources and Environment, University of Chinese Academy of Sciences, Beijing 100049, China
*
Author to whom correspondence should be addressed.
Atmosphere 2025, 16(5), 568; https://doi.org/10.3390/atmos16050568
Submission received: 24 March 2025 / Revised: 26 April 2025 / Accepted: 30 April 2025 / Published: 9 May 2025
(This article belongs to the Section Meteorology)

Abstract

:
In the context of global climate warming, compound drought and heatwave events (CDHEs) have exhibited a pronounced escalation in frequency since the Second Industrial Revolution, incurring substantial socioeconomic losses. This study investigates the spatiotemporal variations of CDHEs in semi-arid and semi-humid regions of northern China based on daily Standardized Precipitation Index (SPI) and maximum temperature (Tmax) datasets. The results show that compared to the 1980s, the occurrence frequency of CDHEs during the 2010s exhibited an increasing trend increase by 20–50 times in the southern region and 10–30 times in the northern region, while some watersheds in the central part of the study area show a decreasing trend. From the 1980s to the 2010s, the percentage of area affected by CDHE with a duration exceeding 11 days/year has risen from 28.3% to 56.7%, reflecting a pronounced upward trend in CDHE duration. Spatiotemporal patterns revealed significant interdecadal disparities in both the frequency and duration of CDHEs, which are primarily determined by heatwave events pattern and the synchronicity of heatwave and drought events. However, drought intensity exhibits comparatively weaker influence. Due to the decrease in the proportion of short–duration heatwaves, the short–duration CDHEs (1–2 days) in all levels exhibited a declining trend in their proportions. Furthermore, the delayed occurrence of drought events resulted in the peak occurrence of CDHEs has gradually shifted June to July–August.

1. Introduction

Global warming profoundly influences climatic dynamics, intensifying drought and heatwave events worldwide [1,2,3,4,5]. Drought is among the most significant natural disasters affecting human society [6,7]. It has accounted for 34% of disaster-related fatalities (the highest proportion) and 7% of economic losses globally over the past five decades [8]. Its damage rate is rising, exceeding that of other climatic hazards [9]. Given the interconnected nature of climatic variables, multiple extreme climate events frequently co-occur sequentially or concurrently (termed compound events). Droughts and heatwaves exhibit particularly high synchronization rates [10,11]. Compound events typically amplify the adverse impacts of individual hazards, generating more severe consequences for both societal and natural systems than singular events [12,13]. Between 1980 and 2012, compound drought and heatwave events in the United States resulted in economic losses amounting to as much as USD 200 billion [14]. Moreover, studies have shown that compound drought and heatwave events lead to significantly greater reductions in global maize yields compared to singular drought or heatwave events [15]. Consequently, monitoring and analyzing single events alone proves insufficient for comprehensive risk assessment, necessitating the integrated analysis of compound events.
Projections indicate that compound drought and heatwave events (CDHEs) will likely increase in frequency, spatial extent, and duration globally [16,17,18]. China exhibits particularly accelerated CDHE escalation trends compared to global averages, characterized by longer durations, higher frequencies, and broader distributions [19,20,21]. For example, the CDHE frequency increased by 125% and 160% in Northeast China and North China, respectively, during 1949–2014 [22]. The frequency of hot and dry events averaged over China in 1994–2011 is double that in 1964–1981, and the duration of hot and dry events increased by 60% [23]. Current CDHE research predominantly focuses on ecologically vulnerable areas (e.g., the Loess Plateau), major river basins (e.g., the Yangtze River), and densely populated regions (e.g., eastern China) [24,25,26]. Furthermore, China’s semi-arid and semi-humid regions represent critical zones for frequent occurrences of drought and heatwaves [27], where both hazards show marked intensification trends [7,28,29]. Studies reveal a high probability of CDHE occurrences during July in most eastern regions of China since the 1980s [30]. There is a decrease in occurrence probabilities from May to July. However, an increasing trend is observed from August onward, suggesting a delayed probability of CDHE incidents in the warm seasons [31]. Nevertheless, research regarding CDHE occurrence remains limited.
Although numerous studies have investigated compound drought and heatwave events (CDHEs), most of them have focused on ecologically fragile zones or major river basins. Few studies have examined the semi-arid and semi-humid transition zone in northern China, a region highly sensitive to climate extremes, leaving significant gaps in understanding CDHE characteristics, trends, and mechanisms within semi-arid and semi-humid zones. Moreover, most existing research is based on monthly or seasonal data, which may mask the fine-scale temporal dynamics of CDHEs. Building upon these limitations, this study investigates northern China’s semi-arid and semi-humid regions (mean annual precipitation: 200–800 mm), employing daily scale Standardized Precipitation Index (SPI) and maximum temperature data to identify CDHEs. By integrating fine-resolution temporal data, we refine the assessment framework for CDHE identification, enabling a more accurate and comprehensive detection of their occurrence. We analyze spatiotemporal variations in CDHEs’ duration and frequency and explore their occurrence date probabilities. The objectives are to (1) characterize CDHE features at daily resolution, and (2) explore spatiotemporal patterns and underlying drivers of CDHEs.

2. Materials and Methods
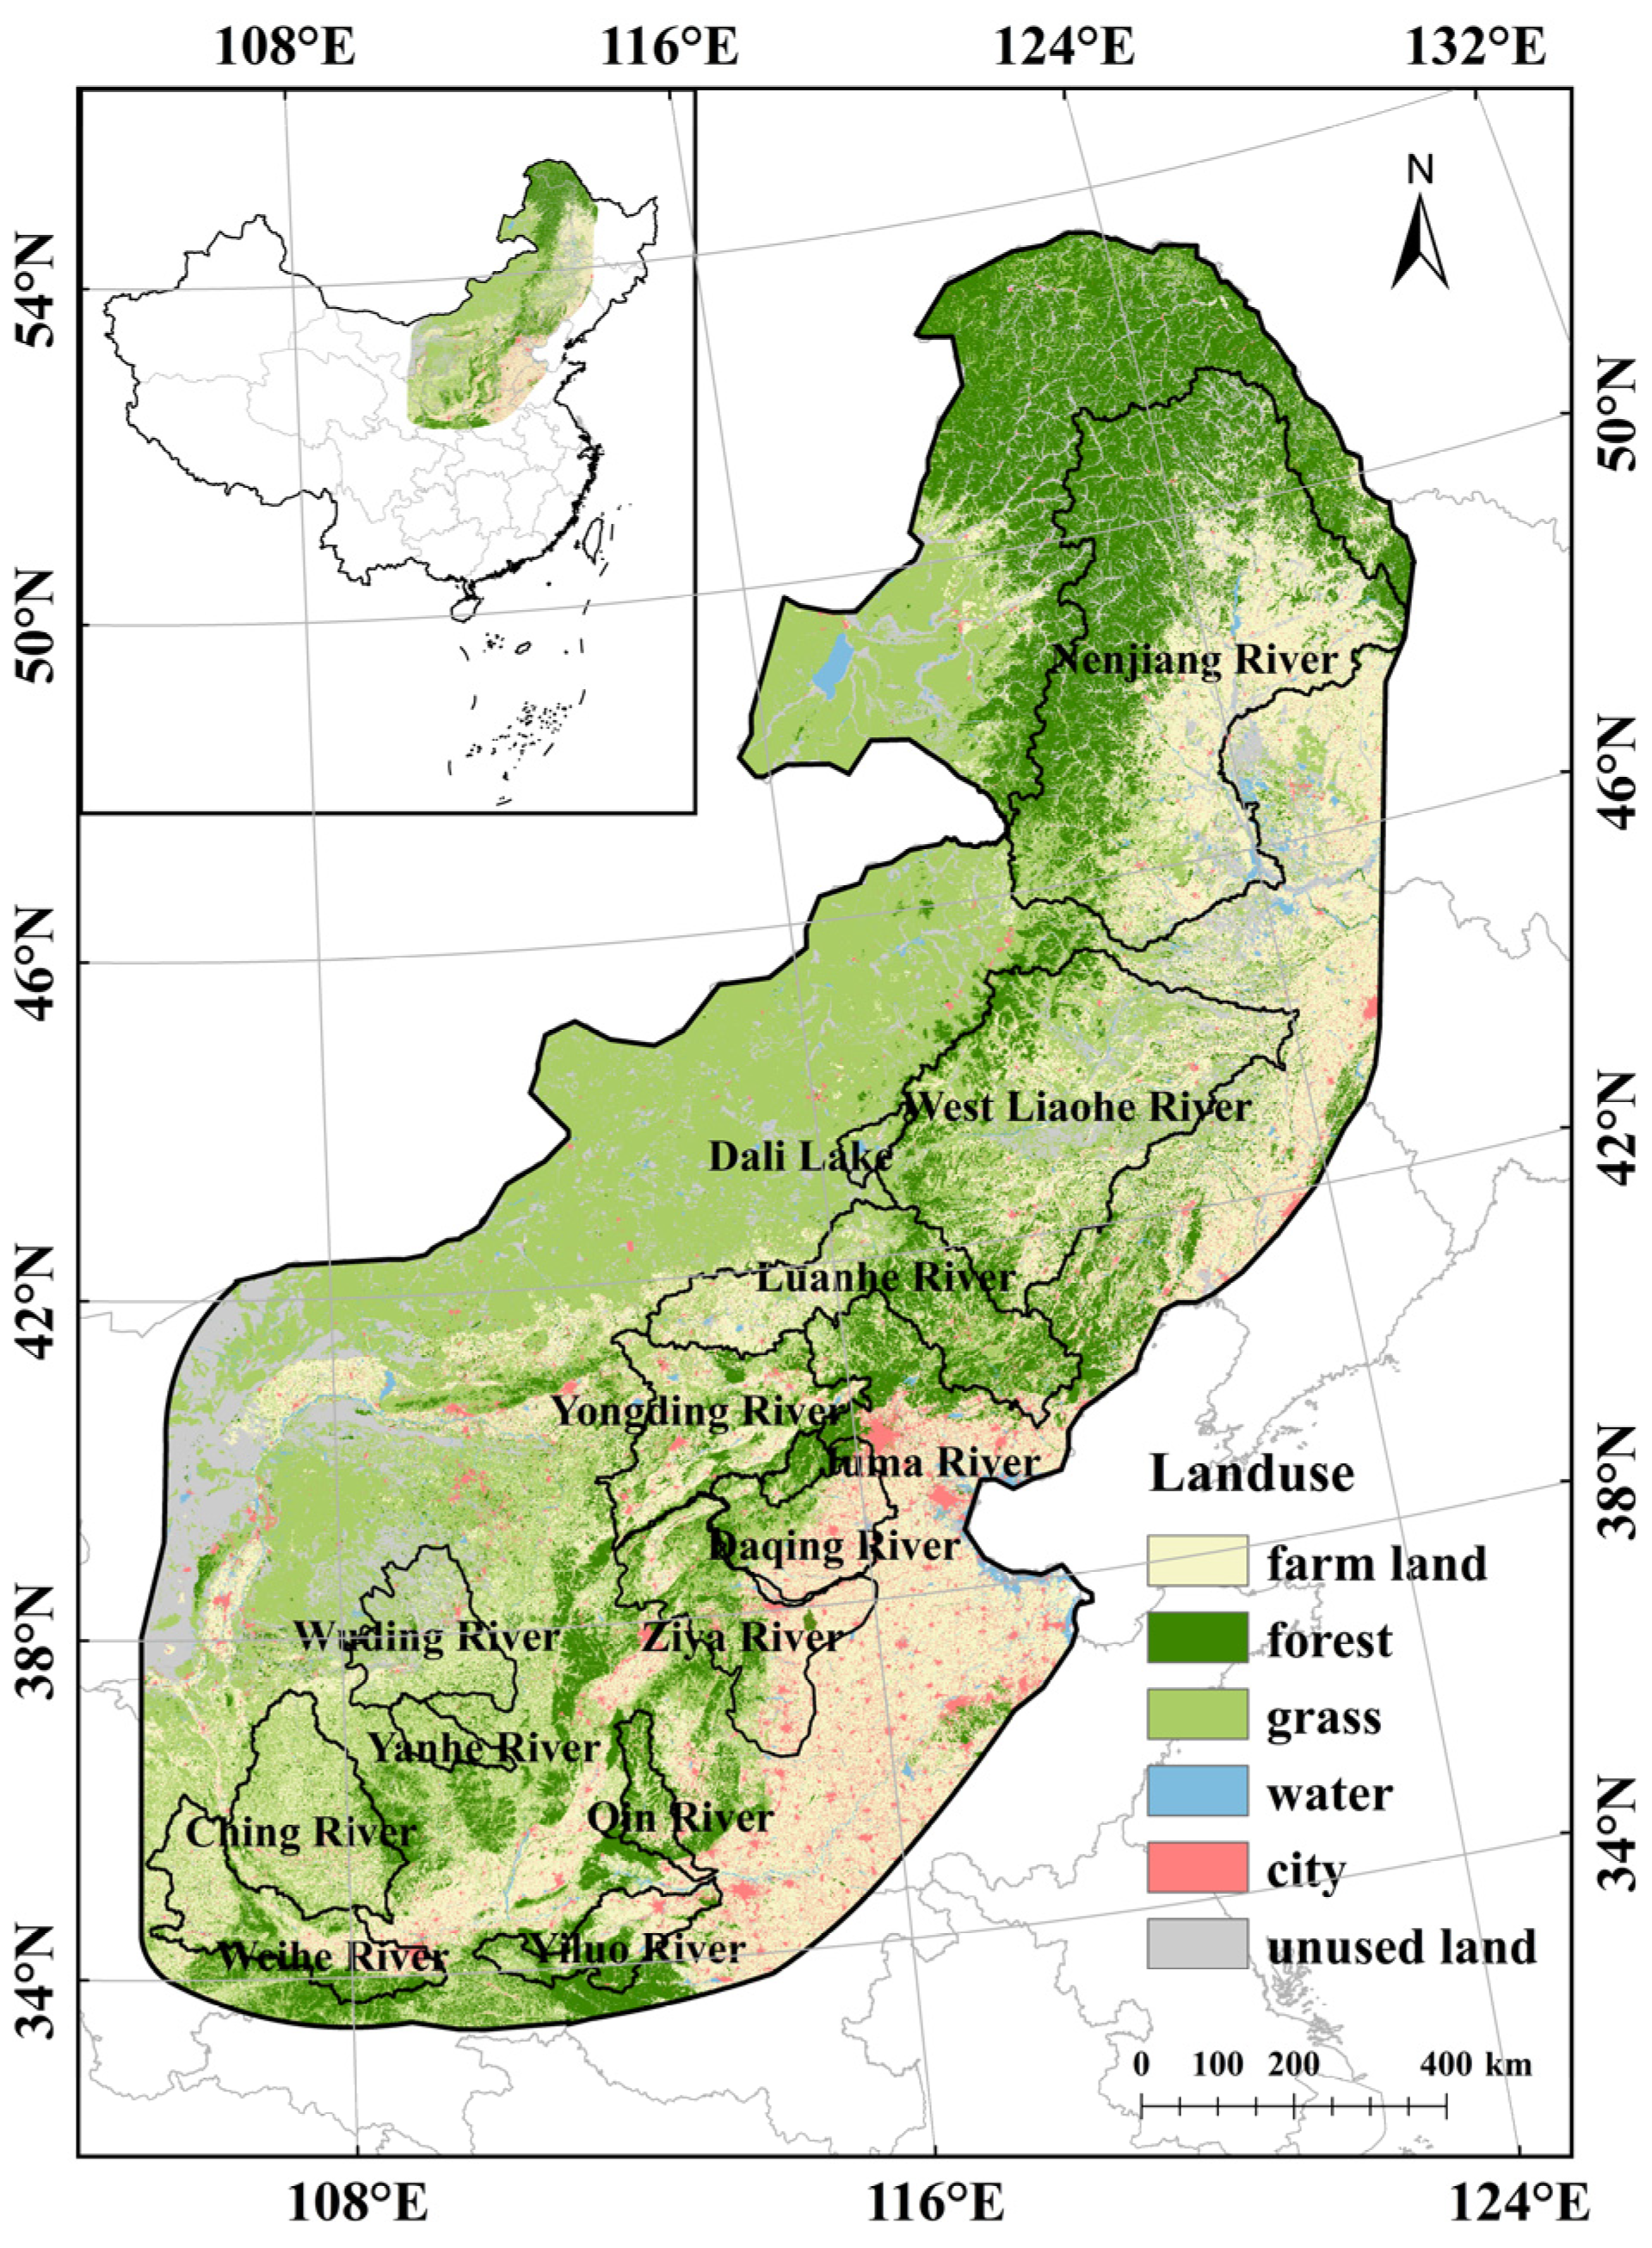
2.1. Study Area

The study area is situated in northeastern China, spanning extensive geographical coordinates between 32.05° N–54.75° N and 104.85° E–129.95° E. The study area spans a vast region of northern China, encompassing a total area of 2.06 × 10⁶ km2 (Figure 1). Geographically, it extends from China’s northernmost continental boundary in the north to the northern foothills of the Qinling Mountains in the south. Longitudinally, it stretches from the western coast of Bohai Bay in the east to the eastern margin of the Helan Mountains in the west.
From May to October during 1980 to 2018, the daily mean temperatures ranged from 5.36 °C to 25.71 °C. The average daily maximum temperatures during the same period varied between 15.19 °C and 28.57 °C. Spatially, the region exhibited a characteristic thermal pattern, with relatively lower temperatures in the central areas and higher values in the eastern and western parts (Figure 2). The annual precipitation averages 200–800 mm, with the multi-year mean growing season precipitation gradually decreasing from east to west. The eastern portion constitutes a semi-humid zone, while the western sector belongs to a semi-arid region. Distinct climatic zonation emerges across the study area. The eastern domain, encompassing 10 major sub-basins including the Nenjiang River, the West Liaohe River, the Dali Lake, and so on, falls under the influence of the East Asian monsoon system, forming a temperate monsoon climate zone. This regime features strong precipitation seasonality, with over 80% of the annual rainfall concentrated during May–October, synchronized with ≥10 °C accumulated temperature (2800–3200 °C·d), demonstrating concurrent heat–moisture availability. In contrast, the western sector of the study area penetrates deep into the continental interior, dominated by continental air masses that establish a temperate continental climate regime. This climatic pattern prevails across the river basins of the Wuding River, the Yanhe River, the Ching River, and the Weihe River. As a typical semi-arid region in China, this area experiences frequent spring droughts, with occurrence rates reaching 62%.

2.2. Data Collection

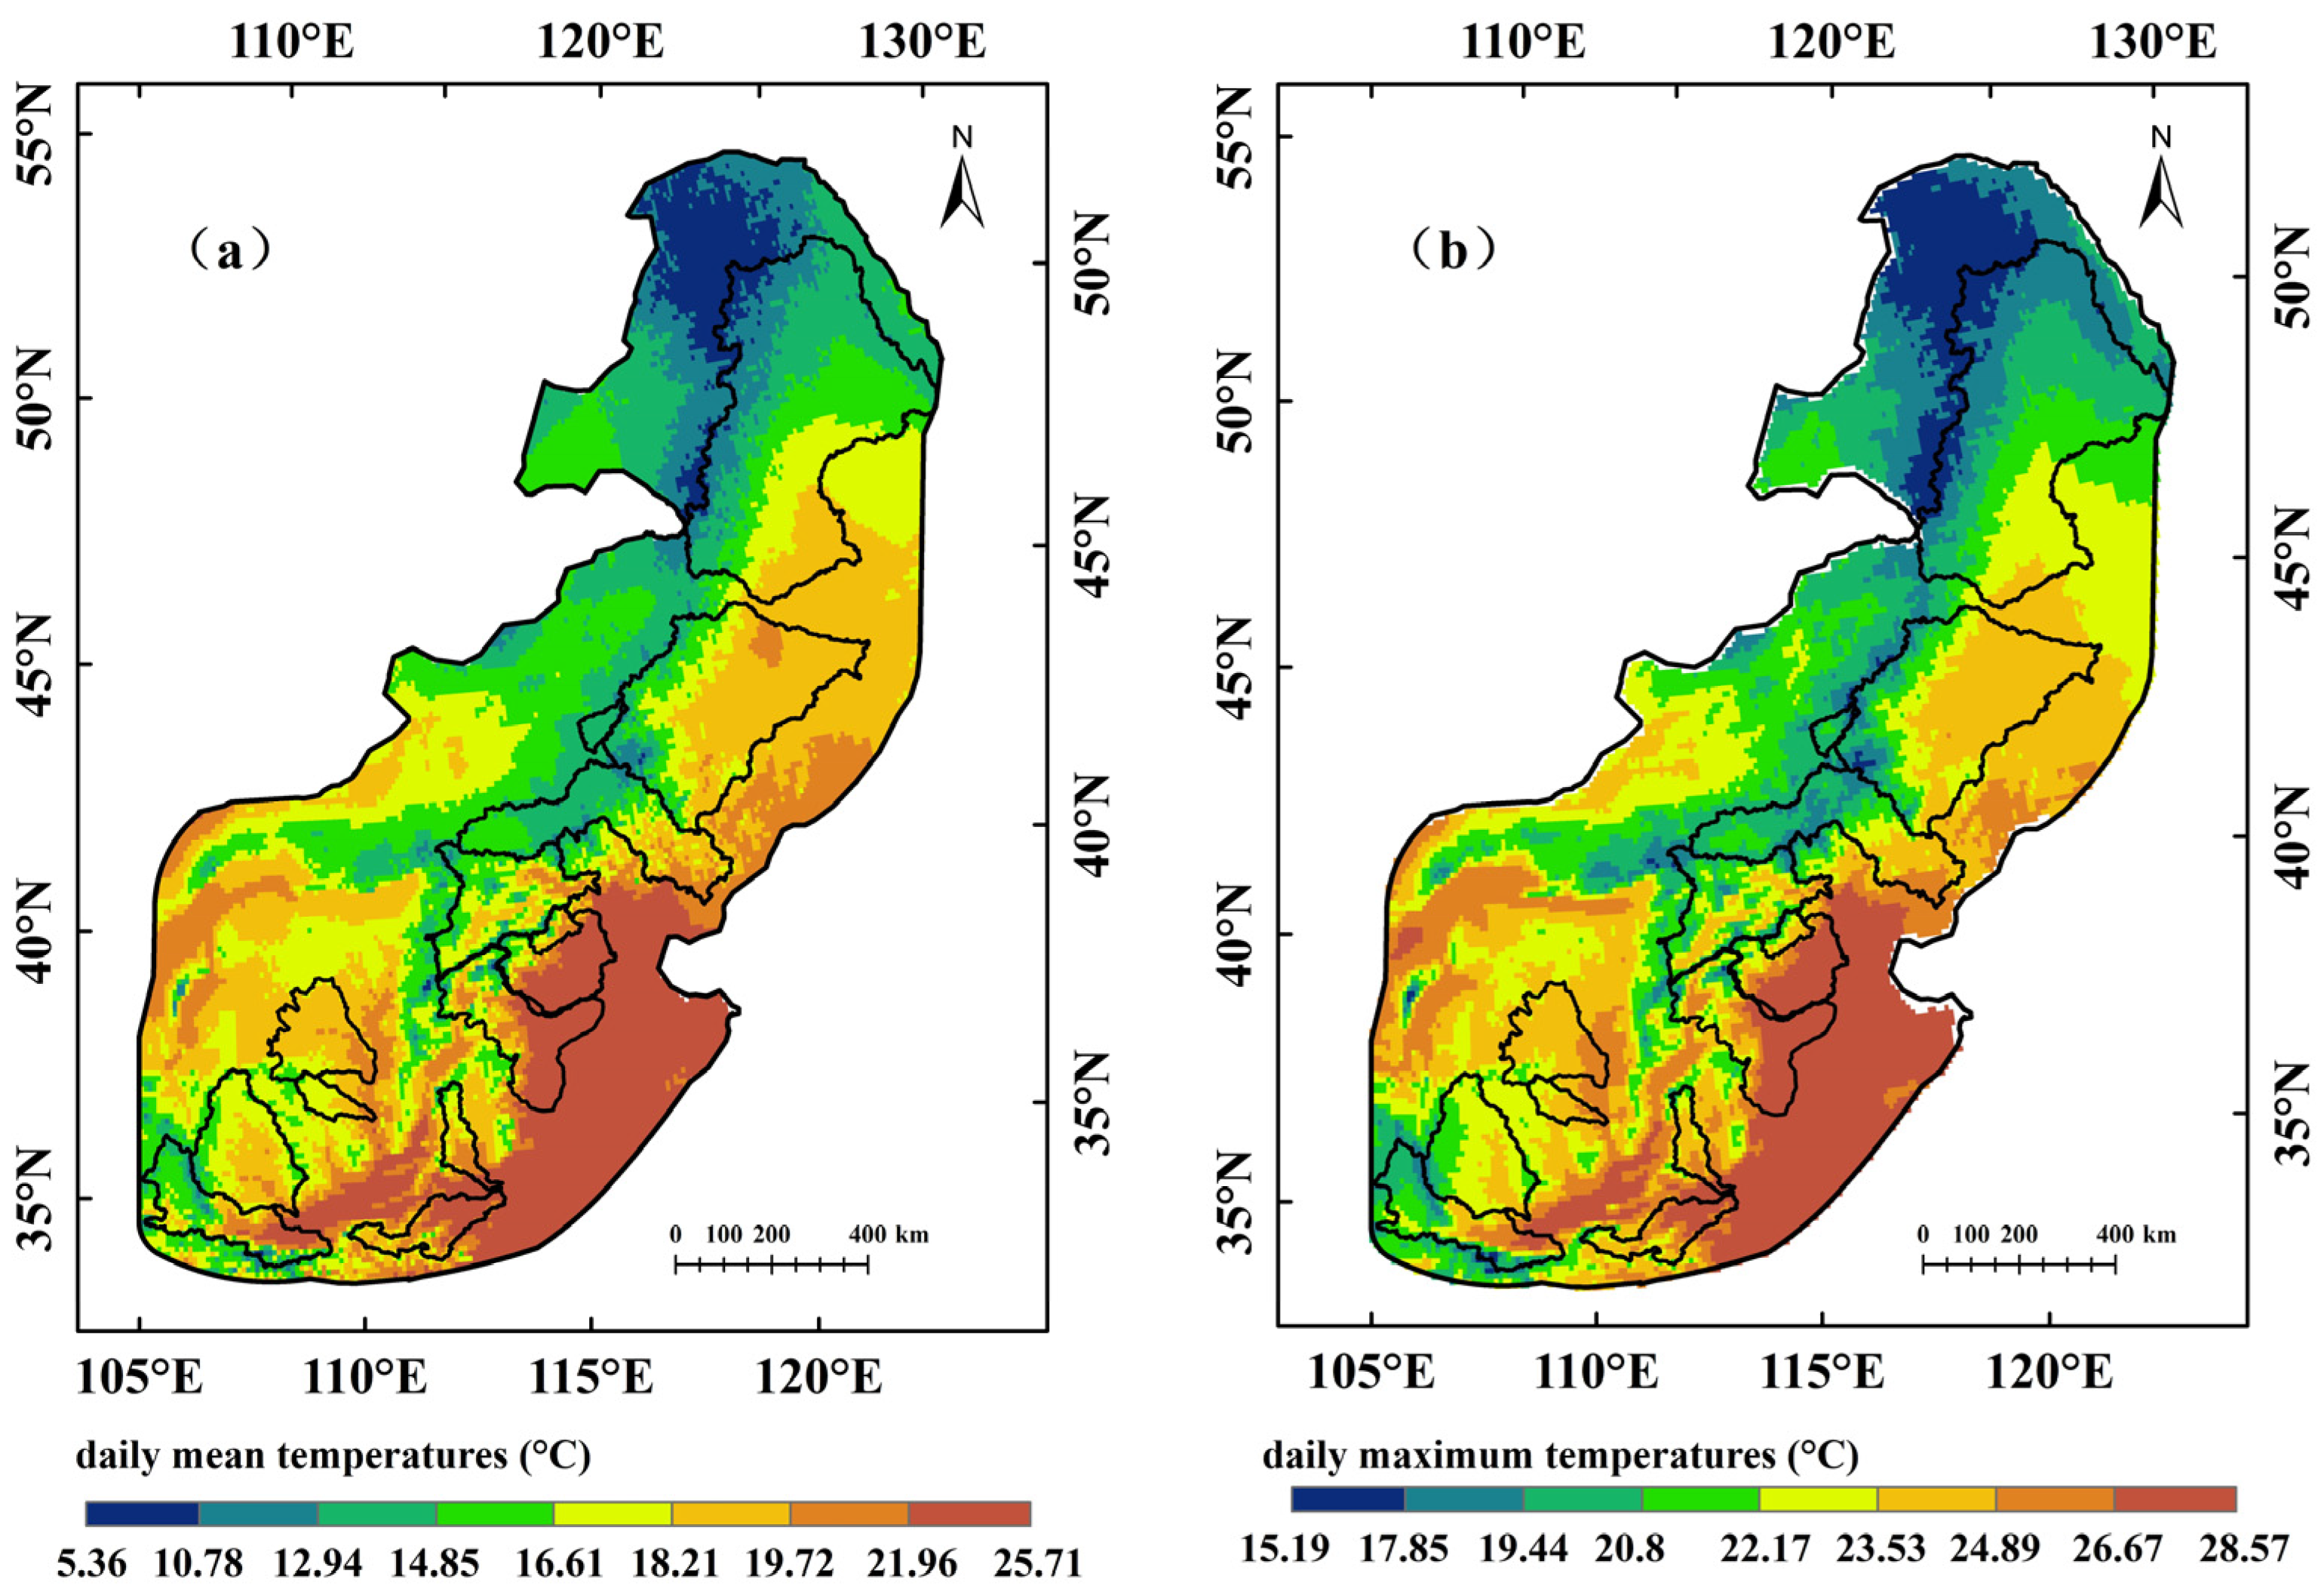
2.2.1. Meteorological Data

The meteorological data include the daily maximum temperature, the daily mean temperature, and the daily precipitation from 1980 to 2018.
The daily maximum temperature and precipitation data were obtained from a high-resolution (1 day, 1 km) and long-term (1961–2019) gridded dataset for temperature and precipitation across China, released by Data Publisher for Earth & Environmental Science (PANGAEA, http://www.pangaea.de/ (accessed on 24 March 2024)). This dataset features a temporal resolution of 1 day and a spatial resolution of 1 km × 1 km. It was generated through comprehensive statistical analysis, integrating machine learning, the generalized additive models, and thin plate splines, using the China Meteorological Administration’s 0.5° × 0.5° gridded dataset and covariates such as elevation, aspect, slope, topographic wetness index, latitude, and longitude for interpolation. Validation against meteorological station observations showed the following metrics for the daily maximum temperature: mean absolute error (MAE) = 1.07 °C, root mean square error (RMSE) = 1.62 °C, Pearson correlation coefficient (Cor) = 0.99, coefficient of determination after adjustment (R2) = 0.98, and Nash–Sutcliffe Efficiency (NSE) = 0.98. For daily precipitation, the metrics were MAE = 1.30 mm, RMSE = 4.78 mm, Cor = 0.84, R2 = 0.71, and NSE = 0.70 [32]. The data were uniformly resampled to 0.1° × 0.1° using bilinear interpolation.
The daily mean temperature data (1980–2018) were sourced from the dataset of daily near-surface air temperature in China from 1979 to 2018 released by the National Tibetan Plateau/Third Pole Environment Data Center (https://data.tpdc.ac.cn/home (accessed on 4 March 2025)). This dataset has a temporal resolution of 1 day and a spatial resolution of 0.1° × 0.1°. It employs distinct reconstruction models for near-surface air temperature (Ta) under different weather conditions and enhances accuracy through region-specific correction equations. Validation using in-situ data revealed RMSE values ranging from 0.35 °C to 1 °C, MAE values from 0.27 °C to 0.68 °C, and Pearson coefficients (R2) from 0.99 to 1.00. Additionally, trend analysis using multiple evaluation metrics indicated a warming rate exceeding 0.0 K/yr, consistent with the global warming trend [33].

2.2.2. Drought Data

The 1980–2018 Standardized Precipitation Index (SPI) data were derived from the first high spatial resolution multi-scale daily SPI and SPEI raster dataset over China from 1979 to 2018 (https://figshare.com/ (accessed on 26 March 2024)), with a temporal resolution of 1 day and a spatial resolution of 0.1° × 0.1°. This dataset was developed using the China Meteorological Forcing Dataset (comprising over 1000 ground observation stations and multiple remote-sensing-based gridded meteorological datasets), with Gamma distribution fitting applied to refine daily SPI time series. The daily SPI with a timescale of 30 days demonstrated strong agreement with traditional monthly SPI (R-value = 0.79) and exhibited robust performance in identifying both long- and short-term droughts [34].

2.3. Methodology

2.3.1. Definition of Compound Drought and Heatwave Events

A compound drought and heatwave event (CDHE) is defined as the intersection of concurrent drought and heatwave events of varying intensities [31]. The identification of CDHEs thus requires the prior determination of drought days and heatwave days. The warm season (May–October) was selected as the study period as it encompasses the majority of high-temperature and low-precipitation events within the study area. This period also corresponds to the peak occurrence of both drought and heatwave hazards, which are associated with substantial environmental and socioeconomic impacts.
Drought quantification employed the Standardized Precipitation Index (SPI). This study utilized daily Standardized Precipitation Index (SPI) values calculated using a 30-day precipitation accumulation window to ensure temporal consistency with the daily maximum temperature data. Drought days were classified using absolute thresholds based on grades of meteorological drought of China’s National Standard (GB/T 20481–2017): A day is classified as a drought day when the SPI falls below −0.5. Drought severity is further divided into three categories: moderate drought (−1.0 < SPI ≤ −0.5), severe drought (−1.5 < SPI ≤ −1.0), and extreme drought (SPI ≤ −1.5). Given substantial spatial temperature variability across the study area, heatwave days were defined using relative thresholds. A heatwave day is identified when the daily maximum temperature (Tmax) exceeds the 85th percentile threshold (Tmax85) of the regional historical record. Heatwave intensity is stratified into three levels: a moderate heatwave (Tmax85 ≤ Tmax < Tmax90), a severe heatwave (Tmax90 ≤ Tmax < Tmax95), and an extreme heatwave (Tmax ≥ Tmax95). The spatial distribution of temperature thresholds exhibits a characteristic pattern with lower values in the central region (95th percentile < 29.85 °C) and higher values in the eastern and western regions (95th percentile ranging from 31.85 °C to 36.85 °C). Significant variations in temperature thresholds were observed among sub-basins. For example, the temperature threshold difference between the Daqing River Basin (33.2 °C) and the Dali Lake Basin (29.3 °C) is 3.9 °C (Figure 3).
A compound drought and heatwave day (CDHD) is identified when a day simultaneously meets both heatwave (Tmax85 ≤ Tmax) and drought (SPI ≤ −0.5) criteria. Under this two-dimensional definition based on heatwave days and drought days, thresholds corresponding to distinct severity levels of CDHDs are detailed in Table 1.
Building upon this framework, individual or consecutive compound drought and heatwave days (CDHDs) collectively constitute compound drought and heatwave events (CDHEs). The principal characteristics of CDHEs include the following:
Frequency: Annual occurrence times of CDHEs.
Duration: Occurrence days of each CDHE. CDHEs are classified into four categories based on their duration: short duration events (1–2 days), medium duration events (3–5 days), mid-to-long duration events (6–10 days), and long duration events (>10 days). Additionally, the total annual duration of CDHEs was calculated as the sum of durations across CDHEs in that year, expressed by the following formula:
d i , j = t e n d i , j t s t a r t i , j + 1       ( j = 1 ,   2 ,   ,   n )
d i = i ,   j = 1 n d i , j       ( i = 1980,1981 ,   ,   2018 )
where i denotes the year, n represents CDHE frequency in the i-th year, d i , j is the duration of the j-th CDHE in the i-th year, d i is the total annual duration, t s t a r t and t e n d correspond to the start and end dates of CDHD sequences, respectively.
Occurrence date: The calendar date marking the onset of each CDHE.
Given substantial interannual variability in CDHE occurrence, spatial trend analysis at the annual scale yielded statistically insignificant results. Consequently, decadal averages (10-year intervals) of CDHEs’ frequency and total annual duration were computed to investigate spatiotemporal patterns. Parallel processing was applied to standalone heatwave and drought events for comparative analysis.

2.3.2. Attribution Analysis

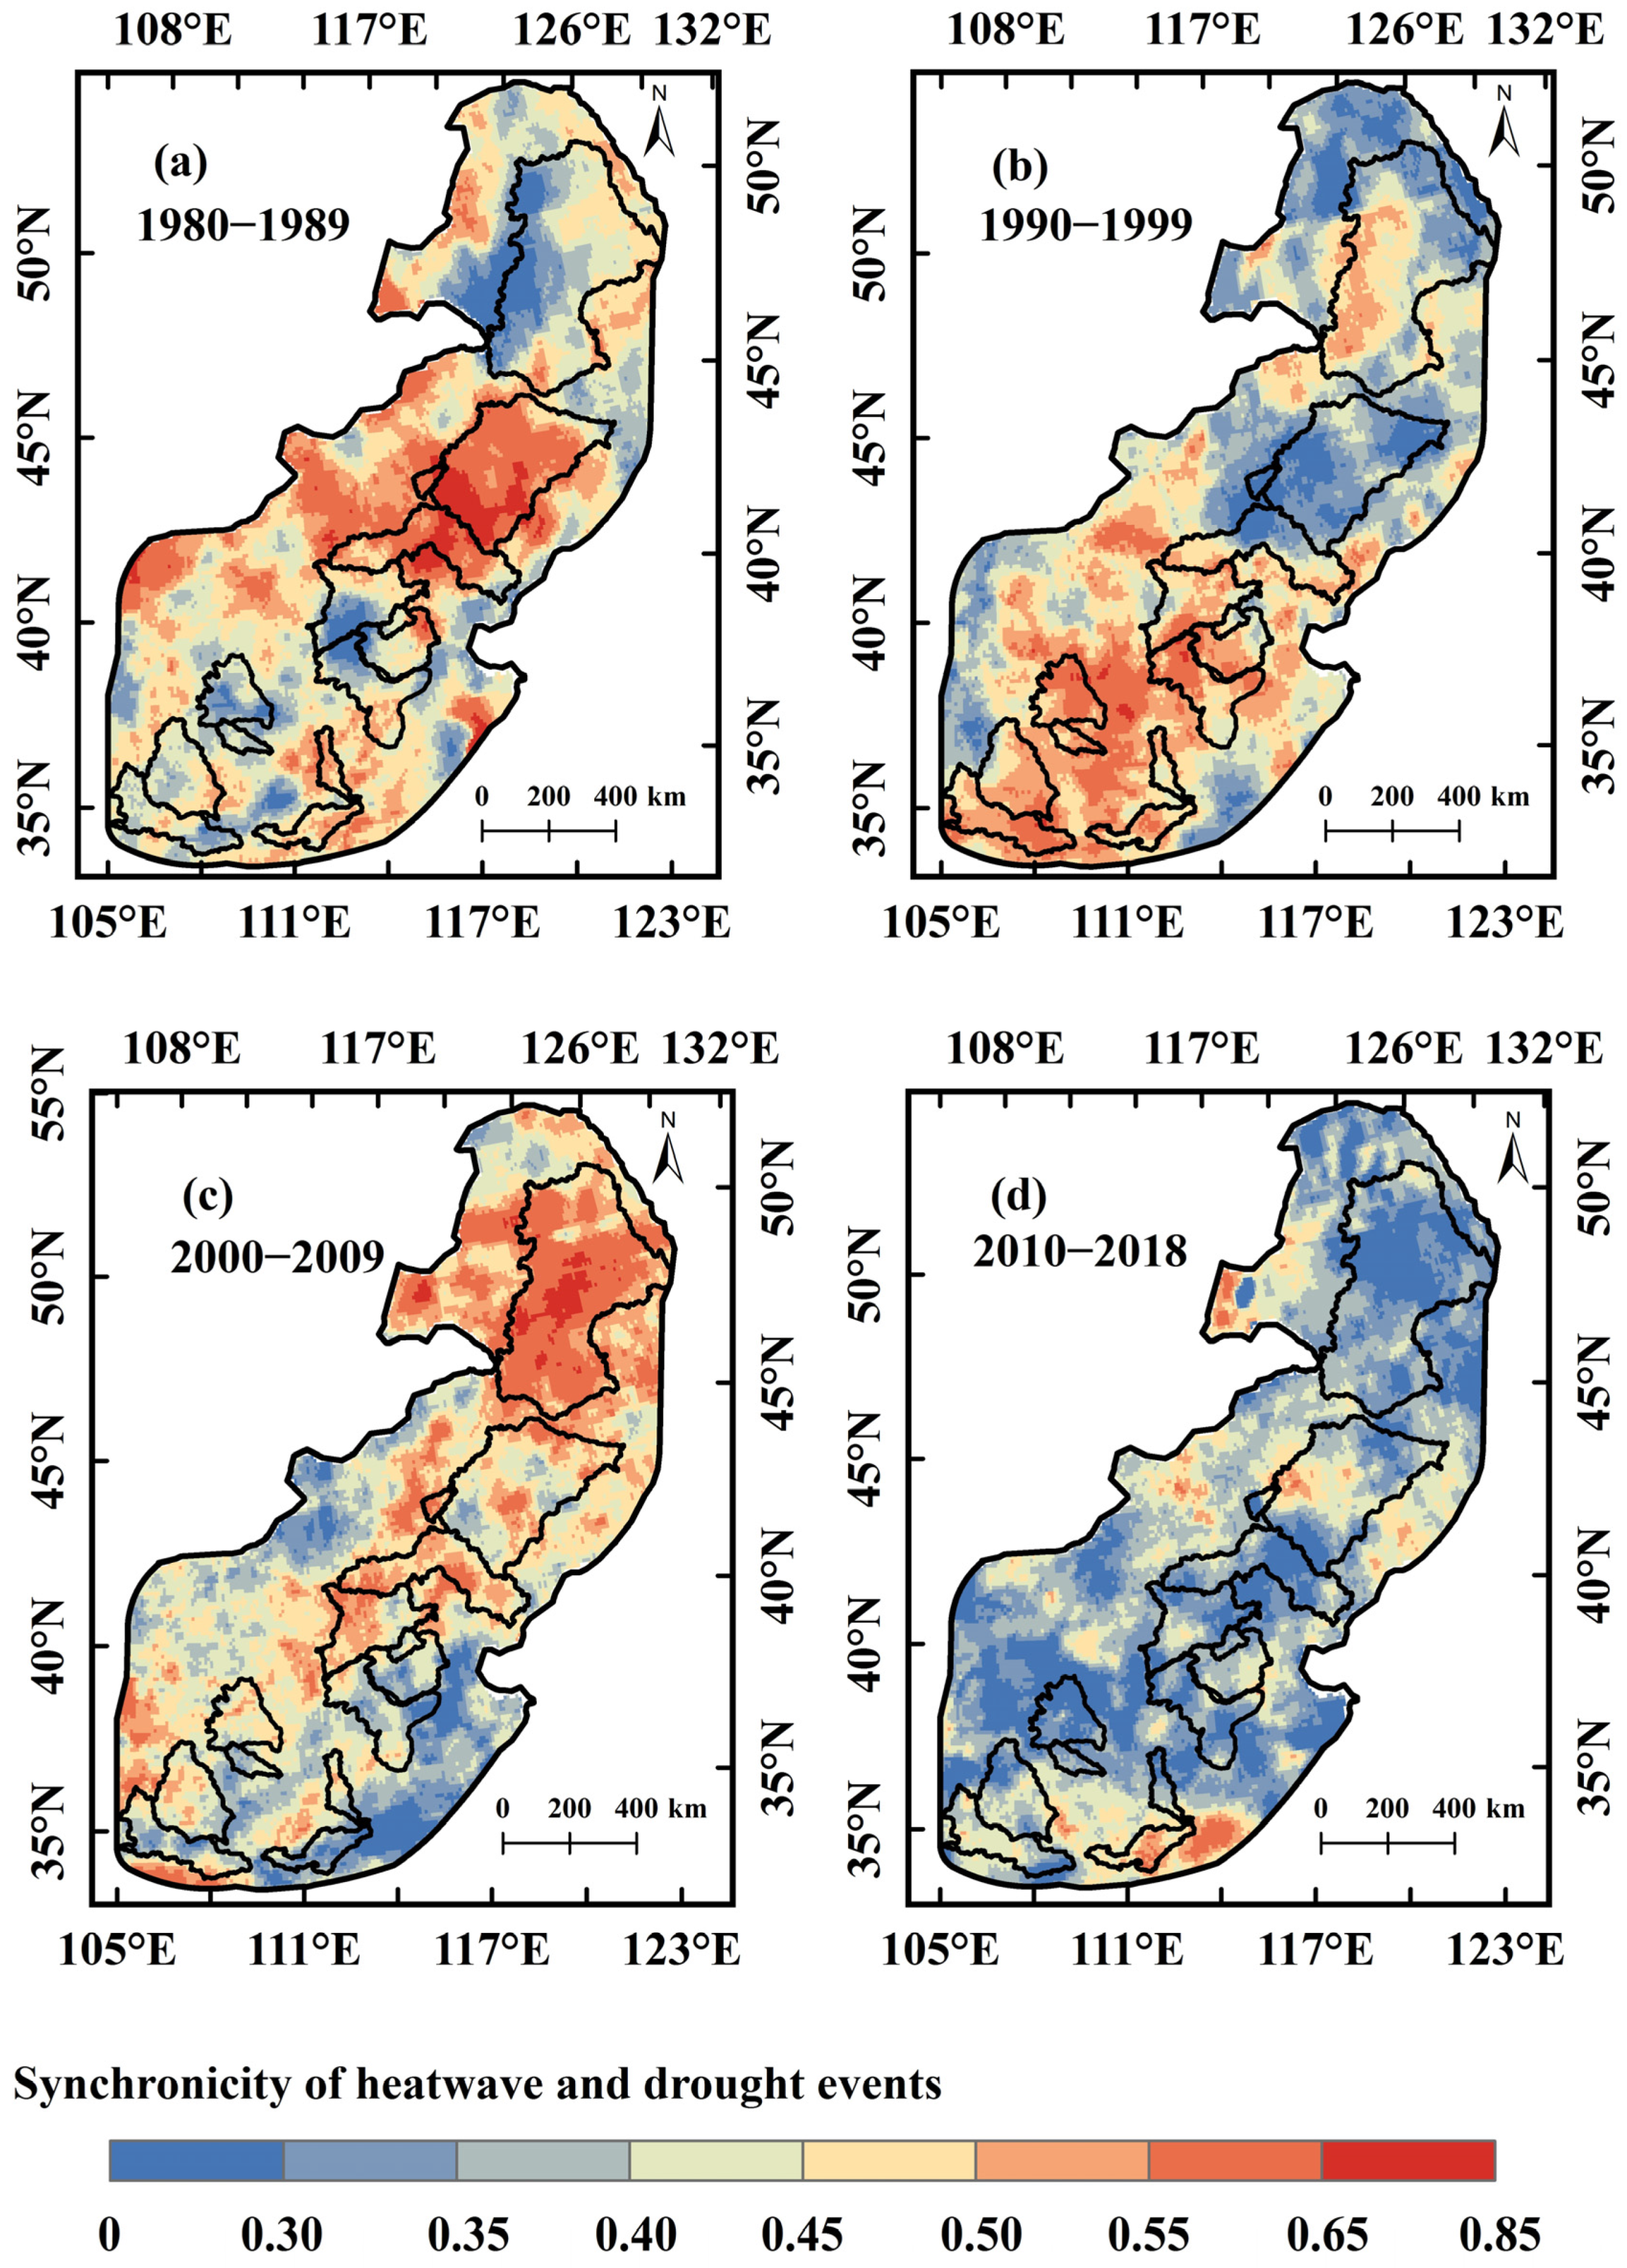
Synchronicity of Heatwave and Drought Events

To quantify the co-occurrence of heatwaves and droughts, we defined their synchronicity as the conditional probability of drought events occurring given the presence of heatwave events. Assuming the probability of heatwave occurrence is non-zero, this conditional probability is expressed as follows:
P b a = P ( S P I 0.5 , T m a x T m a x 85 ) / P ( T m a x T m a x 85 )
where a denotes a heatwave event (TmaxTmax85), and b represents a drought event (SPI ≤ −0.5). Higher P ( b | a ) values indicate stronger synchronicity between droughts and heatwaves.

Partial Correlation Analysis

Partial correlation analysis was employed to identify dominant drivers of CDHE characteristics, calculated as follows:
r y , a b , c = r y a r y b r a b r y c r a c + r y b r a c r b c + r y c r a b r b c ( 1 r y b 2 r y c 2 r b c 2 + 2 r y b r y c r b c ) ( 1 r a b 2 r a c 2 r b c 2 + 2 r a b r a c r b c )
where y y , a ( b , c ) denotes partial correlation coefficient between CDHEs and heatwaves, controlling for drought duration (b) and synchronicity of heatwave and drought events (c); r y a , r y b , and r y c represent Pearson correlation coefficients between CDHEs and heatwaves, droughts, and the synchronicity of heatwave and drought events, respectively. r a b , r a c , and r b c represent the Pearson correlation coefficients between heatwave and drought, heatwave and synchronicity, and drought and synchronicity. The calculation formula for r y a is as follows:
r y , a = c o v ( y , a ) / s y s a  
where c o v ( y , a ) denotes covariance of CDHEs and heatwaves. s y and s a represent variances of CDHEs and heatwave, respectively.
Statistical significance was evaluated using p-values derived from t-statistics:
p = 2 t c d f t , n k 2
t = r n k 2 / 1 r 2
where t is the t-statistic, t c d f denotes the cumulative distribution function, | t | represents the absolute value of the t-statistic, r is the partial correlation coefficient, n denotes sample size, and k represents the number of controlled variables. When the p-value ≤ 0.05, it indicates that the calculation result has statistical significance.
The three primary drivers of CDHEs—heatwave events, drought events, and the synchronicity of heatwave and drought events—were investigated through partial correlation analysis. In this framework, the total annual duration of CDHEs was designated as the dependent variable, while the total annual durations of heatwave events and drought events, along with the synchronicity of heatwave and drought events, served as independent variables. This analysis quantifies the relative contributions of these factors to the occurrence of CDHEs in northern China’s semi-arid and semi-humid regions.

3. Results

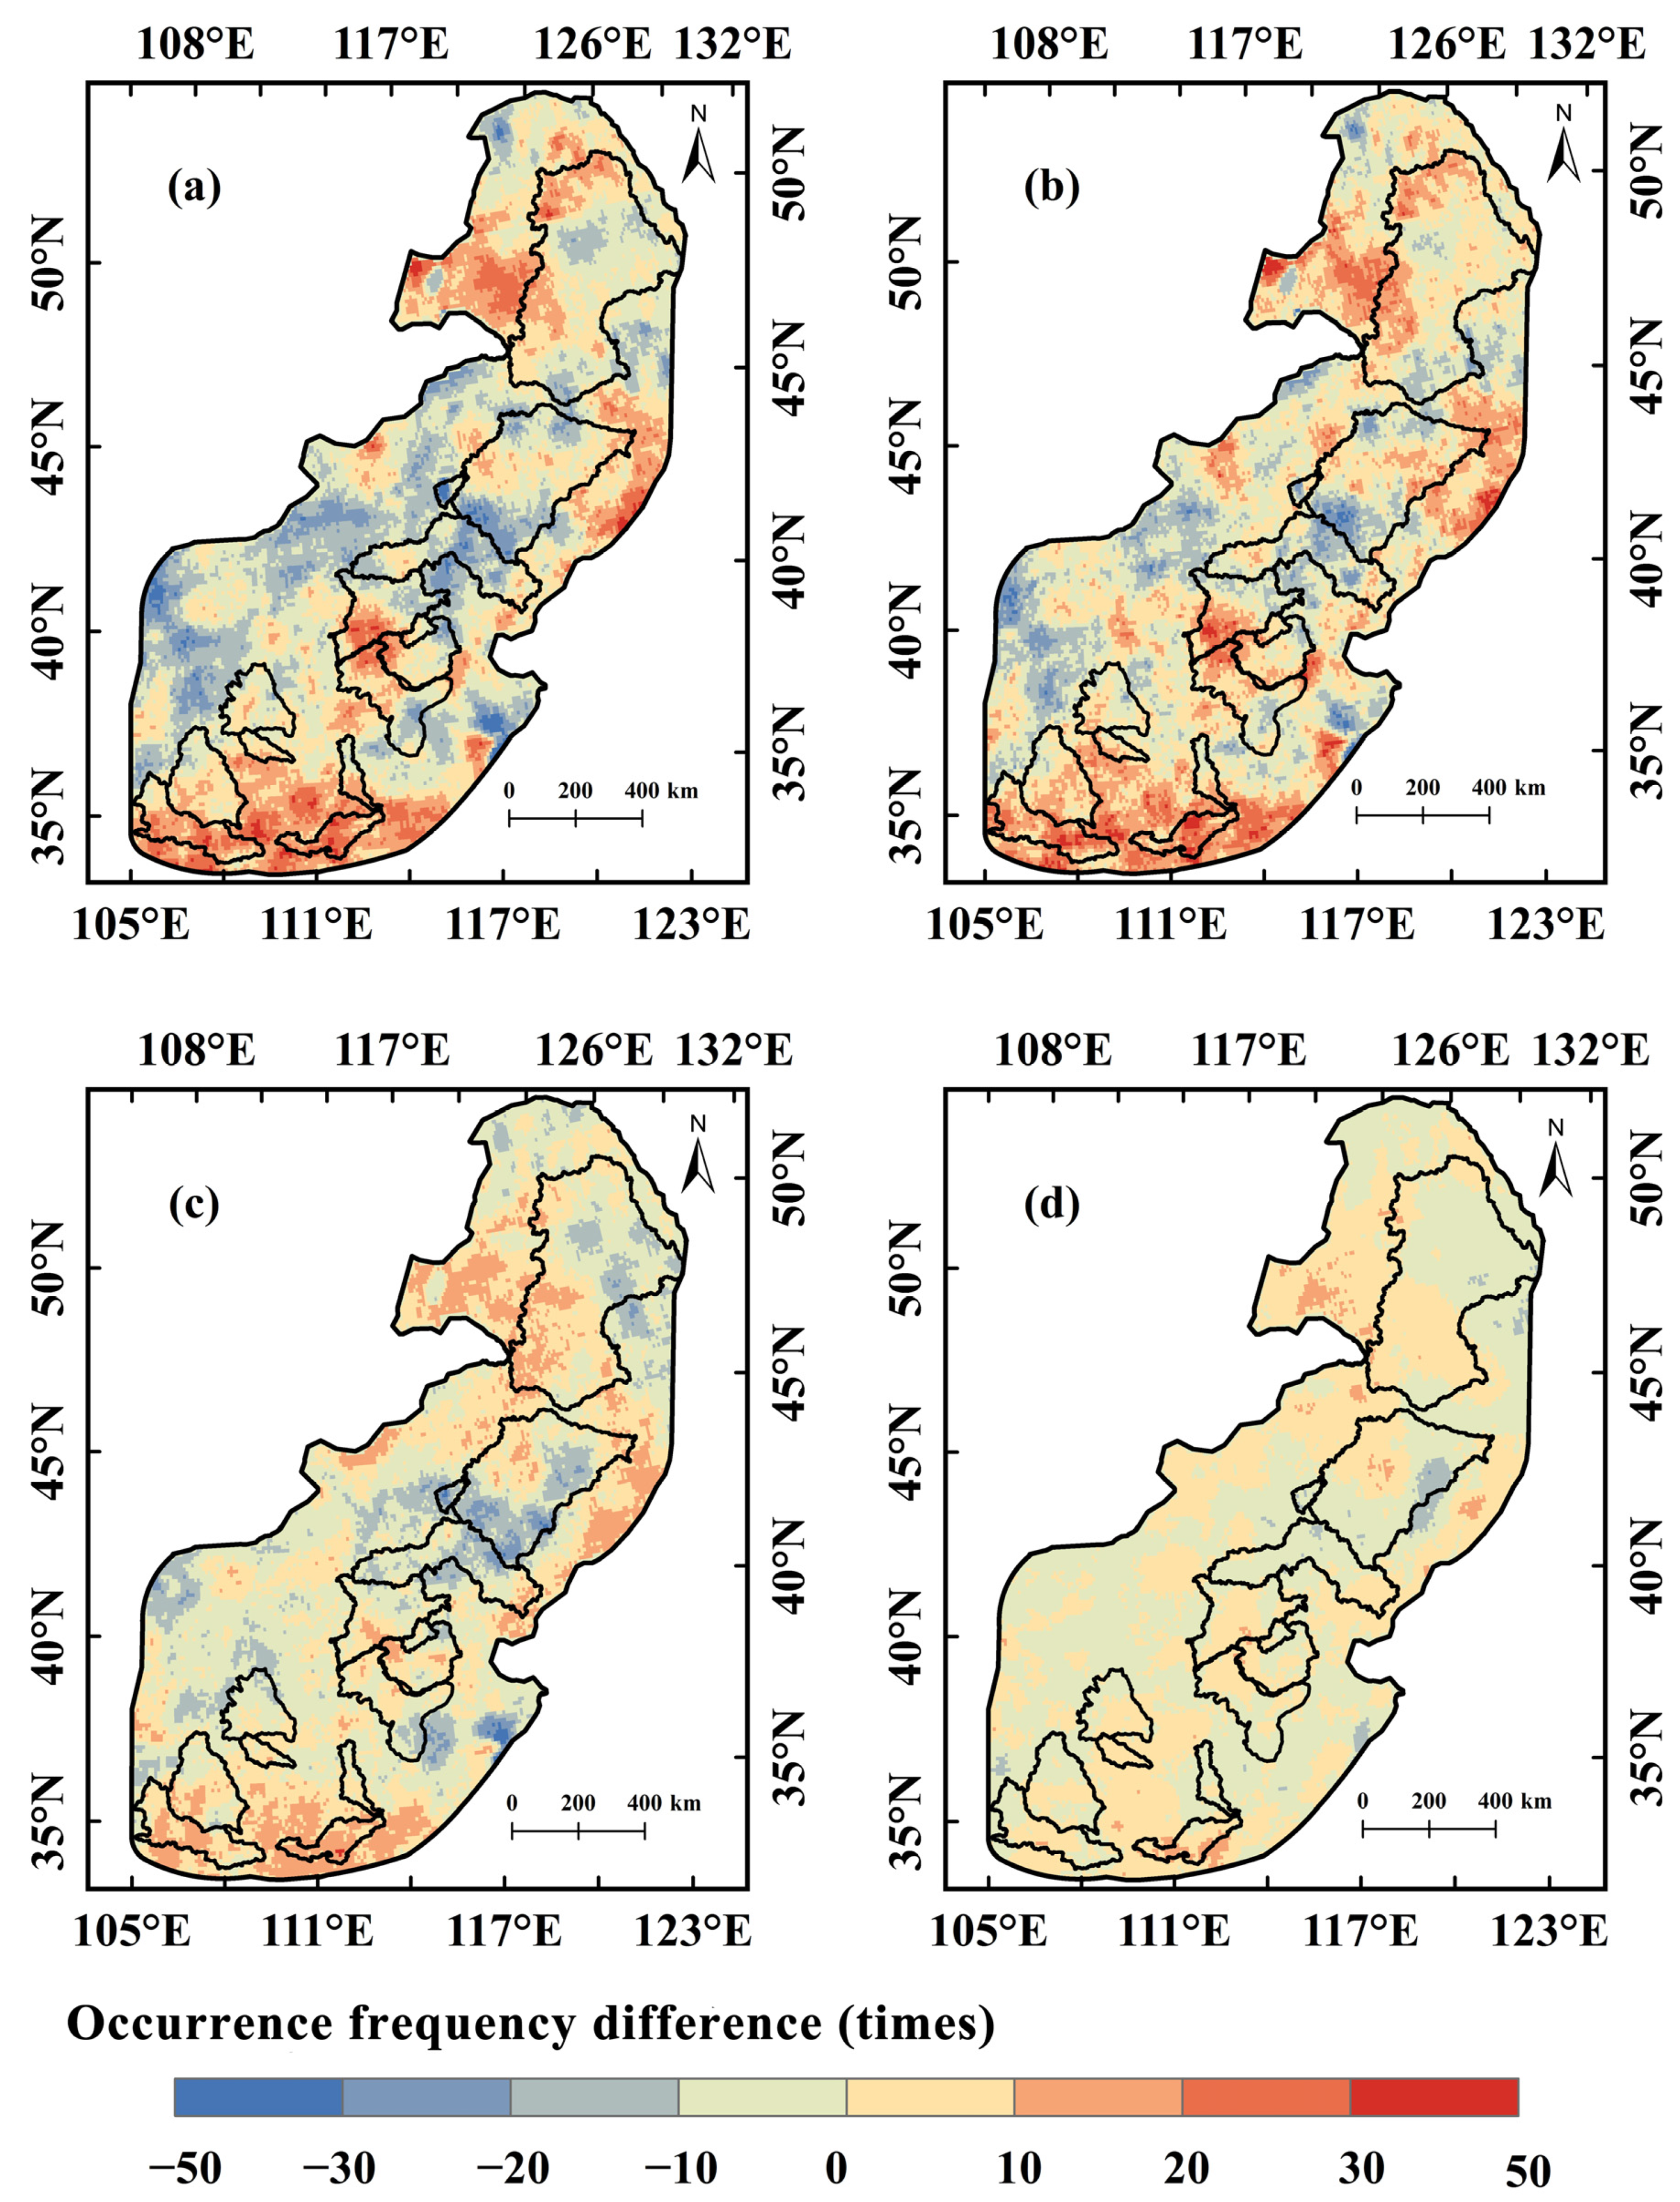
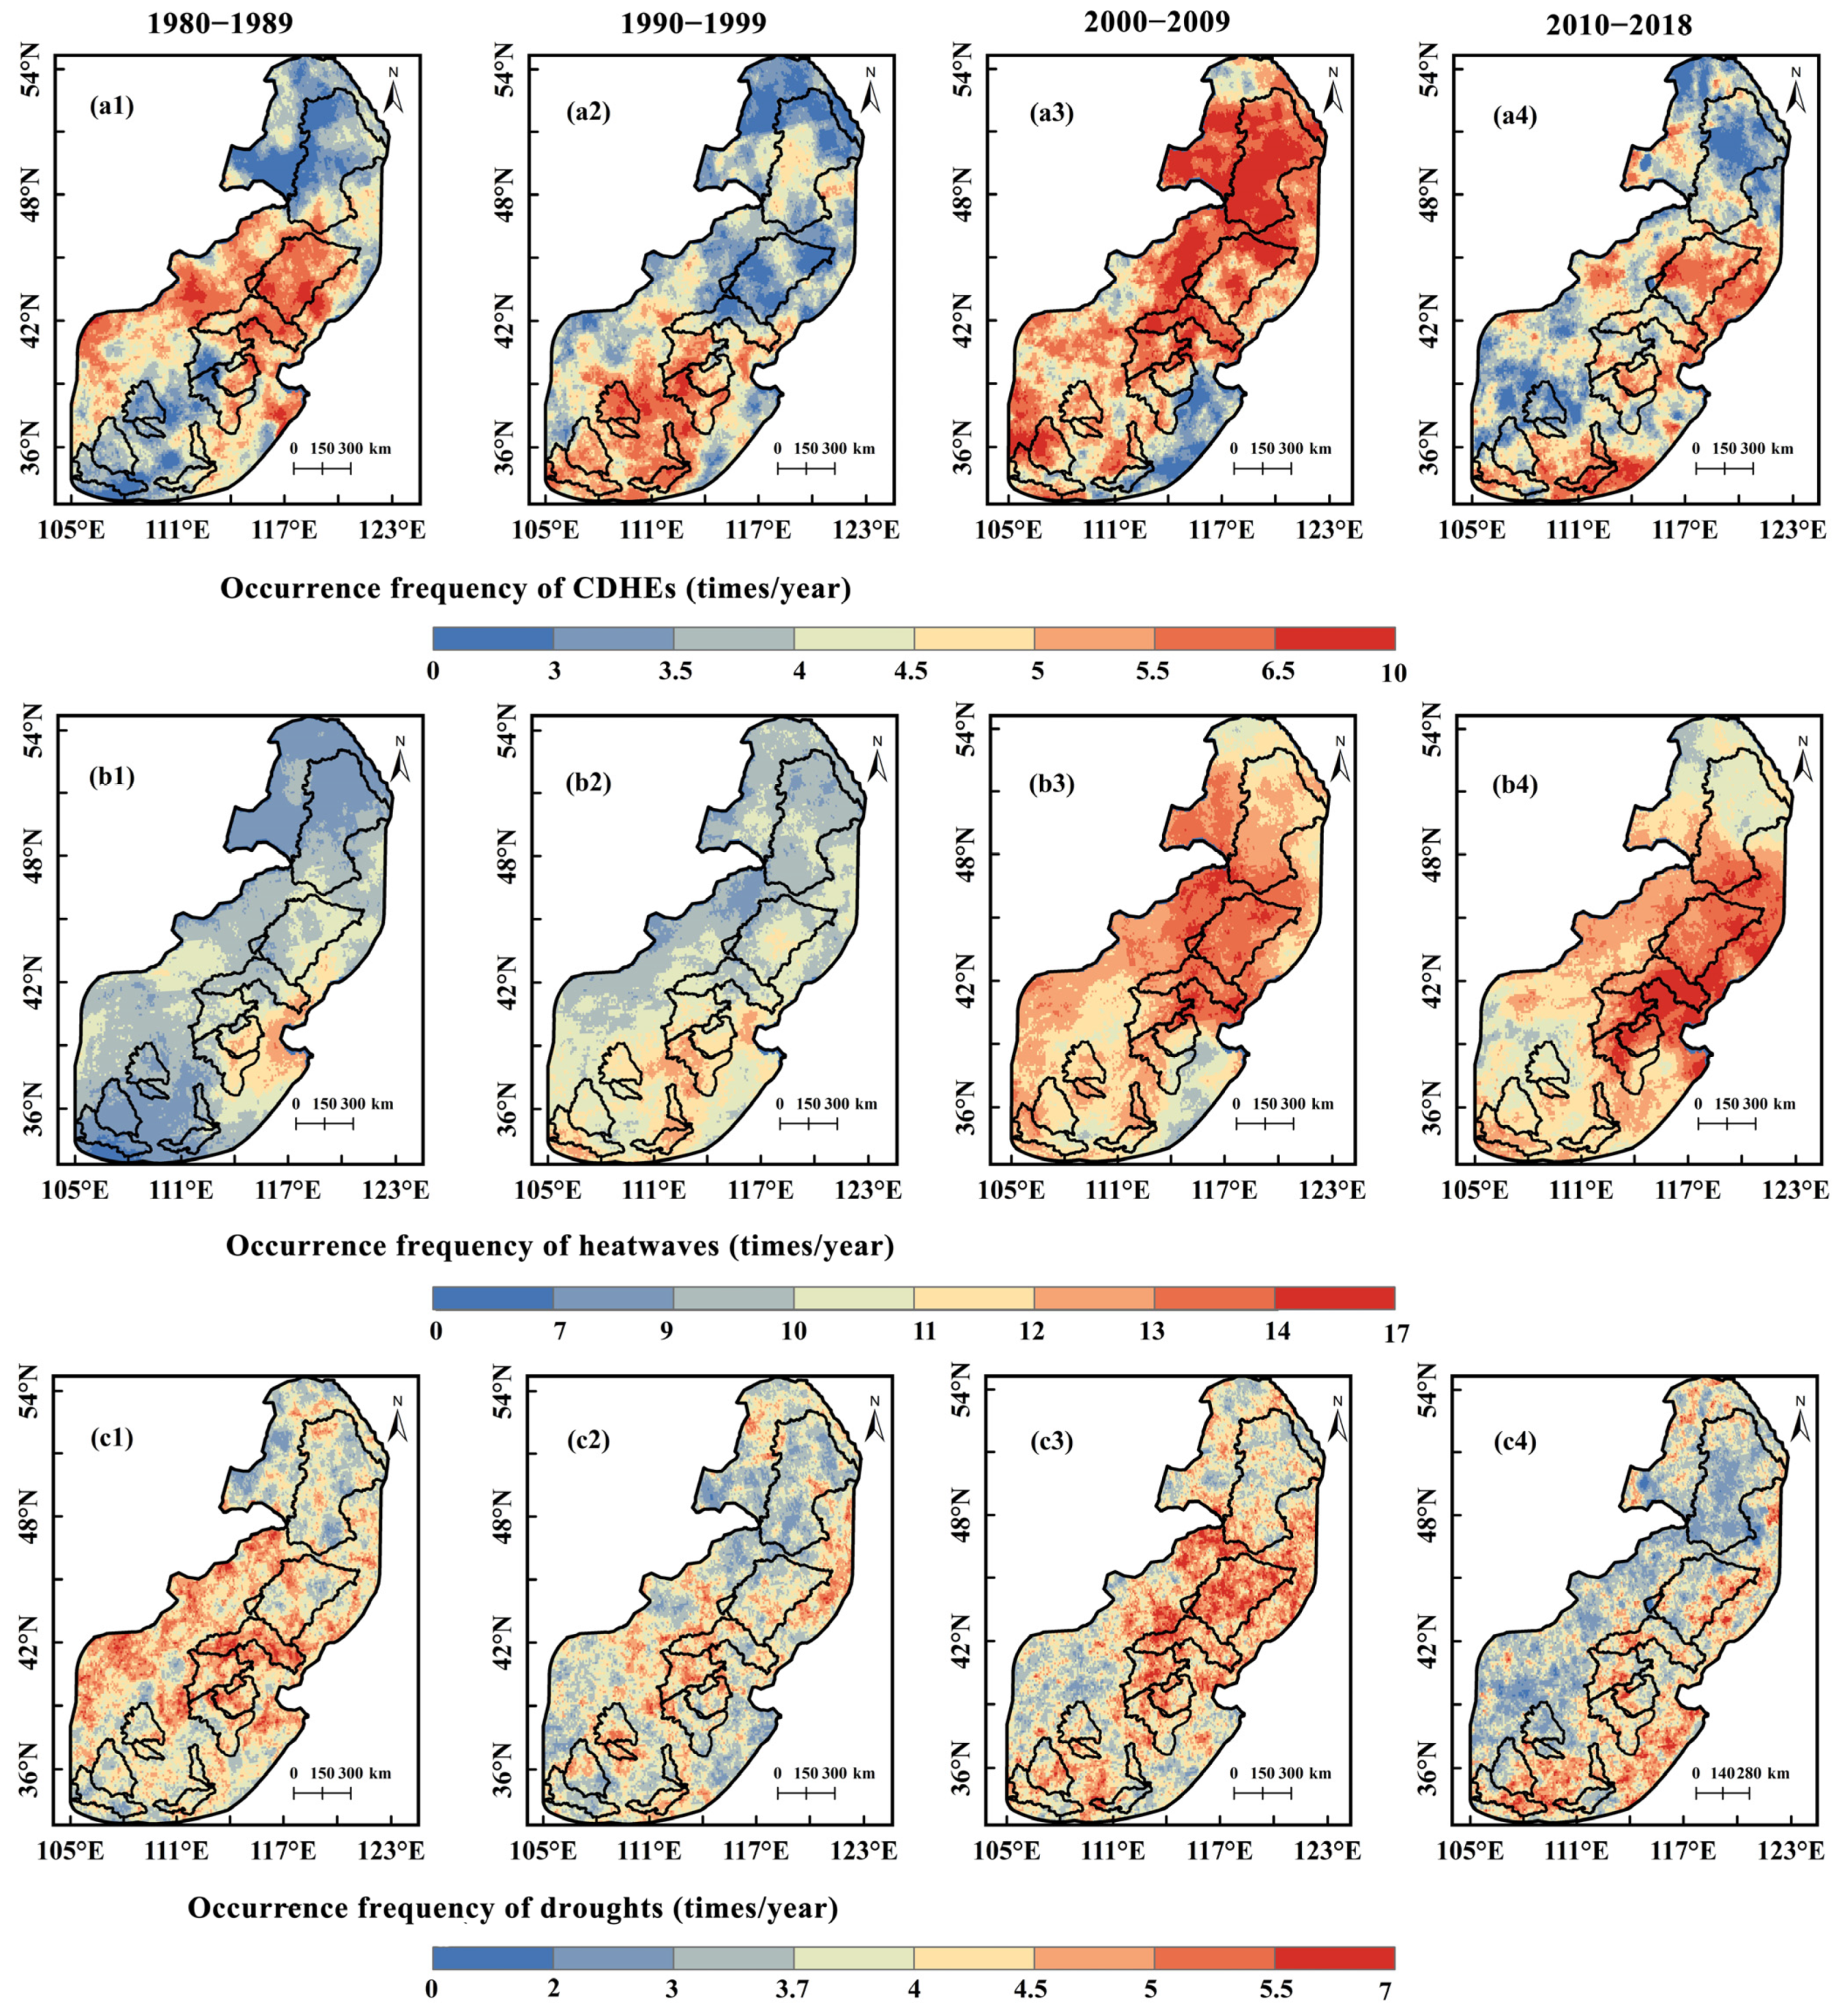
3.1. Frequency of CDHEs

During 1980–2018, the frequency of compound drought and heatwave events (CDHEs) exhibited an increasing trend in the southern and northern parts of the study area but a decreasing trend in central sub-basins (Figure 4). Compared to the 1980s, CDHE frequency increases of 20–50 times in the southern region and 10–30 times in the northern region in the 2010s were observed, with pronounced upward trends observed in the Yiluo River Basin, the Weihe River Basin, and the Nenjiang River Basin (Figure 4a). In the southern region, the magnitude of increase varied by severity: moderate CDHEs (0–50 times) > severe CDHEs (0–30 times) > extreme CDHEs (0–20 times) (Figure 4b–d). Conversely, central regions experienced CDHE frequency declines of 10–50 times, predominantly in the Luanhe River Basin (Figure 4a). Over 80% of the study area was affected by CDHEs, with extreme CDHEs impacting more than 25% of the region, indicating their extensive spatial influence.
The spatial patterns of CDHE frequency exhibit discernible interdecadal variations. During the 1980s, CDHEs were predominantly clustered in the central basins of the study region, specifically the Dali Lake, the West Liaohe River, the Luanhe River, and the Juma River Basins. This spatial concentration shifted in the 1990s to higher frequency occurrences in southern basins, particularly the Yiluo River, the Ching River, and the Weihe River Basins. Post-2000, CDHEs transitioned to broader coverage across the entire study area, with 87.66% and 59.2% of the region experiencing frequencies exceeding four events annually during the 2000s and 2010s, respectively (Figure 5(a1–a4)).
The spatial distribution of CDHE frequency was highly consistent with that of heatwaves. In regions with frequent heatwave events, such as the Dali Lake Basin, the Yongding River Basin, and the Luanhe River Basin during 1980–1989 (frequency > 10 times/year), the frequency of CDHEs was notably high (exceeding 4.5 times/year) (Figure 5(a1,b1)). In contrast, the spatial distribution of drought event frequency exhibited limited alignment with the spatial patterns of CDHE frequency across different decades. For instance, in the 1980s, drought frequency was generally high across the entire study area, with over 80.6% of the region experiencing more than 3.7 times/year (Figure 5(c1)). However, CDHEs during the same period showed a high frequency only in the central part of the study area. Similarly, in the 2000s, areas in the northern part of the region exhibited high CDHE frequency (exceeding 5 times/year), while drought frequency in those areas was relatively low, generally below 4 times/year (Figure 5(c3)). Drought events primarily exerted localized influences, contributing to reductions in CDHE frequency in specific regions. For instance, during the 2000s, the Yiluo River Basin experienced heatwave events exceeding 10 times/year. However, due to drought events occurring below 5 times/year in this region, CDHE frequencies ranged between 3 and 5 times/year (Figure 5(a3,b3,c3)). This suggests that drought events contribute relatively less to the interdecadal variation of CDHE frequency than to heatwave events.

3.2. Duration of CDHEs

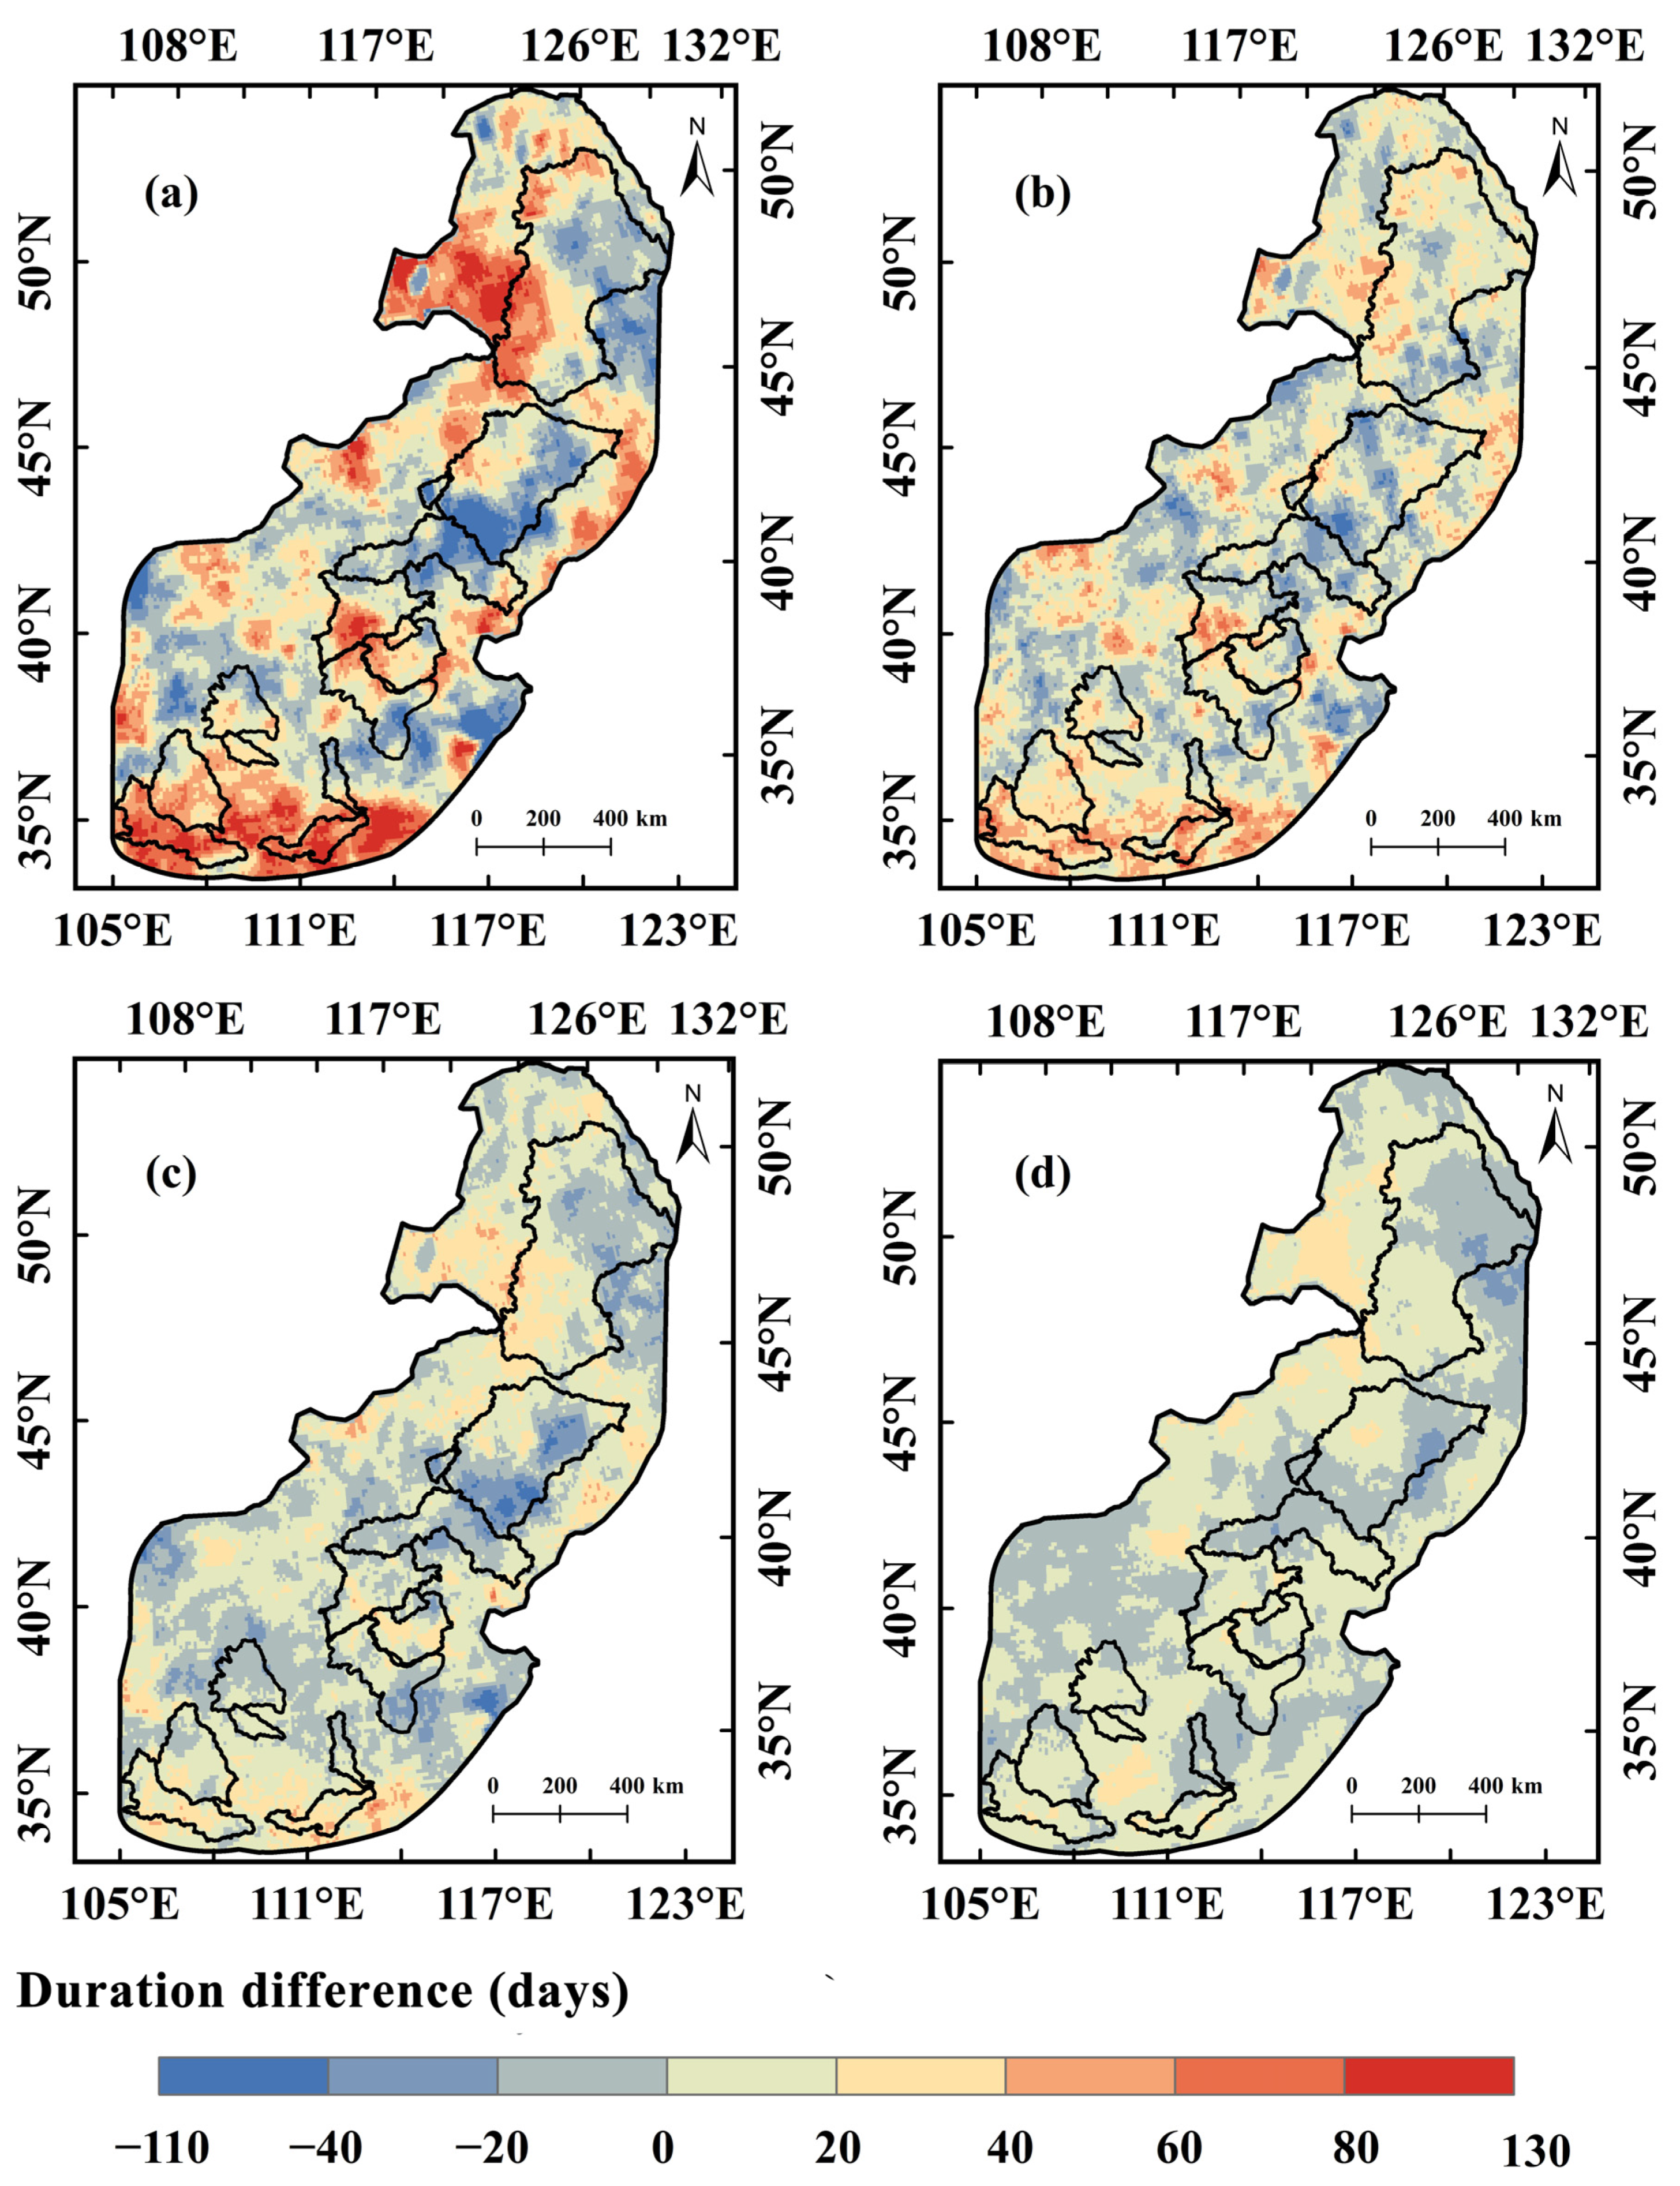
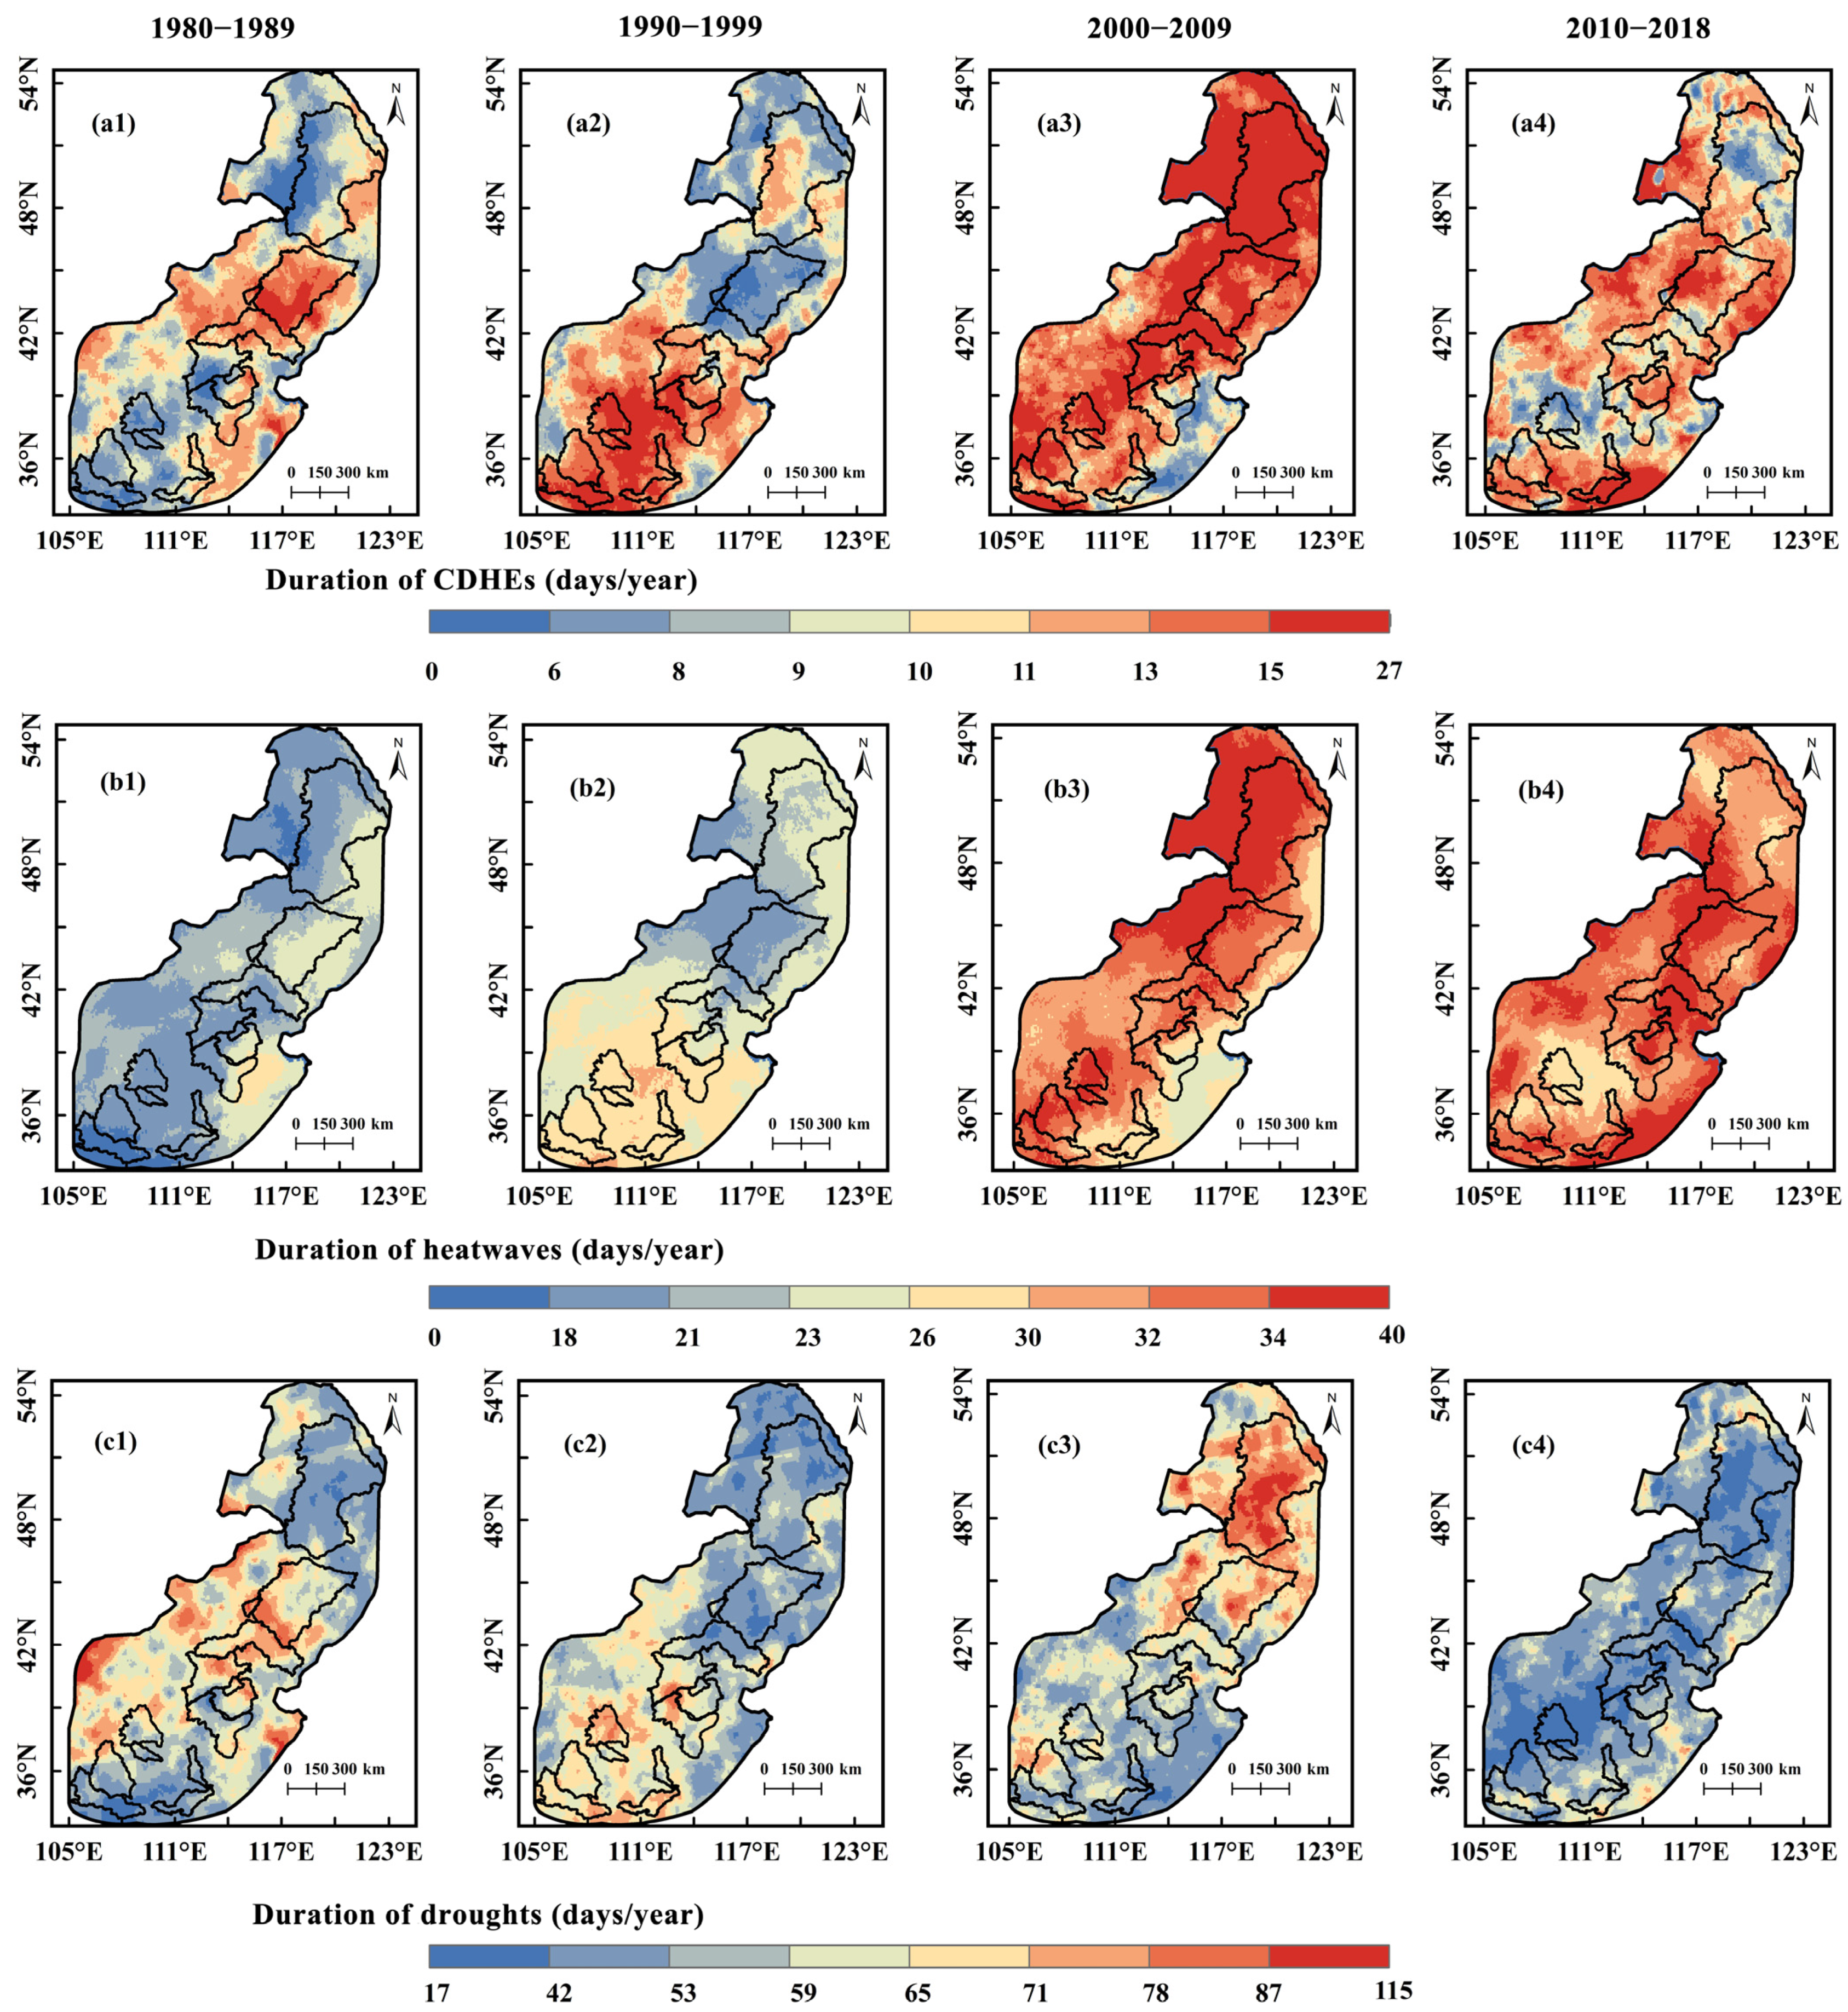
3.2.1. Spatiotemporal Variation of Annual Duration

From 1980 to 2018, the total annual duration of CDHEs exhibited a predominantly increasing trend across the study area. Compared to the 1980s, the total annual duration of CDHEs in the southern and northern regions during the 2010s increased by 40–130 days. In the southern region, the magnitude of increase followed a severity-dependent hierarchy: moderate events (0–130 days) > severe events (0–60 days) > extreme events (0–40 days) (Figure 6). During the 1980s, 28.3% of the region experienced a total annual duration exceeding 11 days/year, concentrated in the central study area. By the 2010s, the spatial extent with total annual durations surpassing 11 days/year expanded to 56.7%, particularly during the 2000s when most regions, except the southeastern study area (averaging 0–9 days/year), showed total annual durations above 11 days/year. Notably, the Yiluo River Basin demonstrated a marked escalation in total annual CDHE duration, rising from an average of 9.91 days/year in the 1980s to 16.96 days/year in the 2010s (Figure 7(a1–a4)).
From 1980 to 2018, heatwaves exhibited a significant upward trend, with their interdecadal spatial distribution patterns showing high consistency with those of CDHEs. Compared to the 1980s, the 2010s witnessed marked increases in the total annual duration of heatwaves across the entire study area, particularly in the Yiluo River and Weihe River Basins where total annual durations of heatwaves surged from 0–18 days/year (1980s) to over 32 days/year (2010s)—representing the most pronounced intensification (Figure 7(b1–b4)). Spatially, longer total annual heatwave durations (>21–26 days/year) during the 1980s were concentrated in central basins, shifting southward in the 1990s (23–32 days/year), and becoming ubiquitous post-2000, with the total annual durations exceeding 26 days/year (Figure 7(b1–b4)). This spatial coherence between heatwaves and CDHEs further corroborates heatwaves’ dominant role in driving CDHE dynamics.
In contrast, drought event durations from 1980 to 2018 demonstrated complex spatial heterogeneity with no significant monotonic trend. The 1980s saw prolonged droughts (>53 days/year) in central basins, followed by a southward migration of drought cores in the 1990s. By the 2000s, drought hotspots shifted northward, particularly in the Nenjiang River Basin, where total annual durations of droughts exceeded 65 days/year. The 2010s exhibited reduced total annual drought durations basin-wide (<59 days/year) (Figure 7(c1–c4)). The total annual duration of drought events exhibited substantial variability with limited temporal regularity, characterized by complex and unstable interdecadal differences.

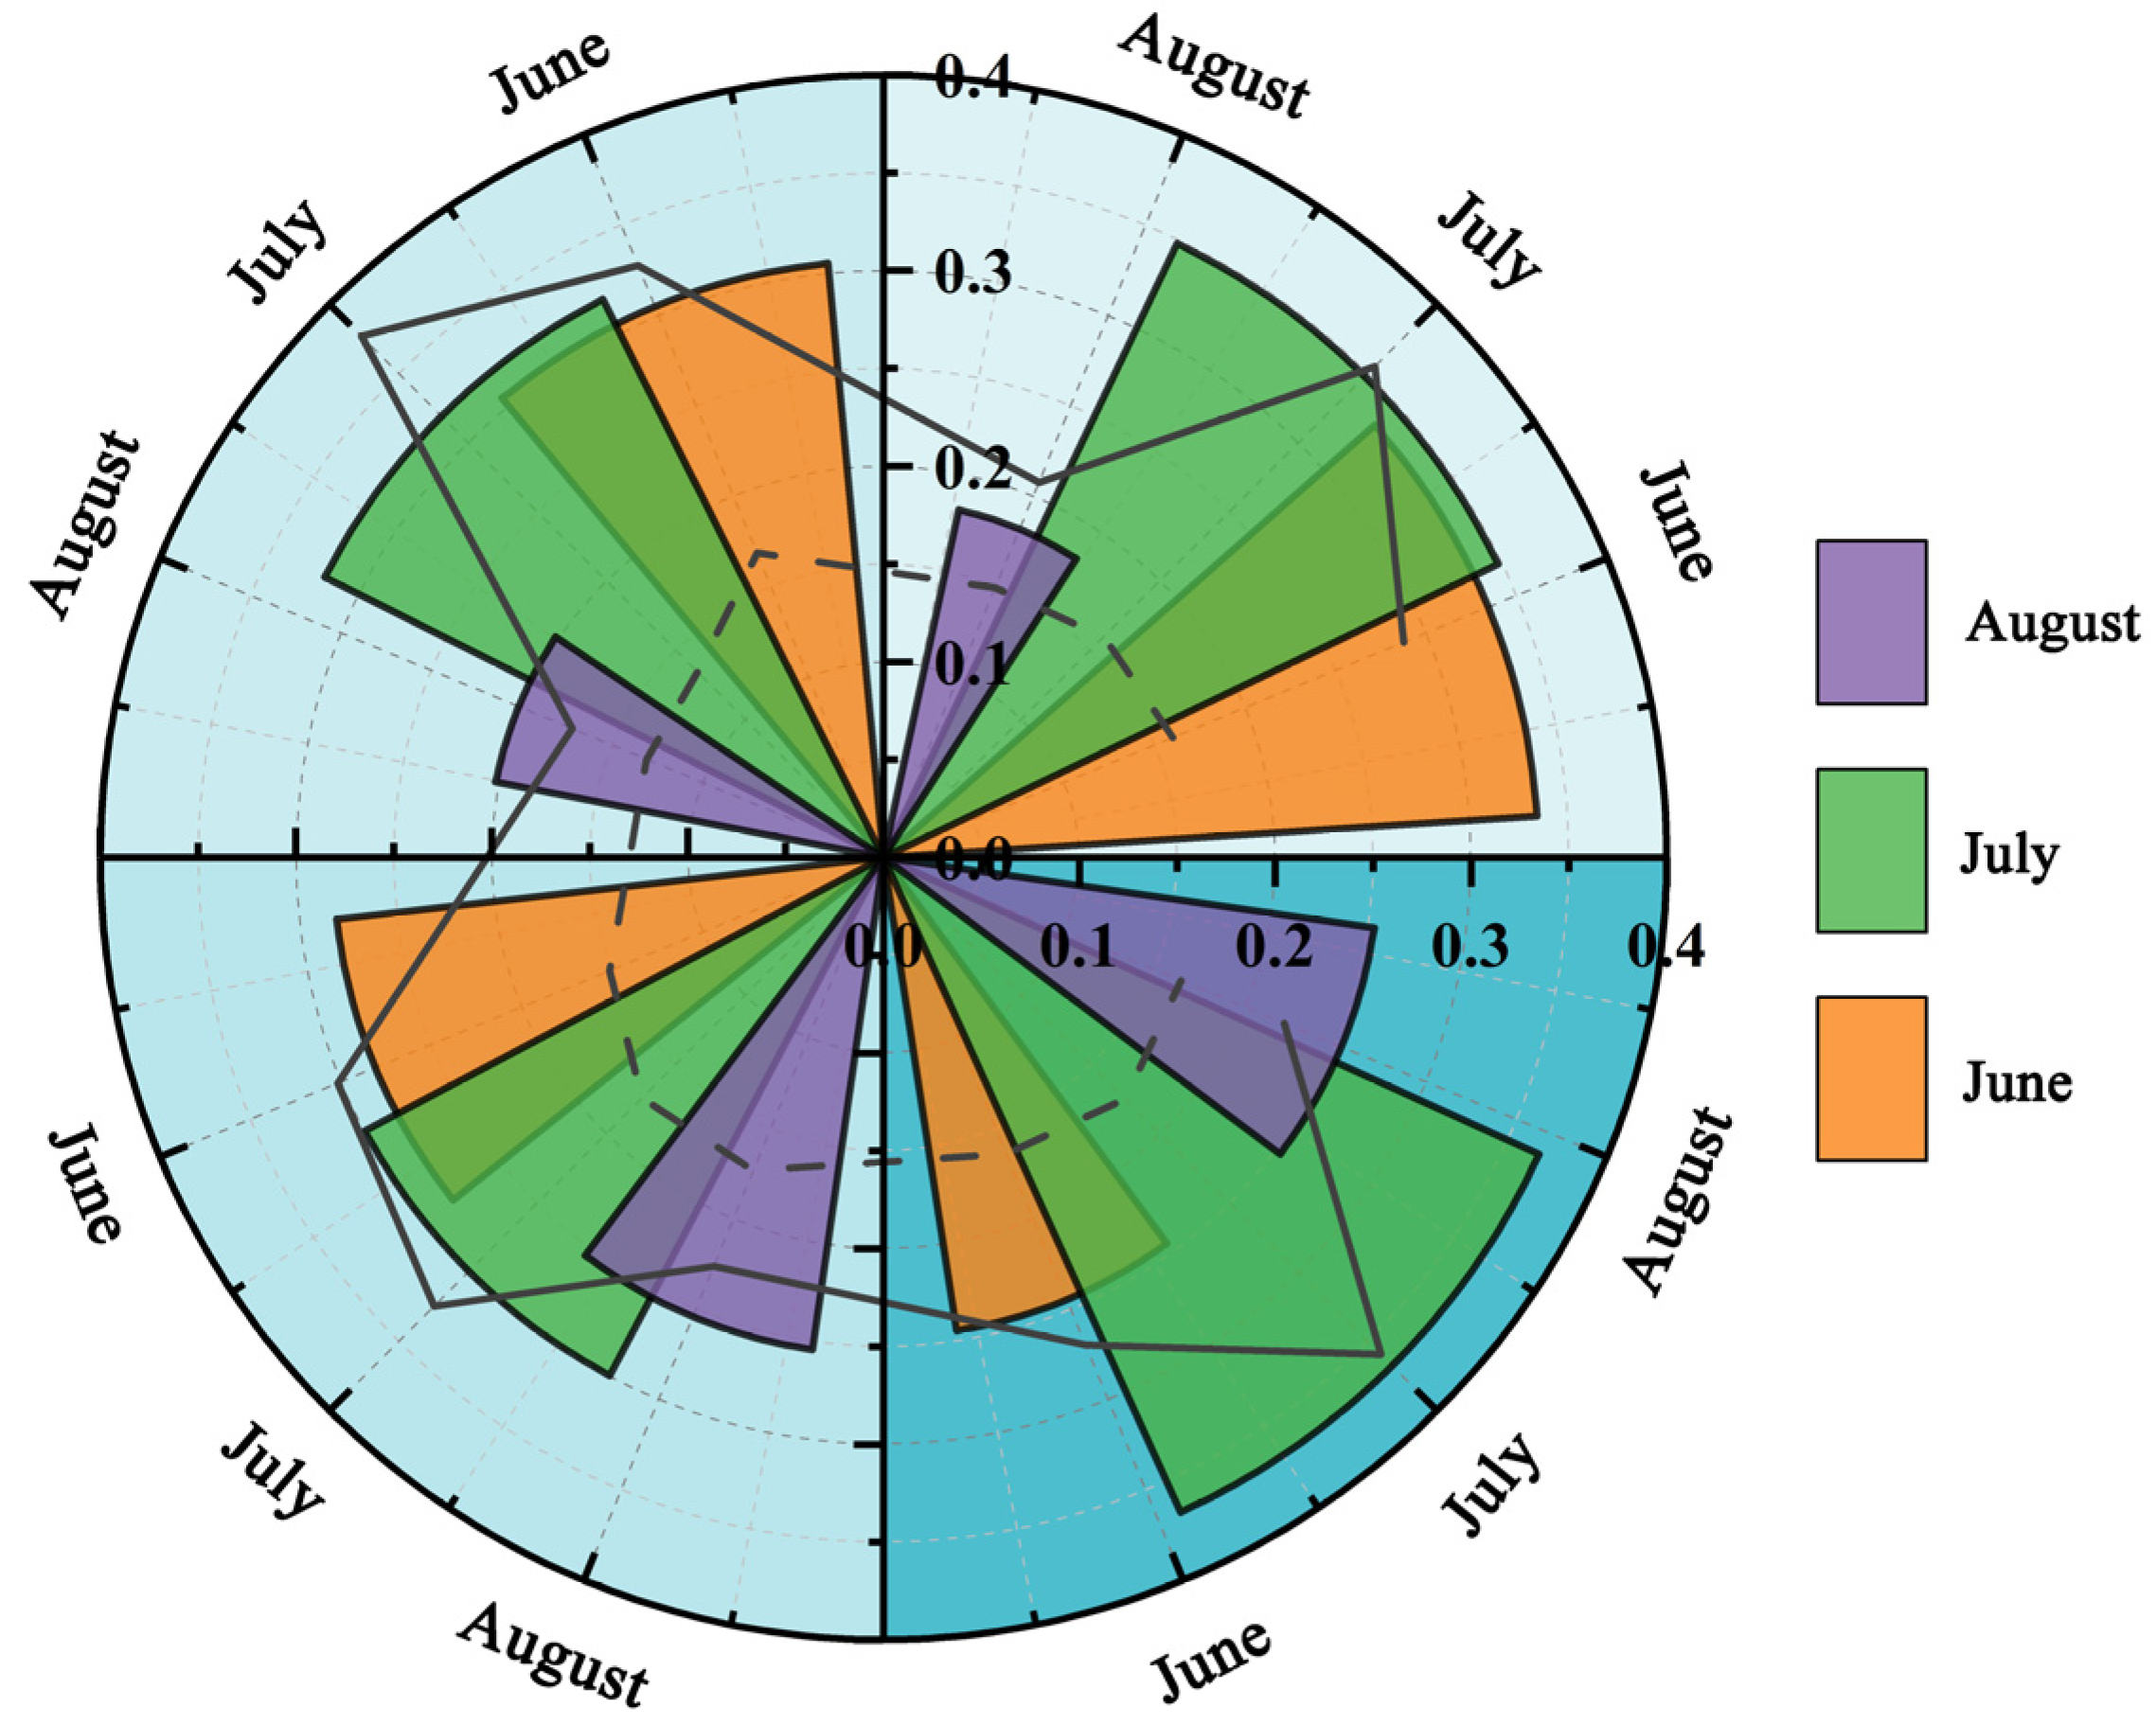
3.2.2. Temporal Variation of Compound Drought and Heatwave Events with Different Duration

The temporal evolution of CDHEs by duration category reveals a clear shift toward longer-lasting events. While the proportion of short-duration CDHEs has declined over time, medium, mid-to-long, and long-duration events have exhibited increasing trends. This pattern aligns with the overall rise in the total annual duration of CDHEs, suggesting an intensification of event persistence. Taking extreme CDHEs as an example, the proportional increases (from the 1980s to the 2010s) across duration categories were as follows: medium duration events (9.8%) > mid-to-long duration events (2.7%) > long duration events (0.4%). Concurrently, the proportion of extreme short-duration CDHEs decreased by 12.8 percentage points, declining from 86.9% in the 1980s to 74.1% in the 2010s (Figure 8(a1–a4)).
Similar declines were observed in short-duration heatwave events, with the proportion of extreme short-duration heatwaves dropping by 8.7 percentage points between the 1980s and 2010s (Figure 8(b4)). Short-duration drought events also displayed a diminishing trend, though less pronounced, as exemplified by a 2.4 percentage point reduction in extreme short-duration droughts from the 1980s to the 2010s (Figure 8(c4)). The declining proportion of short-duration CDHEs was closely linked to temporal shifts and may reflect shifts in heatwave durations.
The occurrence dates of CDHEs exhibited a delayed trend. During June, July, and August in the 1980s, the occurrence proportions of CDHEs were 33.4%, 34.8%, and 18.2%, respectively. By the 2010s, the proportion in June decreased by 8.9 percentage points, while July and August saw increases of 2 and 7.1 percentage points, respectively (Figure 9). This indicates a temporal shift in the CDHE occurrence date toward July and August. The occurrence date of heatwave events showed strong similarity to CDHEs, with both exhibiting high occurrence probabilities (>80%) during June, July, and August. In contrast, drought events displayed relatively uniform monthly distributions, with occurrence probabilities of approximately 20% each month from May to October (Figure 9). These patterns suggest that the monthly distribution of CDHE occurrence dates is primarily influenced by the timing of heatwave events. The delayed occurrence dates of drought events contributed to the postponement of CDHEs. For instance, during 2010–2018, the proportions of drought events in July and August were 17.45% and 16.44%, respectively, representing increases compared to 1980–1989 (14.93% and 13.98%). However, in the 1980s, the proportions of heatwave events occurring in June, July, and August were 28.7%, 35.4%, and 20.7%, respectively, whereas in the 2010s, these values were 27.0%, 25.9%, and 22.1%. Compared to the 1980s, the probability of heatwave events occurring in July and August increased by only 1.7% (Figure 9). Thus, no significant increases were observed in the proportions of heatwave events during July and August over the same period.

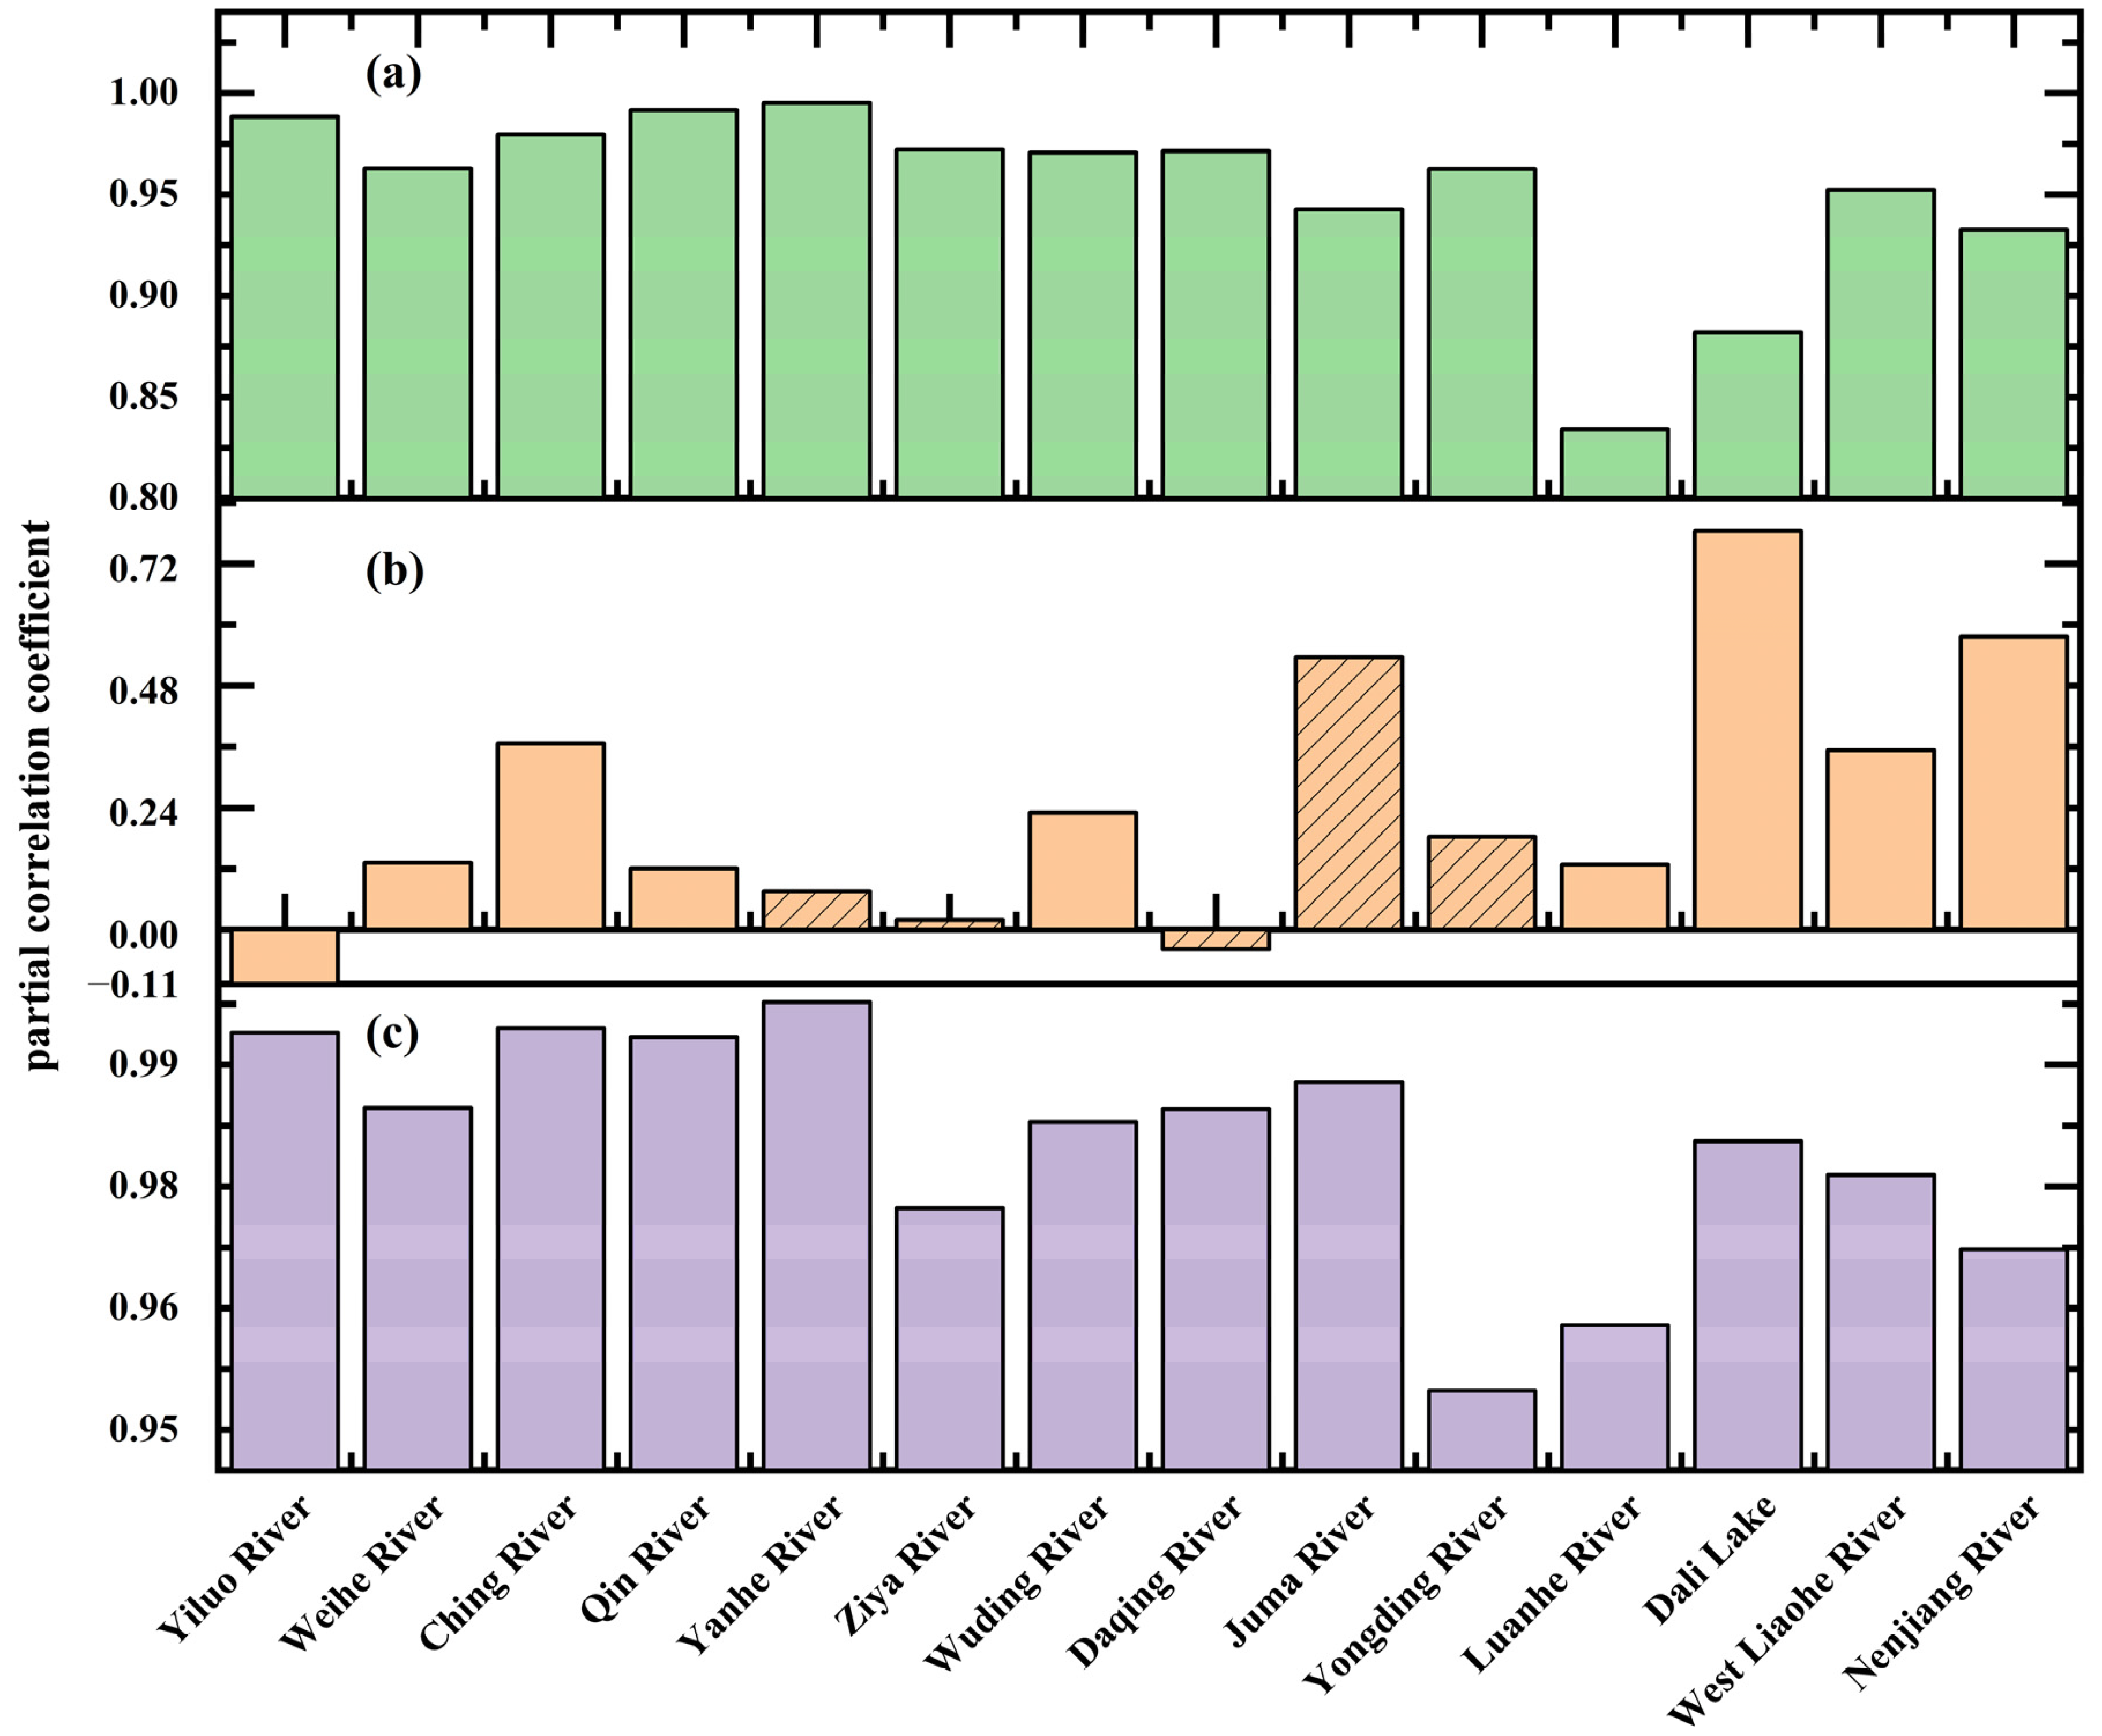
3.3. Attribution Analysis of Compound Drought and Heatwave Events

Heatwave events and the synchronicity of heatwave and drought events emerged as the primary drivers of CDHE variability. Heatwaves exerted dominant control over CDHEs, with partial correlation coefficients ≥0.95 across all sub-basins, indicating a strongly positive influence on CDHE occurrence. Although slightly lower than heatwave impacts, the synchronicity of heatwave and drought events maintained partial correlations > 0.83 with CDHEs (Figure 10), underscoring the non-negligible role of heat-drought coupling in driving CDHEs.
Spatiotemporal analysis of the synchronicity of heatwave and drought events revealed its pronounced interdecadal shifts from 1980 to 2018. Between 1980 and 1989, higher synchronicity predominated in the central region, particularly the West Liaohe River, Dali Lake, and Luanhe River Basins (≥0.55). The 1990s saw a southward migration of high synchronicity zones, concentrated in the Ziyahe River, Wudinghe River, and Yiluo River Basins. Widespread high synchronicity persisted across most regions in 2000–2009, followed by a moderate decline in the 2010s (Figure 11). These spatial patterns aligned closely with CDHE frequency and total annual duration distributions across decades.
In contrast, drought events exhibited weaker associations with CDHEs, showing partial correlations of generally <0.6 and even negative correlations in some sub-basins. This suggests the limited direct drought influence on CDHE formation. However, drought impacts intensified with an increasing latitude and decreasing annual mean temperature. In high-latitude regions (e.g., the Nenjiang River Basin), droughts demonstrated enhanced contributions to CDHEs, while both heatwaves and the synchronicity of heatwave and drought events displayed minor weakening contributions to CDHEs (Figure 10).
Heatwave events play a dominant role in the occurrence dates and duration of CDHEs. A significant correlation exists between the duration of heatwave events and CDHEs, with a partial correlation coefficient of 0.816, indicating a strong influence of heatwaves on the durations of CDHEs. In contrast, drought events showed no significant correlation with CDHE durations, as evidenced by a partial correlation coefficient of only 0.548, suggesting the relatively weak influence of droughts on CDHE durations. Further partial correlation analysis revealed that the occurrence dates of CDHEs across different severity levels were strongly associated with the occurrence dates of heatwaves, with partial correlation coefficients exceeding 0.97. This demonstrates that the timing of CDHEs is almost entirely determined by the occurrence dates of heatwave events, further confirming the dominant role of heatwaves in CDHE dynamics. Conversely, the partial correlation coefficients between CDHE occurrence dates and drought event occurrence dates were consistently below 0.5 and statistically insignificant, indicating the minimal influence of droughts on the occurrence dates of CDHEs (Table 2). In summary, heatwave events exert a far greater influence than drought events on key characteristics of CDHEs, including duration and occurrence dates. Although drought events contribute to the formation of CDHEs, their impact is considerably limited compared to that of heatwaves.

4. Discussion

The analysis of the dominant factors driving compound drought and heatwave events (CDHEs) in this study aligns closely with the mechanisms identified in previous research. Earlier studies have demonstrated that the increased probability of heatwave occurrences [35,36,37], coupled with the bidirectional coupling between drought and heatwave conditions [38,39,40], contributes significantly to the frequent emergence of CDHEs. Consistent with these findings, this study further confirms through partial correlation analysis that heatwave events and the synchronicity of heatwave and drought events are the primary drivers of CDHEs, whereas the individual influence of drought alone is comparatively weak. These results reinforce the view that, under the context of climate change, heatwaves play a leading role in shaping the evolution of CDHEs. External factors such as global warming [41], the El Niño-Southern Oscillation (ENSO) [42], and atmospheric circulation anomalies [43] provide the dynamic conditions for frequent heatwave events. Anthropogenic greenhouse gas emissions may intensify atmospheric circulation anomalies [44] and accelerate global warming [45]. These changes are likely to increase both the frequency and uncertainty of heatwave events, posing substantial challenges for prediction and early warning efforts. This upward trend has reinforced the dominant influence of heatwaves on compound drought and heatwave events (CDHEs), leading to an overall rise in both CDHE frequency and persistence. Against this backdrop of climate change, the overall warming trend during China’s growing season dominates the occurrence of heatwaves [46]. The aerosol optical depth at 550 nm has significantly reduced in the semi-arid and semi-humid regions of northern China [47]. Driven by aerosol–radiation interactions [48], this reduction has increased net surface shortwave radiation, resulting in a rise in regional temperatures. Additionally, under the RCP8.5 scenario, the average growth rate of extreme heatwaves in China is approximately 0.1 [49], significantly higher than other scenarios, indicating that increased longwave radiation due to human activities and technological advancements also contributes to frequent heatwaves. Existing studies have shown that the impact of heatwaves in this region is markedly more significant than that of droughts [50].
Positive land–atmosphere feedback mechanisms amplify the synergistic effects of heatwaves and droughts, a process particularly pronounced in ecologically and hydrologically vulnerable transition zones. Increasing evidence suggests that the primary trigger for land–atmosphere feedback has shifted from droughts to extreme temperatures [51,52]. Rising temperatures exacerbate soil moisture deficits, reducing evaporation [53] and subsequently leading to precipitation deficits. According to energy balance principles, decreased latent heat flux increases sensible heat flux, further elevating surface temperatures [54,55,56]. Heatwaves intensify evapotranspiration demands, accelerating soil moisture depletion and creating a self-reinforcing cycle. Moreover, the hotspot region for soil moisture–temperature feedback in China spans from the northeast to central China [57], with the strongest soil moisture–temperature coupling occurring in transition zones [58]. Anthropogenic activities, particularly the rising concentrations of greenhouse gases, have significantly intensified temperature increases in semi-humid and semi-arid regions. This warming enhances potential evapotranspiration (PET), aggravating soil moisture deficits and driving a pronounced “warming–drying” trend. Human activities have contributed to 87.5% (2.1 × 10⁻³ m3/m3) of the global decline in root-zone (0–100 cm) soil moisture, with greenhouse gas emissions identified as the dominant factor [59]. In addition, land use changes induced by human activities—such as the conversion of grasslands to croplands or shrublands—have substantially altered surface energy partitioning [60]. Deforestation and urbanization reduce vegetation transpiration, weaken the regulation of surface temperature by latent heat flux, and further diminish soil moisture [61,62]. These processes intensify soil moisture–temperature feedback, reinforcing the vulnerability of these transitional zones to CDHEs. Thus, under frequent heatwave conditions and the influence of strong bidirectional drought–heatwave coupling, the semi-arid and semi-humid regions of northern China have become a hotspot for CDHEs. Anthropogenic activities—such as greenhouse gas emissions, land use changes, the excessive exploitation of water resources, and the expansion of industrial and agricultural sectors—have significantly increased the likelihood of compound drought and heatwave events (CDHEs) in semi-humid and semi-arid regions. Evidence indicates that human-induced factors contribute to over 50% of such events globally, with attribution rates exceeding 90% in certain regions, such as the Yangtze River Basin in China [63].
This study, based on daily scale data, found that compound drought and heatwave events (CDHEs) occurred most frequently from June to August, exhibiting a unimodal distribution. Previous studies have suggested that the persistent intensification and westward extension of the subtropical high-pressure system [64,65] promote the stable maintenance of heatwave conditions during June to August, increasing the likelihood of prolonged heatwave events and contributing to the unimodal temporal pattern. The temporal patterns of heatwave events closely mirror those of CDHEs, indicating that heatwave timing is the primary factor influencing the uneven seasonal distribution of CDHEs. This is consistent with the results of the partial correlation analysis conducted in this study. Although heatwaves dominate the temporal distribution of CDHEs, the role of droughts cannot be overlooked, as global warming has shortened drought cycles and intensified drought severity [66]. Under the combined influence of anomalous anticyclones and the East Asian monsoon [67], drought events have shown a significant upward trend in August [68,69], further contributing to the increased occurrence dates of CDHEs in July and August. The observed delay in drought onset aligns with this study’s finding that the onset dates of CDHEs have shifted later in the summer. Together, these results underscore the critical role of heatwave–drought temporal coupling in shaping the seasonal dynamics of CDHEs.

5. Conclusions

This study analyzed the spatiotemporal variations of compound drought and heatwave events (CDHEs) in the semi-arid and semi-humid regions of northern China from 1980 to 2018, based on daily scale Standardized Precipitation Index (SPI) and maximum temperature data. Spatial pattern analysis was used to examine the spatiotemporal characteristics of compound drought and heatwave events (CDHEs) from 1980 to 2018. In addition, partial correlation analysis was conducted to explore the relationships between CDHEs, heatwave events, and drought events.
From 1980 to 2018, occurrence frequency of CDHE showed an increasing trend in the southern and northern parts of the study area but a decreasing trend in some central sub-basins. The increase rate of CDHE frequency and duration varied by severity: moderate > severe > extreme. Compared to the 1980s, the frequency of CDHEs increased by 20–50 times in the south and 10–30 times in the north in 2010s. The total annual duration of CDHEs exhibited an upward trend across the entire study area, the percentage of area affected by CDHE with a duration exceeding 11 days/year has risen from 28.3% to 56.7%. Spatially, CDHE frequency and duration showed significant interdecadal variations: hotspots shifted from the central region in the 1980s to the southern region in the 1990s and became more uniformly distributed across the study area after the 2000s. These changes were primarily driven by heatwave events and the synchronicity of heatwave and drought events, with drought events exerting relatively minor and complex influences.
Short-duration CDHEs in all severity levels showed a declining trend, particularly in extreme CDHEs, whose proportion decreased from 86.9% in the 1980s to 74.1% in the 2010s. This decline was mainly attributed to the reduction in short duration heatwaves, the extreme short-duration heatwaves decreased by 8.7% from the 1980s to the 2010s. Influenced by heatwave occurrence dates, CDHEs predominantly occurred in June, July, and August. Moreover, the delayed occurrence of drought events contributed to a progressive shift toward later occurrence dates of CDHEs. Compared to the 1980s, the occurrence frequency of CDHEs occurring in August increased by 2.46% in the 2010s.
By utilizing daily scale data, this study offers a more detailed depiction of CDHE evolution and provides a methodological reference for high-temporal-resolution event identification. The pattern of CDHEs provides a basis for projecting future developments and formulating regional climate adaptation strategies. However, based on daily scale data, the inclusion of events shorter than three days may introduce bias, as such brief events are more susceptible to fluctuations in temperature and precipitation. A more comprehensive metric combining magnitude and duration would better reflect event severity. Furthermore, future studies should investigate the physical drivers of CDHEs, including atmospheric circulation patterns, solar radiation, and soil properties, to better understand their formation mechanisms. In addition, evaluating the socio-economic and ecological impacts of CDHEs will be essential for enhancing resilience and adaptive capacity in the face of ongoing climate change.

Author Contributions

Conceptualization, methodology, validation, visualization, and writing—original draft preparation, Z.L.; data curation, S.H.; supervision, project administration, funding acquisition, writing—review and editing, S.H. and X.M. All authors have read and agreed to the published version of the manuscript.

Funding

This work was supported by the National Key Research and Development Program of China (No. 2022YFF0801804). We are very grateful to anonymous reviewers on their numerous comments and suggestions that improved the manuscript.

Institutional Review Board Statement

Not applicable.

Informed Consent Statement

Not applicable.

Data Availability Statement

The datasets generated during and analyzed during the current study are available from the corresponding author on reasonable request.

Conflicts of Interest

The authors declare no conflicts of interest.

Abbreviations

The following abbreviations are used in this manuscript:
CDHDCompound Drought and Heatwave Day
CDHECompound Drought and Heatwave Event
SPIStandardized Precipitation Index
TmaxMaximum temperature

References

  1. Naumann, G.; Alfieri, L.; Wyser, K.; Mentaschi, L.; Betts, R.A.; Carrao, H.; Spinoni, J.; Vogt, J.; Feyen, L. Global Changes in Drought Conditions Under Different Levels of Warming. Geophys. Res. Lett. 2018, 45, 3285–3296. [Google Scholar] [CrossRef]
  2. Yuan, X.; Wang, Y.; Ji, P.; Wu, P.; Sheffield, J.; Otkin, J.A. A Global Transition to Flash Droughts under Climate Change. Science 2023, 380, 187–191. [Google Scholar] [CrossRef] [PubMed]
  3. Spinoni, J.; Naumann, G.; Carrao, H.; Barbosa, P.; Vogt, J. World Drought Frequency, Duration, and Severity for 1951–2010: World Drought Climatologies for 1951–2010. Int. J. Climatol. 2014, 34, 2792–2804. [Google Scholar] [CrossRef]
  4. Keellings, D.; Moradkhani, H. Spatiotemporal Evolution of Heat Wave Severity and Coverage Across the United States. Geophys. Res. Lett. 2020, 47, e2020GL087097. [Google Scholar] [CrossRef]
  5. Coumou, D.; Rahmstorf, S. A Decade of Weather Extremes. Nat. Clim. Change 2012, 2, 491–496. [Google Scholar] [CrossRef]
  6. Mishra, A.K.; Singh, V.P. A Review of Drought Concepts. J. Hydrol. 2010, 391, 202–216. [Google Scholar] [CrossRef]
  7. Zhang, Q.; Yao, Y.; Li, Y.; Huang, J.; Ma, Z.; Wang, Z.; Wang, S.; Wang, Y.; Zhang, Y. Causes and Changes of Drought in China: Research Progress and Prospects. J. Meteorol. Res. 2020, 34, 460–481. [Google Scholar] [CrossRef]
  8. World Meteorological Organization. Status of mortality and economic losses due to weather-, climate- and water-related hazards from 1970 to 2019. In Atlas of Mortality and Economic Losses from Weather, Climate and Water Extremes (1970–2019); WMO Publisher: Geneva, Switzerland, 2014; Volume 6, pp. 16–54. [Google Scholar]
  9. Su, B.; Huang, J.; Fischer, T.; Wang, Y.; Kundzewicz, Z.W.; Zhai, J.; Sun, H.; Wang, A.; Zeng, X.; Wang, G.; et al. Drought Losses in China Might Double between the 1.5 °C and 2.0 °C Warming. Proc. Natl. Acad. Sci. USA. 2018, 115, 10600–10605. [Google Scholar] [CrossRef]
  10. Mazdiyasni, O.; AghaKouchak, A. Substantial Increase in Concurrent Droughts and Heatwaves in the United States. Proc. Natl. Acad. Sci. USA. 2015, 112, 11484–11489. [Google Scholar] [CrossRef]
  11. Sharma, S.; Mujumdar, P. Increasing Frequency and Spatial Extent of Concurrent Meteorological Droughts and Heatwaves in India. Sci. Rep. 2017, 7, 15582. [Google Scholar] [CrossRef]
  12. Lee, R.; White, C.J.; Adnan, M.S.G.; Douglas, J.; Mahecha, M.D.; O’Loughlin, F.E.; Patelli, E.; Ramos, A.M.; Roberts, M.J.; Martius, O.; et al. Reclassifying Historical Disasters: From Single to Multi-Hazards. Sci. Total Environ. 2024, 912, 169120. [Google Scholar] [CrossRef]
  13. Hao, Z.; Singh, V.P.; Hao, F. Compound Extremes in Hydroclimatology: A Review. Water 2018, 10, 718. [Google Scholar] [CrossRef]
  14. Suzuki, N.; Rivero, R.M.; Shulaev, V.; Blumwald, E.; Mittler, R. Abiotic and Biotic Stress Combinations. New Phytol. 2014, 203, 32–43. [Google Scholar] [CrossRef]
  15. Feng, S.; Hao, Z.; Zhang, X.; Hao, F. Probabilistic Evaluation of the Impact of Compound Dry-Hot Events on Global Maize Yields. Sci. Total Environ. 2019, 689, 1228–1234. [Google Scholar] [CrossRef] [PubMed]
  16. Batibeniz, F.; Hauser, M.; Seneviratne, S.I. Countries Most Exposed to Individual and Concurrent Extremes and Near-Permanent Extreme Conditions at Different Global Warming Levels. Earth Syst. Dynam. 2023, 14, 485–505. [Google Scholar] [CrossRef]
  17. Hao, Z.; AghaKouchak, A.; Phillips, T.J. Changes in Concurrent Monthly Precipitation and Temperature Extremes. Environ. Res. Lett. 2013, 8, 034014. [Google Scholar] [CrossRef]
  18. Mukherjee, S.; Mishra, A.K.; Ashfaq, M.; Kao, S.-C. Relative Effect of Anthropogenic Warming and Natural Climate Variability to Changes in Compound Drought and Heatwaves. J. Hydrol. 2022, 605, 127396. [Google Scholar] [CrossRef]
  19. Wu, Y.; Miao, C.; Sun, Y.; AghaKouchak, A.; Shen, C.; Fan, X. Global Observations and CMIP6 Simulations of Compound Extremes of Monthly Temperature and Precipitation. GeoHealth 2021, 5, e2021GH000390. [Google Scholar] [CrossRef] [PubMed]
  20. Zhang, Y.; Hao, Z.; Feng, S.; Zhang, X.; Hao, F. Comparisons of Changes in Compound Dry and Hot Events in China Based on Different Drought Indicators. Int. J. Climatol. 2022, 42, 8133–8145. [Google Scholar] [CrossRef]
  21. Yu, R.; Zhai, P. More Frequent and Widespread Persistent Compound Drought and Heat Event Observed in China. Sci. Rep. 2020, 10, 14576. [Google Scholar] [CrossRef]
  22. Zhang, Y.; Hao, Z.; Feng, S.; Zhang, X.; Hao, F. Changes and Driving Factors of Compound Agricultural Droughts and Hot Events in Eastern China. Agric. Water Manag. 2022, 263, 107485. [Google Scholar] [CrossRef]
  23. Su, Q.; Dong, B.; Tian, F.; Klingaman, N.P. Anthropogenic Influence on Decadal Changes in Concurrent Hot and Dry Events over China around the Mid-1990s. Adv. Atmos. Sci. 2024, 41, 233–246. [Google Scholar] [CrossRef]
  24. Sun, W.; Mu, X.; Song, X.; Wu, D.; Cheng, A.; Qiu, B. Changes in Extreme Temperature and Precipitation Events in the Loess Plateau (China) during 1960–2013 under Global Warming. Atmos. Res. 2016, 168, 33–48. [Google Scholar] [CrossRef]
  25. Cui, L.; Zhong, L.; Meng, J.; An, J.; Zhang, C.; Li, Y. Spatiotemporal Evolution Features of the 2022 Compound Hot and Drought Event over the Yangtze River Basin. Remote Sens. 2024, 16, 1367. [Google Scholar] [CrossRef]
  26. Kong, Q.; Guerreiro, S.B.; Blenkinsop, S.; Li, X.-F.; Fowler, H.J. Increases in Summertime Concurrent Drought and Heatwave in Eastern China. Weather Clim. Extrem. 2020, 28, 100242. [Google Scholar] [CrossRef]
  27. Hu, J.; Yang, Z.; Hou, C.; Ouyang, W. Compound Risk Dynamics of Drought by Extreme Precipitation and Temperature Events in a Semi-Arid Watershed. Atmos. Res. 2023, 281, 106474. [Google Scholar] [CrossRef]
  28. Huang, J.; Ma, J.; Guan, X.; Li, Y.; He, Y. Progress in Semi-Arid Climate Change Studies in China. Adv. Atmos. Sci. 2019, 36, 922–937. [Google Scholar] [CrossRef]
  29. Xu, F.; Luo, M. Changes of Concurrent Drought and Heat Extremes in the Arid and Semi-arid Regions of China during 1961–2014. Atmos. Sci. Lett. 2019, 20, e947. [Google Scholar] [CrossRef]
  30. Bian, Y.; Sun, P.; Zhang, Q.; Luo, M.; Liu, R. Amplification of Non-Stationary Drought to Heatwave Duration and Intensity in Eastern China: Spatiotemporal Pattern and Causes. J. Hydrol. 2022, 612, 128154. [Google Scholar] [CrossRef]
  31. Liu, M.; Yin, Y.; Wang, X.; Ma, X.; Chen, Y.; Chen, W. More Frequent, Long-Lasting, Extreme and Postponed Compound Drought and Hot Events in Eastern China. J. Hydrol. 2022, 614, 128499. [Google Scholar] [CrossRef]
  32. Qin, R.; Zhao, Z.; Xu, J.; Ye, J.-S.; Li, F.-M.; Zhang, F. HRLT: A High-Resolution (1 d, 1 Km) and Long-Term (1961–2019) Gridded Dataset for Surface Temperature and Precipitation across China. Earth Syst. Sci. Data 2022, 14, 4793–4810. [Google Scholar] [CrossRef]
  33. Fang, S.; Mao, K.; Xia, X.; Wang, P.; Shi, J.; Bateni, S.M.; Xu, T.; Cao, M.; Heggy, E.; Qin, Z. Dataset of Daily Near-Surface Air Temperature in China from 1979 to 2018. Earth Syst. Sci. Data 2022, 14, 1413–1432. [Google Scholar] [CrossRef]
  34. Zhang, R.; Bento, V.A.; Qi, J.; Xu, F.; Wu, J.; Qiu, J.; Li, J.; Shui, W.; Wang, Q. The First High Spatial Resolution Multi-Scale Daily SPI and SPEI Raster Dataset for Drought Monitoring and Evaluating over China from 1979 to 2018. Big Earth Data 2023, 7, 860–885. [Google Scholar] [CrossRef]
  35. Manning, C.; Widmann, M.; Bevacqua, E.; Van Loon, A.F.; Maraun, D.; Vrac, M. Increased Probability of Compound Long-Duration Dry and Hot Events in Europe during Summer (1950–2013). Environ. Res. Lett. 2019, 14, 094006. [Google Scholar] [CrossRef]
  36. Han, X.; Li, Y.; Yu, W.; Feng, L. Attribution of the Extreme Drought in the Horn of Africa during Short-Rains of 2016 and Long-Rains of 2017. Water 2022, 14, 409. [Google Scholar] [CrossRef]
  37. Wang, R.; Gentine, P.; Li, L.; Chen, J.; Ning, L.; Yuan, L.; Lü, G. Observational Evidence of Regional Increasing Hot Extreme Accelerated by Surface Energy Partitioning. J. Hydrometeorol. 2022, 23, 491–501. [Google Scholar] [CrossRef]
  38. Yoon, D.; Chen, J.-H.; Seo, E. Contribution of Land-Atmosphere Coupling in 2022 CONUS Compound Drought-Heatwave Events and Implications for Forecasting. Weather Clim. Extrem. 2024, 46, 100722. [Google Scholar] [CrossRef]
  39. Wu, X.; Wang, L.; Yao, R.; Luo, M.; Li, X. Identifying the Dominant Driving Factors of Heat Waves in the North China Plain. Atmos. Res. 2021, 252, 105458. [Google Scholar] [CrossRef]
  40. Zhang, J.; Wu, L.; Dong, W. Land-Atmosphere Coupling and Summer Climate Variability over East Asia. J. Geophys. Res. 2011, 116, D05117. [Google Scholar] [CrossRef]
  41. Guo, J.; Wang, X.; Fan, Y.; Liang, X.; Jia, H.; Liu, L. How Extreme Events in China Would Be Affected by Global Warming—Insights From a Bias-Corrected CMIP6 Ensemble. Earth’s Future 2023, 11, e2022EF003347. [Google Scholar] [CrossRef]
  42. Luo, M.; Lau, N.-C. Summer Heat Extremes in Northern Continents Linked to Developing ENSO Events. Environ. Res. Lett. 2020, 15, 074042. [Google Scholar] [CrossRef]
  43. Wang, C.; Zheng, J.; Lin, W.; Wang, Y. Unprecedented Heatwave in Western North America during Late June of 2021: Roles of Atmospheric Circulation and Global Warming. Adv. Atmos. Sci. 2023, 40, 14–28. [Google Scholar] [CrossRef]
  44. Cai, W.; Ng, B.; Geng, T.; Jia, F.; Wu, L.; Wang, G.; Liu, Y.; Gan, B.; Yang, K.; Santoso, A.; et al. Inter-Model Consensus Suggests 20th Century ENSO Likely Influenced by Climate Change. Nat. Rev. Earth Environ. 2023, 4, 407–418. [Google Scholar] [CrossRef]
  45. Forster, P.M.; Smith, C.; Walsh, T.; Lamb, W.F.; Lamboll, R.; Hall, B.; Hauser, M.; Ribes, A.; Rosen, D.; Gillett, N.P.; et al. Indicators of Global Climate Change 2023: Annual Update of Key Indicators of the State of the Climate System and Human Influence. Earth Syst. Sci. Data 2024, 16, 2625–2658. [Google Scholar] [CrossRef]
  46. Zhang, M.; Dong, B.; Schiemann, R.; Robson, J. Summer Compound Heatwaves over China: Projected Changes at Different Global Warming Levels and Related Physical Processes. Clim. Dyn. 2024, 62, 1887–1907. [Google Scholar] [CrossRef]
  47. Tian, X.; Tang, C.; Wu, X.; Yang, J.; Zhao, F.; Liu, D. The Global Spatial-Temporal Distribution and EOF Analysis of AOD Based on MODIS Data during 2003–2021. Atmos. Environ. 2023, 302, 119722. [Google Scholar] [CrossRef]
  48. Hatzianastassiou, N.; Matsoukas, C.; Drakakis, E.; Stackhouse, P.W., Jr.; Koepke, P.; Fotiadi, A.; Pavlakis, K.G.; Vardavas, I. The Direct Effect of Aerosols on Solar Radiation Based on Satellite Observations, Reanalysis Datasets, and Spectral Aerosol Optical Properties from Global Aerosol Data Set (GADS). Atmos. Chem. Phys. 2007, 7, 2585–2599. [Google Scholar] [CrossRef]
  49. Chen, H.; Yue, Y.; Jiang, Q. Temporal and Spatial Patterns of Extreme Heat on Wheat in China under Climate Change Scenarios. Environ. Exp. Bot. 2024, 226, 105938. [Google Scholar] [CrossRef]
  50. Xu, W.; Yuan, W.; Wu, D.; Zhang, Y.; Shen, R.; Xia, X.; Ciais, P.; Liu, J. Impacts of Record-Breaking Compound Heatwave and Drought Events in 2022 China on Vegetation Growth. Agric. For. Meteorol. 2024, 344, 109799. [Google Scholar] [CrossRef]
  51. Wu, X.; Hao, Z.; Hao, F.; Zhang, X. Variations of Compound Precipitation and Temperature Extremes in China during 1961–2014. Sci. Total Environ. 2019, 663, 731–737. [Google Scholar] [CrossRef]
  52. Collins, B. Frequency of Compound Hot–Dry Weather Extremes Has Significantly Increased in Australia since 1889. J. Agron. Crop Sci. 2022, 208, 941–955. [Google Scholar] [CrossRef]
  53. Seneviratne, S.I.; Corti, T.; Davin, E.L.; Hirschi, M.; Jaeger, E.B.; Lehner, I.; Orlowsky, B.; Teuling, A.J. Investigating Soil Moisture–Climate Interactions in a Changing Climate: A Review. Earth-Sci. Rev. 2010, 99, 125–161. [Google Scholar] [CrossRef]
  54. Fischer, E.M.; Seneviratne, S.I.; Vidale, P.L.; Lüthi, D.; Schär, C. Soil Moisture–Atmosphere Interactions during the 2003 European Summer Heat Wave. J. Clim. 2007, 20, 5081–5099. [Google Scholar] [CrossRef]
  55. Gao, J.; Wu, S. Simulated Effects of Land Cover Conversion on the Surface Energy Budget in the Southwest of China. Energies 2014, 7, 1251–1264. [Google Scholar] [CrossRef]
  56. Arain, M.; Burke, E.; Yang, Z.; Shuttleworth, W. Implementing Surface Parameter Aggregation Rules in the CCM3 Global Climate Model: Regional Responses at the Land Surface. Hydrol. Earth Syst. Sci. 1999, 3, 463–476. [Google Scholar] [CrossRef]
  57. Zhang, R.; Zuo, Z. Impact of Spring Soil Moisture on Surface Energy Balance and Summer Monsoon Circulation over East Asia and Precipitation in East China. J. Clim. 2011, 24, 3309–3322. [Google Scholar] [CrossRef]
  58. Gao, C.; Chen, H.; Sun, S.; Xu, B.; Ongoma, V.; Zhu, S.; Ma, H.; Li, X. Regional Features and Seasonality of Land–Atmosphere Coupling over Eastern China. Adv. Atmos. Sci. 2018, 35, 689–701. [Google Scholar] [CrossRef]
  59. Gu, X.; Zhang, Q.; Li, J.; Singh, V.P.; Liu, J.; Sun, P.; Cheng, C. Attribution of Global Soil Moisture Drying to Human Activities: A Quantitative Viewpoint. Geophys. Res. Lett. 2019, 46, 2573–2582. [Google Scholar] [CrossRef]
  60. Deng, X.; Shi, Q.; Zhang, Q.; Shi, C.; Yin, F. Impacts of Land Use and Land Cover Changes on Surface Energy and Water Balance in the Heihe River Basin of China, 2000–2010. Phys. Chem. Earth Parts A/B/C 2015, 79–82, 2–10. [Google Scholar] [CrossRef]
  61. Sun, G.; Noormets, A.; Gavazzi, M.J.; McNulty, S.G.; Chen, J.; Domec, J.-C.; King, J.S.; Amatya, D.M.; Skaggs, R.W. Energy and Water Balance of Two Contrasting Loblolly Pine Plantations on the Lower Coastal Plain of North Carolina, USA. For. Ecol. Manag. 2010, 259, 1299–1310. [Google Scholar] [CrossRef]
  62. Betts, R.A. Integrated Approaches to Climate–Crop Modelling: Needs and Challenges. Phil. Trans. R. Soc. B 2005, 360, 2049–2065. [Google Scholar] [CrossRef]
  63. Zhang, Y.; Hao, Z.; Zhang, X.; Hao, F. Anthropogenically Forced Increases in Compound Dry and Hot Events at the Global and Continental Scales. Environ. Res. Lett. 2022, 17, 024018. [Google Scholar] [CrossRef]
  64. Zeng, J.; Li, H.; Sun, B.; Chen, H.; Wang, H.; Zhou, B.; Duan, M. Summertime Compound Heat Wave and Drought Events in China: Interregional and Subseasonal Characteristics, and the Associated Driving Factors. Environ. Res. Lett. 2024, 19, 074046. [Google Scholar] [CrossRef]
  65. Yihui, D.; Chan, J.C.L. The East Asian Summer Monsoon: An Overview. Meteorol. Atmos. Phys. 2005, 89, 117–142. [Google Scholar] [CrossRef]
  66. Cook, B.I.; Smerdon, J.E.; Seager, R.; Coats, S. Global Warming and 21st Century Drying. Clim. Dyn. 2014, 43, 2607–2627. [Google Scholar] [CrossRef]
  67. Zhang, J.; Chen, H.; Zhang, Q. Extreme Drought in the Recent Two Decades in Northern China Resulting from Eurasian Warming. Clim. Dyn. 2019, 52, 2885–2902. [Google Scholar] [CrossRef]
  68. Zhou, X.; Lu, R. The Unprecedented Extreme Anticyclonic Anomaly over Northeast Asia in July 2021 and Its Climatic Impacts. Adv. Atmos. Sci. 2024, 41, 608–618. [Google Scholar] [CrossRef]
  69. Zhai, P.; Zhang, X.; Wan, H.; Pan, X. Trends in Total Precipitation and Frequency of Daily Precipitation Extremes over China. J. Clim. 2005, 18, 1096–1108. [Google Scholar] [CrossRef]
Figure 1. Location of the study area and land use.
Atmosphere 16 00568 g001
Figure 2. The spatial pattern of averaged temperature in during the growing season (May to October) from 1980 to 2018. In this figure, (a) daily mean average temperature; (b) daily mean maximum temperature.
Atmosphere 16 00568 g002
Figure 3. Temperature threshold for CDHEs under the 95th percentile.
Atmosphere 16 00568 g003
Figure 4. Occurrence frequency differences of CDHEs between the 1980s and the 2010s. In this figure, the 1980s refers to 1980–1989, the 2010s refers to 2010−2018; and (a) CDHEs in all severity levels; (b) moderate CDHEs; (c) severe CDHEs; and (d) extreme CDHEs.
Atmosphere 16 00568 g004
Figure 5. Occurrence frequency of CDHEs, heatwave events, and drought events in all severity levels. In this figure, occurrence frequency of CDHEs in (a1) 1980−1989; (a2) 1990−1999; (a3) 2000−2009; (a4) 2010−2018; occurrence frequency of heatwave events in (b1) 1980−1989; (b2) 1990−1999; (b3) 2000−2009; (b4) 2010−2018; occurrence frequency of drought events in (c1) 1980−1989; (c2) 1990−1999; (c3) 2000−2009; (c4) 2010−2018.
Atmosphere 16 00568 g005
Figure 6. The differences of the total annual duration of CDHEs between the 1980s and the 2010s. In this figure, the 1980s refers to 1980–1989, and the 2010s refers to 2010−2018; and (a) CDHEs in all severity levels; (b) moderate CDHEs; (c) severe CDHEs; and (d) extreme CDHEs.
Atmosphere 16 00568 g006
Figure 7. Annual CDHEs duration, heatwave duration, and drought duration in all severity levels. In this figure, annual CDHEs duration in (a1) 1980−1989; (a2) 1990−1999; (a3) 2000−2009; (a4) 2010−2018; annual heatwave events duration in (b1) 1980−1989; (b2) 1990−1999; (b3) 2000−2009; (b4) 2010−2018; annual drought duration in (c1) 1980−1989, (c2) 1990−1999; (c3) 2000−2009; (c4) 2010–2018.
Atmosphere 16 00568 g007
Figure 8. Proportion of CDHEs, heatwave events, and drought events with different durations. In this figure, the rings from inner to outer represents the periods 1980–1989, 1990–1999, 2000–2009, and 2010–2018. And (a1) CDHEs in all severity levels; (a2) moderate CDHEs; (a3) severe CDHEs; (a4) extreme CDHEs; (b1) heatwave events in all severity levels; (b2) moderate heatwave events; (b3) severe heatwave events; (b4) extreme heatwave events; (c1) drought events in all severity levels; (c2) moderate drought events; (c3) severe drought events; (c4) extreme drought events.
Atmosphere 16 00568 g008
Figure 9. The occurrence frequency proportion of CDHEs, heatwave events, and drought events in different months. In this figure, the sectors represent the CDHEs; solid gray line indicates heatwave events; dashed gray line represents the drought events. The first, second, third, and fourth quadrants correspond to the periods 1980–1989, 1990–1999, 2000–2009, and 2010–2018, respectively.
Atmosphere 16 00568 g009
Figure 10. Partial correlation coefficients between the annual CDHEs duration and heatwave duration, drought duration, and the synchronicity of heatwave and drought events. In this figure, the shadow represents p > 0.05, and (a) partial correlation coefficients between CDHEs duration and the synchronicity of heatwave and drought events; (b) partial correlation coefficients between CDHEs duration and drought duration; (c) partial correlation coefficients between CDHEs duration and heatwave duration.
Atmosphere 16 00568 g010
Figure 11. Synchronicity of heatwave and drought events in different decades. In this figure, synchronicity of heatwave and drought events in (a) 1980−1989; (b) 1990−1999; (c) 2000−2009; (d) 2010−2009.
Atmosphere 16 00568 g011
Table 1. Definition of CDHE based on Tmax and SPI.
Severity LevelDefinition
allTmax ≥ Tmax85, SPI ≤ −0.5
moderate(Tmax ≥ Tmax85, −1.0 < SPI ≤ −0.5) ∪ (Tmax85 ≤ Tmax < Tmax90, SPI ≤−1)
severe(Tmax ≥ Tmax90, −1.5 < SPI ≤ −1.0) ∪ (Tmax90 ≤ Tmax < Tmax95, SPI < −1.5)
extremeTmax ≥ Tmax95, SPI ≤ −1.5
Table 2. Partial correlation analysis between the occurrence dates of CDHEs, drought events and heatwave events.
Title 1AllModerateSevereExtreme
heatwave events0.992 *0.991 *0.971 *0.980 *
drought event0.2580.4110.3810.157
* indicates significance.
Disclaimer/Publisher’s Note: The statements, opinions and data contained in all publications are solely those of the individual author(s) and contributor(s) and not of MDPI and/or the editor(s). MDPI and/or the editor(s) disclaim responsibility for any injury to people or property resulting from any ideas, methods, instructions or products referred to in the content.

