Article

Frictional and Particle Emission Behavior of Different Brake Disk Concepts Correlated with Optical Pin Surface Characterization

1
Volkswagen AG, 38426 Wolfsburg, Germany
2
Institute for Energy and Materials Processes—Reactive Fluids, University of Duisburg-Essen, 47057 Duisburg, Germany
3
Institute for Particle Technology, Technische Universität Braunschweig, 38104 Braunschweig, Germany
*
Author to whom correspondence should be addressed.
Atmosphere 2025, 16(5), 563; https://doi.org/10.3390/atmos16050563
Submission received: 31 March 2025 / Revised: 1 May 2025 / Accepted: 6 May 2025 / Published: 8 May 2025
(This article belongs to the Section Aerosols)

Abstract

:
Brake wear emissions can be reduced by altering the surface of brake disks. A parametric study using a gray cast iron and a laser-cladded brake disk was performed in a pin-on-disk experiment with integrated optical pin surface characterization and particle emission measurement. Significant differences in the friction, wear and emission behavior are present. The high wear-resistance of the laser-cladded disk led to a reduction of 70% of the particle number emission relative to the gray cast iron disk, but the coefficient of friction was unstable. The surface of the pin used with the gray cast iron showed an initial large debris extension and protruding patches that were removed at high braking energies, exposing white patches and creating holes. These observations correspond to known processes from the plateau theory. The surface of the pin used with the laser-cladded disk showed a topography dominated by holes with almost no protruding patches. The braking condition did not influence the pin surface, implying that the disk and not solely the pin surface might be governing the friction process, and therefore challenging the applicability of the plateau theory to laser-cladded disks. To further study this aspect, a segmentation method was developed for the pin surface images and topographical data to extract and quantify different features on the pin, such as debris, patches, holes and the tribolayer. The correlation of the surface coverage ratios of the feature classes with the braking conditions (speed and applied pressure), the coefficient of friction and the emissions confirmed the differences between the gray cast iron and laser-cladded brake disk.

1. Introduction

Brake wear emissions have been identified as a significant contributor to non-exhaust emissions in Europe [1]. In response, the EURO7 regulation will impose limitations on the mass of the particulate matter (PM) smaller than 10 µm emitted by brakes by 2026 [2]. Achieving compliance with these regulations can be realized through alterations to the friction and wear characteristics of the friction pair, or by employing filtration to capture the emitted particles [3,4,5,6]. It has been shown than non-asbestos organic (NAO) brake pads may emit on average 62% less PM10 than low-metallic (LM) brake pads [7]. However, in the European market, NAO brake pads are not widely used because they are seen as providing comfort rather than performance [8]. In recent years, the surface alteration of gray cast iron (GCI) disks has been the focus of several studies with the aim of influencing wear, reducing particle emission, and improving corrosion resistance [9,10,11,12]. A promising coating method is laser cladding, in which a powder alloy is sprayed onto the surface, while a high-power laser melts it. The resulting layer cladded onto the surface is then ground to the required thickness [13]. The hardened surface of these high-speed laser cladding (HS-LC) brake disk exhibits an elevated wear resistance and has been shown to reduce PM10 emissions by up to 70% [14,15]. However, some drawbacks of coated disks include potential delamination [16], limited heat transfer to the gray cast iron core [17], and higher cost.
In sliding friction and wear, the debris has a substantial influence. Godet postulated the third-body approach to describe the wear process based on the lubrication theory [18]. He described how wear particles move between the mating surfaces and stick to asperities or surface valleys. This layer is referred to as “the third body” and carries part of the load. Eriksson et al. developed a plateau theory based on observations of the contact zone through a glass disk [19,20,21,22]. Debris from both mating surfaces flows through the channels created by the protruding asperities, which are made from hard materials, such as metal fibers. They are referred to as primary plateaus. A portion of the debris might become jammed upstream of a primary plateau. Subsequently, the load and heat lead to the compaction of the debris forming a secondary plateau that grows as new debris flows and piles up. Despite their comparatively lower hardness, the secondary plateaus can carry part of the load. The contact area is the sum of both the primary and secondary plateaus. In the event of the primary plateau’s deterioration or loss, the secondary plateau will undergo destruction through three-body abrasion. A reduction in brake pressure can result in the partial deterioration of weakened secondary plateaus. In the subsequent brake application, the contact will readapt by altering its current form and forming new secondary plateaus, increasing the coefficient of friction (COF). The reported size of secondary plateaus ranges from 50 µm to 500 µm [21]. At elevated temperatures and high brake pressures, the sintering of the debris can form even larger plateaus with a size of up to several millimeters [20].
The balance between the formation and the destruction of secondary plateaus has been the core idea in the modelling approach of Ostermeyer and his group [23]. The formation of the secondary plateaus was linked to heat influx, while their destruction was assumed to be caused by friction power. The resulting two-equation model was implemented in a cellular automaton (CA) [24]. The implementation entailed the definition of classes for each pixel, such as patch and non-patch, thereby establishing clear conditions for the growth and destruction of secondary plateaus based on neighboring cells. Additionally, the model considered wear flow. The model was expanded to consider a three-dimensional topography [25]. New classes were defined, including matrix, fiber, patch, compacted debris and no-material. A second group, led by Olofsson, started developing their own two-dimensional cellular automaton with the focus on tracking the debris within the contact and the debris leaving [26]. Similar classes were defined, such as primary plateaus, secondary plateaus, wear material and matrix material. Wahlström expanded the simulation by implementing friction, wear and particle emission models based on experimental data [27] and by considering the disk’s temperature and wear [28]. A main drawback of the cellular automaton is the spatio-temporal resolution required to account for both local and global processes, such as wear flux and patch growth, as well as microscopic and macroscopic structures, such as metal fibers and full-size brake pads [25,26]. An abstract cellular automaton was presented by Ostermeyer and Merlis. It combines the method developed for classical cellular automatons with N-body simulations [29]. The patches are no longer the sum of neighboring cells but are represented only by one cell, as the shape of the patches does not have a significant influence on the global friction and wear behavior. Only the classes soft and hard patches are present. The latter is composed of oxidized debris, while the former is composed of fresh debris. This approach enables the simulation of an entire brake pad, due to the reduction in the number of cells. Another approach pioneered by Wahlström et al. [30], and further developed by Riva et al. [31], is finite element analysis (FEA). This method computes the local pressure distributions and sliding velocities. Then, using applied pressure p and sliding velocity v (pv)-maps based on experimental data, it determines the local wear and particle emission. The global wear and airborne emissions were validated with pin-on-disk measurements. Riva et al. [32] proposed a combination of the aforementioned approaches, whereby an FEA was employed to calculate the contact pressure, and a thermal CFD simulation was used to model the heat transfer. Finally, a cellular automaton was implemented to consider the mesoscopic phenomena. Given the objective of comparing a Cu-free and a Cu-containing brake pad, the classes were adapted to address the differences in the pad mixture. The classes employed included secondary patches, Kevlar, brass, copper, steel and resin.
The development of models at the mesoscopic scale has relied heavily on both in situ and ex situ observations. Ex situ investigations of the tribological system are more common and encompass a large variety of methods for imaging and chemical analysis. Imaging methods include light interference microscopy (LIM) [33,34], optical microscopy (OM) [34,35,36,37,38,39,40,41,42,43], scanning ion microscopy (SIM) [34,44], focused ion beam (FIB) [35,36], scanning electron microscopy (SEM) [35,36,42,44,45], transmission electron microscopy (TEM) [35] and color photography [42]. A qualitative analysis allows us to observe and compare classes, such as plateaus, loose debris and compacted debris, depending on the braking parameters and friction materials. A quantitative analysis requires a segmentation strategy to differentiate the classes. Primary patches are more reflective and appear bright and white, while compacted debris is gray. Lowlands and matrix material are black. This color scheme has been observed both in low-steel and non-asbestos organic brake pads by Neis et al. [37]. They used the Otsu’s algorithm [46] to find a binarization threshold and to isolate the contact area consisting of primary and secondary plateaus.
Most imaging methods require the preparation of the sample by coating or cutting it. No immediate analysis is possible. The microscopy methods offer high resolution but require numerous recordings to generate a micrograph for the analysis of large areas. Poletto et al. [40] investigated the influence of the analyzed area and the resolution using SIM. They concluded that, with 12 images with a total area of 44 mm2, the error of the average size, density and area fraction of the contact plateaus was lower than 5% relative to the measurement of the whole pad using 72 images. The resolution, based on the smallest size of a single contact plateau, was 7.6 × 10 5 mm2 per pixel.
To summarize, current methods to investigate the braking process on a mesoscopic scale encompass experimental characterization through imaging, topography measurement and material analysis, as well as computer simulation employing cellular automaton models grounded in experimental observations. The experimental approach relies on ex situ and off-line measurements, which may require sample preparation and cannot deliver data on transient phenomena. These data have served as a reference, and the derived correlations have been used only to confirm observations, instead of for the generation of models. As for the development of more detailed models that include more parameters and account for transient processes, advanced analysis methods with better differentiation capabilities are required.
The work presented in this paper focusses on comparing the friction, wear and emission behavior of a GCI and an HS-LC brake disk with low-metallic brake pads in the Automated Universal Tribotester (AUT) developed by Ostermeyer et al. [47]. This pin-on-disk tribometer features an at-line pin surface characterization system, consisting of color photography and a topography measurement, as well as a particle measurement system. A parametric study was conducted, incorporating braking blocks with varying sliding velocities and applied pressures. Following each block, the pin was automatically translated away from the disk, color images were taken with a ring and an oblique illumination, and the topography of the pin surface was measured quantitatively. First, results in friction, wear and emission are presented. The images and topographic data from the pin are displayed and discussed. The observed differences between the two disks are proposed to be related to the state of the pin surface. Then, to further investigate this, a segmentation strategy was developed to differentiate and quantify surface changes on the pin in both color images and topography. The correlation of the segmented regions with the braking conditions (pv), the emitted particle number (PN) and the friction (COF) confirms the conclusions from the first part. The pin used with the GCI brake disk shows surface processes corresponding to the plateau theory, while the experiments with the HS-LC disk show an unstable behavior of the COF with minimal change of the pin surface, suggesting that the validity of such models for laser-cladded disks needs to be revised.

2. Materials and Methods

2.1. Measurement Setup

Figure 1 shows a schematic representation of the Automated Universal Tribotester (AUT, [47]), including the disk drive, pin translation unit, integrated at-line optical measurements system for the pin and the particle emission measurement. The disk drive (Figure 1a, left side) offers rotational speeds from 0 to 1500 RPM. The pin translation unit (Figure 1a, right side) enables both radial and axial displacement of a pin. For brake simulation, static and dynamic loads of up to 400 N based on a linear guide equipped with an additional actuator can be achieved. This design supports a variety of testing protocols, from static procedures to complex load profiles such as those derived from WLTP or real-world driving signals. During operation, the forces acting on the pin are recorded by a 3D piezoelectric force transducer in conjunction with a strain gauge bridge, enabling the precise determination of friction coefficients. The temperature of the pin is measured by a thermocouple embedded 2 mm below the pin surface, and the disk temperature is measured by an infrared thermometer close to disk edge.
To characterize surface changes on the pin, an optical measurement system based on an oscillating laser triangulator with a depth resolution of 0.15 µm created a height map of the surface (Figure 1c). This was complemented by an 18-megapixel color camera featuring both ring (Figure 1d) and oblique (Figure 1e) lighting to visualize the local surface characteristics. In this arrangement the specimen can be examined optically by translating the pin to the measurement position without unmounting, thus allowing the observation of continuous, parameter-dependent surface transformations. The ring-light image shows the apparent color of different materials on the pad surface. The oblique light image provides additional information of surface topography such as peaks and valleys.
To measure the particle size distribution and concentration, a nozzle enclosing the pin captured most of the generated particles in over-isokinetic conditions, and then transferred them into a flow splitter (Figure 1a,b). The airflow is then sampled isokinetically for various measurement and analysis instruments, enabling the detailed characterization of particle emissions throughout the test. In this study, a Promo 1000 (Palas, Karlsruhe, Germany) was used for particle measurements.
The disk surface was mapped with a laser triangulator, the optoNCDT 2300-10 (Micro-Epsilon, Ortenburg, Germany). This single-laser sensor has a lateral resolution of 0.15 µm and depth resolution of 0.03 µm. The main objective of the disk topography measurement is to investigate the wear behavior of the disk. Due to the rotational movement and minimal thickness variation of the disk, it exhibits uniform wear in the circumferential direction. Ten profiles of the wear marks on the disk were taken in the radial direction with a resolution of 1 µm, and the average value of the ten measurements each on the GCI and HS-LS disks was then calculated. Further details on the AUT can be found in [47,48,49,50,51,52].

2.2. Friction Materials and Braking Conditions

A conventional GCI brake disk and an HS-LC disk with low-metallic brake pads were used. The diameter of both disks was 306 mm. The coating of the HS-LS consisted of spherical tungsten carbide particles in a stainless-steel layer. The composition of the brake pad for the HS-LC disk was slightly altered to better match the coated surface. Rectangular cut-outs from brake pads with an area of 20 × 10 mm2 were used as pins. The position of the pin was at 9 o’clock, with an effective friction radius of 120.75 mm. The effect of the disk surface is assumed to be greater than the one caused by the difference in the material composition of the pin. Therefore, in the present study, the two friction pairs are referred to as the GCI brake disk and the HS-LC brake disk.
Table 1 shows the testing conditions. After a bedding period, three segments were performed, each with an individual nominal pressure and a variation of five sliding speed. The applied pressure and sliding speed were held constant during each brake application. At the beginning of each segment, a running-in block was performed to assist with stabilizing the surface conditions subsequent to the high-velocity blocks from the preceding segment. Two complete runs of the test protocol were performed. The translation of the pin for the surface characterization was performed before and after each block. Excluding the running-in blocks, a total of 18 image pairs and topographic measurements were taken per run. Only in the second run were the particle emissions measured.

3. Friction Test Results and Surface Imaging

The results from the tribometer are shown in Figure 2 for the GCI and the HS-LC disks in terms of coefficient of friction (COF) and the disk and pin temperatures. In Figure 2a, the COF of the GCI brake disk steadily increases in the first two blocks of each segment (A–B, F–G and K–L), followed by a significant decrease. In the subsequent braking block, the COF either increases or maintains its level before dropping with the onset of the next block (C–E, H–J and M). The high-energy blocks (N–O) exhibit a distinct behavior, with the COF increasing in the first brake applications before significantly decreasing. The disk temperature remained at a low level, and the pin temperature had a strong correlation with the friction work.
As illustrated in Figure 2b, the COF of the HS-LC brake disk has significant variations between the two runs, particularly in blocks A–B and J. In contrast to the GCI, trends that encompass all three segments are not clearly visible. In the segments with 0.56 MPa applied pressure, the COF increases slightly across the initial blocks (run 2 A–C). Subsequently, it rapidly increases to approximately 0.7, remaining constant until the final block. At an applied pressure of 1.12 MPa, the first two blocks (F–G) maintain the COF level, before increasing to a level close to 0.6 with a less steep slope than the 0.56 MPa case. In the final segment, the COF decreases in the first two blocks (K–L), followed by a steady increase, yet remaining below the final values in the first two segments.
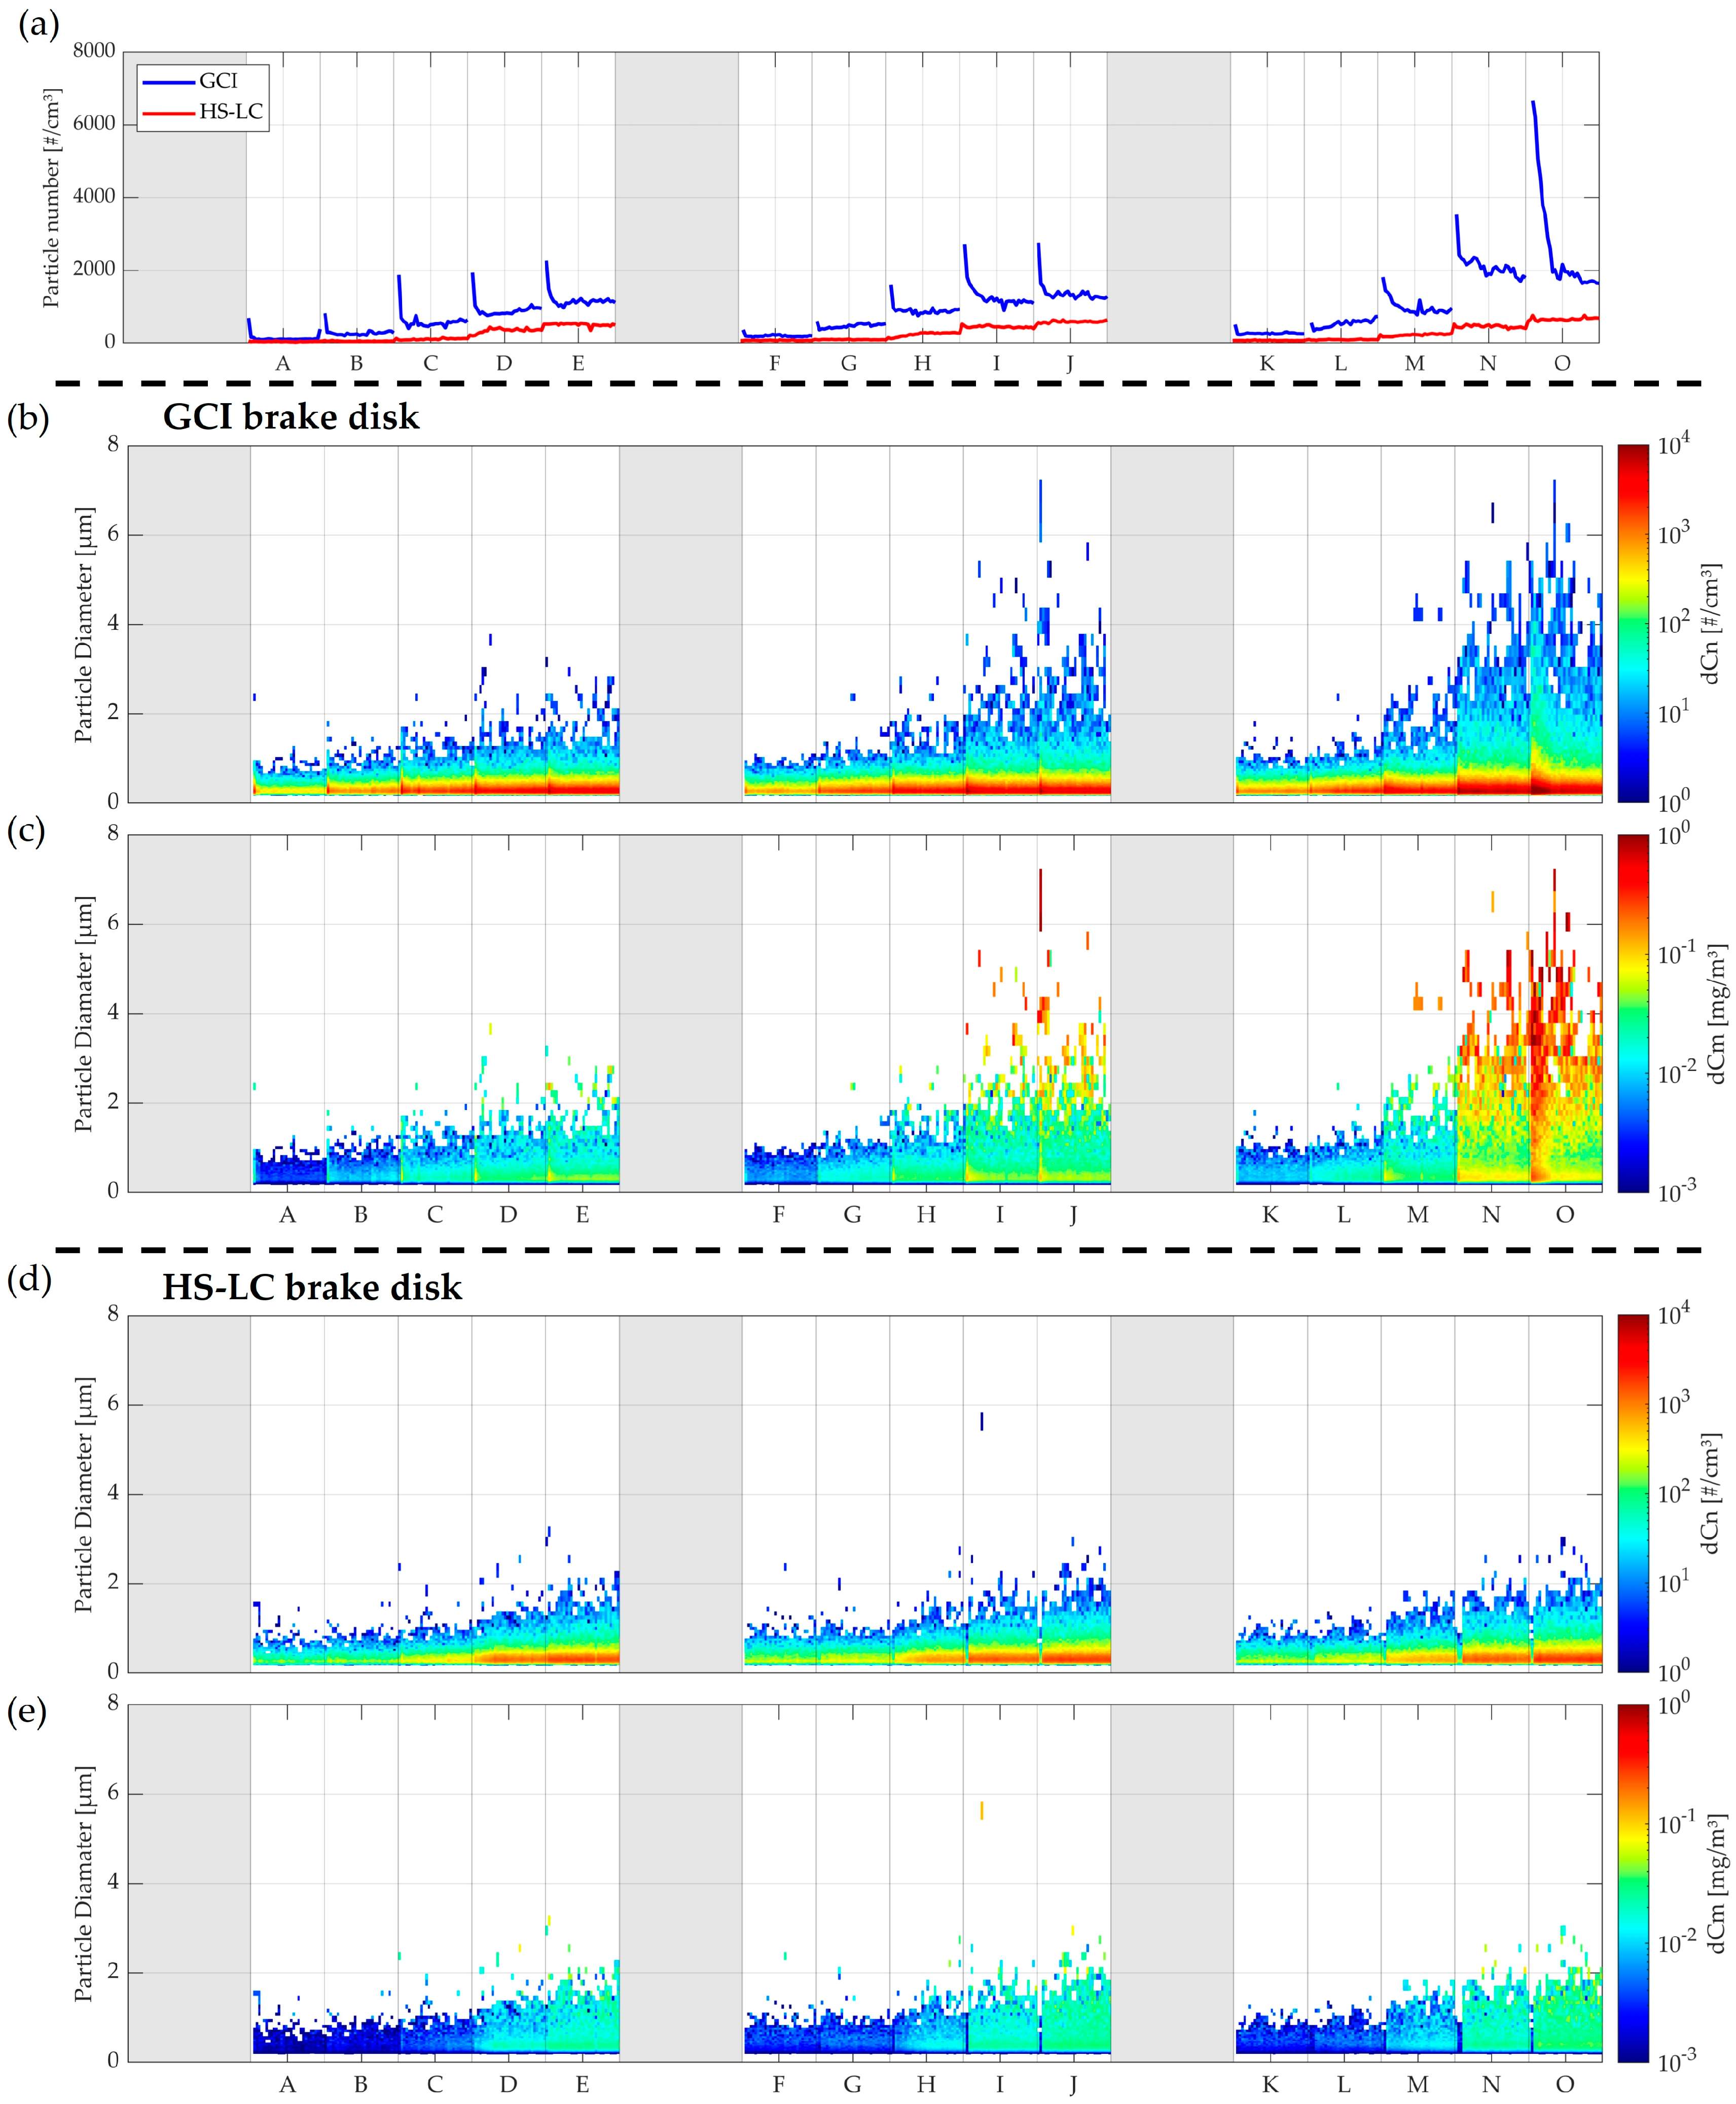
The particle emission data from run 2 are presented in Figure 3. The particle number (PN) is shown for both disks in Figure 3a. The CGI disk yielded a maximum PN at the initial brake application in all braking blocks, which subsequently decreased and stabilized after a few applications. During this initial brake application, an increase in both the number of particles and the presence of larger particles is observed, resulting in a broader size distribution, as shown in Figure 3b and Figure 3c in the number-based and volume-based size distributions, respectively. This effect is also present at high sliding velocities and applied nominal pressures. This phenomenon results in the emergence of a bimodal distribution in blocks I–J and M–O, as evident in the volume-based size distribution.
The HS-LC disk shows in Figure 3a a dependency of the emissions on both the sliding velocity and the applied normal pressure, like in the GCI, but the emissions were reduced by around 70%. A difference is the lack of high-emitting brake applications at the beginning of each block. The number-based and volume-based size distributions in Figure 3d and Figure 3e, respectively, reveal a unimodal distribution with almost no particles larger than 2 µm.
As one might expect with the small size of the pin, the disk temperature shows little change over the test procedure, unlike the pin temperature. A correlation between the pin temperature and the particle emission can be observed. Block-specific trends in the COF can be observed also in the pin temperature. The pin used with the HS-LC brake disk has a higher temperature than the one used with the GCI brake disk.
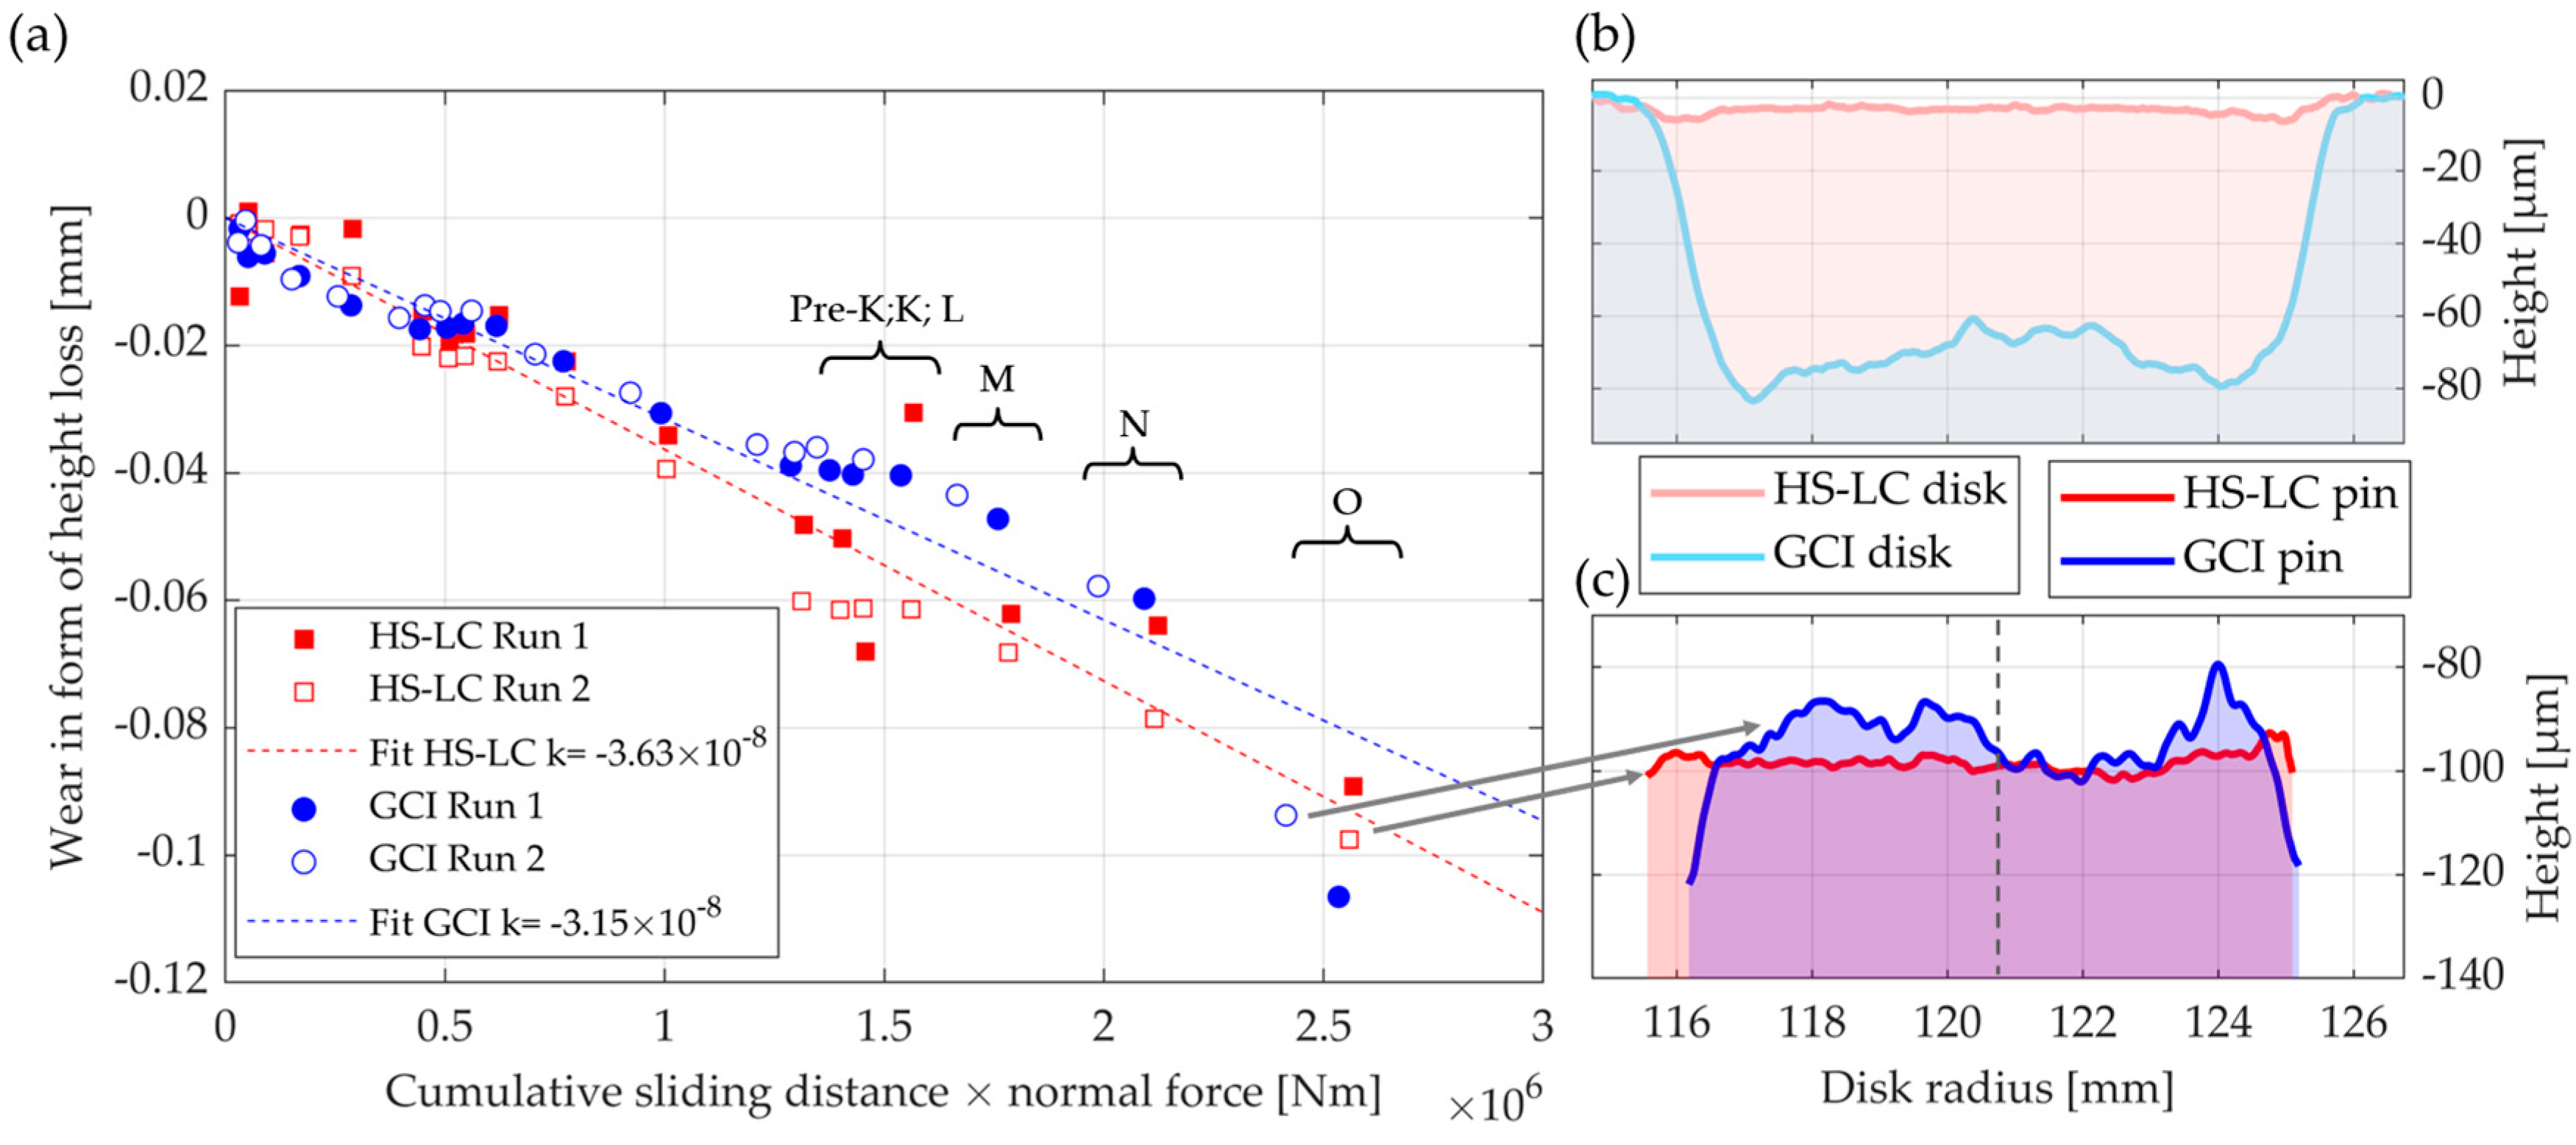
Figure 4a shows the wear, quantified by the height loss of the pin, over the product of the cumulative sliding distance and the applied normal force. The pin used with the GCI disk shows a relatively linear behavior up to 1.8 × 10 6 Nm; the height then decreases more quickly. The last data point in both runs shows a disproportionate wear with a significantly higher height loss, hinting at the presence of severe wear. Both runs of the GCI brake disk show a good reproducibility, unlike the HS-LC disk, where a larger spread is seen. From the slope k of a linear fit, the wear rate can be derived by multiplying with the pin surface area. The wear rates of the pin are comparable, suggesting that the coated disk’s wear rate is relatively small, consistent with the reduced particle emission observed in Figure 3e. The disk and pin topographic profiles are shown in Figure 4b and Figure 4c, respectively. The former was measured only once and after some additional tests, thus it does not correspond to the displayed pin profiles. The slight wear of the HS-LC disk and homogeneous pin wear are visible. In contrast, the GCI brake disk shows a significant, spatially non-uniform material loss with a height difference of up to 20 µm, which is also visible in the pin profile.
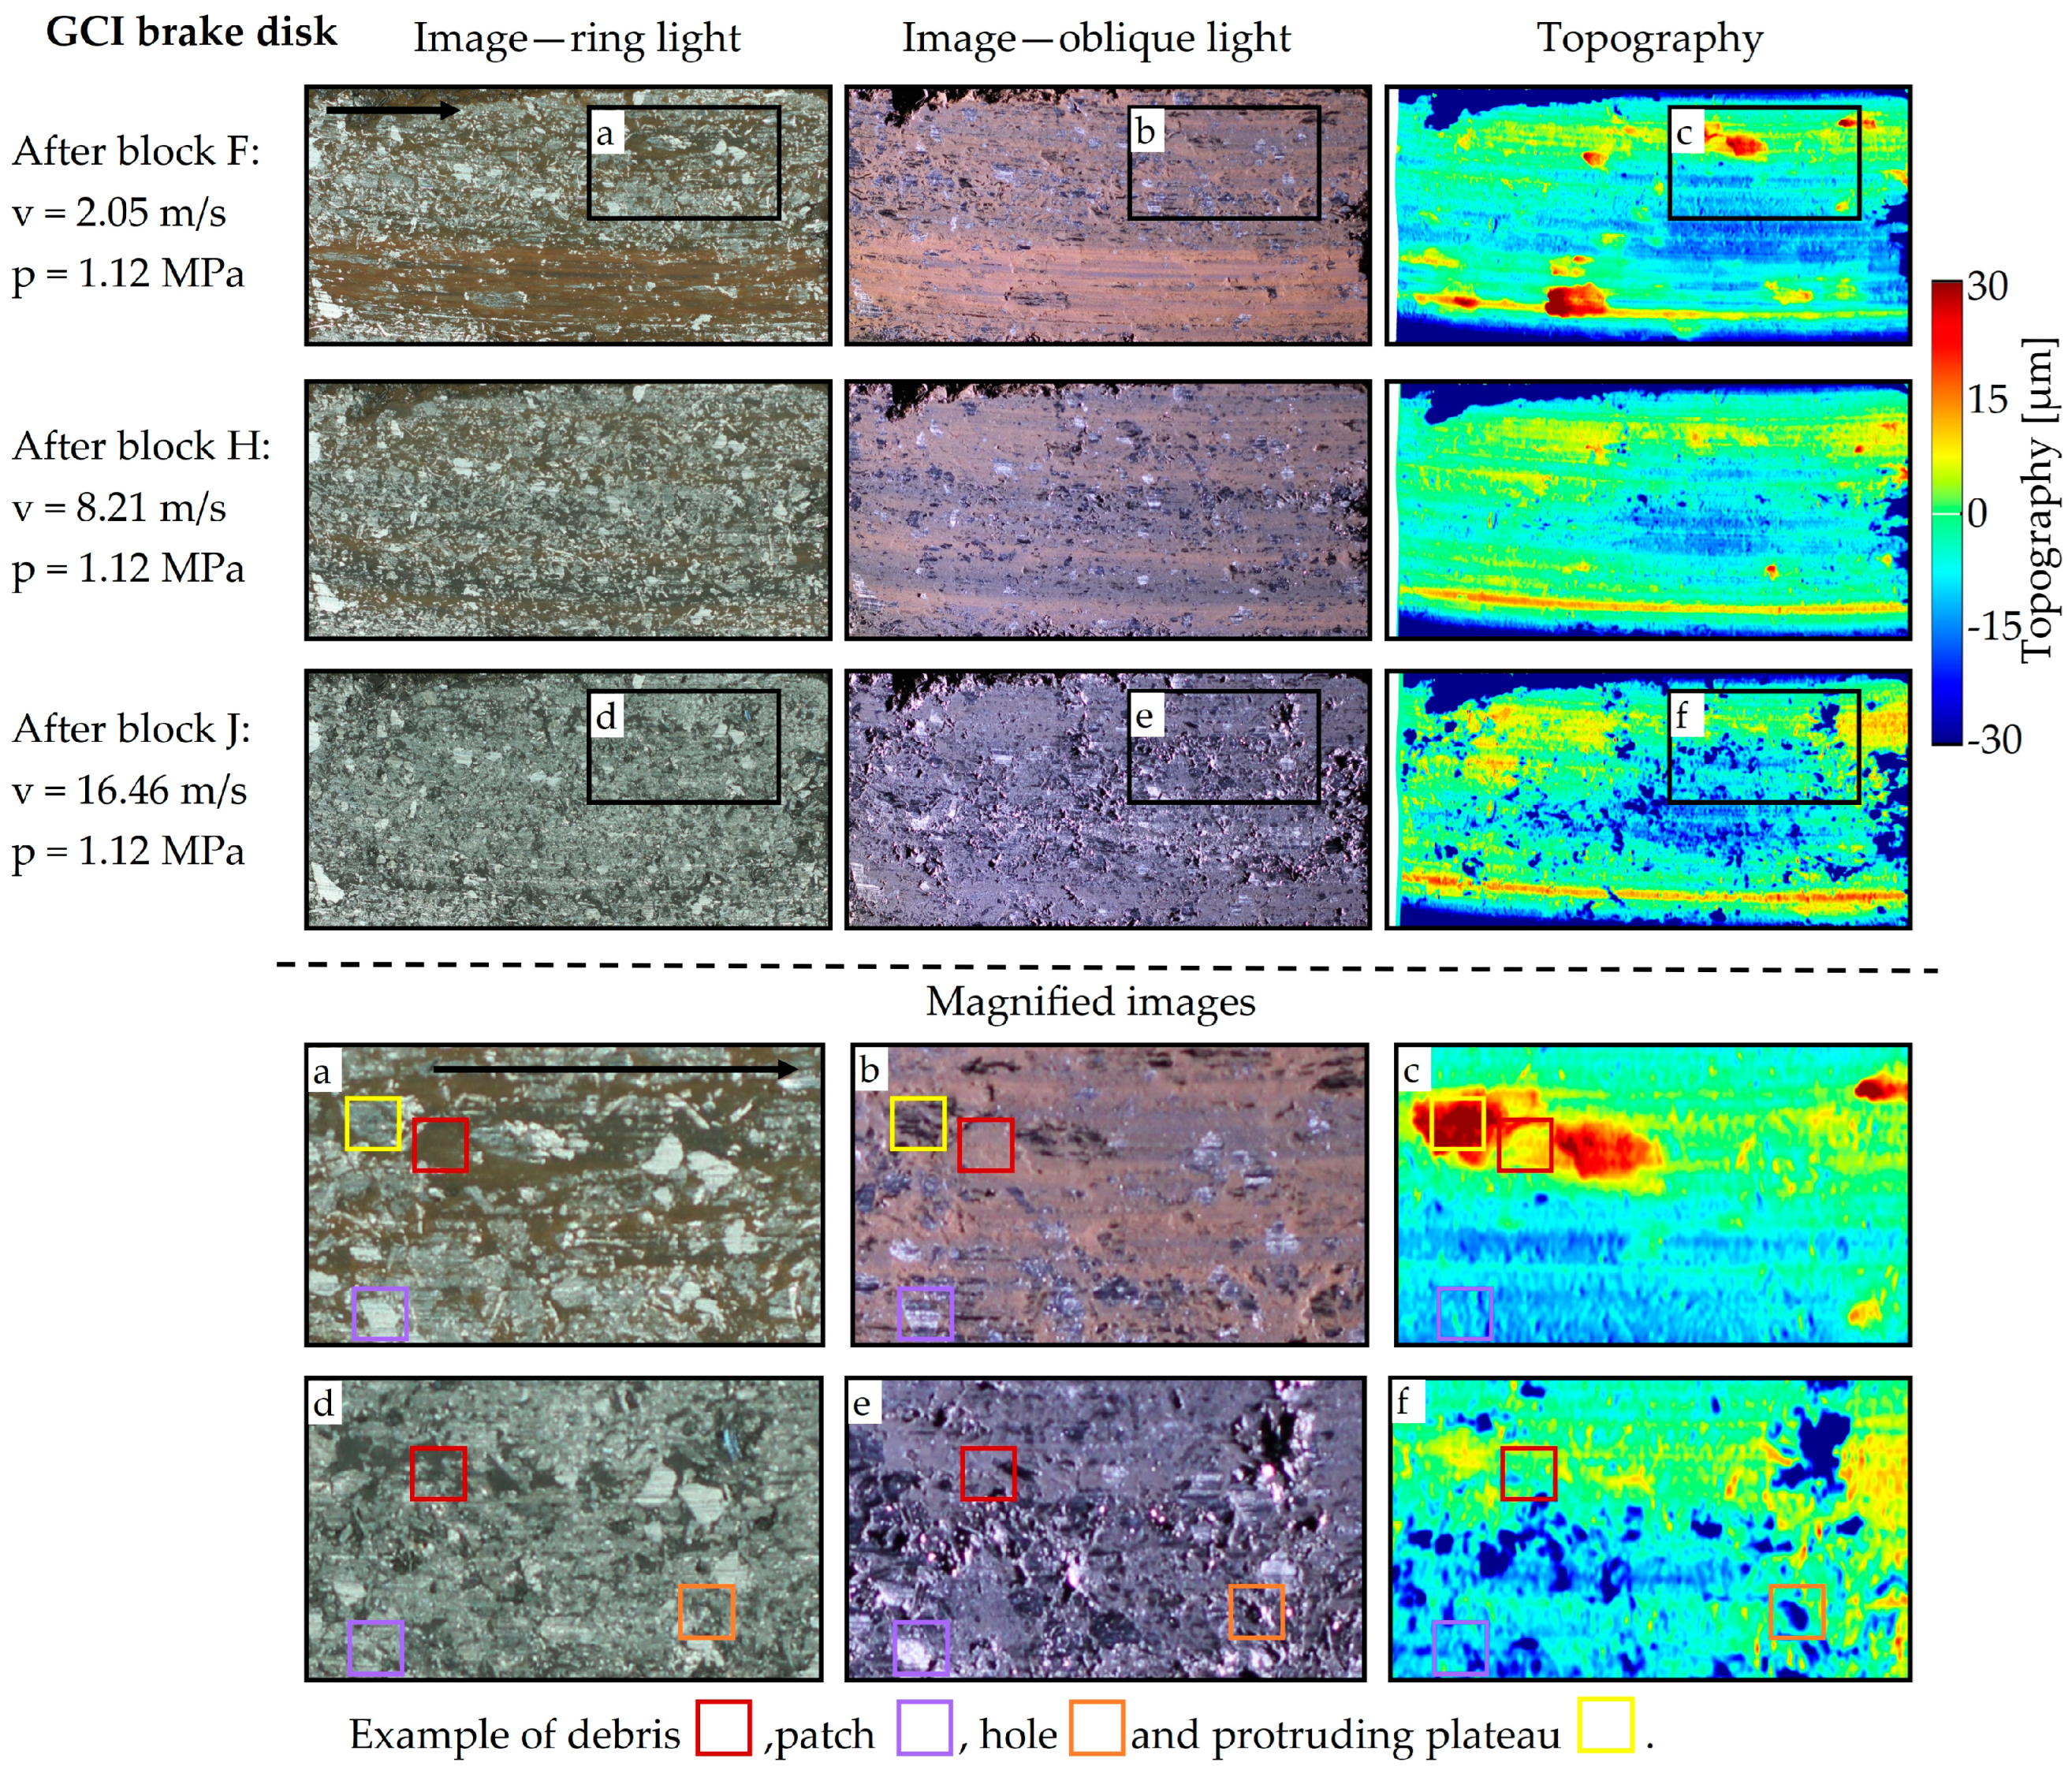
Figure 5 and Figure 6 present a sequence of color images and the topographic data of the pin in the brake segment with 1.12 MPa applied pressure using the GCI and the HS-LC disks, respectively. The magnified images help to compare the data visually.
The observations of the pin images using a GCI brake disk can be summarized as follows:
  • Images with ring illumination have areas with brown, light gray, dark gray and white colors. The brown area increases in the initial block (F) before disappearing completely in block (I); conversely the light and dark gray areas enlarge.
  • Images with oblique illumination display areas with red/brown, light gray, dark gray, white and black color. The red/brown areas match the brown areas, and even cover some gray and white areas of the ring illumination. The white areas in the ring illumination display under the oblique illumination red/brown, gray and white colors. Black areas are present near the pin border and also start to appear in the central region during block (H) after the removal of the red/brown areas.
  • The topographic data show protruding patches. In the initial block (F), these patches seem to grow, before being removed completely in the next two blocks (G–H). Holes starts to appear as the patches are removed, showing a maximum at the highest velocity in this segment (J). The holes spatially match the black areas with the oblique illumination. The patches do not show clear color matching with either ring or oblique illumination images.
The observations of the image sequence using the HS-LC disk can be summarized as:
  • Images with ring illumination show areas with yellow/gray, light gray, dark gray, and white colors. In general, there are only minor changes that are more visible comparing the initial and last blocks (F vs. J).
  • Images with oblique illumination show areas with yellow/brown, light gray, dark gray, white and black colors. The yellow/brown areas are more uniformly distributed in between the patches after block (F), while after block (J) the only brown areas are in the upper and bottom regions.
  • The topographic data show only small protruding patches. Holes are uniformly distributed in all blocks and do not show significant change with increased sliding velocity.
The observation from the pin surface using the GCI brake disk exhibits structures consistent with plateau theory, including primary patches and a third body that forms secondary patches, and their destruction at elevated brake pressures and sliding velocities. The GCI brake disk behaves in a consistent manner, unlike the HS-LC brake disk that shows an unstable friction behavior. Regarding the pin surface characterization, it is notable how relatively small the changes are compared to the variation in COF. Current friction and wear models, in which only the classes’ primary and secondary patches are considered, might not be valid for HS-LC brake disks. This begs the question whether the friction and wear behavior of the HS-LC brake disk might be better described by using other classes or properties of the topographic characterization.
As a first step in that direction, the second part of this study shows the development of a segmentation strategy for the recorded images and the topographical data. The goal is to extract relevant classes from the three data sources and analyze how they change with the braking conditions.

4. Image Segmentation and Correlation Analysis

4.1. Registration of Images and Topographic Data

The first step to extract quantitative information across the different data sources, i.e., both images and topographic data, is to register them. Small deviations between subsequent images are attributable to play in the pin fixture and traversing unit. The output of the oscillating laser triangulator is a 1D–array, which, when converted to a 2D–matrix using a border detector, represents the surface area. The resulting plane might not be co-planar to the friction plane, which needs to be corrected. These aspects lead to a non-trivial registration that is performed using the following steps (implemented in MATLAB):
  • Image-to-image: color images are transformed to gray-scale images. Using speeded up robust features (SURF), the transformation matrix is determined. Only translation and rotation are considered for registration, and all images are registered with reference to the first image.
  • Topographic level correction: a 3D point cloud is formed using the topographic data and the sample point locations in the x– and y–directions. The outliers, e.g., points on the pin holster, as well as the holes and patches, are ignored to ease the fitting of a plane. The slopes α (y–z) and β (x–z) of the fitted plane are used to correct the tilt of the point cloud. This step is repeated five times, while harshness of the threshold for holes and patches is increased. The transformation parameters are stored cumulatively in a final transformation matrix that is applied to the initial point cloud (without data removal). The transformed point cloud is interpolated with a new 2D mesh (x–y) and stored as a 2D matrix.
  • Topography-to-topography: The topographic data are binned to generate a gray-scale image (topographic image), where the range of −20 µm to 20 µm is represented in 0–255 intensity counts. For the registration, an algorithm was developed that uses the cross-correlation values of a sliding interrogation window to generate a displacement vector field. This method is capable of accounting for various geometric transformations, such as rotation, translation, shear and scaling, while being robust to intensity changes of a matching structure (e.g., height difference of the same patch). All topographic images are registered with respect to the first topographic image.
  • Topography-to-image registration is performed with the cross-correlation algorithm. The displacement field of an initial registration of the first image and the first topographic image is used for all subsequent topographic images. Remaining disparities are corrected by individual registration. The final displacement matrix is applied to the topographic data to maintain the full dynamic range in depth scale.
The outcome of the registration consists of three 3D matrices (or stacks), each for one data source, and two 2D matrices, for the location of the data points in the x– and y–directions. The third dimension represents the acquisition sequence, totaling 18 samples for each run.

4.2. Segmentation Scheme

The underlying similarities and differences between the ring and oblique illumination are shown schematically in Figure 7. The oblique illumination utilizes shadowing and reflection to highlight certain features of the surface. Shadows are present behind protruding patches, see #1. Holes appear black in the deeper parts but light gray in the border due to the angle of the light, whereas under ring illumination the entire hole might appear gray (compare #2 and #3). A major difference is that only parts of the white areas under ring illumination (see #4, #5 and #6) appear white under oblique illumination (see #7). The remaining regions appear black (see #8) or brown (see #9). The black color can be attributed to the low surface roughness, which results from direct contact with the disk. A smooth surface reflects light at the same angle as the incoming light without scattering. Due to the mismatch between the camera angle and the angle of the reflected light, the surface then appears black. The white patches, in contrast, might be rougher, leading to diffuse light scattering. The phenomenon shown in #6 and #9 is the penetration of light through a thin layer of debris. The light from the ring illumination may be sufficiently intense to penetrate the thin debris layer, and can be reflected by the underlying patch (see #6). Conversely, the light from the oblique illumination is scattered by the debris, resulting in more diffuse reflection (see #9). In the case of a thicker debris layer, which is represented here in brown, the light is scattered equally, resulting in similar-appearing areas under both oblique and ring illumination, see #10 and #11.
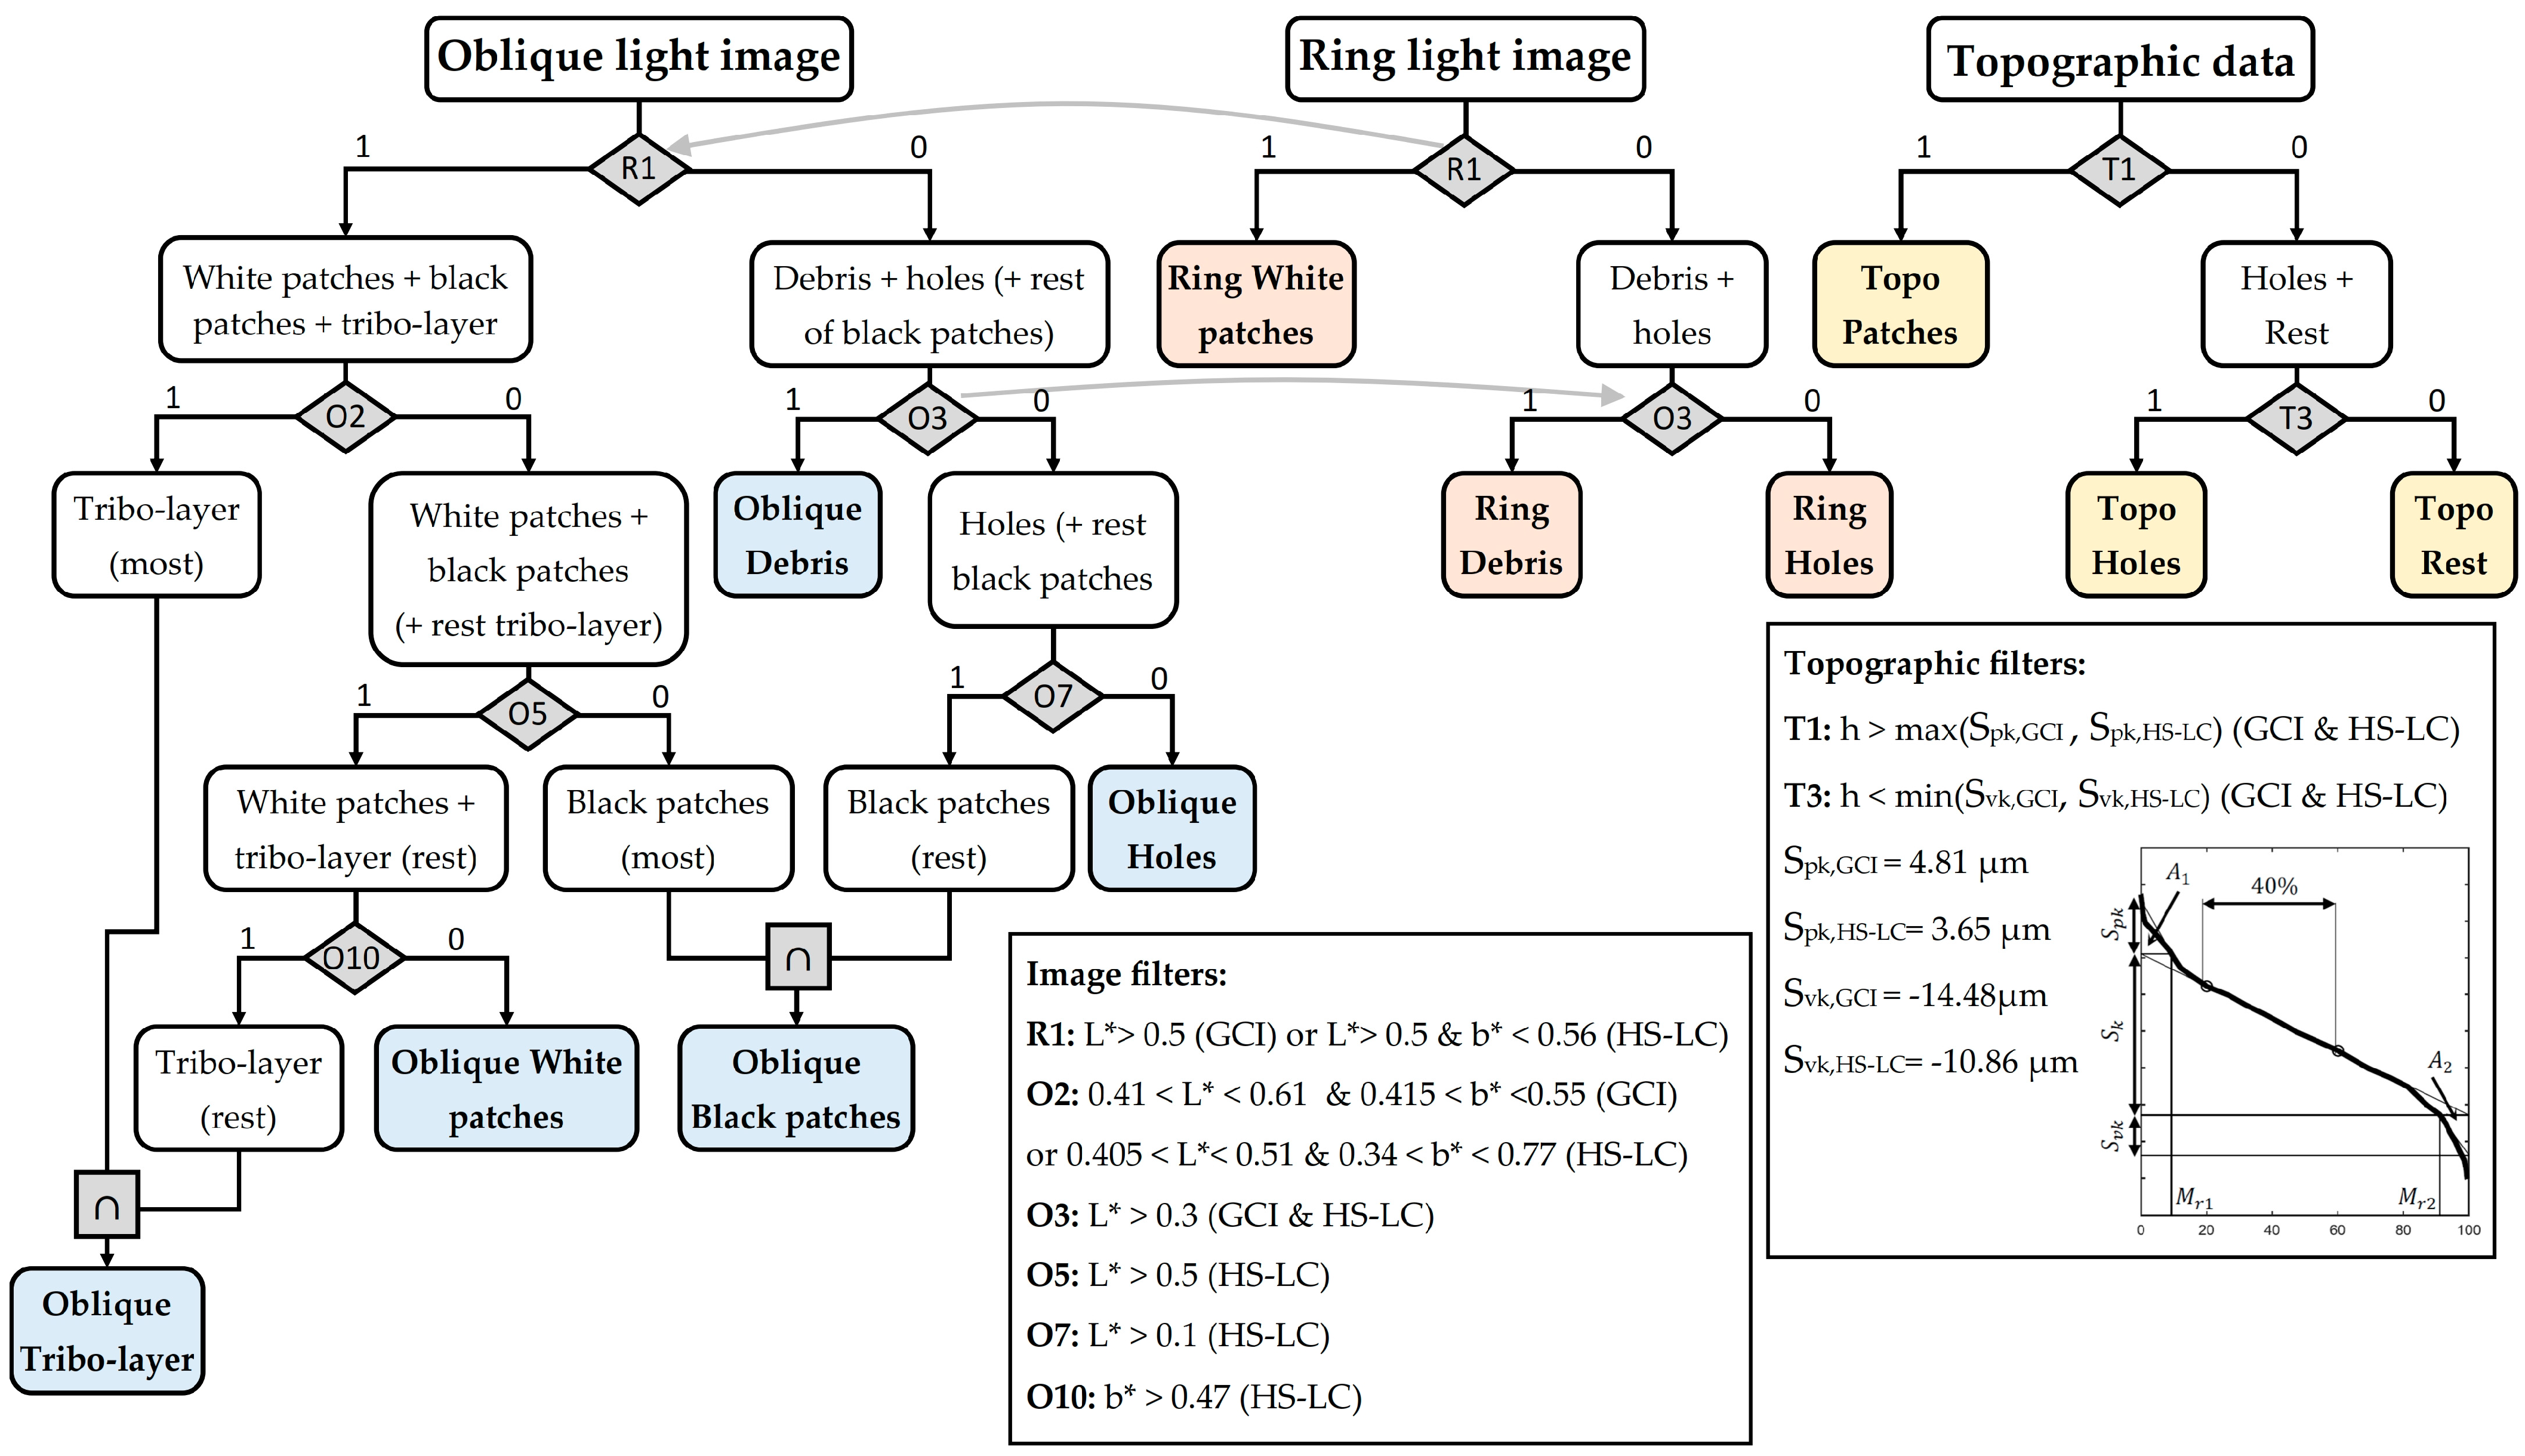
A segmentation scheme was developed based on the observed similarities and differences. To expand the contrast, the RGB images were converted into the CIE L*a*b* color space, in which L* represents the luminance, a* corresponds to a green–red opposition, and b* to a blue–yellow opposition [53,54].
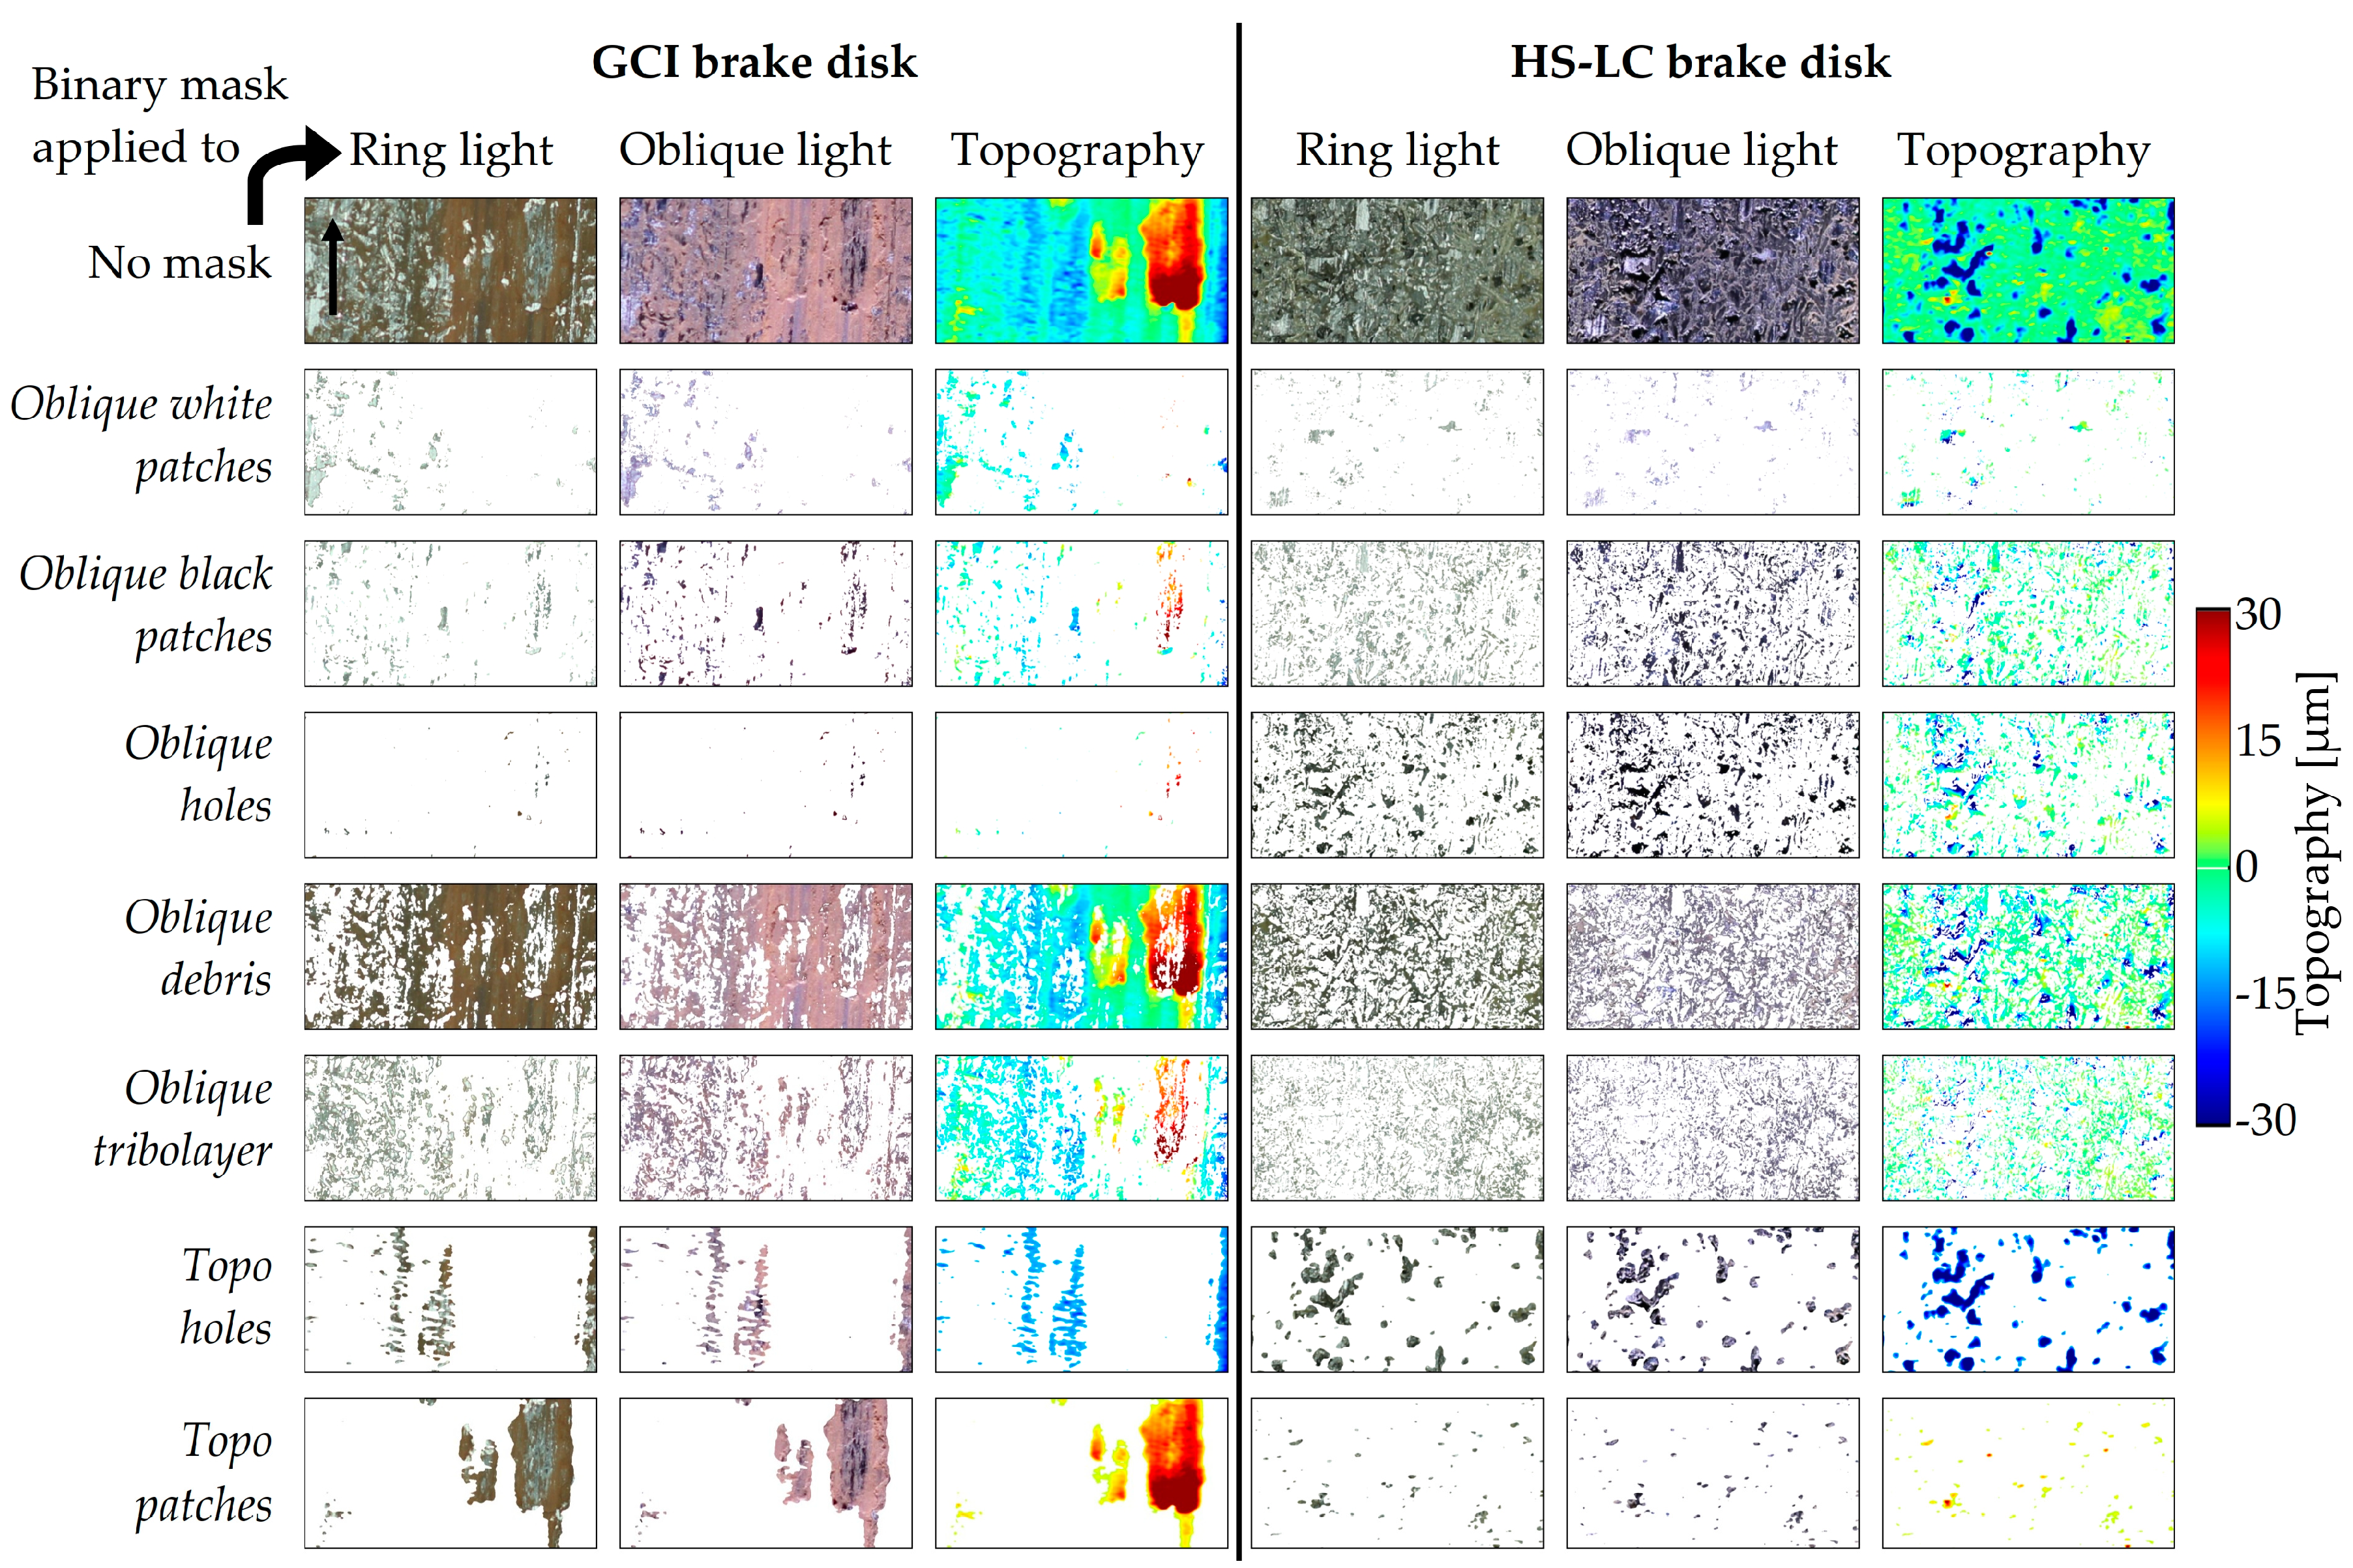
Figure 8 shows the segmentation scheme for an individual sample starting with a six-dimensional matrix (R, G, B, L*, a*, b*) for each illumination type, as well as the 2D matrix containing the topographic data. The segmentation criteria are coded as “R”, “O”, or “T”, depending on the origin of the data used, and a genealogical numbering system. This former part is important as some criteria from the ring light images are used in the segmentation of the oblique light images, and vice versa. Following the segmentation process, binary masks for each of the resulting classes are stored. The total pin surface of each data source is divided completely in the segmented classes. Note that, from the six available colors, only L* and b* were used, as they showed the largest contrast with the given surface coloring. The thresholds are normalized to represent the dynamic range of each color between 0 and 1. The topography data are segmented using the material ratio curve according to the DIN EN ISO 13565-2:1998-04 [55]. To establish global thresholds for the patches (Spk) and holes (Svk), all measurements (36 topographic recordings for GCI and HS-LC, respectively) were considered in the same material ratio curve. Lastly, the highest value for Spk and lowest value for Svk were chosen from both disks. An individual threshold for each topographical measurement (i.e., single block) might lead to a non-comparable outcome. For instance, a dataset with shallow holes and low patches might lead to soft thresholds (overestimation), while a dataset with deep holes and high patches might lead to harsh thresholds (underestimation). An overview of the segmented classes is displayed in Table 2.
An example of the outcome of the segmentation process can be seen in Figure 9. The seven binary masks were applied to the images with ring and oblique light, and the topographic data. This allows us to extract the characteristics of the masks when applied to other data sources (e.g., topographic data of mask oblique holes). This type of comparison, i.e., data integration, may be valuable for future studies, as the combination of multidimensional properties (color, topography and location) augments the analytical capabilities and model training possibilities.

4.3. Segmentation Ratios over Brake Parameters

To evaluate how the classes change during the test procedure, it is necessary to derive scalar values from the binary masks of the segmented classes. This is performed by calculating the area fraction of the binary masks relative to the total pin surface, herein referred to as the coverage ratio. The resulting scalar values range from 0 to 1, with 1 representing the total pin surface. The sum of the coverage ratios from each data source (i.e., ring light, oblique light and topography) must equal the total pin surface.
As demonstrated in Section 3, the friction results show similar trends across all three segments, at least in the GCI brake disk. To generalize the analysis, the coverage ratios are displayed in Figure 10 not in sequential order (compare Figure 2), but over the product of sliding velocity v and applied brake pressure p. This allows us to directly evaluate the influence of a harsher brake application but ignores the sequence of the test procedure. This has been observed to have an impact on the friction process, as the state of the pin surface caused by prior brake applications influences current and future ones. This phenomenon is commonly referred to as “brake history”. For the sake of evaluating the capabilities of the method presented here, this phenomenon is not considered.
The coverage ratios from the oblique illumination are displayed in Figure 10a,b, while the coverage ratios from the topographical data are shown in Figure 10c,d. As proposed in Table 2, a combination of oblique light classes might represent the classes described in the theory, such as primary and secondary patches. Several combinations of oblique light classes are displayed in Figure 10e,f.
Observations from the coverage ratios using the GCI brake disk:
  • COF: shows a steady decline as pv increases, although at the harshest braking block (24 MPa m/s) increases slightly.
  • PN: increases steadily, even though between 7.5 MPa m/s and 15 MPa m/s the slope is less steep. At a pv of 24 MPa m/s a large variation can be observed.
  • Oblique debris + oblique tribolayer: both behave similarly yet the debris layer is 20% higher. Up to a pv of 5 MPa m/s, both stay constant before declining by 20% and reaching a stable level after 17 MPa m/s.
  • Oblique white patches and oblique black patches: show similar behavior, although the black patches expand over 10% more surface. Between 5 MPa m/s and 17 MPa m/s, both classes increase in coverage area. At 24 MPa m/s, the black patches seem to decrease slightly.
  • Oblique holes: increase slowly up to 5 MPa m/s, then it increases with a steeper angle.
  • Topo holes: show a similar behavior to oblique holes, but cover 5% more area.
  • Topo patches: decrease steadily, reaching a stable level around 7%. At 24 MPa m/s it decreases further.
Observations from the coverage ratios using the HS-LC brake disk:
  • COF: shows unstable behavior. Up to 5 MPa m/s, an increase with low spreading can be seen. Afterwards, the increase continues shortly, before a steady decline with larger spreading is established.
  • PN: shows a stable, steady increase.
  • Oblique debris + oblique tribolayer: behave similarly and maintain a constant level around 30%
  • Oblique white patches: show a low coverage that slowly increases.
  • Oblique holes + oblique black patches: behave similarly, although the black patches have an offset of 5%. Both decline steadily before reaching 7.5 MPa m/s, from which they increase slowly.
  • Topo holes: vary slightly, maintaining a level around 8%.
  • Topo patches: increase slightly, but steadily, reaching a maximum of 8%.
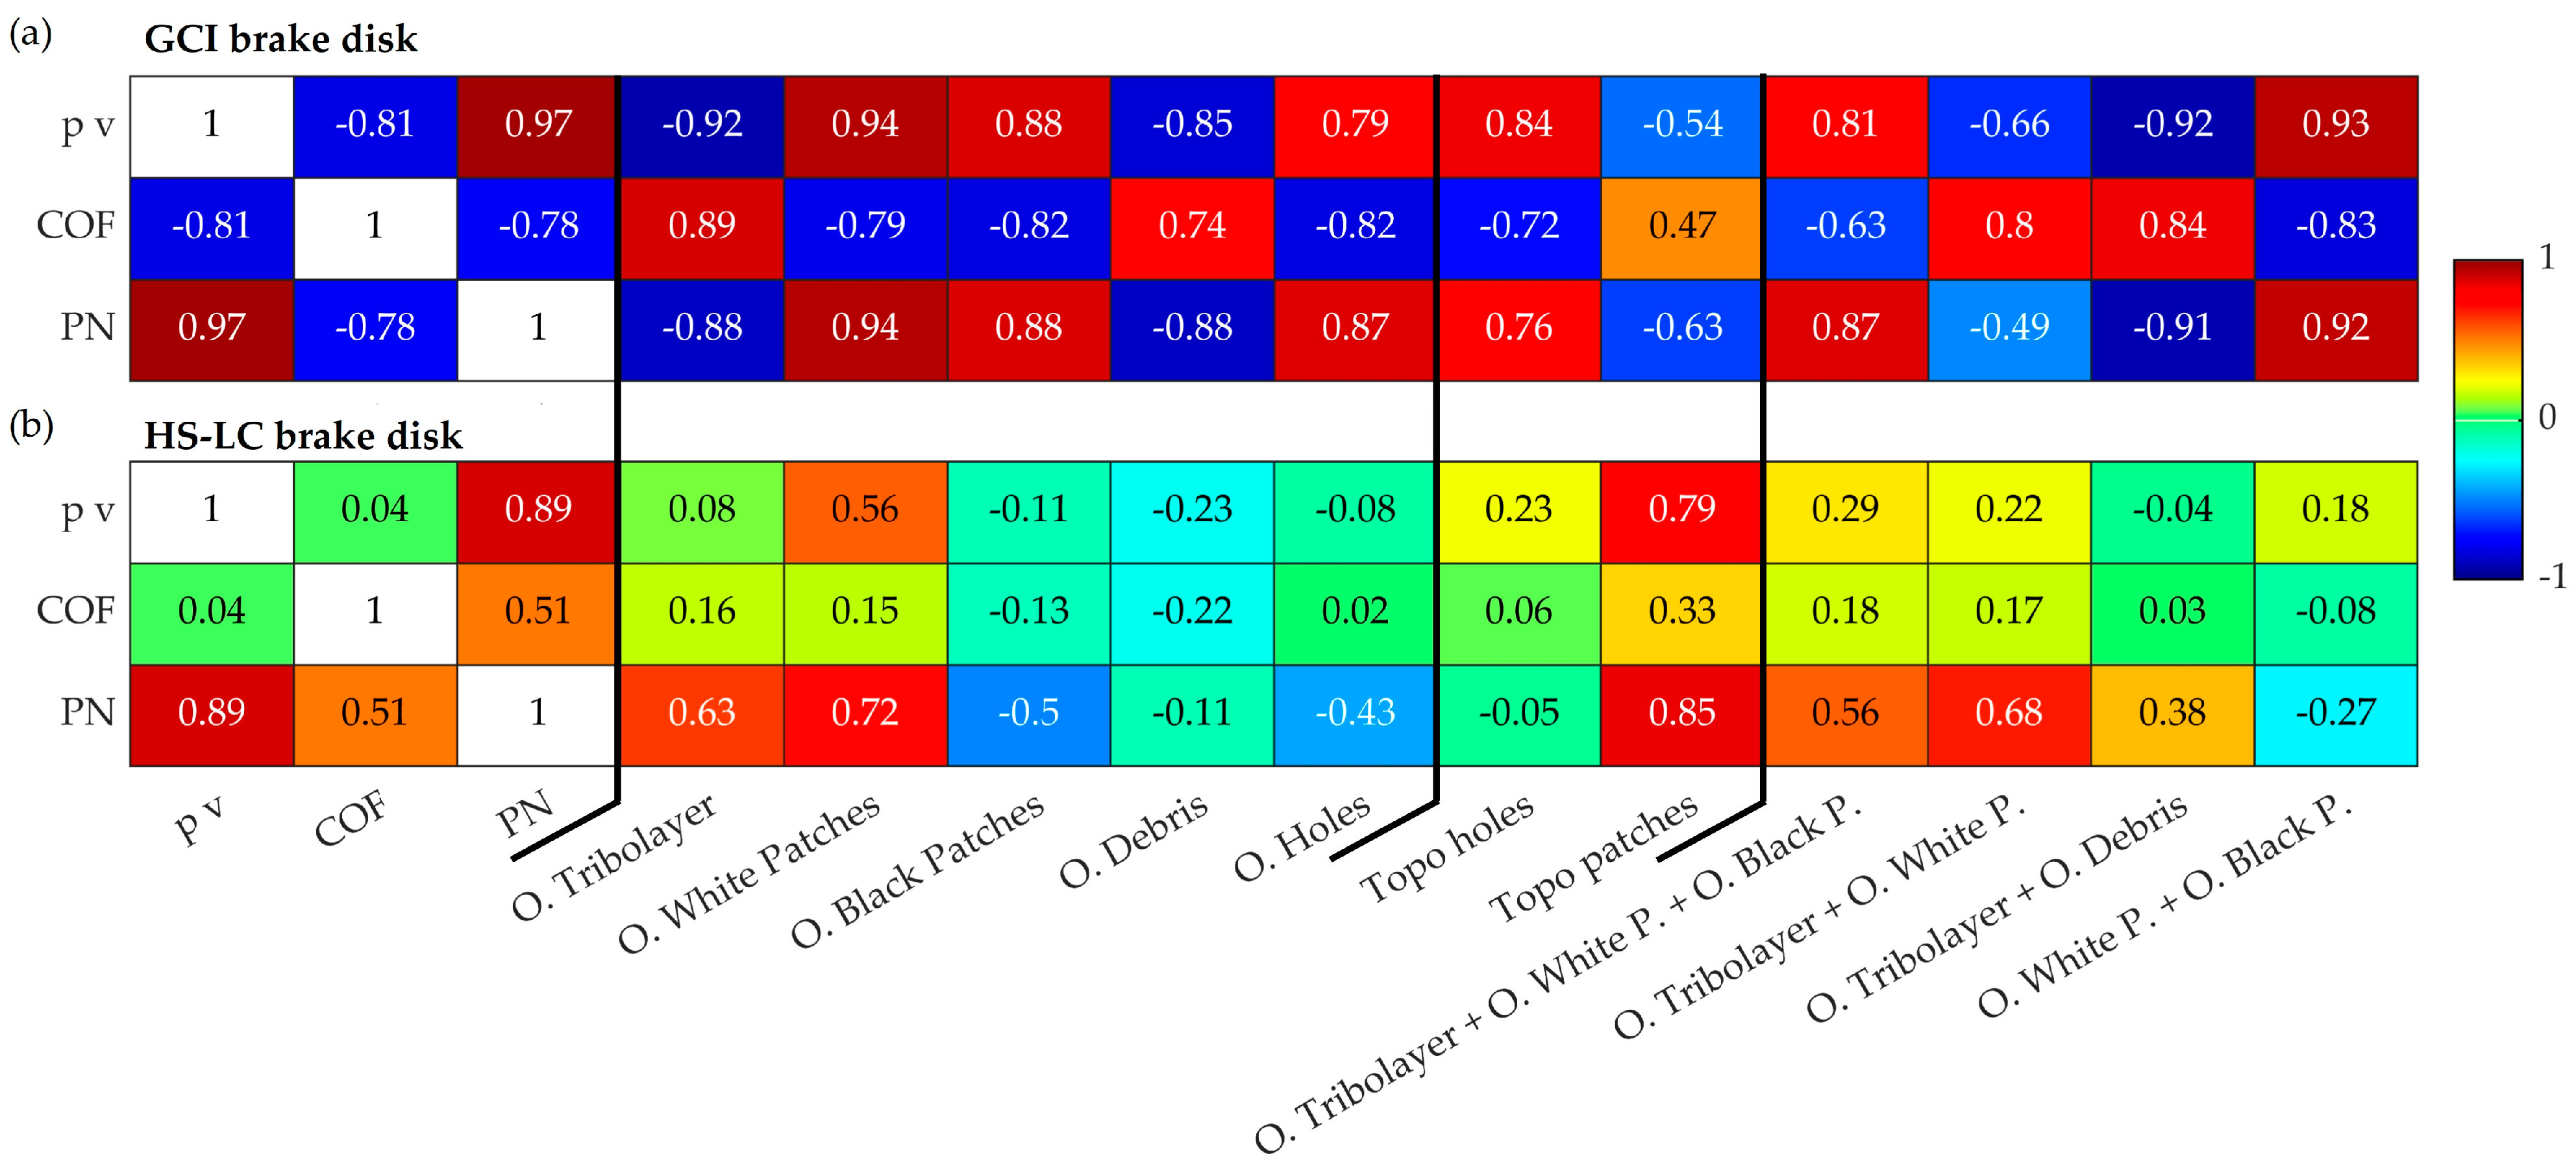
To assess the degree to which the classes correlate with pv, PN and COF, the Pearson’s linear correlation coefficient was calculated and displayed in Figure 11. The trends observed in Figure 10 are not necessarily linear, and as a first evaluation the Pearson’s correlation coefficient is sufficient.
The case using a GCI brake disk shows a strong correlation of PN to pv, and a strong anti-correlation from COF to pv. Remarkably, most of the segmented classes show medium to strong correlations. While oblique debris and oblique tribolayer correlate with COF, oblique white and black patches, oblique holes and topo holes correlate with pv (and, therefore, with PN).
The case using a HS-LC brake disk, in contrast, exhibits no resemblance to the GCI brake, nor do its image classes display any clear trends. This is evident in Figure 11, where only the oblique white patches and topo patches correlate with pv. However, these classes have the lowest surface coverage among all data sources (image or topographic data), thereby demeaning the importance of the correlation.
Prior investigations employing OM, SIM or SEM, which produce grayscale images, usually distinguish three classes bases on optical properties [37]. Primary patches are highly reflective and appear bright and white, while compacted debris appears gray. Lowlands and matrix material appear black. Using the Otsu’s algorithm to find the binarization threshold, most studies only differentiate between lowlands and patches (primary and secondary). The latter is assumed to represent the real contact area during the friction process. Eriksson and Jacobson measured the surface coverage of the contact area between 10% and 20% [20]. In more recent studies, the coverage area has been reported for copper-free brake pads between 19% and 60% [43], for low-metal brake pads between 6% and 54% [42], and for a NAO brake pads between 10% and 55% [38].
In this study, the availability of both the color imaging and the topographical data does not support a unique assignment of a class to the contact area, as shown in Table 2. To propose the protruding patches from the class topo patch as contact area, a flat counterpart is required. In reality, the disk wears off heterogeneously, as seen in Figure 4b. Bettge and Starcevic proposed a method for subtracting the grooves from the pin surface to enhance the patch detection [33]. The best approach would be to incorporate the disk’s topography measurement into the at-line acquisition system.
It is commonly accepted that the contact area increases with higher loads, as the asperities may wear and detach faster, resulting in a narrower gap between the friction partners [20]. At low sliding velocities, this may promote the compaction of debris and the formation of secondary patches, thereby increasing the contact area [20]. This is well represented by the pin used with the CGI brake disk by the classes oblique white patches and oblique black patches, see Figure 5 and Figure 10a (after block F). Conversely, at elevated sliding velocities, the secondary patches may become unstable, resulting in their detachment [56], as clearly visible in the classes oblique debris and oblique tribolayer, see Figure 5 and Figure 10a (after block J). It is noteworthy that neither of these classes exclusively represents the secondary patches. Combinations of individual classes that could potentially represent the contact area are displayed in Figure 10c. The combination of oblique white patches and oblique black patches resulted in values between 15% and 57%, while the combination of oblique white patches, oblique black patches and oblique tribolayer led to a coverage area between 40% and 62%. Both options show plausible values accordingly to prior investigations [56], although the COF correlates more to the first option, as illustrated in Figure 11.

5. Discussion

The discussion will examine three main topics, namely the benefits of the presented segmentation strategy for the GCI brake disk, considerations on the characterization of the HS-LC, and possibilities for data analysis and model generation.
From the friction, wear and emission results using the GCI brake disk presented in part one of this study, see Figure 2, Figure 3 and Figure 4, a comprehensive overview of its performance has been achieved. Nevertheless, through the segmentation and the derived coverage ratios of the classes, a quantitative analysis is possible, allowing us to draw further conclusions. For instance, based on the trends in Figure 10, well represented by the combination of white and black patches and the combination of the debris and tribolayer, three different regions can be observed. The first one has a high debris coverage, protruding patches and limited exposed white areas. The second region represents the transition to the last region, which has a low debris coverage, a large quantity of holes on the surface, and large white areas. Using this information, the wear in Figure 4a can be better described. A direct comparison of Figure 4a and Figure 10 is challenging, due to the loss of time coherence (sequential order of tests) in Figure 10. Nevertheless, using the noted block names in Figure 4a, the three regions can be matched. Blocks K and L are in the first region, block M is in the transitional region, and blocks N and O are in the last region. The height loss does show differences in each region, thus implying that the aforementioned regions could be coupled to widely accepted wear regimes, such as:
  • Moderate wear: exhibits a high COF with low PN emission. Secondary, protruding patches (topo patches) are present. Most of the surface is covered with oxidated debris (oblique debris and oblique tribolayer). The wear is also dominated by tribo-oxidative processes, in which an oxide layer is formed between the friction materials, thereby lubricating and protecting them [57,58].
  • Transitional region: COF declines while PN emission increases steadily. The secondary patches are destroyed progressively (topo patches). Simultaneously, debris is removed from the surface, exposing more patches and holes. This has been observed in [42,56]. The remaining debris is barely oxidated and accumulated between the white and black patches. Some patches are removed, leaving cavities (topo holes). Three-body abrasion, defined as the material wear caused by the penetration of a harder particles (from the removed patches) between the two contacting surfaces in the softer surface [57], is present. This phenomenon might explain the increase of oblique black patches, as observed by [34] using a light microscope.
  • Severe wear: COF stagnates at a lower level than at moderate wear. The further increase in number of cavities (topo holes) means that aggressive three-body abrasion is predominant. The unstable behavior of COF is observed in the harshest conditions, see block O in Figure 2b. The emission of larger particles is evident in Figure 3c,e. Furthermore, the wear increases non-linearly, as depicted in Figure 4a.
Based on Figure 10, the present study sets the threshold for the GCI brake disk with an LM brake pad at 5 MPa m/s to surpass the moderate wear regime, and 15 MPa m/s to enter the severe wear regime without considering the test sequence and possible “brake history” effects. A similar transition from moderate to severe wear was observed by Barros et al. [41] using color photography to image the transferred layer (tribo-film) onto the disk surface, as well as optical microscopy to measure the contact area on the pin. He proposed a limit pressure of 90 bar. In a later study, Barros et al. [59] investigated the threshold, further using the tribo-film as an indicator. The product of sliding speed v and applied pressure p was suggested as well. Moderate wear is present if pv is less than 7 MPa m/s, while severe wear is established if pv is greater than 15 MPa m/s. The intermediate region can be either moderate or severe, depending on the previous braking conditions. In the two studies, they noticed an increase of COF in the severe wear regime [41,59], which stands in contradiction to the results of this study. Österle and Dmitriev [60] showed that after reaching a certain pressure, the COF will remain constant. In a more recent study, Candeo et al. [56] used an LM and a NAO brake pad to generate pv-maps of the COF, wear and particle emissions. An increase of both sliding speed and simulated brake pressure led to an increase in wear and a decrease in COF, especially for the LM brake pad.
As previously mentioned, the HS-LC brake disk does not show clear trends or correlations when analyzed using the segmented classes. This phenomenon may be attributed to several factors. Firstly, laser-cladded disks have been observed to be more unstable and require a longer running-in to achieve stable COF values [10,12]. Secondly, the transfer material layer on the disk was not taken into consideration in this study. Debris from the friction layer is transferred to the hardest mating partner, i.e., the disk [12,57,61]. The disk may be the main actor governing the friction, wear and emission process, as evidenced by the linear increase in PN emissions, which arise primarily from the pin, despite the absence of a strong correlation between image classes (excluding oblique white patches and topo patches) and PN, as illustrated in Figure 11. Thirdly, although the tribo-oxidation of the debris from the pin is still present, it is not sufficient to create a thick, protective layer [62]. Based on this aspect the following considerations should be taken. The at-line surface characterization should also integrate the brake disk. A segmentation algorithm for the classes on the disk is then to be developed. For the further development of friction couples using a surface-hardened brake disk, at least for laser-cladded disks, the goal of promoting third-body processes on the pin surface might be beneficial for a stable friction and wear behavior, which can be well characterized and evaluated by the herein presented segmentation strategy for the pin surface.
The extensive quantitative data generated could be analyzed by more advanced methods than a linear correlation. This could promote the development and validation of more extensive models for the simulation of tribological processes using, for example, a cellular automaton or machine learning algorithms. The latter approach has been explored for the detection of brake squeal [63,64], the prediction of brake wear [65] and the identification of a wear mechanism [66].

6. Conclusions

A pin-on-disk study was conducted to compare gray cast iron (GCI) and laser-cladded (HS-LC) brake disks using low-metallic brake pads. An ex situ method characterized the pin surface after each braking block, involving a color camera with two illumination sources, and a laser triangulator. The study varied sliding velocity and brake pressure to compare the friction materials under different conditions.
Both disks showed changes in the coefficient of friction (COF) with increased sliding velocity: GCI decreased, while HS-LC increased. The HS-LC disk reduced PM10 particle emissions by 70% compared to the GCI disk, despite similar pin wear, due to its high wear resistance. Images and topography measurements revealed significant differences between the pins of both disks. The pin of the GCI disk showed at low braking energies significant quantities of debris and large protruding patches, while at high braking energies holes on the surface appeared and more white patches were visible. These observations correspond to known structures from the plateau theory. The pin used with the HS-LC brake disk had a topography dominated by holes, with minimal surface changes, challenging the applicability of plateau theory to laser-cladded disks.
To further investigate, a segmentation strategy for pin images and topographical data was developed. This strategy aimed to extract different classes (e.g., white patches, black patches, debris) and analyze their changes under braking conditions, correlating them with friction and emission results. For the GCI disk, segmented classes matched observations, showing a strong correlation to sliding velocity and the applied pressure. The HS-LC disk, on the contrary, did not show clear trends of the segmented classes over the braking conditions. This can be attributed to several aspects. For instance, HS-LC brake disks have been observed to be more unstable and require longer running-in periods. A transfer material layer on the disk might play a crucial role in friction, wear and emission processes, which were not considered by the current at-line surface characterization system. For further investigation of the HS-LC disk, the at-line measurement system must consider the disk’s surface. Furthermore, promoting third-body processes on the pin surface can help achieve stable friction and wear characteristics, which can be effectively analyzed using the presented segmentation strategy.
The methods presented here allow us to generate extensive quantitative data on the pin surface, thus potentially facilitating a more profound comprehension of the tribological system, the development of extensive models that accurately reflect the complex interactions within tribological processes, and the training and validation of machine learning models. These approaches not only enhance the understanding of friction and wear dynamics but also pave the way for innovative solutions in brake system design and optimization.

Author Contributions

Conceptualization, J.C.L.A., S.B., C.F., D.H., T.G., F.S., C.S. and S.A.K.; methodology, J.C.L.A., S.B., C.F. and S.A.K.; investigation, S.B. and C.F.; resources, D.H. and C.S.; data curation, J.C.L.A., S.B. and C.F.; writing—original draft preparation, J.C.L.A.; writing—review and editing, J.C.L.A., S.B., C.F., D.H., T.G., F.S., C.S. and S.A.K.; supervision, D.H., F.S., C.S. and S.A.K. All authors have read and agreed to the published version of the manuscript.

Funding

C.S. was funded by the Deutsche Forschungsgemeinschaft (DFG, German Research Foundation) in the Heisenberg Program (grant no. 500382045).

Institutional Review Board Statement

Not applicable.

Informed Consent Statement

Not applicable.

Data Availability Statement

The data presented in this study are available on request from the corresponding author due to the Volkswagen AG individual data disclosure approval process.

Conflicts of Interest

Authors Juan C. Londono Alfaro, David Hesse and Timo Gericke were employed by the company Volkswagen AG. The remaining authors declare that the research was conducted in the absence of any commercial or financial relationships that could be construed as a potential conflict of interest. The results, opinions and conclusions of this study are not necessarily those of Volkswagen AG.

Abbreviations

The following abbreviations are used in this manuscript:
PMParticulate Matter
NAONon-asbestos organic
LMLow-metallic
GCIGray cast iron
HS-LCHigh-speed laser cladding
COFCoefficient of friction
CACellular automaton
FEAFinite element analysis
CFDComputational fluid dynamics
LIMLight interference microscopy
OMOptical microscopy
SIMScanning ion microscopy
FIBFocused ion beam
SEMScanning electron microscopy
TEMTransmission electron microscopy
PNParticle number
AUTAutomated universal tribotester
RPMRevolutions per minute
WLTPWorldwide harmonized light vehicles test procedure
SURFSpeeded up robust features
CIECommission internationale de l’éclairage

References

  1. Grigoratos, T.; Martini, G. Brake wear particle emissions: A review. Environ. Sci. Pollut. Res. Int. 2015, 22, 2491–2504. [Google Scholar] [CrossRef] [PubMed]
  2. COM. 586–Proposal for a Regulation on Type-Approval of Motor Vehicles and Engines and of Systems, Components and Separate Technical Units Intended for Such Vehicles, with Respect to Their Emissions and Battery Durability (Euro7). Directorate General for Internal Market, Industry, Entrepreneurship and SMEs. Available online: https://single-market-economy.ec.europa.eu/sectors/automotive-industry/environmental-protection/emissions-automotive-sector_en (accessed on 28 February 2025).
  3. Neudeck, D. Low emission brakes–can the friction brake still be saved? In 9th International Munich Chassis Symposium 2018; Pfeffer, P., Ed.; Proceedings; Springer Fachmedien: Wiesbaden, Germany, 2019; pp. 675–687. [Google Scholar]
  4. Hascoët, M.; Adamczak, L. At source brake dust collection system. Results Eng. 2020, 5, 100083. [Google Scholar] [CrossRef]
  5. Storch, L.; Hamatschek, C.; Hesse, D.; Feist, F.; Bachmann, T.; Eichler, P.; Grigoratos, T. Comprehensive Analysis of Current Primary Measures to Mitigate Brake Wear Particle Emissions from Light-Duty Vehicles. Atmosphere 2023, 14, 712. [Google Scholar] [CrossRef]
  6. Piscitello, A.; Bianco, C.; Casasso, A.; Sethi, R. Non-exhaust traffic emissions: Sources, characterization, and mitigation measures. Sci. Total Environ. 2021, 766, 144440. [Google Scholar] [CrossRef] [PubMed]
  7. Giechaskiel, B.; Grigoratos, T.; Dilara, P.; Karageorgiou, T.; Ntziachristos, L.; Samaras, Z. Light-Duty Vehicle Brake Emission Factors. Atmosphere 2024, 15, 97. [Google Scholar] [CrossRef]
  8. Breuer, B.; Bill, K.H. Bremsenhandbuch; Springer Fachmedien: Wiesbaden, Germany, 2017. [Google Scholar]
  9. Aranke, O.; Algenaid, W.; Awe, S.; Joshi, S. Coatings for Automotive Gray Cast Iron Brake Discs: A Review. Coatings 2019, 9, 552. [Google Scholar] [CrossRef]
  10. Hamatschek, C.; Augsburg, K.; Schobel, D.; Gramstat, S.; Stich, A.; Gulden, F.; Hesse, D. Comparative Study on the Friction Behaviour and the Particle Formation Process between a Laser Cladded Brake Disc and a Conventional Grey Cast Iron Disc. Metals 2023, 13, 300. [Google Scholar] [CrossRef]
  11. Candeo, S.; Nogueira, A.P.; Gialanella, S.; Straffelini, S. Wear-emission correlation in brake materials. Wear 2025, 562–563, 205650. [Google Scholar] [CrossRef]
  12. Federici, M.; Menapace, C.; Mancini, A.; Straffelini, G.; Gialanella, S. Pin-on-disc study of dry sliding behavior of Co-free HVOF-coated disc tested against different friction materials. Friction 2021, 9, 1242–1258. [Google Scholar] [CrossRef]
  13. Manoj, A.; Saurabh, A.; Narala, S.K.R.; Saravanan, P.; Natu, H.P.; Verma, P.C. Surface modification of grey cast iron by laser cladding for automotive brake disc application. Wear 2023, 532–533, 205099. [Google Scholar] [CrossRef]
  14. Lyu, Y.; Varriale, F.; Malmborg, V.; Ek, M.; Pagels, J.; Wahlström, J. Tribology and airborne particle emissions from grey cast iron and WC reinforced laser cladded brake discs. Wear 2024, 556–557, 205512. [Google Scholar] [CrossRef]
  15. Hesse, D.; Hamatschek, C.; Augsburg, K.; Weigelt, T.; Prahst, A.; Gramstat, S. Testing of Alternative Disc Brakes and Friction Materials Regarding Brake Wear Particle Emissions and Temperature Behavior. Atmosphere 2021, 12, 436. [Google Scholar] [CrossRef]
  16. Manoj, A.; Verma, P.C.; Thangaraju, S.; Narala, S.K.R.; Saravanan, P. High-temperature dry sliding tribological behavior of Fe-based laser cladded grey cast iron for automotive brake disc application. Wear 2025, 205819. [Google Scholar] [CrossRef]
  17. Athanassiou, N.; Olofsson, U.; Wahlström, J.; Dizdar, S. Simulation of thermal and mechanical performance of laser cladded disc brake rotors. Proc. Inst. Mech. Eng. Part J J. Eng. Tribol. 2022, 236, 3–14. [Google Scholar] [CrossRef]
  18. Godet, M. The third-body approach: A mechanical view of wear. Wear 1984, 100, 437–452. [Google Scholar] [CrossRef]
  19. Eriksson, M.; Bergman, F.; Jacobson, S. Surface characterisation of brake pads after running under silent and squealing conditions. Wear 1999, 232, 163–167. [Google Scholar] [CrossRef]
  20. Eriksson, M.; Jacobson, S. Tribological surfaces of organic brake pads. Tribol. Int. 2000, 33, 817–827. [Google Scholar] [CrossRef]
  21. Eriksson, M.; Bergman, F.; Jacobson, S. On the nature of tribological contact in automotive brakes. Wear 2002, 252, 26–36. [Google Scholar] [CrossRef]
  22. Eriksson, M.; Lord, J.; Jacobson, S. Wear and contact conditions of brake pads: Dynamical in situ studies of pad on glass. Wear 2001, 249, 272–278. [Google Scholar] [CrossRef]
  23. Ostermeyer, G.P. Friction and wear of brake systems. Forsch. Im Ingenieurwesen 2001, 66, 267–272. [Google Scholar] [CrossRef]
  24. Ostermeyer, G.P.; Müller, M. Dynamic interaction of friction and surface topography in brake systems. Tribol. Int. 2006, 39, 370–380. [Google Scholar] [CrossRef]
  25. Müller, M.; Ostermeyer, G.P. A Cellular Automaton model to describe the three-dimensional friction and wear mechanism of brake systems. Wear 2007, 263, 1175–1188. [Google Scholar] [CrossRef]
  26. Wahlström, J.; Söderberg, A.; Olofsson, U. A Cellular Automaton Approach to Numerically Simulate the Contact Situation in Disc Brakes. Tribol. Lett. 2011, 42, 253–262. [Google Scholar] [CrossRef]
  27. Wahlström, J. Towards a cellular automaton to simulate friction, wear, and particle emission of disc brakes. Wear 2014, 313, 75–82. [Google Scholar] [CrossRef]
  28. Wahlström, J. A comparison of measured and simulated friction, wear, and particle emission of disc brakes. Tribol. Int. 2015, 92, 503–511. [Google Scholar] [CrossRef]
  29. Ostermeyer, G.-P.; Merlis, J.H. Modeling the Friction Boundary Layer of an Entire Brake Pad with an Abstract Cellular Automaton. Lubricants 2018, 6, 44. [Google Scholar] [CrossRef]
  30. Wahlström, J.; Söderberg, A.; Olander, L.; Jansson, A.; Olofsson, U. A pin-on-disc simulation of airborne wear particles from disc brakes. Wear 2010, 268, 763–769. [Google Scholar] [CrossRef]
  31. Riva, G.; Valota, G.; Perricone, G.; Wahlström, J. An FEA approach to simulate disc brake wear and airborne particle emissions. Tribol. Int. 2019, 138, 90–98. [Google Scholar] [CrossRef]
  32. Riva, G.; Perricone, G.; Wahlström, J. A Multi-Scale Simulation Approach to Investigate Local Contact Temperatures for Commercial Cu-Full and Cu-Free Brake Pads. Lubricants 2019, 7, 80. [Google Scholar] [CrossRef]
  33. Bettge, D.; Starcevic, J. Quantitative description of wear surfaces of disc brakes using interference microscopy. Wear 2001, 248, 121–127. [Google Scholar] [CrossRef]
  34. Limmer, F.; Paulus, A.; Barton, D.; Brooks, P.; Neville, A.; Kosarieh, S. A comparison of methods for characterizing brake pad surfaces. In Proceedings of the Eurobrake 2020 Conference, Barcelona, Spain, 2–4 June 2020. [Google Scholar]
  35. Österle, W.; Bettge, D. Vergleich von Methoden zur Charakterisierung von Bremsbelag-Oberflächen/A Comparison of Methods for Characterizing Brake Lining Surfaces. Pract. Metallogr. 2004, 41, 494–505. [Google Scholar] [CrossRef]
  36. Österle, W.; Urban, I. Friction layers and friction films on PMC brake pads. Wear 2004, 257, 215–226. [Google Scholar] [CrossRef]
  37. Neis, P.D.; Ferreira, N.F.; Sukumaran, J.; de Baets, P.; Ando, M.; Matozo, L.T.; Masotti, D. Characterization of surface morphology and its correlation with friction performance of brake pads. SCAD 2015, 6, 6. [Google Scholar] [CrossRef]
  38. Barros, L.Y.; Neis, P.D.; Ferreira, N.F.; Pavlak, R.P.; Masotti, D.; Matozo, L.T.; Sukumaran, J.; de Baets, P.; Andó, M. Morphological analysis of pad–disc system during braking operations. Wear 2016, 352–353, 112–121. [Google Scholar] [CrossRef]
  39. Neis, P.D.; Ferreira, N.F.; Fekete, G.; Matozo, L.T.; Masotti, D. Towards a better understanding of the structures existing on the surface of brake pads. Tribol. Int. 2017, 105, 135–147. [Google Scholar] [CrossRef]
  40. Poletto, J.C.; Barros, L.Y.; Neis, P.D.; Ferreira, N.F. Analysis of the error in the estimation of the morphology of contact plateaus existing on the surface of brake pads. Tribol. Int. 2018, 126, 297–306. [Google Scholar] [CrossRef]
  41. Barros, L.Y.; Poletto, J.C.; Buneder, D.; Neis, P.D.; Ferreira, N.F.; Pavlak, R.P.; Matozo, L.T. Effect of pressure in the transition between moderate and severe wear regimes in brake friction materials. Wear 2019, 438–439, 203112. [Google Scholar] [CrossRef]
  42. Barros, L.Y.; Poletto, J.C.; Gehlen, G.S.; Lasch, G.; Neis, P.D.; Ramalho, A.; Ferreira, N.F. Transition in wear regime during braking applications: An analysis of the debris and surfaces of the brake pad and disc. Tribol. Int. 2023, 189, 108968. [Google Scholar] [CrossRef]
  43. Limmer, F.; Brooks, P.C.; Gilkeson, C.; Kosarieh, S.; Barton, D.C. Tribo-oxidation of a brake friction couple under varying sliding conditions. Tribol. Int. 2023, 185, 108536. [Google Scholar] [CrossRef]
  44. Österle, W.; Urban, I. Third body formation on brake pads and rotors. Tribol. Int. 2006, 39, 401–408. [Google Scholar] [CrossRef]
  45. Bettge, D.; Starcevic, J. Topographic properties of the contact zones of wear surfaces in disc brakes. Wear 2003, 254, 195–202. [Google Scholar] [CrossRef]
  46. Otsu, N. A Threshold Selection Method from Gray-Level Histograms. IEEE Trans. Syst. Man Cybern. 1979, 9, 62–66. [Google Scholar] [CrossRef]
  47. Ostermeyer, G.P.; Schramm, T.; Raczek, S.; Bubser, F.; Perzborn, N. The automated universal tribotester. In Proceedings of the EuroBrake 2015 Conference, EB2015-STQ-016, Dresden, Germany, 4–6 May 2015. [Google Scholar]
  48. Perzborn, N.; Agudelo, C.; Ostermeyer, G.P. On Similarities and Differences of Measurements on Inertia Dynamometer and Scale Testing Tribometer for Friction Coefficient Evaluation. SAE Int. J. Mater. Manuf. 2015, 8, 104–117. Available online: www.jstor.org/stable/26268697 (accessed on 12 March 2025). [CrossRef]
  49. Raczek, S.; Ostermeyer, G.-P. Development and Implementation of Constant Friction Power Control in a Reduced Scale Brake Dynamometer for Investigations of Automotive Brake Systems. J. Mech. Eng. Autom. 2016, 6, 282–287. [Google Scholar] [CrossRef]
  50. Schramm, T. Automatisierte Topografische Vermessung von Hochlastkontakten in Einem Tribometer. Ph.D. Thesis, TU Braunschweig, Braunschweig, Germany, 2019. [Google Scholar]
  51. Schramm, T.; Ostermeyer, G.-P. Automated Brake Pad Surface Topography Measurement Using the AUT. In Proceedings of the EuroBrake 2016 Conference, EB2016-SVM-023, Milan, Italy, 13–15 June 2016. [Google Scholar]
  52. Vogel, A.; Ostermeyer, G.-P. Adaptronic Actuator to Minimize the Pins Misalignment on Pin-on-Disc Testers; SAE Technical Paper Series; SAE International: Warrendale, PA, USA, 2018. [Google Scholar]
  53. Busin, L.; Vandenbroucke, N.; Macaire, L. Color Spaces and Image Segmentation; Advances in Imaging and Electron Physics; Elsevier: Amsterdam, The Netherlands, 2009; pp. 65–168. [Google Scholar]
  54. Commission Internationale de l’Éclairage. Colorimetry; Technical report CIE 15 2004; CIE: Vienna, Austria, 2004. [Google Scholar]
  55. DIN EN ISO 13565-2:1998-04; Geometrische Produktspezifikationen (GPS)_-Oberflächenbeschaffenheit: Tastschnittverfahren_-Oberflächen mit Plateauartigen Funktionsrelevanten Eigenschaften_-Teil_2: Beschreibung der Höhe Mittels Linearer Darstellung der Materialanteilkurve (ISO_13565-2:1996); Deutsche Fassung EN_ISO_13565-2:1997. Beuth Verlag GmbH: Berlin, Germany, 1998. [CrossRef]
  56. Candeo, S.; Leonardi, M.; Gialanella, S.; Straffelini, S. Influence of contact pressure and velocity on the brake behaviour and particulate matter emissions. Wear 2023, 514–515, 204579. [Google Scholar] [CrossRef]
  57. Straffelini, G. Friction and Wear; Springer International Publishing: Cham, Switzerland, 2015. [Google Scholar]
  58. Stott, F.H. The role of oxidation in the wear of alloys. Tribol. Int. 1998, 31, 61–71. [Google Scholar] [CrossRef]
  59. Barros, L.Y.; Poletto, J.C.; Buneder, D.; Flores, R.; Gehlen, G.; Neis, P.D.; Ferreira, N.F.; Matozo, L.T. An experimental study of the transition in the wear regime of brake friction materials. Polym. Compos. 2021, 42, 6310–6321. [Google Scholar] [CrossRef]
  60. Oesterle, W.; Dmitriev, A.I. Some Considerations on the Role of Third Bodies during Automotive Braking. SAE Int. J. Passeng. Cars-Mech. Syst. 2014, 7, 1287–1294. [Google Scholar] [CrossRef]
  61. Dizdar, S.; Lyu, Y.; Lampa, C.; Olofsson, U. Grey Cast Iron Brake Discs Laser Cladded with Nickel-Tungsten Carbide—Friction, Wear and Airborne Wear Particle Emission. Atmosphere 2020, 11, 621. [Google Scholar] [CrossRef]
  62. Candeo, S.; Varriale, F.; Nogueira, A.P.; Gialanella, S.; Straffelini, G. Performance of a cast-iron and WC Co-free iron-based coated disc under mild and severe brake conditions. Wear 2024, 548–549, 205369. [Google Scholar] [CrossRef]
  63. Stender, M.; Tiedemann, M.; Spieler, D.; Schoepflin, D.; Hoffmann, N.; Oberst, S. Deep learning for brake squeal: Brake noise detection, characterization and prediction. Mech. Syst. Signal Process. 2021, 149, 107181. [Google Scholar] [CrossRef]
  64. Caradec, Q.; Thévenot, M.; Durain, S.; Brunel, J.-F.; Dufrénoy, P.; Stender, M. Investigation of the Conditions of Brake Squeal Occurrence Using Machine Learning Methods. 2024. Available online: https://ssrn.com/abstract=5002168 (accessed on 26 March 2025).
  65. Steffan, J.J.; Jebadurai, I.J.; Asirvatham, L.G.; Manova, S.; Larkins, J.P. Prediction of Brake Pad Wear Using Various Machine Learning Algorithms. In Recent Trends in Design, Materials and Manufacturing; Singh, M.K., Gautam, R.K., Eds.; Lecture Notes in Mechanical Engineering; Springer Nature: Singapore, 2022; pp. 529–543. [Google Scholar]
  66. Sieberg, P.M.; Kurtulan, D.; Hanke, S. Wear Mechanism Classification Using Artificial Intelligence. Materials 2022, 15, 2358. [Google Scholar] [CrossRef] [PubMed]
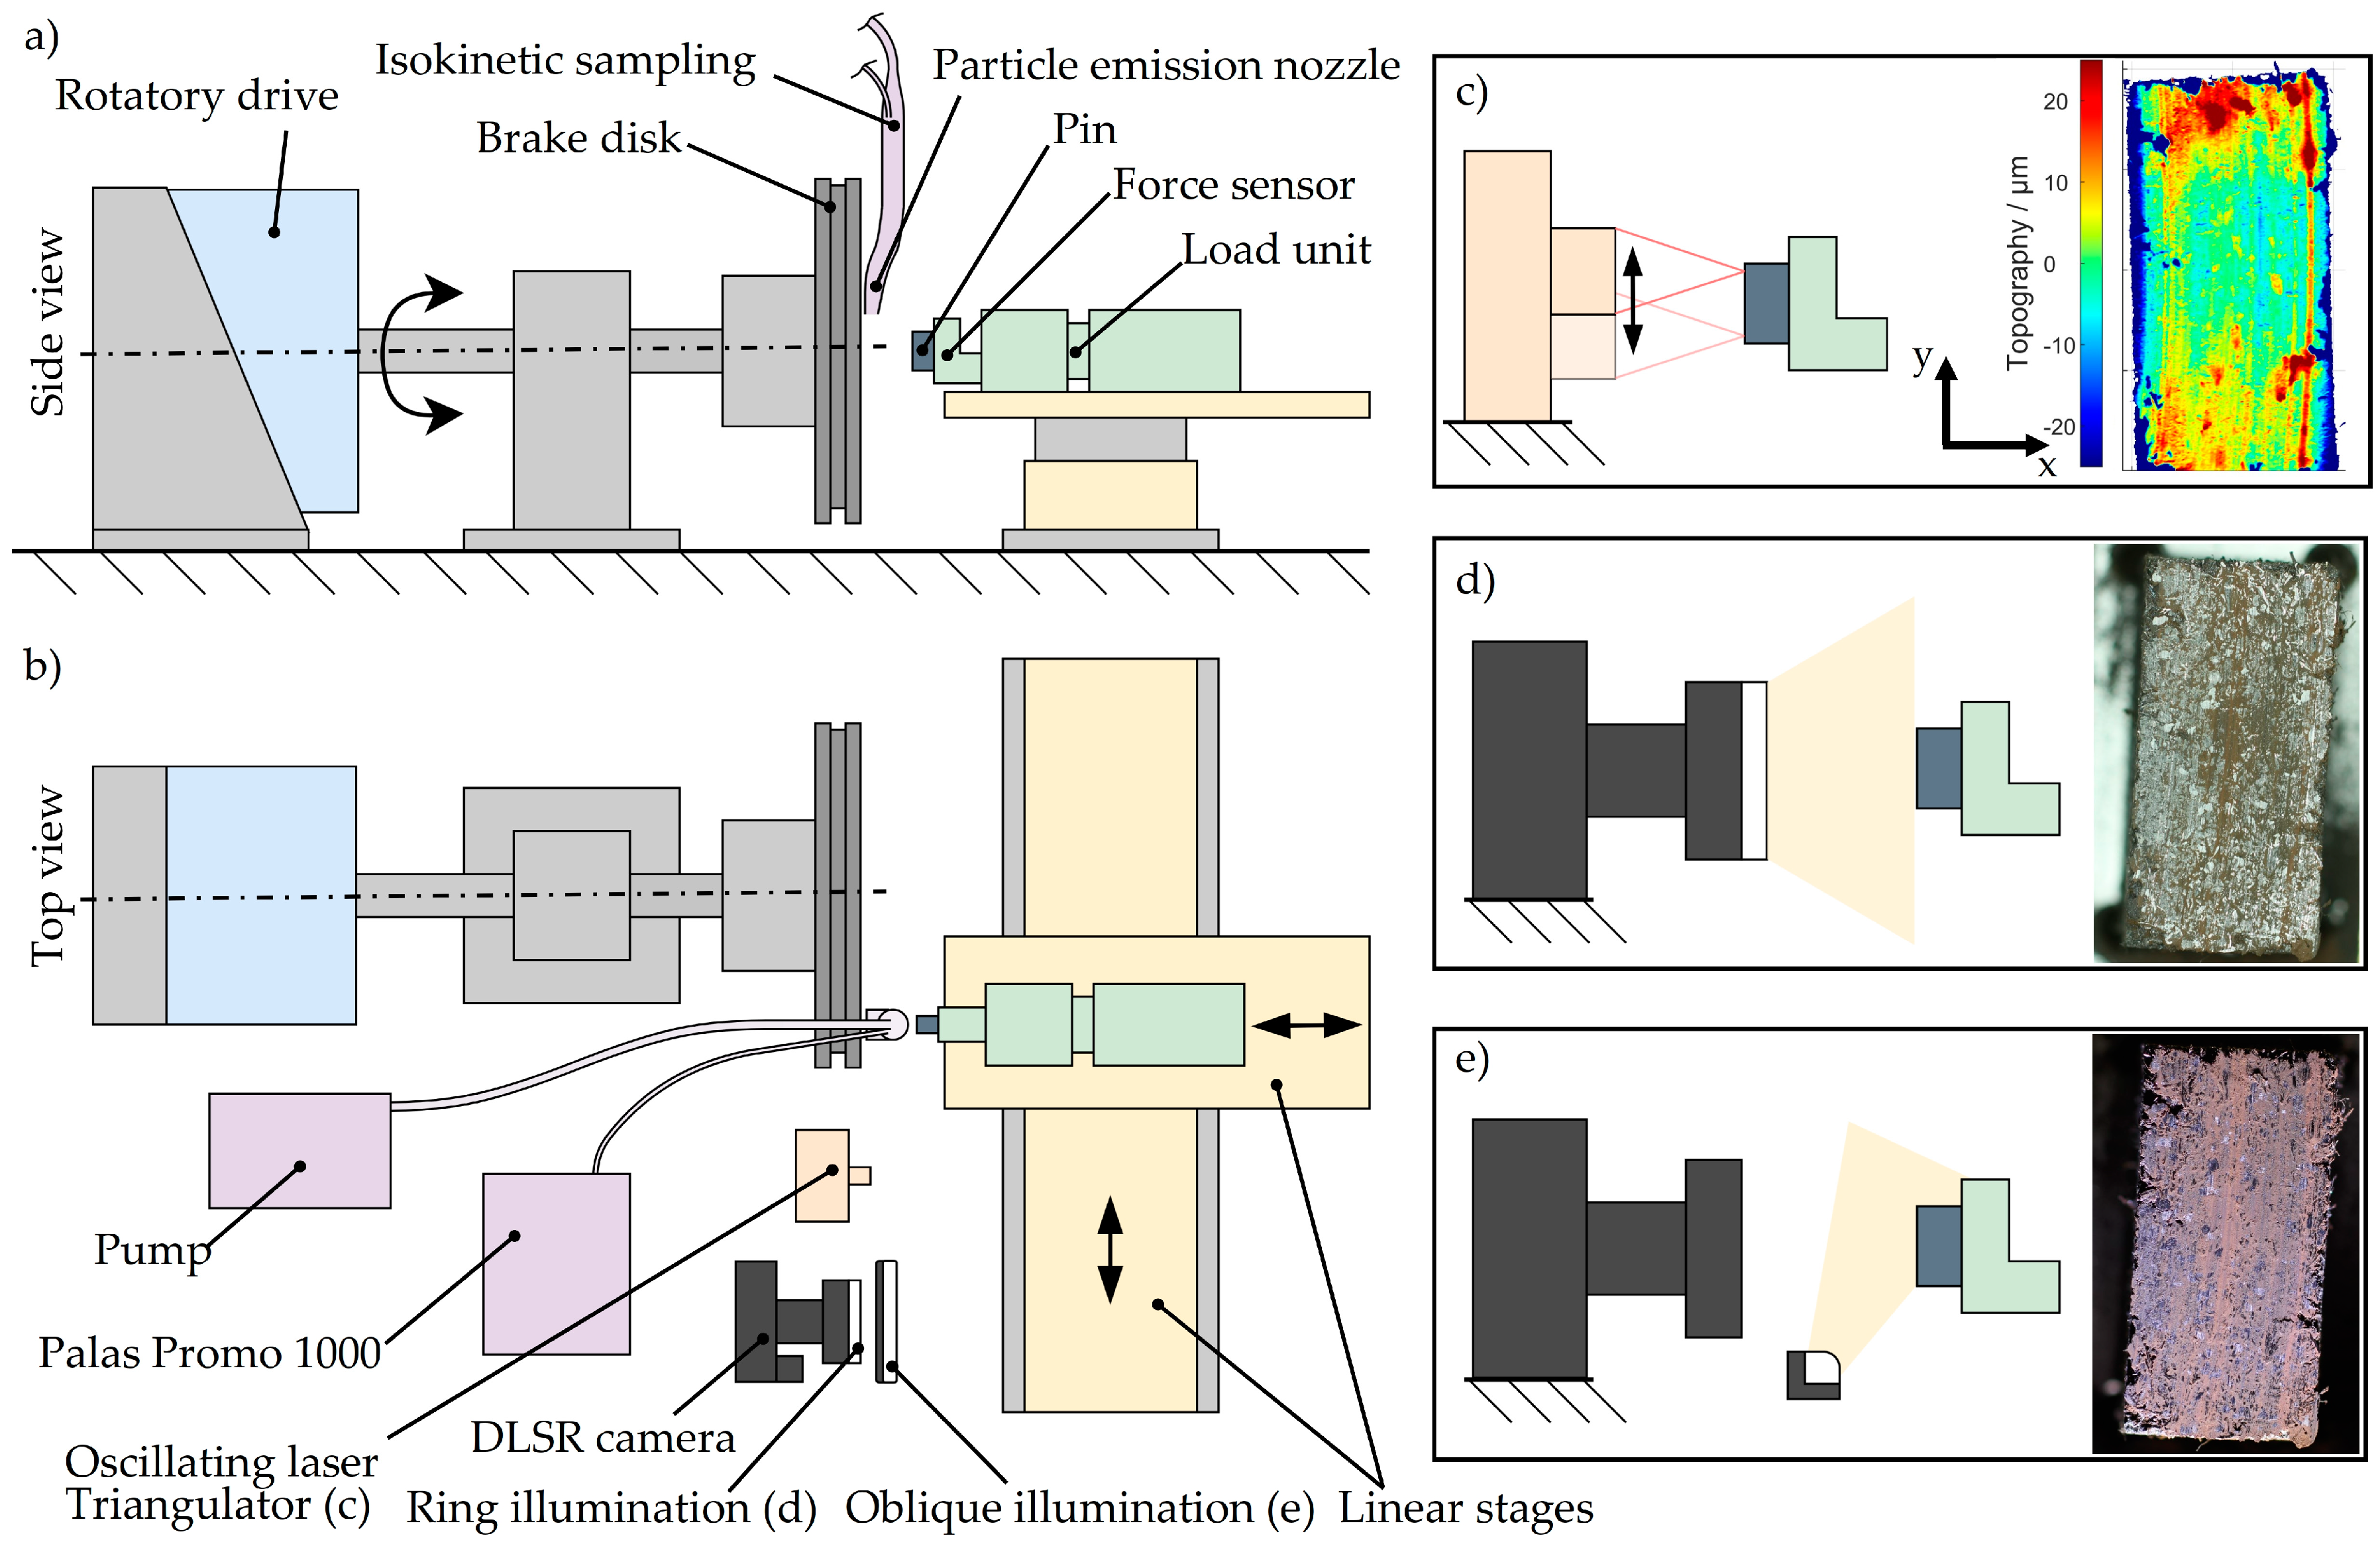
Figure 1. Experimental arrangement in (a) side view showing disk drive, pin translation unit and particle nozzle, and (b) top view with at−line surface characterization and particle measurement system. Data acquisition of optical system with example output of (c) oscillating of laser triangulator for topographic characterization, (d) camera with ring illumination, and (e) camera with oblique illumination.
Atmosphere 16 00563 g001
Figure 2. Test results from tribometer in terms of pin and disk temperatures and COF for (a) the GCI brake disk and (b) the HS-LC brake disk.
Atmosphere 16 00563 g002
Figure 3. Particle emission in the form of (a) PN for both disks, (b) number-based particle size distribution for the GCI brake disk, (c) volume-based particle size distribution for the GCI brake disk, (d) number-based particle size distribution for the HS-LC brake disk, and (e) volume-based particle size distribution for the HS-LC brake disk.
Atmosphere 16 00563 g003
Figure 4. (a) Archard wear of the pin, in terms of height loss with linear fitting function with slope k. (b) Height profile of the disk after additional testing after run 2. (c) Height profile of pin after block O of run 2. The gray dashed line represents effective friction radius.
Atmosphere 16 00563 g004
Figure 5. Image sequence of the pin used with the GCI brake disk from segment 2 in run 2. Images with oblique and ring illumination are displayed in the original color. The arrow represents the sliding direction, and its length represents a scale of 5 mm. Magnified images (af) show examples of the main features.
Atmosphere 16 00563 g005
Figure 6. Image sequence of the pin used with the HS-LC brake disk from segment 2 in run 2. Images with oblique and ring illumination are displayed in original color. The arrow represents sliding direction, and its length represents a scale of 5 mm. Magnified images (af) show examples of main features.
Atmosphere 16 00563 g006
Figure 7. Differences in oblique and ring light illumination on a pin surface. Debris is represented by the brown color, while the primary patch is light gray, and the matrix is the textured gray region. Numbers represents different light rays as addressed in the text.
Atmosphere 16 00563 g007
Figure 8. Segmentation algorithm starting with the three data sources: images with ring and oblique illumination, and topographic data. RGB images are converted into CIE L*a*b* color space. Filters are sequentially applied to generate binary masks that lead to final classes. Filters are named after the origin of data used, “R”, “O”, and “T” for ring, oblique and topographic data, respectively, combined with a genealogic numbering system for the position. Image filters are given in normalized color intensities. Topographic filters are derived from the material ratio curve from the complete disk dataset.
Atmosphere 16 00563 g008
Figure 9. Example results of segmentation algorithm applied for dataset after block F of run 2. Binary masks from classes are applied to the different data sources. Images with oblique and ring illumination are displayed in the original color. The arrow represents the sliding direction, and its length represents a scale of 2 mm.
Atmosphere 16 00563 g009
Figure 10. Averaged coverage ratios over pv from both runs for (a,b) image classes, (c,d) topographic classes, and (e,f) combination of image classes for the GCI and the HS-LC brake disks, respectively. Displayed trend lines were generated using a smoothing spline with a smoothing factor of 0.07. Error bars show standard deviation from both runs.
Atmosphere 16 00563 g010
Figure 11. Pearson’s correlation matrix for the cases using a (a) GCI brake disk and (b) HS-LC brake disk.
Atmosphere 16 00563 g011
Table 1. Testing conditions in pin-on-disk tribometer for both GCI and HS-LS brake disks.
SectionNominal Force
[N]
Nominal Pressure 1
[MPa]
Sliding Velocity 2
[m/s]
Duration
[s]
Number of Applications
[-]
Bedding3351.687.77 (GCI)/11.66 (HS-LC)10200
Segment 1 running-in1120.561.94350
Segment 1 (blocks A-E)1120.561.94, 3.98, 7.77, 11.66, 15.55330 per velocity
Segment 2 running-in2231.121.94350
Segment 2 (blocks F-J)2231.121.94, 3.98, 7.77, 11.66, 15.55330 per velocity
Segment 3 running-in3351.681.94350
Segment 3 (blocks K-O)3351.681.94, 3.98, 7.77, 11.66, 15.55330 per velocity
1 Represents hydraulic pressures of 10, 20 and 30 bar. 2 Represents vehicle speeds of 20, 40, 80, 120 and 160 km/h.
Table 2. Overview of the segmented classes. Colored rectangles represent examples in Figure 5 and Figure 6.
Topographic ClassesRing Light Classes 1Oblique Light ClassesObserved Color/FeaturesExample in Zoom-ImagesPossible Match to Theory
-White patches White patchesWhite, bright areasAtmosphere 16 00563 i001Primary patches
-Black patchesBlack areas that show white under ring lightAtmosphere 16 00563 i001Primary patches
-TribolayerBrown/light gray areas that show white under ring lightAtmosphere 16 00563 i001Secondary patches
-DebrisDebrisBrown areasAtmosphere 16 00563 i002Secondary patches
-HolesHolesBlack/dark grey areasAtmosphere 16 00563 i003Lowlands
Patches--Protruding from surfaceAtmosphere 16 00563 i004Primary and secondary patches
Holes--Cavities on the surfaceAtmosphere 16 00563 i003Lowlands
1 Encompass or equal classes from the oblique light. Therefore, they are not further considered in the following analysis.
Disclaimer/Publisher’s Note: The statements, opinions and data contained in all publications are solely those of the individual author(s) and contributor(s) and not of MDPI and/or the editor(s). MDPI and/or the editor(s) disclaim responsibility for any injury to people or property resulting from any ideas, methods, instructions or products referred to in the content.