

Climatic Conditions in the Central Part of the Kashmir Valley During the Pleistocene–Holocene Transition: Insights from Lithostratigraphy, Geochemical Analyses, and Radiocarbon Chronology of Palaeosol Sequences


Abstract
1. Introduction
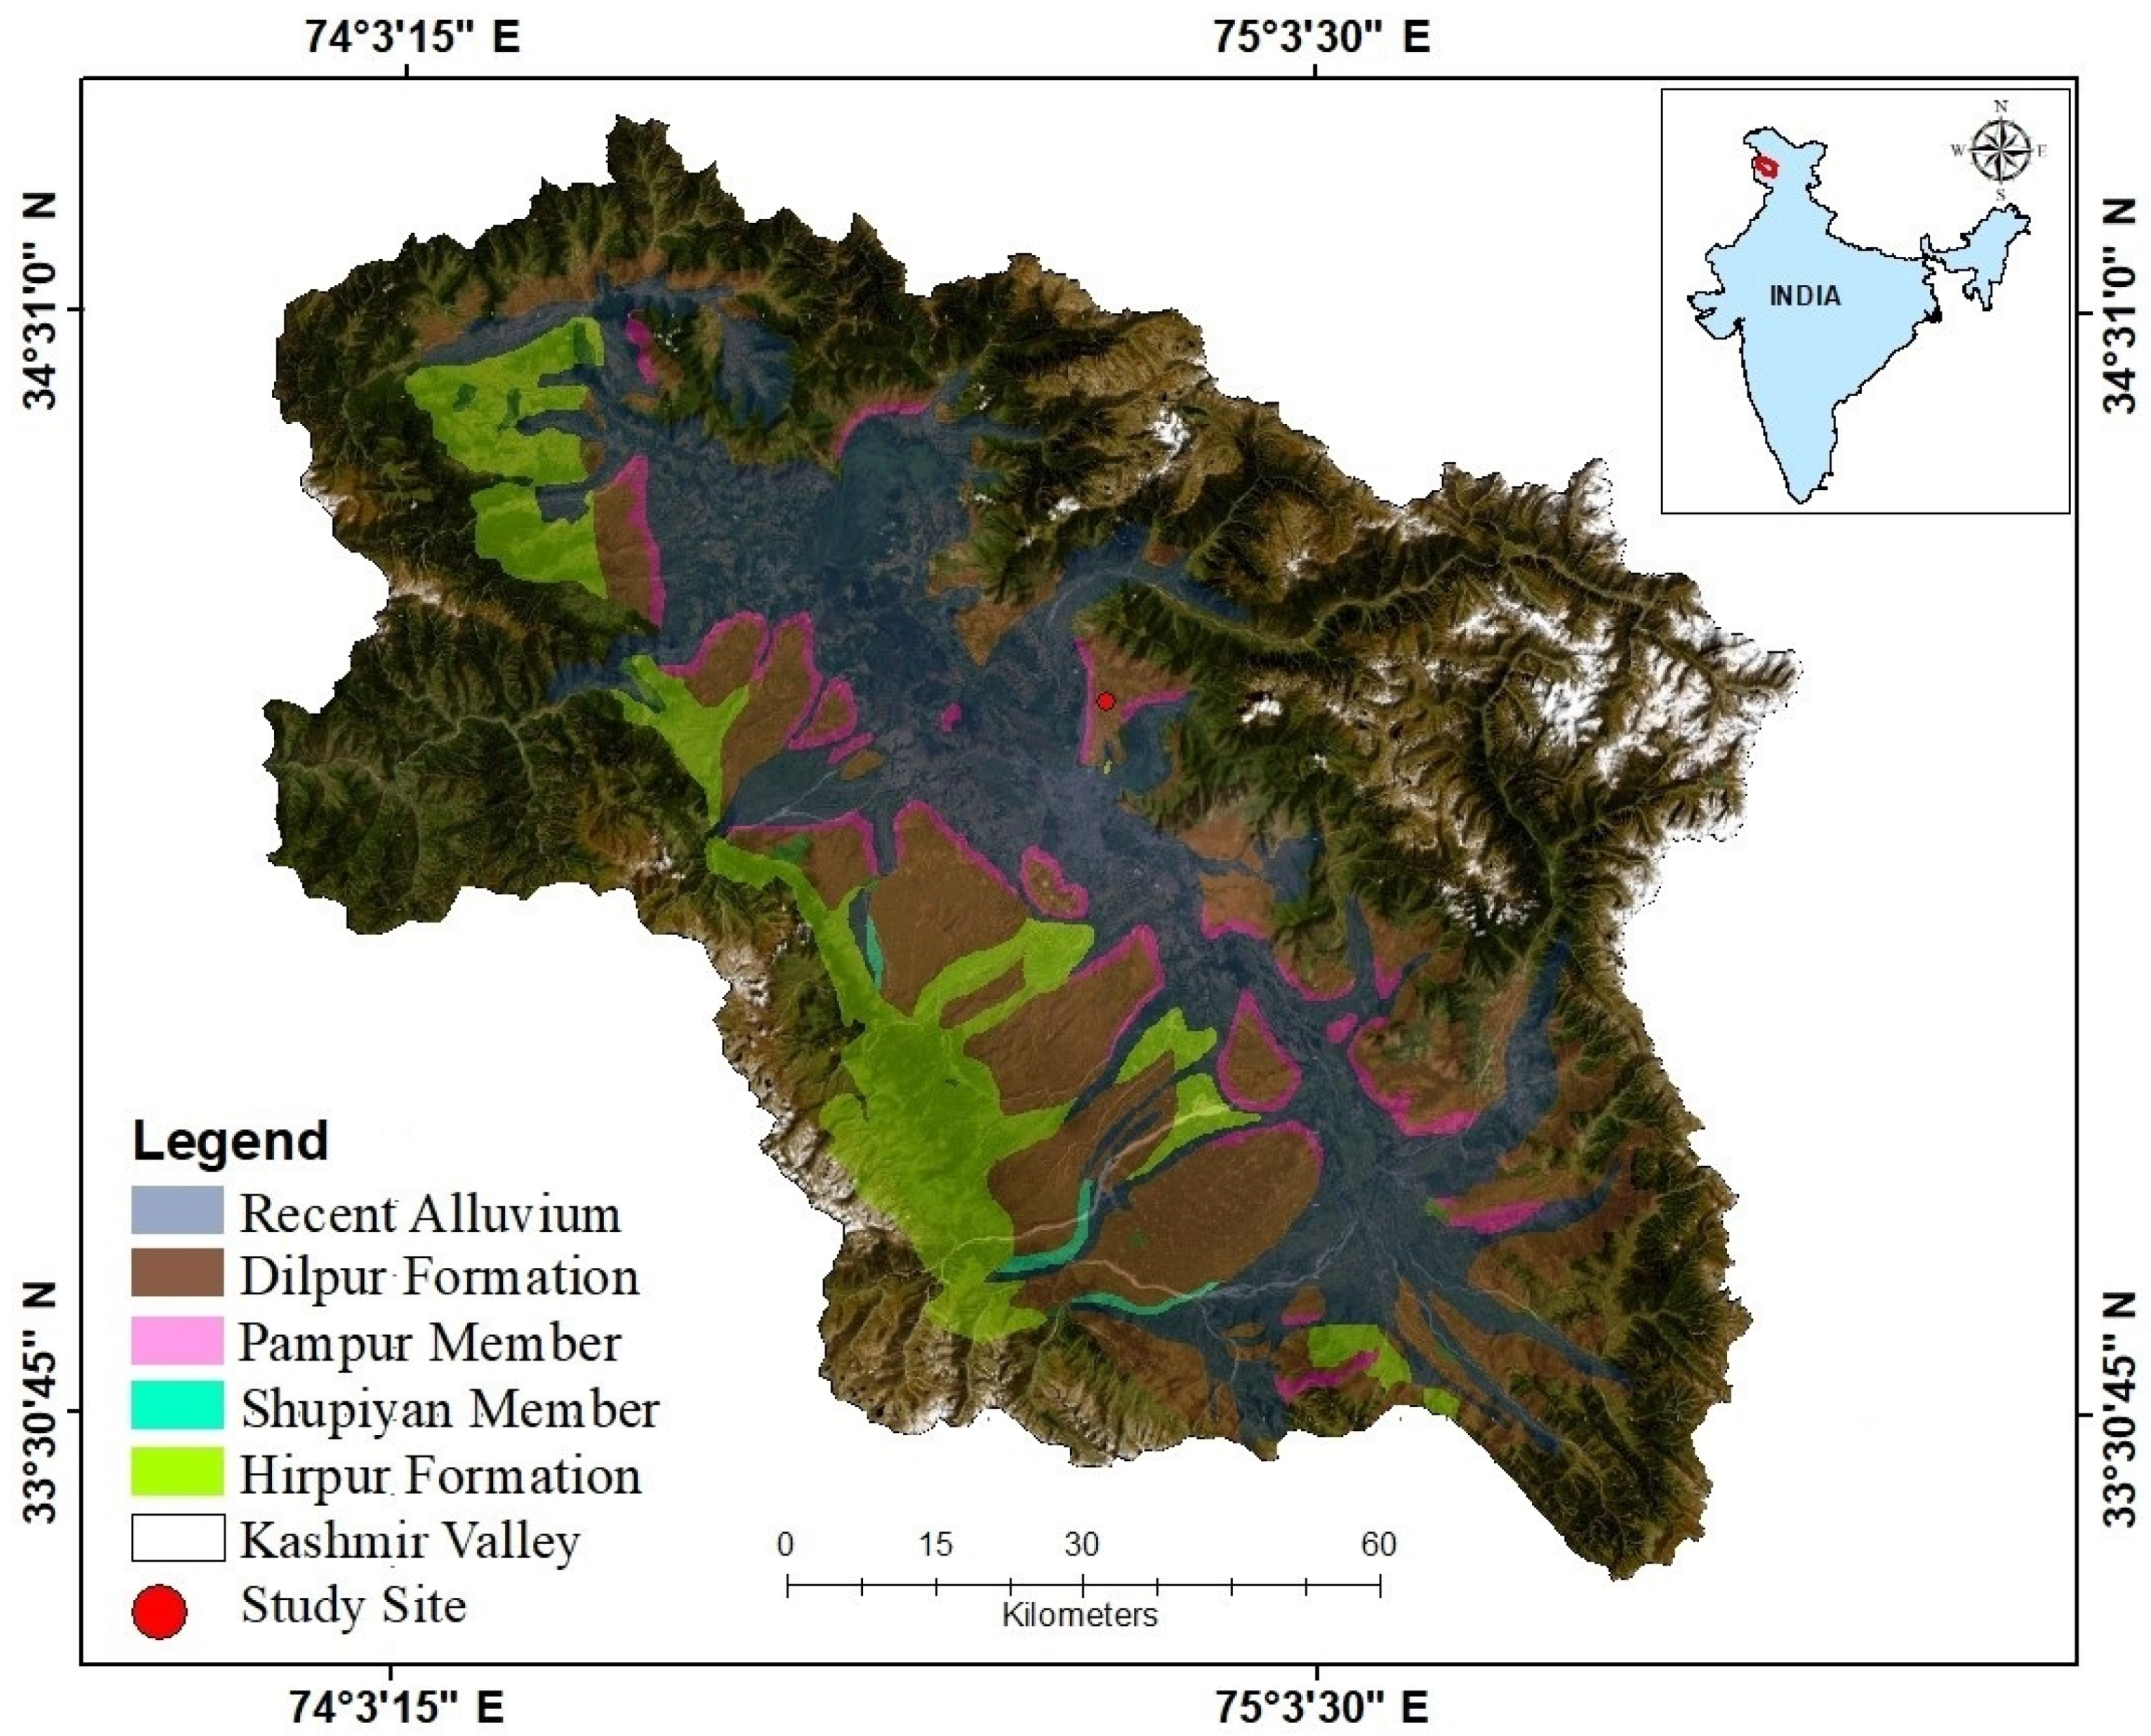
2. Study Area
3. Materials and Methods
3.1. Mapping and Sampling of the Palaeosol Section
3.2. Chronology: Accelerator Mass Spectrometry (AMS) Dating (14C)
3.3. Major Oxide Analysis
3.4. Total Organic Carbon (TOC), Nitrogen (N), CaCO3, and Stable Isotope (δ13C) Analysis
4. Results
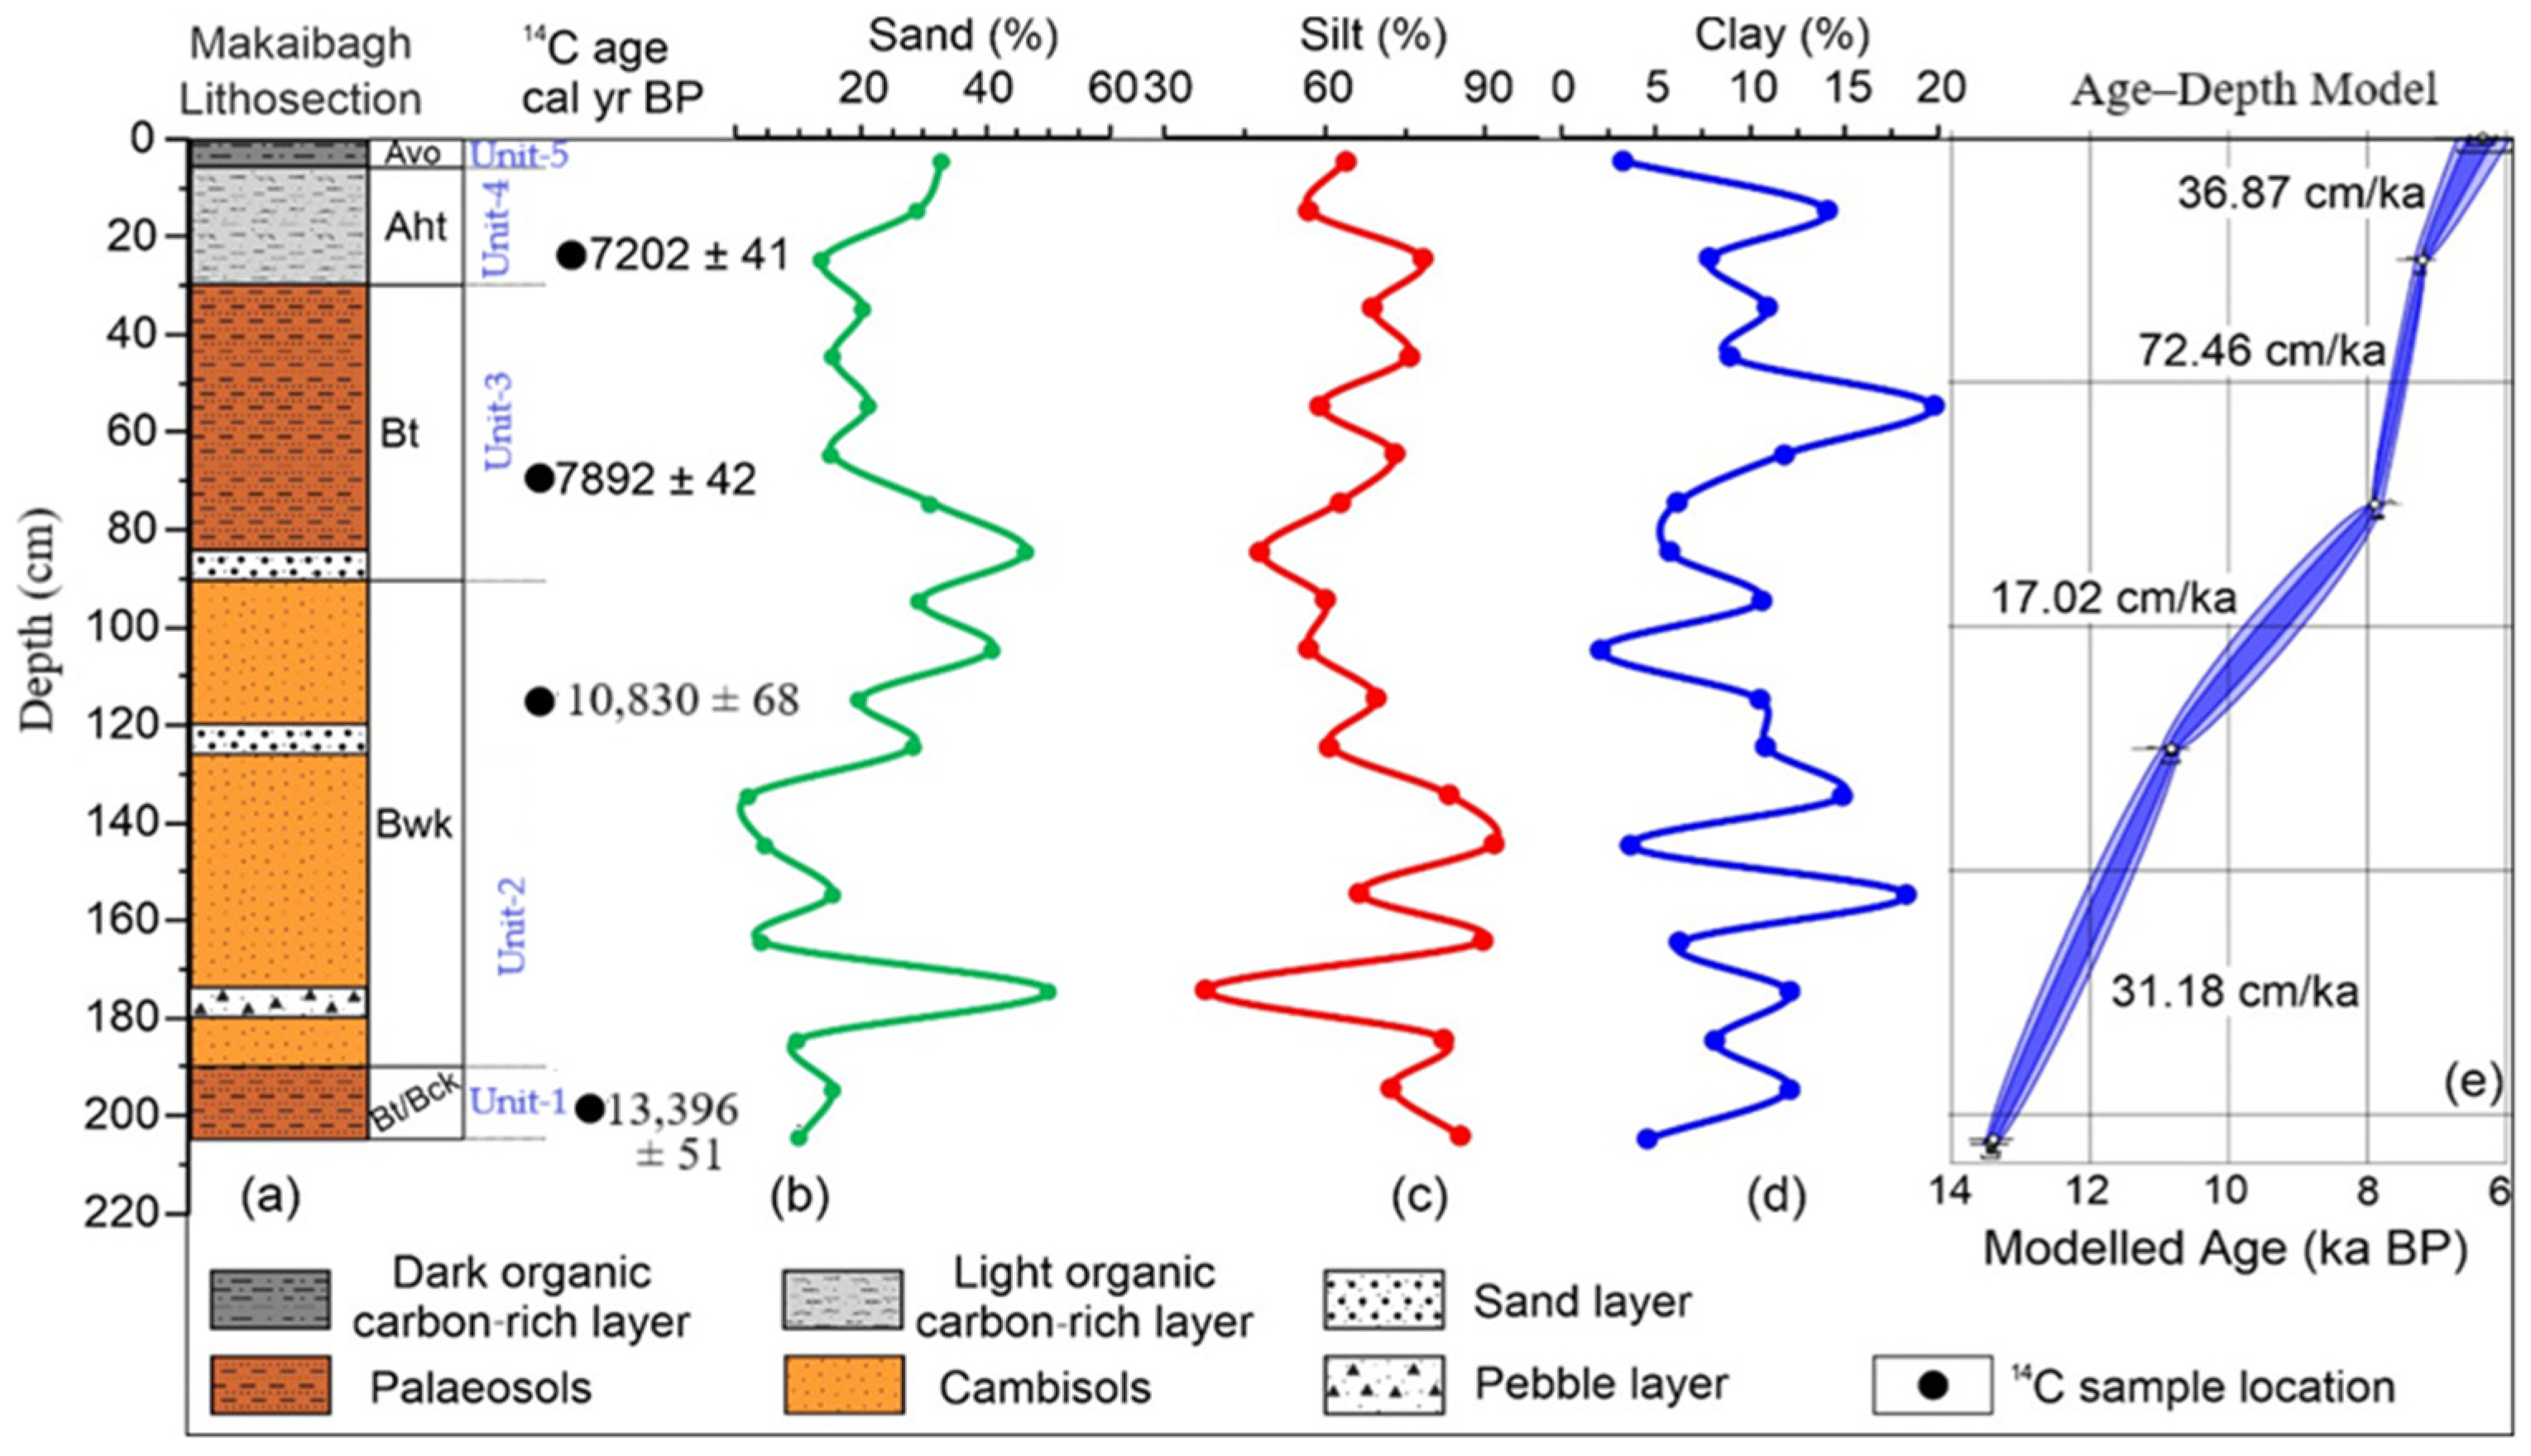
4.1. Sedimentological Features
4.2. Chronology and Sedimentation Rate
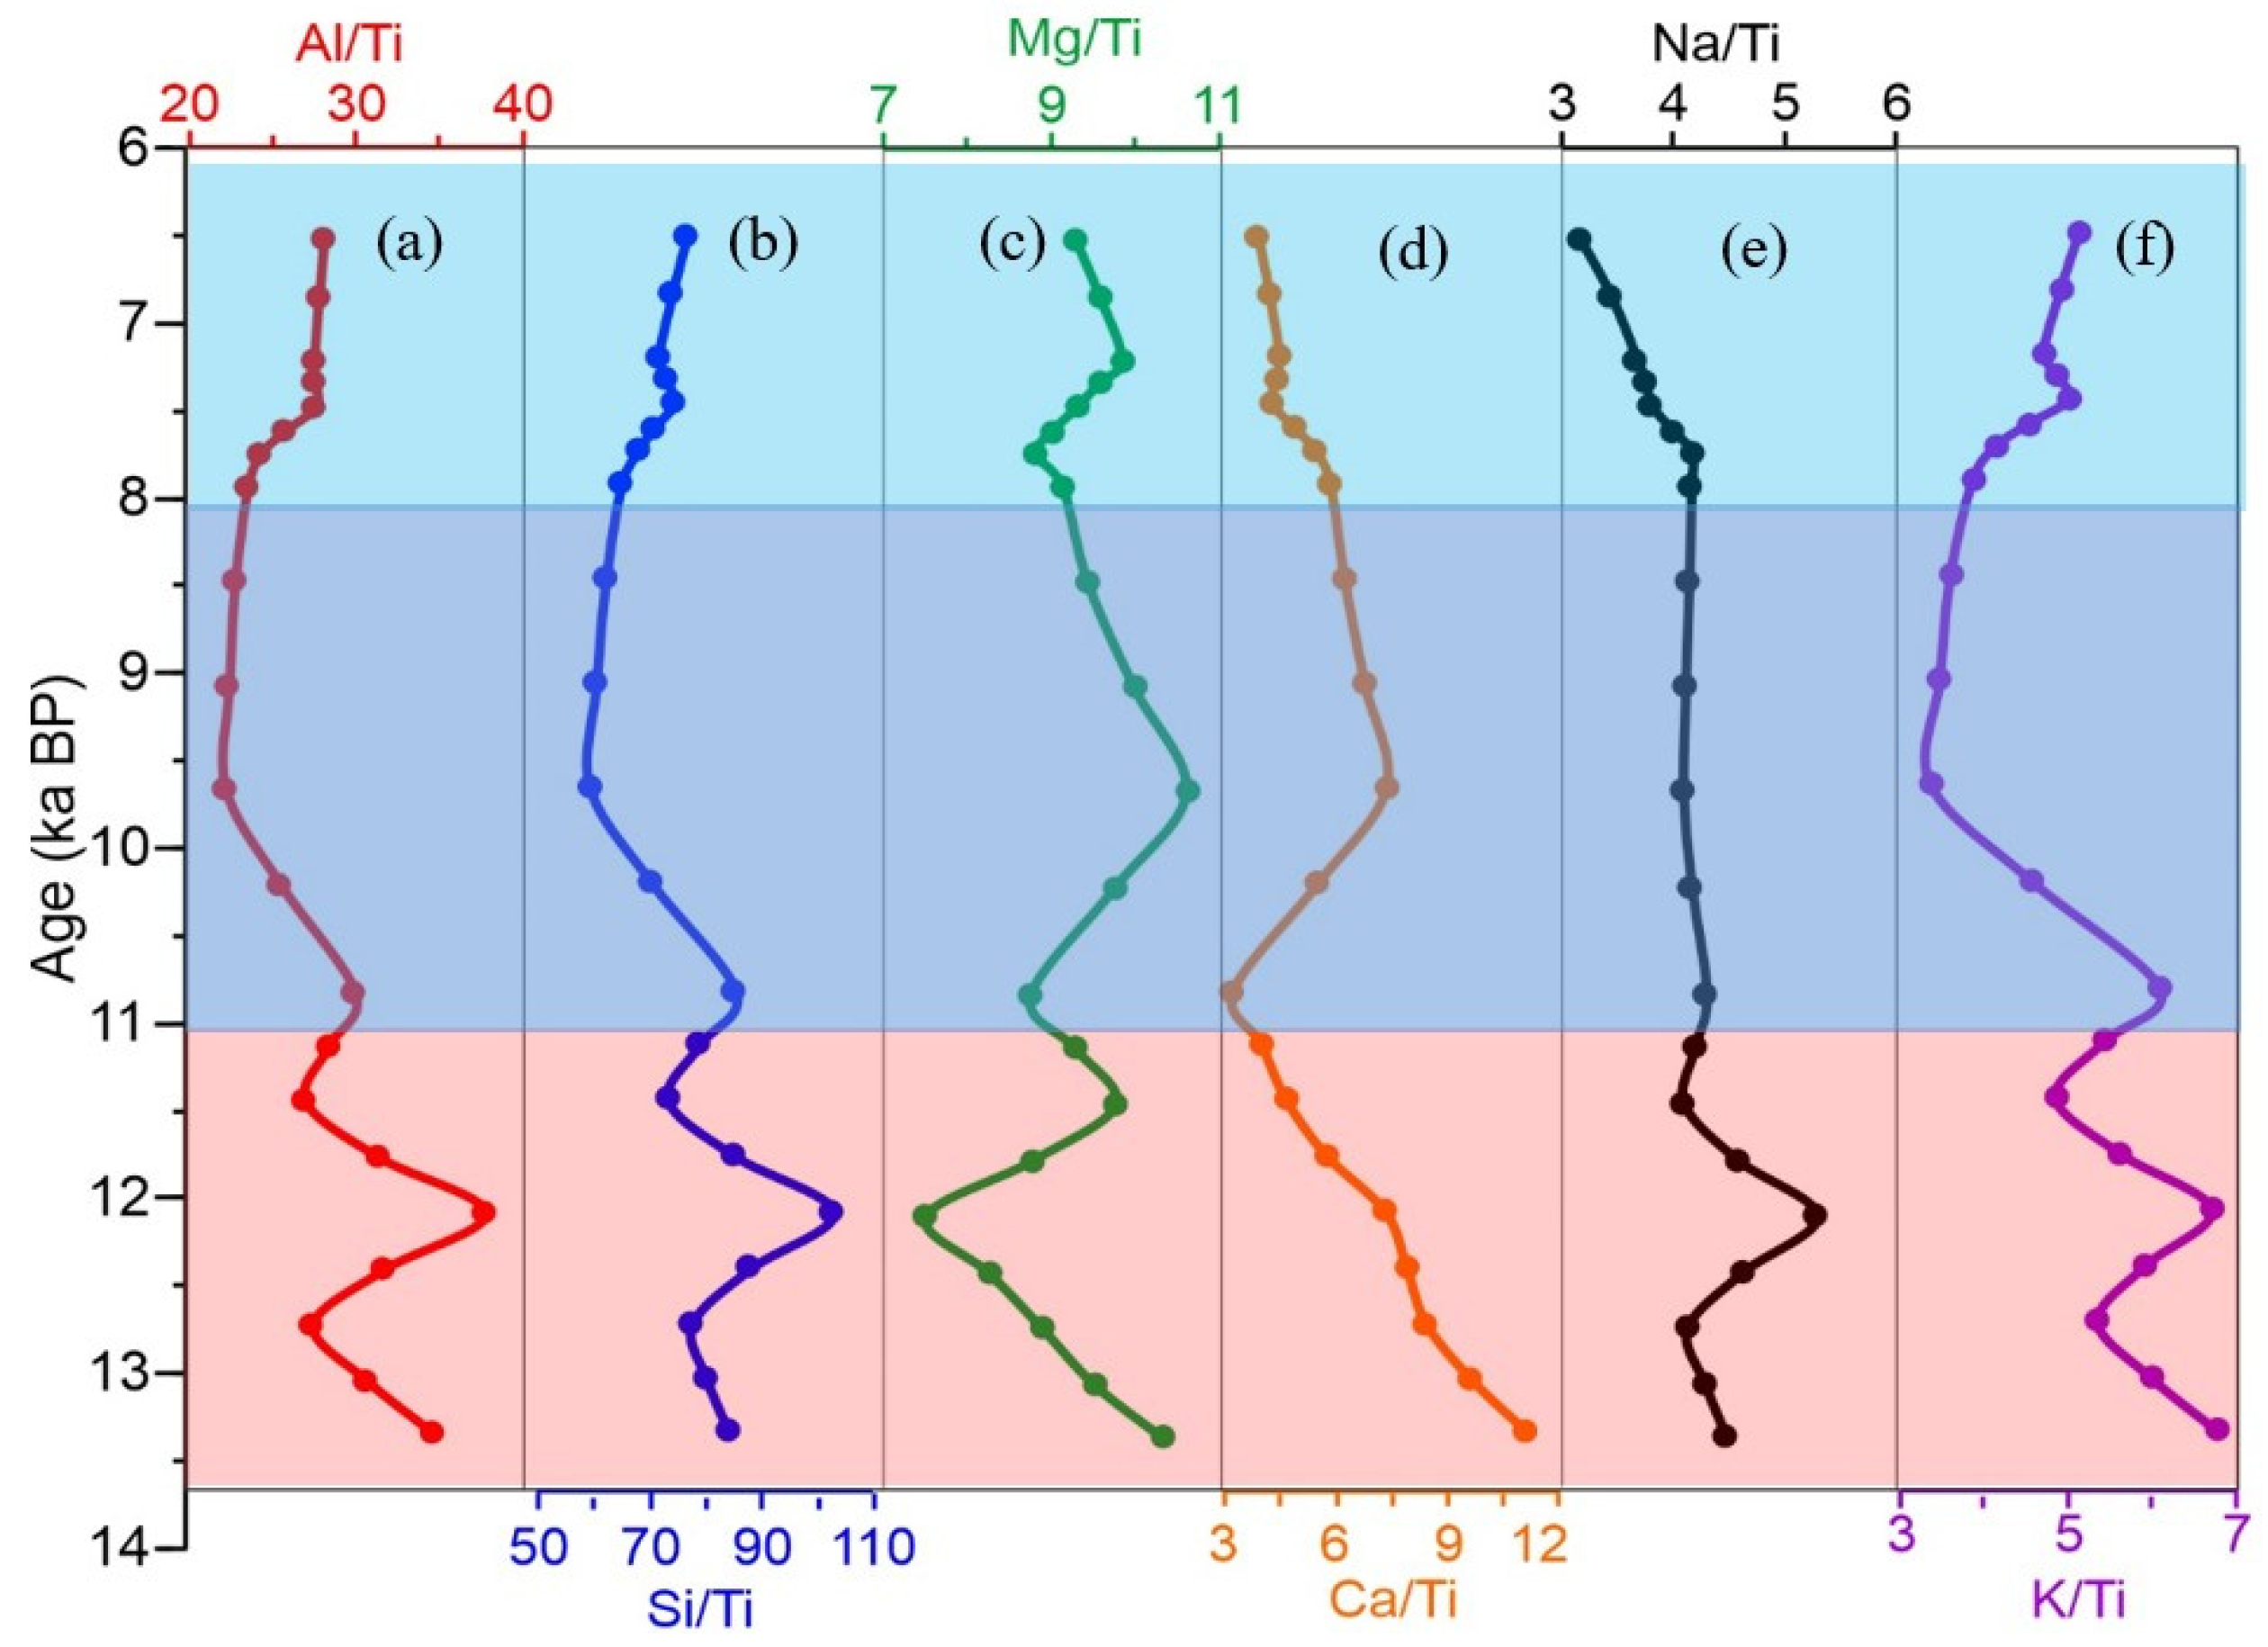
4.3. Bulk Geochemistry
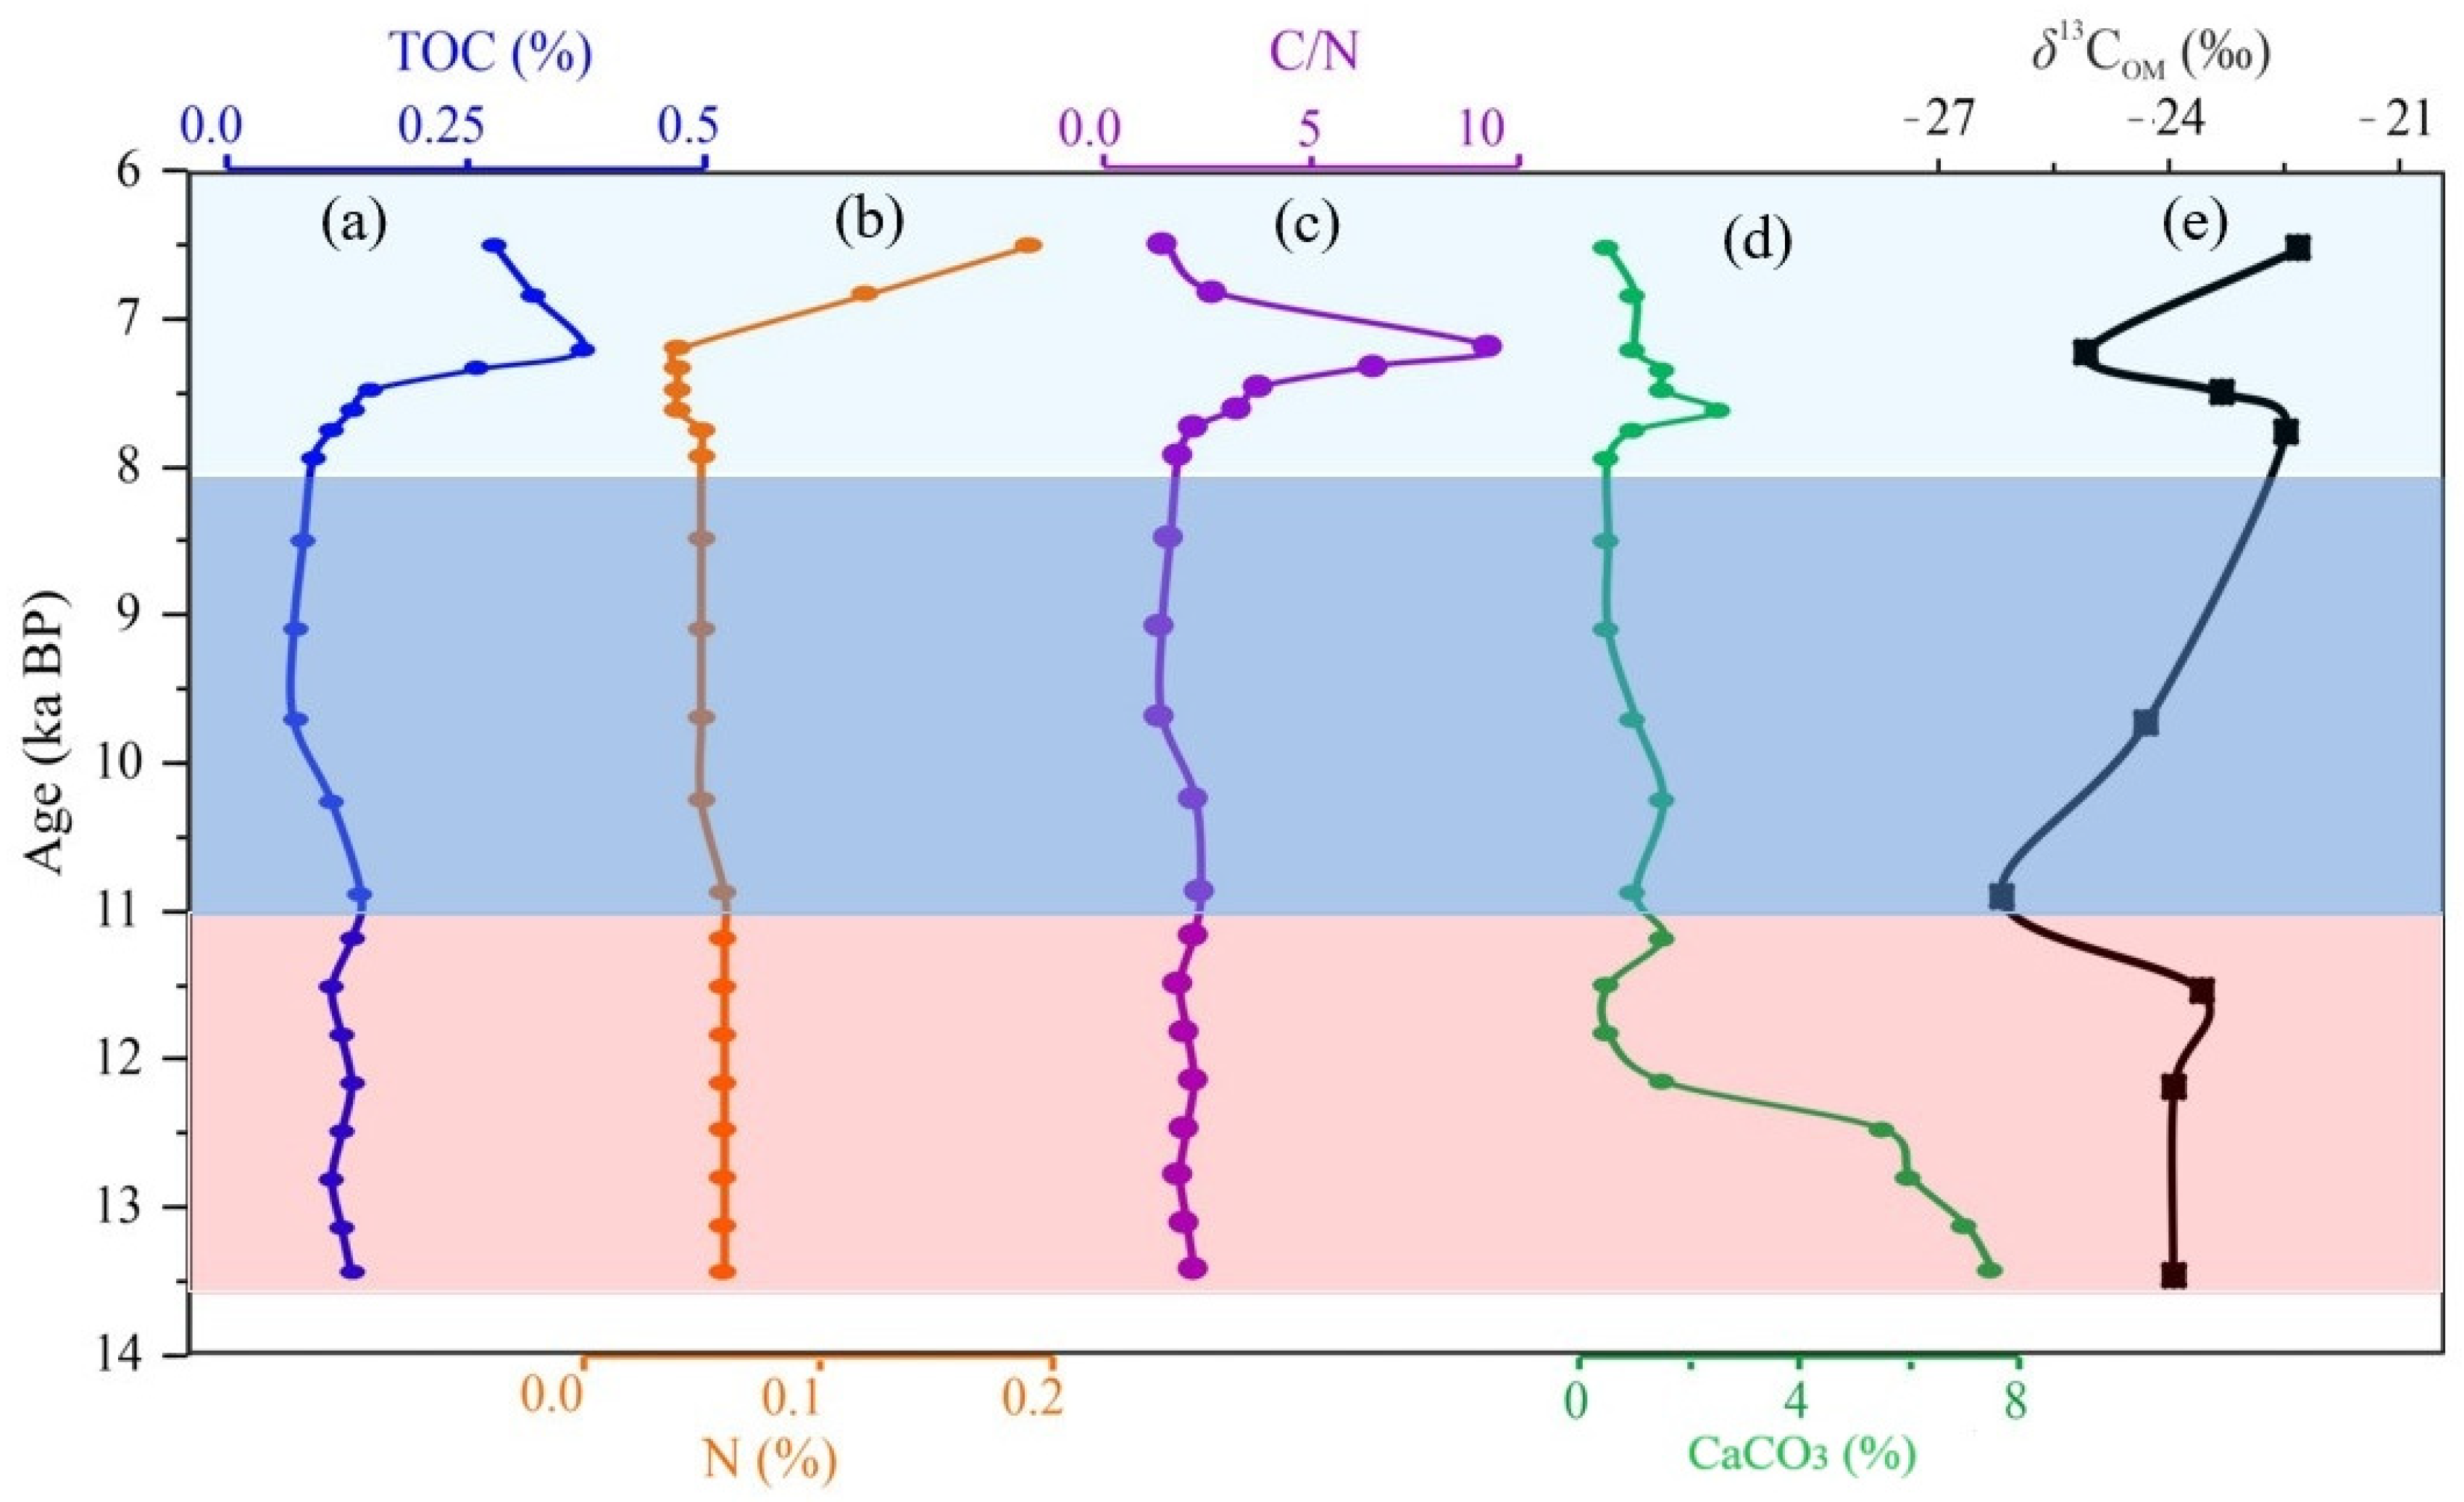
4.4. Bulk Organic Geochemistry (TOC, N) and CaCO3
4.5. Stable Carbon Isotope Composition (δ13C)
5. Discussion
5.1. Geochemical Characteristics and Palaeoweathering
5.2. Pleistocene and Holocene Transition
5.3. Palaeovegetation Patterns
6. Conclusions
Supplementary Materials
Author Contributions
Funding
Institutional Review Board Statement
Informed Consent Statement
Data Availability Statement
Acknowledgments
Conflicts of Interest
Abbreviations
| Al | Aluminium |
| AMS | Accelerator Mass Spectrometry |
| Al2O3 | Aluminum oxide |
| Ca | Calcium |
| CaO | Calcium oxide |
| CaCO3 | Calcium carbonate |
| CIA | Chemical Index of Alteration |
| CIW | Chemical Index of Weathering |
| DST | Department of Science and Technology |
| Fe2O3 | Iron oxide |
| HCl | Hydrochloric acid |
| ISM | Indian summer monsoon |
| IUAC | Inter-University Accelerator Centre |
| K | Potassium |
| ka | Kilo years |
| K2O | Potassium oxide |
| LPS | Loess–palaeosol sequences |
| M | Molar |
| MAG | Marine mud |
| MgO | Magnesium oxide |
| MIS | Marine Isotope Stage |
| MnO | Manganese oxide |
| N | Nitrogen |
| NaOH | Sodium hydroxide |
| Na2O | Sodium oxide |
| OSL | Optically stimulated luminescence |
| P2O5 | Phosphorus pentoxide |
| SDO | Standard Devonian Ohio Shale |
| Si | Silicon |
| SWM | Southwest monsoon |
| SiO2 | Silicon dioxide |
| Ti | Titanium |
| TOC | Total organic carbon |
| UGC | University Grants Commission |
| USGS | United States Geological Survey |
| VPDB | Vienna Pee Dee Belemnite |
| WD | Western disturbance |
| XRF | X-ray fluorescence |
| 14C | Carbon-14 |
| δ13C | Delta carbon-13 |
| σ | Sigma |
References
- Shah, R.A.; Achyuthan, H.; Lone, A.M.; Kumar, S.; Kumar, P.; Sharma, R.; Amir, M.; Singh, A.K.; Dash, C. Holocene palaeoenvironmental records from the high-altitude Wular Lake, Western Himalayas. Holocene 2020, 30, 733–743. [Google Scholar] [CrossRef]
- Shah, R.A.; Achyuthan, H.; Lone, A.M.; Jaiswal, M.K.; Paul, D. Constraining the timing and deposition pattern of loess-palaeosol sequences in Kashmir Valley, Western Himalaya: Implications to paleoenvironment studies. Aeolian Res. 2021, 49, 100660. [Google Scholar] [CrossRef]
- Adameková, K.; Petřík, J. The myth of ‘Bohunician soil’: A re-evaluation of the MIS 3 palaeosol record at the Brno-Bohunice site (Czechia). Catena 2022, 217, 106510. [Google Scholar] [CrossRef]
- Liu, B.; Zhao, H.; Li, S.H.; Jin, H.; Li, Y.; Wang, H.; Sun, A.; Xu, Y.; Wang, K. Asynchronous palaeosol development during the past 20 ka in response to climate change across the dune fields of the Asian summer monsoonal boundary, northern China. Eart. Sci. Rev. 2022, 234, 104232. [Google Scholar] [CrossRef]
- Tauseef, M.; Ray, E.; Paul, D.; Malik, J.N.; Ahmad, I. Mineralogical, geochemical, and magnetic susceptibility variations in the loess-palaeosol sequence from Pattan, Kashmir Valley, India record an enhanced Indian summer monsoon around 35 ka. Quat. Inter. 2022, 616, 55–66. [Google Scholar] [CrossRef]
- da Silva, M.L.; Batezelli, A.; Sergio Bernardes Ladeira, F. Palaeosols as stratigraphic proxies and palaeosurface markers in distributive fluvial systems. J. South Amer. Eart. Sci. 2023, 127, 104318. [Google Scholar] [CrossRef]
- Dar, R.A.; Zeeden, C. Loess-Palaeosol Sequences in the Kashmir valley, NW Himalayas: A Review. Front. Eart. Sci. 2020, 8, 113. [Google Scholar] [CrossRef]
- Delgado, L.; Batezelli, A.; Ladeira, F.S.B. Paleoenvironmental and paleoclimatic reconstruction of Lower to Upper Cretaceous sequences of the Bauru Basin based on palaeosol geochemistry and mineralogical analyses. Palaeogeo. Palaeoclim. Palaeoecol. 2021, 569, 110328. [Google Scholar] [CrossRef]
- Shah, R.A.; Dar, R.A.; Romshoo, S.A. Paleoclimatic reconstruction of the Karewa deposits of Kashmir Valley, northwest Himalaya: A review. Quat. Int. 2024, 688, 16–28. [Google Scholar] [CrossRef]
- Cohen, K.M.; Finney, S.C.; Gibbard, P.L.; Fan, J.X. The ICS International Chronostratigraphic Chart. Episodes 2013, 36, 199–204. [Google Scholar] [CrossRef]
- Pérez-Fernández, A.J.; Ligouis, B.; Alday, A. Reconstructing climate and soil formation processes in the Atxoste rock-shelter (Upper Ebro Valley, Northern Spain): A preliminary geoarchaeological view of human communities during the Pleistocene-Holocene transition in the Ebro Valley and Cantabrian Spa. J. Archaeol. Sci. Rep. 2020, 31, 102286. [Google Scholar] [CrossRef]
- Constantin, D.; Mason, J.A.; Veres, D.; Hambach, U.; Panaiotu, C.; Zeeden, C.; Zhou, L.; Marković, S.B.; Gerasimenko, N.; Avram, A.; et al. OSL-dating of the Pleistocene-Holocene climatic transition in loess from China, Europe and North America, and evidence for accretionary pedogenesis. Eart. Sci. Rev. 2021, 221, 103769. [Google Scholar] [CrossRef]
- Newman, K.; Hakim, B.; Oktaviana, A.A.; Burhan, B.; McGahan, D.; Brumm, A. The missing deposits of South Sulawesi: New sources of evidence for the Pleistocene/Holocene archaeological transition. Archaeol. Res. Asia 2022, 32, 100408. [Google Scholar] [CrossRef]
- Muhs, D.R. Soils and Palaeosols. In Encyclopedia of Geology, 2nd ed.; Alderton, D., Elias, S.A., Eds.; Academic Press: Oxford, UK, 2021; Volume 5, pp. 370–384. [Google Scholar] [CrossRef]
- Sheldon, N.D.; Tabor, N.J. Quantitative paleoenvironmental and paleoclimatic reconstruction using palaeosols. Eart. Sci. Rev. 2009, 95, 1–52. [Google Scholar] [CrossRef]
- Bhargava, O.N.; Kaur, G.; Deb, M. A Paleoproterozoic palaeosol horizon in the Lesser Himalaya and its regional implications. J. Asian Eart. Sci. 2011, 42, 1371–1380. [Google Scholar] [CrossRef]
- Mir, J.A.; Dar, R.A.; Vinnepand, M.; Laag, C.; Rolf, C.; Zeeden, C. Environmental reconstruction potentials of Loess-Palaeosol-Sequences in Kashmir through high-resolution proxy data. Palaeogeo. Palaeoclimatol. Palaeoecol. 2022, 601, 111100. [Google Scholar] [CrossRef]
- Qader, W.; Mir, S.H.; Meister, J.; Dar, R.A.; Madella, M.; Rashid, I. Sedimentological perspective on phytolith analysis in palaeoecological reconstruction. Eart. Sci. Rev. 2023, 244, 104549. [Google Scholar] [CrossRef]
- Pokhrel, S.; Chaudhari, H.S.; Saha, S.K.; Dhakate, A.; Yadav, R.K.; Salunke, K.; Mahapatra, S.; Rao, S.A. ENSO, IOD and Indian Summer Monsoon in NCEP climate forecast system. Clim. Dynam. 2012, 39, 2143–2165. [Google Scholar] [CrossRef]
- Polanski, S.; Fallah, B.; Befort, D.J.; Prasad, S.; Cubasch, U. Regional moisture change over India during the past Millennium: A comparison of multi-proxy reconstructions and climate model simulations. Glob. Planet. Change 2014, 122, 176–185. [Google Scholar] [CrossRef]
- Dimri, A.P.; Yasunari, T.; Kotlia, B.S.; Mohanty, U.C.; Sikka, D.R. Indian winter monsoon: Present and past. Eart. Sci. Rev. 2016, 163, 297–322. [Google Scholar] [CrossRef]
- Rahman, A.; Sarkar, S.; Kumar, S. Paleoenvironment of the Central Himalaya during late MIS 3 using stable isotopic compositions of lacustrine organic matter occluded in diatoms and sediments. Quat. Int. 2020, 558, 1–9. [Google Scholar] [CrossRef]
- Dar, R.A.; Chandra, R.; Romshoo, S.A.; Ahmad, S.M. Isotopic and micro morphological studies of Late Quaternary loess-palaeosol sequences of the Karewa Group: Inferences for palaeoclimate of Kashmir valley. Quat. Int. 2015, 371, 122–134. [Google Scholar] [CrossRef]
- Bronger, A.; Pant, R.K.; Singhvi, A. Pleistocene climatic changes and landscape evolution in the Kashmir basin, India, palaeopedological and chronostratigraphic studies. Quat. Res. 1987, 27, 167–181. [Google Scholar] [CrossRef]
- Agrawal, D.P.; Dodia, R.; Kotlia, B.S.; Razdan, H.; Sahni, A. The Plio-Pleistocene geologic and climate record of the Kashmir valley: A review and new data. Palaeogeo. Palaeoclim. Palaeoeco. 1989, 73, 267–286. [Google Scholar] [CrossRef]
- Gupta, S.K.; Sharma, P.; Juyal, N.; Agrawal, D.P. Loess-palaeosol sequence in Kashmir: Correlation of mineral magnetic stratigraphy with the marine palaeoclimatic record. J. Quat. Sci. 1991, 6, 3–12. [Google Scholar] [CrossRef]
- Thakur, V.C.; Rawat, B.S. Geological Map of the Western Himalaya; Authority of the Surveyor General of India, Printing Group of Survey of India, (HLO): Hyderabad, India, 1992.
- Dar, R.A.; Chandra, R.; Romshoo, S.A.; Kowser, N. Micromorphological investigations of the Late Quaternary loess–palaeosol sequences of the Kashmir valley, India. J. Asia. Eart. Sci. 2015, 111, 328–338. [Google Scholar] [CrossRef]
- Singh, I.B. Sedimentation Pattern in the Karewa Basin, Kashmir Valley, India, and its Geological significance. J. Paleontol. Soc. Ind. 1982, 27, 71–110. [Google Scholar] [CrossRef]
- Kusumgar, S.; Agrawal, D.P.; Krishnamurthy, R.V. Studies on the loess deposits of the Kashmir valley and 14C dating. Radiocarbon 1980, 22, 757–762. [Google Scholar] [CrossRef]
- Burbank, D.W.; Johnson, G.D. Intermontane-basin development in the past 4 Myr in the north-west Himalaya. Nature 1982, 298, 432–436. [Google Scholar] [CrossRef]
- Lone, A.M.; Achyuthan, H.; Chakraborty, S.; Metya, A.; Datye, A.; Kripalani, R.H.; Fousiya, A.A. Controls on the isotopic composition of daily precipitation characterized by dual moisture transport pathways at the monsoonal margin region of North-Western India. J. Hydrol. 2020, 588, 125106. [Google Scholar] [CrossRef]
- Zaz, S.N.; Romshoo, S.A.; Krishnamoorthy, R.T.; Viswanadhapalli, Y. Analyses of temperature and precipitation in the Indian Jammu and Kashmir region for 1980–2016 periods: Implications for remote influence and extreme events. Atmos. Chem. Phy. 2019, 19, 15–37. [Google Scholar] [CrossRef]
- Galy, V.; François, L.; France-Lanord, C.; Faure, P.; Kudrass, H.; Palhol, F.; Singh, S.K. C4 plants decline in the Himalayan basin since the Last Glacial Maximum. Quat. Sci. Rev. 2008, 27, 1396–1409. [Google Scholar] [CrossRef]
- Krumbein, W.C.; Pettijohn, F.J. Manual of Sedimentary Petrography; Appleton Century-Crofts, Inc.: New York, NY, USA, 1938; pp. 230–233. [Google Scholar]
- Kumar, P.; Saikia, L.; Meenakshi; Khandelwal, D.; Kumar, P.V.; Sharma, R.; Ojha, S.; Gargari, S.; Mukherjee, P.K.; Chopra, S. Statistical assessment of long-term performance for AMS measurements at IUAC, New Delhi. Nucl. Instr. Meth. 2022, 529, 29–37. [Google Scholar] [CrossRef]
- Reimer, P.J.; Austin, W.E.N.; Bard, E.; Bayliss, A.; Blackwell, P.G.; Bronk Ramsey, C.; Butzin, M.; Cheng, H.; Edwards, R.L.; Friedrich, M.; et al. The IntCal20 Northern Hemisphere radiocarbon age calibration curve (0–55 CAL kBP). Radiocarbon 2020, 62, 725–757. [Google Scholar] [CrossRef]
- Ramsey, C.B. Methods for Summarizing Radiocarbon Datasets. Radiocarbon 2017, 59, 1809–1833. [Google Scholar] [CrossRef]
- Nesbitt, H.W.; Young, G.M. Prediction of some weathering trends of plutonic and volcanic rocks based on thermodynamic and kinetic considerations. Geochim. Cosmochim. Acta 1984, 48, 1523–1534. [Google Scholar] [CrossRef]
- Harnois, L. The CIW index: A new chemical index of weathering Sediment. Geology 1988, 55, 319–322. [Google Scholar] [CrossRef]
- McLennan, S.M. Weathering and global denudation. J. Geol. 1993, 101, 295–303. [Google Scholar] [CrossRef]
- Loring, D.H.; Rantala, R.T.T. Manual for the geochemical analyses of marine sediments and suspended particulate matter. Eart. Sci. Rev. 1992, 32, 235–283. [Google Scholar] [CrossRef]
- Paul, D.; Skrzypek, G.; Forizs, I. Normalization of measured stable isotopic compositions to isotope reference scales—A review. Rapid Com. Mass Spec. 2007, 21, 3006–3014. [Google Scholar] [CrossRef]
- Muhs, D.R. Loess and its geomorphic, stratigraphic, and paleoclimatic significance in the Quaternary. Treatise Geomorp. 2013, 11, 149–183. [Google Scholar] [CrossRef]
- Shah, R.A.; Achyuthan, H.; Sangode, S.J.; Lone, A.M.; Rafiq, M. Mineral Magnetic and Geochemical Mapping of the Wular Lake Sediments, Kashmir Valley, NW Himalaya. Aquat. Geochem. 2020, 26, 31–52. [Google Scholar] [CrossRef]
- Cerling, T.E. The stable isotopic composition of modern soil carbonate and its relationship to climate. Earth Planet. Sci. Lett. 1989, 71, 229–240. [Google Scholar] [CrossRef]
- Ahmad, I.; Chandra, R. Geochemistry of loess-palaeosol sediments of Kashmir Valley, India: Provenance and weathering. J. Asian Earth Sci. 2013, 66, 73–89. [Google Scholar] [CrossRef]
- Rudnick, R.L.; Gao, S. Composition of the continental crust. In Treatise on Geochemistry; Holland, H.D., Turekian, K.K., Eds.; Newnes: London, UK, 2014; pp. 1–64. [Google Scholar] [CrossRef]
- Ray, E.; Paul, D. Major and trace element characteristics of the Average Indian post-Archean Shale: Implications for provenance, weathering, and depositional environment. ACS Eart. Space Chem. 2021, 5, 1114–1129. [Google Scholar] [CrossRef]
- Khan, I.; Amir, M.; Paul, D.; Srivastava, P. Late Holocene aridification recorded in the stable carbon and nitrogen isotope composition of soils from Nainital, Lesser Himalaya. Quat. Int. 2018, 467, 195–203. [Google Scholar] [CrossRef]
- Cerling, T.E.; Quade, J. Stable Carbon and Oxygen Isotopes in Soil Carbonates. In Climate Change in Continental Isotopic Records; Swart, P.K., Lohmann, K.C., Mckenzie, J., Savin, S., Eds.; American Geophysical Union: Washington, DC, USA, 1993. [Google Scholar] [CrossRef]
- Krishnamurthy, R.V.; DeNiro, M.J.; Pant, R.K. Isotope evidence for Pleistocene climatic changes in Kashmir, India. Nature 1982, 298, 640–641. [Google Scholar] [CrossRef]
- Krishnamurthy, R.V.; Bhattacharya, S.K.; Kusumgar, S. Palaeoclimatic changes deduced from 13C/12C and C/N ratios of the Karewa lake sediments, India. Nature 1986, 23, 150–152. [Google Scholar] [CrossRef]
- Sage, R.F.; Wedin, D.A.; Li, M. The Biogeography of C4 Photosynthesis: Patterns and Controlling Factors. C4 Plant Biol. 1999, 10, 313–373. [Google Scholar] [CrossRef]


| Depth (cm) | Thickness (cm) | Age (ka) | Horizon | Description |
|---|---|---|---|---|
| 1–5 | 5 | <6.5 | Avo | Dark brown (10YR 2/2, 4/2), organic carbon-rich silt with root traces and pores, with high moisture content. |
| 6–30 | 25 | 12–6.5 | Aht | Dark brown (10YR 3/2, 3/1) with higher organic carbon content, with visible root channel filled with fine silt. Well-developed ped with a gradational contact with the lower horizon. |
| 31–90 | 60 | Bt | Dull brown (7.5YR 5/3, 5/4), moderately developed palaeosol with bedded sand layers, low CaCO3 content and containing a significant amount of sand content. This horizon developed during MIS-1. | |
| 91–190 | 100 | Bwk | Light grey (7.5YR 8/1), weakly altered sediments with high CaCO3 and pedogenic nodules, N2 nodules and bedded sand horizons. A pebble/gravel bed (3–4 cm thick) is deposited at the base of this unit. A sharp contact with the lower horizon. | |
| 191–205 | 15 | 13.4–12 | Bt/Bck | Greyish-brown or grey (7.5YR 8/2), weakly developed palaeosol with very high CaCO3 content |
| Lab ID | Depth (cm) | Libby Age (Years BP) | Calibrated Age (Years BP) | (µ) Calibrated (Years BP) | |
|---|---|---|---|---|---|
| from | to | ||||
| 17C1149 | 25 | 6422 ± 41 | 7307 | 7164 | 7202 ± 41 |
| 17C1150 | 75 | 6849 ± 41 | 7933 | 7771 | 7892 ± 42 |
| 17C1151 | 125 | 9639 ± 53 | 10,960 | 10,708 | 10,830 ± 68 |
| 17C1153 | 205 | 11,521 ± 48 | 13,488 | 13,308 | 13,396 ± 51 |
| Sample ID | Depth (cm) | Age (ka) | TOC (%) | C (%) | N (%) | C/N | CaCO3 (%) | δ13C (VPDB, ‰) |
|---|---|---|---|---|---|---|---|---|
| MAK-1 | 5 | 6.5 | 0.28 | 0.28 | 0.19 | 1.47 | 0.50 | −22.47 |
| MAK-2 | 15 | 6.8 | 0.32 | 0.32 | 0.12 | 2.67 | 1.00 | |
| MAK-3 | 25 | 7.2 | 0.37 | 0.37 | 0.04 | 9.25 | 1.00 | −25.13 |
| MAK-4 | 35 | 7.3 | 0.26 | 0.26 | 0.04 | 6.50 | 1.50 | |
| MAK-5 | 45 | 7.5 | 0.15 | 0.15 | 0.04 | 3.75 | 1.50 | −23.42 |
| MAK-6 | 55 | 7.6 | 0.13 | 0.13 | 0.04 | 3.25 | 2.50 | |
| MAK-7 | 65 | 7.8 | 0.11 | 0.11 | 0.05 | 2.20 | 1.00 | −22.63 |
| MAK-8 | 75 | 7.9 | 0.09 | 0.09 | 0.05 | 1.80 | 0.50 | |
| MAK-9 | 85 | 8.5 | 0.08 | 0.08 | 0.05 | 1.60 | 0.50 | |
| MAK-10 | 95 | 9.1 | 0.07 | 0.07 | 0.05 | 1.40 | 0.50 | |
| MAK-11 | 105 | 9.7 | 0.07 | 0.07 | 0.05 | 1.40 | 1.00 | −24.38 |
| MAK-12 | 115 | 10.2 | 0.11 | 0.11 | 0.05 | 2.20 | 1.50 | |
| MAK-13 | 125 | 10.8 | 0.14 | 0.14 | 0.06 | 2.33 | 1.00 | −26.19 |
| MAK-14 | 135 | 11.2 | 0.13 | 0.13 | 0.06 | 2.17 | 1.50 | |
| MAK-15 | 145 | 11.5 | 0.11 | 0.11 | 0.06 | 1.83 | 0.50 | −23.69 |
| MAK-16 | 155 | 11.8 | 0.12 | 0.12 | 0.06 | 2.00 | 0.50 | |
| MAK-17 | 165 | 12.1 | 0.13 | 0.13 | 0.06 | 2.17 | 1.50 | −24.03 |
| MAK-18 | 175 | 12.4 | 0.12 | 0.12 | 0.06 | 2.00 | 5.50 | |
| MAK-19 | 185 | 12.8 | 0.11 | 0.11 | 0.06 | 1.83 | 6.00 | |
| MAK-20 | 195 | 13.1 | 0.12 | 0.12 | 0.06 | 2.00 | 7.00 | |
| MAK-21 | 205 | 13.4 | 0.13 | 0.13 | 0.06 | 2.17 | 7.50 | −24.04 |
| Minimum | 0.07 | 0.07 | 0.04 | 1.40 | 0.50 | −26.19 | ||
| Maximum | 0.37 | 0.37 | 0.19 | 9.25 | 7.50 | −22.47 | ||
| Mean | 0.15 | 0.15 | 0.06 | 2.67 | 2.10 | −24.00 | ||
| SD | 0.08 | 0.08 | 0.03 | 1.83 | 2.22 | 1.10 |
Disclaimer/Publisher’s Note: The statements, opinions and data contained in all publications are solely those of the individual author(s) and contributor(s) and not of MDPI and/or the editor(s). MDPI and/or the editor(s) disclaim responsibility for any injury to people or property resulting from any ideas, methods, instructions or products referred to in the content. |
© 2025 by the authors. Licensee MDPI, Basel, Switzerland. This article is an open access article distributed under the terms and conditions of the Creative Commons Attribution (CC BY) license (https://creativecommons.org/licenses/by/4.0/).
Share and Cite
Shah, R.A.; Romshoo, S.A.; Khan, I.; Kumar, P. Climatic Conditions in the Central Part of the Kashmir Valley During the Pleistocene–Holocene Transition: Insights from Lithostratigraphy, Geochemical Analyses, and Radiocarbon Chronology of Palaeosol Sequences. Atmosphere 2025, 16, 564. https://doi.org/10.3390/atmos16050564
Shah RA, Romshoo SA, Khan I, Kumar P. Climatic Conditions in the Central Part of the Kashmir Valley During the Pleistocene–Holocene Transition: Insights from Lithostratigraphy, Geochemical Analyses, and Radiocarbon Chronology of Palaeosol Sequences. Atmosphere. 2025; 16(5):564. https://doi.org/10.3390/atmos16050564
Chicago/Turabian StyleShah, Rayees Ahmad, Shakil Ahmad Romshoo, Imran Khan, and Pankaj Kumar. 2025. "Climatic Conditions in the Central Part of the Kashmir Valley During the Pleistocene–Holocene Transition: Insights from Lithostratigraphy, Geochemical Analyses, and Radiocarbon Chronology of Palaeosol Sequences" Atmosphere 16, no. 5: 564. https://doi.org/10.3390/atmos16050564
APA StyleShah, R. A., Romshoo, S. A., Khan, I., & Kumar, P. (2025). Climatic Conditions in the Central Part of the Kashmir Valley During the Pleistocene–Holocene Transition: Insights from Lithostratigraphy, Geochemical Analyses, and Radiocarbon Chronology of Palaeosol Sequences. Atmosphere, 16(5), 564. https://doi.org/10.3390/atmos16050564