
Spatiotemporal Characteristic of XCO2 and Its Changing Contribution Rate from Different Influencing Indicators in Mongolian Plateau of Central Asia

 , ,
, ,
Abstract
1. Introduction
2. Data and Methods
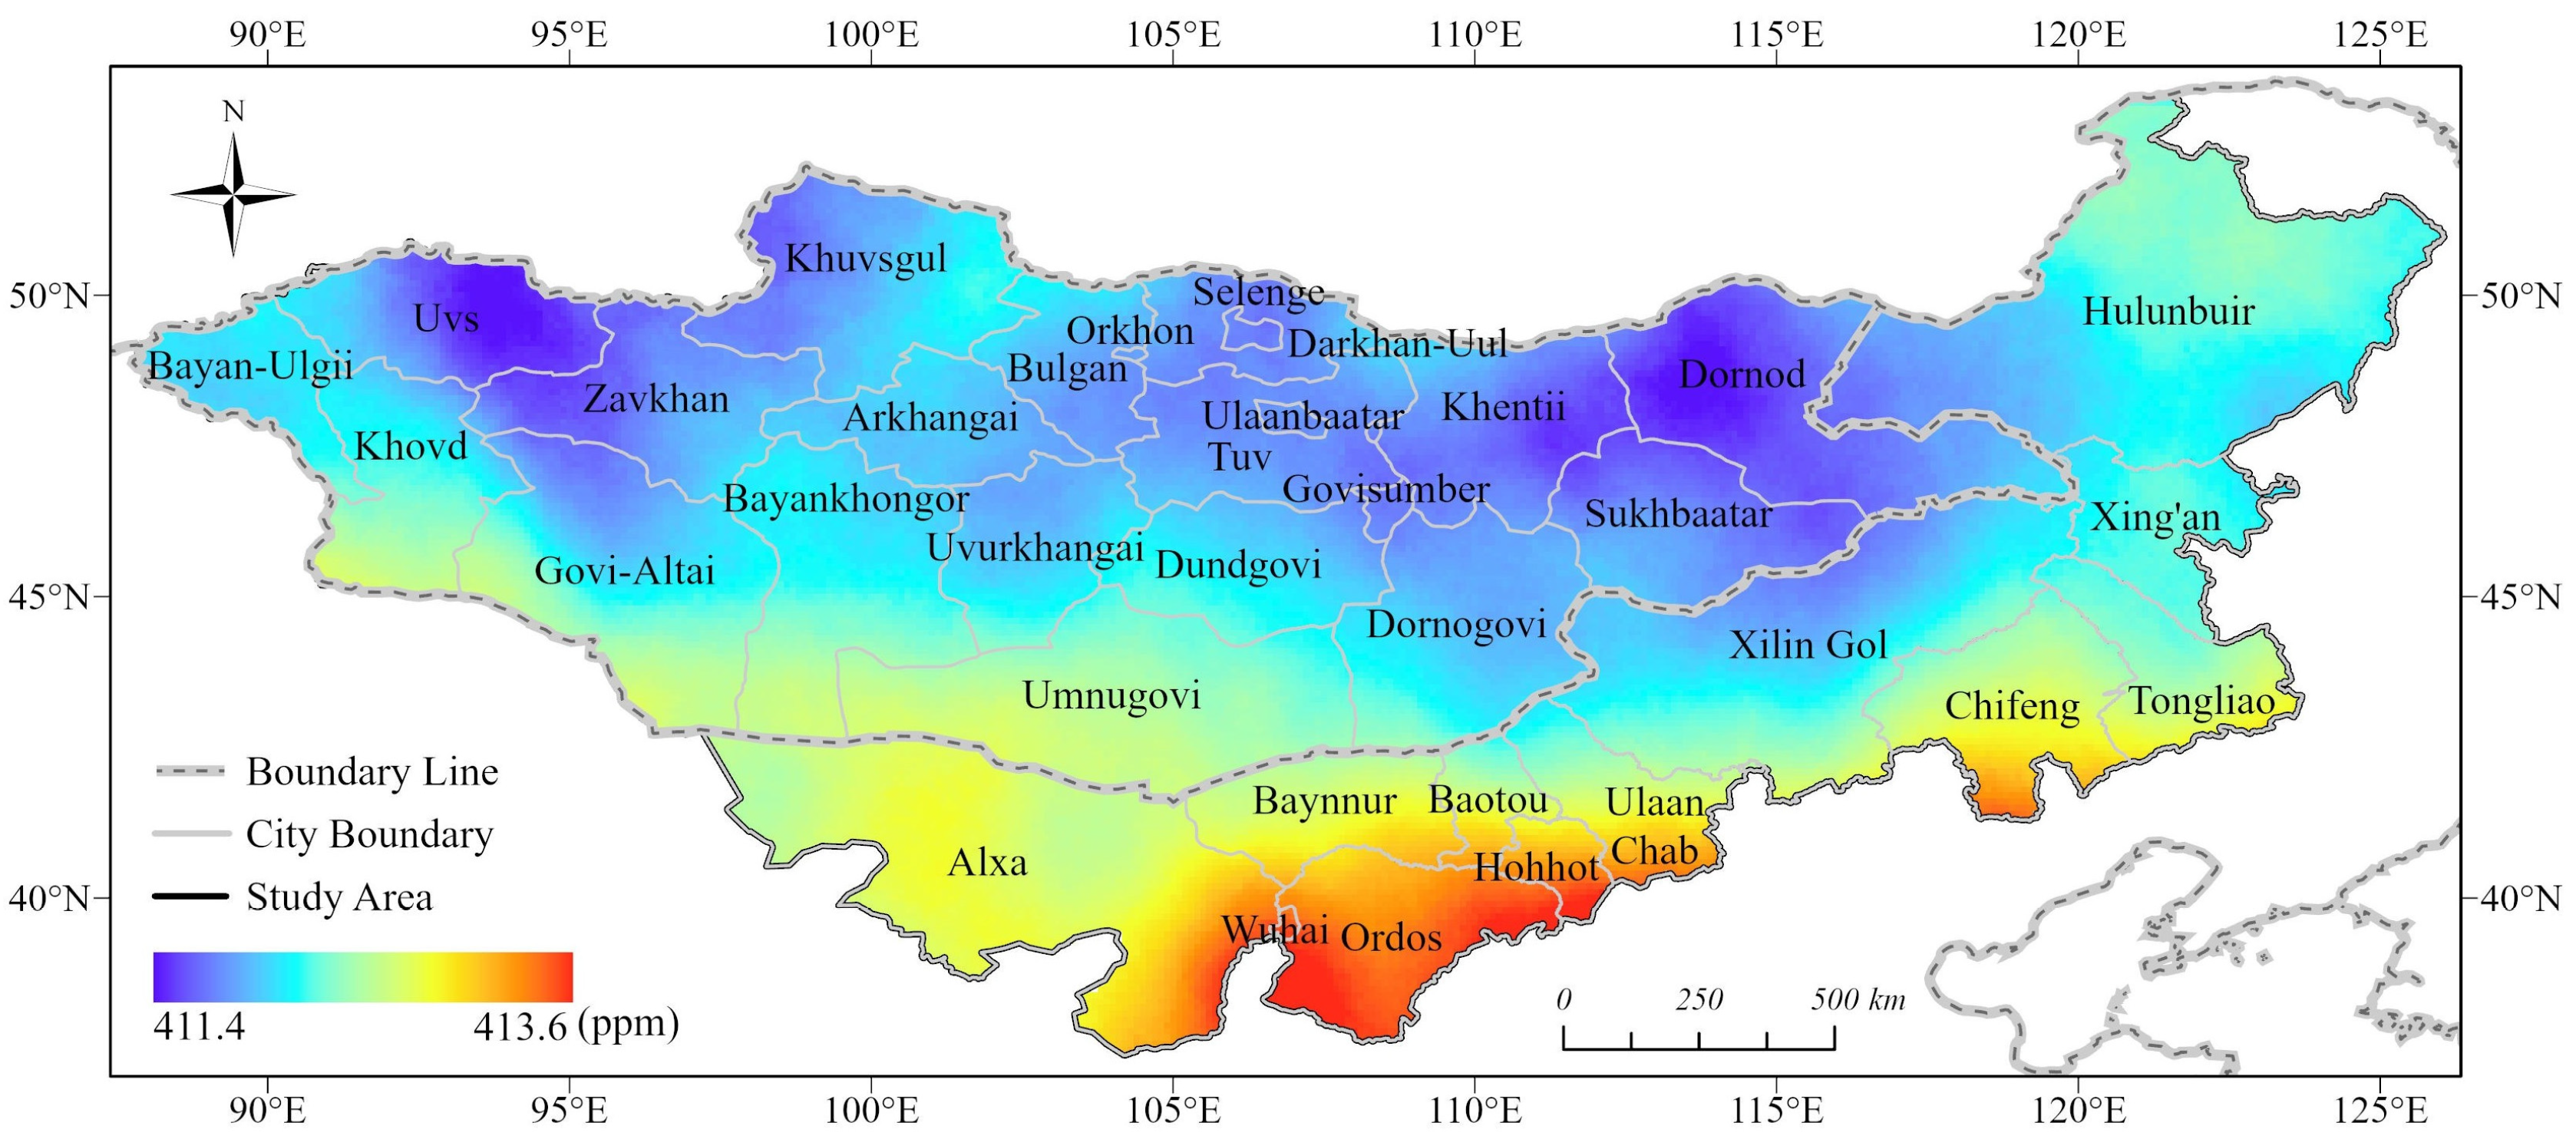
2.1. Overview of the Study Area
2.2. Data Collection
2.2.1. OCO-2 Data
2.2.2. MODIS Data
2.2.3. ERA5-Land Data
2.2.4. CHIRPS Data
2.3. Research Methodology
2.3.1. Preprocessing of OCO-2 Satellite Data
2.3.2. Factor Selection and Calculation
2.3.3. Variance Inflation Factor Analysis
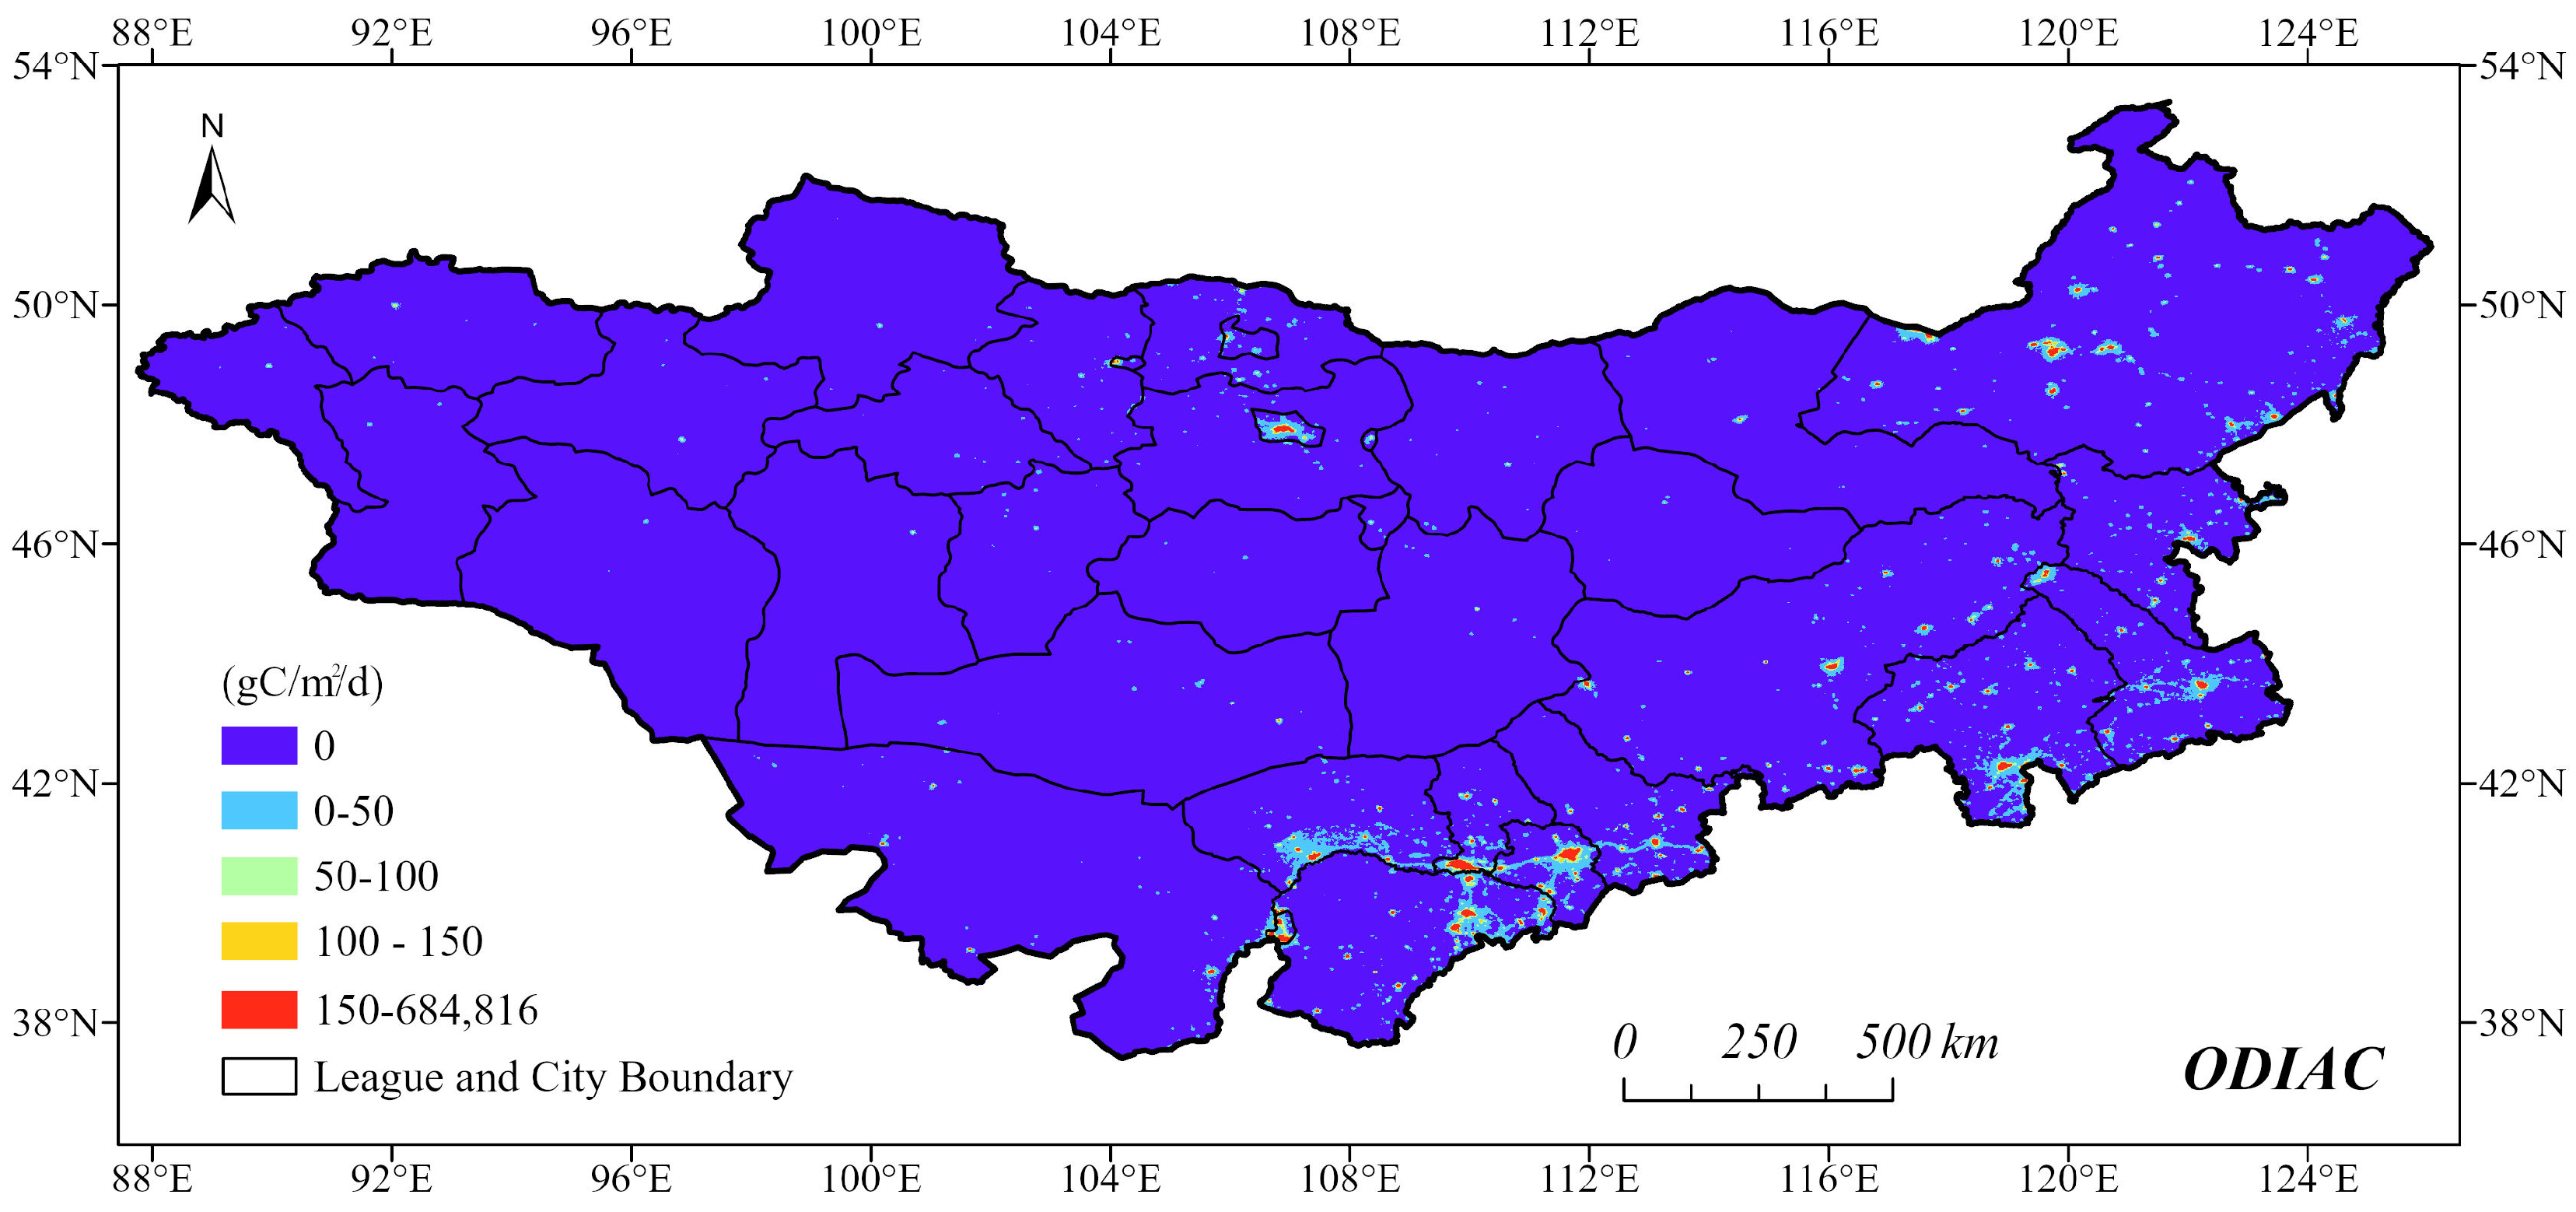
2.3.4. ODIAC Data
2.3.5. Random Forest Model
3. Results and Discussion
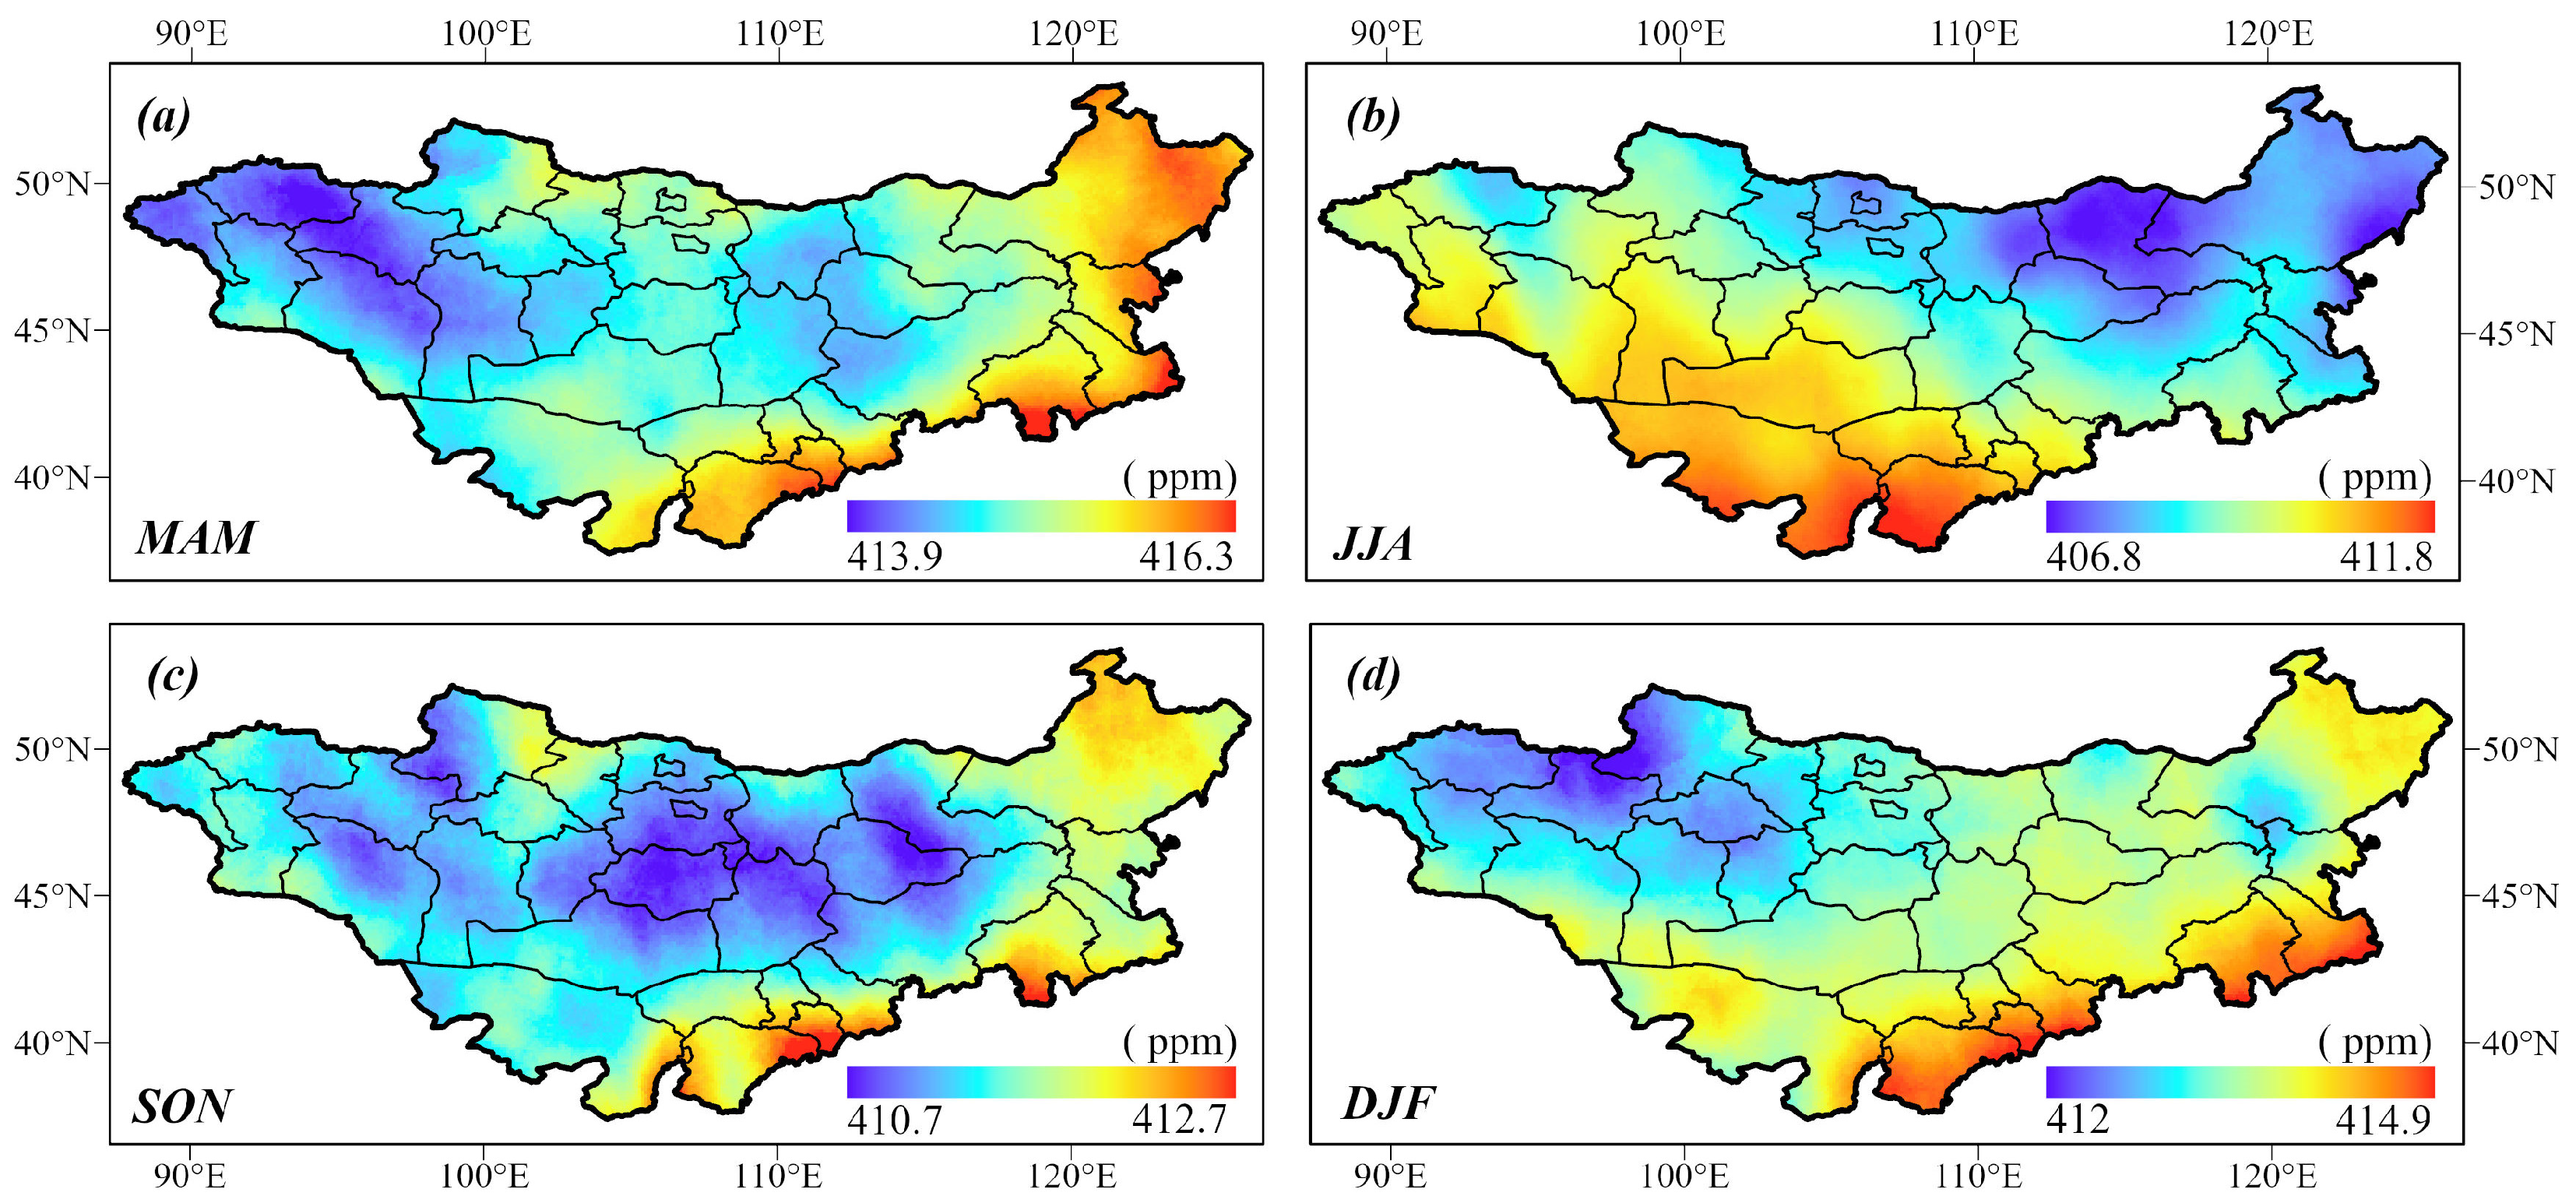
3.1. Analysis of Overall Distribution and Seasonal Evolution Pattern of XCO2
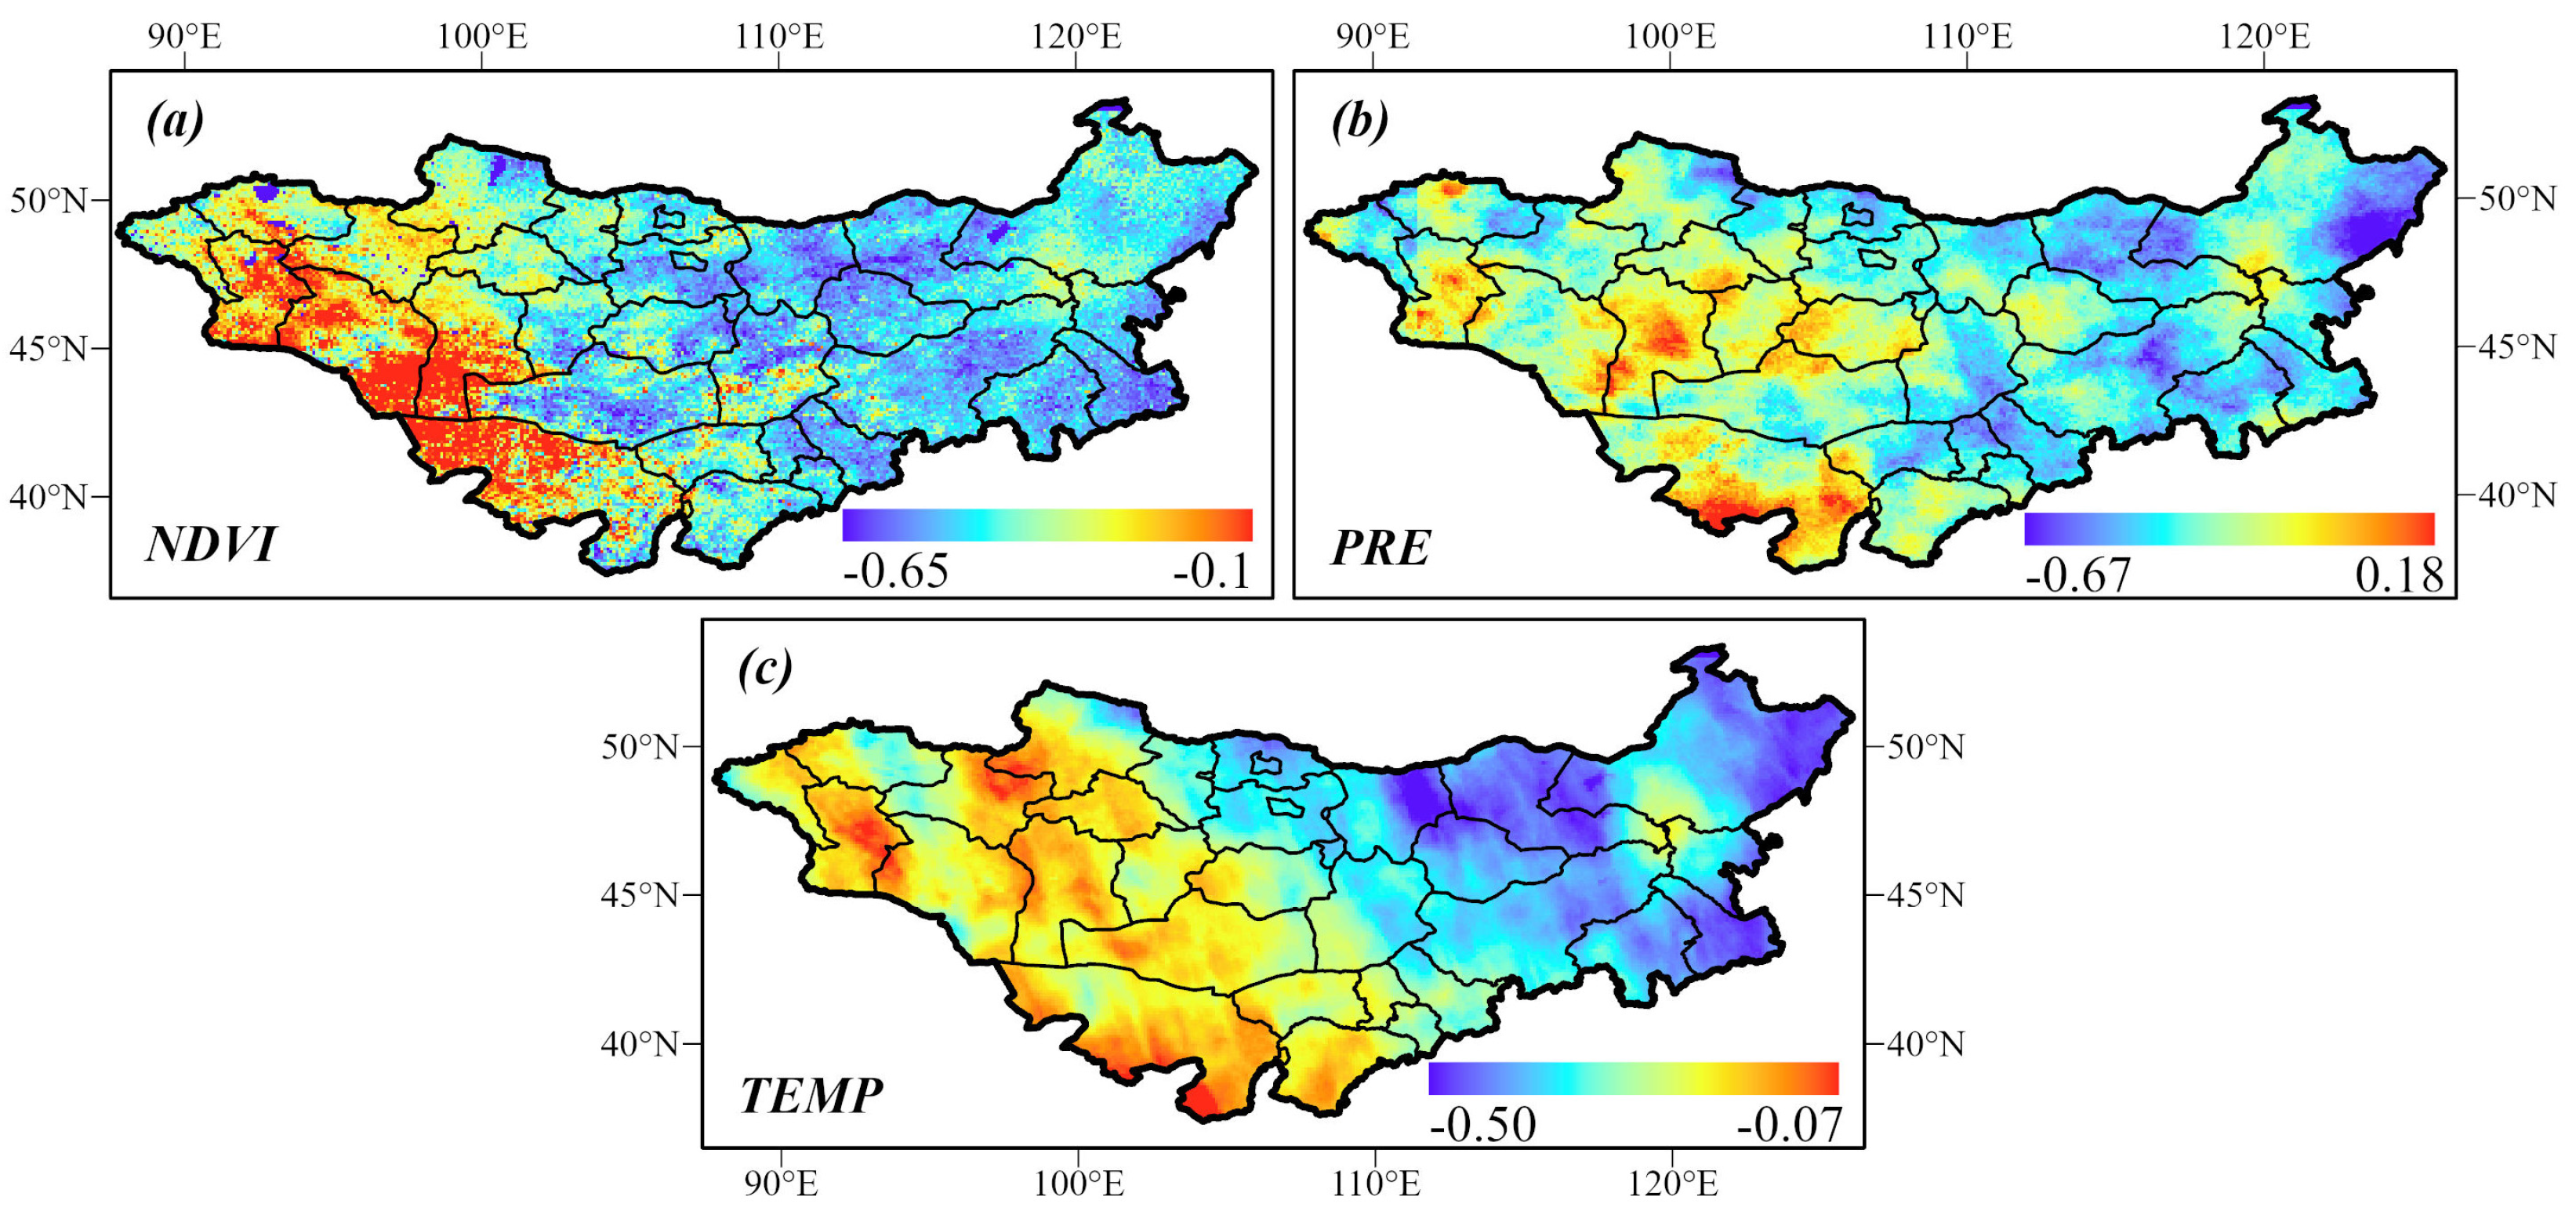
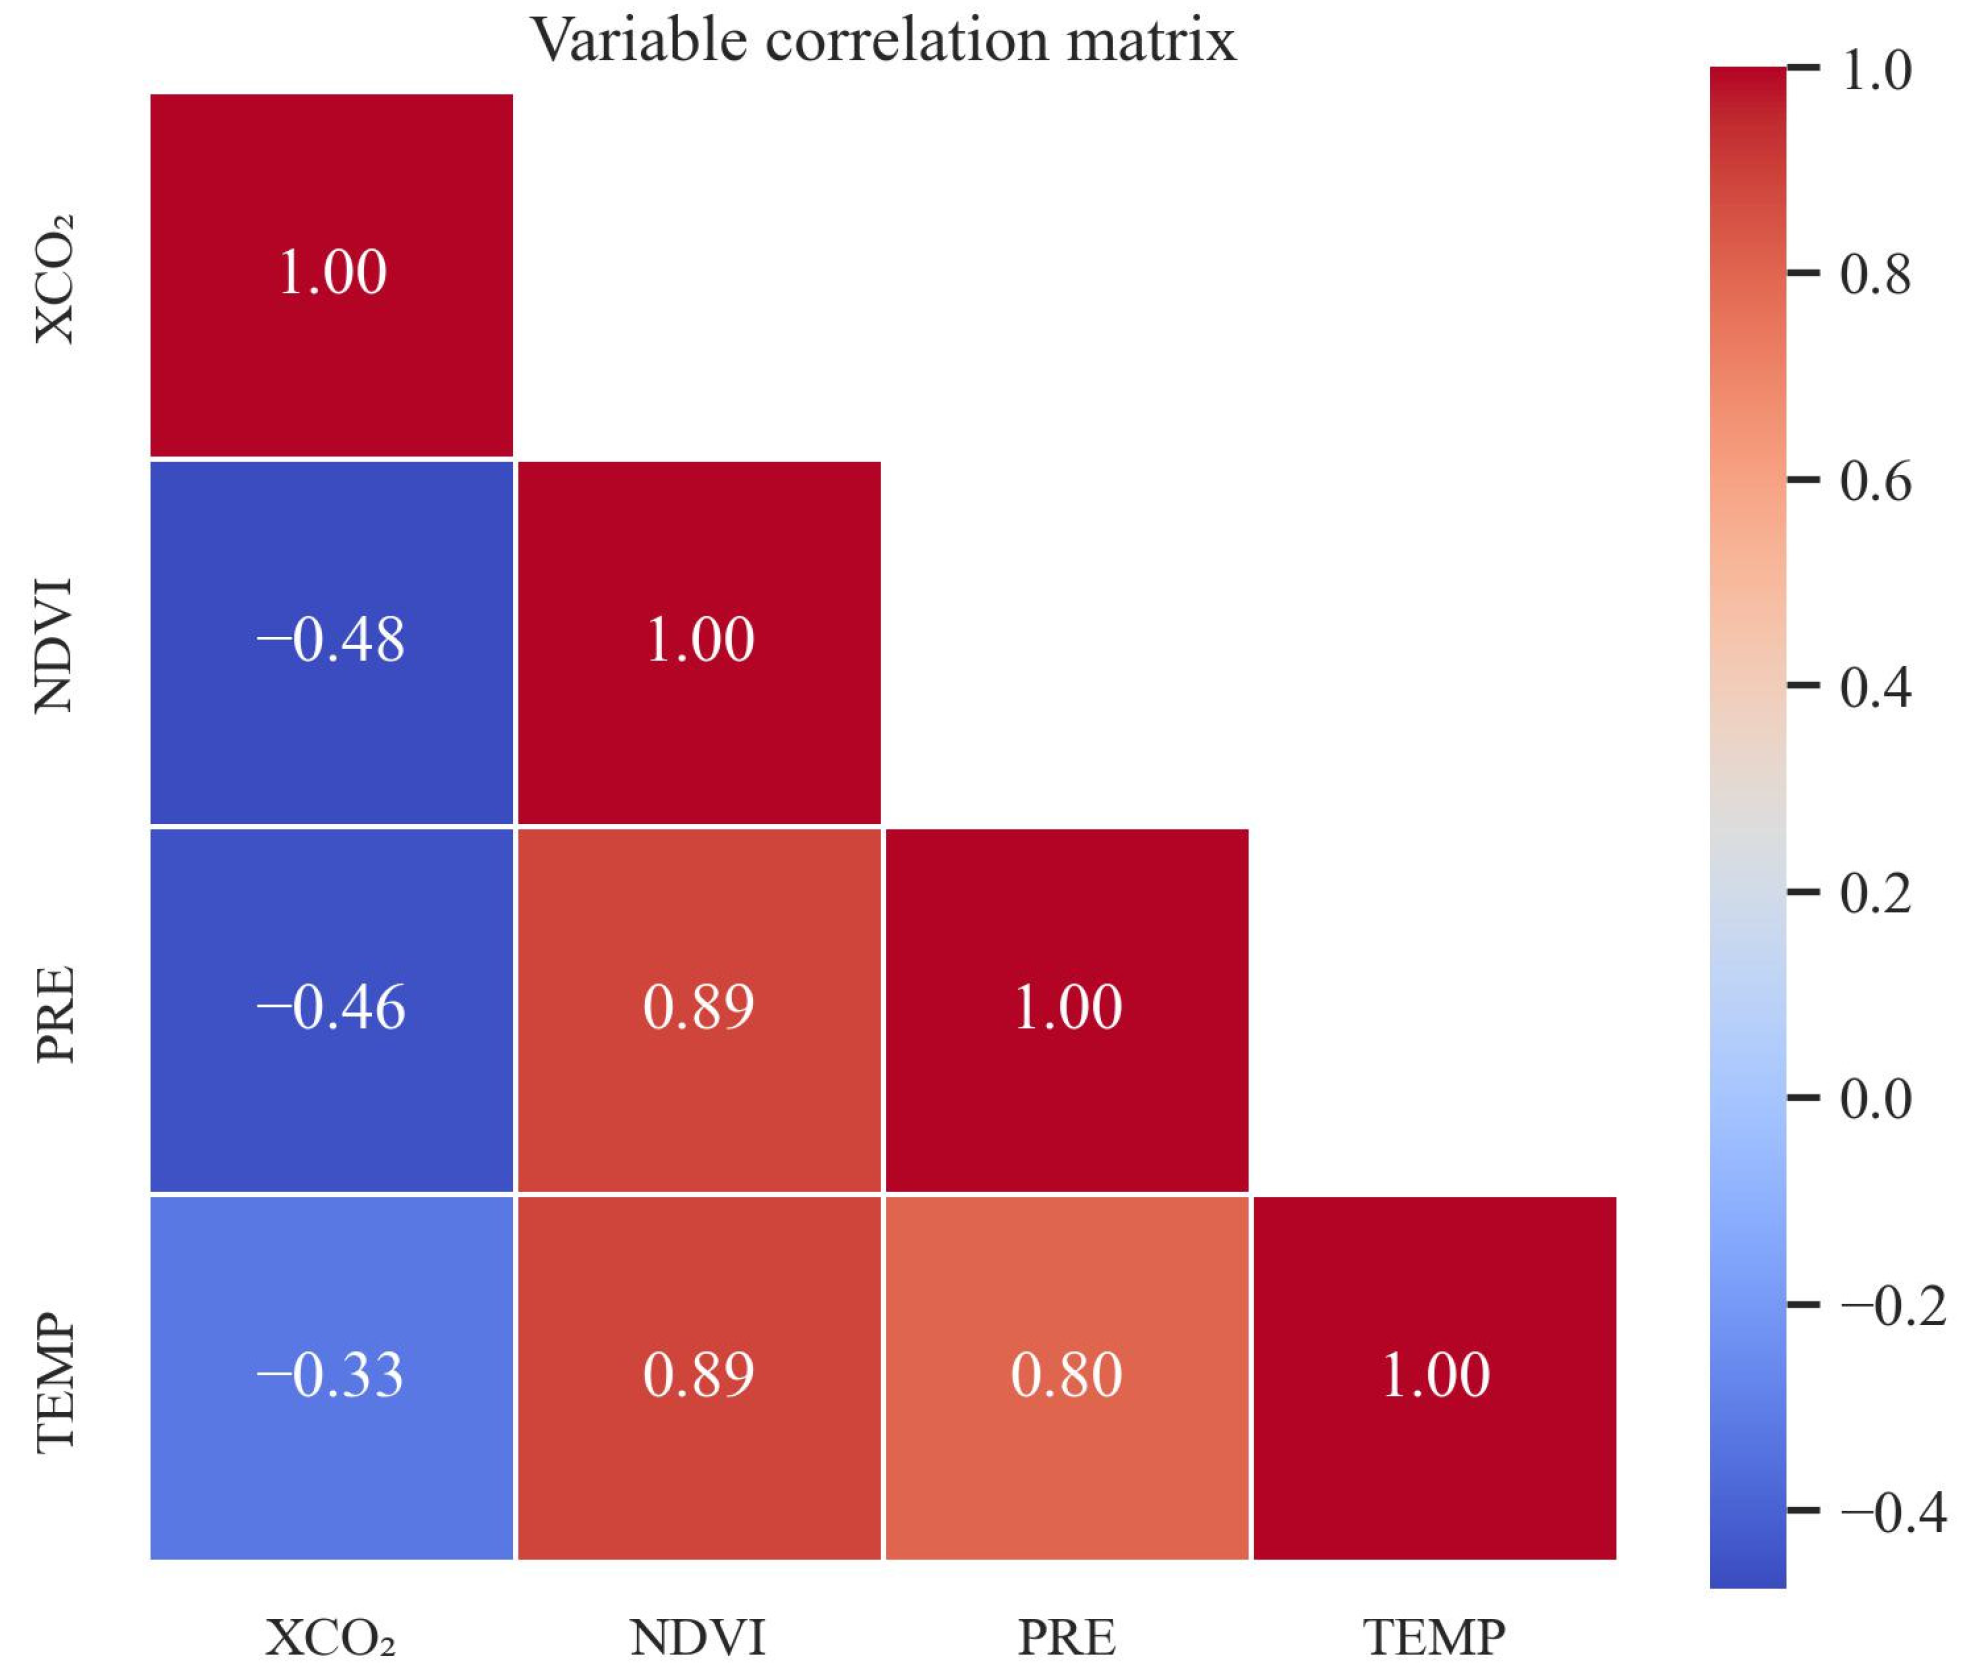
3.2. Analysis of the XCO2 Changing Correlations from the Perspectives of Natural Environments
3.2.1. Collinearity Issue Is Reliable in Mongolian Plateau for Analyzing the XCO2 Changing Correlations from the Perspectives of Natural Environments
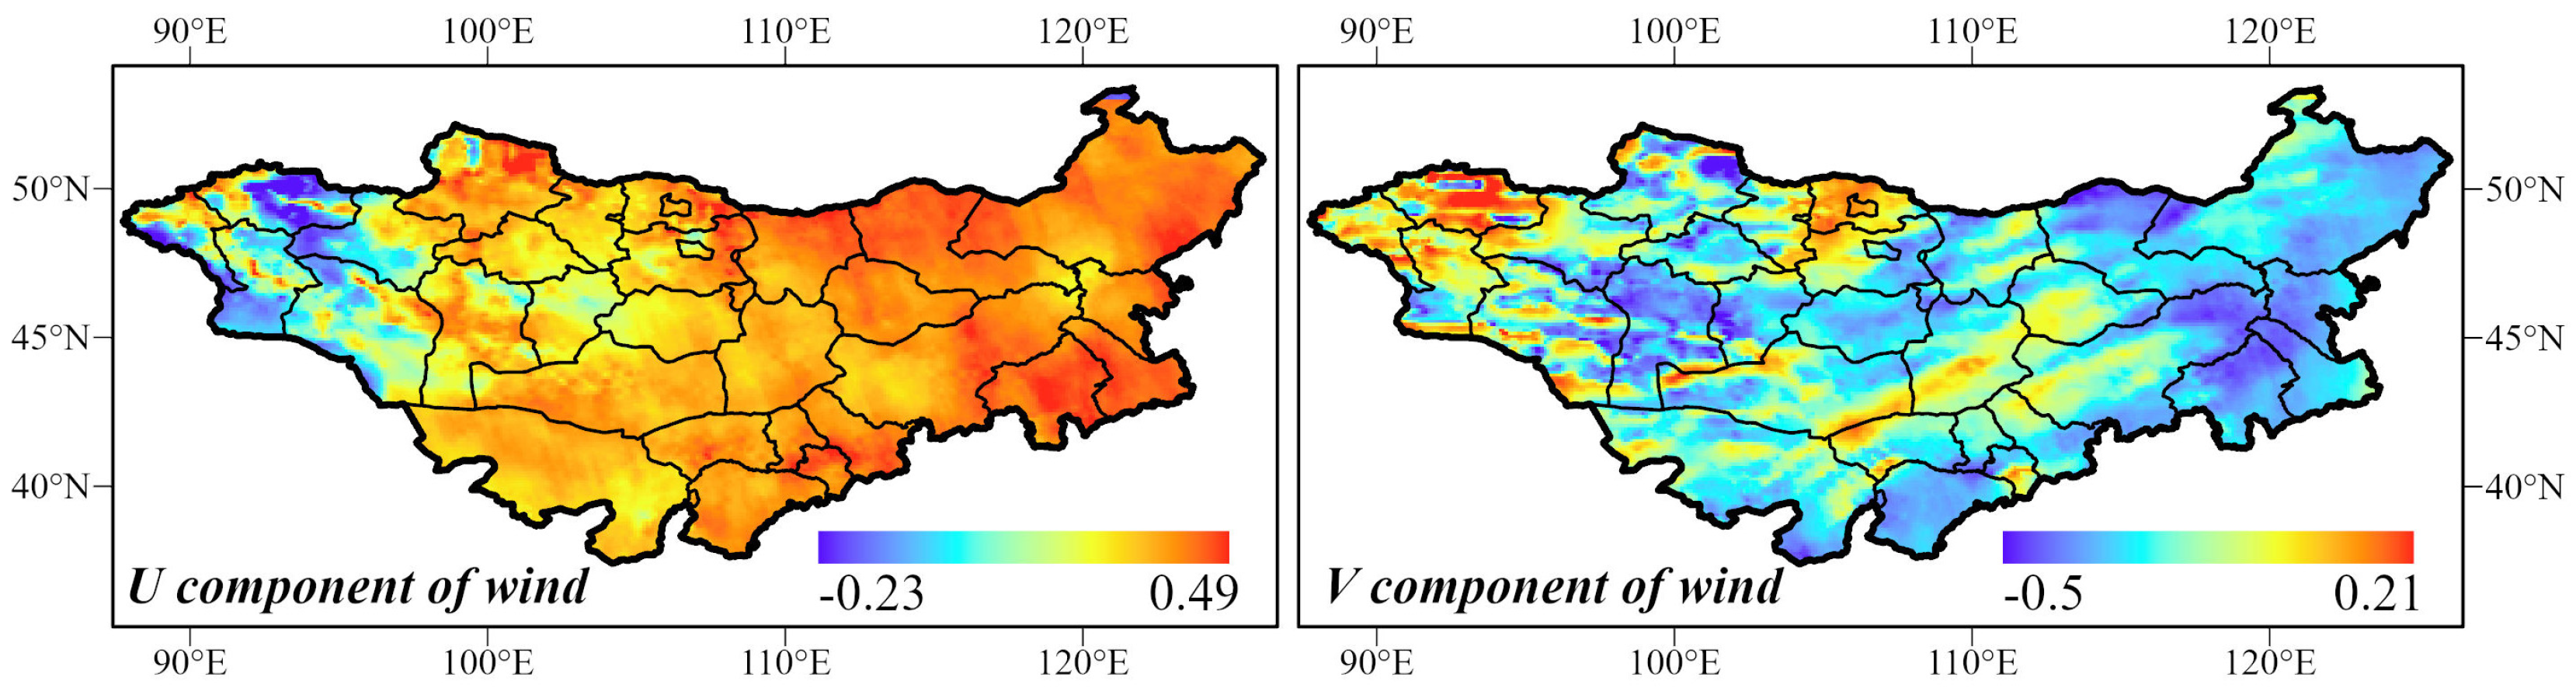
3.2.2. Analysis of the Effect of Wind Field on XCO2
3.3. Analysis of the Contributions of Single and Interactive Factors to XCO2 Changes
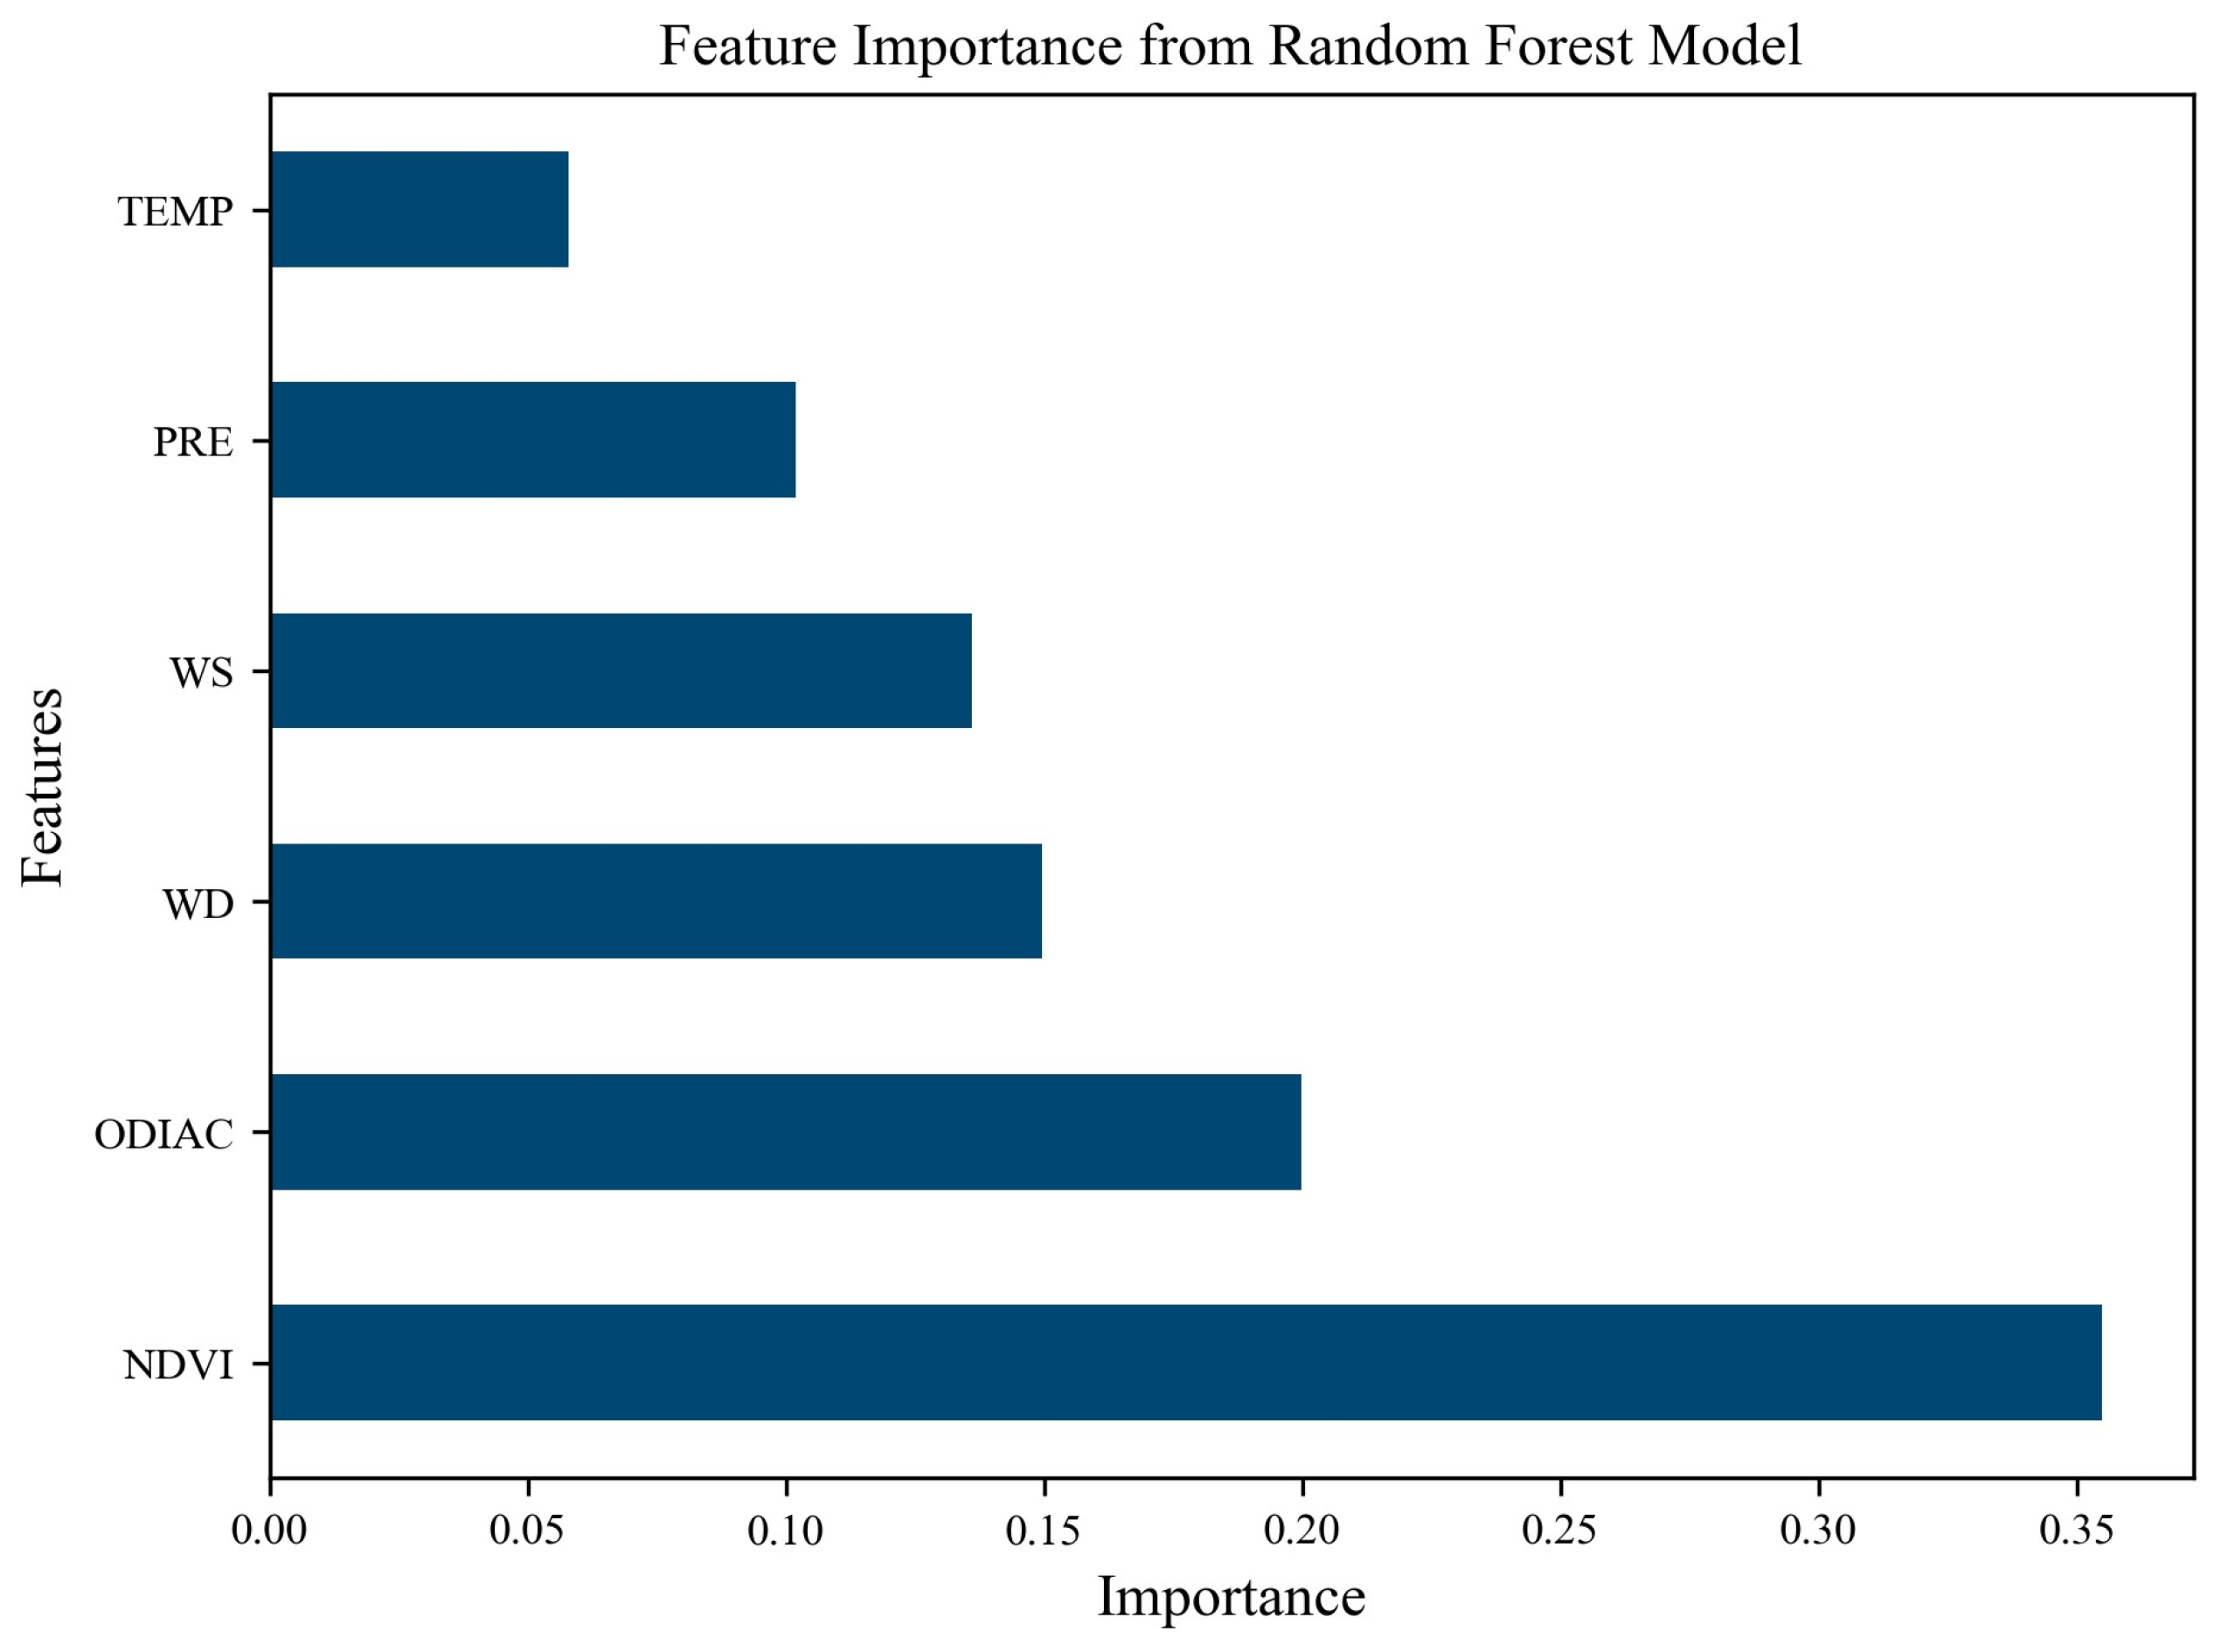
3.3.1. Analysis of Contribution Rates of Different Influencing Factors on XCO2 Changes
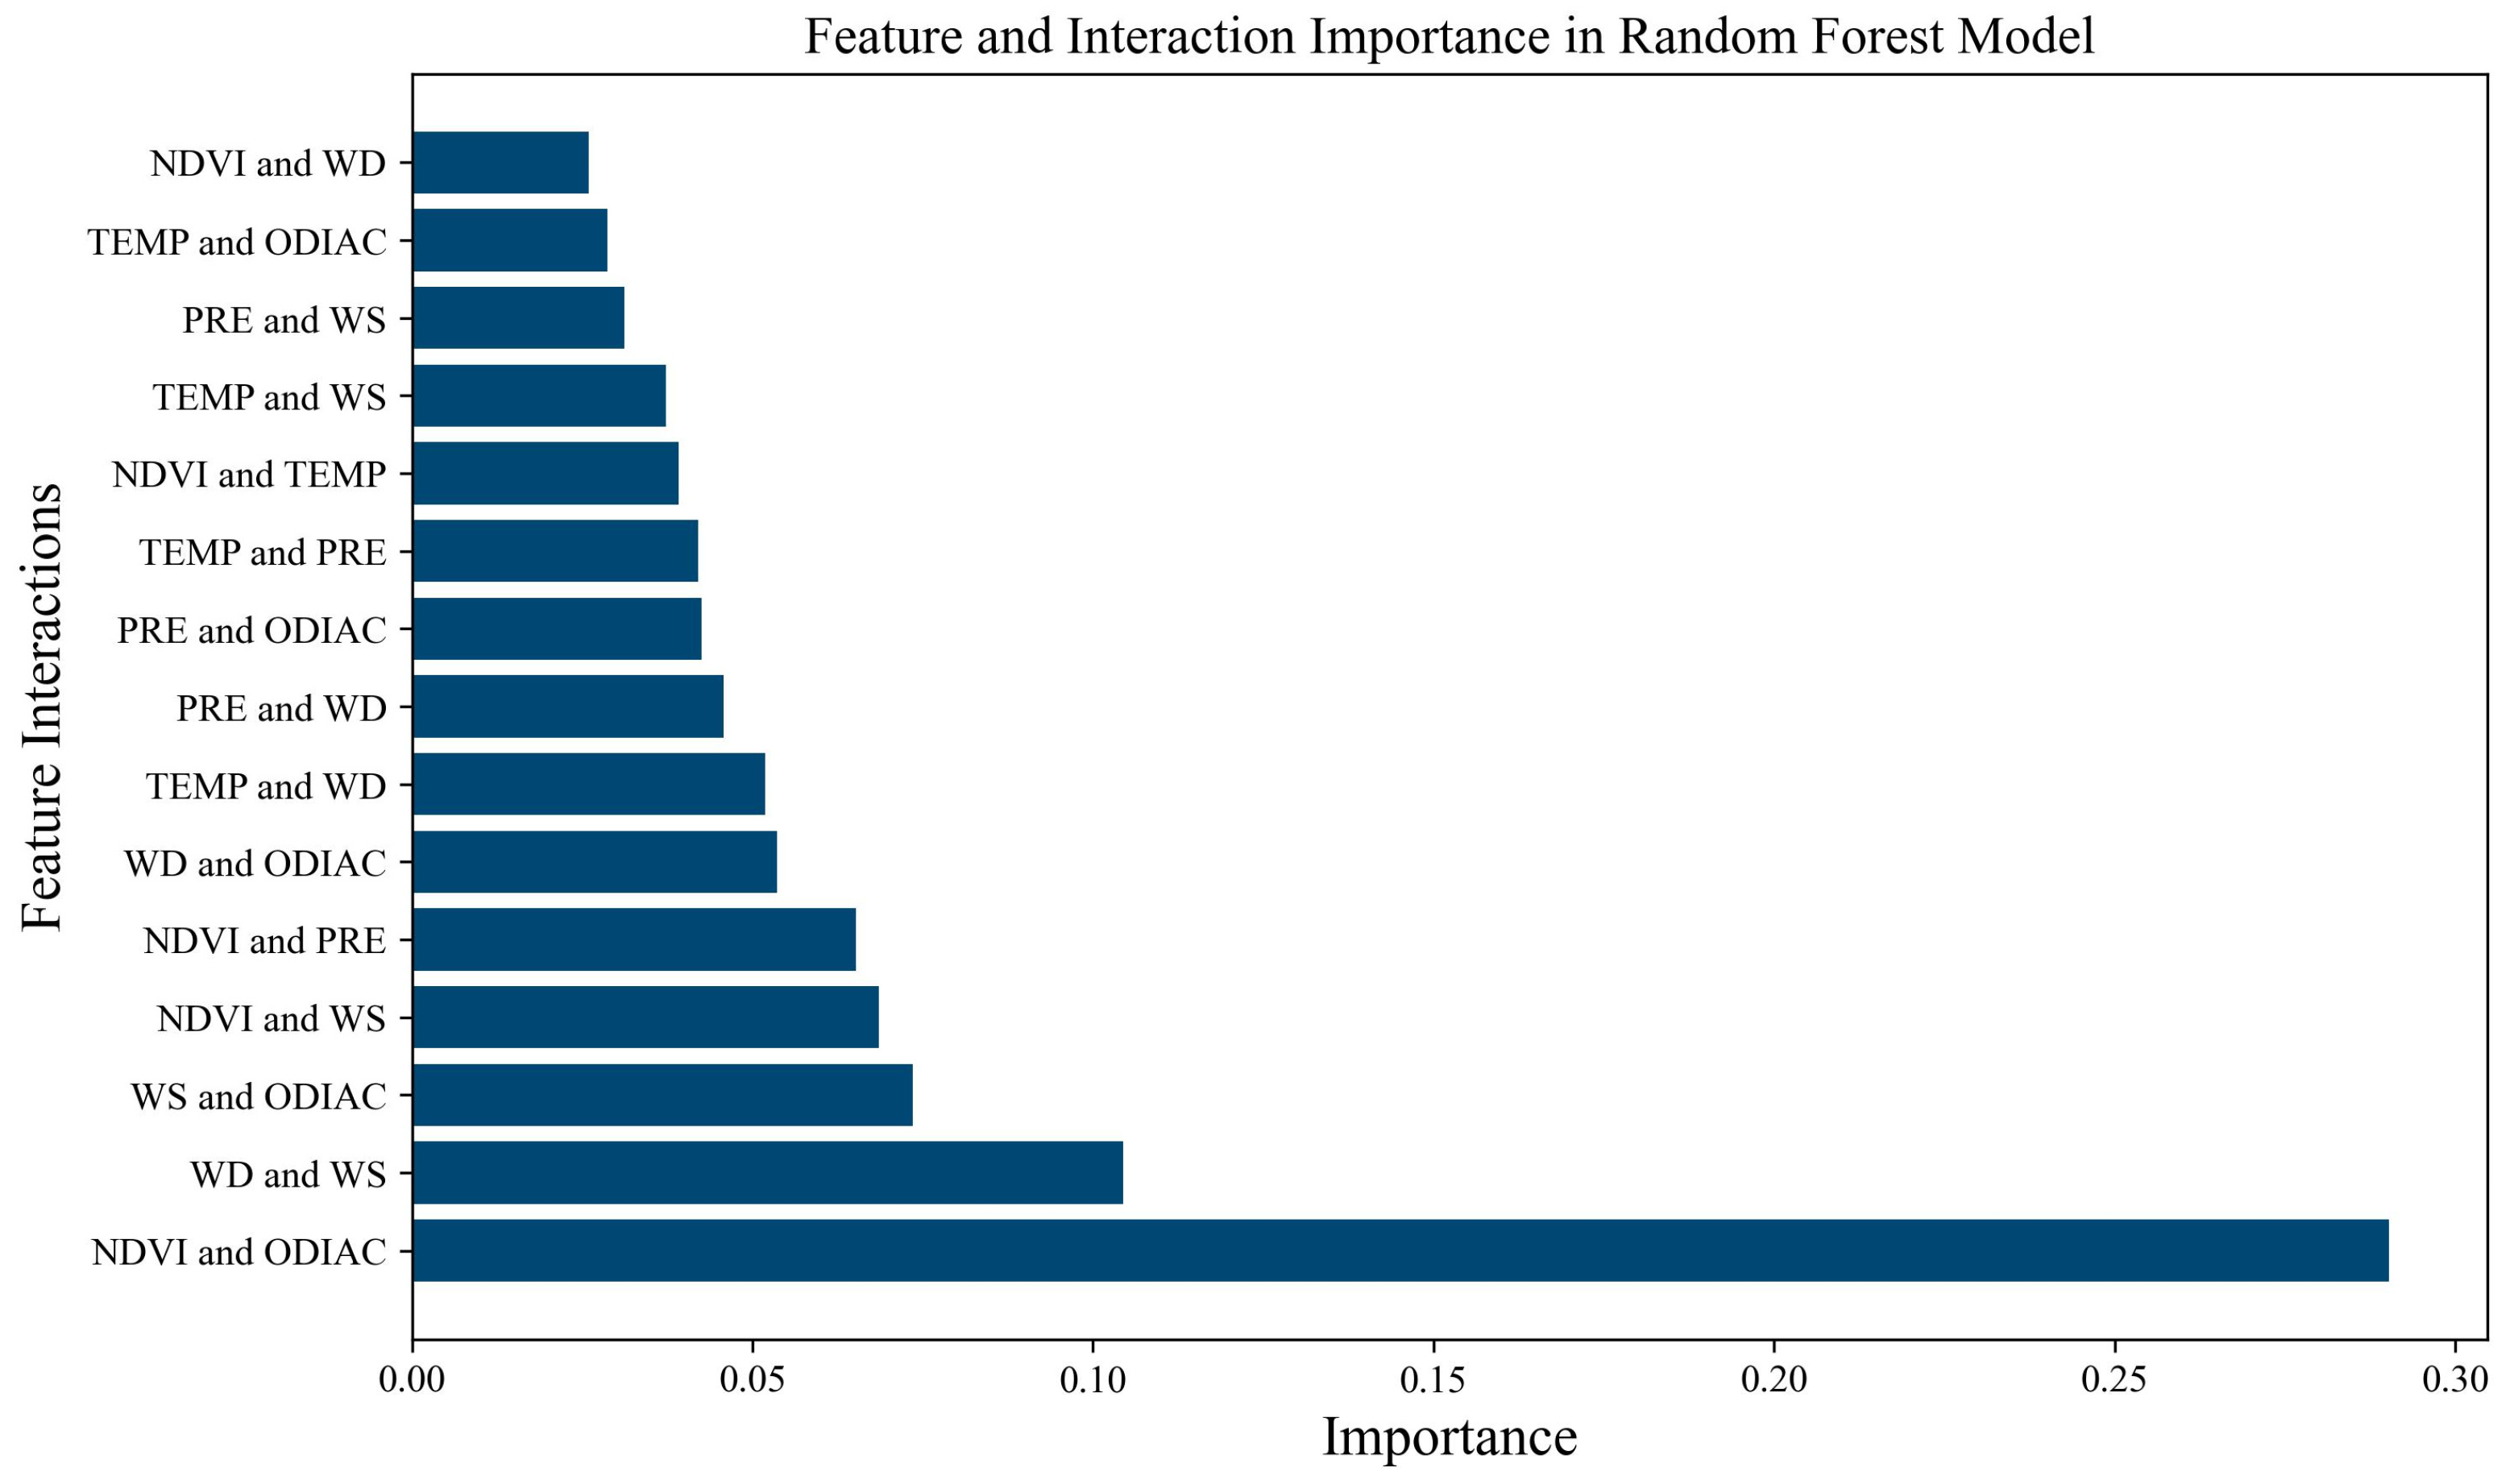
3.3.2. Analysis of Contribution Rate of Interactive Factors on XCO2 Changes
4. Conclusions
- (1)
- For overall distribution and seasonal changes of XCO2, the average XCO2 concentration is 412 ppm, with an annual growth rate of 2.29 ppm/a from 2018 to 2022. In different regions, XCO2 concentrations exhibit significant spatial heterogeneity, with higher values in the southern regions and lower values in the north. The regions with higher concentrations are primarily located in the central region of Inner Mongolia, particularly in cities such as Hohhot and Ordos. Meanwhile, the seasonal analysis reveals a clear temporal pattern, with the following order: spring (414.83 ppm) > winter (413.4 ppm) > autumn (411.3 ppm) > summer (409.12 ppm). The XCO2 concentration patterns in spring, winter, and autumn are relatively consistent, with higher values in eastern regions and lower in western regions, but the pattern is the opposite in summer.
- (2)
- From the perspectives of natural environments on XCO2 changes, XCO2 is significantly negatively correlated with the NDVI, precipitation, and temperature across most of the plateau, indicating that areas with a higher NDVI, greater precipitation, and moderate temperatures generally correspond to lower XCO2 levels. Temporal correlation analysis further reveals that this negative correlation is most pronounced in the eastern regions, where vegetation cover is higher, precipitation is more abundant, and temperatures are moderate.
- (3)
- As for the contributions of single and interactive factors to XCO2 changes, evidently, the influence of each factor on the plateau’s XCO2 varied. The NDVI, as the primary carbon sink indicator, was deemed the most important, with a contribution rate of 0.35, followed by fossil fuel combustion emissions, WD, and WS, but PRE and TEMP displayed a low contribution rate. Meanwhile, for interactive factors, the NDVI and ODIAC showed the highest contribution rate (over 0.25). WS and WD, ODIAC and WS, and NDVI and WS also exhibited a high contribution rate (over 0.05), while the contributions of other factors were lower.
Author Contributions
Funding
Institutional Review Board Statement
Informed Consent Statement
Data Availability Statement
Conflicts of Interest
References
- Li, H.; Zhao, Y.; Wang, S.; Liu, Y. Spatial-temporal characteristics and drivers of the regional residential CO2 emissions in China during 2000–2017. J. Clean. Prod. 2020, 276, 124116. [Google Scholar] [CrossRef]
- Lynn, J.; Peeva, N. Communications in the IPCC’s Sixth Assessment Report cycle. Clim. Change 2021, 169, 18. [Google Scholar] [CrossRef]
- AghaKouchak, A.; Chiang, F.; Huning, L.S.; Love, C.A.; Mallakpour, I.; Mazdiyasni, O.; Moftakhari, H.; Papalexiou, S.M.; Ragno, E.; Sadegh, M. Climate Extremes and Compound Hazards in a Warming World. Annu. Rev. Earth Planet. Sci. 2020, 48, 519–548. [Google Scholar] [CrossRef]
- Dong, G.; Zhao, F.; Chen, J.; Zhang, Y.; Qu, L.; Jiang, S.; Ochirbat, B.; Chen, J.; Xin, X.; Shao, C. Non-climatic component provoked substantial spatiotemporal changes of carbon and water use efficiency on the Mongolian Plateau. Environ. Res. Lett. 2020, 15, 095009. [Google Scholar] [CrossRef]
- Zheng, J.; Zhang, H.; Zhang, S. Comparison of Atmospheric Carbon Dioxide Concentrations Based on GOSAT, OCO-2 Observations and Ground-Based TCCON Data. Remote Sens. 2023, 15, 5172. [Google Scholar] [CrossRef]
- Yin, S.; Wang, X.; Tani, H.; Zhang, X.; Zhong, G.; Sun, Z.; Chittenden, A.R. Analyzing temporo-spatial changes and the distribution of the CO2 concentration in Australia from 2009 to 2016 by greenhouse gas monitoring satellites. Atmos. Environ. 2018, 192, 1–12. [Google Scholar] [CrossRef]
- Whitburn, S.; Clarisse, L.; Crapeau, M.; August, T.; Hultberg, T.; Coheur, P.F.; Clerbaux, C. A CO2 independent cloud mask from Infrared Atmospheric Sounding Interferometer (IASI) radiances for climate applications. Atmos. Meas. Tech. 2022, 15, 6653–6668. [Google Scholar] [CrossRef]
- Zhang, L.; Wei, C.; Liu, H.; Jiang, H.; Lu, X.; Zhang, X.; Jiang, C. Comparison analysis of global methane concentration derived from SCIAMACHY, AIRS, and GOSAT with surface station measurements. Int. J. Remote Sens. 2021, 42, 1823–1840. [Google Scholar] [CrossRef]
- Fang, J.; Chen, B.; Zhang, H.; Dilawar, A.; Guo, M.; Liu, C.; Liu, S.A.; Gemechu, T.M.; Zhang, X. Global Evaluation and Intercomparison of XCO2 Retrievals from GOSAT, OCO-2, and TANSAT with TCCON. Remote Sens. 2023, 15, 5073. [Google Scholar] [CrossRef]
- Bodah, B.W.; Neckel, A.; Stolfo Maculan, L.; Milanes, C.B.; Korcelski, C.; Ramírez, O.; Mendez-Espinosa, J.F.; Bodah, E.T.; Oliveira, M.L.S. Sentinel-5P TROPOMI satellite application for NO2 and CO studies aiming at environmental valuation. J. Clean. Prod. 2022, 357, 131960. [Google Scholar] [CrossRef]
- Mousavi, S.-M.; Mobarghaee Dinan, N.; Ansarifard, S. Examination and Analysis of Annual, Seasonal, and Monthly Variations in Atmospheric Carbon Dioxide Concentration Across the Middle East Region Utilizing SCIAMACHY, GOSAT, and OCO-2 Satellite Data. Environ. Sci. 2024, 22, 305–324. [Google Scholar] [CrossRef]
- Xie, F.; Ren, T.; Zhao, C.; Wen, Y.; Gu, Y.; Zhou, M.; Wang, P.; Shiomi, K.; Morino, I. Fast retrieval of XCO2 over east Asia based on Orbiting Carbon Observatory-2 (OCO-2) spectral measurements. Atmos. Meas. Tech. 2024, 17, 3949–3967. [Google Scholar] [CrossRef]
- Adiya, S.; Dalantai, S.; Wu, T.; Wu, X.; Yamkhin, J.; Bao, Y.; Sumiya, E.; Yadamsuren, G.; Avirmed, D.; Dorjgotov, B. Spatial and temporal change patterns of near-surface CO2 and CH4 concentrations in different permafrost regions on the Mongolian Plateau from 2010 to 2017. Sci. Total Environ. 2021, 800, 149433. [Google Scholar] [CrossRef]
- Te, T.; Bagan, H.; Che, M.; Hou, X.; Uudus, B. Spatiotemporal variability of near-surface CO2 and its affecting factors over Mongolia. Environ. Res. 2023, 236, 116796. [Google Scholar] [CrossRef] [PubMed]
- Bai, Y.; Li, S.; Liu, M.; Guo, Q. Assessment of vegetation change on the Mongolian Plateau over three decades using different remote sensing products. J. Environ. Manag. 2022, 317, 115509. [Google Scholar] [CrossRef]
- Luo, M.; Meng, F.; Sa, C.; Duan, Y.; Bao, Y.; Liu, T.; De Maeyer, P. Response of vegetation phenology to soil moisture dynamics in the Mongolian Plateau. Catena 2021, 206, 105505. [Google Scholar] [CrossRef]
- Li, X.; Xiao, J.; He, B.; Altaf Arain, M.; Beringer, J.; Desai, A.R.; Emmel, C.; Hollinger, D.Y.; Krasnova, A.; Mammarella, I.; et al. Solar-induced chlorophyll fluorescence is strongly correlated with terrestrial photosynthesis for a wide variety of biomes: First global analysis based on OCO-2 and flux tower observations. Glob. Change Biol. 2018, 24, 3990–4008. [Google Scholar] [CrossRef]
- Golkar, F.; Mousavi, S.M. Variation of XCO2 anomaly patterns in the Middle East from OCO-2 satellite data. Int. J. Digit. Earth 2022, 15, 1219–1235. [Google Scholar] [CrossRef]
- Bai, Y.; Liu, M.; Guo, Q.; Wu, G.; Wang, W.; Li, S. Diverse responses of gross primary production and leaf area index to drought on the Mongolian Plateau. Sci. Total Environ. 2023, 902, 166507. [Google Scholar] [CrossRef]
- Yilmaz, M. Accuracy assessment of temperature trends from ERA5 and ERA5-Land. Sci. Total Environ. 2023, 856, 159182. [Google Scholar] [CrossRef]
- Saunders, K.M.; Roberts, S.J.; Perren, B.; Butz, C.; Sime, L.; Davies, S.; Van Nieuwenhuyze, W.; Grosjean, M.; Hodgson, D.A. Holocene dynamics of the Southern Hemisphere westerly winds and possible links to CO2 outgassing. Nat. Geosci. 2018, 11, 650–655. [Google Scholar] [CrossRef]
- Mulungu, D.M.M.; Mukama, E. Evaluation and modelling of accuracy of satellite-based CHIRPS rainfall data in Ruvu subbasin, Tanzania. Model. Earth Syst. Environ. 2023, 9, 1287–1300. [Google Scholar] [CrossRef]
- Oda, T.; Maksyutov, S.; Andres, R.J. The Open-source Data Inventory for Anthropogenic CO2, version 2016 (ODIAC2016): A global monthly fossil fuel CO2 gridded emissions data product for tracer transport simulations and surface flux inversions. Earth Syst. Sci. Data 2018, 10, 87–107. [Google Scholar] [CrossRef] [PubMed]
- Golkar, F.; Shirvani, A. Spatial and temporal distribution and seasonal prediction of satellite measurement of CO2 concentration over Iran. Int. J. Remote Sens. 2020, 41, 8891–8909. [Google Scholar] [CrossRef]
- Gao, W.; Ding, Z.; Lu, J.; Wan, Y. Low-carbon information quality dimensions and random forest algorithm evaluation model in digital marketing. Sci. Rep. 2024, 14, 22416. [Google Scholar] [CrossRef]
- Ho, V.H.; Morita, H.; Bachofer, F.; Ho, T.H. Random forest regression kriging modeling for soil organic carbon density estimation using multi-source environmental data in central Vietnamese forests. Model. Earth Syst. Environ. 2024, 10, 7137–7158. [Google Scholar] [CrossRef]
- Wang, Z.; Zhao, Z.; Wang, C. Random forest analysis of factors affecting urban carbon emissions in cities within the Yangtze River Economic Belt. PLoS ONE 2021, 16, e0252337. [Google Scholar] [CrossRef]
- Chen, J.; Hu, R.; Chen, L.; Liao, Z.; Che, L.; Li, T. Multi-sensor integrated mapping of global XCO2 from 2015 to 2021 with a local random forest model. ISPRS J. Photogramm. Remote Sens. 2024, 208, 107–120. [Google Scholar] [CrossRef]


| Data Name | Data Source | Spatiotemporal Resolution |
|---|---|---|
| Atmospheric CO2 column concentration | OCO-2 Satellite Observation Data | 16-day/1.29 × 2.25 km |
| Normalized difference vegetation index | MODIS/MOD13A3 | 16-day/1 km |
| Temperature and precipitation | ERA5-LAND | Hourly/0.1° × 0.1° |
| Wind direction and wind speed | ERA5-LAND | Hourly/0.1° × 0.1° |
| Precipitation | CHIRPS | Daily/0.05° × 0.05° |
| Fossil fuel combustion emissions | ODIAC | Monthly/1 km |
| Digital Elevation Model | Shuttle Radar Topography Mission | Year/30 m |
Disclaimer/Publisher’s Note: The statements, opinions and data contained in all publications are solely those of the individual author(s) and contributor(s) and not of MDPI and/or the editor(s). MDPI and/or the editor(s) disclaim responsibility for any injury to people or property resulting from any ideas, methods, instructions or products referred to in the content. |
© 2025 by the authors. Licensee MDPI, Basel, Switzerland. This article is an open access article distributed under the terms and conditions of the Creative Commons Attribution (CC BY) license (https://creativecommons.org/licenses/by/4.0/).
Share and Cite
A, Y.; Bao, Z.; Tong, S.; Bao, Y.; Dalantai, S.; Natsagdorj, B.; Fan, X. Spatiotemporal Characteristic of XCO2 and Its Changing Contribution Rate from Different Influencing Indicators in Mongolian Plateau of Central Asia. Atmosphere 2025, 16, 560. https://doi.org/10.3390/atmos16050560
A Y, Bao Z, Tong S, Bao Y, Dalantai S, Natsagdorj B, Fan X. Spatiotemporal Characteristic of XCO2 and Its Changing Contribution Rate from Different Influencing Indicators in Mongolian Plateau of Central Asia. Atmosphere. 2025; 16(5):560. https://doi.org/10.3390/atmos16050560
Chicago/Turabian StyleA, Yunga, Zhengyi Bao, Siqin Tong, Yuhai Bao, Sainbayar Dalantai, Boldbaatar Natsagdorj, and Xinle Fan. 2025. "Spatiotemporal Characteristic of XCO2 and Its Changing Contribution Rate from Different Influencing Indicators in Mongolian Plateau of Central Asia" Atmosphere 16, no. 5: 560. https://doi.org/10.3390/atmos16050560
APA StyleA, Y., Bao, Z., Tong, S., Bao, Y., Dalantai, S., Natsagdorj, B., & Fan, X. (2025). Spatiotemporal Characteristic of XCO2 and Its Changing Contribution Rate from Different Influencing Indicators in Mongolian Plateau of Central Asia. Atmosphere, 16(5), 560. https://doi.org/10.3390/atmos16050560