Article

On-Road Measurements and Modelling of Disc Brake Temperatures and Brake Wear Particle Number Emissions on a Heavy-Duty Tractor Trailer

by
Misja Frederik Alban Steinmetz
*,
Jann Aschersleben
and
Aspasia Panagiotidou
TNO, Anna van Buerenplein 1, 2595 DA The Hague, The Netherlands
*
Author to whom correspondence should be addressed.
Atmosphere 2025, 16(5), 561; https://doi.org/10.3390/atmos16050561
Submission received: 28 March 2025 / Revised: 26 April 2025 / Accepted: 2 May 2025 / Published: 8 May 2025
(This article belongs to the Special Issue Brake and Tire Non-Exhaust Emissions and Air Pollution)

Abstract

:
In this paper, results are presented for an on-road measurement campaign for measuring the brake wear particles of disc brakes on a heavy-duty tractor trailer during the EU P012101 Pilot Project funded by the European Parliament. A novel approach was adopted using a fully open sampling system with minimal influence on air flow around the brake and brake disc temperatures. Models for brake disc heating and cooling were developed, as well as a model for the particle number emissions. It was concluded that brake wear emissions per kilometre were the highest on urban roads and the lowest on the motorway. Furthermore, when modelling heating during braking actions, the best results were seen when introducing dependencies on both the braking work and initial brake temperatures. When modelling the brake cooling, a non-linear dependence on the difference between the brake disc temperature and ambient air temperature was empirically observed. For the particle number emissions, a relationship was established between the braking work applied to the disc during the braking action and the particle number emissions of the braking action.

1. Introduction

Traffic-related particulate emissions have become a major source of urban air pollution, posing significant risks to both the environment and human health (see, for example, [1,2,3,4,5,6,7,8,9,10,11,12]). These emissions originate not only from exhaust sources but also from non-exhaust sources, such as brake wear, tire wear, road surface wear and particle resuspension [5,13]. About half of the mass of the total non-exhaust traffic-related PM10 emissions may be attributed to brake wear [5]. As stricter emissions regulations, technological advancements, and fleet electrification continue to curb exhaust emissions, non-exhaust sources are gaining increased attention and significance, with the latest vehicle legislation introducing regulations specifically aimed at reducing them [14]. This study focused on brake wear emissions from heavy-duty vehicles and contributed by developing models to simulate the heating and cooling of brake discs, as well as to estimate the number of particles generated during braking. In this paper, brake wear emissions are defined as particles released into the environment during vehicle deceleration due to the wear of brake system components [15]. Research on brake wear emissions from heavy-duty vehicles is relatively limited. Notable studies in this area include [15,16]. In [15], the researchers have conducted an analysis of brake wear particle emissions from heavy-duty vehicles using laboratory measurements. They employed a modified LINK 6900 brake dynamometer to simulate testing conditions for heavy-duty vehicles (HDVs) and measure brake wear PM. In their study, three HDVs were tested: two heavy-duty passenger buses and one heavy-duty cargo truck. The results indicate that the PM10 emissions varied depending on the test cycle and vehicle, ranging from ∼5 to ∼45 mg/km per brake. By converting these PM10 emissions to particle number (PN) emissions, based on the correlation between PM and PN emissions our study found, the values correspond to PN emissions in the order of approximately 10 11 10 12 particles per kilometre per brake. Similarly, [16] examined PM emissions from heavy-duty trucks representative of California’s fleet using a LINK dynamometer. For individual wheel tests with disc brakes, they reported PM10 emissions ranging from ∼10 to ∼30 mg/km/brake. Based on our PM–PN correlation, these values correspond to roughly 10 11 particles per km per brake—about an order of magnitude higher than the emissions observed in our setup. The discrepancies between these studies and our results may be due to differences in the measurement setups, particularly our use of on-road measurements instead of dyno brake cycle testing. Given the limited existing literature on this topic, particularly concerning heavy-duty vehicles, this paper fills a critical gap by providing insights and models that advance the understanding of on-road brake wear emissions for heavy-duty vehicles.
In UN Global Technical Regulation No. 24 [17], a test procedure for brake wear emissions of light-duty vehicles has been presented. In the Euro 7 [18] regulation, limit values have been given for light-duty brake wear emissions. Meanwhile, official test procedures or Euro 7 limit values for heavy-duty vehicles have not yet been determined. A lot of research is currently ongoing on heavy-duty test procedures and limit values. This research provides important insight into real-world heavy-duty brake wear emissions by taking a novel approach to on-road measurements with a fully open sampling system. Through the use of an open sampling system, the airflow and temperature of the brakes is minimally affected. On the other hand, more care should be taken in the design to ensure all brake wear particles are indeed caught with an open sampling system. More details of testing of the open sampling system used may be found in [19] (§7.4).
Brake wear emissions of heavy-duty vehicles have so far only been addressed in limited studies ([20,21]). Moreover, studies that addressed heavy-duty brake wear were usually based on laboratory test cycles [15]. The authors have not been able to find other results of on-road brake wear measurement campaigns for heavy-duty vehicles in the current literature.
All models presented in this study were developed based on measurement data from the EU P012101 Pilot project—Feasibility study on reduction of traffic-related particulate emissions by means of vehicle-mounted fine dust filtration [19]—funded by the European Parliament, which focused on investigating brake wear reduction technologies. The data were collected during the on-road testing of a heavy-duty vehicle—specifically, a DAF ( 4 × 2 ) tractor—and represents the first on-road dataset to provide initial insights into brake wear particulates from heavy-duty vehicles. In the P012101 report [19], further on-road measurements were performed on a truck and a bus. However, more research into on-road brake wear emissions is needed, including the study of many more vehicle types.
For both the heating and cooling processes, two models are discussed—models A and B for heating, and models C and D for cooling—while one model is introduced for the particle number (PN). Model A simulates temperature as a linear function of braking work, while model B extends model A by also incorporating the disc’s initial temperature. In the case of cooling, model C simulates temperature as a linear function of a cooling term, defined as the integrated difference between the brake disc temperature and the temperature of the ambient air from the start time of the cooling process to a given time t. To account for the non-linear behaviour observed in the data, model D incorporates a non-linear formulation of the cooling term. Finally, the PN model is defined as a linear function of the braking work. The performances of all the models were evaluated using the mean squared error ( ξ MSE ), the mean absolute error ( ξ MAE ) and the mean relative error ( ξ MRE ).
Some of the main takeaways of this paper can be summarised as follows. The collected on-road data can be used to study heavy-duty on-road disc temperature distributions and brake wear particle number emission factors for different road types. However, too much noise was introduced during the on-road measurements for this study of the dependencies of different variables, such as the influence of the temperature and braking torque on the PN emissions. By strict filtering, the noise could be greatly reduced. Models for brake heating, brake cooling and PN emissions may then be fitted on the filtered dataset. For brake heating, it was observed that the temperatures increased more quickly at a higher starting disc temperature. For brake cooling, a non-linear relationship (i.e., exponent smaller than 1) was found between the disc temperature delta’s and the temperature difference between the disc and the ambient air. For (cumulative) PN emissions, more variation in the data was observed than in the other two models and a linear model was fitted depending on the total work by the brake.
The remainder of this paper is as follows: Section 2 provides a detailed description of the measurement setup used to collect the data utilised in this study. Section 3 outlines the data preprocessing steps. Section 4 presents the results of an exploratory data analysis, including a correlation analysis between measured and calculated variables. Section 5 introduces both the disc brake heating and cooling models, and Section 6 discusses the development of the particle number (PN) model. Finally, Section 7 summarises the key findings and conclusions of this study.

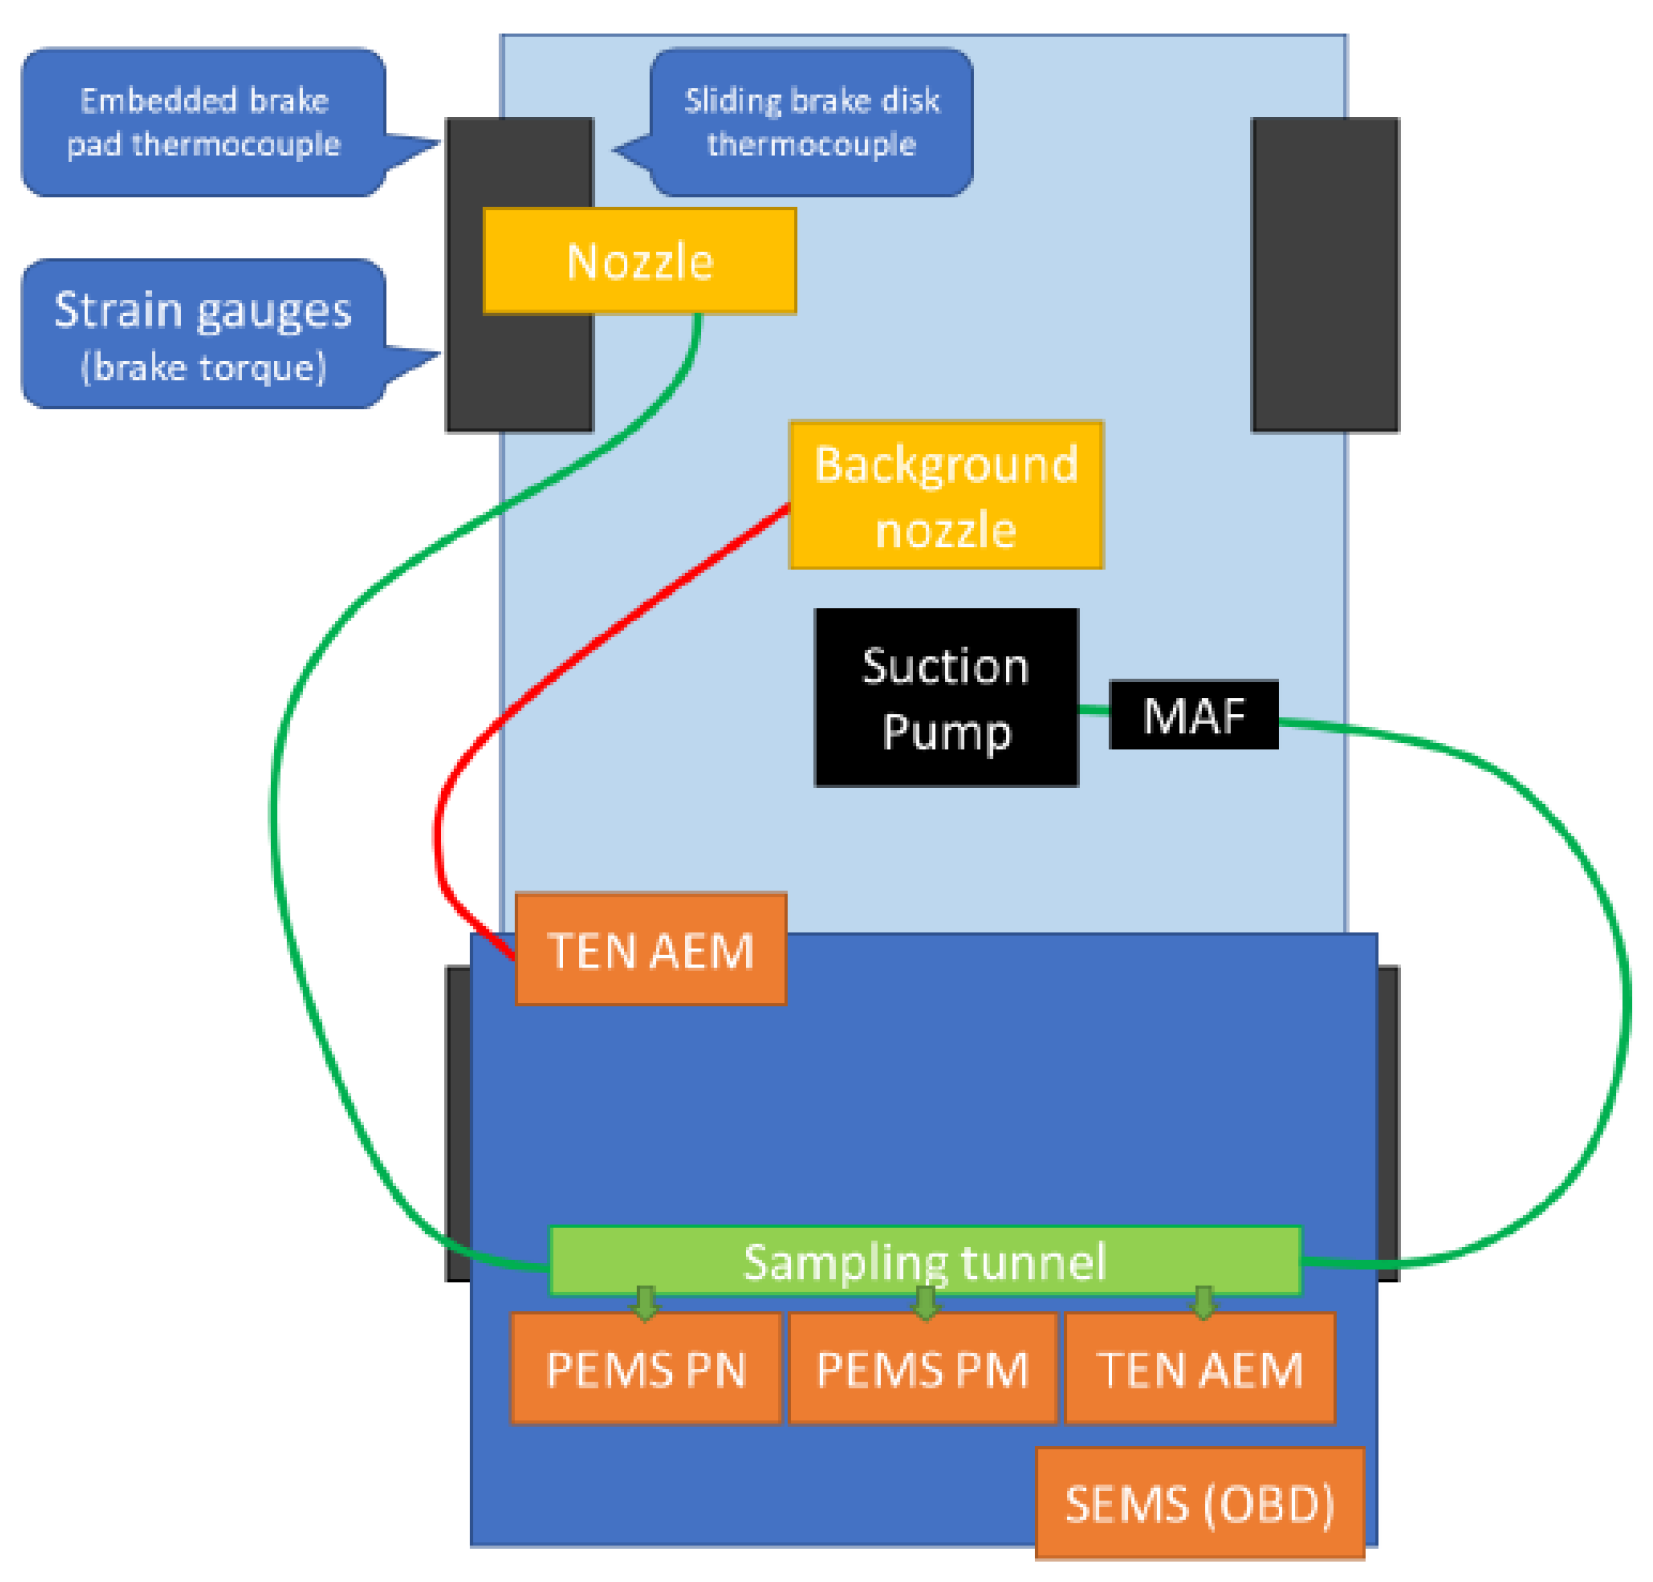
2. Measurement Setup

This section outlines the setup used to measure the data analysed in this study. A schematic overview is provided in Figure 1, which illustrates the two primary components of the setup: the vehicles’ rear braking system and the sampling system. The measurement location was placed on the rear axle due to several considerations, including the greater available space for sampling and the higher anticipated braking force on the rear axle of a tractor compared with the front axle under normal driving conditions.
As illustrated in Figure 1, the tractor’s braking system was equipped with two temperature-monitoring sensors: a sliding thermocouple positioned on one of the brake pads and an embedded thermocouple located on the brake disc. To estimate the braking torque, a strain gauge was employed, with its signals calibrated against torque measurements obtained from a hub dynamometer (dyno). While a good correlation was observed between the strain gauge deltas and the measured torque values, it is important to note that the dyno measurements were conducted under idealised conditions with the chassis stationary and only the wheels being spun by the dyno to minimise the vibration interference.
The sampling system consisted of a custom-made nozzle attached to the brake calliper and worked in conjuction with a suction pump. Emissions were sampled from both sides of the brake disc and directed through piping to the sampling tunnel by generating a partial vacuum with a side-channel blower. Flow through the sampling system was monitored by a mass airflow (MAF) sensor.
Various measurement devices were connected to the tunnel, including a PEMS particle mass counter (PEMS PM), a PEMS particle number counter (PEMS PN) and a TEN PN particle counter. Additionally, a TEN particle number counter was connected to a small sampling nozzle placed upstream of the braking system to capture background particle levels and eliminate instances of external high emissions sources from the data. Because of the positioning of the background nozzle, it is emphasised that this signal could not be used (and was not used) to determine the background particle levels at the brake in between braking events. The entire setup was linked to the vehicle via a standardised OBD connector, enabling data extraction and logging on a SEMS device.

2.1. Description of Dataset

About 1400 km were driven with the measurement setup. As percentages of the total distance, about 65% of the kilometres were driven on the motorway, about 25% on rural roads and about 10% on urban roads. The VSS signal from the OBD was used for the vehicle speed and acceleration. Since the PEMS signals and other signals could not be logged on the same device, these were aligned in the processing of the data using their respective GPS signals. Subsequently, all available signals were stored as a 1 Hz table per trip. Other signals that were used in the analysis were the brake disc temperature, braking torque and power (calculated from the strain gauges combined with the vehicle speed), PN concentrations and mass airflow through the suction tube. Lastly, road types were added to each row of the table using an open-source routing machine (OSRM) and the GPS latitude and longitude.

2.2. Reduced Pump Speeds

Some testing was performed with reduced pump speed settings at 34% of maximal capacity (or a mass airflow of about 9.4 g/s). It was observed that PN concentration peaks under comparable braking actions were lower under reduced pump speed settings. This suggests that at reduced pump speeds, not all brake wear particles were captured by the measurement setup. Whether all brake wear particles were likely captured at 100% pump speeds (or a mass airflow of about 14.4 g/s) needs to be the topic of further investigation.

3. Data Analysis Methodology

3.1. Preprocessing of the Data

The data were preprocessed. Acceleration was calculated from the vehicle velocity VSS signal. Signal drops in the temperature and MAF signals were corrected. These were easily identified as instances where the signal decreased by more than a fixed (large) threshold and replaced by linearly interpolated values. Then, braking events were identified as follows.
Definition 1. 
A braking event is a continuous subset of our dataset such that the following conditions were satisfied:
  • At every second, the mean-centred 5 s rolling average acceleration was negative;
  • At every second, the mean-centred 3 s rolling average disc temperature was increasing;
  • The overall disc temperature increase between the start and the end of the event was at least 1 ° C ;
  • The duration of the event was at least 3 s.
Definition 1 was the result of some trial and error experimentation of finding the most robust method of identifying braking in the dataset. An attempt was made to use signals available through the vehicle OBD-port, such as the Brake Pedal Position (BPP), but these were not sufficiently responsive to reliably identify braking.

3.2. Braking Event Selection Cuts

The modelling of the heating of the brake disc and the number of emitted particles during braking was performed on a selection of high-quality braking events. Without any selection cuts, the data were found to be very sensitive to noise, which was likely caused by the aforementioned vibrations and other real-world factors. The selection cuts are briefly summarised in the following. All braking events in which a negative braking torque was measured were excluded for the modelling. Furthermore, it was required that the total temperature increase during a braking event had to be at least 1 ° C . In case a temperature decrease occurred during a braking event, only the data up to the very first temperature decrease was considered. Data points were excluded within a braking event if the velocity dropped below 3 km h−1 since outlying behaviour of these data points was empirically observed. Lastly, braking events that lasted less than 10 s were excluded from our analysis to ensure a braking event had a sufficient number of data points.

3.3. Cooling Event Selection Cuts

After the brake disc heats up during braking, it cools down due to the temperature difference between the brake disc and the ambient air. Similarly to the procedure described in the previous section, the selection of high-quality cooling events for our cooling model was required. The total temperature decrease of the brake disc during a cooling event had to be at least 1 ° C . Data points within a cooling event for which the temperature decrease was less than 0.5   ° C within five subsequent seconds were excluded. Lastly, it was again required that cooling events had a total duration of at least 10 s to ensure a sufficient number of data points.

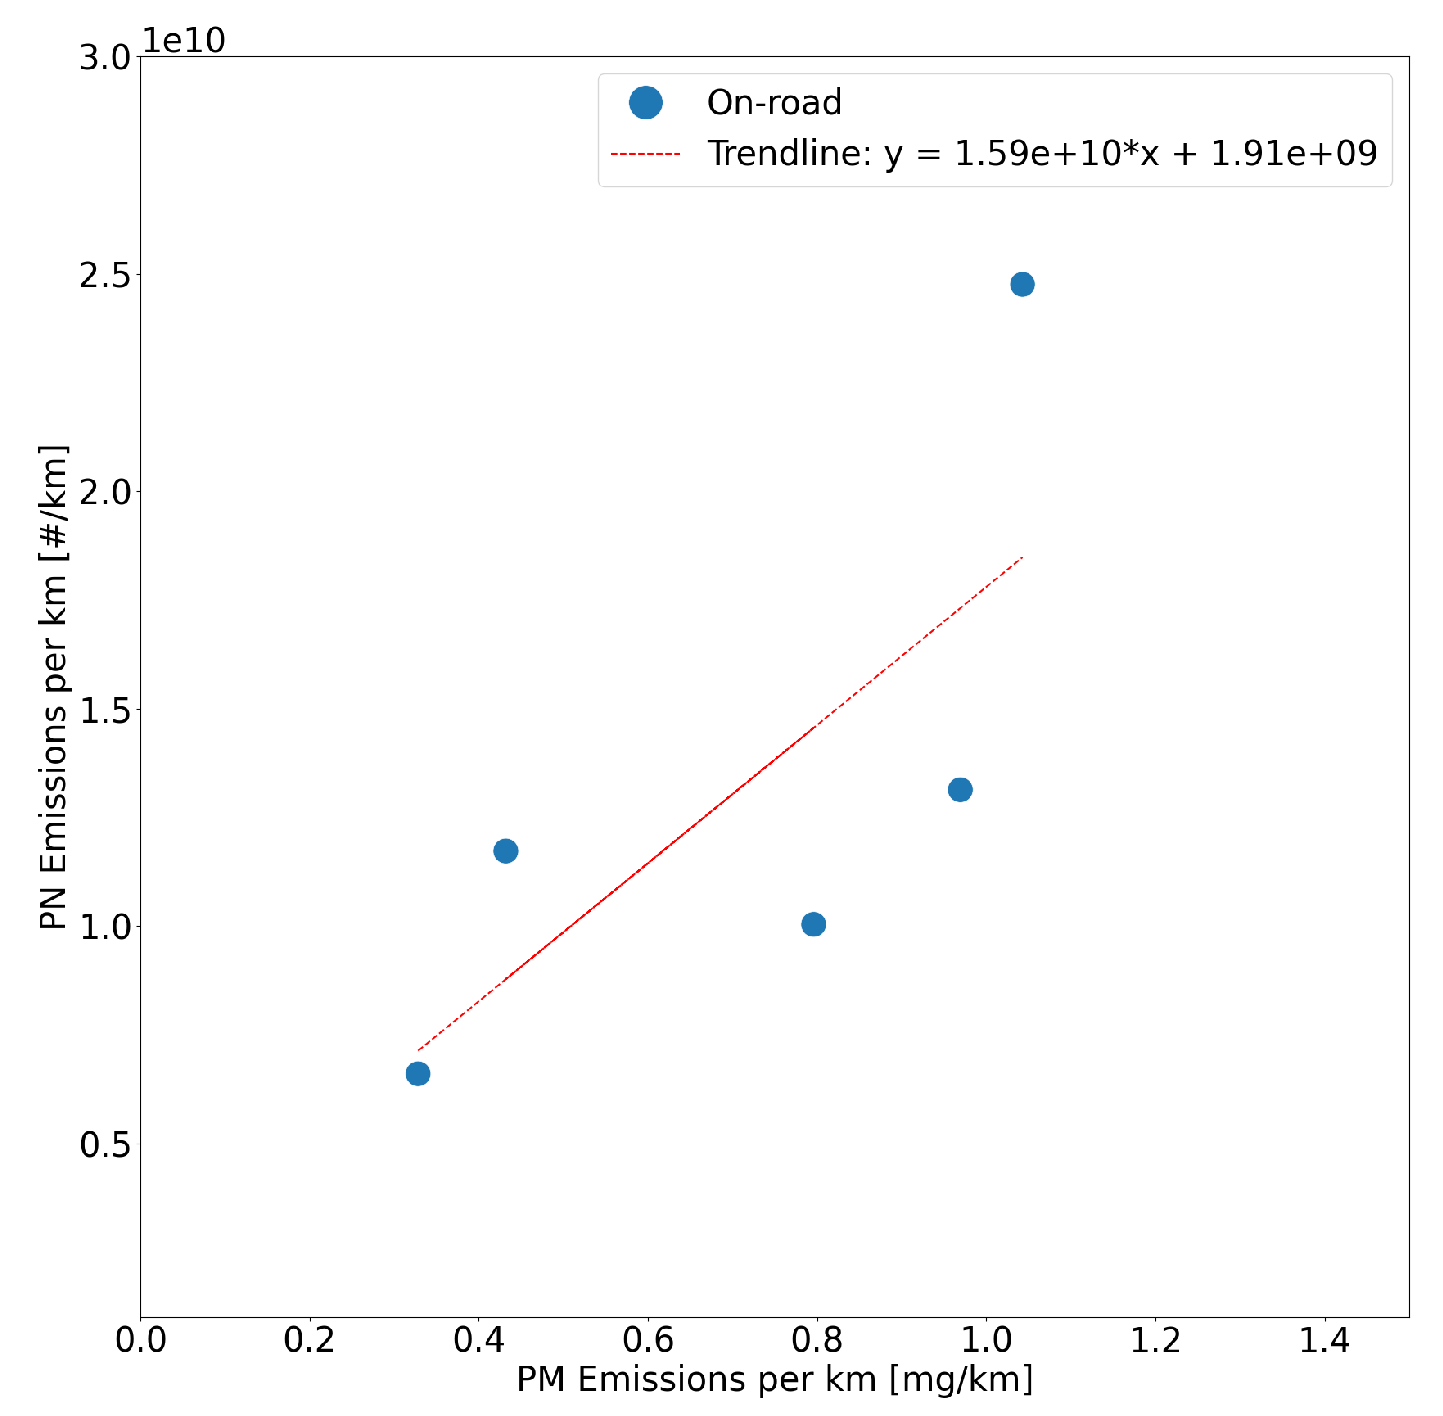
4. Temperature and Particle Number at a Trip Level

On-road testing was conducted on different types of roads, covering 151 km in urban areas, 320 km on rural roads and 915 km on the motorway. The results are shown in Figure 2. As observed, braking events were the least frequent during motorway driving, which can be attributed to minimal braking requirements and effective brake cooling due to high airflow over the brakes. Consequently, the particle number (PN) emissions were low, recorded at 1.09 × 10 9 #/km per brake. In contrast, rural driving exhibited more variation in the braking temperatures, likely due to fluctuations in the vehicle speeds and braking intensities, which ranged from light braking to more forceful actions, such as decelerating from 80 km/h to a complete stop before entering a roundabout. Urban driving resulted in the highest PN emissions, measured at 1.17 × 10 10 #/km per brake, probably due to the higher frequency of braking events and lower driving speeds. Under urban conditions, the brake temperatures showed a wide range, from nearly 0 ° C to 300 ° C , with the number of braking events per km notably higher compared with both the motorway and rural driving.
A correlation analysis was also performed to investigate the relationship between different measured and calculated variables, including PN emissions, the starting disc temperature, and the average calculated braking force and power per braking event, both before and after applying the selection cuts. The results are presented in Figure 3 and Figure 4. Notably, before filtering the data, no clear evidence of correlations was observed between the PN emissions and the other variables. This lack of correlation was likely due to the sensitivity of the measurement setup to vibrations from the brake calliper and frame during the on-road measurements. A good correlation was only found between the PEMS PN and TEN AEM concentration signals, which effectively cross-validated the PN outputs of both machines.
In contrast, after data filtering, a clear correlation was observed between the total PN emissions and total work of the braking event, providing evidence of an existing relationship between the two variables, as expected from physical principles. However, still no correlation was found between the total PN emissions of the braking event and the starting disc temperature, suggesting that any relationship between these two variables, if present, was less straightforward. In the literature (see [19], p. 73), so-called transition temperatures were observed for heavy-duty disc brakes. After such a temperature threshold was crossed, a sharp increase was observed in the particle number concentration. Below the transition temperatures, the particle number concentrations were near constant. A possible explanation for not finding a relationship between the temperature and PN emissions in our on-road tests was that under real-world on-road conditions, the transition temperatures of the brake discs were never reached.
Finally, a comparison between the PN and PM emission measurements through filter weighting at the end of the on-road tests was also conducted. Teflo filters were used consistently in all cases. The results of both measurements for each trip are presented in Table 1. Additionally, one trip was excluded from the analysis, as its PM results were considered significant outliers compared with the rest. It is important to note that unlike the PN analysis presented earlier, non-braking emissions could not be excluded in this case, potentially leading to slightly elevated results. Conversely, uncertainty regarding whether the measurement setup captured all the generated braking emissions may have contributed to an underestimation of the reported values.
Figure 5 illustrates the relationship between PM and PN emissions, with a fitted trendline. Each point represents a single trip. Despite the limited number of data points, a correlation between the particle number and particle mass was observed, as expected.

5. Modelling Disc Brake Heating and Cooling at the Brake Event Level

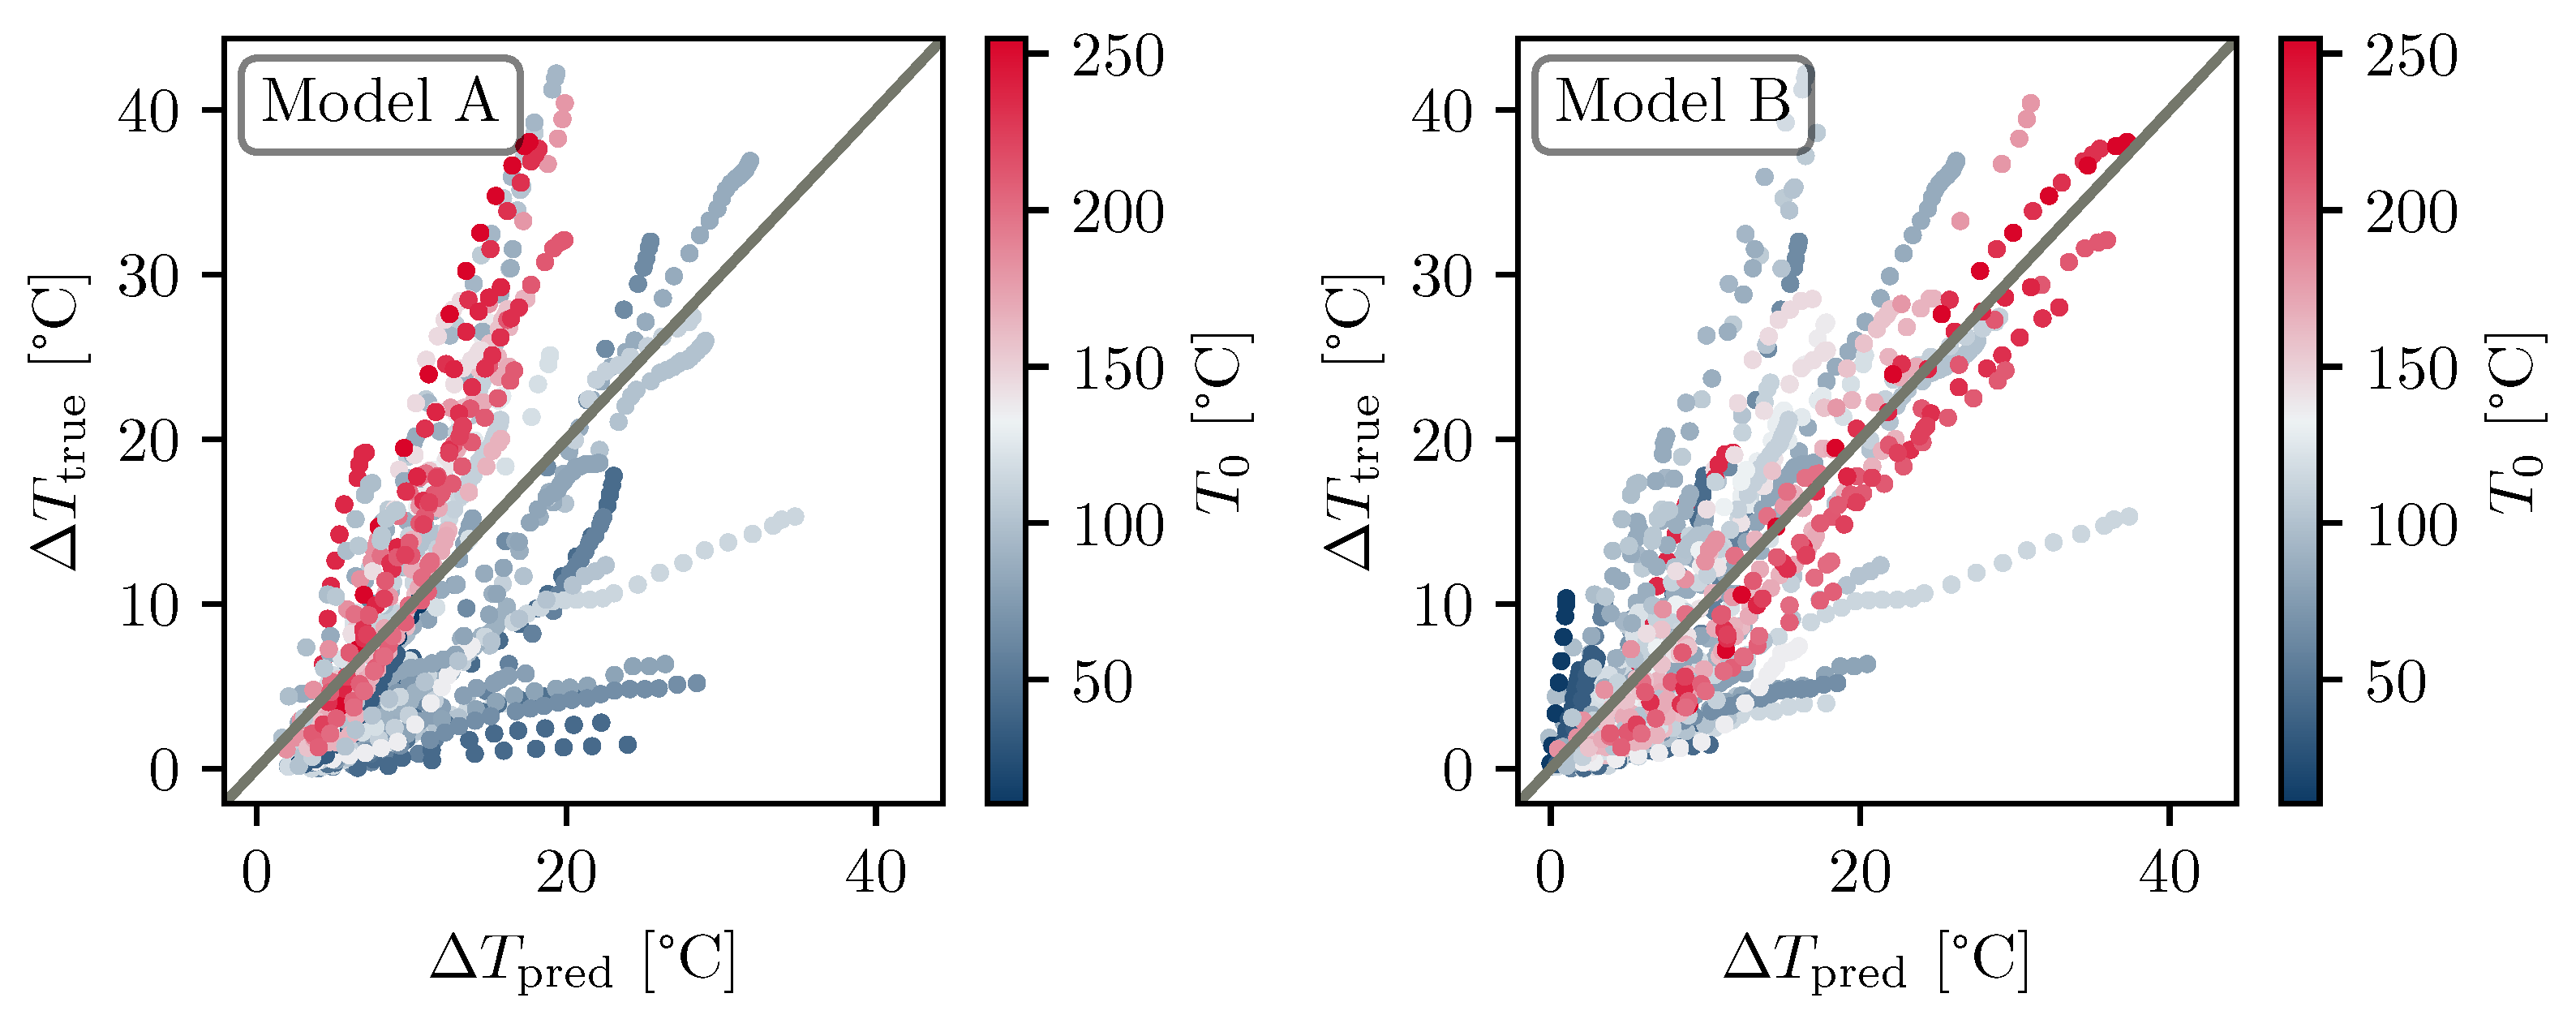
5.1. Disc Brake Heating

For each braking event, the temperature difference Δ T i between the initial disc temperature T 0 and the disc temperature T i at a specific time t i , defined as Δ T i = T i T 0 , was calculated. The temperature of the disc was expected to be proportional to the braking work W i given by
Δ T i W i = t 0 t i P ( t ) d t = t 0 t i τ ( t ) · ω ( t ) d t = t 0 t i ( F ( t ) × r ) · ω ( t ) d t
where t 0 is the starting time of the braking event; P is the braking power; τ is the braking torque; ω is the angular velocity of the wheel; F is the braking force; and r is the position vector, representing the radius of the wheel perpendicular to ω . As a first approach, which is referred to as model A in the following, the disc temperature Δ T i was fitted as a linear function of the braking work W i via
Δ T i ( W i ) = a 1 W i + a 2
using the least squares method, where a 1 and a 2 are the free model parameters that were optimised during the fit. The model was fitted using all braking events that met the selection criteria described in Section 3.2 simultaneously. The best-fit model parameters for model A are given in Table 2.
To evaluate the performance of our model, the mean squared error ξ MSE , mean absolute error ξ MAE and mean relative error ξ MRE were calculated, which are defined as
ξ MSE = 1 n i = 1 n ( y i , true y i , pred ) 2 ,
ξ MAE = 1 n i = 1 n | y i , true y i , pred | ,
ξ MRE = 1 n i = 1 n y i , true y i , pred y i , true ,
where y i , true describes the true (measured) values and y i , pred describes the prediction by the model. The evaluation parameters for model A are stated in Table 3.
Figure 6 (left) shows the true (measured) disc temperatures Δ T true versus the predicted disc temperatures Δ T pred from model A. The colour of each data point represents the initial temperature T 0 of the braking event. This figure clearly shows many individual braking events, distinguishable by their identical initial temperature T 0 . The results from model A indicate that there was a clear correlation between the temperature of the disc Δ T i and the braking work W i . Furthermore, one can observe a noticeable pattern in the initial temperature distribution of the data points. Data points for which the model underestimates the disc temperature (data points below the grey line) tended to have small initial temperatures. On the other hand, data points for which the model overestimates the disc temperature (data points above the grey line) tended to have high initial temperatures. Based on this observation, a model was introduced that also takes the initial temperature of the disc T 0 into account. This model is referred to as model B and is defined as
Δ T i ( W i ) = a 1 T 0 α W i + a 2 ,
where a 1 , a 2 and α are the model parameters that were optimised during the fit. Note that Figure 6 shows that the slope (i.e., the a 1 term) shows a temperature dependence for Model A. Therefore, it was decided to introduce the T 0 α term in front of W i in the above equation, allowing the slope to vary with different starting temperatures. The best-fit parameters and evaluation parameters for model B can be found in Table 2 and Table 3, respectively. Figure 6 (right) shows the true disc temperatures Δ T true versus the predicted disc temperatures Δ T pred from model B. It is evident both visually from Figure 6 and from our evaluation parameters that model B significantly improved the fit. By introducing the initial disc temperature to our model, the MAE improved by 24 % , the MSE by 36 % and the MRE by 50 % . Since our best-fit model resulted in Δ T i T 0 0.9 , it follows that the temperature of the disc increased more rapidly during a braking event for higher initial temperatures of the disc T 0 . High initial temperatures T 0 may indicate that there was heating energy stored within the system (sometimes referred to as “bulk” temperature), such as the nozzle, brake calliper, frame axle or wheel, which allowed the measured disc surface temperature to rise quicker for the same amount of braking power W. The dependence on the initial temperatures T 0 may, therefore, be thought of as “historical effect” encoding braking that has happened before the braking action under consideration started.

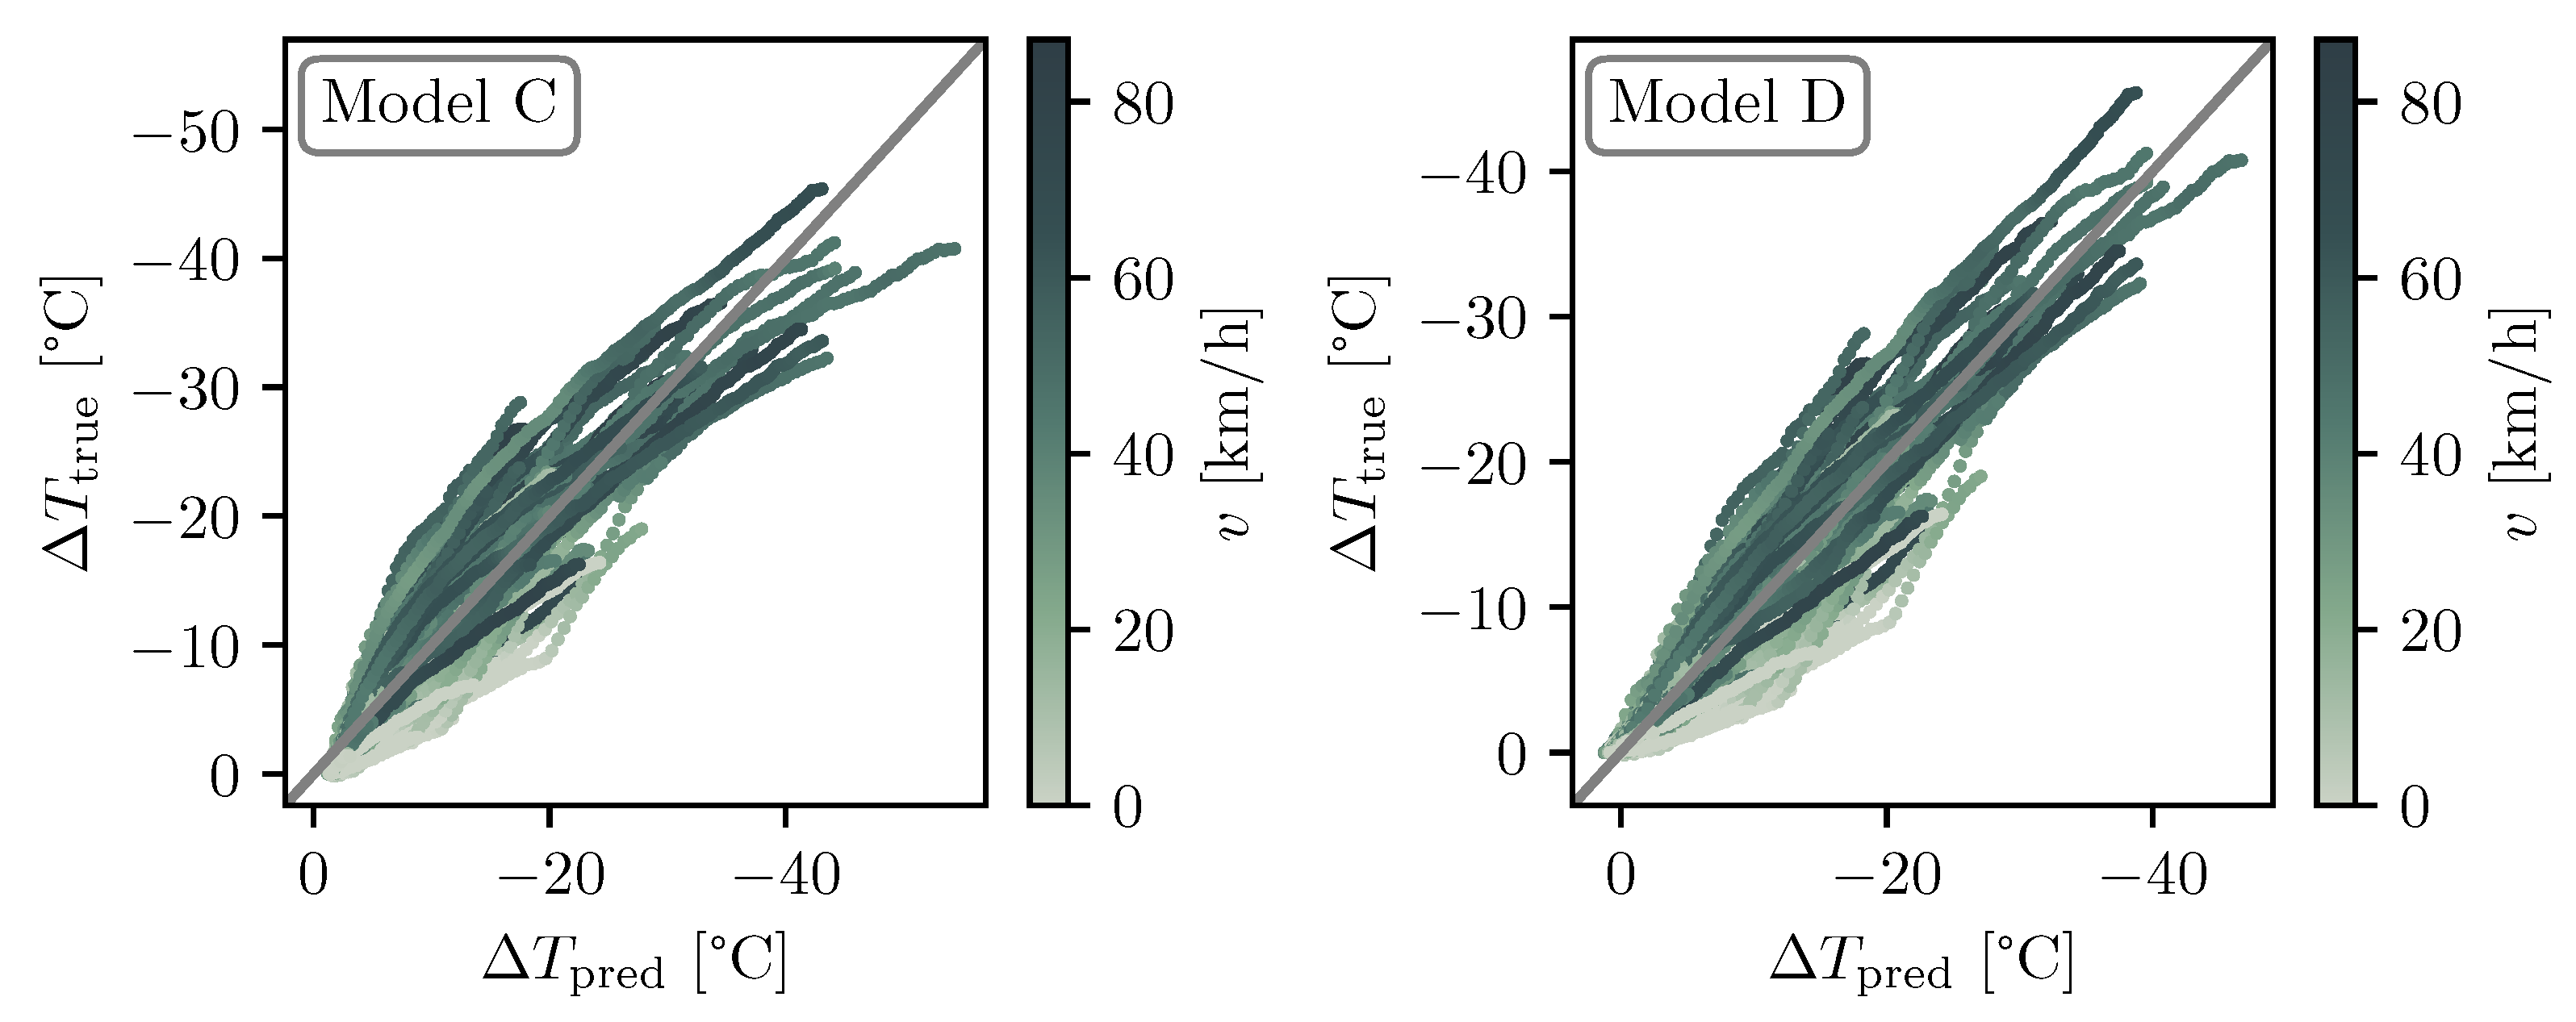
5.2. Disc Brake Cooling

The cooling of the brake disc was expected to be mainly influenced by convective heat transfer to the ambient air. The convective heat transfer depends on the surface area of the brake disc, the velocity of the vehicle, and the difference between the brake disc temperature and the ambient air temperature. Since the surface area of the brake disc was constant within our setup, the surface area was not included as a variable parameter in our model. For reasons that will be explained later in this paragraph, the velocity of the vehicle was also not included in our model. Therefore, first, a cooling term was defined as the difference between the brake disc temperature T and the temperature of the ambient air T amb integrated from the starting time t 0 of the cooling event up to a given time t i via
Q i = t 0 t i ( T ( t ) T amb ( t ) ) d t .
As a first approach, the temperature difference Δ T i was fitted as a linear function of the cooling term Q i via
Δ T i ( Q i ) = b 1 Q i + b 2
using the least squares method, where b 1 and b 2 are the free model parameters. The model was fitted using all cooling events that met the selection criteria described in Section 3.3 simultaneously. This model is referred to as model C in the following. The best-fit model parameter and the corresponding evaluation parameters are given in Table 4 and Table 5, respectively.
Figure 7 (left) shows the true (measured) disc temperatures Δ T true versus the model predicted disc temperatures Δ T pred from model C. The colour of each data point represents the current velocity v of the vehicle. The results shown in Figure 7 (left) indicate that the model in Equation Model C described the brake disc cooling fairly well. Notably, adding the velocity of the vehicle v to the model did not improve the model performance. This phenomenon can be attributed to the velocity distribution illustrated in Figure 7 (left). Given the absence of a notable correlation in the velocity distribution of the data points, the integration of velocity into the model was not expected to improve its performance. Furthermore, a non-linear correlation between the true and model-predicted values was observed. The introduction of an additional radiation cooling term proportional to T ( t ) 4 T amb ( t ) 4 did not improve the model. In order to account for the non-linear behaviour of the data, model D is introduced as
Δ T i ( Q i ) = b 1 Q i β + b 2 .
where b 1 , b 2 and β are the free model parameters. The best-fit model parameter and the corresponding evaluation parameters are given in Table 4 and Table 5, respectively. The true (measured) disc temperatures Δ T true versus the model predicted disc temperatures Δ T pred from model D are shown in Figure 7 (right). Model D improved the MAE by 9 % , the MSE by 13 % and the MRE by 50 % . Similarly to our explanation in Section 5.1, suppose that the non-linear behaviour of the temperature cooling might be related to the complexity of the experimental setup. Several factors, such as the uneven distribution of heat energy within the system, the limitation of the temperature measurements of the disc’s surface, or variations in the material properties and external environmental conditions may have also played significant roles in influencing the cooling dynamics and could contribute to the observed non-linearity.

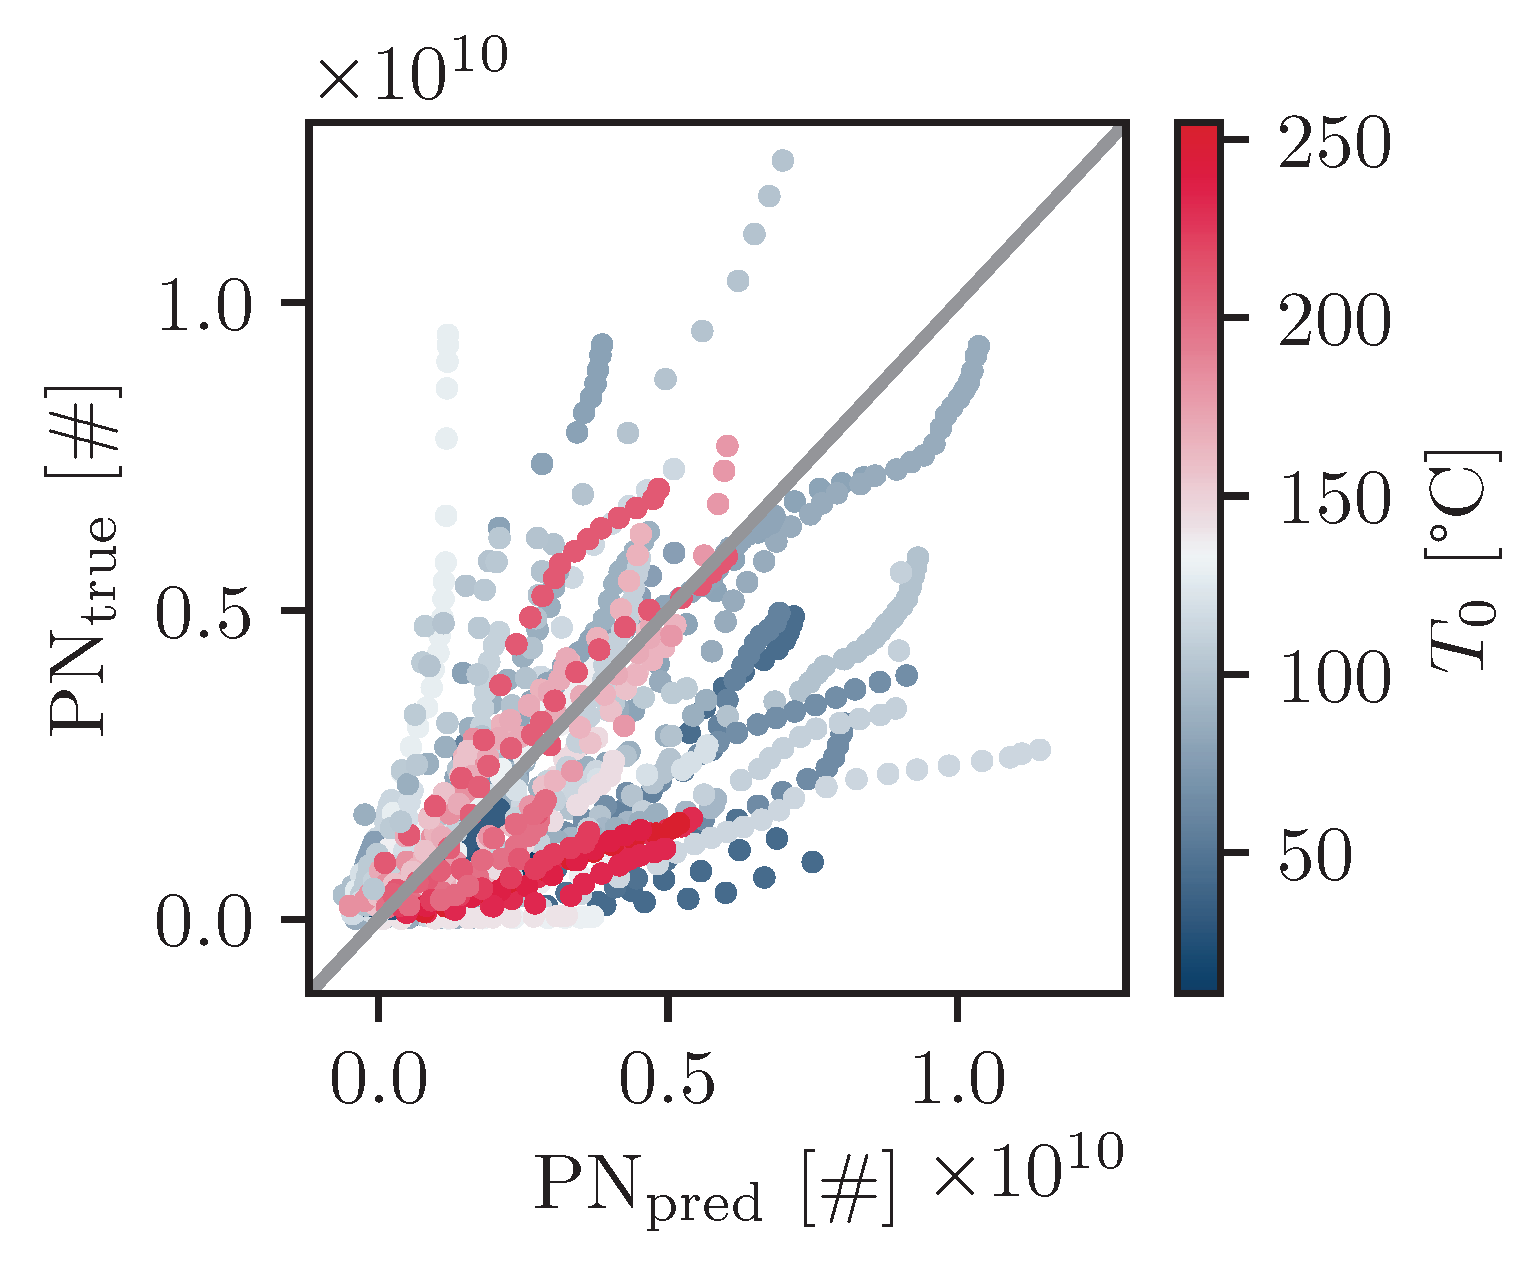
6. Modelling Particle Number Under Braking

Throughout this section, only the PN emissions of a single brake of the tractor trailer are considered. For each braking event, the number of particles PNi emitted up to a given time t i is determined via
PN i = t 0 t i dPN d t ,
where t 0 is the starting time of the braking event and dPN / d t is the particle number emission rate per unit time. Note that total particle number counts result from combining the PEMS PN-measured particle concentrations and the MAF sensor outputs to convert these into total particle number emmissions. Similar to the brake heating, the particle number was expected to be proportional to the braking work, i.e., PN i W i , so the particle number PN i was modelled as a linear function of the braking work W i via
PN i ( W i ) = c 1 W i + c 2
using the least squares method, where c 1 and c 2 are the free model parameters. In contrast to the disc heating model, the particle emission model was fitted for each braking event individually to obtain a best-fit values for c 1 and c 2 for each braking event. Afterwards, their mean and standard error on the mean were calculated to obtain a single best-fit value for both parameters c 1 and c 2 . The best-fit model parameters and evaluation parameters for the particle number fit are shown in Table 6 and Table 7.
Figure 8 shows the true (measured) particle numbers PNtrue versus the predicted particle numbers PNpred of all braking events, where the data points are colour-coded according to the initial temperature T 0 of each braking event. The figure clearly illustrates a positive correlation between the emitted particle numbers and the braking work. In contrast to the disc temperature model, however, the distribution of the initial temperature T 0 within Figure 8 did not show an obvious pattern. Therefore, an extension of the model by adding disc-temperature-related parameters similar to Model B did not result in a significant performance improvement and is thus not further discussed in this work.

7. Conclusions

In this paper, an analysis of data collected during an on-road measurement campaign with a (heavy-duty) tractor trailer is presented. About 1400 kilometres were driven with the tractor under varying conditions. Some of the main takeaways of this analysis may be summarized as follows:
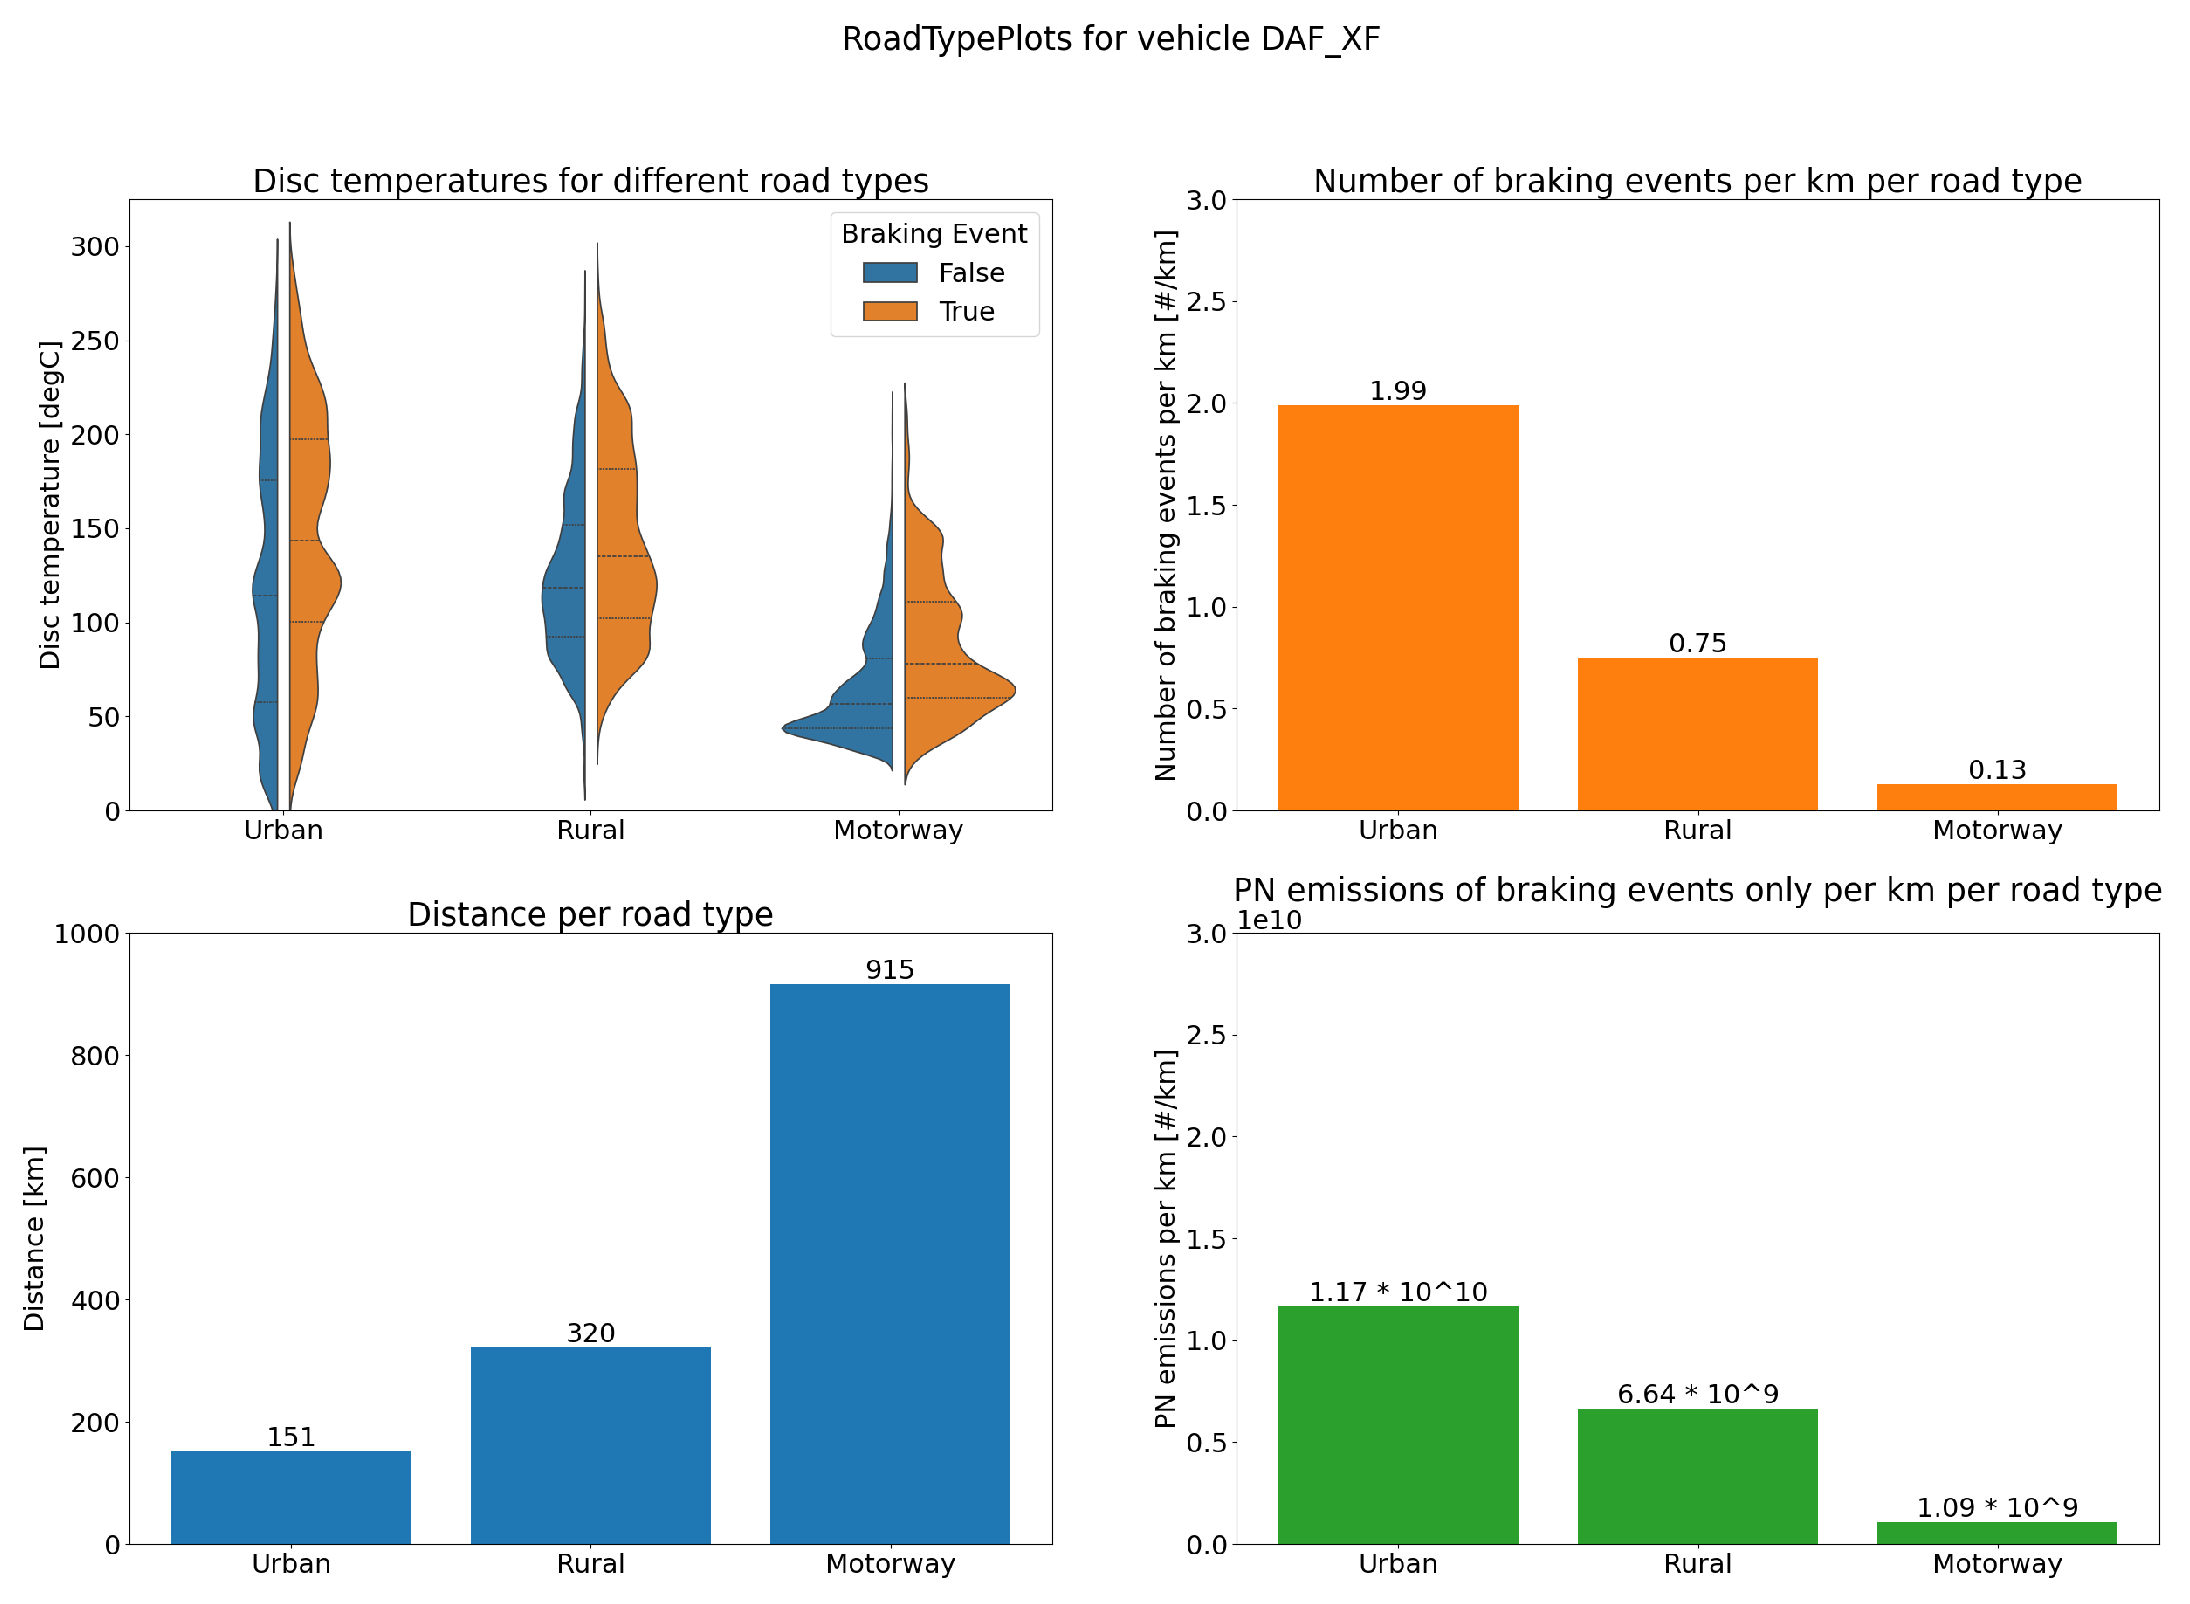
  • When distinguishing three different road types ‘Urban’, ‘Rural’ and ‘Motorway’, the highest average brake disc temperatures and the most braking actions per kilometre were observed on urban roads. Conversely, the lowest average temperatures and the lowest number of braking events per kilometre were observed on the motorway.
  • In line with the first result, the highest particle number emissions per kilometre per brake of 1.17 × 10 10 were seen on urban roads. These were followed by rural roads with 6.64 × 10 9 particles per kilometre per brake. Lastly, on the motorway, the lowest particle number emissions of 1.09 × 10 9 particles per kilometre per brake were observed.
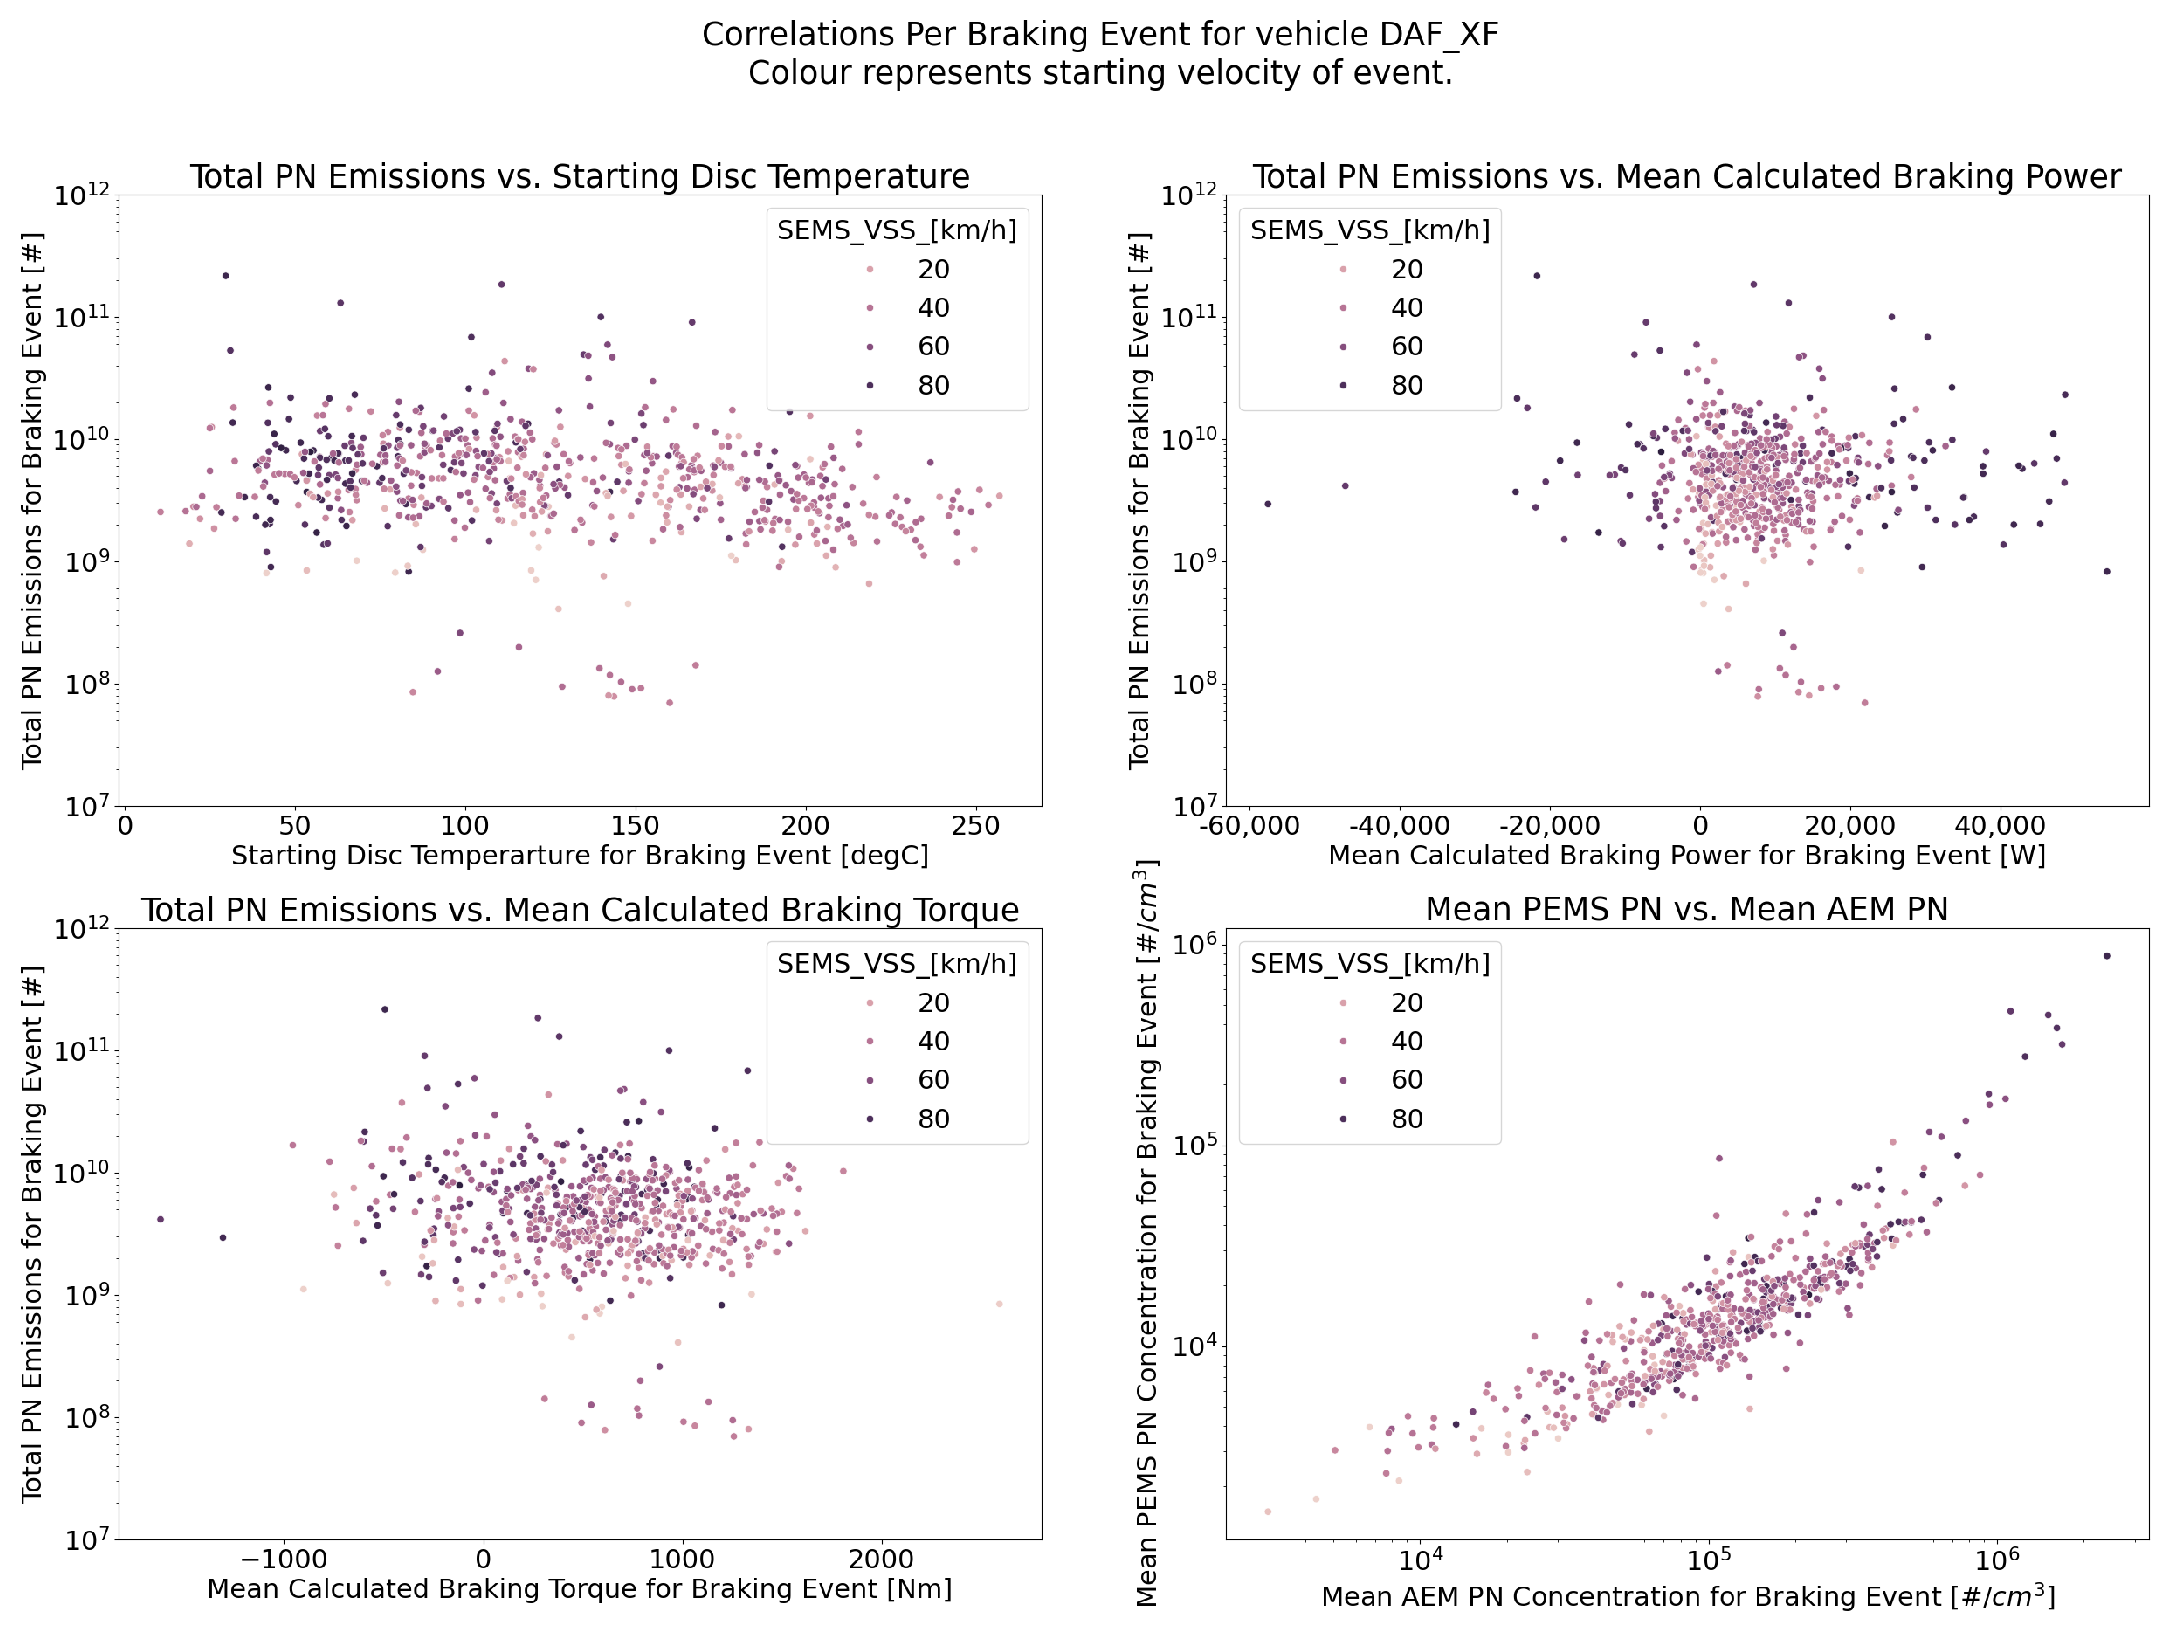
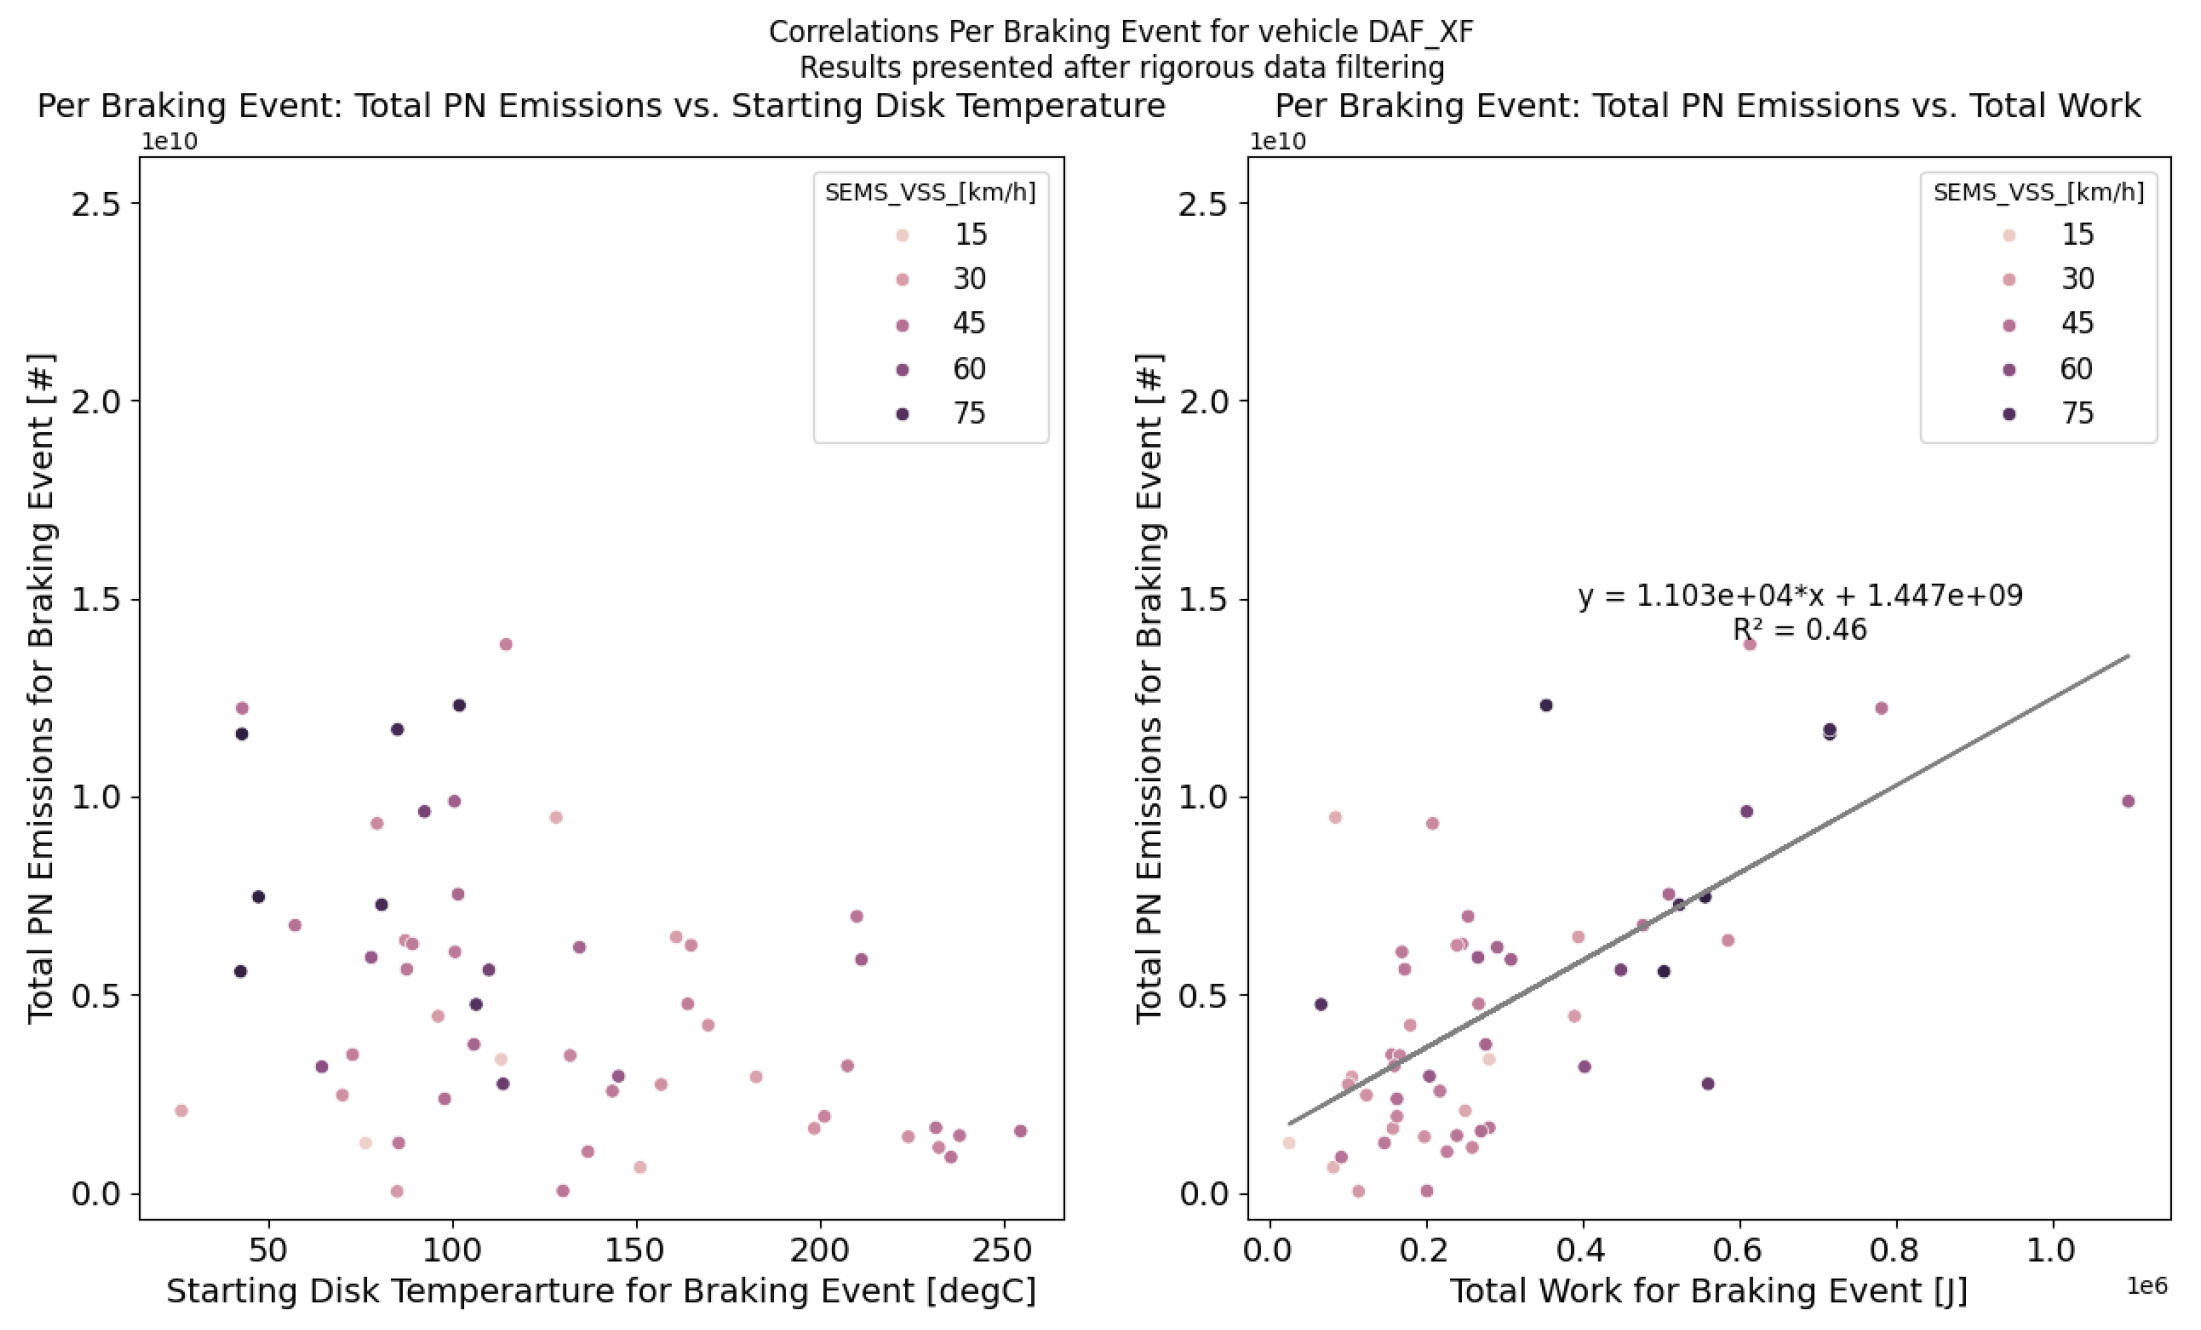
  • Rigorous filtering of the data was necessary to be able to establish the expected correlations from physical principles. A possible source of noise was vibrations introduced during the on-road measurements.
  • A relationship was established between the braking work applied on the braking disc during the braking action and the PN emissions of the braking action.
  • When modelling the heating of the (surface) temperature of the brake disc, a dependence on the braking work was observed. The results were improved if a further dependence on the initial temperature of the brake disc at the start of the braking event was introduced so that the modelled temperatures were allowed to rise more quickly. This may have been due to the fact that this term encoded the ‘historic braking actions’ in some sense, which added energy to the bulk, allowing temperatures to rise more quickly during a new braking action.
  • When modelling the cooling of the disc’s (surface) temperature, a non-linear dependence on the temperature difference between the brake disc temperature and the ambient air temperature was found. No clear evidence was found in the data for a dependence on the vehicle velocity.
To the best of the knowledge of the authors, these were among the first on-road brake wear measurements on a heavy-duty vehicle. It is clear that more research is needed in this area and there is room for improvement in the measurement setup. On the other hand, valuable data and insights were collected during this measurement campaign and following analysis, which are presented in this paper.

Author Contributions

M.F.A.S. led this research and performed most of the processing of the measurement data, as well as the initial analyses. J.A. performed analyses for better filtering of the data and the modelling presented above. A.P. performed some of the analyses at a trip level. All three authors made substantial contributions to the writing of this paper. All authors have read and agreed to the published version of the manuscript.

Funding

The research in this paper was based on data collected in the EU P012101 Pilot project—Feasibility study on reduction of traffic-related particulate emissions by means of vehicle-mounted fine dust filtration funded by the European Parliament.

Institutional Review Board Statement

Not applicable.

Informed Consent Statement

Not applicable.

Data Availability Statement

The original contributions presented in this study are included in the article. Further inquiries can be directed to the corresponding author(s).

Acknowledgments

The authors are grateful to Quinn Vroom for his feedback, comments and suggestions on an early version of this paper. The authors are also grateful to Remco Gijseman and Lex Verberne for their support at different stages of this research.

Conflicts of Interest

The authors declare no conflicts of interest.

References

  1. Frateur, T. Health Effects of Brake Wear Particle Emissions. Informal Document GRPE-90-30. 2024. Available online: https://unece.org/sites/default/files/2024-01/GRPE-90-30e.pdf (accessed on 1 May 2025).
  2. Wahid, S.M. Automotive brake wear: A review. Environ. Sci. Pollut. Res. 2018, 25, 174–180. [Google Scholar] [CrossRef] [PubMed]
  3. Peters, A.; Wichmann, H.E.; Tuch, T.; Heinrich, J.; Heyder, J. Respiratory effects are associated with the number of ultrafine particles. Am. J. Respir. Crit. Care Med. 1997, 155, 1376–1383. [Google Scholar] [CrossRef] [PubMed]
  4. Amato, F.; Cassee, F.R.; Van Der Gon, H.A.D.; Gehrig, R.; Gustafsson, M.; Hafner, W.; Harrison, R.M.; Jozwicka, M.; Kelly, F.J.; Moreno, T.; et al. Urban air quality: The challenge of traffic non-exhaust emissions. J. Hazard. Mater. 2014, 275, 31–36. [Google Scholar] [CrossRef] [PubMed]
  5. Grigoratos, T.; Martini, G. Brake wear particle emissions: A review. Environ. Sci. Pollut. Res. 2015, 22, 2491–2504. [Google Scholar] [CrossRef] [PubMed]
  6. Akhbarizadeh, R.; Dobaradaran, S.; Torkmahalleh, M.A.; Saeedi, R.; Aibaghi, R.; Ghasemi, F.F. Suspended fine particulate matter (PM2. 5), microplastics (MPs), and polycyclic aromatic hydrocarbons (PAHs) in air: Their possible relationships and health implications. Environ. Res. 2021, 192, 110339. [Google Scholar] [CrossRef] [PubMed]
  7. Sridharan, S.; Kumar, M.; Singh, L.; Bolan, N.S.; Saha, M. Microplastics as an emerging source of particulate air pollution: A critical review. J. Hazard. Mater. 2021, 418, 126245. [Google Scholar] [CrossRef] [PubMed]
  8. Shaddick, G.; Thomas, M.L.; Mudu, P.; Ruggeri, G.; Gumy, S. Half the world’s population are exposed to increasing air pollution. NPJ Clim. Atmos. Sci. 2020, 3, 23. [Google Scholar] [CrossRef]
  9. West, J.J.; Cohen, A.; Dentener, F.; Brunekreef, B.; Zhu, T.; Armstrong, B.; Bell, M.L.; Brauer, M.; Carmichael, G.; Costa, D.L.; et al. What we breathe impacts our health: Improving understanding of the link between air pollution and health. Environ. Sci. Technol. 2016, 50, 4895–4904. [Google Scholar] [CrossRef] [PubMed]
  10. Costa, L.G.; Cole, T.B.; Coburn, J.; Chang, Y.C.; Dao, K.; Roqué, P.J. Neurotoxicity of traffic-related air pollution. Neurotoxicology 2017, 59, 133–139. [Google Scholar] [CrossRef] [PubMed]
  11. Von Schneidemesser, E.; Monks, P.S.; Allan, J.D.; Bruhwiler, L.; Forster, P.; Fowler, D.; Lauer, A.; Morgan, W.T.; Paasonen, P.; Righi, M.; et al. Chemistry and the linkages between air quality and climate change. Chem. Rev. 2015, 115, 3856–3897. [Google Scholar] [CrossRef] [PubMed]
  12. Fiore, A.M.; Naik, V.; Leibensperger, E.M. Air quality and climate connections. J. Air Waste Manag. Assoc. 2015, 65, 645–685. [Google Scholar] [CrossRef] [PubMed]
  13. Baensch-Baltruschat, B.; Kocher, B.; Stock, F.; Reifferscheid, G. Tyre and road wear particles (TRWP)—A review of generation, properties, emissions, human health risk, ecotoxicity, and fate in the environment. Sci. Total Environ. 2020, 733, 137823. [Google Scholar] [CrossRef] [PubMed]
  14. Denier van der Gon, H.A.; Gerlofs-Nijland, M.E.; Gehrig, R.; Gustafsson, M.; Janssen, N.; Harrison, R.M.; Hulskotte, J.; Johansson, C.; Jozwicka, M.; Keuken, M.; et al. The policy relevance of wear emissions from road transport, now and in the future—An international workshop report and consensus statement. J. Air Waste Manag. Assoc. 2013, 63, 136–149. [Google Scholar] [CrossRef] [PubMed]
  15. Yin, J.; Xu, Z.; Wei, W.; Jia, Z.; Fang, T.; Jiang, Z.; Cao, Z.; Wu, L.; Wei, N.; Men, Z.; et al. Laboratory measurement and machine learning-based analysis of driving factors for brake wear particle emissions from light-duty electric vehicles and heavy-duty vehicles. J. Hazard. Mater. 2025, 488, 137433. [Google Scholar] [CrossRef] [PubMed]
  16. Koupal, J.; DenBleyker, A.; Kishan, S.; Vedula, R.; Agudelo, C.; Eastern Research Group, Inc.; LINK Engineering Company; California, Department of Transportation, Division of Research, Innovation, and System Information. Brake Wear Particulate Matter Emissions Modeling; Technical Report; California Department of Transportation, Division of Research and Innovation: Sacramento, CA, USA, 2021.
  17. United Nations. Proposal for a New Amendment to UN Global Technical Regulation No. 24 (Laboratory Measurement of Brake Emissions for LightDuty Vehicles). 2024. pp. 1–174. Available online: https://unece.org/sites/default/files/2024-11/ECE-TRANS-WP29-GRPE-2024-04e.pdf (accessed on 1 May 2025).
  18. European Union. Regulation (EU) 2024/1257 of the European Parliament and of the Council of 24 April 2024 on Type-approval of Motor Vehicles and Engines and of Systems, Components and Separate Technical Units Intended for such Vehicles, with Respect to their Emissions and Battery Durability (Euro 7), Amending Regulation (EU) 2018/858 of the European Parliament and of the Council and Repealing Regulations (EC) No 715/2007 and (EC) No 595/2009 of the European Parliament and of the Council, Commission Regulation (EU) No 582/2011, Commission Regulation (EU) 2017/1151, Commission Regulation (EU) 2017/2400 and Commission Implementing Regulation (EU) 2022/1362. Available online: http://data.europa.eu/eli/reg/2024/1257/oj (accessed on 7 May 2025).
  19. Gijseman, R.; Vroom, Q.; Steinmetz, M.F.; Boukallouht, Z.; Kranendonk, M.; Dimaratos, A.; Saltas, E.; Tsakonas, G.; Samaras, Z.; Mamarikas, S.; et al. PP012101 Pilot Project—Feasibility Study on Reduction of Traffic-Related Particulate Emissions by Means of Vehicle-Mounted Fine Dust Filtration. Technical report. TNO, Horiba, KTH, LAT and e:misia, 2025. Funded by the European Union. Available online: https://resolver.tno.nl/uuid:32e22274-a482-4668-9b8d-d23cd078b908 (accessed on 1 May 2025).
  20. Hagino, H.; Oyama, M.; Sasaki, S. Laboratory testing of airborne brake wear particle emissions using a dynamometer system under urban city driving cycles. Atmos. Environ. 2016, 131, 269–278. [Google Scholar] [CrossRef]
  21. Lee, E.S.; Sahay, K.; O’Neil, E.; Biswas, S.; Dzhema, I.; Huang, S.M.; Lin, P.; Chang, M.C.O.; Huai, T. Tracer-Gas-Integrated Measurements of Brake-Wear Particulate Matter Emissions from Heavy-Duty Vehicles. Environ. Sci. Technol. 2023, 57, 15968–15978. [Google Scholar] [CrossRef] [PubMed]
Figure 1. Schematic overview of the measurement setup.
Atmosphere 16 00561 g001
Figure 2. Analysis of on-road test results categorised by road type. The PN emissions are the emissions of a single brake only.
Atmosphere 16 00561 g002
Figure 3. Analysis of correlations between variables before applying the selection cuts. All variables refer to measured values for a single brake only.
Atmosphere 16 00561 g003
Figure 4. Analysis of the correlations between variables after applying the selection cuts. The listed temperature, work and PN emissions refer to a single brake only.
Atmosphere 16 00561 g004
Figure 5. Comparison of the on-road PM emissions with the PN emissions. These are the emissions of a single brake only.
Atmosphere 16 00561 g005
Figure 6. True (measured) disc temperatures Δ T true versus the predicted disc temperatures Δ T pred from model A (left) and model B (right). The colour of the data points represents the initial temperature T 0 of the braking event.
Atmosphere 16 00561 g006
Figure 7. True (measured) disc temperatures Δ T true versus the model-predicted disc temperatures Δ T pred for the temperature cooling events from model C (left) and model D (right). The colour of the data points represents the velocity v of the vehicle. Note that the x- and y-axes are inverted, i.e., they show decreasing temperatures from left to right and bottom to top, respectively.
Atmosphere 16 00561 g007
Figure 8. True (measured) particle numbers PNtrue versus the model predicted particle numbers PNpred. The colour of the data points represents the initial temperature T 0 of the braking event.
Atmosphere 16 00561 g008
Table 1. Comparison of filter weight measurements and PN emissions. The listed emissions are the emissions per kilometre per brake.
TripDistance
[km]
PM Emissions
[mg/km]
PN Emissions
[#/km]
Trip A406.290.33 6.60 × 10 9
Trip B196.630.80 1 × 10 10
Trip C122.210.43 1.17 × 10 10
Trip D114.090.97 1.31 × 10 10
Trip E135.871.04 2.48 × 10 10
Table 2. Best-fit model parameters for the disc brake heating model.
Best-Fit Parameters
Model a 1  [°CJ−1] a 2  [°C] α
Model A ( 5.9 ± 0.3 ) × 10 5 1.5 ± 0.5 -
Model B ( 9.4 ± 1.7 ) × 10 7 0.2 ± 0.3 ( 9.0 ± 0.3 ) × 10 1
Table 3. Evaluation parameters for the disc brake heating model.
Model ξ MSE ξ MAE ξ MRE
Model A51.85.41.8
Model B33.14.10.9
Table 4. Best-fit model parameters for the disc brake cooling model.
Best-Fit Parameters
Model b 1  [°CJ−1] b 2   [°C] β
Model C ( 2.05 ± 0.01 ) × 10 3 1.15 ± 0.04 -
Model D ( 2.22 ± 0.12 ) × 10 2 1.46 ± 0.08 ( 7.56 ± 0.05 ) × 10 1
Table 5. Evaluation parameters for the disc brake cooling model.
Model ξ MSE ξ MAE ξ MRE
Model C8.42.20.8
Model D7.32.00.4
Table 6. Best-fit model parameters for the particle number (PN) model. The PN emissions of a single brake were modelled.
c 1 [#/J] c 2 [#]
( 2.2 ± 0.2 ) × 10 4 ( 6.3 ± 1.0 ) × 10 8
Table 7. Evaluation parameters for the particle number (PN) model.
ξ MSE ξ MAE ξ MRE
4.5 × 10 18 1.5 × 10 9 3.3
Disclaimer/Publisher’s Note: The statements, opinions and data contained in all publications are solely those of the individual author(s) and contributor(s) and not of MDPI and/or the editor(s). MDPI and/or the editor(s) disclaim responsibility for any injury to people or property resulting from any ideas, methods, instructions or products referred to in the content.

