
Evaluation and Mapping of Snow Characteristics Using Remote Sensing Data in Astore River Basin, Pakistan

 ,
,  , ,
, ,  and
and 
Abstract
1. Introduction
2. Materials and Methods
2.1. Study Area
2.2. Data Collection
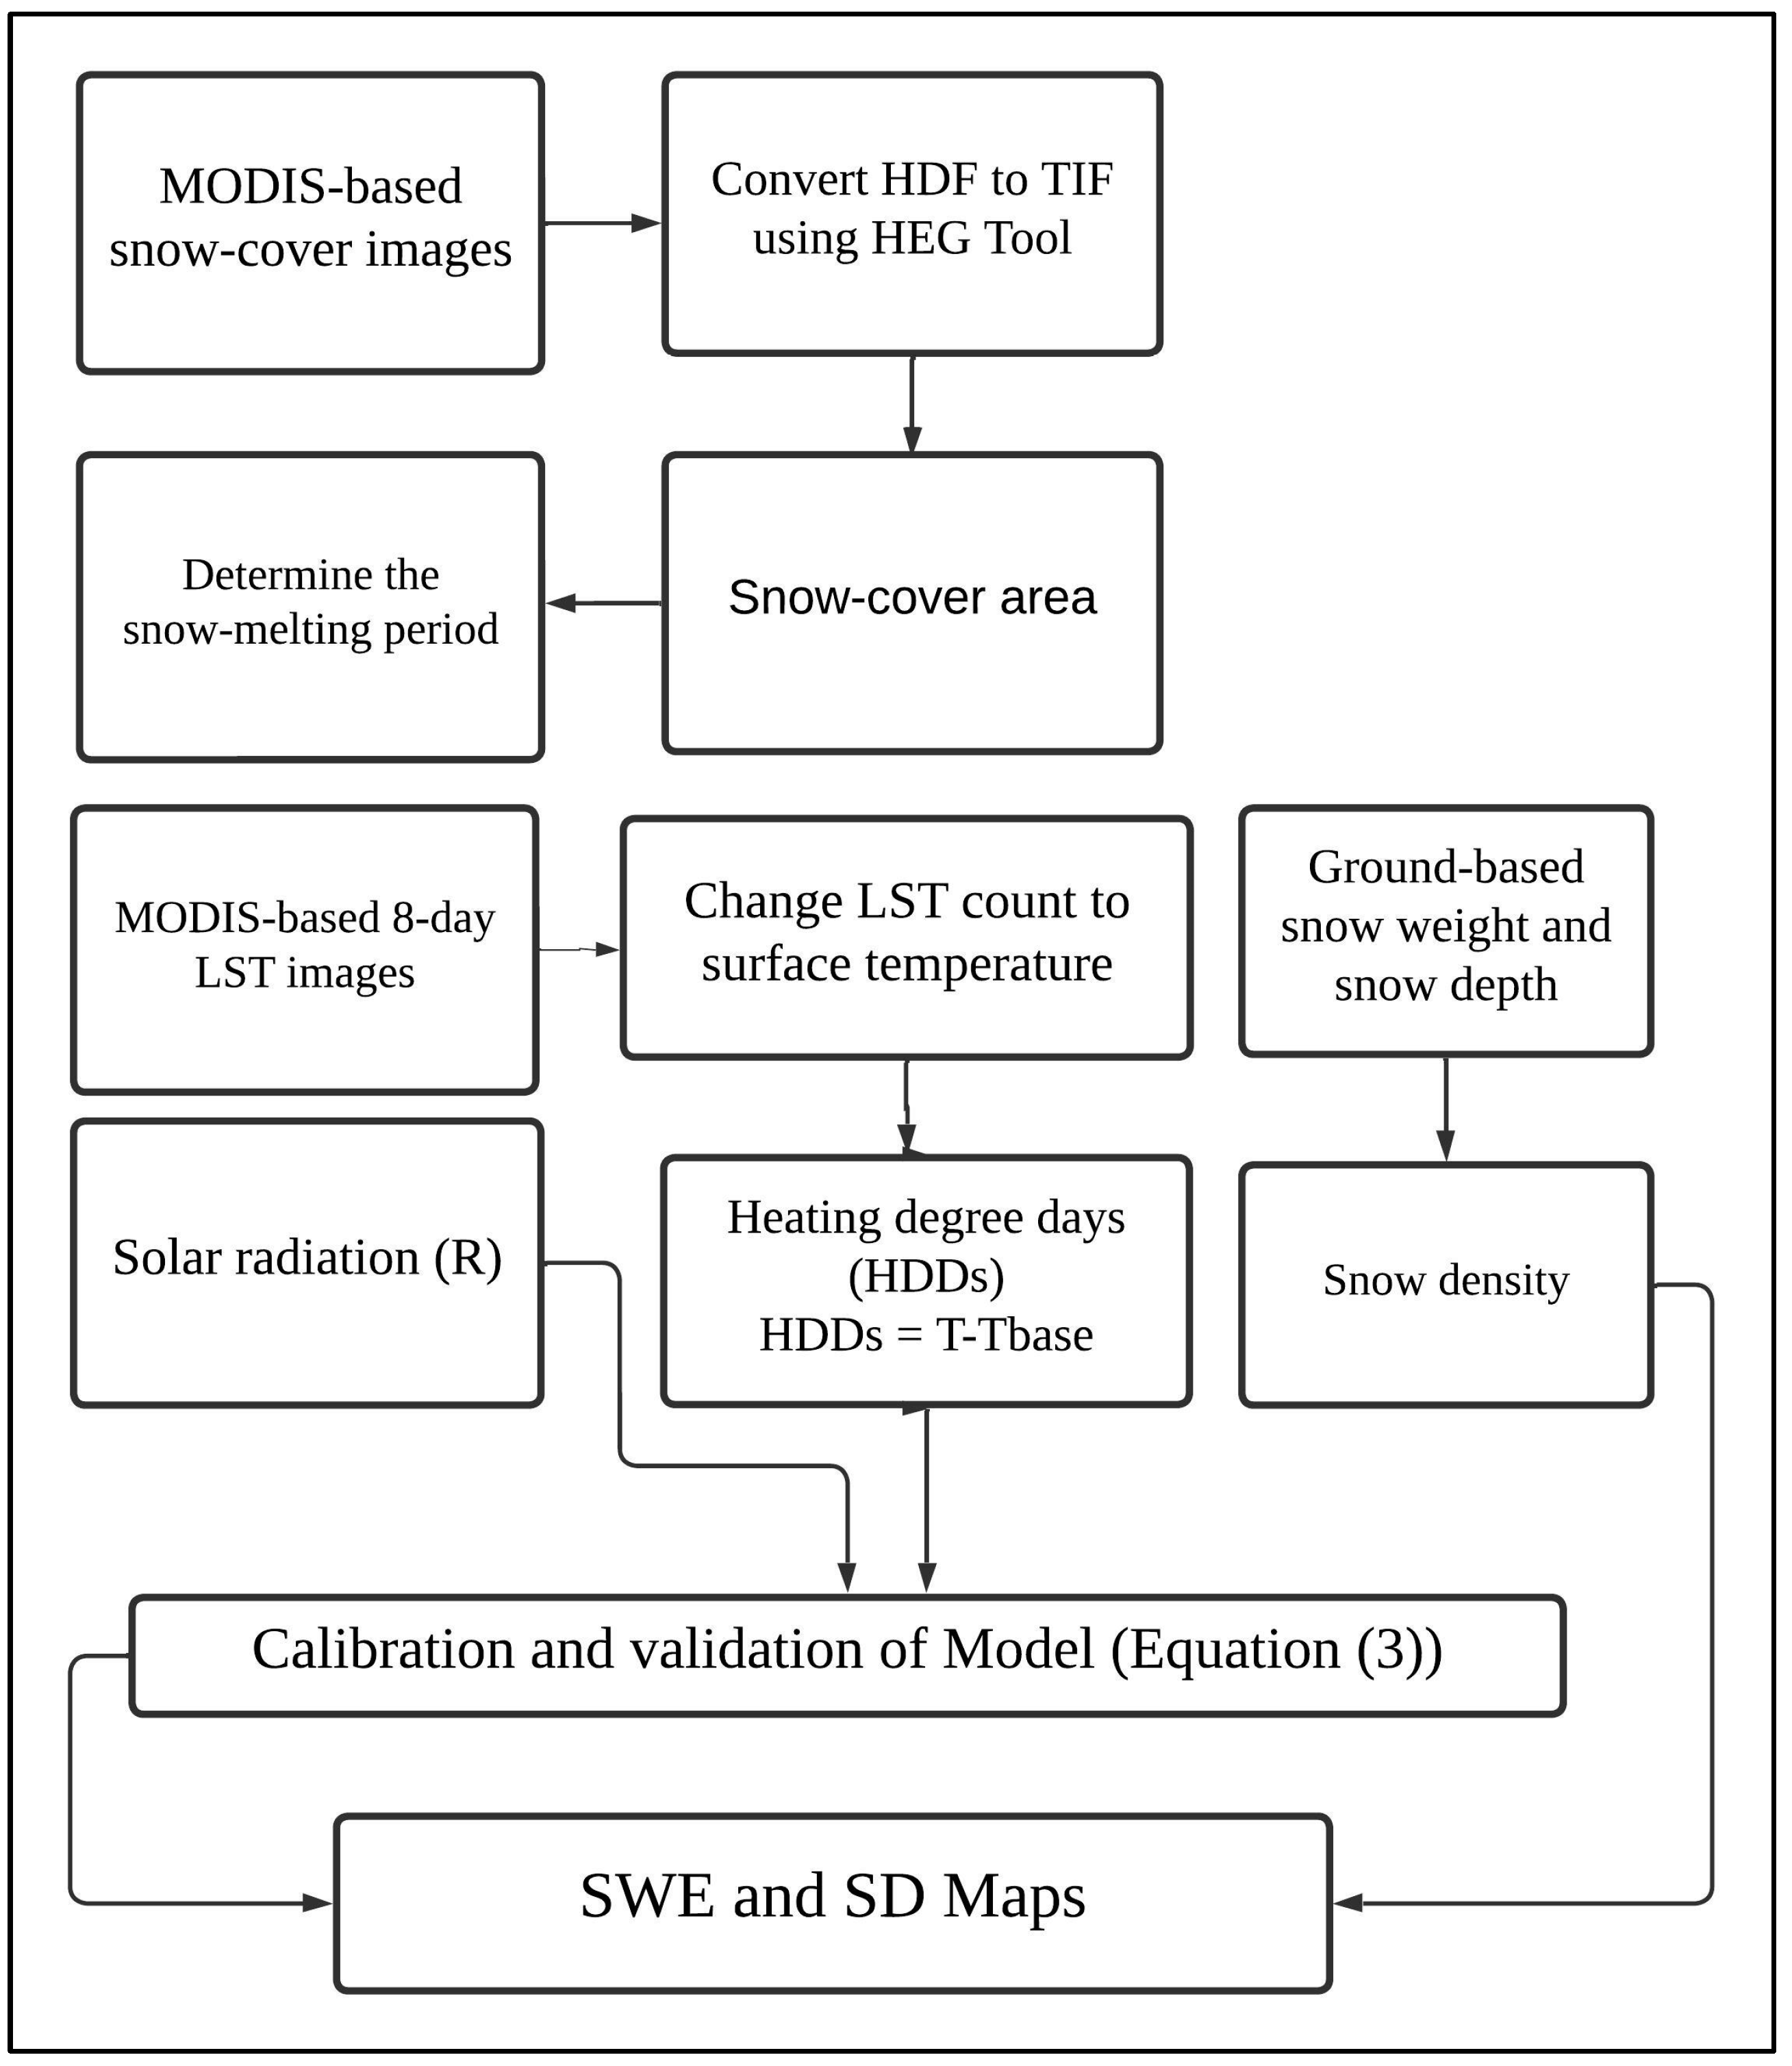
2.3. Methodology
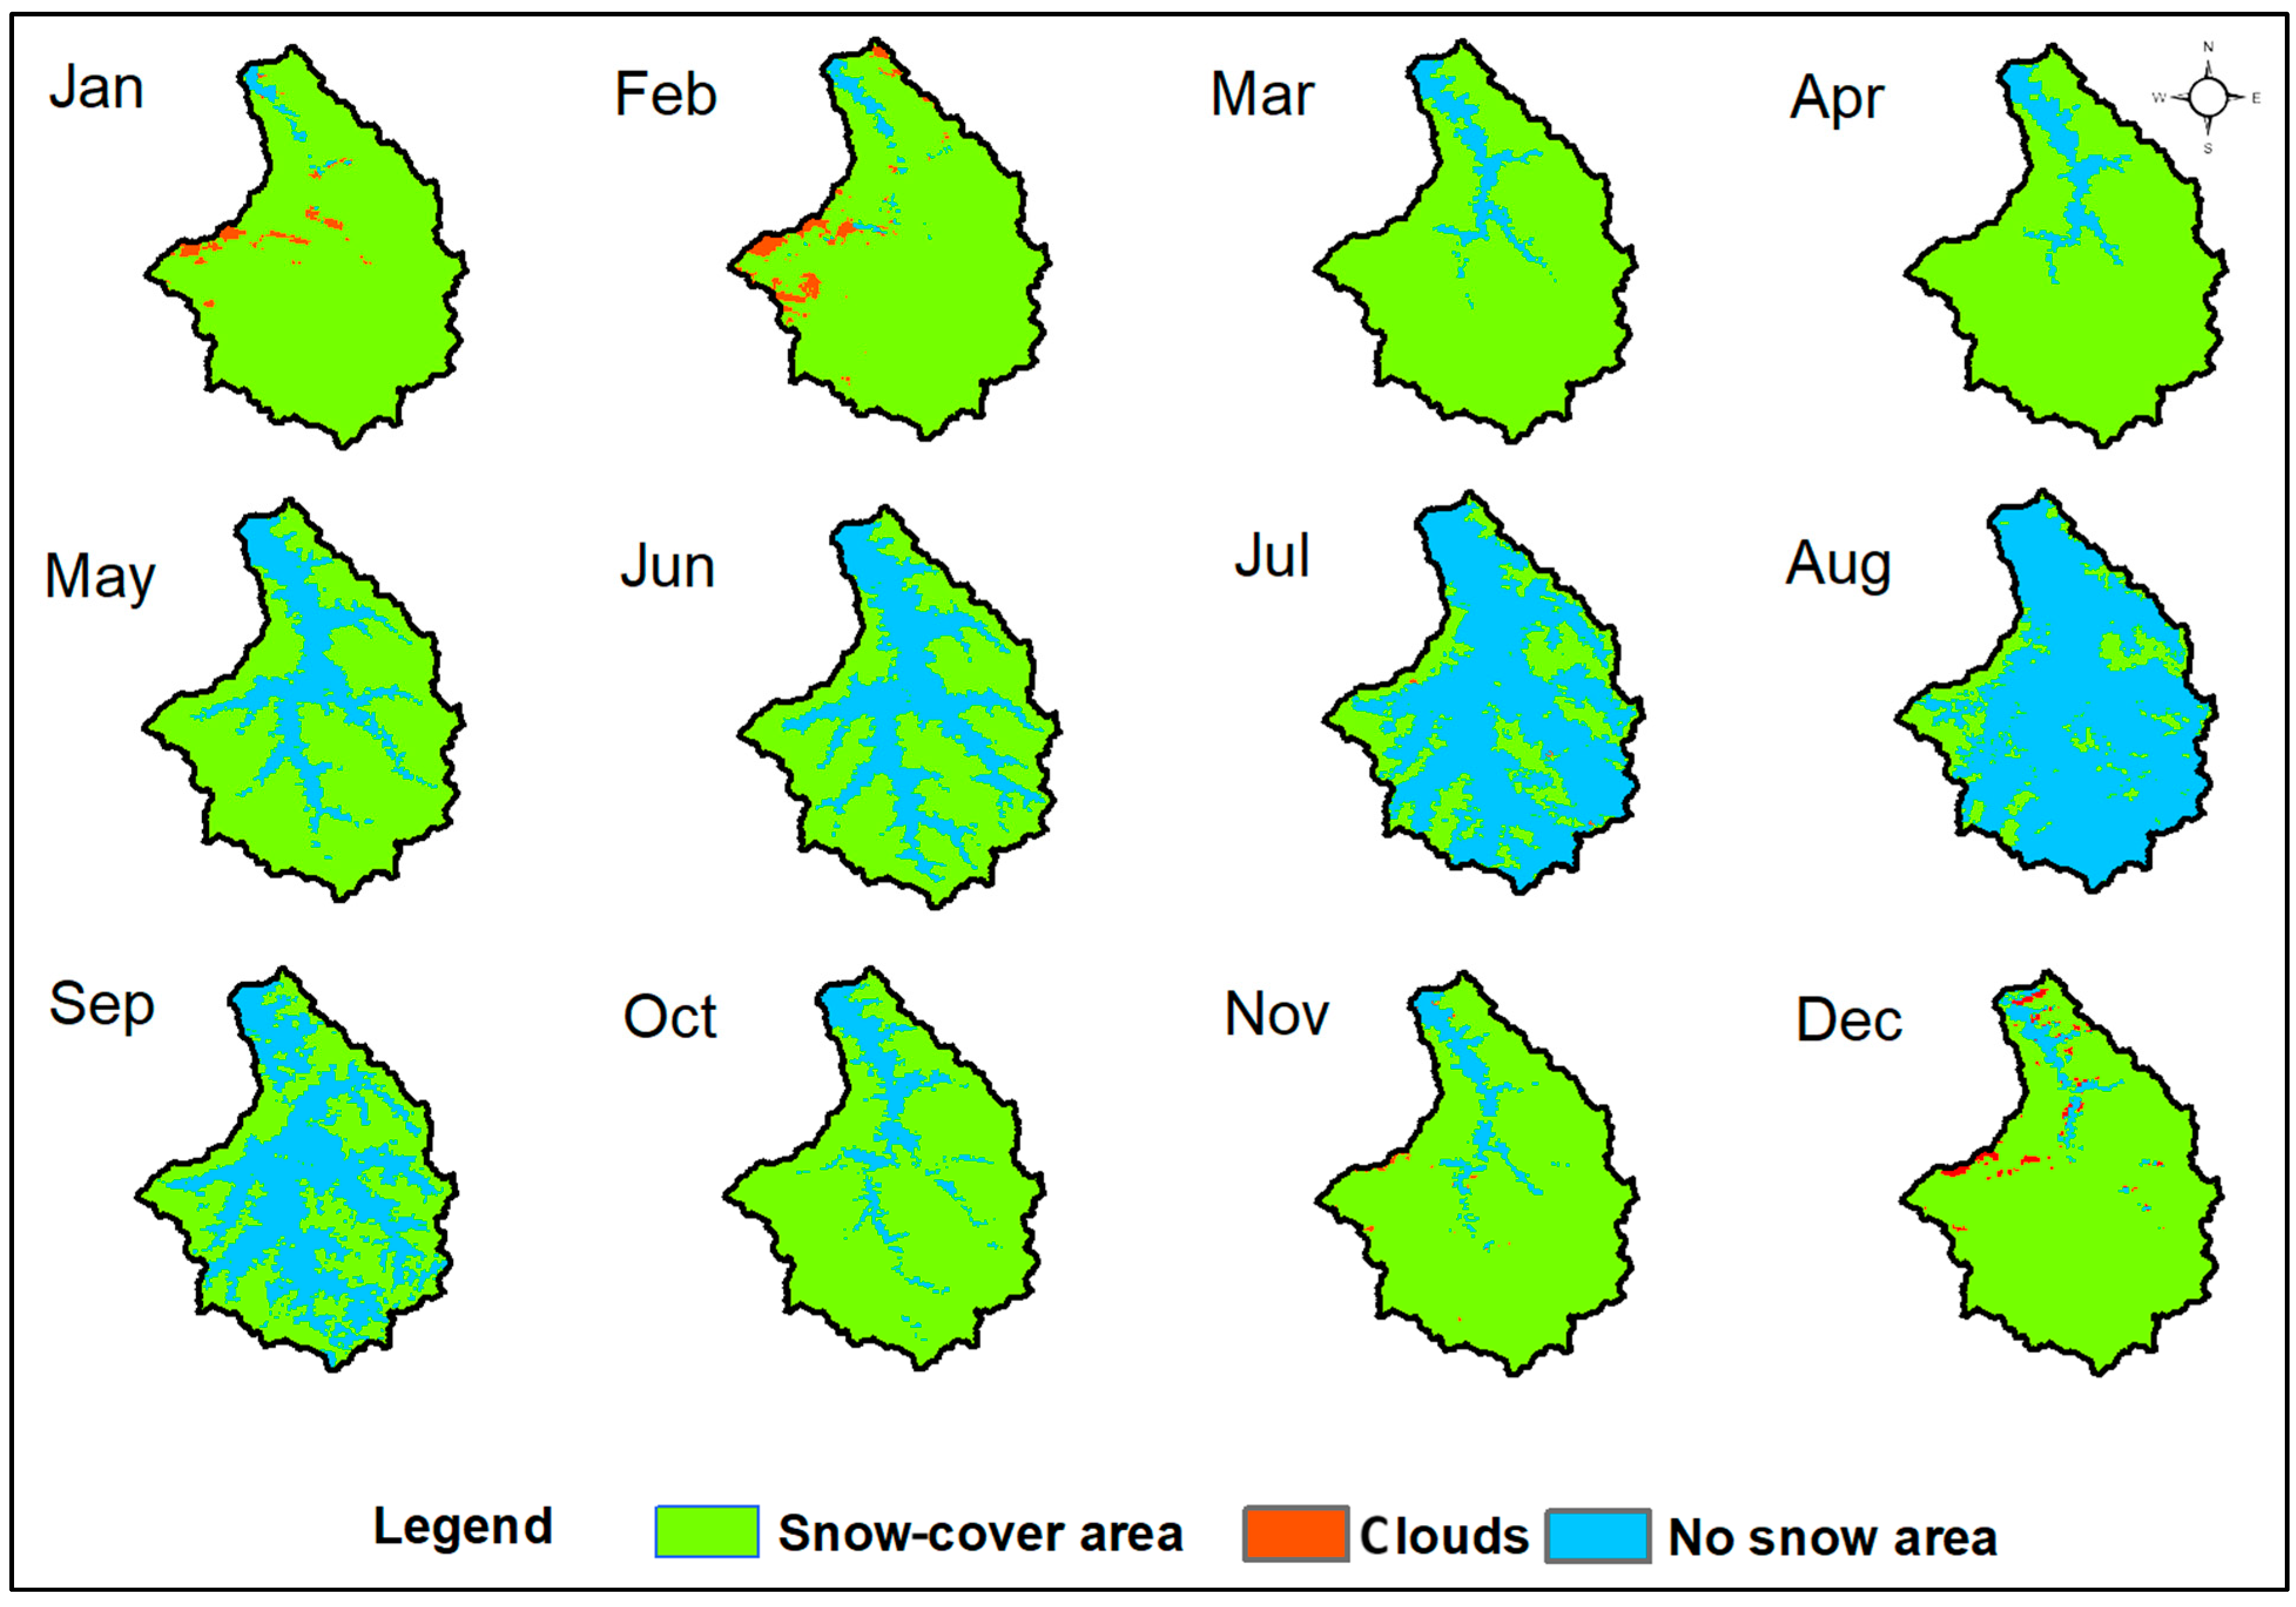
2.3.1. Snow Cover
2.3.2. Heating Degree Days (HDDs)
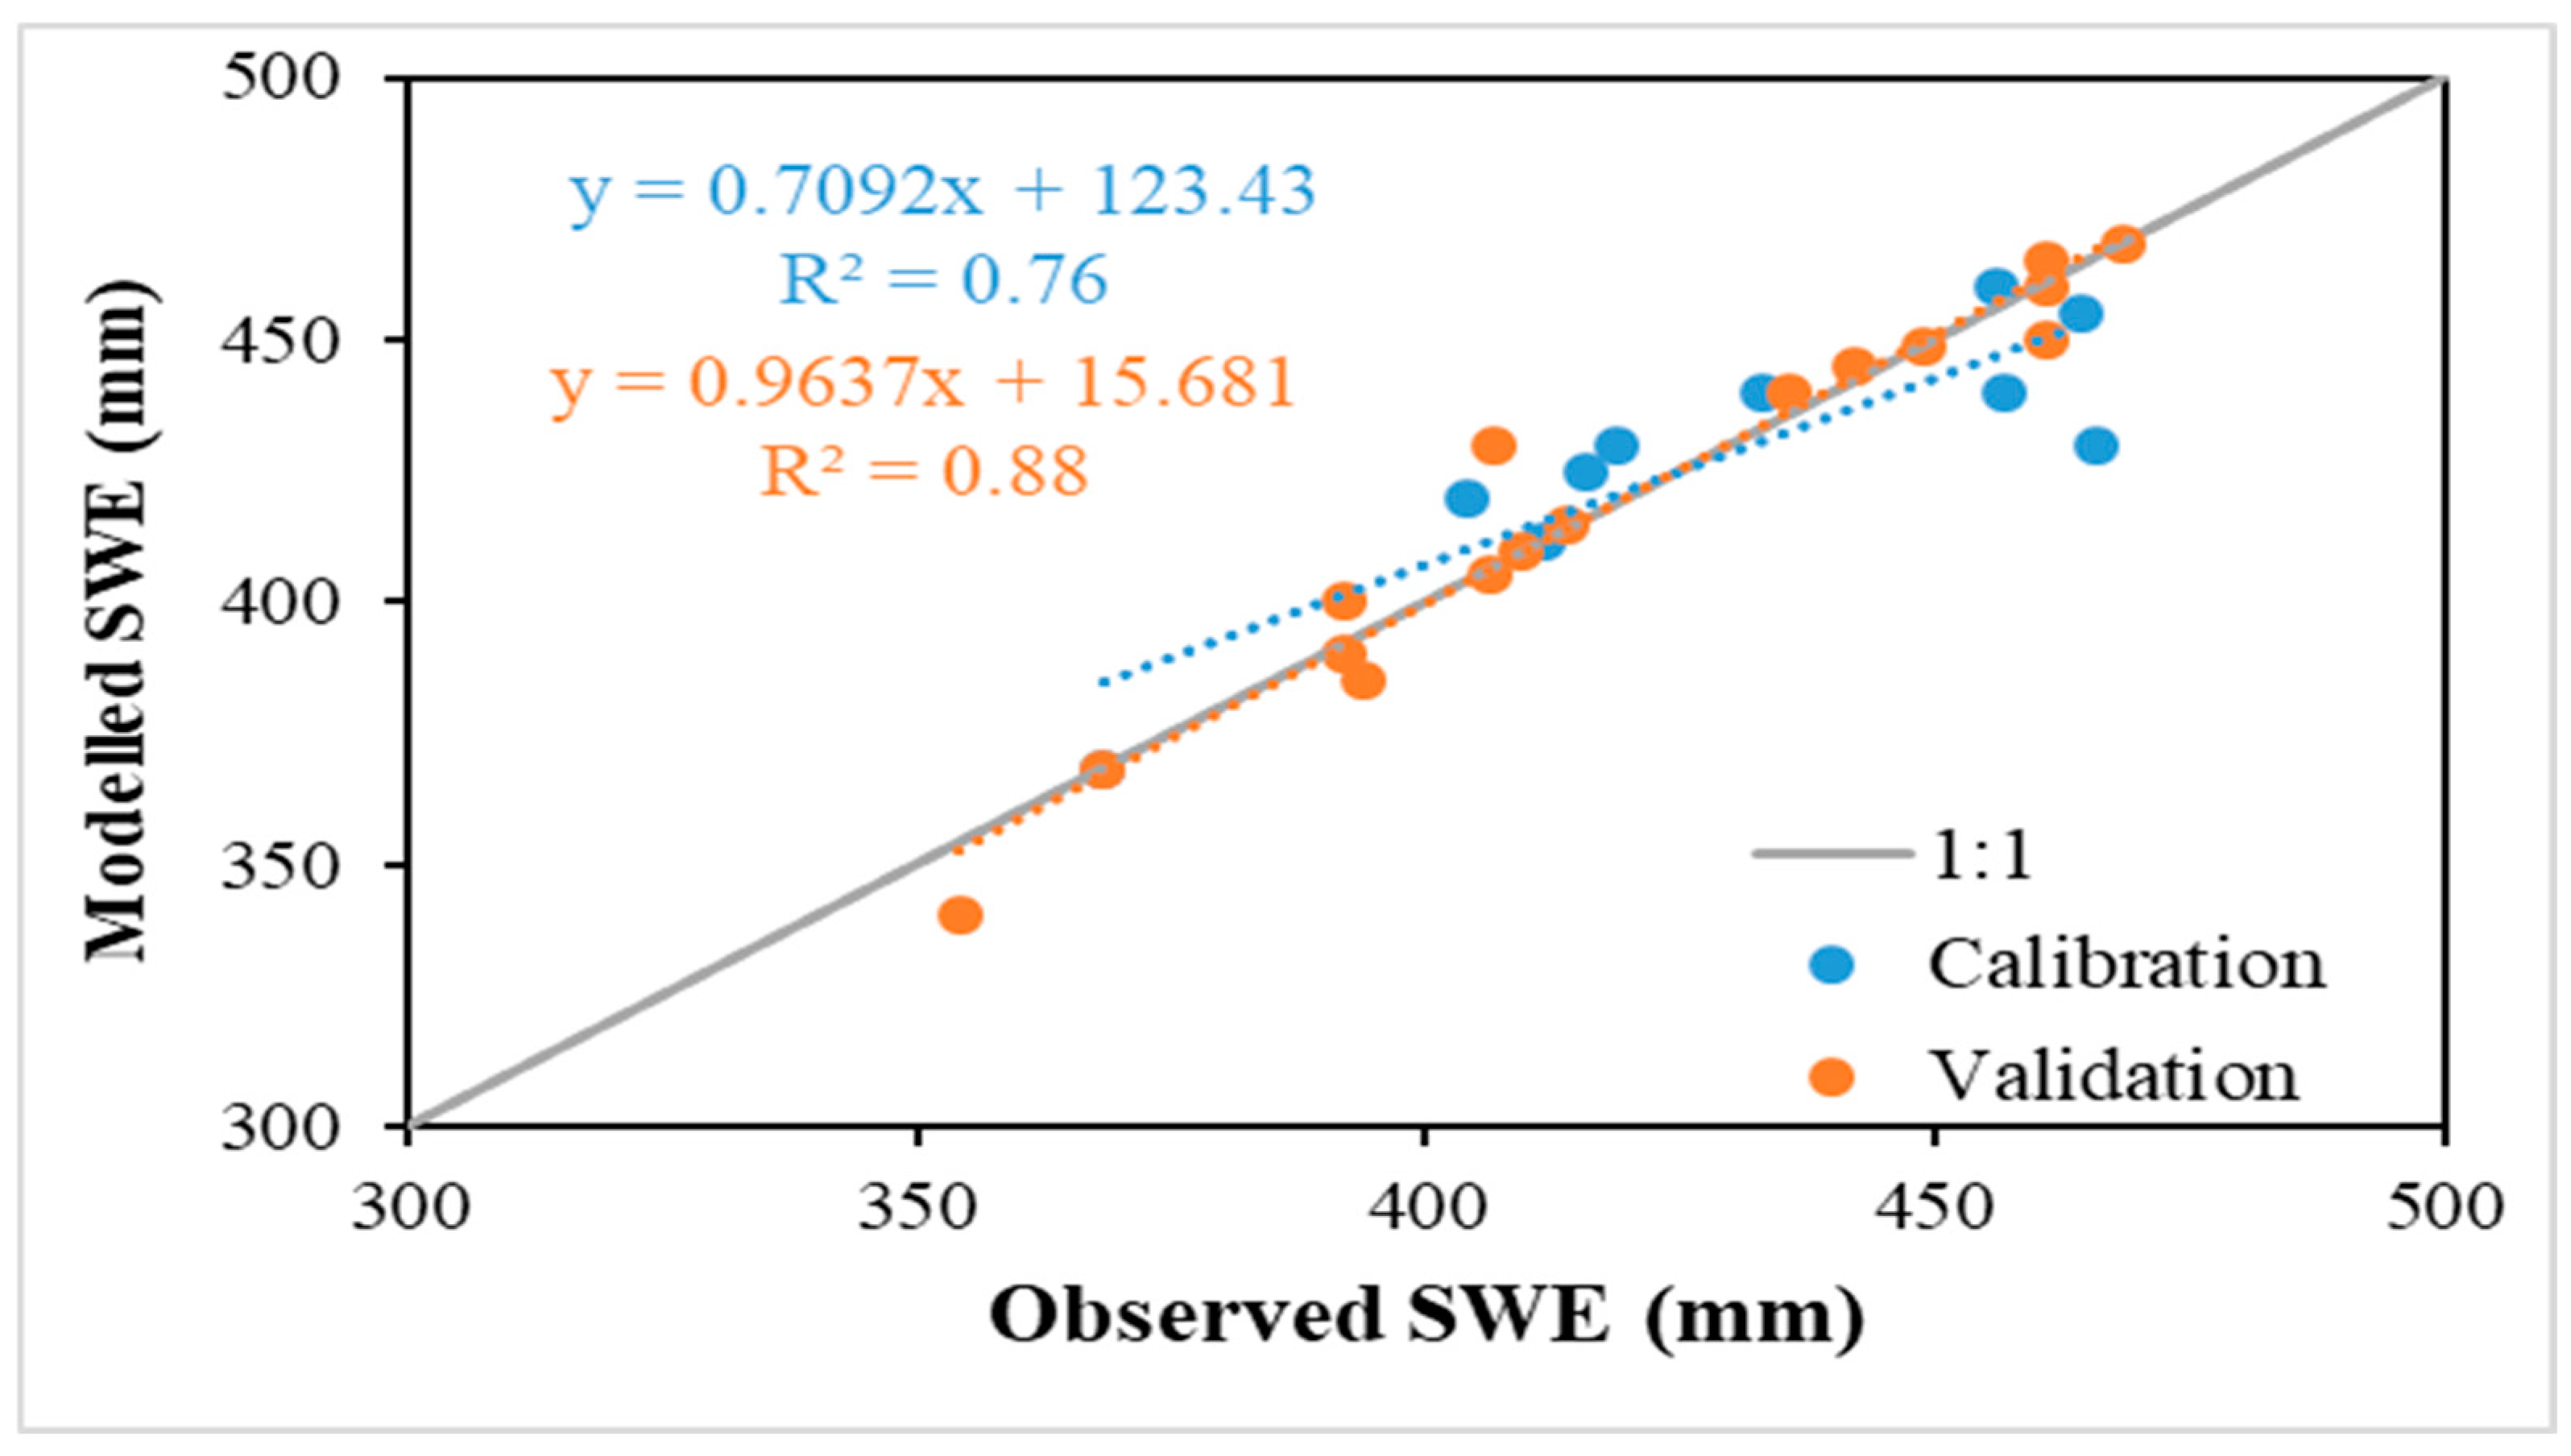
2.3.3. Model Setup
3. Results and Discussion
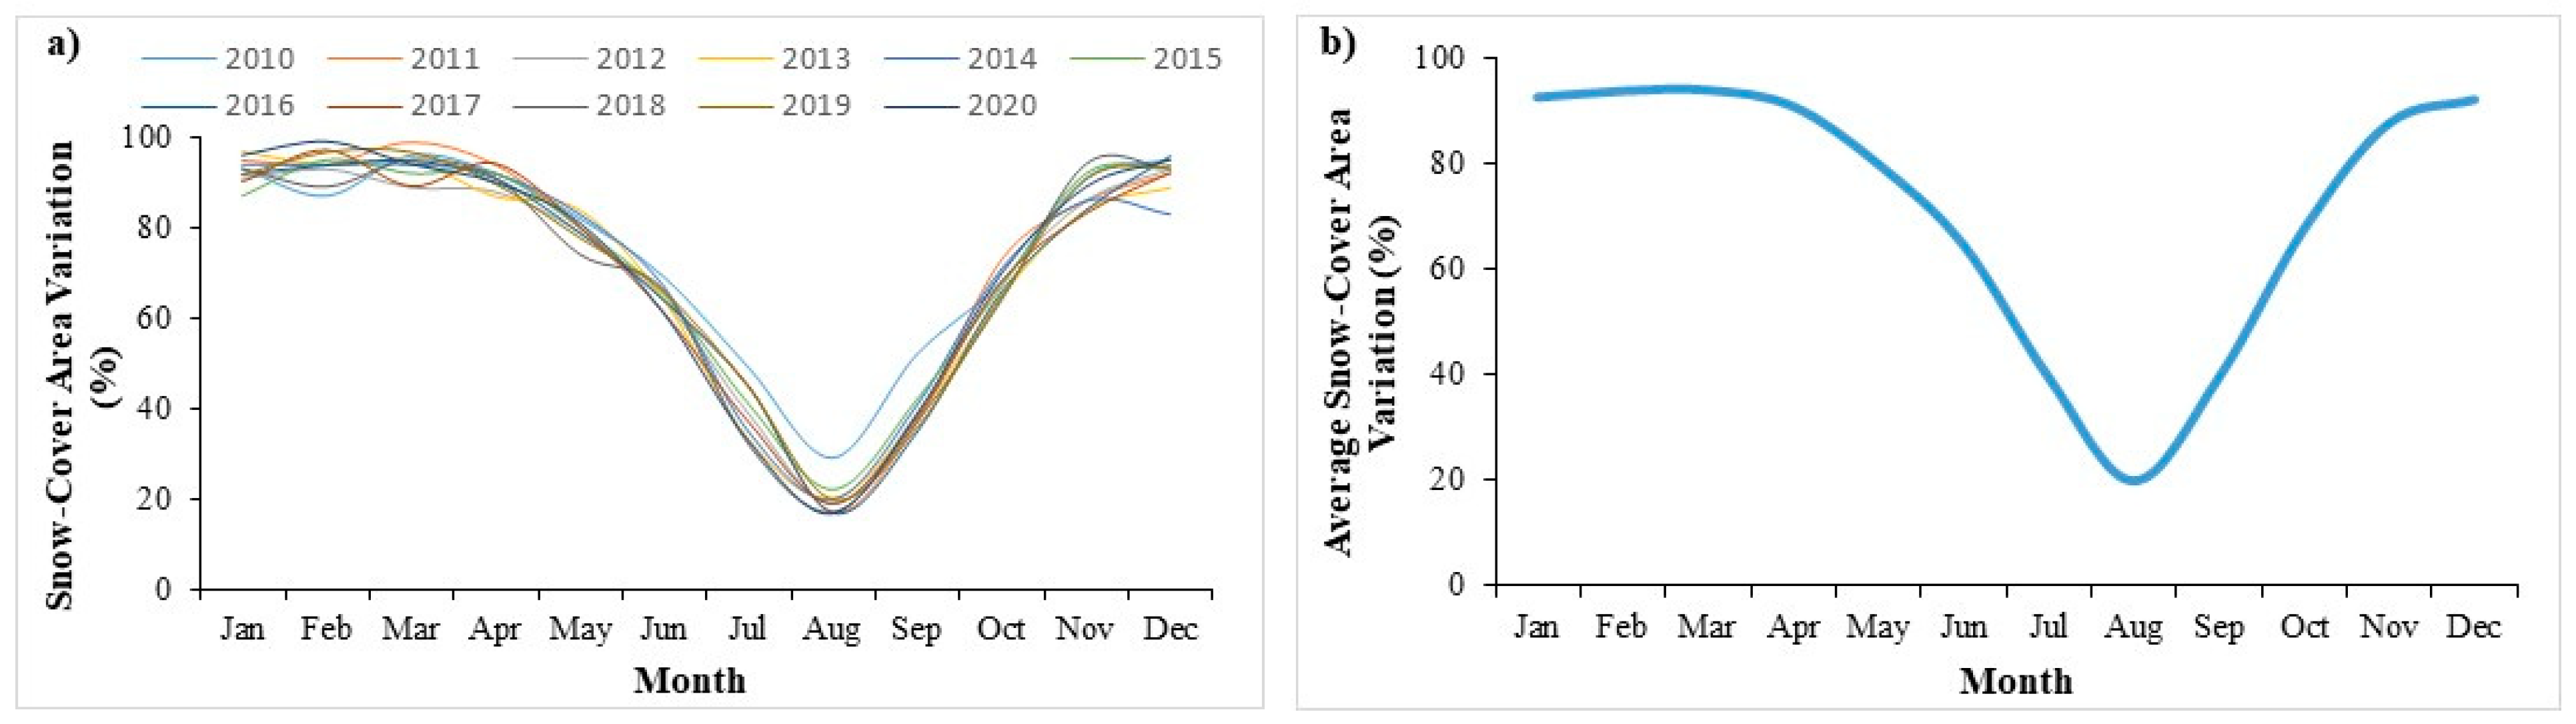
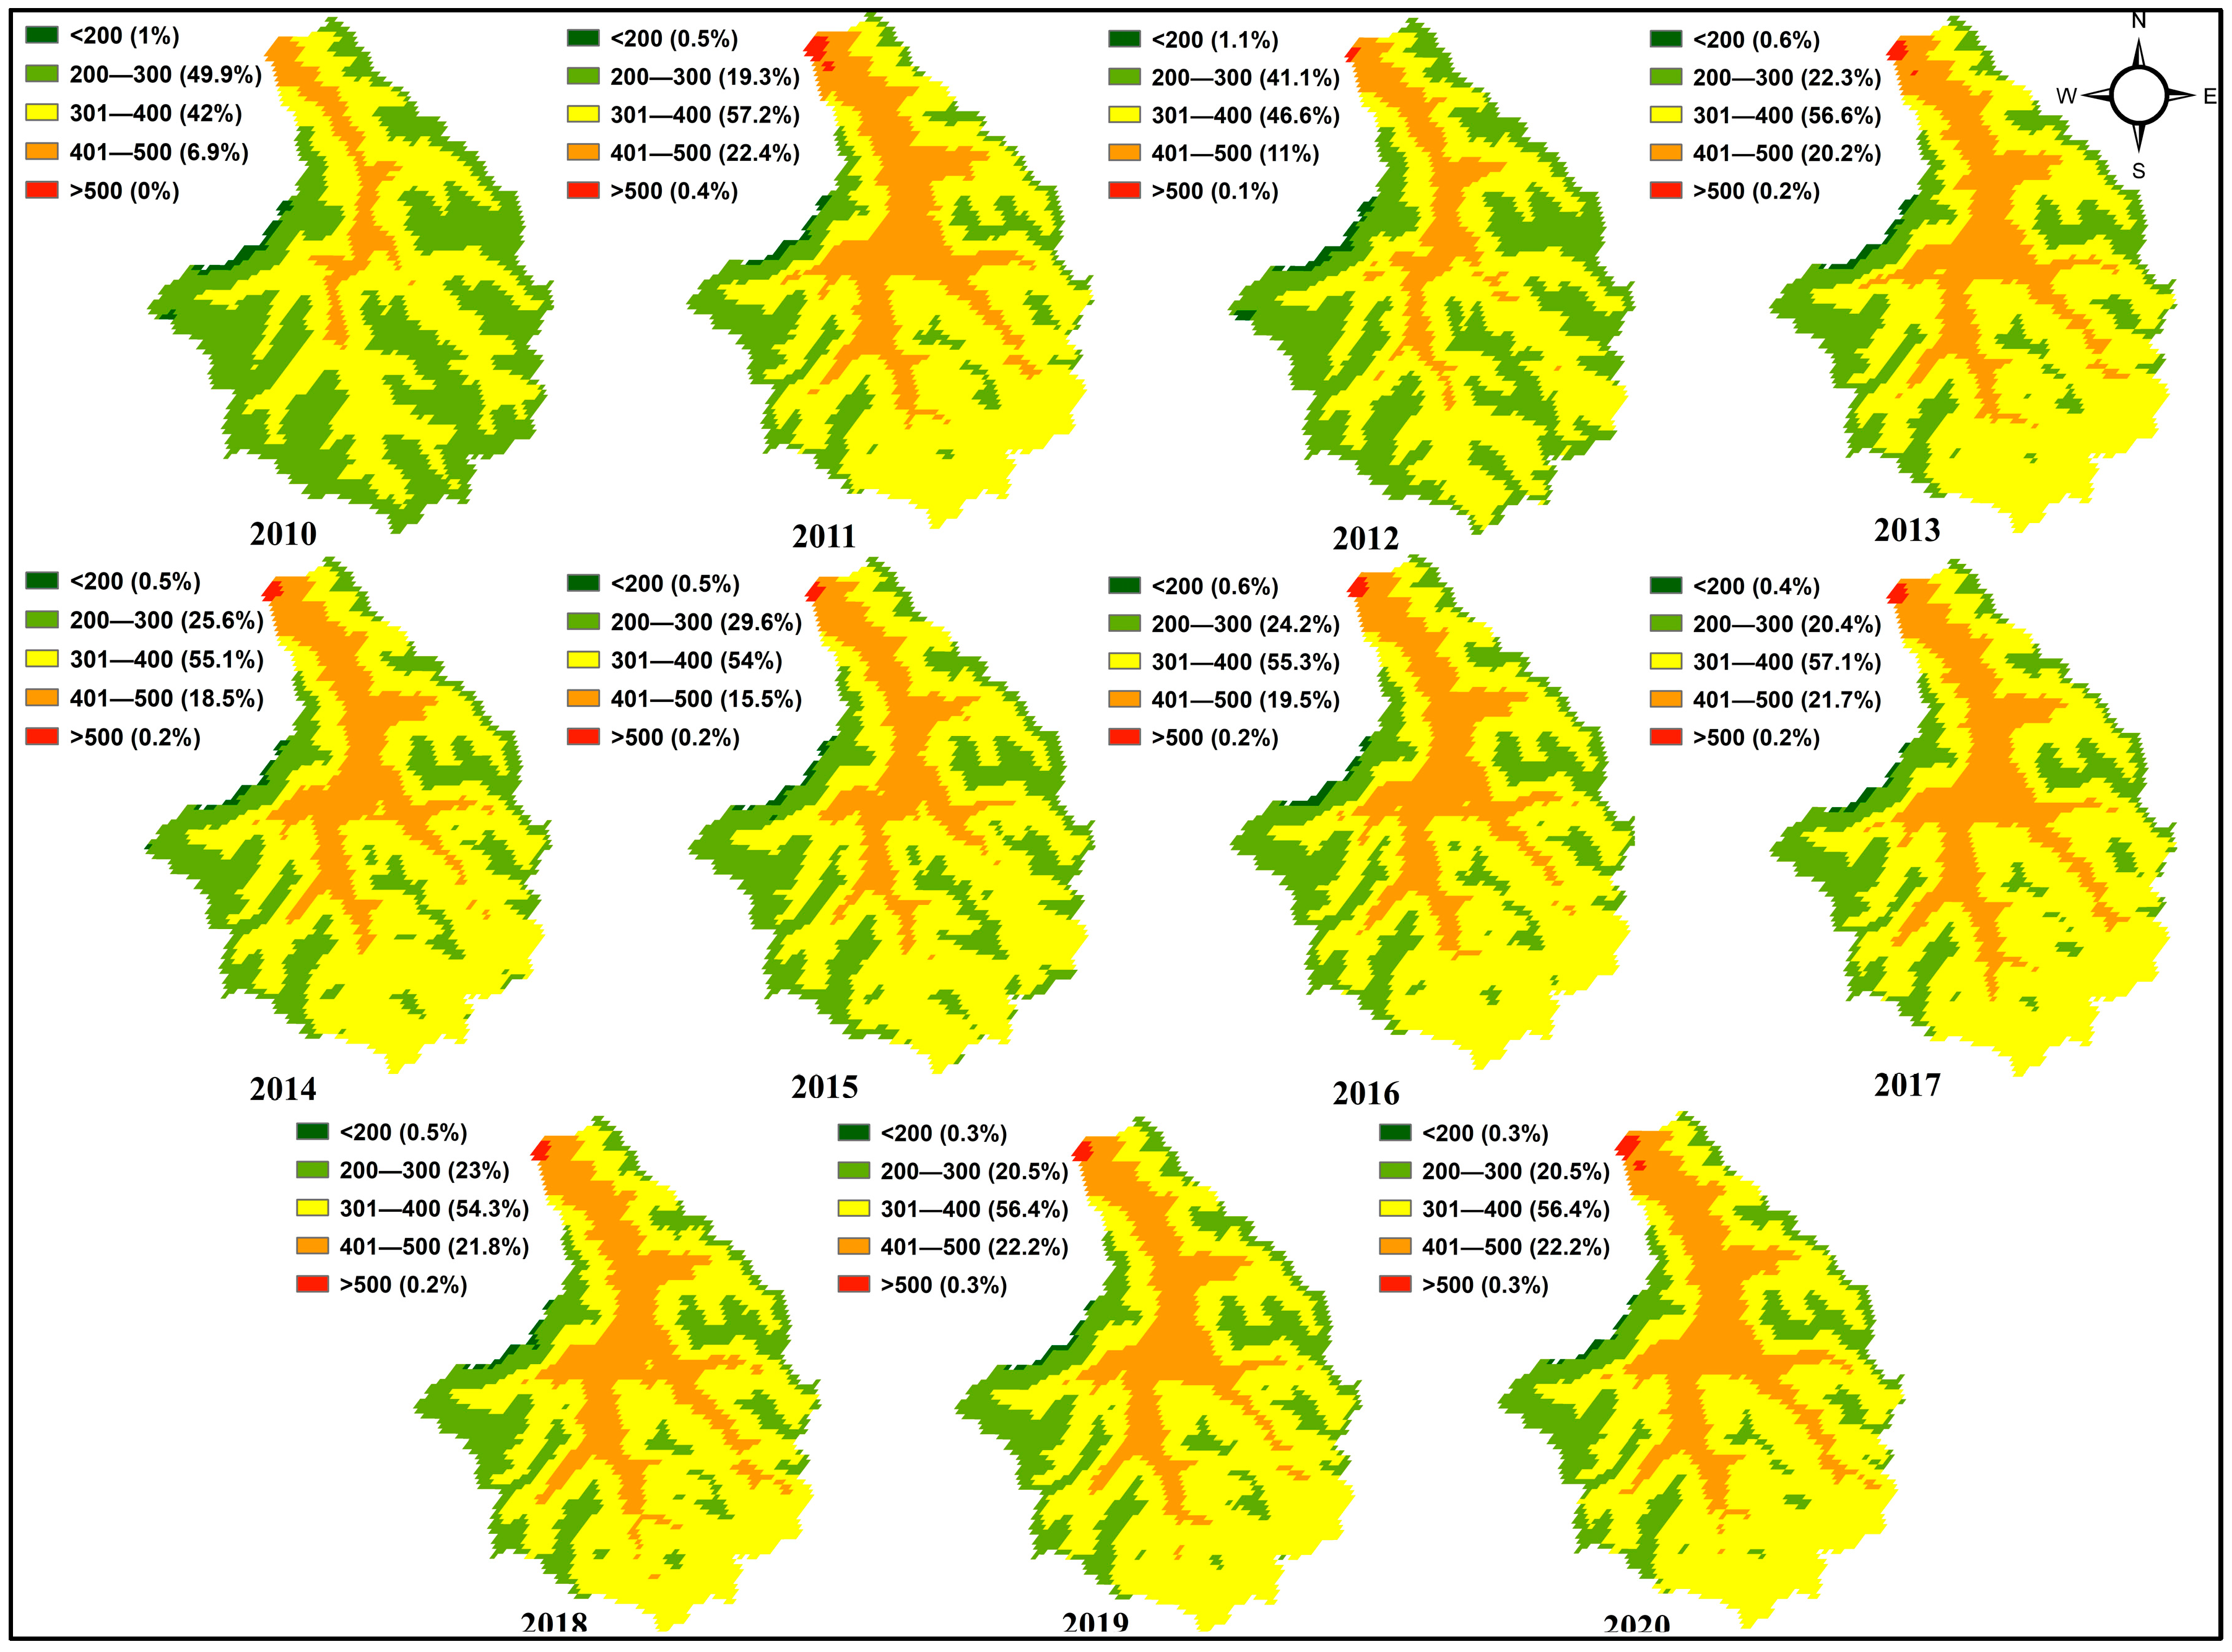
3.1. Snow-Cover Dynamics in Astore River Basin
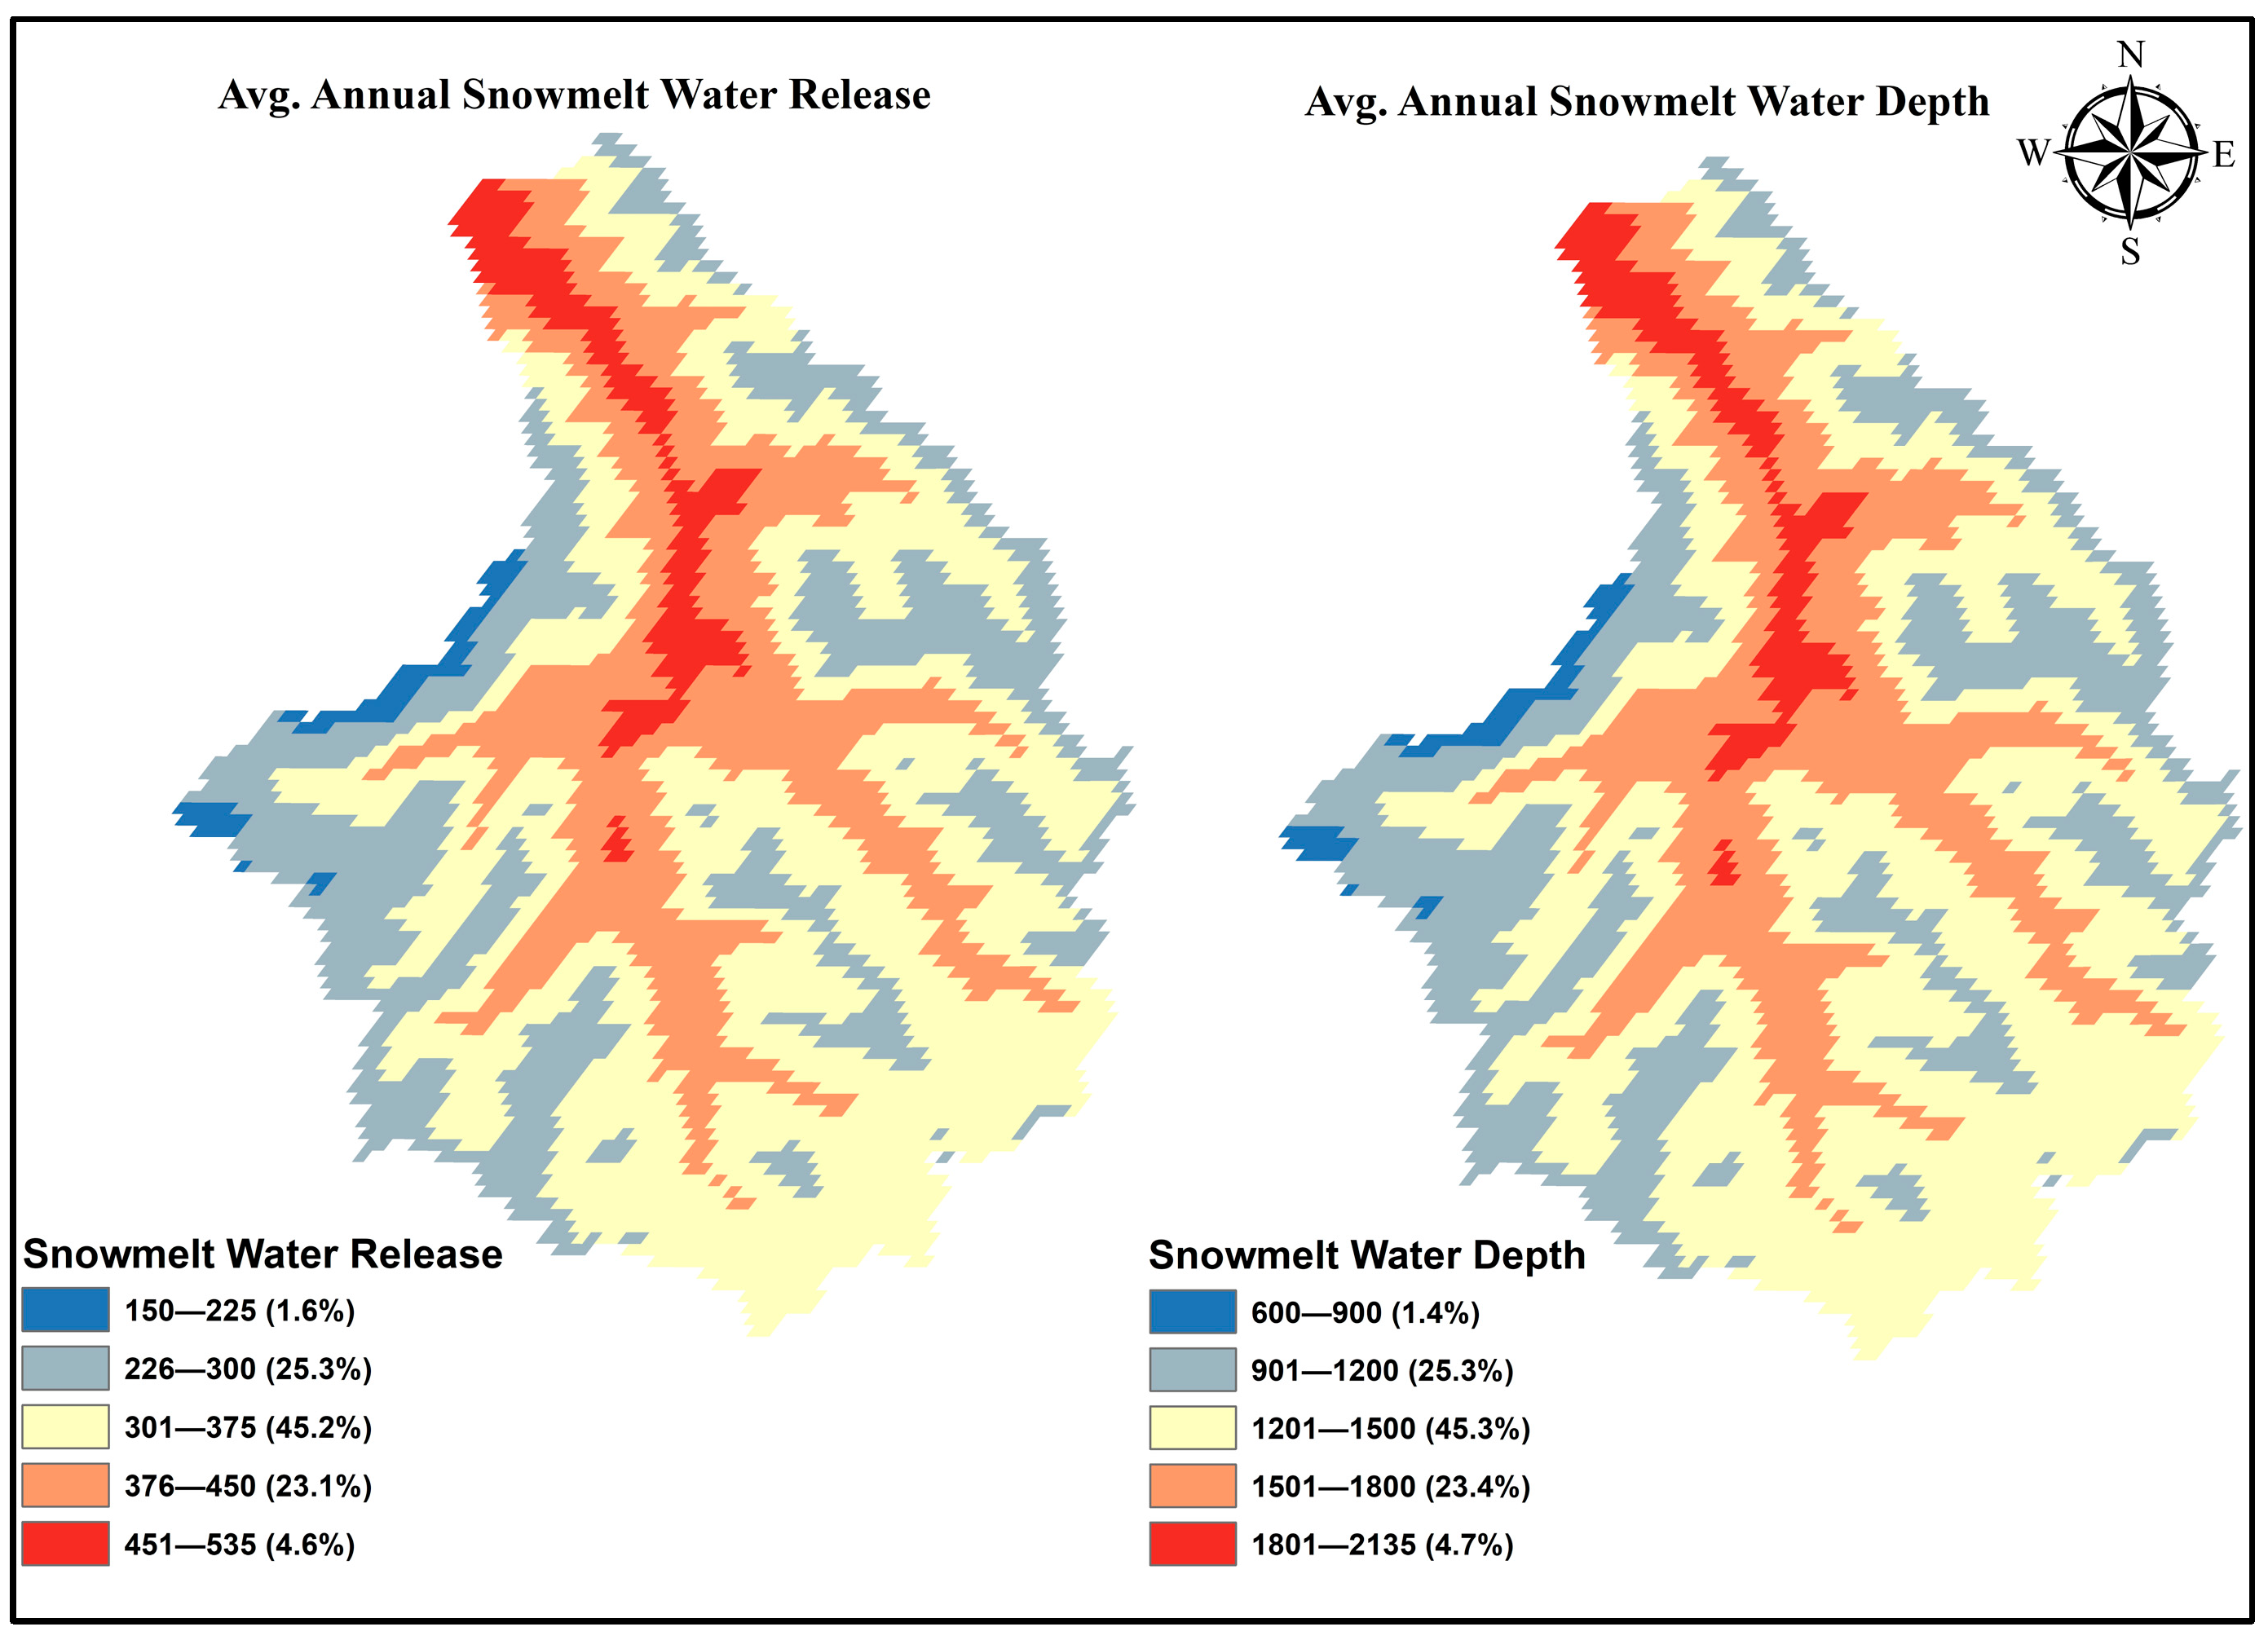
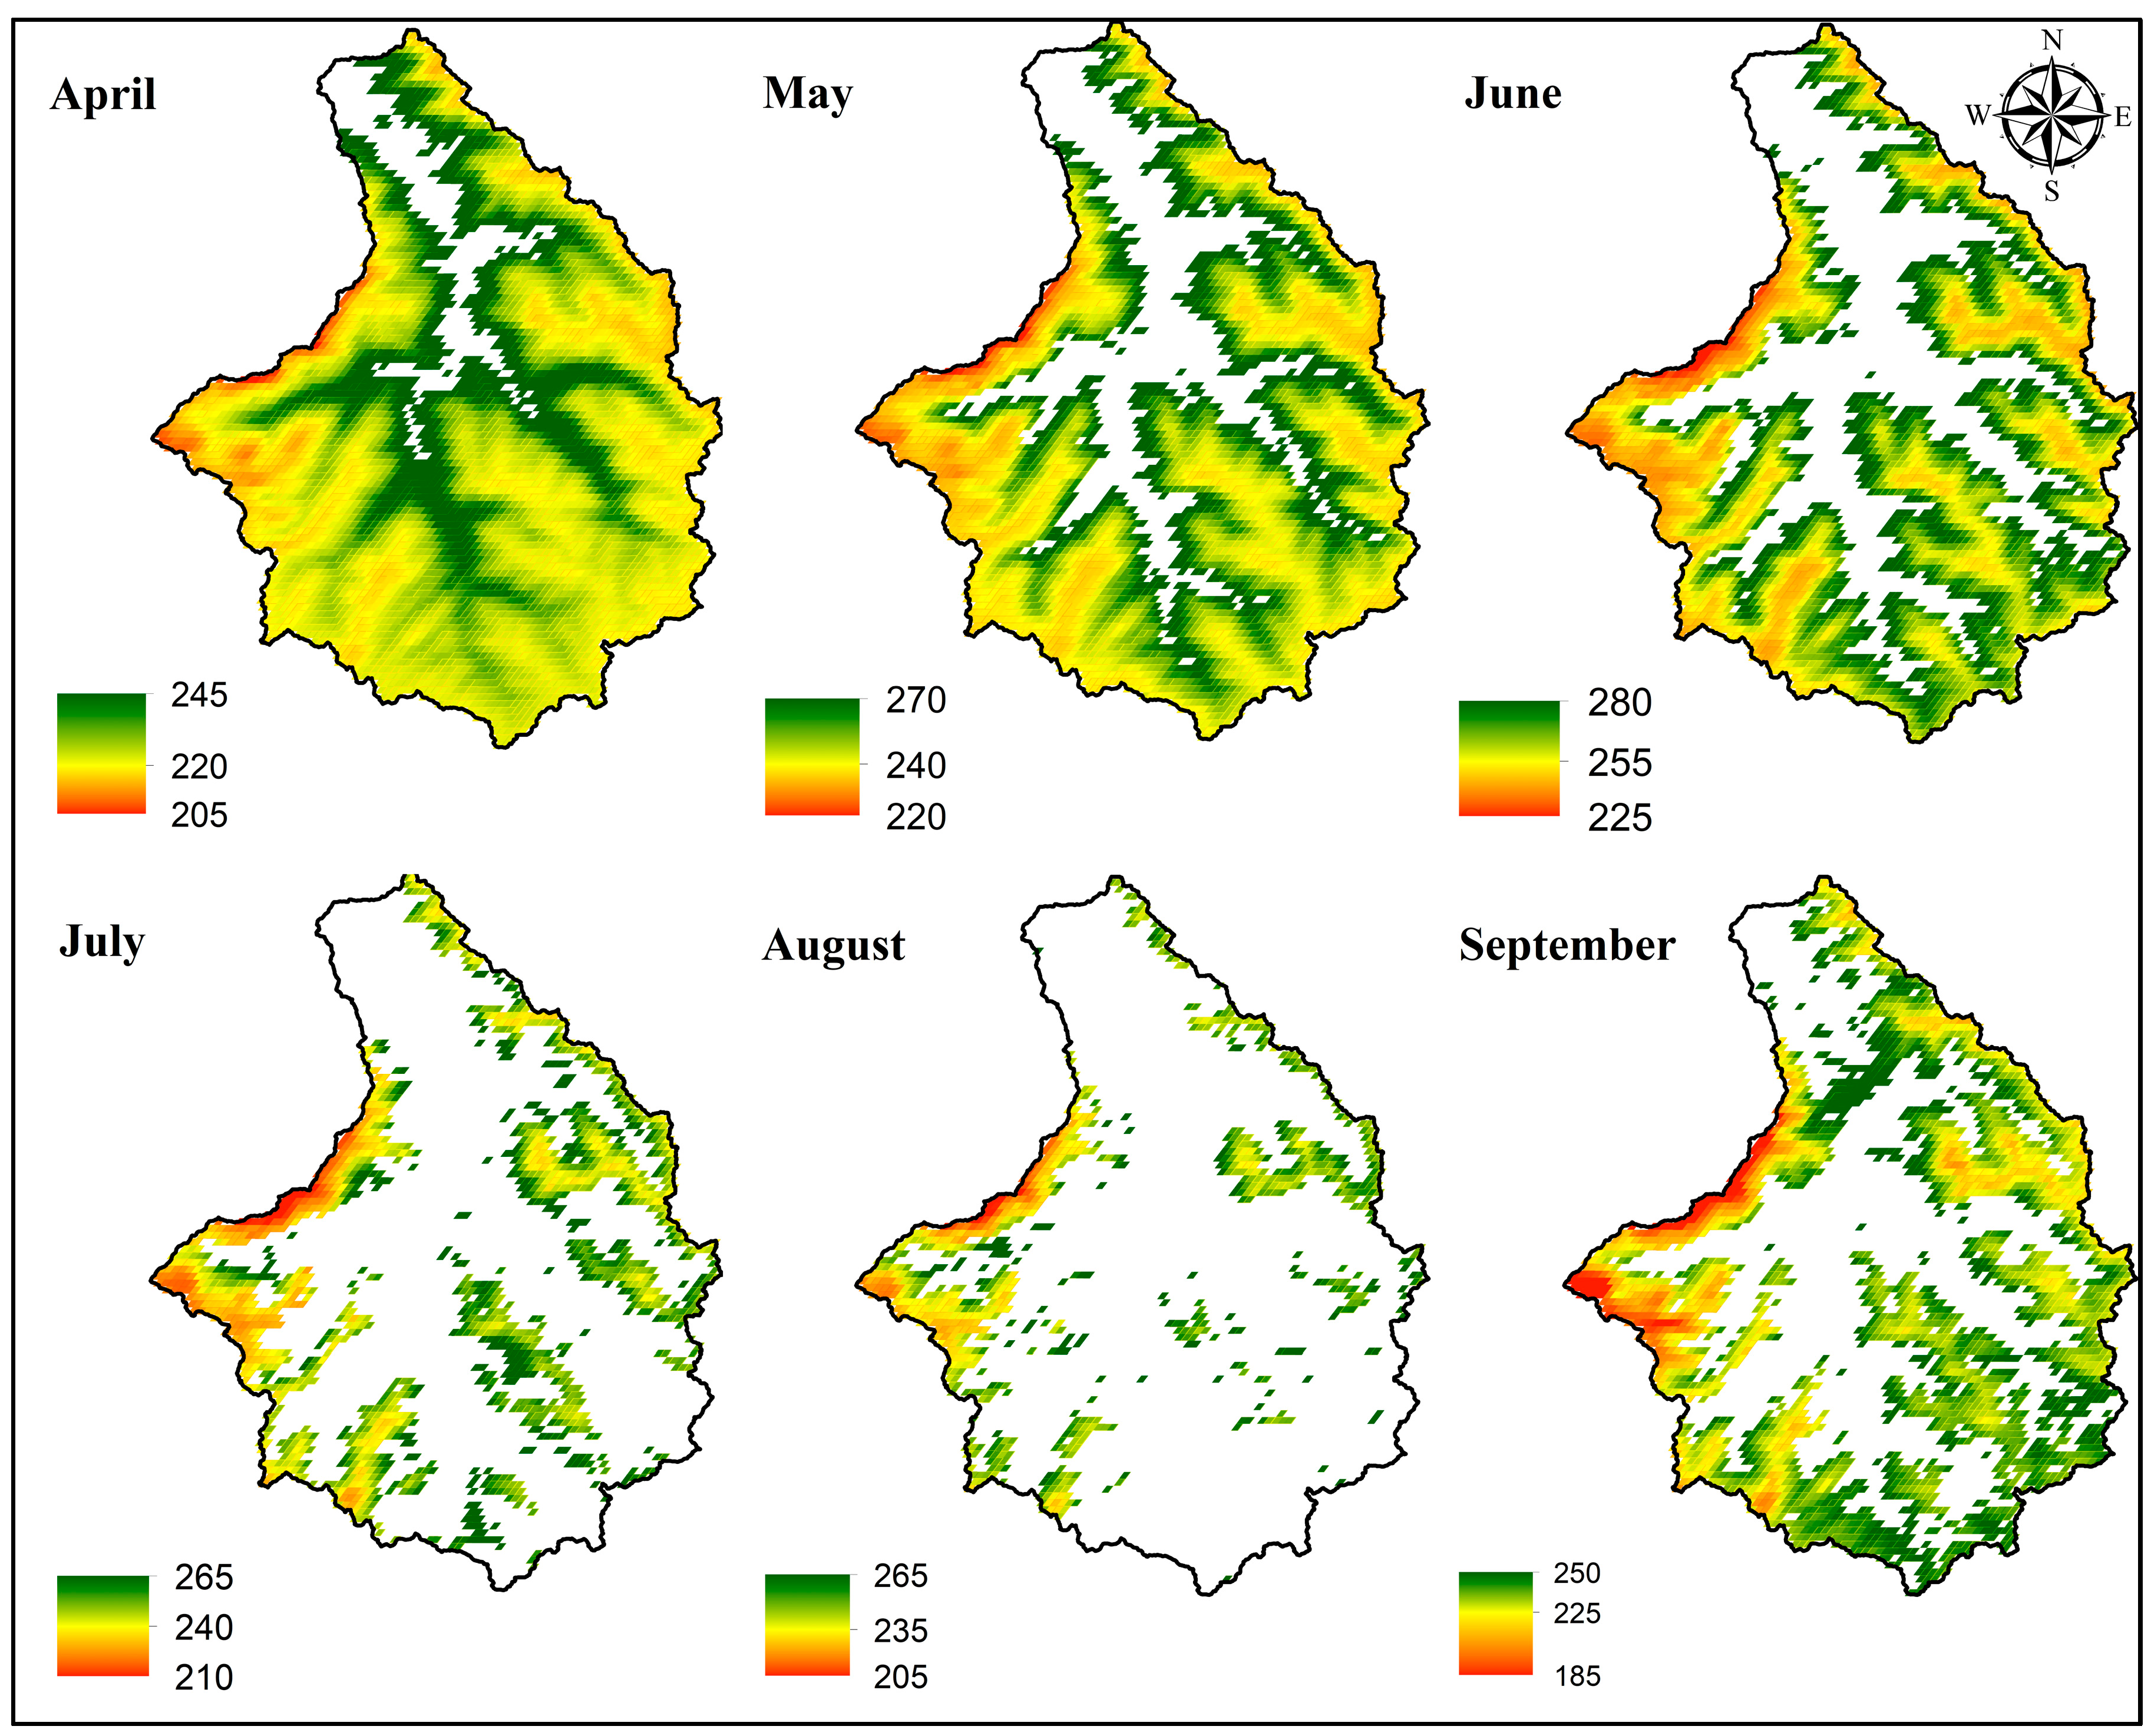
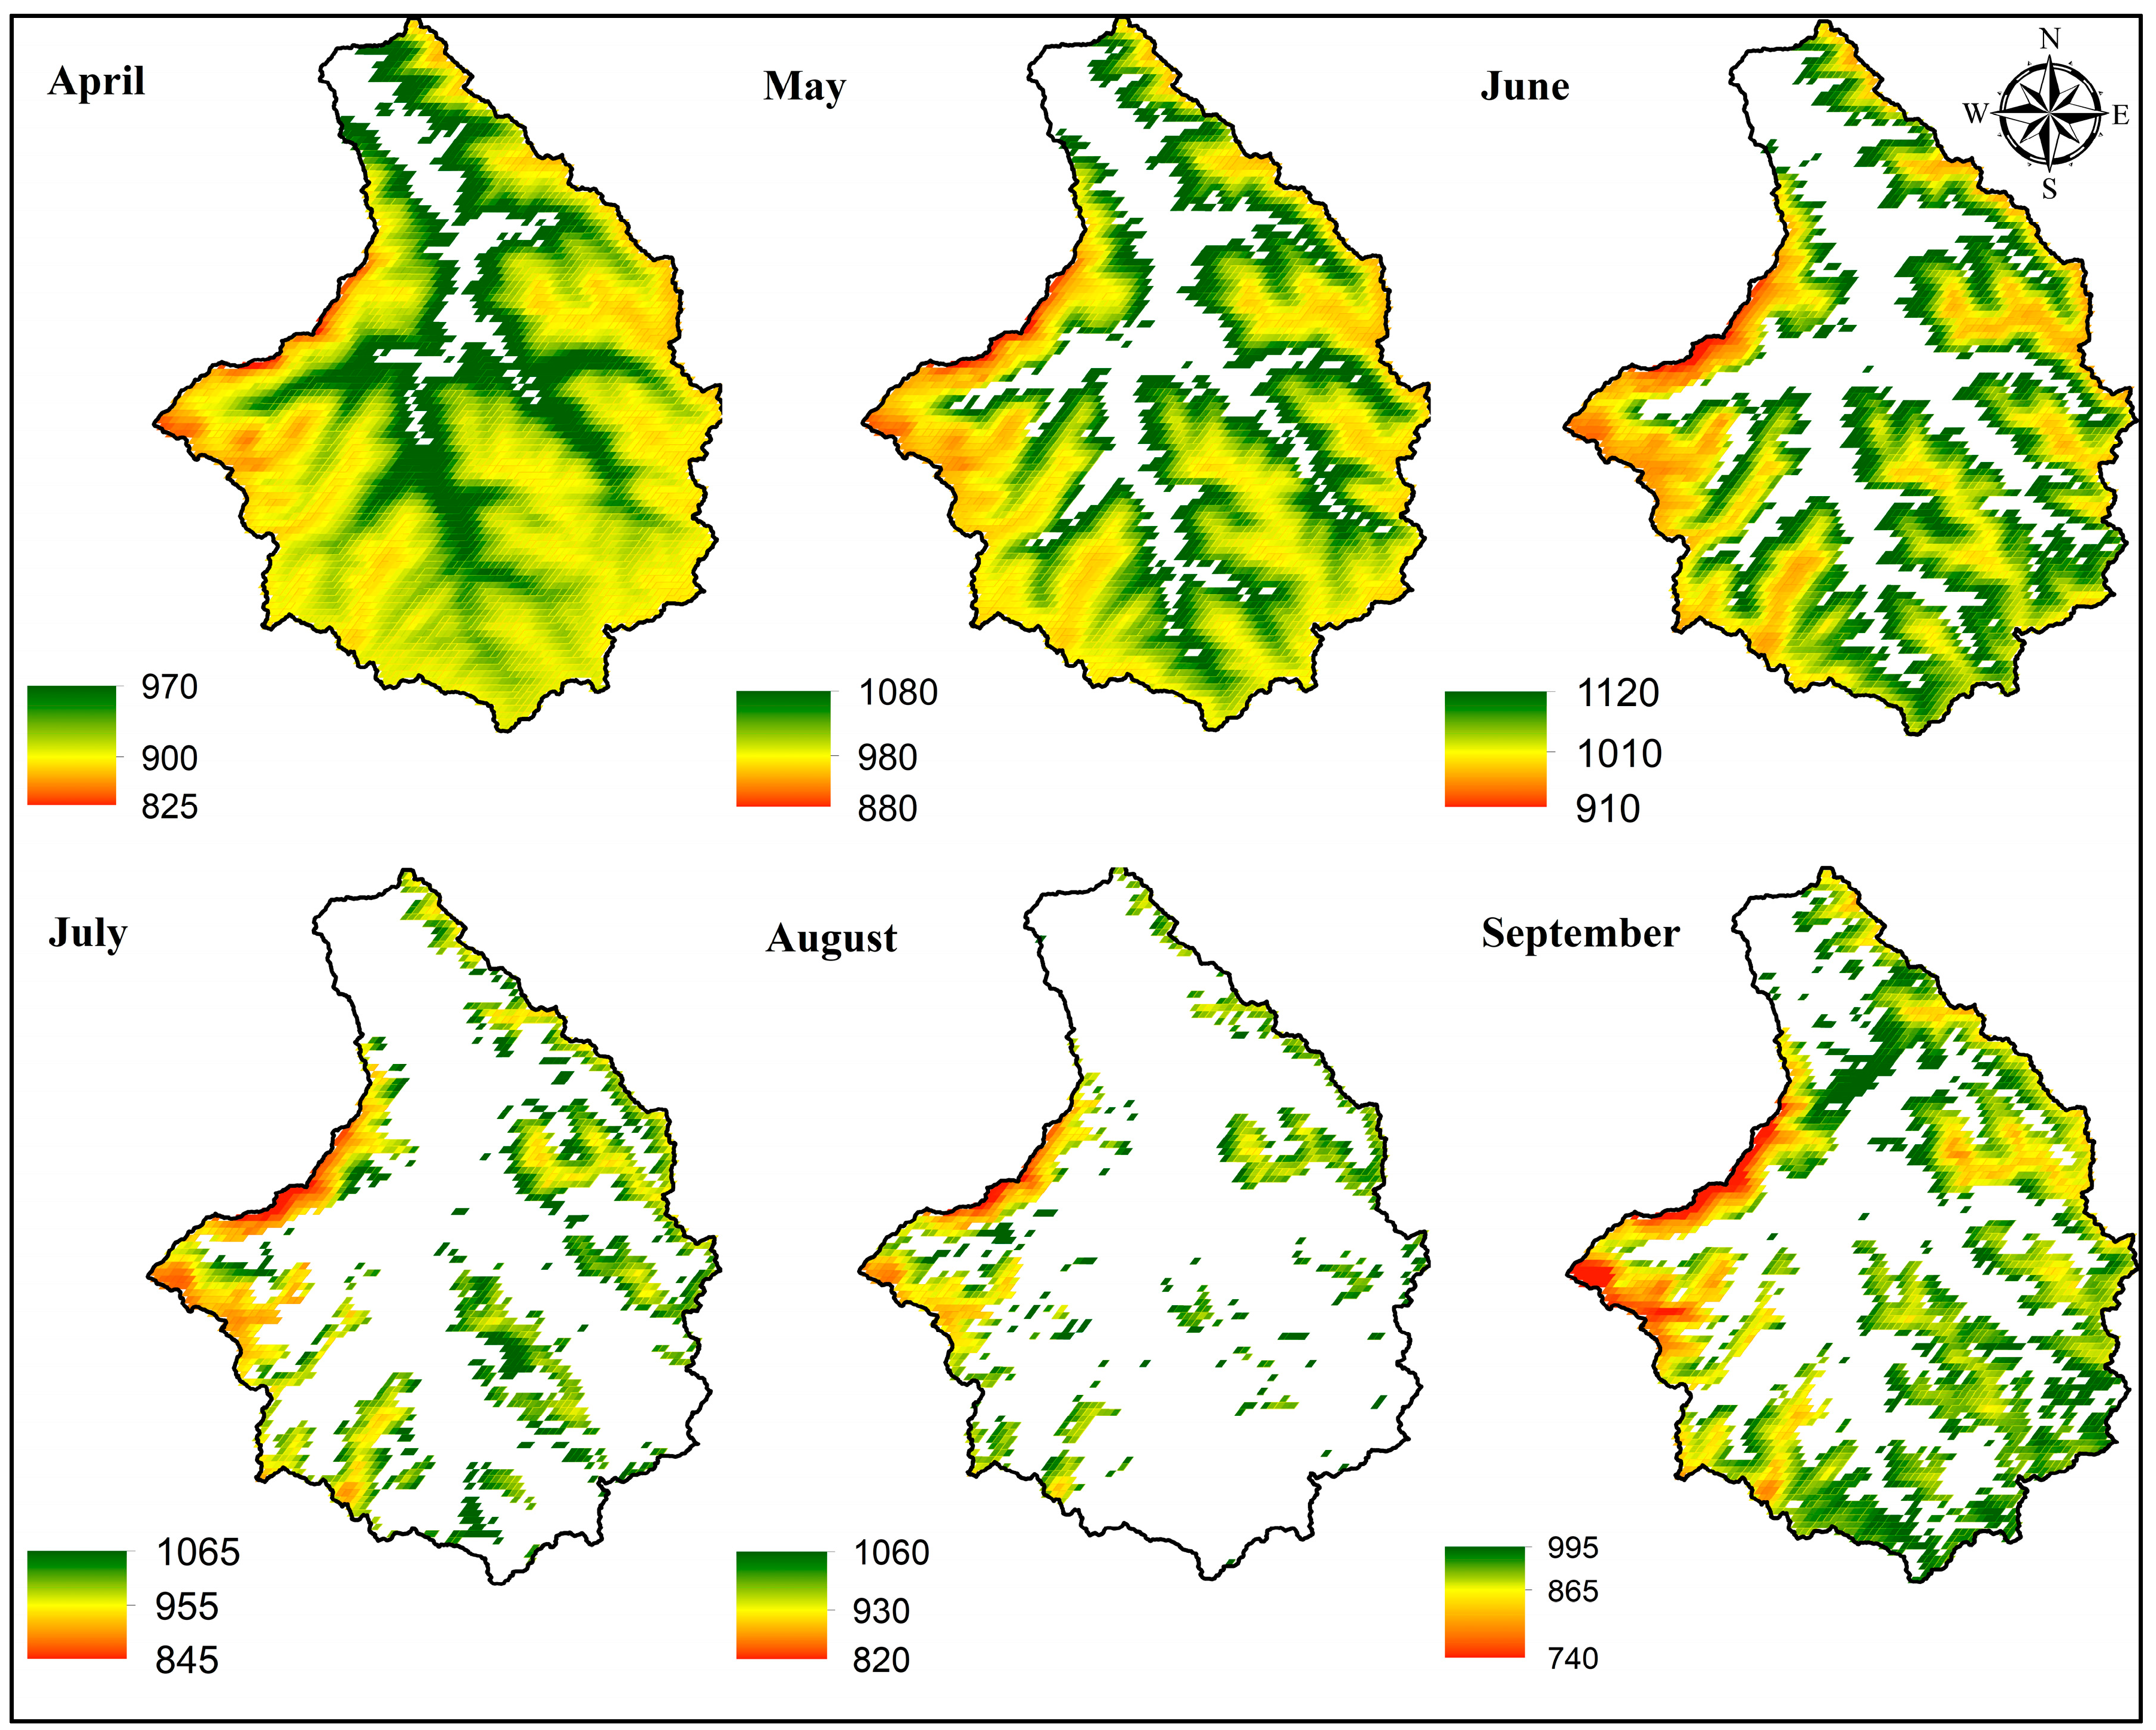
3.2. Snowmelt Water Release and Depth Maps
4. Conclusions
Author Contributions
Funding
Data Availability Statement
Acknowledgments
Conflicts of Interest
Abbreviations
| SWE | Snowmelt water release |
| SD | Snowmelt water depth |
| HDDs | Heating degree days |
| R | Solar radiation |
| WAPDA | Water and Power Development Authority |
| GMRC | Glacier Monitoring Research Centre |
| PMD | Pakistan Meteorological Department |
| MODIS | Moderate Resolution Imaging Spectroradiometer |
| NSIDC | National Snow and Ice Data Center |
| LST | Land surface temperature |
| SCA | Snow-cover area |
| SDC | Snow depletion curve |
| GPS | Global Positioning System |
| GIS | Geographic Information System |
| HDF | Hierarchical Data Format |
| HKH | Hindukush Karakoram Himalaya |
| b | Energy to water depth conversion ratio |
| a | Heating degree days coefficient. |
References
- Largeron, C.; Dumont, M.; Morin, S.; Boone, A.; Lafaysse, M.; Metref, S.; Cosme, E.; Jonas, T.; Winstral, A.; Margulis, S.A. Toward Snow Cover Estimation in Mountainous Areas Using Modern Data Assimilation Methods: A Review. Front. Earth Sci. 2020, 8, 325. [Google Scholar] [CrossRef]
- Hassan, Q.K.; Sekhon, N.S.; Magai, R.; McEachern, P. Reconstruction of snow water equivalent and snow depth using remote sensing data. J. Environ. Inform. 2012, 20, 67–74. [Google Scholar] [CrossRef]
- Stigter, E.M.; Wanders, N.; Saloranta, T.M.; Shea, J.M.; Bierkens, M.F.P.; Immerzeel, W.W. Assimilation of snow cover and snow depth into a snow model to estimate snow water equivalent and snowmelt runoff in a Himalayan catchment. Cryosphere 2017, 11, 1647–1664. [Google Scholar] [CrossRef]
- Yang, K.; Musselman, K.N.; Rittger, K.; Margulis, S.A.; Painter, T.H.; Molotch, N.P. Combining ground-based and remotely sensed snow data in a linear regression model for real-time estimation of snow water equivalent. Adv. Water Resour. 2022, 160, 104075. [Google Scholar] [CrossRef]
- Bavera, D.; De Michele, C. Snow water equivalent estimation in the Mallero basin using snow gauge data and MODIS images and fieldwork validation. Hydrol. Process 2009, 23, 1961–1972. [Google Scholar] [CrossRef]
- Majumdar, S. Snow Depth and Swe Estimation Using and Interferometric. Master’s Thesis, University of Twente, Enschede, The Netherlands, 2019. [Google Scholar]
- Cha, Y.; Park, S.S.; Kim, K.; Byeon, M.; Stow, C.A. Capabilities and limitations of tracing spatial temperature patterns by fiber-optic distributed temperature sensing. Water Resour. Res. 2014, 50, 5375–5377. [Google Scholar] [CrossRef]
- Sturm, M.; Taras, B.; Liston, G.E.; Derksen, C.; Jonas, T.; Lea, J. Estimating snow water equivalent using snow depth data and climate classes. J. Hydrometeorol. 2010, 11, 1380–1394. [Google Scholar] [CrossRef]
- Khan, I.U.; Iqbal, M.; Arshad, A.B.; Ali, Z.; Masood, M.U. Evaluation of Snow Characteristics in Astore Basin, Pakistan. In Proceedings of the 2nd Conference on Sustainable Water Resources Management 2022, Centre of Excellence in Water Resources Engineering, UET, Lahore, Pakistan, 16 November 2022; pp. 82–93, ISBN 978-969-8670-06-01. [Google Scholar]
- Zheng, Z.; Molotch, N.P.; Oroza, C.A.; Conklin, M.H.; Bales, R.C. Spatial snow water equivalent estimation for mountainous areas using wireless-sensor networks and remote-sensing products. Remote Sens. Environ. 2018, 215, 44–56. [Google Scholar] [CrossRef]
- Li, H.; Wang, Z.; He, G.; Man, W. Estimating snow depth and snow water equivalence using repeat-pass interferometric SAR in the northern piedmont region of the Tianshan Mountains. J. Sens. 2017, 2017, 8739598. [Google Scholar] [CrossRef]
- Li, D.; Durand, M.; Margulis, S.A. Estimating snow water equivalent in a Sierra Nevada watershed via spaceborne radiance data assimilation. Water Resour. Res. 2017, 53, 647–671. [Google Scholar] [CrossRef]
- Hassan, Q.K. Spatial mapping of growing degree days: An application of MODIS-based surface temperatures and enhanced vegetation index. J. Appl. Remote Sens. 2007, 1, 013511. [Google Scholar] [CrossRef]
- Hassan, Q.K.; Rahman, K.M.; Haque, A.S.; Ali, A. Solar energy modelling over a residential community in the City of Calgary, Alberta, Canada. Int. J. Photoenergy 2011, 2011, 216519. [Google Scholar] [CrossRef]
- Hassan, Q.K. Application of Landsat-7 ETM+ and MODIS products in mapping seasonal accumulation of growing degree days at an enhanced resolution. J. Appl. Remote Sens. 2007, 1, 013539. [Google Scholar] [CrossRef]
- Fily, M.; Dedieu, J.P.; Durand, Y. Comparison between the Results of a Snow Metamorphism Model and Remote Sensing Derived Snow Parameters in the Alps. Remote Sens. Environ. 1999, 68, 254–263. [Google Scholar] [CrossRef]
- Sekhon, N.S.; Hassan, Q.K.; Sleep, R.W. Evaluating potential of MODIS-based indices in determining ‘snow gone’ stage over forest-dominant regions. Remote Sens. 2010, 2, 1348–1363. [Google Scholar] [CrossRef]
- Wallrn, C.C. Global solar radiation and potential evapotranspiration in Sweden. Tellus 1966, 18, 786–800. [Google Scholar] [CrossRef]
- Jonas, T.; Marks, D. Estimating the snow water equivalent from snow depth data. J. Hydrol. 2016, 11, 1–4. [Google Scholar]
- Gustafson, J.R.; Brooks, P.D.; Molotch, N.P.; Veatch, W.C. Estimating snow sublimation using natural chemical and isotopic tracers across a gradient of solar radiation. Water Resour. Res. 2010, 46, W1251. [Google Scholar] [CrossRef]
- Welch, S.C.; Kerkez, B.; Bales, R.C.; Glaser, S.D.; Rittger, K.; Rice, R.R. Sensor placement strategies for snow water equivalent (SWE) estimation in the American River basin. Water Resour. Res. 2013, 49, 891–903. [Google Scholar] [CrossRef]
- Boon, S. Snow Accumulation and Ablation in a Beetle-Killed Pine Stand in Northern Interior British Columbia 2007. Available online: https://doi.org/10.22230/jem.2007v8n3a369 (accessed on 29 August 2021).
- Pistocchi, A.; Bagli, S.; Callegari, M.; Notarnicola, C.; Mazzoli, P. On the Direct Calculation of Snow Water Balances Using Snow Cover Information—Enhanced Reader. Water 2017, 9, 848. [Google Scholar] [CrossRef]
- Akther, M.S.; Hassan, Q.K. Remote sensing based estimates of surface wetness conditions and growing degree days over northern Alberta, Canada. Boreal. Environ. Res. 2011, 16, 407–416. [Google Scholar]
- Tahir, A.A.; Chevallier, P.; Arnaud, Y.; Ashraf, M.; Bhatti, M.T. Snow cover trend and hydrological characteristics of the Astore River basin (Western Himalayas) and its comparison to the Hunza basin (Karakoram region). Sci. Total Environ. 2014, 505, 748–761. [Google Scholar] [CrossRef] [PubMed]
- Farhan, S.B.; Zhang, Y.; Ma, Y.; Guo, Y.; Ma, N. Hydrological regimes under the conjunction of westerly and monsoon climates: A case investigation in the Astore Basin, Northwestern Himalaya. Clim. Dyn. 2015, 44, 3015–3032. [Google Scholar] [CrossRef]
- Shamir, E.; Georgakakos, K.P. Estimating snow depletion curves for American River basins using distributed snow modeling. J. Hydrol. 2007, 334, 162–173. [Google Scholar] [CrossRef]
- Adnan, M.; Nabi, G.; Kang, S.; Zhang, G.; Adnan, R.M.; Anjum, M.N.; Iqbal, M.; Ali, A.F. Snowmelt runoff modelling under projected climate change patterns in the Gilgit river basin of northern Pakistan. Pol. J. Environ. Stud. 2017, 26, 525–542. [Google Scholar] [CrossRef]
- Jain, V.; Dhingra, A.; Gupta, E.; Takkar, I.; Jain, R.; Islam, S.M.N. Influence of Land Surface Temperature and Rainfall on Surface Water Change: An Innovative Machine Learning Approach. Water Resour. Manag. 2023, 37, 3013–3035. [Google Scholar] [CrossRef]
- Molotch, N.P.; Margulis, S.A. Estimating the distribution of snow water equivalent using remotely sensed snow cover data and a spatially distributed snowmelt model: A multi-resolution, multi-sensor comparison. Adv. Water Resour. 2008, 31, 1503–1514. [Google Scholar] [CrossRef]
- Brubaker, K.; Rango, A.; Kustas, W.; Brubaker, K.; Rango, A.; Kustas, W. Incorporating Radiation Inputs into the Snowmelt Runoff Model. Hydrol. Process 1996, 10, 1329–1343. [Google Scholar] [CrossRef]
- Melloh, R.R. A Synopsis and Comparison of Selected Snowmelt Algorithms; Cold Regions Research and Engineering Laboratory: Hanover, NH, USA, 1999; p. 24. [Google Scholar]
- Klein, A.G.; Barnett, A.C. Validation of daily MODIS snow cover maps of the Upper Rio Grande River Basin for the 2000–2001 snow year. Remote Sens. Environ. 2003, 86, 162–176. [Google Scholar] [CrossRef]
- Parajka, J.; Blöschl, G. Validation of MODIS snow cover images over Austria. Hydrol. Earth Syst. Sci. 2006, 10, 679–689. [Google Scholar] [CrossRef]
- Shrestha, A.B.; Joshi, S.P. Snow Cover and Glacier Change Study in Nepalese Himalaya Using Remote Sensing and Geographic Information System. J. Hydrol. Meteorol. 1970, 6, 26–36. [Google Scholar] [CrossRef]
- Ashraf, A.; Ahmad, S.S.; Aziz, N.; Shah, M.T.A. Preliminary Estimation of Snow Covers Extents of Astore River Basin in Northern Areas, Pakistan. J. Geogr. Geol. 2012, 4, 124–133. [Google Scholar] [CrossRef]
- Dahri, Z.H.; Ahmad, B.; Leach, J.H.; Ahmad, S. Satellite-based snowcover distribution and associated snowmelt runoff modeling in Swat River Basin of Pakistan. Proc. Pak. Acad. Sci. 2011, 48, 19–32. [Google Scholar]
- Bashir, F.; Rasul, G. Estimation of Average Snow Cover over Northern Pakistan. Pak. J. Meteorol. 2010, 7, 63–69. [Google Scholar]


| Source | Data | Description |
|---|---|---|
| NASA | MODIS 8-day snow cover images, with a 500 m spatial resolution (MOD10A2). | These images were used to calculate the snow-cover area. |
| NASA | MODIS 8-day land surface temperature (LST), with a 1 km spatial resolution (MOD11A2). | This product was used to calculate the heating degree days. |
| WAPDA | Solar radiation on a daily basis for the period of 2010–2020 at the Rama and Rattu stations. | This information was used to generate SWE and SD maps and develop them in relation to the HDDs. |
| PMD | Solar radiation on a daily basis for the period of 2010–2020 at Astore Station. | |
| Astore river basin | Snow weight and snow depth data of fresh and settled snow samples at 26 locations. | These data were used to calibrate and validate the model. |
| Sr. No. | Month | Snow-Cover Area (km2) | Snow-Cover Area (%) |
|---|---|---|---|
| 1 | January | 3718 | 93 |
| 2 | February | 3767 | 94 |
| 3 | March | 3767 | 94 |
| 4 | April | 3657 | 91 |
| 5 | May | 3206 | 80 |
| 6 | June | 2608 | 65 |
| 7 | July | 1591 | 39 |
| 8 | August | 800 | 20 |
| 9 | September | 1591 | 39 |
| 10 | October | 2740 | 68 |
| 11 | November | 3540 | 88 |
| 12 | December | 3695 | 92 |
Disclaimer/Publisher’s Note: The statements, opinions and data contained in all publications are solely those of the individual author(s) and contributor(s) and not of MDPI and/or the editor(s). MDPI and/or the editor(s) disclaim responsibility for any injury to people or property resulting from any ideas, methods, instructions or products referred to in the content. |
© 2025 by the authors. Licensee MDPI, Basel, Switzerland. This article is an open access article distributed under the terms and conditions of the Creative Commons Attribution (CC BY) license (https://creativecommons.org/licenses/by/4.0/).
Share and Cite
Khan, I.U.; Iqbal, M.; Ali, Z.; Arshed, A.B.; Wang, M.; Adnan, R.M. Evaluation and Mapping of Snow Characteristics Using Remote Sensing Data in Astore River Basin, Pakistan. Atmosphere 2025, 16, 550. https://doi.org/10.3390/atmos16050550
Khan IU, Iqbal M, Ali Z, Arshed AB, Wang M, Adnan RM. Evaluation and Mapping of Snow Characteristics Using Remote Sensing Data in Astore River Basin, Pakistan. Atmosphere. 2025; 16(5):550. https://doi.org/10.3390/atmos16050550
Chicago/Turabian StyleKhan, Ihsan Ullah, Mudassar Iqbal, Zeshan Ali, Abu Bakar Arshed, Mo Wang, and Rana Muhammad Adnan. 2025. "Evaluation and Mapping of Snow Characteristics Using Remote Sensing Data in Astore River Basin, Pakistan" Atmosphere 16, no. 5: 550. https://doi.org/10.3390/atmos16050550
APA StyleKhan, I. U., Iqbal, M., Ali, Z., Arshed, A. B., Wang, M., & Adnan, R. M. (2025). Evaluation and Mapping of Snow Characteristics Using Remote Sensing Data in Astore River Basin, Pakistan. Atmosphere, 16(5), 550. https://doi.org/10.3390/atmos16050550