Article

Analysis of VOC Emission Characteristics in the Petrochemical Industry and Study on Fenceline Monitoring Techniques

1
Department of Health Science, Korea University, Anam-ro 145, Seongbuk-gu, Seoul 02841, Republic of Korea
2
Department of Public Health, College of Medicine, Korea University, Anam-ro 145, Seongbuk-gu, Seoul 02841, Republic of Korea
3
Environmental Research Complex, National Institute of Environmental Research, Hwangyeong-ro 42, Seo-gu, Incheon 22689, Republic of Korea
*
Author to whom correspondence should be addressed.
Atmosphere 2025, 16(5), 543; https://doi.org/10.3390/atmos16050543
Submission received: 31 March 2025 / Revised: 24 April 2025 / Accepted: 30 April 2025 / Published: 4 May 2025

Abstract

:
Volatile organic compounds (VOCs) contribute to air pollution and pose health risks. This study investigates VOC emissions from petroleum refining and petrochemical industries using passive and active fenceline monitoring techniques. The primary objective of this research is to compare the characteristics and detection performance of passive and active sampling methods for VOC monitoring, particularly focusing on benzene and other major components, such as BTEX. A total of 87 VOC species were analyzed, with benzene, toluene, ethylbenzene, and xylene (BTEX) being dominant. Passive sampling detected benzene at an average concentration of 3.60 µg/m3, whereas active sampling recorded 1.33 µg/m3, showing up to 2.5 times higher values in passive sampling. In certain locations, benzene levels exceeded the EPA action level of 9 µg/m3, with a peak value of 18.37 µg/m3 at one sampling point. Meteorological conditions significantly influenced VOC concentrations, with stronger winds dispersing emissions more widely. This study provides crucial data for VOC emission control and regulatory policy development, emphasizing the need for continuous monitoring and targeted reduction strategies in industrial zones.

1. Introduction

Volatile organic compounds (VOCs) readily evaporate into the atmosphere, where they engage in photochemical reactions to produce ozone (O3) and secondary pollutants. These emissions are major factors in the degradation of air quality and an increase in health risks [1]. Certain VOCs, such as benzene and 1,3-butadiene, are known carcinogens and have been associated with severe health issues, including leukemia, respiratory diseases, and neurological damage, following prolonged exposure. To address these concerns, several countries have implemented regulatory measures and monitoring systems designed to reduce VOC emissions [2].

1.1. Characteristics of VOC Emissions in Industrial Complexes and the Petroleum Refining and Petrochemical Industries

Petroleum refining and petrochemical manufacturing are recognized as major sources of volatile organic compounds (VOCs), particularly during crude oil refining and the production of petrochemical products [3]. Substantial emissions of VOCs are generated from storage tanks, separation and distillation processes, reaction processes, and purification processes, which adversely impact air quality in neighboring areas. Given these emission characteristics, monitoring VOC concentrations at the boundaries of facility sites (fenceline) is critical [4]. As a result, real-time emission monitoring systems using fenceline monitoring techniques have been established in the United States, Canada, and Europe, with discussions ongoing in South Korea [5].

1.2. VOC Fenceline Monitoring Regulations and Rule 1180 in the United States

The United States Environmental Protection Agency (EPA) enforces fenceline monitoring regulations, utilizing Method 325A/B to monitor VOC emissions in industrial complexes. These regulations mandate that oil refineries and chemical plants employ passive sampling techniques to measure VOC concentrations over extended periods at the facility boundaries, with a requirement to report these data to environmental authorities [6].
The California Air Resources Board (CARB) has implemented Rule 1180, which mandates the real-time monitoring of VOCs around refineries and ensures that local residents are promptly informed when concentrations exceed defined thresholds [7].
Rule 1180 emphasizes monitoring benzene due to its high toxicity and carcinogenicity. Benzene is classified as a Group 1 Carcinogen by the International Agency for Research on Cancer (IARC), capable of inducing blood cancers such as leukemia, even from prolonged exposure to low concentrations [8]. In addition, the regulation aims to protect the health of communities near industrial complexes, as benzene emissions from oil refineries, petrochemical plants, and automotive fuel storage facilities significantly affect the long-term health of nearby residents [9].
Thus, Rule 1180 identifies benzene as a significant VOC for monitoring, setting protocols to immediately alert the community if concentrations surpass specific levels. Due to benzene’s high volatility and its ability to remain in the atmosphere for extended periods, its concentrations can escalate over broad areas beyond the facility boundaries. This feature is closely monitored under Rule 1180 to ensure both community safety and adherence to environmental standards [10].

1.3. VOC Monitoring and Regulatory Standards in Canada

Canada has implemented a variety of regulations for monitoring and managing the emissions of volatile organic compounds (VOCs), similar to approaches in the United States. Environment and Climate Change Canada (ECCC) mandates that facilities report their VOC emissions through the National Pollutant Release Inventory (NPRI). Moreover, several regions operate monitoring systems that measure VOCs at the facility boundaries (fenceline) [11].
The “Reduction in the Release of Volatile Organic Compounds Regulations (Petroleum Sector)” in Canada necessitate the implementation of a fenceline monitoring program. This program encompasses the following key aspects [12].
Sampling Method: Utilization of passive sampling techniques.
Sampling Duration: Each sampling tube collects VOCs from the air continuously over a 14-day period.
Analysis Method: Analysis of the collected samples is conducted using thermal desorption gas chromatography/mass spectrometry (TD-GC/MS).
Standard Compliance: Compliance with the United States Environmental Protection Agency (EPA) Method 325A/B is required.
Regulatory Standards and Action Levels
Canadian fenceline monitoring regulations do not set “action levels” for specific VOCs; instead, they require facilities to submit their measurement data.
Canadian regulations do not compel immediate action if benzene levels exceed specified thresholds, in contrast to U.S. practices. Nonetheless, certain regions (e.g., Ontario) conduct independent evaluations and manage concentrations of benzene and 1,3-butadiene.

1.4. Regulation of VOCs and the Current Status of the Clean Air Conservation Act in South Korea

In South Korea, the regulation of VOCs emitted from facilities is managed under the Clean Air Conservation Act. The Ministry of Environment, guided by Article 23 of the Clean Air Conservation Act, administers systems for the comprehensive control of air pollutants and for managing specific harmful air substances. This administration particularly targets VOCs such as benzene, toluene, and xylene (BTEX), which are identified as critical substances requiring rigorous management [13].
Currently, South Korea utilizes a variety of methods to control VOC emissions, including a facility permit system, a chimney remote monitoring system (TMS), and a voluntary management system at workplaces. Despite these measures, the country still faces challenges in acquiring accurate VOC measurement data at facility boundaries (fenceline) and in maintaining a continuous monitoring system [14].
Given these challenges, there is an apparent need to implement fenceline monitoring, with reference to practices in the U.S. EPA and Canada, to establish a system for long-term monitoring of concentrations at the boundaries of facilities emitting VOCs. Furthermore, amending the Clean Air Conservation Act to enhance the legal framework, thus facilitating immediate responses when specific VOC concentrations exceed the action level, is considered essential.
Therefore, this study aims to conduct detailed speciation analysis of VOCs, with a particular focus on benzene, emitted from petroleum refining and petrochemical manufacturing facilities in South Korea. It further seeks to compare the results of passive and active fenceline monitoring techniques currently applied at industrial sites. To enhance reliability, this study also includes methodological descriptions related to detection techniques and discusses the uncertainty associated with the measurement data, ensuring scientific transparency and supporting policy development based on accurate environmental information.

2. Materials and Methods

2.1. Study Subjects and Measurement Facilities

The petrochemical industry encompasses a wide spectrum of operations, including petroleum refining, which transforms crude oil into petroleum products and related items, and the production of basic chemical compounds. These compounds are produced by decomposing and separating the hydrocarbons present in petroleum to create basic chemical products and their derivatives. Facilities within the petrochemical sector that manufacture basic chemical compounds typically process diesel and naphtha obtained from petroleum refining to produce essential compounds, such as ethylene and propylene. Domestically, facilities engaged in manufacturing petroleum products and petrochemical basic compounds are classified based on the presence of a naphtha cracking process. Accordingly, two major facilities that incorporate this process were selected from the domestic petrochemical basic compound manufacturing sector (Table 1).
For each facility, the processing plots were defined, and specific measurement points were established. In accordance with EPA Method 325A/B, 18 measurement points were set up at both Study Facility A and Study Facility B, based on the ground area (Figure 1). Details concerning each point, including the adjacent processes and the primary products manufactured, are provided in Table 2.

2.2. Measurement Techniques

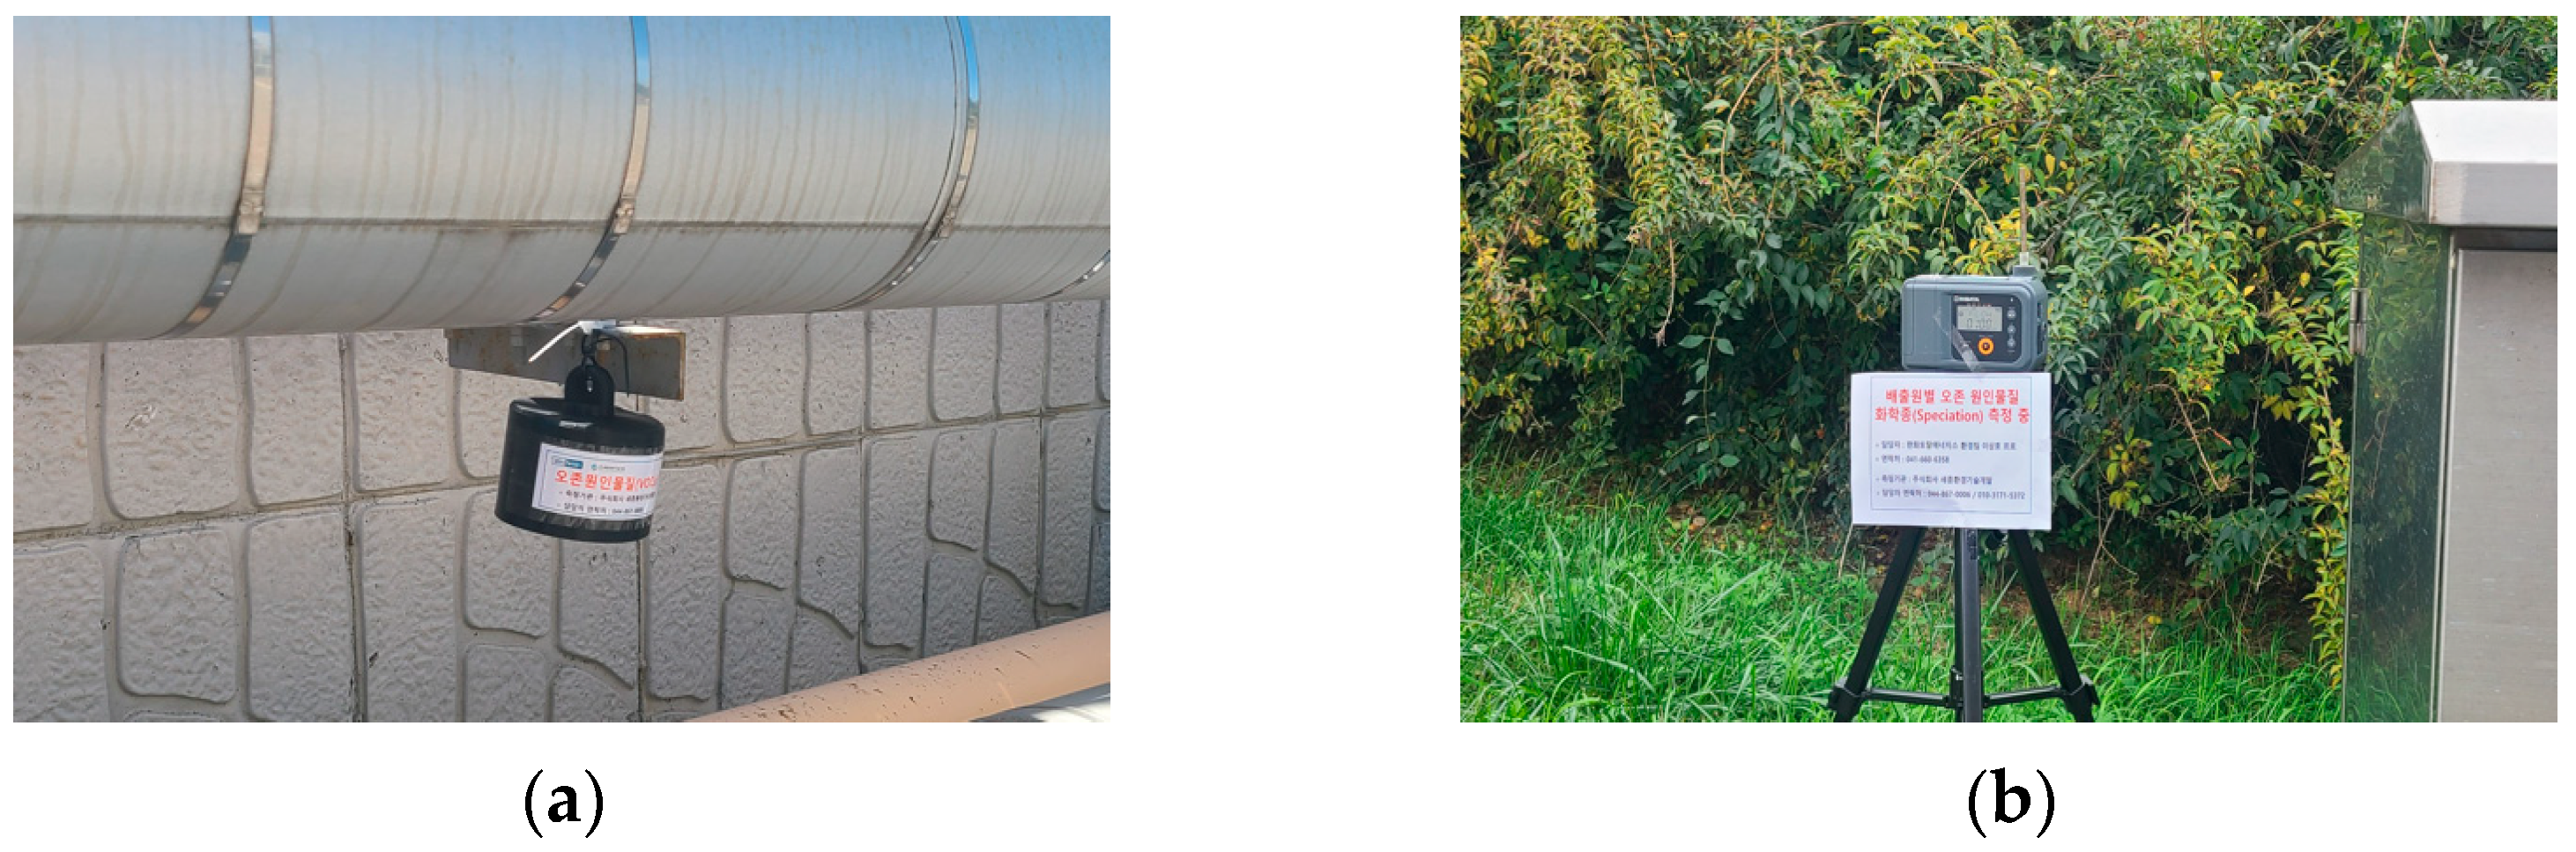
2.2.1. Passive Sampling

In the study facilities, samplers were positioned vertically at the same locations as the active sampling points, ensuring that the diffusive sampling cap was situated 1.5 m above the ground. Sampling occurred continuously over a period of 14 days [15] (Table 3).

2.2.2. Active Sampling

At the study facilities, a suction pump (SIBATA, MP-Σ100) facilitated sample collection at a flow rate of 100 mL/min, accumulating a total of 6 L of samples, conducted twice in the morning and three times in the afternoon. The VOC sampling adsorption tube adhered to the guidelines for sorbent selection from EPA Method TO-17, utilizing a Carbotrap 300 (1/4 in. × 3 1/2 in filled with Carbopak C, Carbopak B, and Carbosieve SIII. The measurement points were strategically placed based on the facility’s site area, in accordance with EPA fenceline monitoring techniques, with measurements taken every 20 degrees from the site’s central point [16].

2.2.3. Sampling Dates
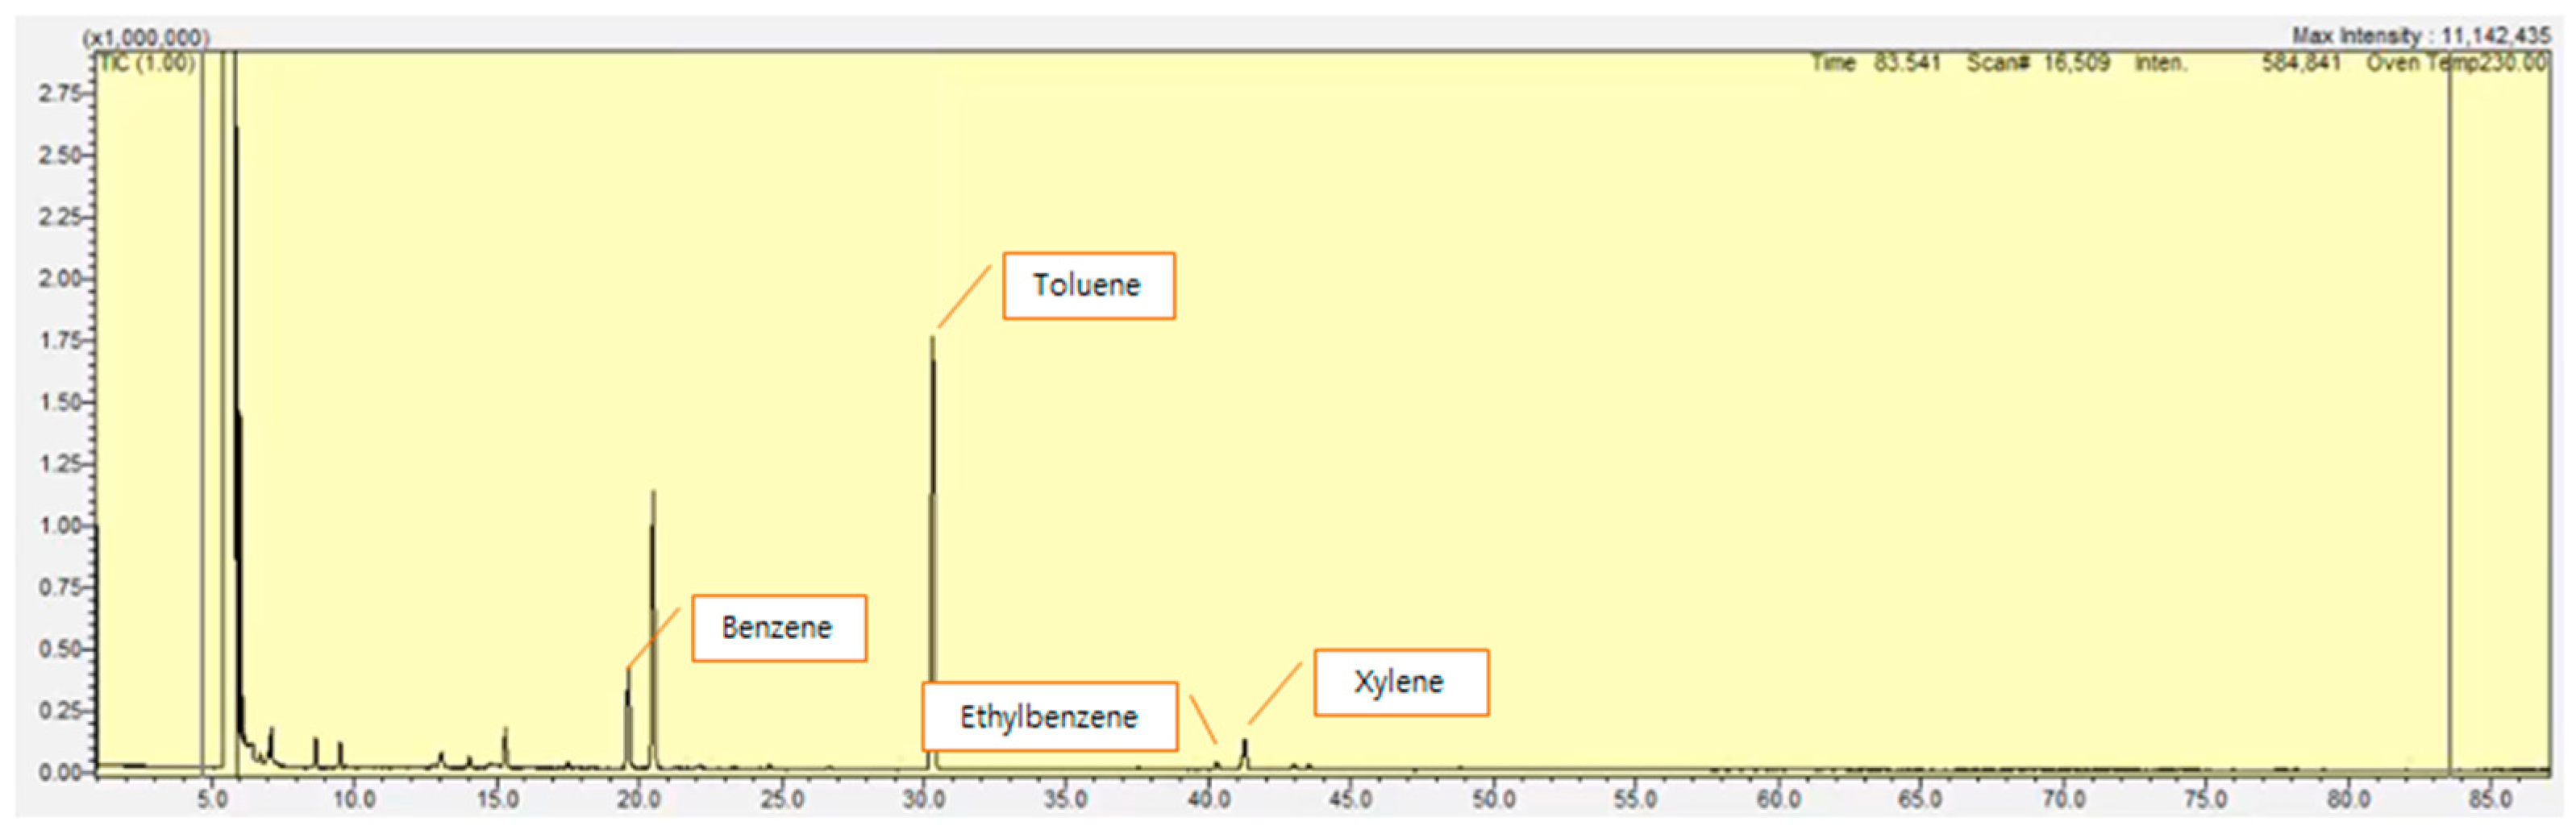
Throughout the study facilities, monitoring included one session of passive sampling and one session of active sampling (Figure 2) conducted annually between May and November (Table 4).

2.3. Analytes

This analysis encompasses 79 distinct compounds from the 57 ozone precursor substances listed in PAMS and the 43 items from TO-14, after excluding duplicates (Table 5). Furthermore, the study focuses on substances for which the passive method allows calculable concentration conversions using the uptake rate [17,18].
The chromatographic analysis was conducted using thermal desorption gas chromatography/mass spectrometry (TD-GC/MS) for passive samples and EPA Method TO-17 for active samples. Figure 3 presents an example chromatogram showing major target VOCs, such as benzene, toluene, ethylbenzene, and xylene (BTEX), which were commonly detected in both passive and active measurements (Figure 3).
In this study, rigorous quality assurance and quality control (QA/QC) procedures were implemented to ensure the accuracy and reliability of VOC concentration data obtained from both passive and active sampling. For passive samples, blank tests were conducted before and after sampling, and the sorbent tubes were sealed and stored in a cold, dark environment to prevent contamination. Active sampling devices were pre-calibrated using a standard flow calibrator, and duplicate samples were collected at selected locations to evaluate measurement reproducibility. All analyses were performed in accordance with EPA Methods TO-17 and 325B, and the detection limits were confirmed through spiked recovery experiments. These QA/QC efforts contributed to the validity of the reported concentrations and minimized analytical uncertainty.
In particular, spiked validation tests conducted for BTEX compounds (benzene, toluene, and ethylbenzene) demonstrated high analytical precision and reliability. The relative standard deviations (RSDs) for all compounds were below 4%, and the average accuracy was 97.6%. The detection limits ranged from 0.7 to 1.8 ng/mL, and the quantification limits ranged from 2.2 to 5.7 ng/mL, all of which are well within acceptable environmental and regulatory thresholds. These results confirm that the analytical methods used in this study ensure quantitative reliability and support the scientific credibility of the VOC measurement data (Table 6).

3. Results

3.1. Study Facility A

(1)
LD/LDD Process
For the LD/LDD process at Points 2 and 3, synthetic resins are manufactured using ethylene and styrene monomer. This location was part of both the first passive and the second active sampling campaigns. The expectation was to detect ethylene and styrene monomer. The VOC composition from the initial passive analysis showed butane at 37%, isopentane at 14%, isobutane at 11%, 1-butene at 10%, and 3-methylpentane at 7%. Despite expectations, ethylene was not detected, while styrene monomer was present at 0.9%.
The subsequent active measurement revealed substantial amounts of other substances, with 1-butene at 36%, trans-2-butene at 31%, cis-2-butene at 29%, 1-hexene at 1%, and n-pentane at 1%. Neither ethylene nor styrene monomer were found in the active measurement results.
(2)
ADL PE Process
This production process, located at Point 4, involves using ethylene and propylene to produce PE and PP. The process was part of both the first passive and the second active sampling campaigns. The expected substances to be detected were ethylene, propylene, polyethylene, and polypropylene. The VOC composition from the first passive analysis comprised n-butane at 42%, isopentane at 14%, isobutane at 12%, m,p-xylene at 10%, and benzene at 5%.
The second active measurement results indicated significant detection of other substances, with 1-butene at 42%, trans-2-butene at 28%, cis-2-butene at 27%, n-pentane at 2%, and 1-hexene at 1%. Neither ethylene nor propylene were detected in the passive or active measurements.
(3)
EVA Process
Located at Points 5 and 6, the EVA process manufactures polypropylene using ethylene and propylene as primary materials. The expected detection of ethylene, propylene, and polyethylene was confirmed through initial passive analysis, which revealed VOC compositions with n-butane at 49%, isopentane at 11%, isobutane at 10%, 1-butene at 8%, and m,p-xylene at 6%.
The subsequent active measurements, excluding 1-butene, showed substantial quantities of substances not identified in the passive analysis. The detected substances included 1-butene at 37%, trans-2-butene at 28%, cis-2-butene at 28%, 2,2-dimethylbutane at 2%, and n-pentane at 1%. Surprisingly, neither ethylene nor propylene were detected at these points, mirroring the findings from the ADL PE process.
(4)
PP4 Process
The PP4 process, conducted at Point 7, focuses on producing PP from ethylene. The detection of ethylene and polypropylene was anticipated. The VOC composition from the first passive analysis of this region showed n-butane at 43%, isopentane at 16%, isobutane at 11%, 1-butene at 7%, and m,p-xylene at 6%.
Further analysis through active measurements, which excluded n-butane and 1-butene, revealed a considerable presence of substances that were not detected previously. The concentrations were 1-butene at 25%, cis-2-butene at 20%, trans-2-butene at 19%, 3-methylpentane at 17%, and n-butane at 7%.
(5)
CFU/ARO#2 Process
The CFU/ARO#2 process, conducted at Points 8, 9, and 10, employs heavy naphtha for the production of benzene, gasoline, and solvents, or for refining crude oil. The substances anticipated for detection included gasoline, benzene, and paraxylene. According to the initial passive analysis, the VOC composition in this area was characterized by n-butane at 46%, isopentane at 16%, isobutane at 12%, 1-butene at 7%, and m,p-xylene at 4%. In addition, the concentration of paraxylene was confirmed.
The subsequent active measurements, excluding n-butane and 1-butene, indicated a significant presence of substances not detected in the passive analysis, with 2,2-dimethylbutane at 22%, 1-butene at 19%, cis-2-butene at 15%, trans-2-butene at 14%, and n-butane at 9%. While the concentrations were lower compared to the passive results, m,p-xylene was detected at a rate of 1% in the active measurements.
(6)
PTA
Located at Points 12 and 13, the PTA process involves distilling or hydrogenating xylene to produce high-purity terephthalic acid. Xylene and terephthalic acid were the substances expected to be detected. The first passive analysis revealed the VOC composition in this region as n-butane at 57%, isopentane at 15%, isobutane at 10%, n-pentane at 5%, and m,p-xylene at 4%. In addition, o-xylene, which was also expected, was detected at a rate of 1%.
Subsequent active measurements uncovered a substantial presence of substances not found in the passive analysis, including 1-butene at 45%, trans-2-butene at 18%, cis-2-butene at 13%, isopentane at 10%, and n-pentane at 5%. The detected concentrations of xylene variants in the active measurements were lower compared to the passive results, with m,p-xylene at 0.7% and o-xylene at 0.4%.
(7)
TANK YARD
This process, conducted at Points 11, 14, and 15, focuses on the storage of crude oil and related products. The VOC composition in this area, as revealed by the initial passive analysis, consisted of n-butane at 48%, isobutane at 15%, isopentane at 10%, 1-butene at 9%, and n-hexane at 5%.
Subsequent active measurements, after excluding 1-butene and isobutane, revealed a significant presence of substances not identified in the passive analysis, including 1-butene at 45%, trans-2-butene at 18%, cis-2-butene at 13%, isopentane at 10%, and n-pentane at 5%.
(8)
SM #1, #2
Located at Point 16, the SM #1, #2 process entails synthesizing styrene monomer or PE resin using ethylene. The substances anticipated for detection were ethylene and styrene monomer. The first passive analysis of VOC composition displayed cyclohexane at 60%, n-butane at 15%, toluene at 11%, isobutane at 3%, and 1-butene at 2%.
The toluene concentration at this point was notably high, measured at 57.53 µg/m3, markedly above the average of 7.84 µg/m3 observed at other points.
The findings from the second set of active measurements, after excluding n-butane, isobutane, and 1-butene, identified the detection of additional substances that were not detected in the passive analysis. These included n-butane at 25%, isobutane at 22%, propane at 14%, trans-2-butene at 9%, and 1-butene at 8%. Although styrene was detected at a rate of 1% in the passive measurements, it was absent in the active measurements.
(9)
NCC Process
The NCC process, located at Points 17 and 18, employs light naphtha that has been processed through the refinery (CFU) to manufacture products. Ethylene and propylene were expected to be detected. The initial passive analysis revealed the VOC composition in this area to include 1-butane at 20%, propylene at 16%, n-butane at 15%, cyclohexane at 10%, and toluene at 9%.
The subsequent active measurements, which excluded 1-butene and toluene, revealed significant amounts of previously undetected substances. These included 1-butene at 31%, trans-2-butene at 23%, cis-2-butene at 22%, 3-methylpentane at 14%, and toluene at 2%.
Notably, butanes predominated; yet, high concentrations of benzene were observed at Points 17 and 18, with Point 18 recording a benzene concentration of 18.37 µg/m3, surpassing the action level for the facility (compared to an average of 3.60 µg/m3 at other points).
(10)
BTX Process
Located at Point 1, the BTX process focuses on the production of aromatic products. Benzene, toluene, and xylene were expected to be detected. The first passive analysis of VOC composition displayed 1-hexene at 37%, propane at 14%, methylcyclopentane at 12%, methylcyclohexane at 11%, and ethylbenzene at 6%. The detected levels of the anticipated substances—benzene, toluene, and xylene—were relatively low, at 3%, 1%, and 2%, respectively.
The findings from the second set of active measurements uncovered a substantial presence of substances not identified in the passive analysis, including 1-butene at 29%, trans-2-butene at 28%, cis-2-butene at 26%, n-hexane at 4%, and n-pentane at 3%. While the concentration of benzene was lower in the active measurements at 0.7%, the amounts of toluene and xylene were consistent with the passive results, registering at 1% and 2%, respectively.
(11)
General Discussion and Observations
At Study Facility A, ethylene and propylene, the VOCs expected to be detected, were identified exclusively at Point 18.
Among the substances for which concentrations were ascertainable through passive sampling, aromatic hydrocarbons such as benzene, toluene, ethylbenzene, xylene, and styrene showed concentrations exceeding 1 µg/m3 (benzene at 3.6 µg/m3, toluene at 7.8 µg/m3, ethylbenzene at 1.3 µg/m3, xylene at 4.6 µg/m3, and styrene at 1.5 µg/m3). Other substances were present at very low concentrations below 0.1 µg/m3. Although the average concentration fell below the action level, notably high concentrations of 12.54 µg/m3 and 18.37 µg/m3 were recorded at Points 14 and 18, respectively, surpassing the established action level of 9 µg/m3.
The notably high concentrations of benzene and toluene near Points 16, 17, and 18 suggest a need to trace and monitor potential leaks of benzene from the NCC cracking and SM processes. Despite the inability to compare active measurement results for Point 17 due to internal constraints at the facility, the elevated concentrations observed at adjacent Points 16 and 18 highlight the necessity for ongoing monitoring.
The examination of the total VOCs captured and the wind direction indicated that winds were more robust on the days when active measurements were conducted than on those of passive measurements (wind speeds during passive measurements ranged from 3–5 m/s compared to 3–8 m/s during active measurements) (Figure 4).
While western winds prevailed during the passive analysis, a significantly higher total amount was captured at Point 17. In contrast, during active measurements influenced by winds blowing toward the lower right, large quantities were detected at Points 3 and 4.
These findings imply that if the emissions from the process are substantial, they are more influenced by the volume of emissions than by the wind. Nevertheless, if wind speeds rise to between 5 m/s and 8 m/s, the effects of the wind may surpass those of the VOCs emitted from the process.

3.2. Study Facility B

(1)
Plant 1 CDU, VDU, HCR, HDS, DCU Processes
Located at Points 1 and 18, this section includes facilities for atmospheric distillation, vacuum distillation, hydrocracking, and thermal cracking. The initial passive analysis of the VOC composition revealed 1-butane at 28%, isobutane at 25%, n-pentane at 15%, n-butane at 13%, and isopentane at 8%. Subsequent active measurements, with the exclusion of n-butane and isobutane, showed significant detections of previously undetected substances, including n-butane and isobutane each at 24%, 3-methylpentane at 10%, 2,2-dimethylbutane at 7%, and trans-2-butene at 7%.
(2)
Plant 2 CDU, HDS Processes
Corresponding to Point 12, this area houses atmospheric distillation and hydrodesulfurization processes. The initial passive analysis identified the VOC composition as n-butane at 42%, isobutane at 19%, 1-butene at 15%, isopentane at 11%, and 2-methylpentane at 4%.
The active measurements later revealed substantial amounts of substances not detected initially, with n-octane at 23%, 1-butene at 17%, cis-2-butene and trans-2-butene both at 15%, and toluene at 6%.
(3)
BTX Process
Situated at Point 11, the BTX process focuses on the production of aromatic compounds. The expected detectable substances included benzene, toluene, xylene, and ethylbenzene. The first passive analysis showed isobutane at 26%, 1-butene at 25%, isopentane at 15%, 2-methylpentane at 13%, and n-hexane at 7%.
The subsequent active measurements, excluding 1-butene, revealed significant detections of additional substances not found in the passive analysis. These included propane at 42%, 1-butene at 23%, 3-methylpentane at 12%, 2,2-dimethylbutane at 7%, and n-octane at 5%.
(4)
WWT Process (Wastewater Treatment)
Located at Point 10, the wastewater treatment process is responsible for treating wastewater generated within the factory. The VOC composition identified in the initial passive analysis included n-butane at 20%, 1-butane at 17%, n-pentane at 15%, isobutane at 12%, and 2-methylpentane at 8%.
Subsequent active measurements, excluding 1-butane, detected significant quantities of substances not found in the passive analysis: 1-butene at 31%, trans-2-butene at 23%, cis-2-butene at 17%, n-octane at 9%, and 3-methylpentane at 8%.
Although lower VOC concentrations were anticipated at this point, passive measurements revealed that VOCs constituted 8.3% of the total emissions from this site, which was 2.61 times higher than the lowest detected concentration at Point 1. Active measurements indicated that VOCs accounted for 2.12% of the total, which was 2.67 times higher than the lowest detected concentration at Point 9.
(5)
FCC RDS Process
At Point 2, the FCC RDS process involves catalytic cracking of residual oil (B/C) using advanced equipment. The initial passive analysis of VOCs in this area showed isobutane at 44%, isopentane at 21%, 1-butane at 11%, n-pentane at 7%, and 2-methylpentane at 6%.
The second set of active measurements, excluding isobutane and 1-butene, revealed substantial detections of previously undetected substances, including n-butane at 32%, isobutane at 32%, 1-butene at 9%, cis-2-butene at 7%, and trans-2-butene at 6%.
(6)
CDU, BTX
Operating at Points 7 and 8, this part of the facility handles distillation and aromatic processing. The VOC composition from the initial passive analysis featured isobutane and n-butane each at 19%, isopentane at 16%, 1-butene at 12%, and 2-methylpentane at 10%.
The active measurements later confirmed that most substances detected during the passive analysis were again identified, with n-butane at 26%, isobutane at 23%, isopentane at 17%, 1-butene at 8%, and trans-2-butene at 7%.
(7)
Crude Oil/Product TANK FARM
Located at Points 2, 3, 4, 5, and 17, this facility is designated for storing crude oil, naphtha, gasoline, kerosene, and diesel. The initial passive analysis of the VOC composition revealed isobutane at 35%, n-butane at 32%, isopentane at 13%, 1-butene at 7%, and n-pentane at 5%.
Following this, active measurements, which excluded n-butane, isobutane, and 1-butene, detected substantial quantities of substances not found during the passive analysis. These included n-butane at 31%, isobutane at 29%, 1-butene at 8%, cis-2-butene at 7%, and trans-2-butene at 7%.
(8)
Plant 3 CDU, VDU, HCR, HDS, DCU Processes
This section, encompassing Points 13, 14, 15, and 16, includes facilities for atmospheric distillation, vacuum distillation, hydrocracking, and thermal cracking. The VOC composition, as determined by the first passive analysis, featured n-butane at 29%, 1-butane at 18%, isobutane at 18%, n-pentane at 11%, and isopentane at 8%.
The second round of active measurements, which also excluded 1-butene, revealed a notable presence of substances not detected previously, with 1-butene at 26%, trans-2-butene at 20%, cis-2-butene at 19%, n-octane at 9%, and 2,2-dimethylbutane at 7%.
(9)
Warehouse
Positioned at Point 6, this area functions as a storage warehouse for products. The initial passive analysis showed that the VOC composition included n-butane at 41%, isobutane at 19%, 1-butene at 13%, n-pentane at 8%, and isopentane at 7%.
Later active measurements, which excluded 1-butene, n-pentane, and isopentane, identified a significant presence of substances not previously detected. These included trans-2-butene at 18%, 1-butene at 18%, cis-2-butene at 16%, n-pentane at 9%, and isopentane at 8%.
(10)
General Discussion and Conclusions
Across all measurement points, the initial passive results revealed that n-butane was the most frequently detected VOC, representing 23.1% of detections. The second set of active measurements also indicated a similar proportion of n-butane at 22.0%.
Benzene, a target compound of this study, was detected at all measurement points, with an average concentration of 2.58 µg/m3 in passive measurements and 1.24 µg/m3 in active measurements, indicating that the facility meets the action level requirements consistently.
During the passive measurement period, winds were observed to be slightly stronger compared to the active measurement period, with wind speeds during active measurements ranging from 2–4 m/s and passive measurements from 3–7 m/s. The total volume captured corresponded to the direction of the wind (Figure 5).

3.3. Comparison of Active and Passive Methods and Community Notification Levels

Both active and passive methods were applied in this study to assess their validity. At Study Facility A, the common substances included benzene, toluene, ethylbenzene, xylene, and styrene, with trace amounts of chlorobenzene and tetrachloroethylene also present, although at minimal concentrations around 0.05 µg/m3. For benzene, the passive average concentration was 3.60 µg/m3, significantly higher than the active average of 1.33 µg/m3, showing a discrepancy of approximately 2.5 times.
A notably high concentration of 18.37 µg/m3 was recorded at Point 18 for benzene, exceeding the ΔC threshold. Given its proximity to the NCC cracking process, where substantial quantities of benzene were detected, continuous monitoring and management are deemed necessary at this point.
Under California standards, if the hourly average concentration of benzene exceeds 25.8 µg/m3, a community notification is required. The regulated substances and thresholds for community notification set by the EPA and the state of California are clearly defined in the regulatory documents (Table 7).
Apart from ethylbenzene, which showed similar results in both active and passive measurements, compounds such as toluene and styrene displayed higher concentrations in the passive assessments. This variance may be related to the production processes operational on the days when active measurements were conducted, suggesting that ongoing passive records might provide more reliable data.
At Study Facility B, the commonly detected substances included benzene, toluene, ethylbenzene, xylene, styrene, and 1,2-dichloropropane, while other substances appeared only in trace amounts or were not detected at all.
Generally, both active and passive methods yielded similar concentrations for these substances; for instance, 1,2-dichloropropane had a passive average concentration of 0.03 µg/m3 compared to an active average of 0.04 µg/m3. However, benzene demonstrated a significant discrepancy, with a passive average concentration of 2.58 µg/m3 versus an active average of 1.24 µg/m3—a difference of approximately two-fold. Styrene exhibited the most marked difference, with a passive average of 1.02 µg/m3 versus an active average of 0.02 µg/m3. Notably, styrene was not detected at many points during active measurements, as it is not a direct product of the processes but rather a secondary use material (Table 8).
Study Facility B maintains both community notification levels and ΔC concentrations well below the regulatory thresholds. Specifically, points 10, 11, and 12, situated near the BTX processes, showed slightly higher benzene concentrations compared to other areas (1.95% emission ratio at Point 11 versus an average of 1.42% at other points). Nevertheless, no location registered concentrations exceeding 5 µg/m3 across all measurement points.

4. Discussion

This study utilized passive and active fenceline monitoring techniques to assess VOC emission characteristics within the petroleum refining and petrochemical manufacturing industries in Korea. A thorough analysis of the results yielded insights into the discrepancies between measurement methods, the predominant substances detected, the impacts of operational processes and meteorological conditions, and how these compare with international standards.

4.1. Comparison of Passive and Active Measurement Results

Passive sampling proved effective in reflecting long-term emission characteristics of VOCs. The substances most frequently detected through this method were n-butane (29.86%), cyclohexane (13.23%), and isobutane (8.53%), with benzene also consistently detected. These substances were similarly identified as major components in the active method, demonstrating that both methodologies consistently reflect the VOC emission characteristics of specific facilities.
However, the active method identified substances such as 1-butene, trans-2-butene, and styrene at significantly high concentrations momentarily—substances that were either undetected or present in low concentrations in the passive method. This suggests that while the active method excels in capturing sudden emissions from short-term operational processes, the passive method more effectively captures the long-term trends of accumulated VOC emissions.

4.2. Relationship Between VOC Concentrations and Meteorological Conditions (Wind Speed, Wind Direction)

Meteorological conditions had a significant impact on the dispersion and concentration changes of VOCs. At Study Facility A, strong winds prevailed during the passive measurement period, with speeds ranging from 3 to 7 m/s. These conditions led to higher VOC concentrations detected in the direction of the westerly winds in the passive measurements, whereas shifts in wind direction during the active measurement period resulted in higher concentrations at specific points (Points 3 and 4).
Particularly notable was the detection of benzene at Point 18 at a concentration of 18.37 µg/m3, exceeding the EPA’s action level of 9 µg/m3. This observation underscores that when benzene emissions are substantial, their impact tends to be more significantly influenced by the quantity of emissions rather than by wind effects. In addition, when wind speeds exceeded 5 m/s, the VOC dispersion increased, leading to lower concentrations.

4.3. Analysis of Major VOC Sources and Process Impact

The analysis of VOCs detected in each facility revealed that the primary sources of emissions and the characteristics of VOCs varied according to the process.
Facility A: The NCC cracking and SM processes were identified as significant sources of aromatic hydrocarbons, such as benzene and toluene, with elevated concentrations detected at Points 16–18.
Facility B: The processes producing aromatic products and mixed xylenes were the principal contributors to VOC emissions. Both active and passive measurements displayed similar VOC concentration patterns.

4.4. Comparison with International Regulations and Applicability in Korea

Compared to the regulations of the United States Environmental Protection Agency (EPA) and the California Air Resources Board (CARB) Rule 1180, some locations in this study exceeded the EPA’s action level for benzene concentrations, although none surpassed the community notification threshold of 25.8 µg/m3 set by California.
Contrary to Canada’s fenceline monitoring regulations, which require facilities only to report measurement data without establishing an action level, this study highlights the necessity for site-specific VOC management based on actual measured concentrations.
In Korea, although the Clean Air Conservation Act manages VOC emissions, the fenceline monitoring system is insufficiently implemented. Therefore, it is recommended that Korea refine its VOC emission management regulations by adopting methods similar to those used by the EPA and CARB.

4.5. Ozone Formation Potential and Regulatory Implications

Beyond emission concentrations, the potential contribution of specific VOCs to tropospheric ozone formation must also be considered. Several VOCs identified in this study—such as toluene, xylene isomers, styrene, and 1-butene—are known to exhibit high photochemical ozone creation potential (POCP) values. These compounds are not only toxicologically relevant but also play a significant role in atmospheric photochemistry.
Facilities A and B, which involve naphtha cracking and aromatic hydrocarbon production, are expected to emit these high-POCP substances in significant quantities. Therefore, VOC management strategies should be expanded to incorporate reactivity-based prioritization, such as POCP or maximum incremental reactivity (MIR) metrics, in addition to concentration-based thresholds.
Future monitoring and control policies should account for both exposure risks and secondary pollutant formation, thereby enhancing the effectiveness of air quality management in industrial areas.

4.6. Limitations of the Study and Future Research Directions

This research focused on measuring VOCs at specific facilities (petroleum refining and petrochemical manufacturing) and analyzed changes in concentrations due to VOC emission characteristics and meteorological conditions. However, the study faces several limitations.
Lack of Long-Term Monitoring: The passive method involved 14-day sampling, and the active method entailed five daily samples, which limits the ability to assess variations in VOC emissions over longer periods or across different seasons. Additionally, the short duration and limited frequency of active sampling reduce the representativeness of the data in capturing operational variability and episodic emission events. Therefore, more extensive and continuous monitoring campaigns are necessary to understand annual emission fluctuations, capture short-term peaks, and support robust temporal comparisons between different monitoring approaches.
Temporal Inconsistency Between Monitoring Methods: The passive and active samplings were conducted during different periods, which limits the ability to make direct comparisons between the two methods due to the influence of seasonal meteorological conditions and varying operational states. This temporal mismatch reduces the validity of drawing parallel conclusions regarding emission concentrations. While each method provides valuable insights into emission characteristics, more synchronized sampling schedules are required to enable robust cross-method evaluations and to ensure temporal consistency in future monitoring studies.
Need for Enhanced Modeling Studies: Future research should include VOC dispersion models to analyze the contribution of various sources to overall emissions more accurately.
Future research should expand VOC monitoring across various industrial sectors and conduct long-term studies to support the development of policies aimed at reducing VOC emissions.

5. Conclusions

This research involved a speciation analysis of VOCs emitted by the petroleum refining and petrochemical manufacturing industries in Korea and assessed the efficacy of passive and active fenceline monitoring techniques. The results revealed that passive sampling is effective in reflecting the long-term emission characteristics of VOCs, consistently detecting aromatic hydrocarbons such as benzene, toluene, ethylbenzene, and xylene (BTEX). Notably, the passive method measured benzene concentrations averaging 3.60 µg/m3, which is approximately 2.5 times higher than those measured by the active method (1.33 µg/m3).
The active method proved particularly useful for capturing instantaneous concentrations of VOCs that occur at specific operational times, detecting certain VOCs (such as styrene and 1-butene) exclusively through this approach. Meteorological conditions, including wind speed and direction, significantly influenced the distribution of VOC concentrations. The observations showed that when wind speeds exceeded 5 m/s, the influence of dispersion became more significant than the sources of emissions.
At specific sites, such as Point 18, benzene was detected at concentrations of 18.37 µg/m3, exceeding the EPA’s action level of 9 µg/m3. However, no sites surpassed the community notification threshold of 25.8 µg/m3 established by California’s Rule 1180.
The study confirmed that both passive and active monitoring methods are valid for evaluating VOC emission characteristics, and their concurrent use enhances monitoring effectiveness. Based on these findings, there is a compelling need to introduce fenceline monitoring regulations and strengthen the VOC emission monitoring system within Korea.

Author Contributions

Conceptualization, H.E.L. and J.H.K.; formal analysis, H.E.L.; investigation, S.J.Y.; writing—original draft preparation, H.E.L.; writing—review and editing, J.H.K.; supervision, S.J.Y. All authors have read and agreed to the published version of the manuscript.

Funding

This research was funded by the National Institute of Environmental Research (NIER), Republic of Korea, under the project titled “Study on the Management Measures for Causative Substances of Fine Dust in Industrial Sites Using Advanced Monitoring Techniques (I)”, grant number NIER-2025-01-10-002.

Institutional Review Board Statement

Not applicable.

Informed Consent Statement

Not applicable.

Data Availability Statement

The data presented in this study are available on request from the corresponding author.

Conflicts of Interest

The authors declare no conflict of interest.

References

  1. Lee, J.-W. A Study on the Measurement and Investigation of Air Quality in a University Library. J. Korean Libr. Inf. Sci. Soc. 2019, 50, 635–658. [Google Scholar]
  2. Kim, K.S.; Lee, H.S.; Kong, S.Y.; Ku, H.J. A Study on Public Opinion Poll and Policy on Indoor Air Pollution. 2001. Available online: https://www.osti.gov/etdeweb/biblio/20334334 (accessed on 31 March 2025).
  3. Chung, Y.H.; Kim, S.C.; Shin, S.K.; Kang, I.G.; Lee, J.I.; Lee, W.S.; Lee, J.B. A Study on the Characteristic Trace Organic Pollutants in the Industrial Wastewater. Anal. Sci. Technol. 1998, 11, 62–72. [Google Scholar]
  4. Daves, G. Refinery fence-line monitoring to impact petrochemical operators. Oil Gas J. 2017, 115, 68–73. [Google Scholar]
  5. DeWees, J.M. Refinery fenceline monitoring & method 325A/B. In National Air Toxics Monitoring and Data Analysis Workshop; EPA: Boston, MA, USA, 2015; Volume 28. [Google Scholar]
  6. Eisele, A.P.; Mukerjee, S.; Smith, L.A.; Thoma, E.D.; Whitaker, D.A.; Oliver, K.D.; Alston, L.; Cousett, T.A.; Miller, M.C.; Smith, D.M.; et al. Volatile organic compounds at two oil and natural gas production well pads in Colorado and Texas using passive samplers. J. Air Waste Manag. Assoc. 2016, 66, 412–419. [Google Scholar] [CrossRef] [PubMed]
  7. Stutz, J.; Colosimo, S.F.; Cooperdock, S.; Pikelnaya, O.; Polidori, A. UV-DOAS Measurements of BTEX in Petrochemical Facilities: Performance, Quality Assessment, and Applications. AGU Fall Meet. Abstr. 2022, 2022, A45I-1943. [Google Scholar]
  8. IARC Working Group on the Evaluation of Carcinogenic Risks to Humans. Benzene. In Chemical Agents and Related Occupations; IARC Working Group on the Evaluation of Carcinogenic Risks to Humans: Lyon, France, 2012. [Google Scholar]
  9. Jang, Y.C.; Lee, S.; Shin, Y.; Kim, H.; Lee, J. Human health risk assessment of benzene from industrial complexes of Chungcheong and Jeonla province. J. Environ. Impact Assess. 2011, 20, 497–507. [Google Scholar]
  10. Goho, S.A. Advances in Air Monitoring Opportunities and Challenges for Addressing Race, Poverty, and Environmental Justice. Am. J. Law Equal. 2023, 3, 53–63. [Google Scholar] [CrossRef]
  11. Stephanie, T.; Edwards, S.J.; Walker, T.R. A toxicity-based analysis of Canada’s National Pollutant Release Inventory (NPRI): A case study in Nova Scotia. Environ. Sci. Pollut. Res. 2020, 27, 2238–2247. [Google Scholar]
  12. Available online: https://laws-lois.justice.gc.ca/eng/regulations/SOR-2020-231/page-4.html?wbdisable=true (accessed on 31 March 2025).
  13. Seok, H.J.; Kahn, J.B.; Kim, Y.L.; Seo, J.W.; Hong, S.Y.; Kim, H.J. Discharge impact analysis of air pollutants for integrated environmental management. J. Environ. Anal. Health Toxicol. 2020, 23, 240–247. [Google Scholar] [CrossRef]
  14. Park, J.H.; Shin, S.J.; Lee, D.G. Enhancing the applicability and improvement direction of integrated environmental permit system. J. Korean Soc. Water Environ. 2018, 34, 339–345. [Google Scholar]
  15. Lee, H.E.; Kim, J.H.; Seo, D.; Yoon, S.J. Prioritization of Volatile Organic Compound Reduction in the Tire Manufacturing Industry through Speciation of Volatile Organic Compounds Emitted at the Fenceline. Atmosphere 2024, 15, 223. [Google Scholar] [CrossRef]
  16. Kim, M.G.; Kim, J.H.; Yoon, S.J.; Cho, S.H.; Yu, J.U.; Kang, C.W.; Moon, K.W.; Lee, H.E. Evaluating the feasibility of air environment management system for VOCs through ‘VOCs specification’ of petroleum refining industry. J. Air Waste Manag. Assoc. 2023, 73, 362–373. [Google Scholar] [CrossRef] [PubMed]
  17. Lee, J.H.; Han, J.S.; Yun, H.K.; Cho, S.Y. Evaluation of incremental reactivity and ozone production contribution of VOCs using the PAMS data in Seoul metropolitan area. J. Korean Soc. Atmos. Environ. 2007, 23, 286–296. [Google Scholar] [CrossRef]
  18. Walgraeve, C.; Demeestere, K.; Dewulf, J.; Van Huffel, K.; Van Langenhove, H. Uptake rate behavior of tube-type passive samplers for volatile organic compounds under controlled atmospheric conditions. Atmos. Environ. 2011, 45, 5872–5879. [Google Scholar] [CrossRef]
Figure 1. Measurement points and process division of the study facilities: (a) Study Facility A, (b) Study Facility B.
Atmosphere 16 00543 g001
Figure 2. Examples of sampling installations: (a) Passive sampler, (b) Active sampler. The sign displayed in the photo indicates that VOCs analysis is in progress and that the equipment should not be removed.
Atmosphere 16 00543 g002
Figure 3. Example chromatogram obtained from VOC analysis using TD-GC/MS. Major aromatic compounds, such as benzene, toluene, ethylbenzene, and xylene (BTEX), are labeled (Study Facility A—Passive Sampling Point 17).
Atmosphere 16 00543 g003
Figure 4. Study Facility A—Total VOC ratios by measurement point and wind rose diagram: (a) Total VOC ratios at Study Facility A, (b) Wind rose diagram.
Atmosphere 16 00543 g004
Figure 5. Study Facility B—Total VOC ratios by measurement point and wind rose diagram: (a) Total VOC ratios at Study Facility B, (b) Wind rose diagram.
Atmosphere 16 00543 g005
Table 1. Characteristics and site area of the study facilities.
FacilityCharacteristics of the FacilitySite Area
Study Facility AManufacture of synthetic resins, such as PE/PP, and petrochemical basic chemicals, including styrene monomer (SM), by-product fuels, and solvents from basic fractions3,047,914 m2
(753.15 ac)
Study Facility BPetroleum refining and manufacture of petrochemical basic chemical compounds3,039,476.79 m2
(751.07 ac)
Table 2. Process overview of Study Facilities A and B.
Study Facility AStudy Facility B
Process Division (Abbreviation)Process OverviewVOC Emission SubstancesProcess Division (Abbreviation)Process OverviewVOC Emission Substances
LD/LDDProduction of synthetic resins utilizing ethylene and styrene monomerEthylene, Styrene Monomer, etc.CDU, VDU, HCR, HDS, DCUProcesses including Atmospheric Distillation, Vacuum Distillation, HydrocrackingTrace Olefins, Paraffinic Fractions
ADL PEManufacturing of PE and PP from ethylene and propyleneEthylene, Propylene, Polyethylene, PolypropyleneCDU, HDSProcesses including Atmospheric Distillation, HydrodesulfurizationParaffinic Fractions
EVAPolypropylene production using ethylene and propyleneEthylene, Propylene, PolyethyleneBTX ProcessProduction of aromatic compoundsRefined and Separated Fractions
PP4PP manufacturing from ethyleneEthylene, Polypropylene, etc.WWT Process (Wastewater Treatment)Treatment of wastewater generated within the facilityNone (Acid/Alkali Chemical Treatment, Odor from Biological Treatment Process)
CFU/ARO#2Use of heavy naphtha for producing benzene, gasoline, solvents, alongside crude oil refiningGasoline, Benzene, Paraxylene, LPG, Kerosene, Jet Fuel, Diesel, etc.FCC, RDS ProcessCatalytic Cracking of Residual Oil (B/C) using advanced equipmentSome Olefins, Paraffinic Fractions
PTAProducing high-purity terephthalic acid through the distillation or hydrogenation of xyleneXylene, Terephthalic Acid, etc.CDU, BTX ProcessDistillation and Aromatic ProcessingAromatic Compounds, Paraffinic Fractions
TANK YARDStorage process for crude oil and related productsCrude OilCrude Oil/Products, etc. TANK FARMStorage facilities for crude oil, naphtha, gasoline, kerosene, dieselCrude Oil
SM #1,#2Synthesis of styrene monomer or PE resin from ethyleneEthylene, Styrene Monomer
NCCProduction of various products using light naphtha from the refinery (CFU)Ethylene, Propylene, C4 Synthetic Rubber, etc.
BTXAromatic product productionBenzene, Toluene, Xylene, etc.
Table 3. Passive sampling methods and conditions.
CategoryMeasurement Technique
Measured SubstancesEPA Method 325B, Validated Sorbents and Uptake Rates for Selected Clean Air Act Compounds, including 18 types of ozone precursor VOCs, 57 types, and TO-14A target substances, 31 types
Sampling AreaIdentical to Active Sampling
Sampling Duration14 days
Analysis MethodSolid Adsorbent Technique
Adsorbent Tube and Passive TypeCarbopak X
Table 4. Sampling dates at the study facilities.
FacilityDateMeasurement Method
Study Facility A31 May–14 June (15 days)Passive
31 October–1 November (2 days)Active
Study Facility B3 June–17 June (15 days)Passive
29 August–30 August (2 days)Active
Table 5. Ozone precursor substances (57 types) listed in PAMS.
No.Substance NameCas No.No.Substance NameCas No.
1Ethylene74-85-1303-Methylhexane589-34-4
2Acetylene74-86-2312,2,4-Trimethylpentane50-84-1
3Ethane74-84-032n-Heptane142-82-5
4Propylene115-07-133Methylcyclohexane108-87-2
5Propane74-98-6342,3,4-Trimethylpentane565-75-3
6Isobutane75-28-535Toluene108-88-3
71-Butene106-98-9362-Methylheptane592-27-8
8n-Butane106-97-8373-Methylheptane589-81-1
9trans-2-Butene624-64-638n-Octane111-65-9
10cis-2-Butene590-18-139Ethylbenzene100-41-4
11Isopentnae78-78-440m-Xylene108-38-3
121-Pentene109-67-141p-Xylene106-42-3
13n-Pentane109-66-042Styrene100-42-5
14Isoprene78-79-5043o-Xylene95-47-6
15trans-2-Pentene646-04-844n-Nonane111-84-2
16cis-2-Pentene627-20-345Isopropylbenzene98-82-8
172,2-Dimethylbutane75-83-246n-Propylbenzene103-65-1
18Cyclopentane287-92-347m-Ethyltoluene620-14-4
192,3-Dimethylbutane79-29-848p-Ethyltoluene622-96-8
202-Methylpentane107-83-5491,3,5-Trimethylbenzene108-67-8
213-Methylpentane96-14-050o-Ehtyltoluene611-14-3
221-Hexene592-41-6511,2,4-Trimethylbenzene95-63-6
23n-Hexane110-54-352n-Decane124-18-5
24Methylcyclopentane96-37-7531,2,3-Trimethylbenzene526-73-8
252,4-Dimethylpentane108-08-754m-Diehtylbenzene141-93-5
26Benzene71-43-255p-Diehtylbenzene105-05-5
27Cyclohexane110-82-756n-Undecane1120-21-4
282-Methylhexane591-76-457n-Dodecane112-40-3
292,3-Dimethylpentane565-59-3---
Table 6. Summary of QA/QC Validation Results for BTEX Compounds in Passive and Active Sampling.
CompoundsSpiked
Concentration (ng/mL)
Average
(ng/mL)
DeviationPrecision
(%)
Accuracy
(%)
Detection
Limit
(ng/mL)
Limit of
Quantification
(ng/mL)
Benzene32.9142.150.7881.87099.4301.7485.567
Toluene39.1950.620.7821.54497.5601.8045.744
Ethylbenzene44.2957.360.4730.82596.4500.7042.242
m,p-Xylene88.58104.191.6681.60197.5802.3207.388
Styrene43.0255.370.8951.61797.2401.8585.917
o-Xylene44.7259.152.1433.62297.3901.5004.779
Table 7. Community notification concentrations and ΔC concentrations at Study Facility A.
Substance NameCommunity Notification ConcentrationCalculated
Average Concentration
ΔC Concentration
Benzene9 µg/m3
(Action level)
25.8 µg/m3
3.60 µg/m317.9 µg/m3
Toluene37,540 µg/m37.84 µg/m356.87 µg/m3
Ethylbenzene-1.26 µg/m32.66 µg/m3
m,p-Xylene22,326 µg/m33.59 µg/m37.3 µg/m3
Styrene25,510 µg/m31.51 µg/m35.42 µg/m3
o-Xylene22,326 µg/m30.80 µg/m31.05 µg/m3
Table 8. Community notification concentrations and ΔC concentrations at Study Facility B.
Substance NameCommunity Notification ConcentrationCalculated
Average Concentration
ΔC Concentration
1,2-Dichloropropane4 µg/m3
(Action level)
0.040.04
Benzene9 µg/m3
(Action level)
25.8 µg/m3
1.244.71
Toluene37,540 µg/m31.993.31
Ethylbenzene-1.510.75
m,p-Xylene22,326 µg/m32.427.06
Styrene25,510 µg/m30.020.2
o-Xylene22,326 µg/m31.140.87
Disclaimer/Publisher’s Note: The statements, opinions and data contained in all publications are solely those of the individual author(s) and contributor(s) and not of MDPI and/or the editor(s). MDPI and/or the editor(s) disclaim responsibility for any injury to people or property resulting from any ideas, methods, instructions or products referred to in the content.

