Article

Non-Optimal Wet-Bulb Temperature and Short-Term Black Carbon Exposure Largely Impact Emergency Department Visits for Cause-Stable Ischemic Heart Disease

by
Qianrong Chen
1,
Kun Hou
1,*,
Xia Xu
2 and
Zhen Wang
3
1
School of Remote Sensing and Geomatics Engineering, Nanjing University of Information Science and Technology, Nanjing 210044, China
2
Jiangsu Province Hydrology and Water Resources Investigation Bureau, Nanjing 210029, China
3
National Geomatics Center of China, Beijing 100830, China
*
Author to whom correspondence should be addressed.
Atmosphere 2025, 16(5), 542; https://doi.org/10.3390/atmos16050542
Submission received: 5 April 2025 / Revised: 29 April 2025 / Accepted: 2 May 2025 / Published: 4 May 2025
(This article belongs to the Topic Impacts of Air Quality on Environment and Human Health)

Abstract

:
Little is known about the effects of wet-bulb temperature (WBT) and short-term black carbon (BC) exposure on emergency department visits for cause-stable ischemic heart disease (CSIHD). In this study, we improved and extended a set of distributed lag nonlinear models (DLNMs). After controlling for the interaction effect of WBT and BC and multiple confounding factors, we found that the lagged effect of low WBT reached the maximum risk of 1.076 (95% CI, 1.083–1.134) at lag day 7, which was greater than the maximum value of 1.057 (95% CI, 1.016–1.093) of high WBT occurring at lag day 0. The lagged effects of low and high BC both approached their maximum at lag day 0, corresponding to the risk of 1.061 (95% CI, 1.021–1.085) and 1.326 (95% CI, 1.072–1.187), respectively. The effect of short-term consecutive extreme low WBT was significant over a duration of 0–5.5 days and became insignificant after 5.5 days, whereas extreme high WBT had no impact except for the duration of 0–3 days. Exposure to short-term consecutive extreme low and high BC was found to have significant effects over a certain period, manifested in the durations of 0–1, 4–10, and 0–10 days, respectively. Our study confirmed the association of varying degrees of WBT and BC with emergency department visits for CSIHD, and targeted public health interventions for individuals are recommended under specific external humid thermal and high air pollution environments.

1. Introduction

Global climate change is intensifying now and in the anticipated future [1]. The increasing frequency of abnormal temperatures and extreme weather events involving heat waves, cold spells, and typhoons has led to an increase in the adverse risk of health burdens for the population [2,3]. At the same time, extreme weather conditions are exacerbating air pollution and its effects. Extreme weather events significantly increase pollution levels and exacerbate their health impacts through processes such as wildfires, heat waves, floods, and droughts [2,3,4]. Wildfires release large amounts of particulate matter and toxic gases, heat waves accelerate the formation of ground-level ozone, and floods spread waterborne pollutants [1,2,4]. Additionally, droughts trigger dust storms that reduce air quality, while temperature inversions trap pollutants near the ground [5]. These processes can lead to increased respiratory diseases, cardiovascular diseases, infection risks, and increased mortality, highlighting the critical links between extreme climate, pollution, and public health. The interactive effects of heat waves and the ozone greatly increase the health-related risks faced by the global population due to compound events, especially in China, which is originally located in an area of intense climate change and relatively high air pollution [4,5,6]. The combination of these above-mentioned factors has resulted in significant increases in a range of disease burden events, varying from death, respiratory problems, and suicide to emergency department visits caused by various illnesses [7,8,9,10].
Abnormal ambient temperatures have been linked to an increase in emergency department visits. Short-term exposure to extreme heat was positively associated with increased emergency department visits for mental disorders, schizophrenia, and dementia in New York State, USA [10]. Both low and high temperatures were found to be associated with an increased risk of non-fatal emergency department visits in China, and the effects of low temperatures were more persistent than those of high temperatures [11]. Furthermore, several studies have investigated the nonlinear relationship between emergency department visits and temperature variations, whose exposure–response curves were modeled as U-shaped [11,12,13]. Wet-bulb temperature (WBT) is a key comprehensive characterization of temperature, humidity, and the energy regulation of the human body, making entire areas uninhabitable, more so than other thermal pressure indices [14,15]. However, few studies have addressed the association of WBT with the risk of emergency department visits, and the changing pattern of its effect remains to be further elucidated.
Previous studies have also investigated and confirmed the linkage between air pollution exposure and the risk of emergency department visits. Fine particulate matter involving PM2.5 and PM10 was identified as being associated with an increased risk of emergency department visits in terms of psychiatric, cardiovascular, eye diseases, and respiratory systems [16,17,18]. Increased SO2 concentrations were found to be associated with increased visits to circulatory and neurology emergency departments, with the most positive association occurring during the cold season [19]. Different levels of O3, NO2, and CO exposure accounted for the increased risk of cardiovascular emergency department visits in Mexico City, whose effects have been explored with certain lagged effects at different lag days [20]. Black carbon (BC), a distinct component of PM2.5, consists of pure carbon particles formed through incomplete combustion of fossil fuels and biomass. Unlike the chemically diverse mixture of general PM2.5, BC is characterized by strong light absorption, high surface reactivity, and solid particulate form [21]. Due to its small size and unique physicochemical properties, BC can penetrate deep into the respiratory system, triggering oxidative stress and systemic inflammation more potently than many other PM2.5 constituents [22]. BC exposure is robustly associated with multiple health outcomes [21], whose effect differs significantly from those of fine particulate matter such as PM2.5 or PM10 based on its physical and chemical properties [21,22]. However, the effect of BC on the risk of emergency department visits remains unclear, and the relevant mechanisms need to be further clarified.
In this study, we collected the daily emergency department visit data of cause-stable ischemic heart disease (CSIHD) at Renhe Hospital in Shanghai, China, covering the period from 1 January 2013, to 31 December 2020. Patient diagnoses for all individuals were documented in the discharge records following the International Classification of Diseases, 10th Revision (ICD-10). Based on these records, we identified and compiled the daily counts of emergency department visits for CSIHD. The daily high spatio-temporal resolution WBT, BC, and other air pollutant data were correlated based on geocoding. The relationship between environmental exposures, such as temperature or air pollution, and health outcomes is often characterized by both delayed (lagged) effects and nonlinear associations. The distributed lag nonlinear model (DLNM) is specifically designed to simultaneously account for nonlinear exposure–response relationships and lagged effects over time. The DLNM offers a flexible framework that allows the estimation of the overall and time-specific impacts of exposures, accommodating potential threshold effects, saturation, and delayed responses. This approach provides a more comprehensive and accurate assessment of the temporal dynamics between exposure and health risks, making it well-suited for our analysis. We extended and improved a set of DLNMs to control for the interaction effects of WBT and BC, as well as other confounding factors, including the air pollutants of O3, NO2, SO2, and CO, and the effects of weeks, seasonality, and holiday, and characterized the nonlinear relationship between WBT/BC exposure and emergency department visits for CSIHD, respectively.
We assessed the lagged effects of low and high WBT/BC over different lag days and quantified the attributable risk of different ranges of exposure for the emergency department visits with CSIHD. On this basis, the additional effect of short-term consecutive extreme low and high WBT/BC exposure on the risk of emergency department visits was explored. This study is the first to comprehensively assess the effects of WBT and BC exposure on the risk of emergency department visits for CSIHD, which is an important supplement to the research on the association between temperature or air pollution exposure and the risk of emergency department visits, and also helps to improve the medical emergency response under extreme weather conditions.

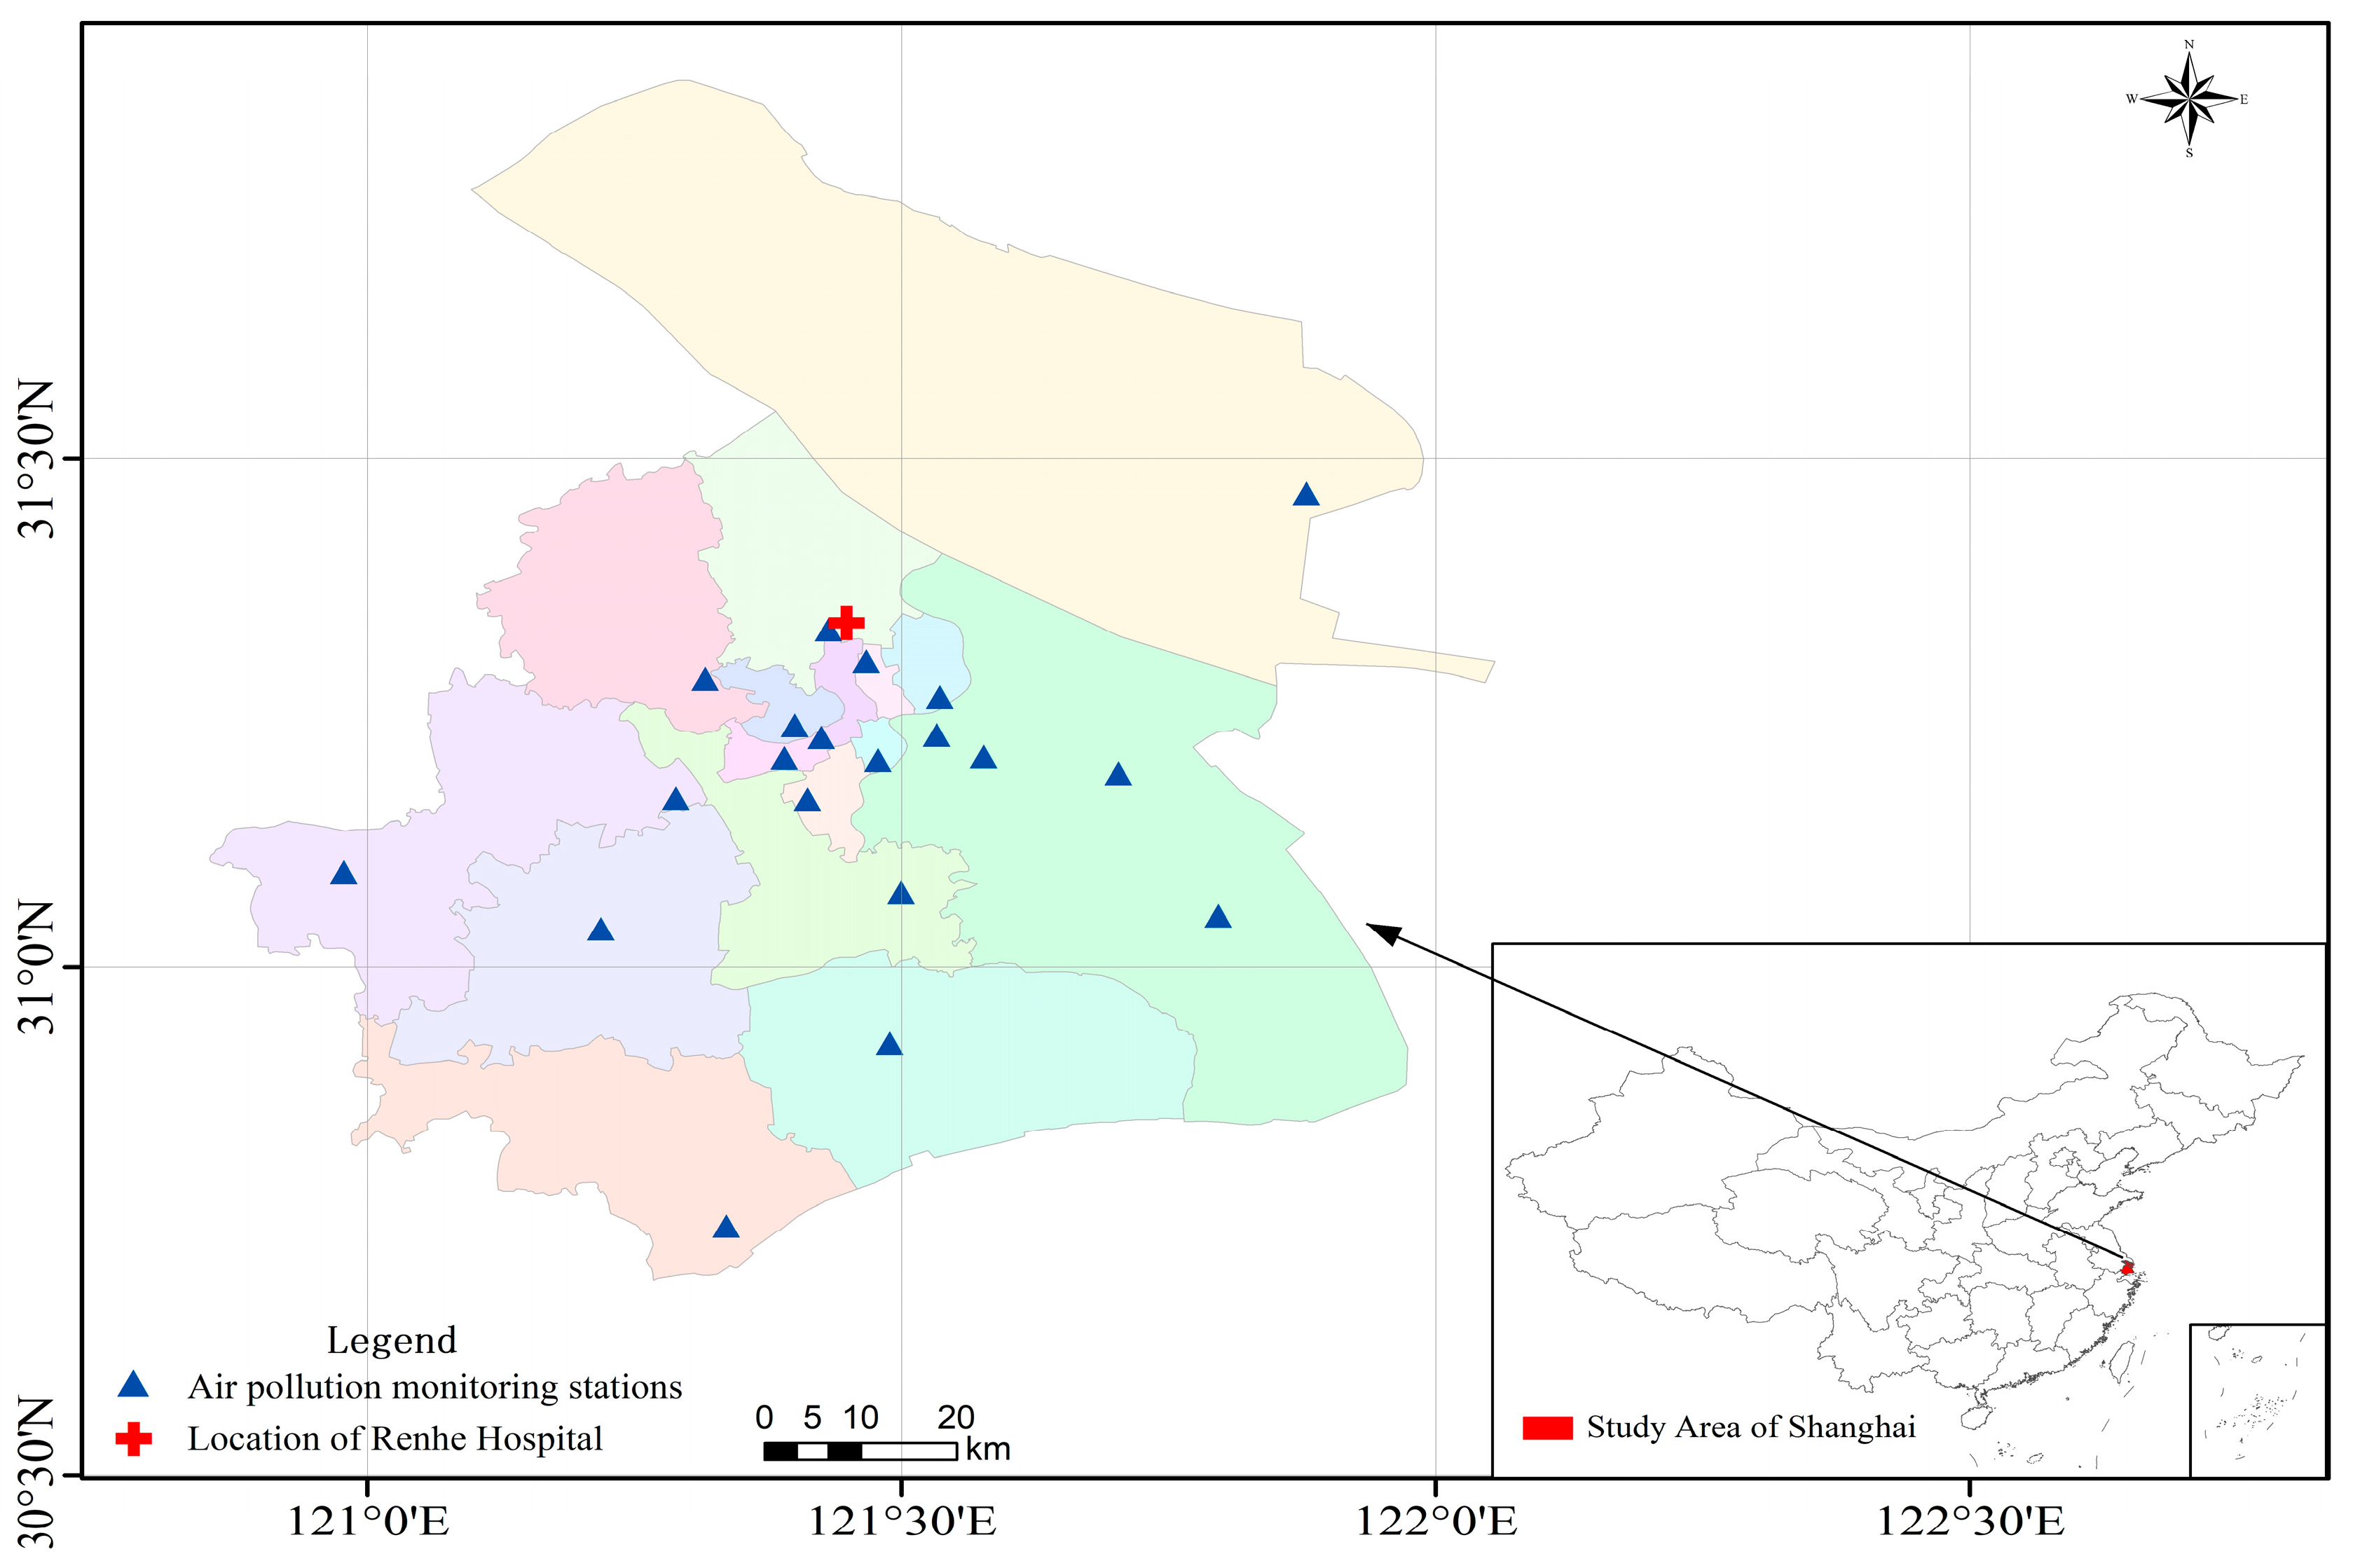
2. Materials and Methods

2.1. Wet-Bulb Temperature (WBT)

Wet-bulb temperature data are derived from the high spatial resolution dataset of human thermal stress indices in South and East Asia [15], where wet-bulb temperature and eight other heat stress indices are available (https://doi.org/10.6084/m9.figshare.c.5196296, accessed on 12 March 2024). This dataset uses ECMWF ERA5-land and ERA5 reanalysis products to grid multiple heat stress indices including wet-bulb temperature in South Asia and East Asia, with a spatial resolution of 10 km and a daily temporal resolution. According to this, we obtained the daily mean wet-bulb temperature data of Shanghai from 1 January 2013 to 31 December 2020, covering the entire time span of this study.

2.2. Black Carbon (BC)

Black carbon data are obtained from the MERRA-2 (Modern-era Retrospective Analysis for Research and Applications, Vision2) reanalysis dataset (https://gmao.gsfc.nasa.gov/reanalysis/MERRA-2/data_access/, accessed on 20 March 2024), which is maintained and published by National Aeronautics and Space Administration (NASA). This dataset is based on a reanalysis of the updated version of the Goddard Earth Observing System model (GEOS-5), which provides analyzable atmospheric pollutants including black carbon on a spatiotemporal scale, and has been shown to be well correlated with the overall ground-based observation samples in China [23,24]. We retrieved and obtained the black carbon concentration products for the study area from 1 January 2013 to 31 December 2020, and used the inverse distance-weighted interpolation method to generate daily surface black carbon concentration data with a spatial resolution of approximate 10 km.

2.3. Other Air Pollutant Data

The air ground monitoring station of the Ministry of Ecology and Environment (MEE) of China provides hourly concentration data of other air pollutants, including PM2.5, SO2, O3, and CO. Twenty monitoring stations were involved in this study area, and we obtained the daily air pollutant concentration data of each monitoring station by averaging the hourly monitoring data. Emergency department visits came from different areas of Shanghai on the same day, thus we further averaged the air pollutant data of the entire monitoring sites to reflect the pollution exposure on the day of the emergency visit, which is consistent with other research [10,11]. The geographical distribution of air pollution monitoring sites is shown in Figure 1.

2.4. Emergency Department Visits of Cause-Stable Ischemic Heart Disease (CSIHD)

Emergency department attendance records were extracted from Renhe Hospital, Baoshan District, Shanghai, China, from 1 January 2013 to 31 December 2020 (Figure 1). Patient data, encompassing visit dates, age, gender, and clinical diagnoses, were systematically collected for subsequent analysis. All diagnoses were standardized based on the tenth revision of the International Classification of Diseases (ICD-10) and documented in the records at the time of emergency department discharge, based on which we identified and collected the number of daily emergency department visits for CSIHD [25]. Overall, after excluding the missing data and incomplete recorded information, a total of 18,241 cases of CSIHD data were validated in this research. Table 1 illustrates the daily statistics of the relevant variables involved, where we can see that both WBT and BC have a relatively wide range, varying from −8.92–28.74 °C and 0.4–32.69 μg/m3, respectively.

2.5. Methods

2.5.1. Distributed Lag Nonlinear Model (DLNM)

Ambient temperature and air pollutants have been demonstrated to have nonlinear and lagged effects on emergency department visits in terms of different diseases [11,13,19]. Therefore, as in other studies, we used a series of distributed lag nonlinear models to infer the nonlinear and lagged effects of WBT and BC on the risk of emergency department visits for CSIHD, respectively. Our initial analysis showed that the number of emergency department visits per day for CSIHD approximately followed the Poisson distribution, whereby the logarithmic transformation was used as a link function to correlate wet-bulb temperature or black carbon with the relative risk of emergency department visits [26,27]. The constructed DLNM is shown in Equation (1).
l o g μ t = α + β T t , l + S O 3 t , d f 1 + S N O 2 t , d f 2 + S S O 2 t , d f 3 + S C O t , d f 4 + s T i m e , d f 5 + η W e e k t + ϖ M o n t h t + σ S e a s o n t + υ H o l i d a y t + S ( W B T t / B C t , d f 6 )
where μ t is the mathematical expectation of the recorded emergency department visits for CSIHD on each day t. α denotes the intercept. Tt,l is the crossover matrix derived by applying the distributed lag nonlinear model to WBT and BC, whose corresponding vector of coefficients is β. l represents the number of days of lag time. S represents the natural cubic spline function, and df accounts for the degree of freedom (df), which is used to describe and reflect the interference effects of other air pollutants of O3, NO2, SO2, CO, the long-term time trend term of Time, and WBT or BC that is controlled in the model. Weekt represents day t of the week; Montht indicates the month of the year in which day t falls; Seasont is the seasonal variable, reflecting the four seasons of the year; and Holidayt is a binary variable, which equals 1 to indicate that day t is a holiday, otherwise it is not a holiday. η, ϖ, σ, and υ represent the coefficients corresponding to each variable, respectively. As in previous studies [6], BC was considered as a disturbing factor in assessing the relationship between WBT and emergency department visits; vice versa, WBT was treated as a confounding factor controlled in the model when focusing on the effect of BC. The results of collinearity analysis showed that black carbon had a strong collinearity effect with PM2.5, thus the variable of PM2.5 concentrations is not included in the model [6].
Based on the DLNM of model (1), we explored the relationship between WBT/BC and the relative risk of emergency department visits for CSIHD from two aspects: daily variation and lag time. We used different fitting functions involving natural cubic splines with 4/5 knots, polynomial functions, and B-splines to model the complex nonlinear relationship between daily exposure changes in WBT/BC, lag days, and emergency department visits, respectively. We set the reference values for WBT and BC (i.e., the optimal WBT or BC value at which the emergency department visits achieved the least), obtained through multiple simulation tests by model (1) [28,29], whose risk contributions were treated as the reference to compute the relative risk of other WBT/BC exposures for emergency department visits for CSIHD. Here, we set the reference values of WBT and BC to 20.3 °C and 0 μg/m3, respectively. The reference values were selected without interfering with the final exposure–response curve, mainly in order to place the high and low WBT on either side of the reference temperature and higher BC concentrations on the right side of the lowest BC exposure of 0 μg/m3, such that the results were easier to interpret [28,29,30].
The Akaike Information Criterion (AIC) was used to choose the optimal fit and the df for various variables [29,31]. The best fit was achieved with the minimum AIC value, where four knots of the natural cubic spline demonstrated the optimal simulation of the exposure changes in WBT/BC. For the lagged effect, four knots of the natural cubic spline were finally selected to simulate the nonlinear impact of the lagged effect on the relative risk of emergency department visits. The number of days of the lag time was tested and set to 28 days, beyond which the trend of the lagged effect of WBT/BC gradually stabilized (see sensitivity analysis). According to the AIC, the df values (df1, df2, df3, df4) of cubic splines for O3, NO2, SO2, and CO were all set to 3, df5 of Time was set to 7 × 7, indicating that there are 7 degrees of freedom in each of the 7 years, and df6 of WBT/BC was selected to be 4.

2.5.2. Interaction Effect of DLNM on Wet-Bulb Temperature and Black Carbon

To distinguish the respective effect of WBT or BC exposure on emergency department visits for CSIHD, we explored the interaction effects of WBT and BC on emergency department visits as we did in our previous study [32]. The geographical detector model was used to estimate the interaction effect for different stratified exposures of WBT/BC and emergency department visits [33]. By calculating and comparing the q value of the influence of each individual factor on the outcome variable and the q value of the comprehensive effect after the superposition of the two factors, the geographic detector determines whether the two factors interact, and the strength, direction, linear or nonlinear of the interaction [33,34]. The test results of the geographical detector in this study showed that the q value of WBT and BC was 0.267 and 0.324, respectively, and the q value of their interaction was 0.375, indicating that WBT and BC had a weak positive interaction on the emergency visits for CSIHD [32,33]. Therefore, on the basis of model (1), we introduced the product term WBT × BC to represent and reflect the interaction effect between WBT and BC [32]. The AIC was also utilized to choose the df value for controlling for the interaction effect, where df7 equals 3 to demonstrate the optimal fit. The final model was constructed as shown in Equation (2), which was subsequently used to assess the effects of changes in WBT/BC exposure and the lag time on the risk of emergency department visits for CSIHD.
l o g μ t = α + β T t , l + S O 3 t , d f 1 + S N O 2 t , d f 2 + S S O 2 t , d f 3 + S C O t , d f 4 + s T i m e , d f 5 + η W e e k t + ϖ M o n t h t + σ S e a s o n t + υ H o l i d a y t + S ( W B T t / B C t , d f 6 ) + S ( W B T t × B C t , d f 7 )

2.5.3. The Fraction and Number of Emergency Department Visits for CSIHD Attributed to Various Ranges of WBT/BC Exposure

We quantified the fraction and number of emergency department visits resulting from varying degrees of exposure to WBT and BC [28]. Exposure to WBT or BC on a given day affects the daily emergency department visits on the following days, with the sum of its lagged effects being considered the attributable risk of exposure on that day [35]. Equations (3) and (4) were used to quantify the fraction AFx,d and number of emergency department visits ANx,d attributable to the exposure of WBT/BC xt for day t, respectively.
A F x , d = 1 exp l = 0 L β X t , l
A N x , d = A F x , t l = 0 L n t + l L + 1
where L denotes the maximum lag time of 28 days, l indicates the lag days following day t, l = 0 L β X t , l accounts for the overall cumulative relative risk of logarithmic transformation for temperature xt in day t, and nt represents the number of emergency department visits for CSIHD in day t. The total attributable number of emergency department visits ANtot was obtained by summing up ANx,t for all days, and the total attributable fraction AFtot is calculated by the ratio of ANtot to the total number of deaths. The details of this approach have been introduced in several prior studies [29,30,35].
By referring to the range division with respect to different temperatures, we defined the range of different exposures to WBT, specifically, 0 °C to the 2.5th percentile was extreme low WBT, 2.5th percentile to the reference value (20.3 °C) was low WBT, 20.3 °C to the 97.5th percentile was high WBT, and higher than the 97.5th percentile was extreme WBT. The range of different pollution exposures was also divided for BC. We defined the reference value (0 μg/m3) to the 2.5th percentile as extreme low concentration, the 2.5th to 50th percentile as moderate low concentration, the 50th to 97.5th percentile as moderate high concentration, and above the 97.5th percentile as extreme high concentration. Subsequently, the total attributable fraction of emergency department visits for CSIHD due to different ranges of WBT/BC exposure was calculated, respectively, and the 95% confidence intervals were obtained using Monte Carlo simulations as performed in other studies [28,29,30].

2.5.4. Effects of Short-Term Consecutive Extreme Exposure to WBT/BC

The effects of short-term consecutive extreme exposure are referred to as superimposed on top of the effects of WBT/BC daily exposure, which is considered to be an additional effect for the emergency department visits [2,29]. We further improved and enhanced the DLNM of model (2) to include and reflect the additional impact of consecutive extreme WBT/BC exposure on the emergency department visits for CSIHD. The constructed model is shown in Formula (5):
l o g μ t = α + β T t , l + S C E ( t i ) + S O 3 t , d f 1 + S N O 2 t , d f 2 + S S O 2 t , d f 3 + S C O t , d f 4 + s T i m e , d f 5 + η W e e k t + ϖ M o n t h t + σ S e a s o n t + υ H o l i d a y t + S ( W B T t / B C t , d f 6 ) + S ( W B T t × B C t , d f 7 )
where β T t , l represents the effects of daily WBT/BC exposure, SCE(ti) accounts for the additional effect of short-term consecutive extreme WBT/BC exposure, and the meanings expressed by other symbols in the formula remain unchanged. We used a two-stage analysis to quantify the impact of extreme WBT/BC exposure on the emergency department visits. In the first stage of analysis, we defined the extreme exposure indicator of SCE(ti) to reflect the day with exposure to extremely high WBT/BC, as shown in Equation (6):
S C E ( t i ) h i g h = l = 0 L w I t i l > τ h i g h
where the value of I is 1 if ti-l is higher than or equal to the threshold τ h i g h for extremely high WBT/BC exposure; otherwise, it is 0. Here, S C E ( t i ) h i g h is the usual metric for defining the days under extremely high exposure, which is interpreted as the number of days that are greater than or equal to the intensity criterion τ h i g h and last for at least Lw + 1 days. Like other studies [29,30,35], the extremely high exposure threshold τ h i g h was set to the 97.5th percentile and Lw was set to 1, which means that exposure to WBT/BC above the 97.5th percentile for at least two consecutive days was considered a consecutive extreme high exposure event for the emergency department visits for CSIHD.
Based on the definition of the extreme exposure indicator, we conducted a nonlinear exploration of the impact of consecutive days of extreme exposure (≥2) on the emergency department visits in the second stage of analysis. In this case, we defined S C E ( t i ) h i g h = f ( d ) , and the specific expression of di is shown in Equation (7):
d i = l = 1 L w I t i l > τ h i g h j = 0 l I t i j > τ h i g h
in which di is defined as the number of consecutive days that the exposure reaches the threshold τ by date i. The product term in the above formula ensures that the exposure for all previous days is greater than or equal to τ. For non-extreme high exposure days, d is 0, and the first day is greater than or equal to the threshold τ, then the second day is 1, and so on, until the day the exposure level returns below the threshold. Lw represents the maximum number of days of duration, which is set to 10 days because the duration of sustained extreme high exposure to temperature or air pollution mostly does not exceed 10 days [2]. The function f describing the additional effects of consecutive extreme high exposure days d was simulated by a quadratic spline of 5 df with 3 nodes placed at 2, 5, 8, days without natural constraints [2,29,36].
Similarly, we use the same method to define the extreme low exposure indicator and characterize the nonlinear effect of short-term consecutive extremely low exposure days on the emergency department visits for CSIHD, which are expressed as Formulas (8) and (9), respectively:
S C E ( t i ) l o w = l = 0 L w I t i l > τ l o w
d i = l = 1 L w I t i l > τ l o w j = 0 l I t i j > τ l o w
in which the threshold of extreme low exposure for WBC/BC was set at 2.5th percentiles, whose duration was also set to 10 days to facilitate comparison with the impact of extreme high exposure. The meaning of the remaining variables in the formula does not change.

2.5.5. Sensitivity Analysis

We conducted the sensitivity analyses for the maximum time length of lagged effect and the influence of various confounding factors on the results of the study. Specifically, the maximum lag days were varied from 7 to 30 days to determine whether the lag time of 28 days fully reflects and captures the lagged effect of WBT/BC. Other air pollutants in model (2) involving O3, NO2, SO2, and CO were treated as the confounding factors, whose different combinations were adjusted and set in the model to test the stability of the estimated results of the model. The results of the above sensitivity analysis are exhibited in Supplementary Tables S1 and S2, confirming the robustness of our results.

3. Results

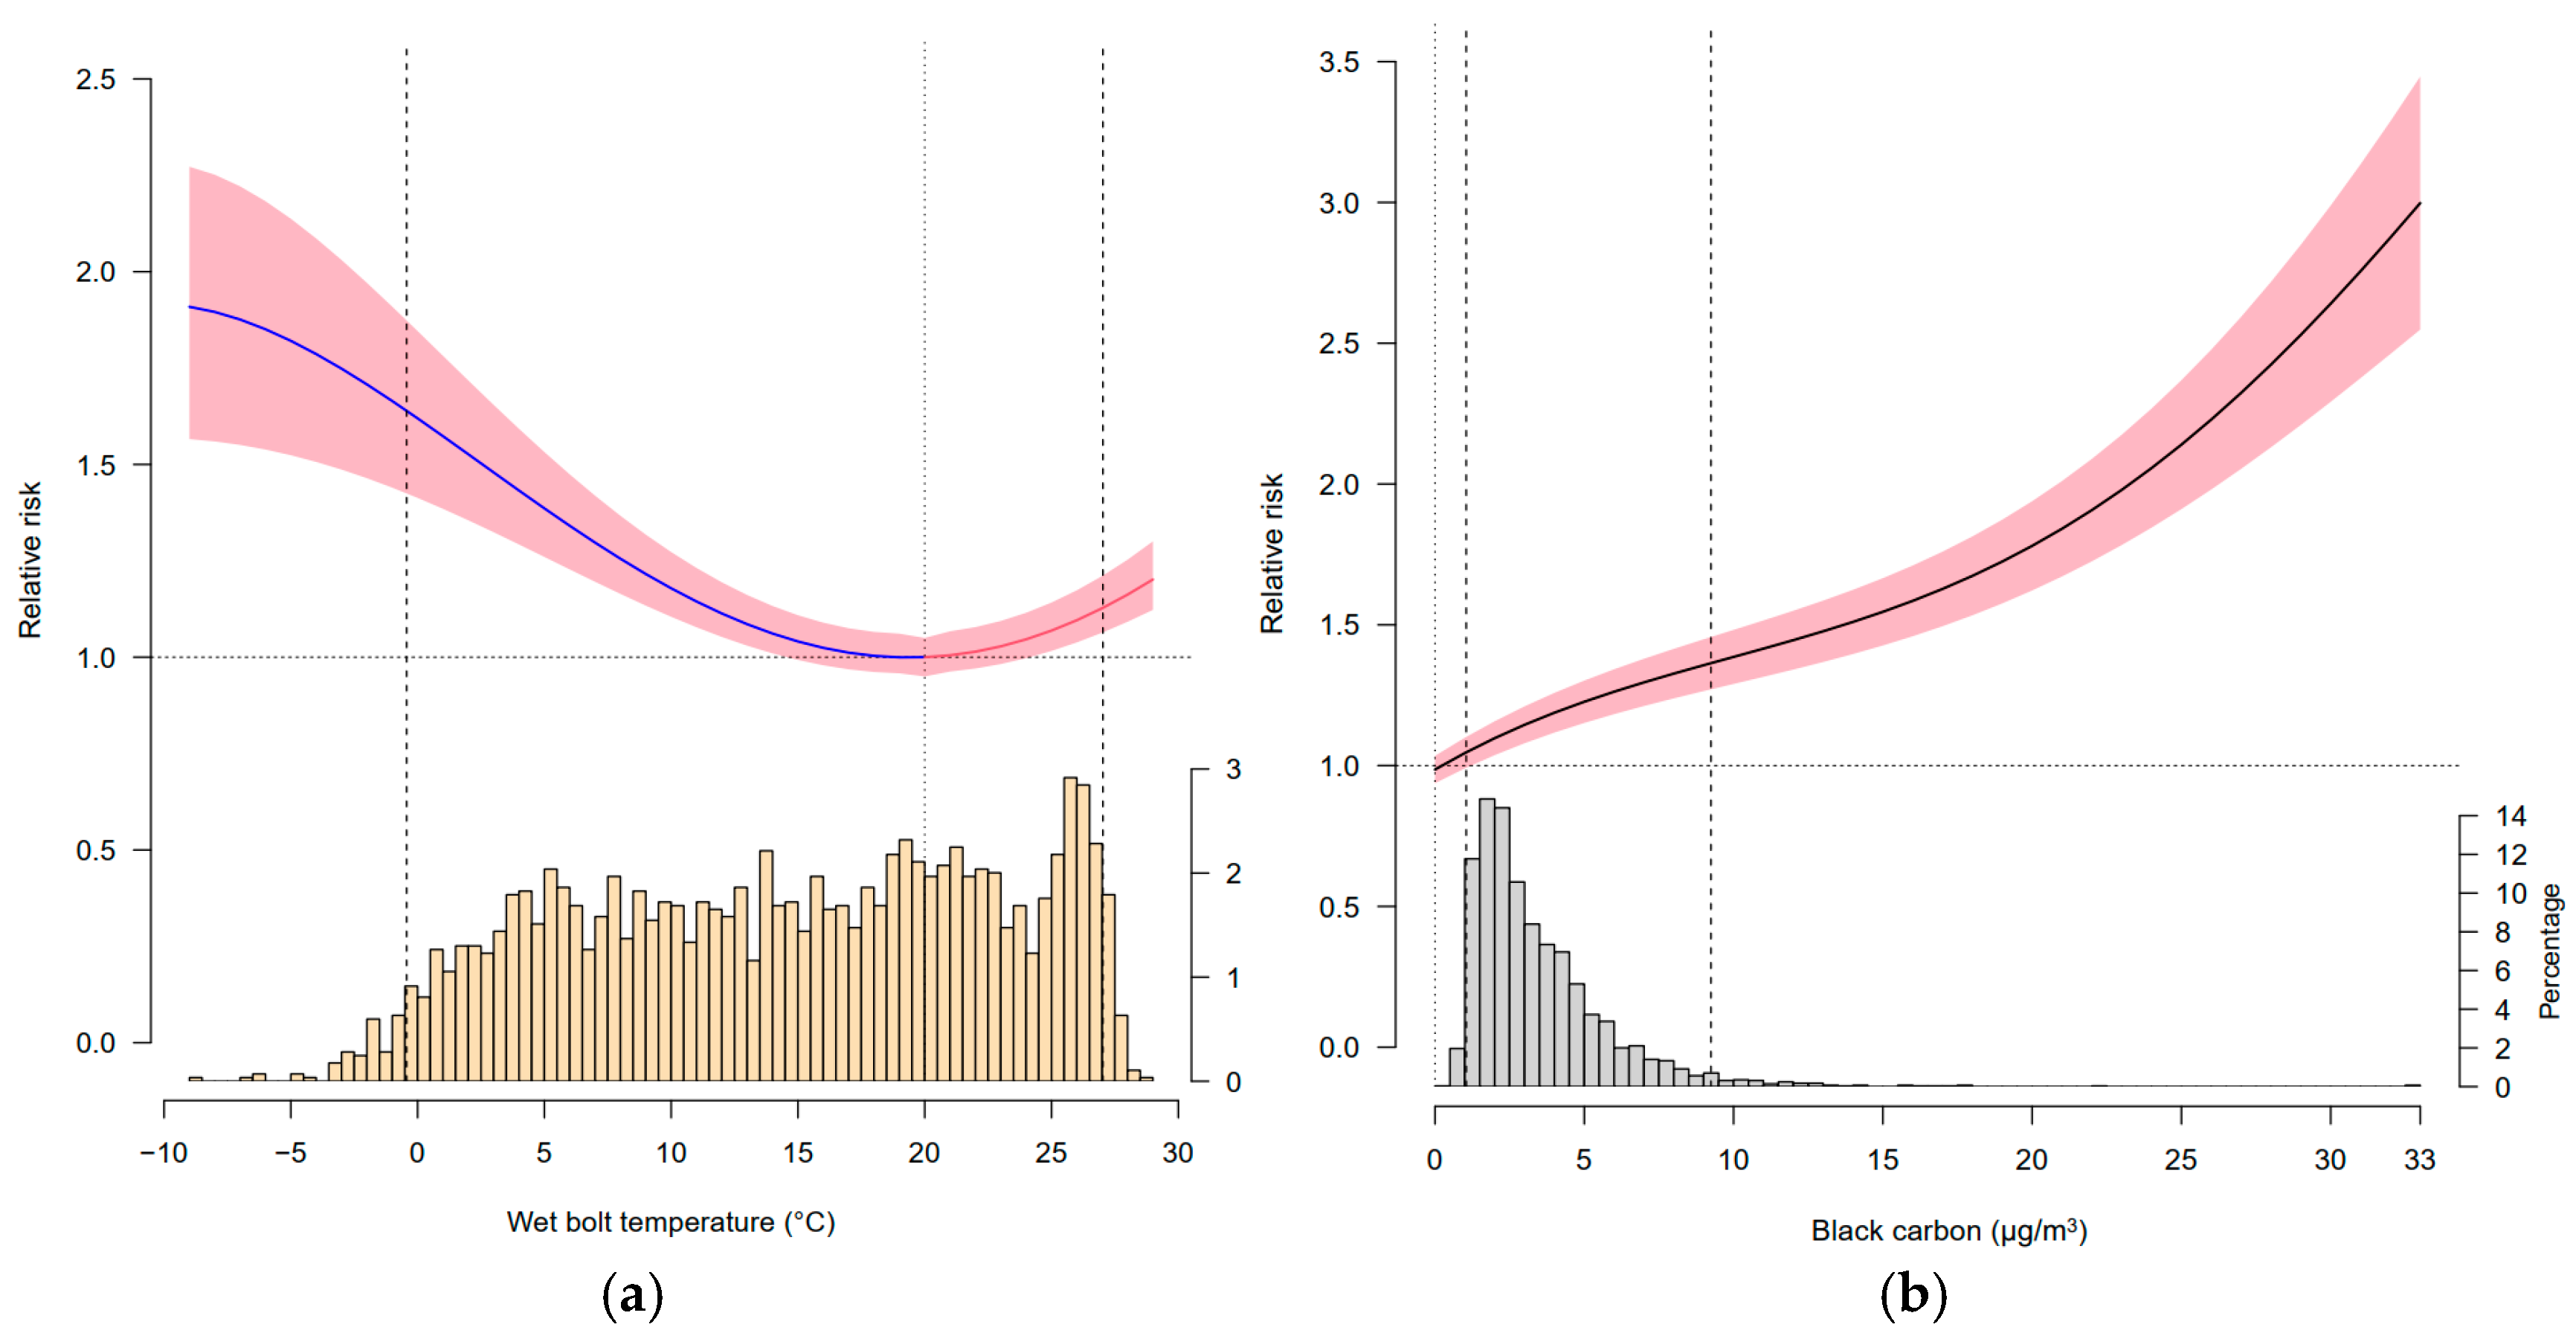
3.1. Association of WBT or BC Exposure with the Risk of Emergency Department Visits for CSIHD

Different fitting functions were used to detect the nonlinear relationship between WBT/BC exposure and the risk of emergency department visits, among which four knots of natural cubic spline were selected as the best fit to simulate the effects of exposure change and lag time (Section 2.5). Similarly to prior studies [28,29,30], the maximum lag length was set to 28 days to fully capture and reflect the impact of the lagged effect of WBT/BC on the risk of emergency department visits.
Figure 2a exhibits the effects of WBT variations on the emergency department visits for CSIHD, where the relationship curve between WBT and the relative risk of emergency department visits presents a U-shape. We found that low WBT (blue line) had a greater impact on the risk of emergency department visits than that of high WBT (red line). The risk of emergency department visits increased gradually as WBT deviated from the reference value (i.e., 20.3 °C, at which the risk of emergency department visits was the lowest) and became substantial as WBT reached its highest or lowest. The relationship between BC and the emergency department visit risk was found to be approximately J-shaped (Figure 2b, black line), which differed from that of WBT. An exposure concentration of BC of 0 μg/m3 (i.e., the reference value) corresponded to the lowest risk of emergency department visits; as the BC concentration increased, the risk of emergency department visits gradually increased, reaching the maximum value with the highest BC concentration. Exposure to BC above 10 μg/m3 contributed to a significant increase in the risk of emergency department visits.

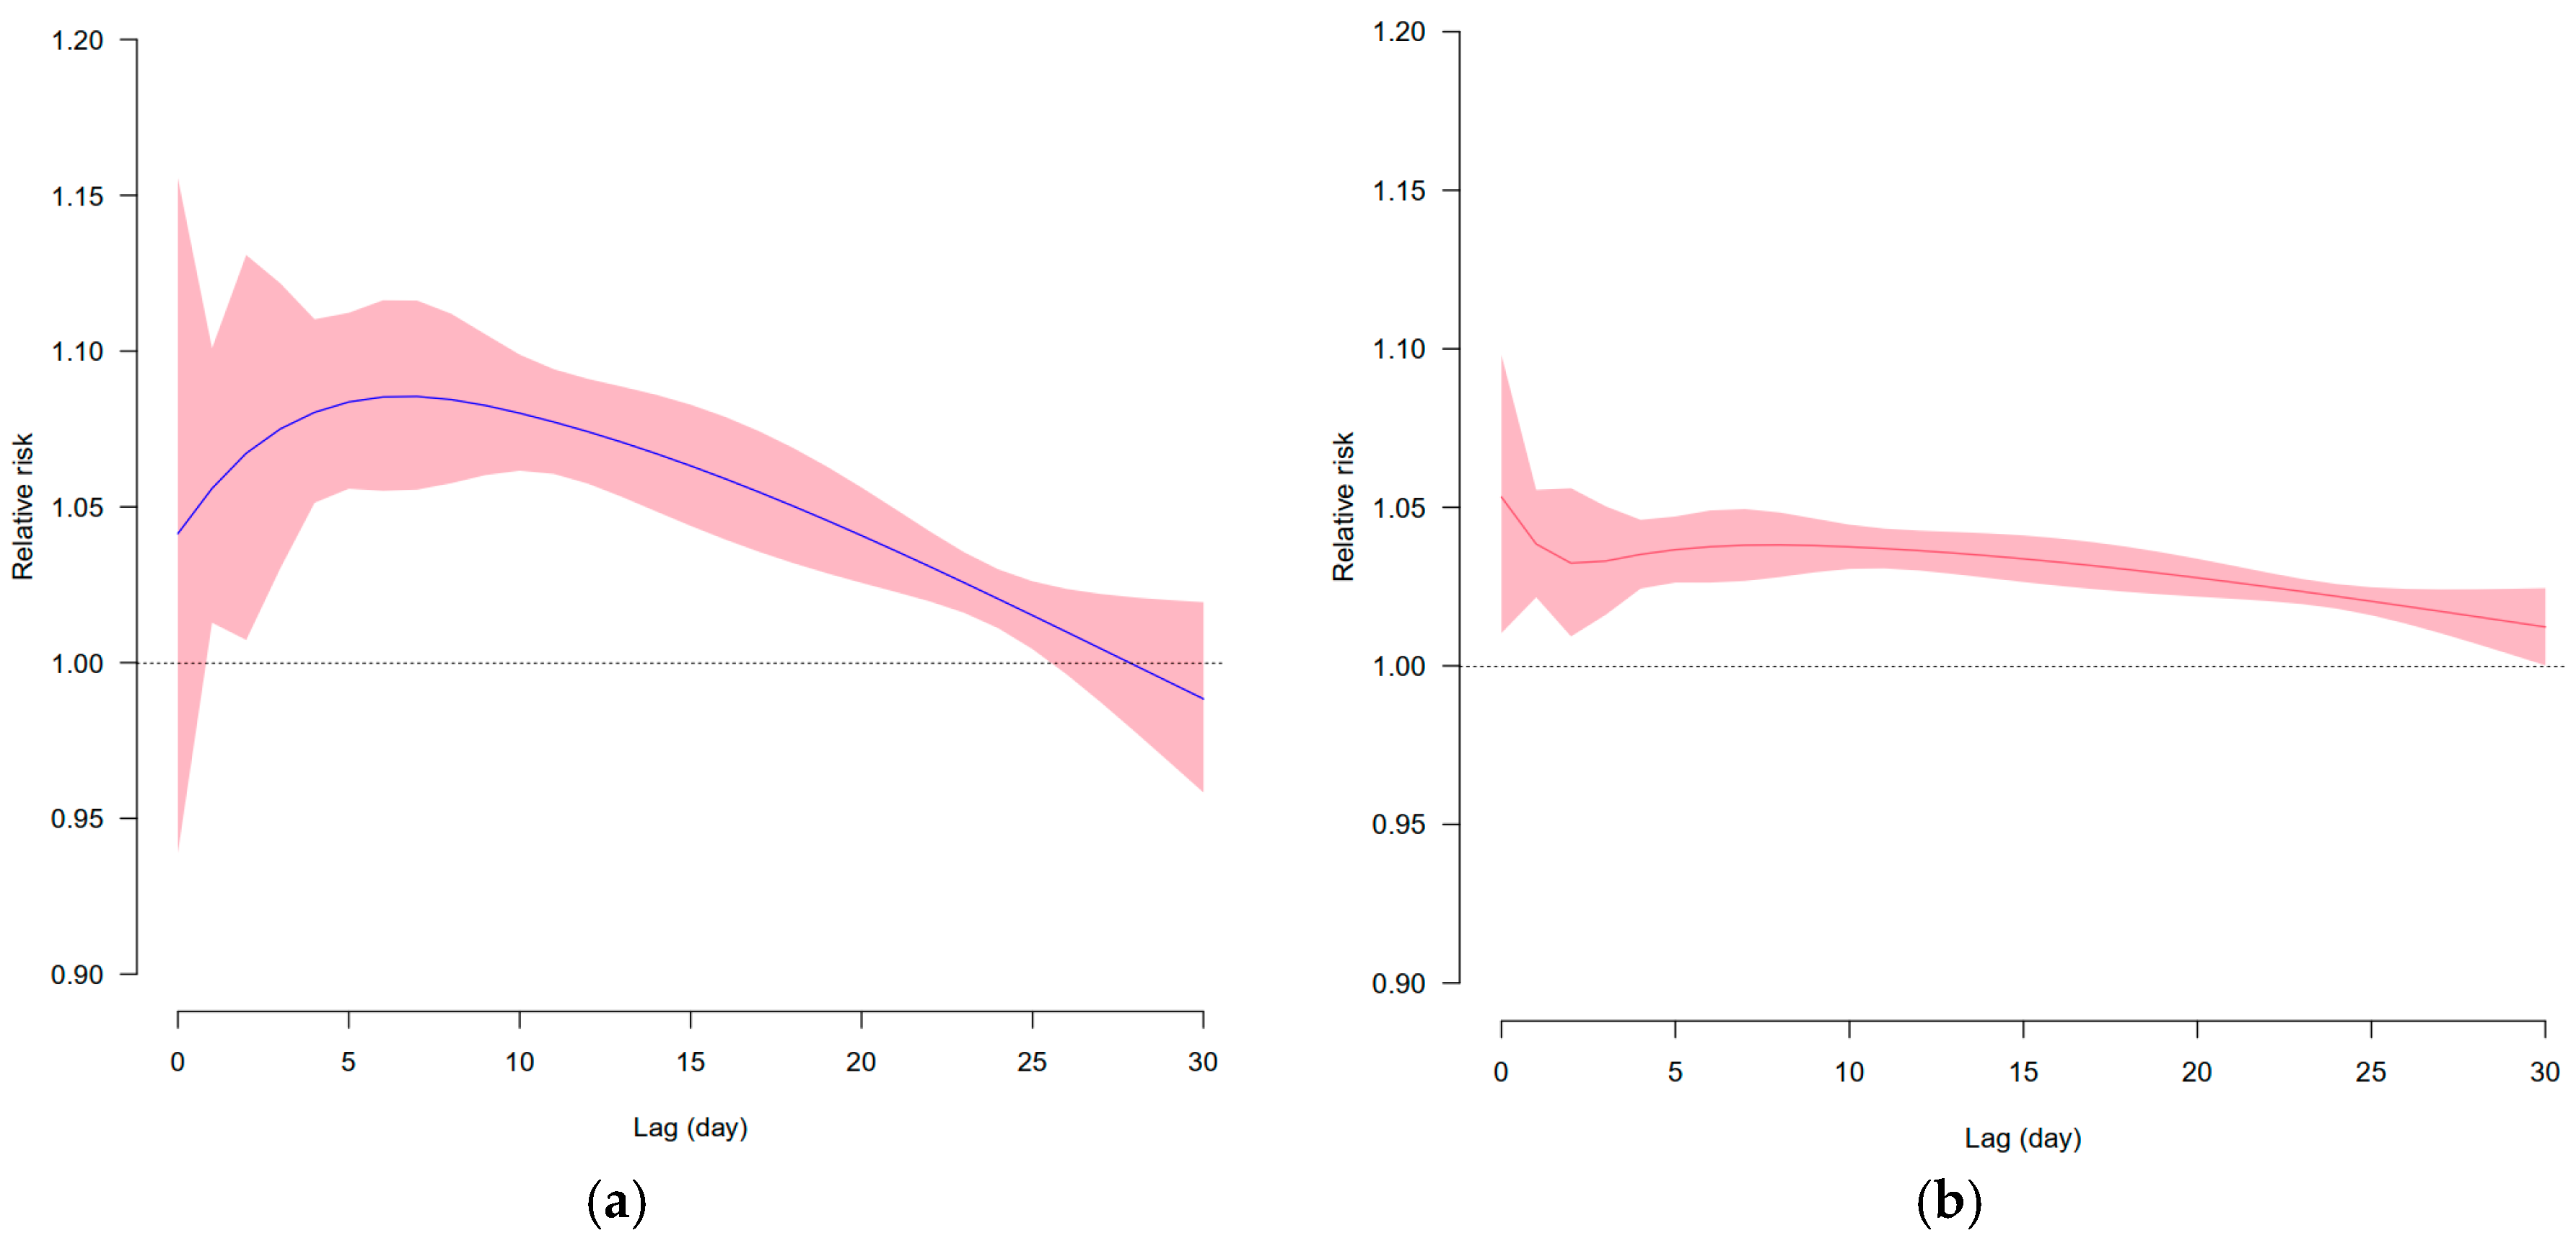
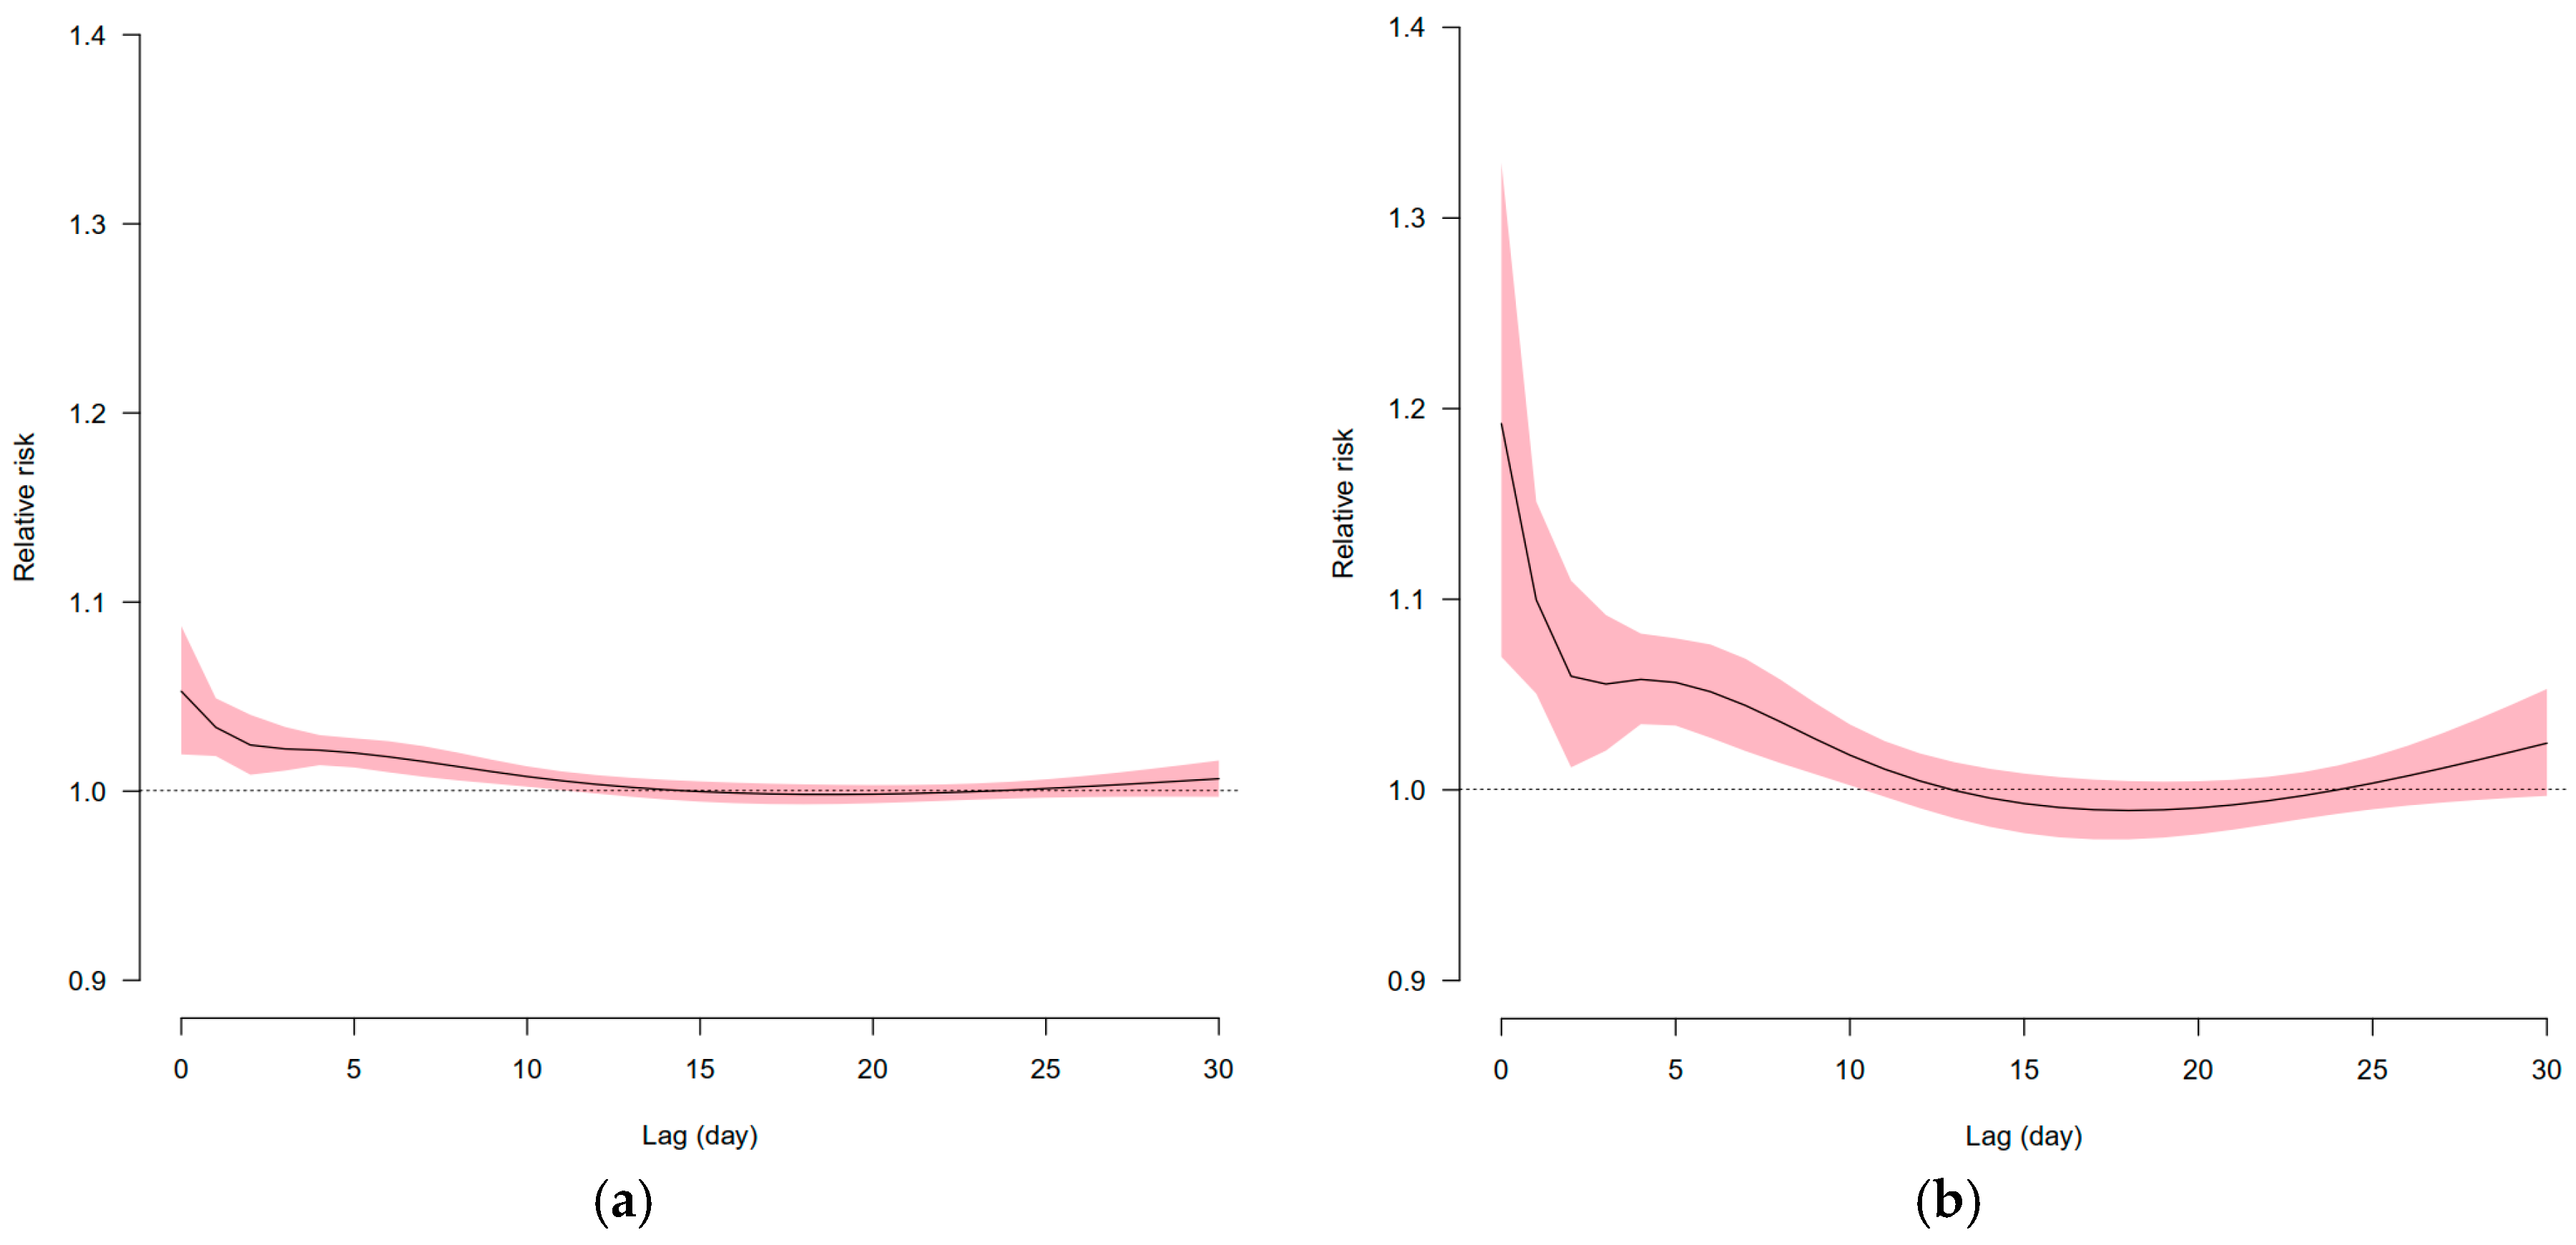
3.2. Lagged Effects of WBT or BC Exposure

We estimated the lagged effects of low and high exposures for WBT and BC, where low and high exposures were set at the 2.5th and 97.5th percentiles of WBT/BC, respectively, and the quantitative calculation results of lagged effects at different lag days are shown in Table 2.
Figure 3 illustrates the association between the lagged effect of WBT at the 2.5th and 97.5th percentiles and the risk of emergency department visits. The effect of low WBT was found to be insignificant at lag day 0 (95% confidence interval across the relative risk value of 1), and gradually increased with increasing lag days, reaching the maximum at lag day 7, then decreasing, and becoming insignificant again at about lag day 25. The lagged effect of high WBT occurred and reached the maximum at lag day 0. With the increase in lag days, the effect gradually decreased, increased after reaching the minimum at lag day 2 and maintained a slow decline, and became insignificant at lag day 30. Overall, the lagged effect of high WBT lasted longer, which was lower than that of low WBT. We found that the lagged effects of low and high BC exposure on the risk of emergency department visits were similar (Figure 4), of which both the lagged effects of low and high exposure occurred at lag day 0, demonstrated a downward trend with increasing lag time, and then became insignificant at lag day 10 (95% confidence interval spanned the relative risk value of 1). The lagged effect of high BC exposure was more pronounced than that of low BC for the risk of emergency department visits.

3.3. Emergency Department Visits for CSIHD Attributed to Various Ranges of WBT or BC

According to the variations in the exposure levels of WBT/BC, we divided them into different ranges. Specifically, WBT was divided into four ranges, including extreme low WBT (from 0 °C to the 2.5th percentile of −0.43 °C), moderate low WBT (from −0.43 °C to the reference value of 20.3 °C), moderate high WBT (from 20.3 °C to the 97.5th percentile of 27.03 °C), and extreme high WBT (above 27.03 °C). BC was similarly divided into four ranges, including extreme low exposure (from the reference value of 0 μg/m3 to the 2.5th percentile of 1.05 μg/m3), moderate low exposure (from 1.05 μg/m3 to the 50th percentile of 2.82 μg/m3), moderate high exposure (from 2.82 μg/m3 to the 97.5th percentile of 9.24 μg/m3), and extreme high exposure (above 9.24 μg/m3). Subsequently, the fractions of emergency department visits for CSIHD attributable to different ranges of WBT or BC exposure were quantified, respectively (Section 2.5).
As shown in Figure 5a, moderate WBT accounted for the maximum fraction of 20.65% (95% CI, 11.76–29.56%) of the emergency department visits for CSIHD, and the minimum fraction of 4.41% (95% CI, 2.23–6.59%) was attributable to extreme high WBT, which is consistent with the relationship curve between WBT variation and the risk of emergency department visits in Figure 2a. Figure 5b illustrates the contribution of different BC exposure ranges to the emergency department visits for CSIHD, where extreme low exposure accounted for the minimum fraction of 7.08% (95% CI, 3.77–10.41%), and the maximum fraction of 15.52% (95% CI, 7.86–23.19%) could be attributed to moderate high exposure. The fraction of emergency department visits caused by extreme high exposure of BC was not the largest, mainly because the vast majority of emergency department visits occurred at exposures below 10 μg/m3 (see Figure 2b).

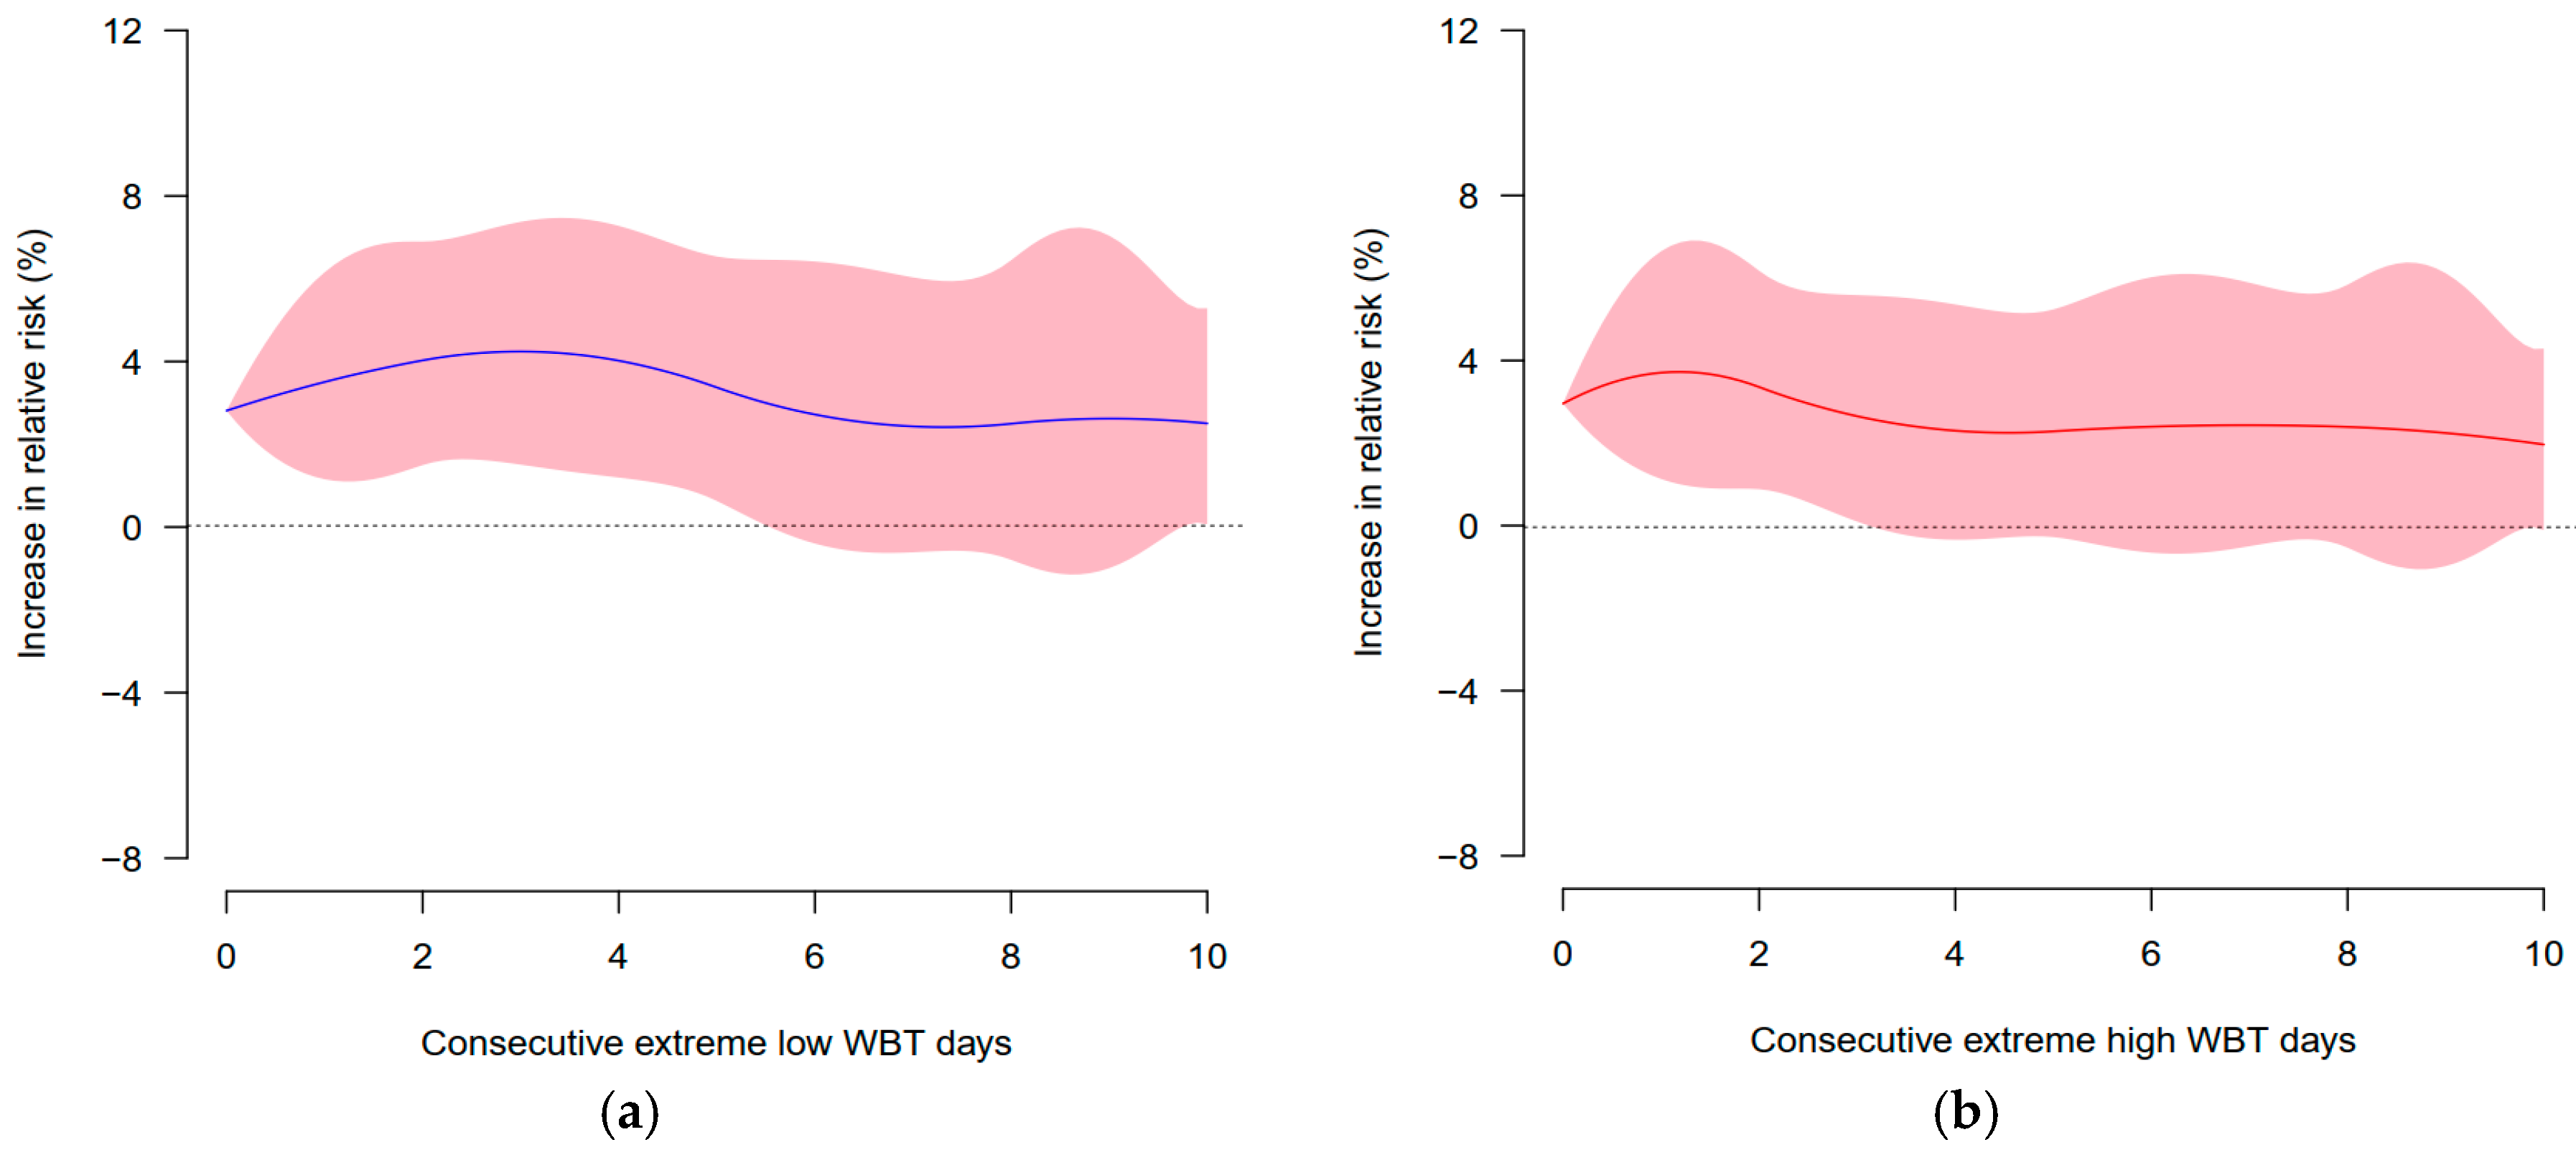
3.4. Effects of Short-Term Consecutive Extreme High and Low Exposure

Short-term consecutive extreme exposure usually refers to an extremely high or low exposure that occurs over a relatively short period of time, which is considered to be an additional effect on top of the basis of daily exposure variations [2]. We further quantified the effect of short-term consecutive extreme exposure to WBT and BC on the risk of emergency department visits for CSIHD (Section 2.5), where the threshold for extreme high exposure was defined as the 97.5th percentile (i.e., above 27.03 °C for WBT and 9.24 μg/m3 for BC), and the threshold for extreme low exposure was defined as the 2.5th percentile (i.e., below −0.43 °C for WBT and 1.05 μg/m3 for BC). The duration of short-term consecutive extreme high and low exposure for both WBT and BC was set to 10 days to fully capture and reflect their effects (Section 2.5) [2,29]. Figure 6 exhibits the effects of short-term consecutive extreme low (blue line) and high (red line) WBT on the risk of emergency department visits, of which extreme low WBT is significant over a duration of 0–5.5 days and becomes insignificant after 5.5 days; extreme high WBT has no effect except for the durations of 0–3 days. We found that the effects of short-term extreme low BC exposures were significant for the duration of 0–1 and 4–10 days (Figure 7a), the extreme high BC exposure effects were significant for the entire duration of 0–10 days with the maximum occurring on day 9 (Figure 7b), and short-term consecutive exposure to extreme high BC was associated with a greater risk of emergency department visits for CSIHD compared with that of extreme low exposure.

4. Discussion

The global climate is changing at a rapid rate, where ambient temperature, air pollutants, and their interaction effects have led to a significant increase in a range of health-related risks, especially for emergency department visits due to various diseases including psychiatric and cardiovascular diseases, eye diseases, and respiratory problems [11,13,16,19]. However, there are few studies on the effects of WBT and BC exposure on the risk of emergency department visits for CSIHD, whose mechanisms of action remain unclear. In this study, we comprehensively evaluated the association of daily WBT or BC exposure with the risk of emergency department visits for CSIHD, of which the quantitative exposure–response relationships were revealed. Several potential physiological mechanisms accounted for these.
The effect of WBT on the risk of emergency department visits for CSIHD was found to be approximately U-shaped, with a lower WBT having a greater effect than a higher WBT, and the corresponding risk being lowest at the reference temperature of 20.3 °C. This is consistent with the findings of previous studies [11,12,13], mainly because blood pressure increases significantly in winter, leading to a deterioration in blood pressure control in some hypertensive patients, while cold-induced blood pressure increases also lead to long-term blood pressure variability in both normal blood pressure and pre-hypertensive patients, which are known cardiovascular risk factors [37]. We found an overall J-shaped expose–response relationship between BC exposure and emergency department visits for CSIHD, indicating a gradual increase in the relative risk with increasing BC concentrations, similar to previous studies of air pollutants and multiple health outcomes [38,39,40]. Exposure to fine particulate matter (PM2.5 and PM10) has been linked to increased emergency department visits for psychiatric, cardiovascular, ocular, and respiratory conditions [16,17,18]. Higher SO2 levels were associated with more circulatory and neurological visits, particularly during the cold season [19]. In Mexico City, O3, NO2, and CO exposures were also associated with elevated cardiovascular emergency visits, with lagged effects observed across different days [20]. Our study also showed that BC exposure higher than 10 μg/m3 significantly enhanced the risk of emergency department visits, suggesting that BC exposure higher than 10 μg/m3 was a high-risk exposure event for the emergency department visits for CSIHD. BC, a pure carbon component of PM2.5 from incomplete fossil fuel and biomass combustion, differs from general PM2.5 due to its strong light absorption, high surface reactivity, and solid form [21]. Its ultrafine size and unique properties enable deep respiratory penetration, triggering oxidative stress and systemic inflammation more strongly than many other PM2.5 constituents [22]. This is the main reason that high concentrations of BC directly penetrate into the blood through the respiratory system, inducing oxidative stress that affects vascular function and destroying endothelial vasodilation and endogenous fibrinolysis to produce thrombosis, which is considered to be the most common potential pathology that causes cardiovascular disease [39,41].
Both WBT and BC exposure exerted a lagged effect on the emergency department visits for CSIHD. Overall, the lagged effect of low WBT is more significant, and the response of high WBT’s lag effect is more rapid and durable, which is consistent with the findings of several relevant studies [26,27]. The lagged effects of low and high concentrations of BC demonstrated a certain degree of similarity, where higher levels of BC exposure corresponded to more significant lagged effects, mainly due to the more substantial effects of higher levels of pollution exposure on the physiological properties of individuals [39]. Moderate WBT and moderate high exposure to BC accounted for the maximum fraction of 20.65% (95% CI, 11.76–29.56%) and 15.52% (95% CI, 7.86–23.19%) of the emergency department visits for CSIHD, respectively, which is mainly due to the range distribution of WBT/BC corresponding to the day the emergency department visit occurs [28,30,36]. We also explored the impacts of short-term consecutive extreme low and high WBT on the risk of emergency department visits for CSIHD, of which extreme low WBT is significant over a duration of 0–5.5 days and becomes insignificant after 5.5 days; extreme high WBT has no effect except for the duration of 0–3 days. The effect of short-term extreme low BC exposure was significant for the duration of 0–1 and 4–10 days, and the extreme high BC exposure was significant for the entire duration of 0–10 days with the maximum occurring on day 9. The effect of extreme low WBT is no longer significant after 5.5 days, while the effect of high WBT seems to be more rapid and short-lived. This is mainly because the individual’s reaction to heat exposure is relatively faster compared to cold exposure, and the duration of the effect of cold exposure is longer [12,13]. The prolonged lag effect of high BC exposure, especially the peak observed on the 9th day, was interpreted as significant and persistent negative health effects of high BC exposure on individuals. This is similar to previous studies on air pollution and health outcomes [17,18,19]. These results further confirm that short-term consecutive extreme WBT/BC exposure has a non-negligible effect on the risk of emergency department visits for CSIHD, which is similar to the results of prior studies that focused on the effects of heat waves and cold spells on various health outcomes [2,29,36].
There are some limitations in this study. Similarly to the typical characteristics of population-based environmental exposure index analyses, environmental WBT and BC exposures are used to reflect the individual exposures. Since indoor temperature and relative humidity are easily affected by air conditioning and purifiers, we do not have access to usage information for this part [13,29]. Therefore, the utilization of environmental WBT and BC exposure indicators cannot capture the specific WBT or BC exposure of the individual heterogeneity in the measurement [13,42]. More accurate WBT and BC exposure assessments could improve the accuracy of the results. Limited by the source of data, this study did not take into account the specific individual information regarding lifestyle, behavior, education level, and socioeconomic status, which could potentially influence the estimated associations [26,43]. The sample of CSIHD that includes more adequate information on socioeconomic demographic characteristics could address this. In addition, our study has several limitations related to the COVID-19 pandemic period. First, although our data collection extended until 31 December 2020, we did not specifically exclude patients infected with COVID-19. Given that COVID-19 infection itself can induce cardiovascular complications [44,45], including ischemic heart disease, it is possible that some of the emergency department visits classified as cause-stable ischemic heart disease (CSIHD) were influenced by COVID-19 infection. This may introduce potential confounding effects, making it difficult to fully disentangle the associations between wet-bulb temperature, black carbon exposure, and CSIHD. Second, the implementation of strict public health measures, such as lockdowns and mobility restrictions during the pandemic, likely led to significant reductions in air pollutant emissions [46,47], including black carbon, and potentially altered ambient temperature exposures. These changes could have impacted both the level of environmental exposure and healthcare-seeking behaviors, thus affecting the observed relationships. Therefore, caution is warranted when interpreting our findings, especially for the period from December 2019 to December 2020. Moreover, our study did not account for indoor environmental exposures, such as secondhand tobacco smoke, the use of solid fuels and gas stoves, carbon monoxide emissions from heating sources or blocked chimneys, and biological contaminants like molds, fungi, and mycotoxins, all of which are known to influence cardiovascular health. The lack of data on these indoor exposures may have resulted in residual confounding. Furthermore, individual psychosocial factors, including chronic stress and mental health conditions, which are also important determinants of heart disease, were not captured in our analysis. Future studies should aim to incorporate both indoor environmental factors and psychosocial variables to provide a more comprehensive understanding of the environmental determinants of cause-stable ischemic heart disease.
CSIHD is a serious threat and associated factor for health risks, and plays an important role in the scheduling of public resources for emergency department visits simultaneously. In this research, we reported the effects of non-optimal WBT and varying degrees of BC exposure on the risk of emergency department visits for CSIHD. The lagged effects of WBT and BC were explored, and the attributable risks of their different exposure ranges were quantified. The results suggested that the additional effect of short-term consecutive extreme WBT or BC exposure on the risk of emergency department visits is not negligible and should be of concern. Overall, our study contributed to a comprehensive and detailed understanding of the relationship between WBT and BC exposure and the risk of emergency department visits for CSIHD, which provides important implications for other health outcomes associated with temperature and air pollutants.

5. Conclusions

We show that both WBT and BC exert a lagged effect on the risk of emergency department visits for CSIHD. We further demonstrated an additional increased risk of short-term consecutive exposure to extreme low (2.5th percentile) and high (97.5th percentile) WBT/BC for emergency department visits over a sustained period of several days. Global climate change is intensifying now and in the anticipated future. Our study provides new insights into the environmental variables of WBT and BC affecting the risk of emergency department visits for CSIHD, and reveals opportunities to prevent or reduce emergency department visits by effective individual-specific practical action guidelines. A second importance lies in improving the targeting of public administrative interventions to the external high or low WBT/BC exposure where the areas are most needed.

Supplementary Materials

The following supporting information can be downloaded at: https://www.mdpi.com/article/10.3390/atmos16050542/s1, Supplementary Table S1: The relative risk of WBT/BC on emergency department visits at lag day 0 for the selection of various maximum lag days for CSIHD; Supplementary Table S2: The relative risk of WBT/BC on emergency department visits at lag day 0 for the maximum lag days of 28 with versus without controlling for O3, NO2, SO2, and CO for CSIHD.

Author Contributions

Conceptualization, K.H.; methodology, K.H.; software, Q.C.; validation, K.H., Q.C. and X.X.; formal analysis, X.X. and Z.W.; investigation, Q.C., X.X. and Z.W.; resources, K.H.; data curation, Q.C.; writing—original draft preparation, K.H.; writing—review and editing, K.H., X.X. and Z.W.; visualization, X.X.; supervision, K.H.; project administration, K.H.; funding acquisition, K.H. All authors have read and agreed to the published version of the manuscript.

Funding

This research was funded by the National Natural Science Foundation of China (Grant No. 42401519), the Natural Science Foundation of Jiangsu Province (Grant No. BK20230430), and the Startup Foundation for Introducing Talent of NUIST (Grant No. 2022r041).

Institutional Review Board Statement

The study was conducted in accordance with the Declaration of Helsinki, and approved by the Ethics Committee of Shanghai University (IRB Number: ECSHU 2023-018).

Informed Consent Statement

Informed consent was obtained from all subjects involved in the study.

Data Availability Statement

The raw data supporting the conclusions of this article will be made available by the authors on request.

Acknowledgments

We would like to thank the staff of Baoshan District Renhe Hospital for assisting with on-site data collection and Zheng Zhang for providing this publicly available data.

Conflicts of Interest

The authors declare no conflict of interest.

References

  1. Cramer, W.; Guiot, J.; Fader, M.; Garrabou, J.; Gattuso, J.; Iglesias, A.; Lange, M.A.; Lionello, P.; Llasat, M.C.; Paz, S.; et al. Climate change and interconnected risks to sustainable development in the Mediterranean. Nat. Clim. Change 2018, 8, 972–980. [Google Scholar] [CrossRef]
  2. Gasparrini, A.; Armstrong, B. The Impact of Heat Waves on Mortality. Epidemiology 2011, 22, 68–73. [Google Scholar] [CrossRef]
  3. Wing, O.E.J.; Lehman, W.; Bates, P.D.; Sampson, C.C.; Quinn, N.; Smith, A.M.; Neal, J.C.; Porter, J.R.; Kousky, C. Inequitable patterns of US flood risk in the Anthropocene. Nat. Clim. Change 2022, 12, 156–162. [Google Scholar] [CrossRef]
  4. Ban, J.; Lu, K.; Wang, Q.; Li, T. Climate change will amplify the inequitable exposure to compound heatwave and ozone pollution. One Earth 2022, 5, 677–686. [Google Scholar] [CrossRef]
  5. Xu, F.; Qu, Y.; Bento, V.A.; Song, H.; Qiu, J.; Qi, J.; Wan, L.; Zhang, R.; Miao, L.; Zhang, X.; et al. Understanding climate change impacts on drought in China over the 21st century: A multi-model assessment from CMIP6. Npj Clim. Atmos. Sci. 2024, 7, 32. [Google Scholar] [CrossRef]
  6. Zhang, L.; Liu, W.; Hou, K.; Lin, J.; Zhou, C.; Tong, X.; Wang, Z.; Wang, Y.; Jiang, Y.; Wang, Z.; et al. Air pollution-induced missed abortion risk for pregnancies. Nat. Sustain. 2019, 2, 1011–1017. [Google Scholar] [CrossRef]
  7. Burke, M.; González, F.; Baylis, P.; Heft-Neal, S.; Baysan, C.; Basu, S.; Hsiang, S. Higher temperatures increase suicide rates in the United States and Mexico. Nat. Clim. Change 2018, 8, 723–729. [Google Scholar] [CrossRef]
  8. Tran, H.M.; Tsai, F.; Lee, Y.; Chang, J.; Chang, L.; Chang, T.; Chung, K.F.; Kuo, H.; Lee, K.; Chuang, K.; et al. The impact of air pollution on respiratory diseases in an era of climate change: A review of the current evidence. Sci. Total Environ. 2023, 898, 166340. [Google Scholar] [CrossRef]
  9. Weinberger, K.R.; Haykin, L.; Eliot, M.N.; Schwartz, J.D.; Gasparrini, A.; Wellenius, G.A. Projected temperature-related deaths in ten large U.S. metropolitan areas under different climate change scenarios. Environ. Int. 2017, 107, 196–204. [Google Scholar] [CrossRef]
  10. Yoo, E.; Eum, Y.; Roberts, J.E.; Gao, Q.; Chen, K. Association between extreme temperatures and emergency room visits related to mental disorders: A multi-region time-series study in New York, USA. Sci. Total Environ. 2021, 792, 148246. [Google Scholar] [CrossRef]
  11. Zhao, Q.; Zhang, Y.; Zhang, W.; Li, S.; Chen, G.; Wu, Y.; Qiu, C.; Ying, K.; Tang, H.; Huang, J.; et al. Ambient temperature and emergency department visits: Time-series analysis in 12 Chinese cities. Environ. Pollut. 2017, 224, 310–316. [Google Scholar] [CrossRef] [PubMed]
  12. Bai, L.; Woodward, A.; Chen, B.; Liu, Q. Temperature, hospital admissions and emergency room visits in Lhasa, Tibet: A time-series analysis. Sci. Total Environ. 2014, 490, 838–848. [Google Scholar] [CrossRef]
  13. Zhang, Y.; Ebelt, S.T.; Shi, L.; Scovronick, N.C.; D’Souza, R.R.; Steenland, K.; Chang, H.H. Short-term associations between warm-season ambient temperature and emergency department visits for Alzheimer’s disease and related dementia in five US states. Environ. Res. 2023, 220, 115176. [Google Scholar] [CrossRef]
  14. Dong, J.; Brönnimann, S.; Hu, T.; Liu, Y.; Peng, J. GSDM-WBT: Global station-based daily maximum wet-bulb temperature data for 1981–2020. Earth Syst. Sci. Data 2022, 14, 5651–5664. [Google Scholar] [CrossRef]
  15. Yan, Y.; Xu, Y.; Yue, S. A high-spatial-resolution dataset of human thermal stress indices over South and East Asia. Sci. Data 2021, 8, 229. [Google Scholar] [CrossRef] [PubMed]
  16. Bucci, A.; Sanmarchi, F.; Santi, L.; Golinelli, D. Evaluating the nonlinear association between PM10 and emergency department visits. Socio-Econ. Plan. Sci. 2024, 93, 101887. [Google Scholar] [CrossRef]
  17. Muhsin, H.A.; Steingrimsson, S.; Oudin, A.; Åström, D.O.; Carlsen, H.K. Air pollution and increased number of psychiatric emergency room visits: A case-crossover study for identifying susceptible groups. Environ. Res. 2022, 204, 112001. [Google Scholar] [CrossRef]
  18. Trentalange, A.; Renzi, M.; Michelozzi, P.; Guizzi, M.; Solimini, A.G. Association between air pollution and emergency room admission for eye diseases in Rome, Italy: A time-series analysis. Environ. Pollut. 2024, 343, 123279. [Google Scholar] [CrossRef]
  19. Guo, P.; Feng, W.; Zheng, M.; Lv, J.; Wang, L.; Liu, J.; Zhang, Y.; Luo, G.; Zhang, Y.; Deng, C.; et al. Short-term associations of ambient air pollution and cause-specific emergency department visits in Guangzhou, China. Sci. Total Environ. 2018, 613–614, 306–313. [Google Scholar] [CrossRef]
  20. Ugalde-Resano, R.; Riojas-Rodríguez, H.; Texcalac-Sangrador, J.L.; Cruz, J.C.; Hurtado-Díaz, M. Short term exposure to ambient air pollutants and cardiovascular emergency department visits in Mexico city. Environ. Res. 2022, 207, 112600. [Google Scholar] [CrossRef]
  21. Wei, J.; Wang, J.; Li, Z.; Kondragunta, S.; Anenberg, S.; Wang, Y.; Zhang, H.; Diner, D.; Hand, J.; Lyapustin, A.; et al. Long-term mortality burden trends attributed to black carbon and PM2·5 from wildfire emissions across the continental USA from 2000 to 2020: A deep learning modelling study. Lancet Planet. Health 2023, 7, e963–e975. [Google Scholar] [CrossRef] [PubMed]
  22. Chowdhury, S.; Pozzer, A.; Haines, A.; Klingmüller, K.; Münzel, T.; Paasonen, P.; Sharma, A.; Venkataraman, C.; Lelieveld, J. Global health burden of ambient PM2.5 and the contribution of anthropogenic black carbon and organic aerosols. Environ. Int. 2022, 159, 107020. [Google Scholar] [CrossRef]
  23. Cao, S.; Zhang, S.; Gao, C.; Yan, Y.; Bao, J.; Su, L.; Liu, M.; Peng, N.; Liu, M. A long-term analysis of atmospheric black carbon MERRA-2 concentration over China during 1980–2019. Atmos. Environ. 2021, 264, 118662. [Google Scholar] [CrossRef]
  24. Xu, X.; Yang, X.; Zhu, B.; Tang, Z.; Wu, H.; Xie, L. Characteristics of MERRA-2 black carbon variation in east China during 2000–2016. Atmos. Environ. 2020, 222, 117140. [Google Scholar] [CrossRef]
  25. Zhou, Y.; Jin, Y.; Zhang, Z. Short-term exposure to various ambient air pollutants and emergency department visits for cause-stable ischemic heart disease: A time-series study in Shanghai, China. Sci. Rep. 2023, 13, 16989. [Google Scholar] [CrossRef] [PubMed]
  26. Niu, Y.; Gao, Y.; Yang, J.; Qi, L.; Xue, T.; Guo, M.; Zheng, J.; Lu, F.; Wang, J.; Liu, Q. Short-term effect of apparent temperature on daily emergency visits for mental and behavioral disorders in Beijing, China: A time-series study. Sci. Total Environ. 2020, 733, 139040. [Google Scholar] [CrossRef]
  27. Yang, R.; Wang, Y.; Dong, J.; Wang, J.; Zhang, H.; Bao, H. Association between ambient temperature and cause-specific respiratory outpatient visits: A case-crossover design with a distributed lag nonlinear model in Lanzhou, China. Urban. Clim. 2022, 46, 101303. [Google Scholar] [CrossRef]
  28. Gasparrini, A.; Guo, Y.; Hashizume, M.; Lavigne, E.; Zanobetti, A.; Schwartz, J.; Tobias, A.; Tong, S.; Rocklöv, J.; Forsberg, B.; et al. Mortality risk attributable to high and low ambient temperature: A multicountry observational study. Lancet 2015, 386, 369–375. [Google Scholar] [CrossRef]
  29. Hou, K.; Zhang, L.; Xu, X.; Yang, F.; Chen, B.; Hu, W.; Shu, R. High ambient temperatures are associated with urban crime risk in Chicago. Sci. Total Environ. 2023, 856, 158846. [Google Scholar] [CrossRef]
  30. Renjie, C.; Peng, Y.; Lijun, W.; Cong, L.; Yue, N.; Weidong, W.; Yixuan, J.; Yunning, L.; Jiangmei, L.; Jinlei, Q.; et al. Association between ambient temperature and mortality risk and burden: Time series study in 272 main Chinese cities. BMJ-Brit Med. J. 2018, 363, k4306. [Google Scholar]
  31. Lin, L.; Huang, P.; Weng, L. Selecting Path Models in SEM: A Comparison of Model Selection Criteria. Struct. Equ. Model. A Multidiscip. J. 2017, 24, 855–869. [Google Scholar] [CrossRef]
  32. Zhang, L.; Liu, W.; Hou, K.; Lin, J.; Song, C.; Zhou, C.; Huang, B.; Tong, X.; Wang, J.; Rhine, W.; et al. Air pollution exposure associates with increased risk of neonatal jaundice. Nat. Commun. 2019, 10, 3741. [Google Scholar] [CrossRef]
  33. Peng, W.; Fan, Z.; Duan, J.; Gao, W.; Wang, R.; Liu, N.; Li, Y.; Hua, S. Assessment of interactions between influencing factors on city shrinkage based on geographical detector: A case study in Kitakyushu, Japan. Cities 2022, 131, 103958. [Google Scholar] [CrossRef]
  34. Zhang, H.; Dong, G.; Wang, J.; Zhang, T.; Meng, X.; Yang, D.; Liu, Y.; Lu, B. Understanding and extending the geographical detector model under a linear regression framework. Int. J. Geogr. Inf. Sci. 2023, 37, 2437–2453. [Google Scholar] [CrossRef]
  35. Gasparrini, A.; Leone, M. Attributable risk from distributed lag models. BMC Med. Res. Methodol. 2014, 14, 55. [Google Scholar] [CrossRef]
  36. Hou, K.; Zhang, L.; Xu, X.; Yang, F.; Chen, B.; Hu, W. Ambient temperatures associated with increased risk of motor vehicle crashes in New York and Chicago. Sci. Total Environ. 2022, 830, 154731. [Google Scholar] [CrossRef] [PubMed]
  37. Goel, H.; Shah, K.; Kumar, A.; Hippen, J.T.; Nadar, S.K. Temperature, cardiovascular mortality, and the role of hypertension and renin–angiotensin–aldosterone axis in seasonal adversity: A narrative review. J. Hum. Hypertens. 2022, 36, 1035–1047. [Google Scholar] [CrossRef]
  38. Hystad, P.; Larkin, A.; Rangarajan, S.; Al Habib, K.F.; Avezum, Á.; Calik, K.B.T.; Chifamba, J.; Dans, A.; Diaz, R.; du Plessis, J.L.; et al. Associations of outdoor fine particulate air pollution and cardiovascular disease in 157,436 individuals from 21 high-income, middle-income, and low-income countries (PURE): A prospective cohort study. Lancet Planet. Health 2020, 4, e235–e245. [Google Scholar] [CrossRef]
  39. Li, T.; Yu, Z.; Xu, L.; Wu, Y.; Yu, L.; Yang, Z.; Shen, P.; Lin, H.; Shui, L.; Tang, M.; et al. Residential greenness, air pollution, and incident ischemic heart disease: A prospective cohort study in China. Sci. Total Environ. 2022, 838, 155881. [Google Scholar] [CrossRef]
  40. Cheng, B.; Pan, C.; Cai, Q.; Liu, L.; Cheng, S.; Yang, X.; Meng, P.; Wei, W.; He, D.; Liu, H.; et al. Long-term ambient air pollution and the risk of musculoskeletal diseases: A prospective cohort study. J. Hazard. Mater. 2024, 466, 133658. [Google Scholar] [CrossRef]
  41. Nemmar, A.; Hoet, P.H.M.; Vanquickenborne, B.; Dinsdale, D.; Thomeer, M.; Hoylaerts, M.F.; Vanbilloen, H.; Mortelmans, L.; Nemery, B. Passage of Inhaled Particles into the Blood Circulation in Humans. Circulation 2002, 105, 411–414. [Google Scholar] [CrossRef] [PubMed]
  42. Lippmann, S.J.; Fuhrmann, C.M.; Waller, A.E.; Richardson, D.B. Ambient temperature and emergency department visits for heat-related illness in North Carolina, 2007–2008. Environ. Res. 2013, 124, 35–42. [Google Scholar] [CrossRef] [PubMed]
  43. Chen, Y.; Zheng, M.; Lv, J.; Shi, T.; Liu, P.; Wu, Y.; Feng, W.; He, W.; Guo, P. Interactions between ambient air pollutants and temperature on emergency department visits: Analysis of varying-coefficient model in Guangzhou, China. Sci. Total Environ. 2019, 668, 825–834. [Google Scholar] [CrossRef] [PubMed]
  44. Wadhera, R.K.; Shen, C.; Gondi, S.; Chen, S.; Kazi, D.S.; Yeh, R.W. Cardiovascular Deaths During the COVID-19 Pandemic in the United States. J. Am. Coll. Cardiol. 2021, 77, 159–169. [Google Scholar] [CrossRef]
  45. Roth, G.A.; Vaduganathan, M.; Mensah, G.A. Impact of the COVID-19 Pandemic on Cardiovascular Health in 2020: JACC State-of-the-Art Review. J. Am. Coll. Cardiol. 2022, 80, 631–640. [Google Scholar] [CrossRef]
  46. Venter, Z.S.; Aunan, K.; Chowdhury, S.; Lelieveld, J. Air pollution declines during COVID-19 lockdowns mitigate the global health burden. Environ. Res. 2021, 192, 110403. [Google Scholar] [CrossRef]
  47. Hu, M.; Chen, Z.; Cui, H.; Wang, T.; Zhang, C.; Yun, K. Air pollution and critical air pollutant assessment during and after COVID-19 lockdowns: Evidence from pandemic hotspots in China, the Republic of Korea, Japan, and India. Atmos. Pollut. Res. 2021, 12, 316–329. [Google Scholar] [CrossRef]
Figure 1. Geographical locations of air pollution monitoring stations and Renhe Hospital in Shanghai, China. Different colors represent the administrative areas of Shanghai.
Atmosphere 16 00542 g001
Figure 2. The association between WBT/BC exposure and the risk of emergency department visits of CSIHD with the maximum lag of 28 days. (a), WBT. (b), BC. The colors of the curves in blue, red, and black indicate low WBT, high WBT, and BC exposure, respectively. The light red area represents the 95% confidence interval of the corresponding curve, and the histogram above the horizontal axis accounts for the range distribution of WBT (yellow) and BC (gray). The three gray dashed lines perpendicular to the horizontal axis represent the 2.5th, 97.5th percentile and reference values of WBT/BC (where the relative risk is equal to 0, i.e., 20.3 °C for WBT and 0 μg/m3 for BC), respectively.
Atmosphere 16 00542 g002
Figure 3. The lagged effects of low and high WBT on the risk of emergency department visits for CSIHD. The light red area indicates the 95% CI of the curve. (a) 2.5th (−0.43 °C) percentile WBT. (b) 97.5th (27.03 °C) percentile WBT.
Atmosphere 16 00542 g003
Figure 4. The lagged effects of low and high BC on the risk of emergency department visits for CSIHD. The light red area indicates the 95% CI of the curve. (a) 2.5th (1.05 μg/m3) percentile BC. (b) 97.5th (9.24 μg/m3) percentile BC.
Atmosphere 16 00542 g004
Figure 5. Fractions of emergency department visits for CSIHD attributed to various ranges of exposure. (a) WBT. (b) BC.
Atmosphere 16 00542 g005
Figure 6. Increased risk of short-term consecutive extreme low and high WBT exposure for the emergency department visits for CSIHD. (a) 2.5th (−0.43 °C) percentile WBT. (b) 97.5th (27.03 °C) percentile WBT.
Atmosphere 16 00542 g006
Figure 7. Increased risk of short-term consecutive extreme low and high BC exposure for the emergency department visits for CSIHD. (a) 2.5th (1.05 μg/m3) percentile BC. (b) 97.5th (9.24 μg/m3) percentile BC.
Atmosphere 16 00542 g007
Table 1. The daily statistics of the relevant variables involved in the study.
VariablesTime SpanMean ValueMinimum Value25th Percentile50th Percentile75th PercentileMaximum Value
Emergency department visits for CSIHD2013–20206.32146823
WBT (°C)2013–202014.39−8.927.4314.8721.4928.74
BC (μg/m3)2013–20203.470.41.872.824.432.69
O3 (μg/m3)2013–202093.116.1862.388.03117.13280
NO2 (μg/m3)2013–202041.445.2427.8637.7151.84140.08
SO2 (μg/m3)2013–202013.1447.410.5414.92106.9
CO (μg/m3)2013–20200.780.310.560.670.8619.92
Table 2. The lagged effects of low and high WBT/BC exposure at different lag days.
VariablesLag DaysRelative Risk and 95% Confidence Interval (CI)
Estimated ValueLower Bound of 95% CIUpper Bound of 95% CI
2.5th percentile WBT01.0420.9381.157
151.0681.0431.076
280.9870.9351.022
97.5th percentile WBT01.0571.0161.093
151.0321.0261.041
281.0181.0121.023
2.5th percentile BC01.0611.0211.085
151.0020.9231.097
281.0010.9641.192
97.5th percentile BC01.3261.0721.187
150.9860.9741.013
281.0220.9941.043
Disclaimer/Publisher’s Note: The statements, opinions and data contained in all publications are solely those of the individual author(s) and contributor(s) and not of MDPI and/or the editor(s). MDPI and/or the editor(s) disclaim responsibility for any injury to people or property resulting from any ideas, methods, instructions or products referred to in the content.

