Article

Spatiotemporal Analysis and Physicochemical Profiling of PM10 and PM2.5 in Slovenia

1
Department for Environment, Milan Vidmar Electric Power Research Institute, Hajdrihova 2, 1000 Ljubljana, Slovenia
2
Materials Technology and Forming, Faculty of Mechanical Engineering, University of Maribor, Smetanova 17, 2000 Maribor, Slovenia
3
Laboratory for Thermoenergetics, Faculty of Chemistry and Chemical Engineering, University of Maribor, Smetanova 17, 2000 Maribor, Slovenia
*
Author to whom correspondence should be addressed.
Atmosphere 2025, 16(5), 540; https://doi.org/10.3390/atmos16050540
Submission received: 31 March 2025 / Revised: 25 April 2025 / Accepted: 30 April 2025 / Published: 2 May 2025
(This article belongs to the Section Air Quality)

Abstract

:
Particulate matter (PM10 and PM2.5) is a key contributor to urban air pollution and poses significant health risks, particularly in densely populated areas. While conventional air quality monitoring focuses on particle size and concentration, this study emphasizes the importance of understanding chemical composition and emission sources for effective air pollution management. PM samples were collected between 2019 and 2022 at two locations in the Republic of Slovenia: a traffic-dominated urban site and an industrial area. Annual average PM10 concentrations ranged from 14 to 34 µg/m3, and those of PM2.5 ranged from 9 to 22 µg/m3. In addition to decreasing annual concentrations, a notable reduction in exceedance days was observed between 2019 and 2022, indicating the effectiveness of recent air quality improvement measures. Meteorological data and statistical models were used to assess environmental influences on PM variability. Advanced SEM-EDS analysis revealed substantial seasonal and spatial differences in particle composition, with key elements such as silicon (4.3–28.4%), carbon (13.1–61.7%), and trace amounts of lead and zinc varying across sites and particle types. Mineral dust (Si, Al, Ca, Fe, Mg), originating from soil resuspension, construction, and Saharan dust, was dominant. Combustion-related particles containing C, Pb, Zn, and Fe oxides were associated with vehicle emissions, industrial processes, and biomass burning. Secondary aerosols, such as sulphates and nitrates, showed seasonal trends, with higher concentrations in summer and winter, respectively. The results confirm that PM levels are driven by complex interactions between local emissions, weather conditions, and seasonal dynamics. The study supports targeted policy measures, particularly regarding residential heating and traffic emissions, to improve air quality.

1. Introduction

Air pollution is a global challenge and remains one of the most pressing environmental issues of our time, with widespread direct and indirect effects on nearly all nations [1,2]. Within the European Union (EU), it has long been a high-priority concern, prompting extensive efforts in monitoring, regulation, and mitigation. While certain member states have observed improvements due to the enforcement of updated environmental standards—such as the revised World Health Organization (WHO) Air Quality Guidelines (2021) [3] and the 2024 Air Quality Directive [4]—others continue to struggle with persistently high pollution levels [5].
Air pollution is primarily driven by emissions from industry [6], transport [7], agriculture [8], and domestic heating [9], releasing a complex mix of pollutants, including particulate matter (PM), nitrogen oxides (NOx), sulphur dioxide (SO2), and volatile organic compounds (VOCs). These substances contribute significantly to climate change acceleration, acidification of ecosystems, and biodiversity loss [10].
In addition to environmental degradation, air pollution poses serious risks to human health, being strongly linked to respiratory and cardiovascular diseases, elevated mortality, and weakened immune function [11,12]. Recent studies have established air pollution as one of the leading environmental determinants of premature death in the EU, with associations with lung cancer, stroke, and chronic obstructive pulmonary disease (COPD) [13]. Moreover, long-term exposure has been correlated with reproductive disorders, adverse birth outcomes, and increased healthcare burdens [14,15]. Despite localized improvements, persistent pollution continues to threaten public health and long-term demographic stability [16].
Among the major air pollutants, particulate matter (PM) stands out due to its complex composition, atmospheric persistence, and widespread impact. PM consists of a heterogeneous mixture of solid and liquid particles suspended in the air, originating from both natural and human sources, including organic compounds, mineral dust, metals, and other inorganic species [1,17]. The primary sources of PM include anthropogenic, geogenic, and biogenic activities, leading to a broad spectrum of emission profiles and atmospheric transformations [1,18]. PM is typically categorized by size—PM2.5 (particles < 2.5 μm) and PM10 (particles <10 μm)—both of which are widely monitored due to their health implications [19]. Growing awareness of PM’s contribution to climate and health hazards has intensified scientific and policy interest, reinforcing the call for more stringent regulations and evidence-based mitigation strategies [3,4,20].
As numerous studies have emphasized [18,21,22,23,24], characterizing the physical and chemical properties of PM is critical for identifying emission sources, understanding atmospheric behaviour, and elucidating toxicological mechanisms. A range of analytical techniques are applied, including Atomic Absorption Spectroscopy (AAS), Inductively Coupled Plasma Optical Emission Spectroscopy (ICP-OES) or Inductively Coupled Plasma Mass Spectroscopy (ICP-MS) for trace metal qualifications. Techniques such as Field Emission Scanning Electron Microscopy (FE-SEM) or Energy-Dispersive X-ray Spectroscopy (EDS) provide high-resolution imaging and elemental analysis, while X-ray Diffraction (XRD) is used to identify crystalline structures and mineral phases. Additionally, Fourier Transform Infrared Spectroscopy (FT-IR) spectroscopy enables detection of organic functional groups, contributing to insights into secondary organic aerosol formation. These methods collectively enhance our understanding of PM composition, enabling precise source attribution and comprehensive health risk assessment [18]. The resulting data form the foundation for evidence-based air quality policies and regulatory decisions.
Air quality in the Republic of Slovenia (RS) exhibits distinct regional and seasonal variability, with lower pollution levels generally observed in rural regions compared to urban industrial areas such as Ljubljana, Maribor, and Zasavje [25]. During winter, air quality deteriorates due to increased solid fuel combustion and unfavourable meteorological conditions, such as temperature inversions, which trap pollutants near the ground [19]. Key sources include vehicular traffic, residential heating, and industrial activities [5]. PM10 and PM2.5 remain the pollutants of greatest concern, due to their established links to health risks and premature mortality. Slovenia’s topography and climatic conditions further contribute to PM accumulation, especially in the heating season [5,26].
To contextualize Slovenia’s air quality challenges within a broader regional framework, recent studies from Central and Southeastern Europe offer valuable insight. In Slovenia, high levels of PM2.5 in rural areas due to residential wood burning have been documented, especially during winter, and are often underestimated in official monitoring [27]. In the Western Balkans, independent monitoring in cities such as Pljevlja (Montenegro) has revealed frequent exceedances of PM10 and PM2.5 limits [28]. Similarly, in Central Europe, studies in Krakow (Poland) have highlighted the strong influence of meteorological conditions on PM2.5 variability, further illustrating the complex interplay between climate, emissions, and geography in the region [29].
This study presents a detailed analysis of air quality in Slovenia over a four-year period (2019–2022), utilizing data from two strategically located monitoring stations with differing pollution profiles. Measurements include PM concentrations, meteorological data (temperature, humidity, wind speed, precipitation), and elemental composition analysis using Scanning Electron Microscopy coupled with Energy-Dispersive Spectroscopy (SEM-EDS). The results reveal significant variations in PM levels, sources, and behaviour under different environmental conditions. Heavy metal content was also examined to assess pollution sources and potential health risks. The findings contribute to a deeper understanding of air pollution dynamics in Slovenia, offering a scientific basis for targeted environmental interventions and regulatory planning. This study expands upon previous work [5,30,31] and aims to support national strategies for cleaner air and improved public health outcomes.

2. Materials and Methods
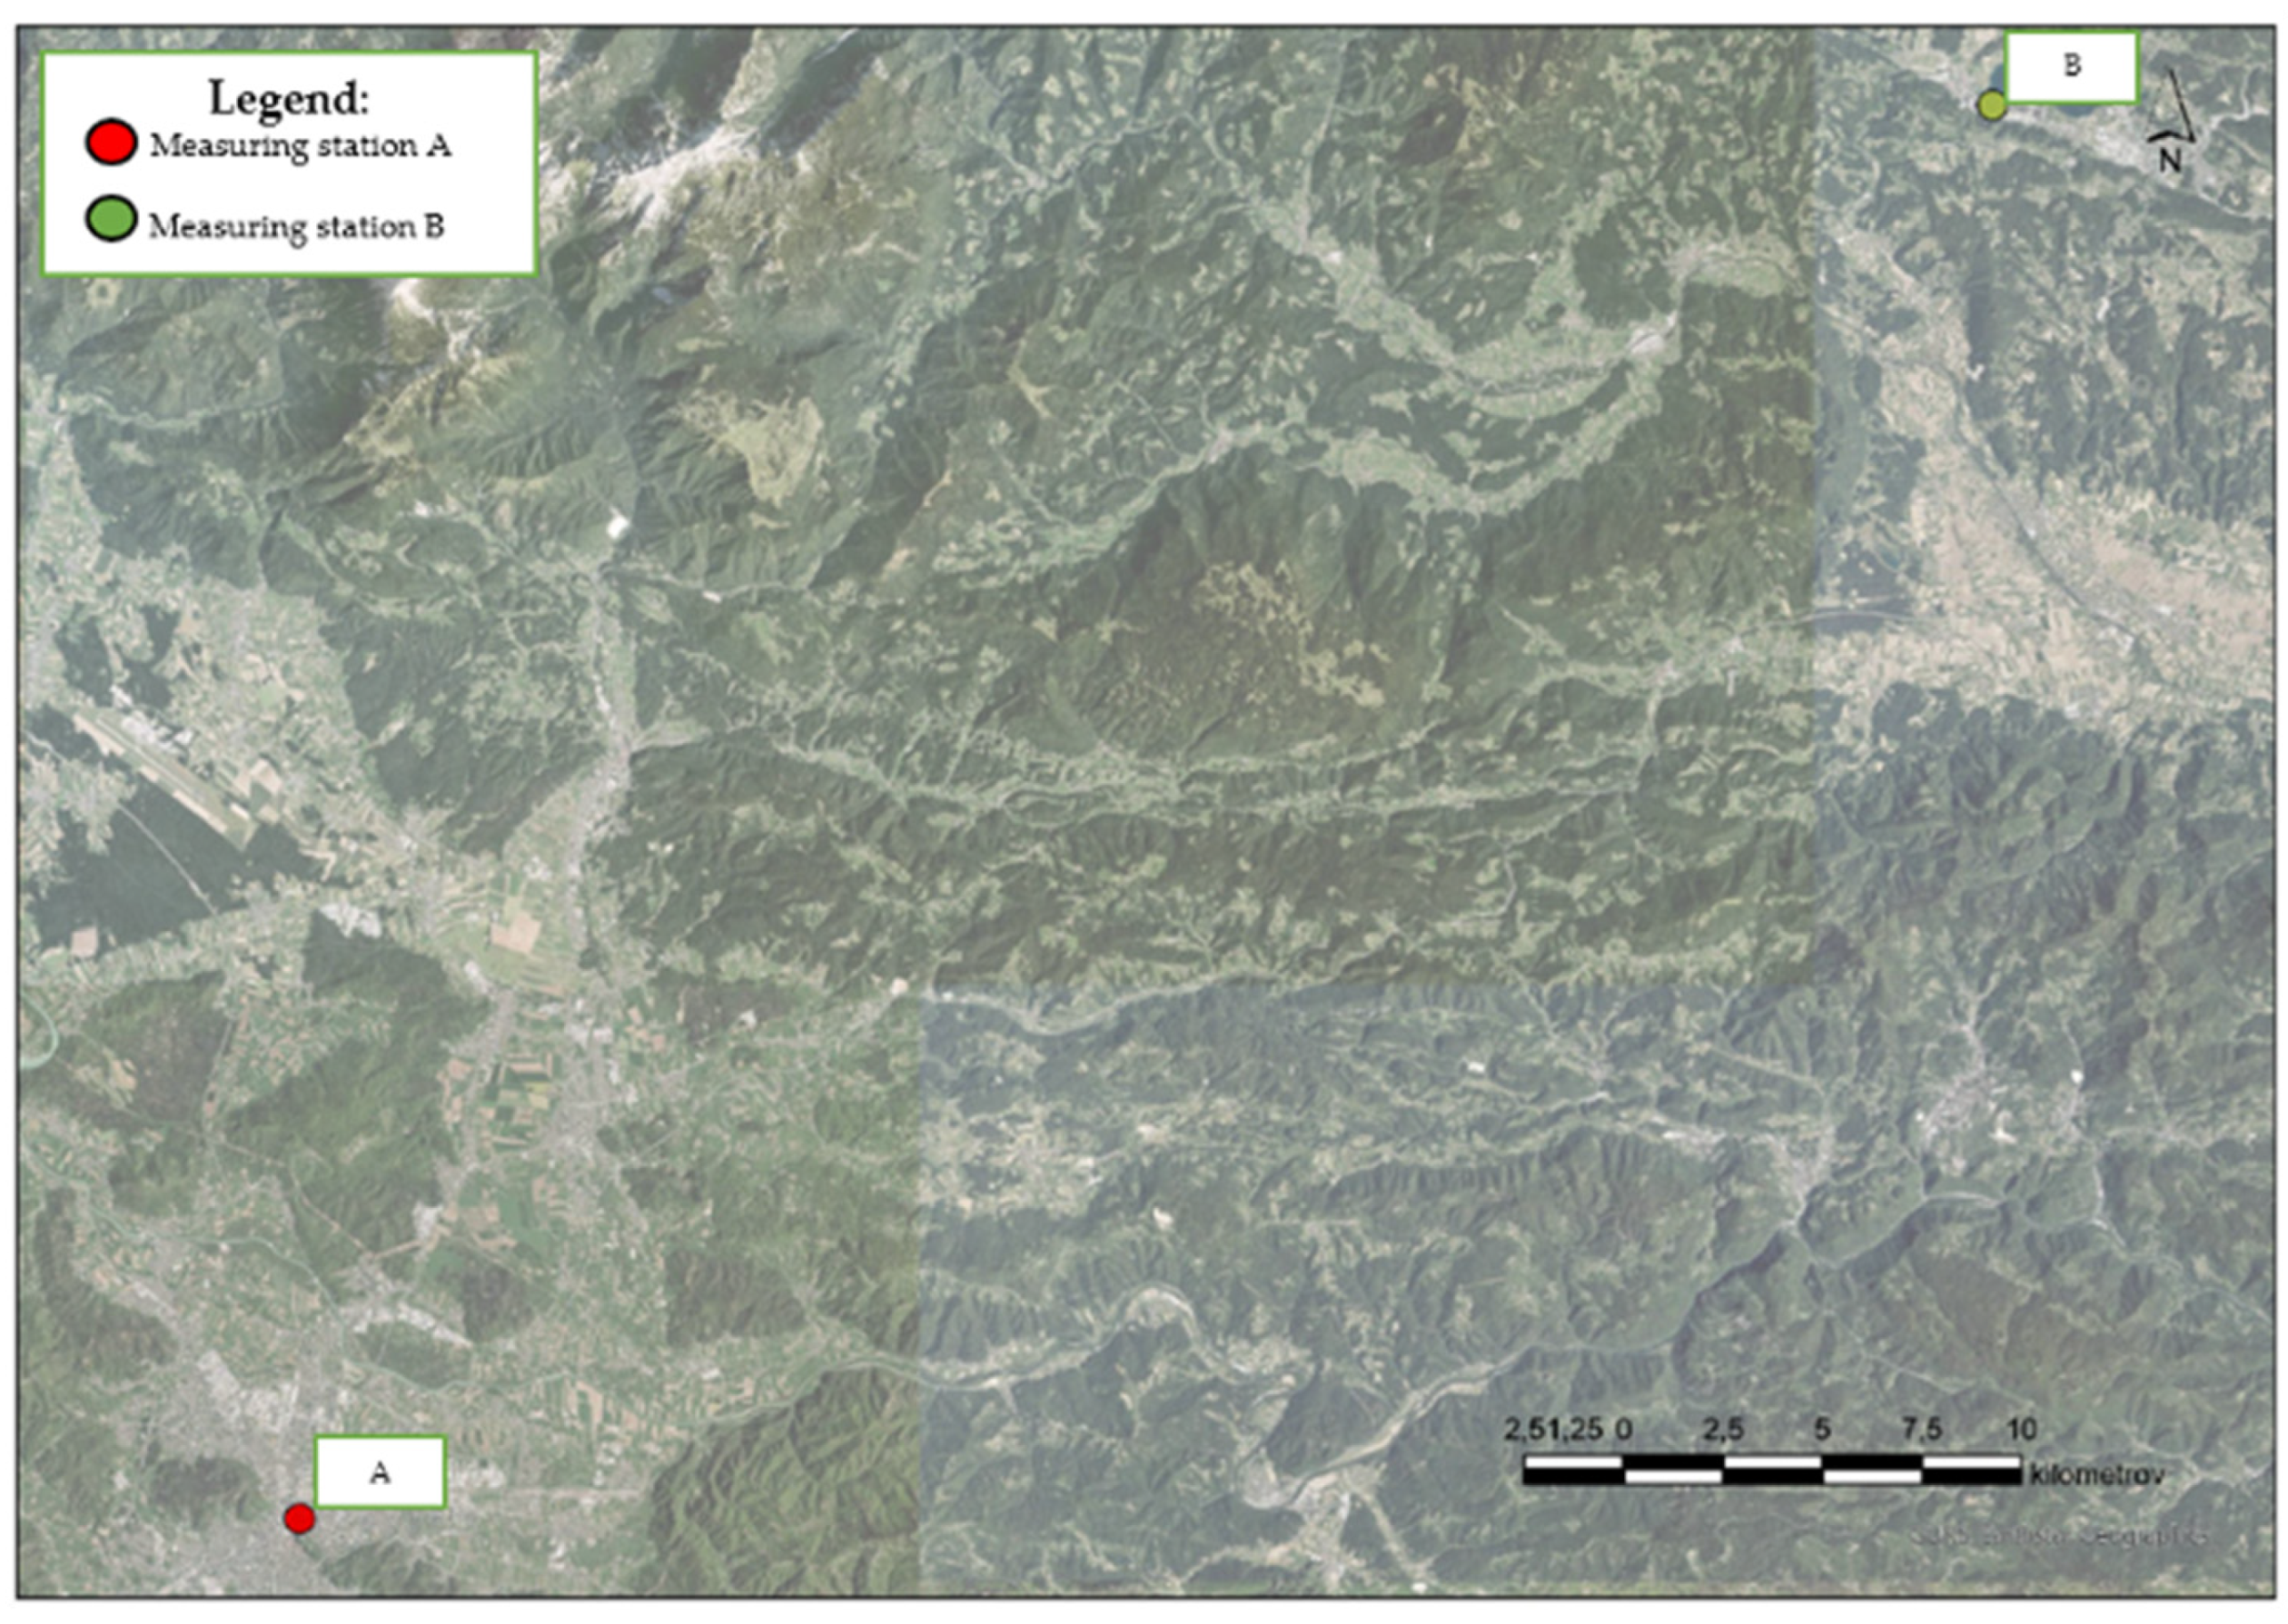
2.1. Study Area

Slovenia, situated in Central Europe, features a diverse climate shaped by its complex topography, with continental conditions dominating the interior and Mediterranean influences present along the coast [31]. In the sub-Mediterranean zone, the average annual temperature is around 12 °C, while in the lower-elevation areas of central Slovenia, it ranges between 8 °C and 1 °C [32]. Precipitation levels vary considerably across regions, from approximately 800 mm in the far northeast to over 3000 mm in the mountainous northwest [32]. Owing to its geographical position between the Alps and the Adriatic Sea, Slovenia experiences moderate levels of air pollution, with elevated concentrations typically observed in urban and industrial areas. For example, in 2023, the annual mean PM10 concentration was approximately 27 μg/m3 [19].

2.2. Site Selection

This study was conducted at two air quality monitoring sites located in distinct geographical and environmental regions of Slovenia (Figure 1). The selected stations represent contrasting pollution profiles, encompassing both urban traffic-related and industrial emission sources [19]. Both chosen stations (designated as site A and site B) are part of the national air quality monitoring network, ensuring high data reliability and comparability. Each station is equipped with air-conditioning and ventilation systems to maintain optimal and controlled sampling conditions. Air samplers were installed indoors, positioned at approximately 1 m above ground level [5]. The measurement campaign spanned four full years, from 1 January 2019 to 31 December 2022.
Site A is located in the centre of Ljubljana. This urban location is characterized by dense traffic and is surrounded by buildings, which can influence air circulation and pollutant dispersion. The city’s topography, situated in a Ljubljana basin, can lead to thermal inversions [33,34,35,36], especially during colder months, trapping pollutants near the ground level. Site B is situated close to the Šoštanj Thermal Power Plant. This industrial setting is influenced by emissions from the power plant, particularly under certain meteorological conditions. The surrounding area includes hilly terrain, which can also contribute to the occurrence of thermal inversions [33,34,35,36]. In terms of population, Ljubljana is the capital and largest city of Slovenia, with approximately 280,000 residents, while Šoštanj is a smaller town, with around 8000 inhabitants. This demographic difference, along with the distinct urban and industrial characteristics of the two sites, provides a diverse context for assessing air quality variations.
Table 1 presents a comprehensive overview of the station characteristics, including the elevation, geographic coordinates, site classification, and instrumentation used. The inclusion of spatially and functionally diverse locations enables a more representative assessment of air quality across Slovenia, considering variability in emission patterns, meteorological conditions, and socio-economic parameters, such as industrial intensity, population density, and traffic volume.

2.3. PM Sampling

Real-time hourly measurements of PM10 and PM2.5 concentrations were continuously recorded by the Environment Department of the Milan Vidmar Electric Power Research Institute (EIMV) and the Slovenian Environment Agency (ARSO). The dataset is publicly available at https://www.arso.gov.si/zrak/kakovost%20zraka/podatki/ (accessed on 11 March 2025).
As described in previous work [5,37], PM concentrations were determined using an automatic gravimetric analyzer (Sven Leckel, model SEQ47/50, Berlin, Germany). For sample collection, Whatman™ glass fibre filters (47 mm in diameter, porosities of 8.0 µm and 0.4 µm, Burlington, MA, USA) were utilized. Prior to deployment, filters were pre-conditioned by thermal treatment at 850 °C for 3 h to eliminate potential residues. Both before and after sample collection, filters were equilibrated for at least 48 h in a controlled environment with a relative humidity of 50 ± 5% and a temperature of 25 ± 2 °C, before being weighed using a Mettler Toledo analytical balance (model AG 245, resolution 0.01 mg, Columbus, OH, USA). Particle mass concentrations were then calculated and expressed in µg/m3.
Sampling adhered to rigorous quality control protocols to minimize contamination, and was conducted in line with the SIST EN 12341:2014 standard gravimetric method [5,36].
Daily averages of PM10 and PM2.5 were computed only if at least 16 h of valid data were available, following established protocols [5,37]. The data were further aggregated into daily, monthly, and annual means to facilitate temporal trend analyses.
Simultaneously, daily meteorological data were obtained from the EIMV and ARSO stations, including the average temperature (Tp), relative humidity (RHp), precipitation (Pp), and wind speed (WSp). These parameters were integrated into the analysis to evaluate their influence on pollutant dispersion and accumulation. The methodological approach is consistent with prior research investigating atmospheric dynamics and air pollution interactions in Slovenia [5,36].

2.4. SEM-EDS Analysis

To investigate the elemental composition and morphological features of fine particulate matter, Scanning Electron Microscopy (SEM; Quanta 200 3D model, Hillsboro, OR, USA) was combined with Energy-Dispersive X-ray Spectroscopy (EDS). This integrated technique enabled high-resolution imaging and qualitative elemental analysis at the level of individual particles. A total of four samples, two PM10 and two PM2.5 samples, collected at both monitoring sites in August 2023, were selected for analysis. Particles were deposited onto plasma-treated Ni-Ti alloy substrates to enhance surface adhesion and reduce analytical interference during SEM-EDS examination. Imaging was performed at 100× magnification, allowing for a representative overview of both chemical composition and particle morphology across the observed size range. Elemental identification was conducted using electron beam scanning at an accelerating voltage of 20 kV, providing reliable detection of major and trace elements within the samples.
To quantify elemental concentrations, the relative weight percentages (normalized to 100%) were computed for the following elements: carbon (C), oxygen (O), sodium (Na), aluminum (Al), silicon (Si), potassium (K), sodium (S), chlorine (Cl), zinc (Zn), magnesium (Mg), iron (Fe), and copper (Cu). This analysis provided critical insights into the potential sources and atmospheric transformation processes influencing airborne particulate matter composition.

2.5. Statistical Analysis

To explore the relationship between PM10 and PM2.5 concentrations, Pearson correlation analysis was performed, accounting for differences across sampling sites and study years. This statistical method allowed for the assessment of linear associations between the two particulate matter fractions, offering insight into their co-variability and possible shared emission sources. A significance threshold of p < 0.05 was applied throughout the analysis, indicating that observed correlations were unlikely to occur by random chance. Correlation strength was interpreted using conventional criteria, with r-values above 0.7 considered strong, those between 0.5 and 0.7 considered moderate, and those below 0.5 considered weak.

3. Results and Discussion

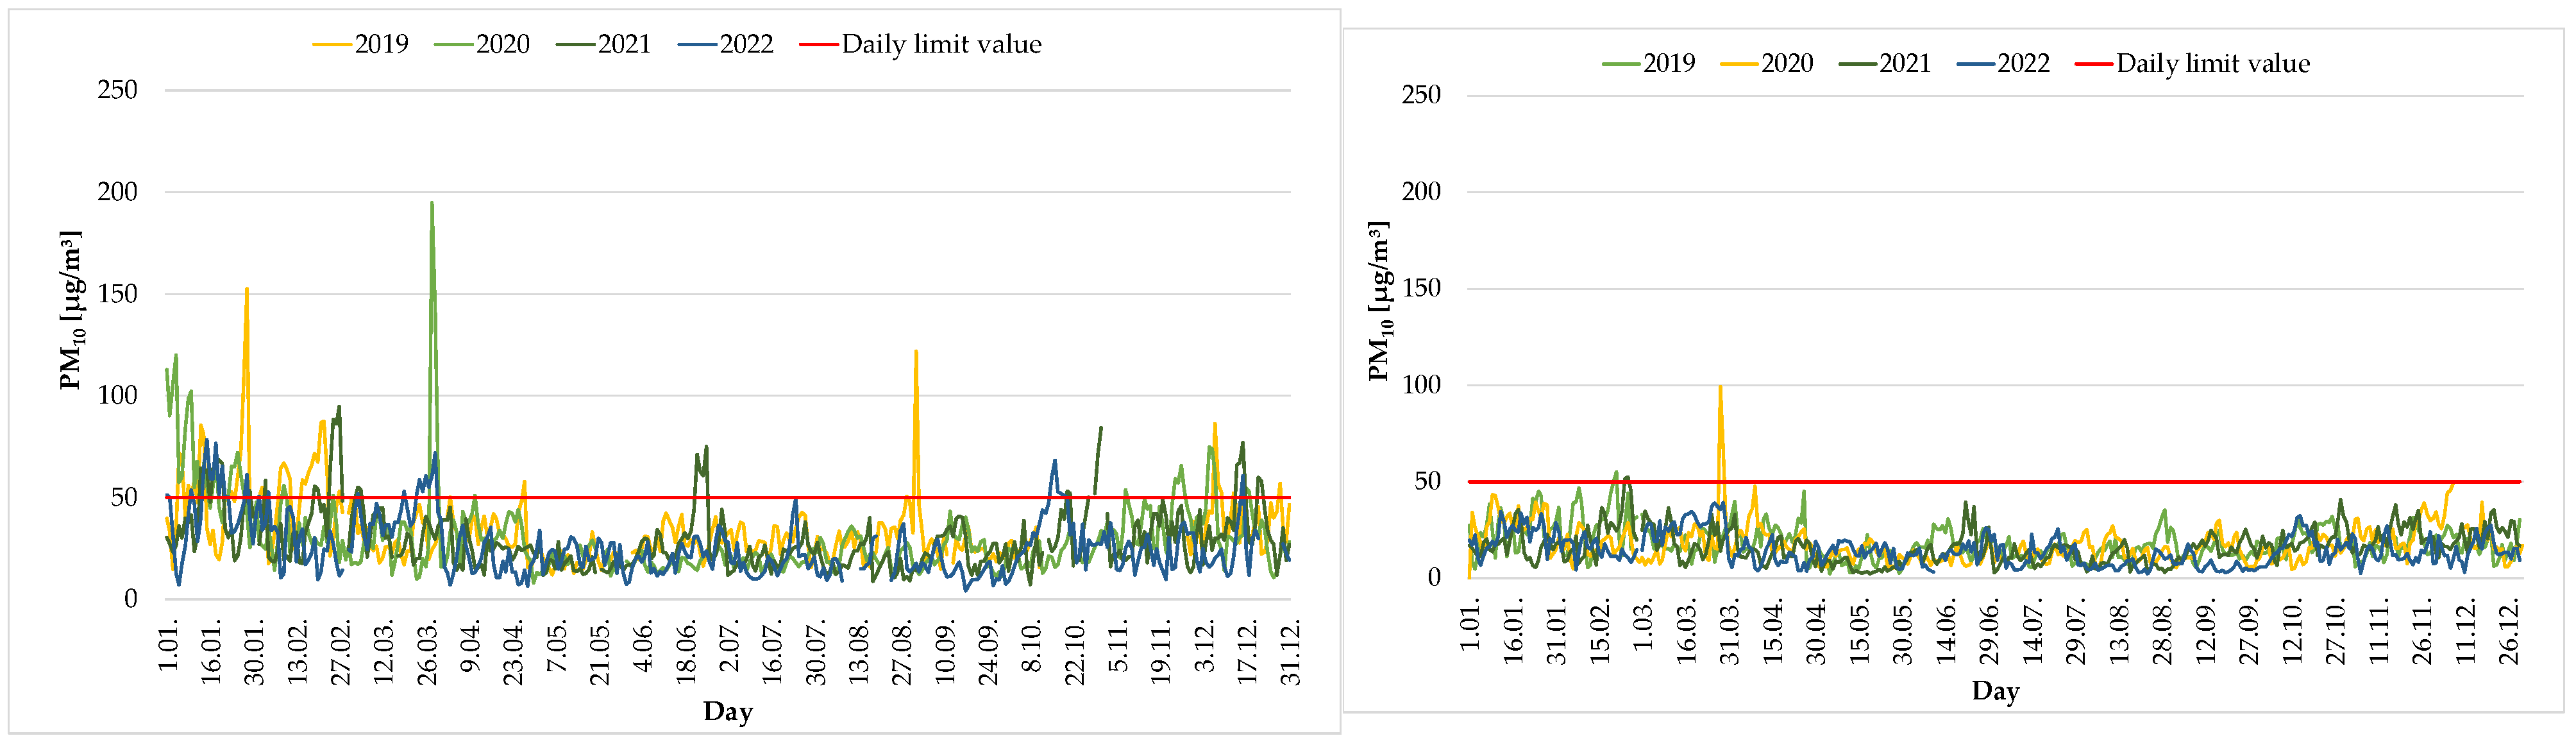
3.1. PM10 Concentrations Through the Years

Figure 2 illustrates the daily average concentrations of PM10 recorded at the traffic and industrial monitoring stations (sites A and B) throughout the entire study period (2019–2022), while Figure 3 depicts the corresponding mean, minimum, and maximum values, along with their standard deviations. The temporal pattern of PM10 concentrations revealed substantial variability, with pronounced seasonal fluctuations and frequent exceedances of the 50 µg/m3 daily limit. The highest single-day concentration, 195 µg/m3, was observed at site A on 28 March 2020.
At site A, the annual number of exceedance days showed a decreasing trend, with 39 days in 2019, followed by 37 in 2020, 31 in 2021, and 30 in 2022. Despite the mobility restrictions introduced during the COVID-19 pandemic in 2020, a marked reduction in PM10 levels was not observed. This outcome is likely due to the continued dominance of residential wood burning as a major emission source, particularly in urban environments. While traffic-related emissions declined, overall PM10 concentrations remained relatively stable, largely influenced by meteorological conditions such as temperature inversions, wind speed, and precipitation [33,34,35,36]. At site B, the highest daily PM10 concentration was recorded on 27 March 2020—just one day before the peak observed at site A—indicating a strong influence of regional meteorological conditions in both locations. However, the maximum value at site B was approximately 100 µg/m3 lower, likely reflecting its lower population density and fewer emissions from residential wood combustion in the surrounding area. The lowest daily PM10 concentration at site B occurred on May 19, 2021, when moderate temperatures and steady precipitation helped to suppress particle accumulation, keeping levels below 10 µg/m3 throughout the day [33,34,35,36]. Despite its proximity to the Šoštanj Thermal Power Plant, site B consistently exhibited lower PM10 concentrations compared to site A. This contrast is likely due to elevated urban emissions at site A, which is located at a busy city intersection with high traffic volumes and widespread use of solid fuels for residential heating. Additionally, Ljubljana’s topographic basin shape increases the frequency of temperature inversions, which limit vertical mixing and prolong atmospheric residence times of PM10 [33,34,35,36]. Exceedances of the daily PM10 limit (50 µg/m3) were most common at site A during winter, with 21 exceedance days in January, 2 in February, 3 in March, 1 in April, and 5 in both November and December. In contrast, site B recorded significantly fewer exceedances, with one day in February, three in March, one in April, and five in both November and December [33,34,35,36].
Monthly PM10 concentrations displayed a pronounced seasonal pattern, with elevated levels during winter and markedly lower values in summer. The highest concentrations typically occurred in January and December, coinciding with increased solid fuel combustion and unfavourable atmospheric conditions for pollutant dispersion. At site A, monthly PM10 values ranged from 20.00 ± 0.60 µg/m3 to 64.00 ± 1.92 µg/m3, while at Site B, concentrations were substantially lower, varying between 1.00 ± 0.33 µg/m3 and 29.00 ± 0.87 µg/m3. Interestingly, the highest quartile averages at site A were recorded during the transitional spring and summer periods (April–June and July–September), reaching up to 50.00 ± 1.00 µg/m3. In contrast, site B exhibited peak quartile values in the colder January–March period, underscoring the dominant influence of seasonal heating and local meteorological factors on site-specific PM dynamics [33,34,35,36]. The lowest annual PM10 concentration at site A was recorded in 2022, with a mean value of 25.91 µg/m3, representing a modest decrease compared to 29.06 µg/m3 in 2021. At site B, a consistent downward trend was observed across the four-year period, with annual averages of 18 µg/m3 in both 2019 and 2020, 16 µg/m3 in 2021, and a minimum value of 15 µg/m3 in 2022 [33,34,35,36].
Meteorological factors played a key role in modulating PM10 concentration variability. Spring 2020 was marked by above-average temperatures and a 50% decrease in precipitation compared to historical norms, with only one-third of the amount of rainfall recorded in the same period of 2019 [33,34,35,36]. This significant reduction in wet deposition likely contributed to elevated PM10 levels, as airborne particles were not efficiently removed from the atmosphere, despite a concurrent decline in traffic-related emissions. The highest PM10 values were typically observed during winter months, largely due to weak wind conditions, frequent temperature inversions [33,34,35,36], and increased emissions from residential heating—particularly the combustion of solid fuels such as wood and coal. Furthermore, intensified transport activity in densely populated areas further exacerbated PM10 pollution. In addition to local sources, episodic atmospheric events also caused sharp increases in PM10 concentrations. These included Saharan dust intrusions in spring, forest fire smoke during summer, and elevated pollen levels during the blooming season.
For broader spatial context, PM10 concentrations were compared with measurements from Zagreb and Luxembourg, both located at comparable altitudes [38]. Daily levels in Zagreb averaged around 50 µg/m3, likely reflecting the impact of higher traffic volumes and greater population density [38]. In contrast, Luxembourg reported an annual mean PM10 concentration of 22 µg/m3 in 2021, a value comparable to that observed at site A [38]. However, Luxembourg’s population is approximately half that of the area surrounding site A, and emissions from residential solid fuel combustion are notably lower. Additionally, Luxembourg’s hilly terrain promotes more effective pollutant dispersion, reducing PM10 accumulation compared to densely urbanized, low-lying areas, such as those around site A [38].

3.2. PM2.5 Concentrations Through the Years

Figure 4 displays the daily average PM2.5 concentrations at the traffic and industrial monitoring sites (A and B) over the full study period, while Figure 5 presents the corresponding mean, minimum, and maximum values, along with their standard deviations. At site A, a clear seasonal pattern was observed, with elevated concentrations during colder months, primarily attributed to emissions from residential heating systems. The highest recorded PM2.5 concentration occurred on 27 January 2019, reaching 62.42 µg/m3, which exceeded the peak value from 17 January 2022 by nearly 60 µg/m3. January consistently registered the highest monthly concentrations in 2019 and 2021; however, an unexpected peak was noted in April 2020, potentially due to long-range atmospheric transport of fine particulates [33,34,35,36]. Throughout the study period, maximum daily values frequently occurred in late January, coinciding with the coldest days and increased heating demand. Conversely, lower concentrations were typically measured between April and July, when warmer temperatures and reduced combustion-related emissions improved air quality [33,34,35,36]. At site B, PM2.5 concentrations also exhibited a seasonal increase during colder months, similarly to at site A. However, the interannual variability at site B was less pronounced, indicating more stable pollution patterns over the years. Although minimum daily values were comparable at both sites, peak PM2.5 concentrations at site A were up to 100 µg/m3 higher, emphasizing the stronger influence of urban emission sources, particularly from traffic and domestic heating. Daily PM2.5 levels varied significantly across years and locations. In 2020, the average daily concentration at site A was 18.35 ± 0.55 µg/m3, whereas no data were available for site B, due to instrument malfunction. Over the entire study period, a general downward trend in PM2.5 concentrations at both sites was observed, with the most substantial reduction occurring in 2021 [33,34,35,36]. This improvement is likely associated with the adoption of the revised WHO Air Quality Guidelines [39] in 2021, which raised public awareness and triggered the implementation of stricter national air quality policies. In response, governments introduced tighter regulatory measures, including the promotion of modern heating systems, incentives for cleaner fuel usage, and the deployment of emission-reducing technologies such as particulate filters for wood combustion appliances. These interventions contributed to a gradual improvement in air quality, particularly in urban areas, by lowering ambient fine particulate concentrations. In 2020, the weekly average PM2.5 concentration at site A was 13.96 ± 0.41 µg/m3, further supporting the observed trend of seasonal and regulatory-driven fluctuations. Monthly averages showed distinct seasonal variation, with elevated levels in winter and lower values during summer months. At site A, monthly PM2.5 concentrations ranged from 20.00 ± 0.60 µg/m3 to 43.00 ± 1.29 µg/m3, whereas at site B, values fluctuated between 1.00 ± 0.33 µg/m3 and 29.00 ± 0.87 µg/m3 [33,34,35,36].
For comparative purposes, Zagreb—located at a similar elevation to site A—displayed comparable PM2.5 concentrations. Despite its higher population density, Zagreb’s flat topography limits the occurrence of temperature inversions [38], which may help to explain the similarity in pollution levels. In contrast, Luxembourg—also situated at a similar altitude—reported significantly lower PM2.5 values, averaging approximately 9 µg/m3. Its hilly terrain enhances air circulation, while a smaller population base and reduced residential emissions contribute to better overall air quality. Although all three cities experience a moderate continental climate, these comparisons underscore the influence of topography and population density as key drivers of PM2.5 variability [38].

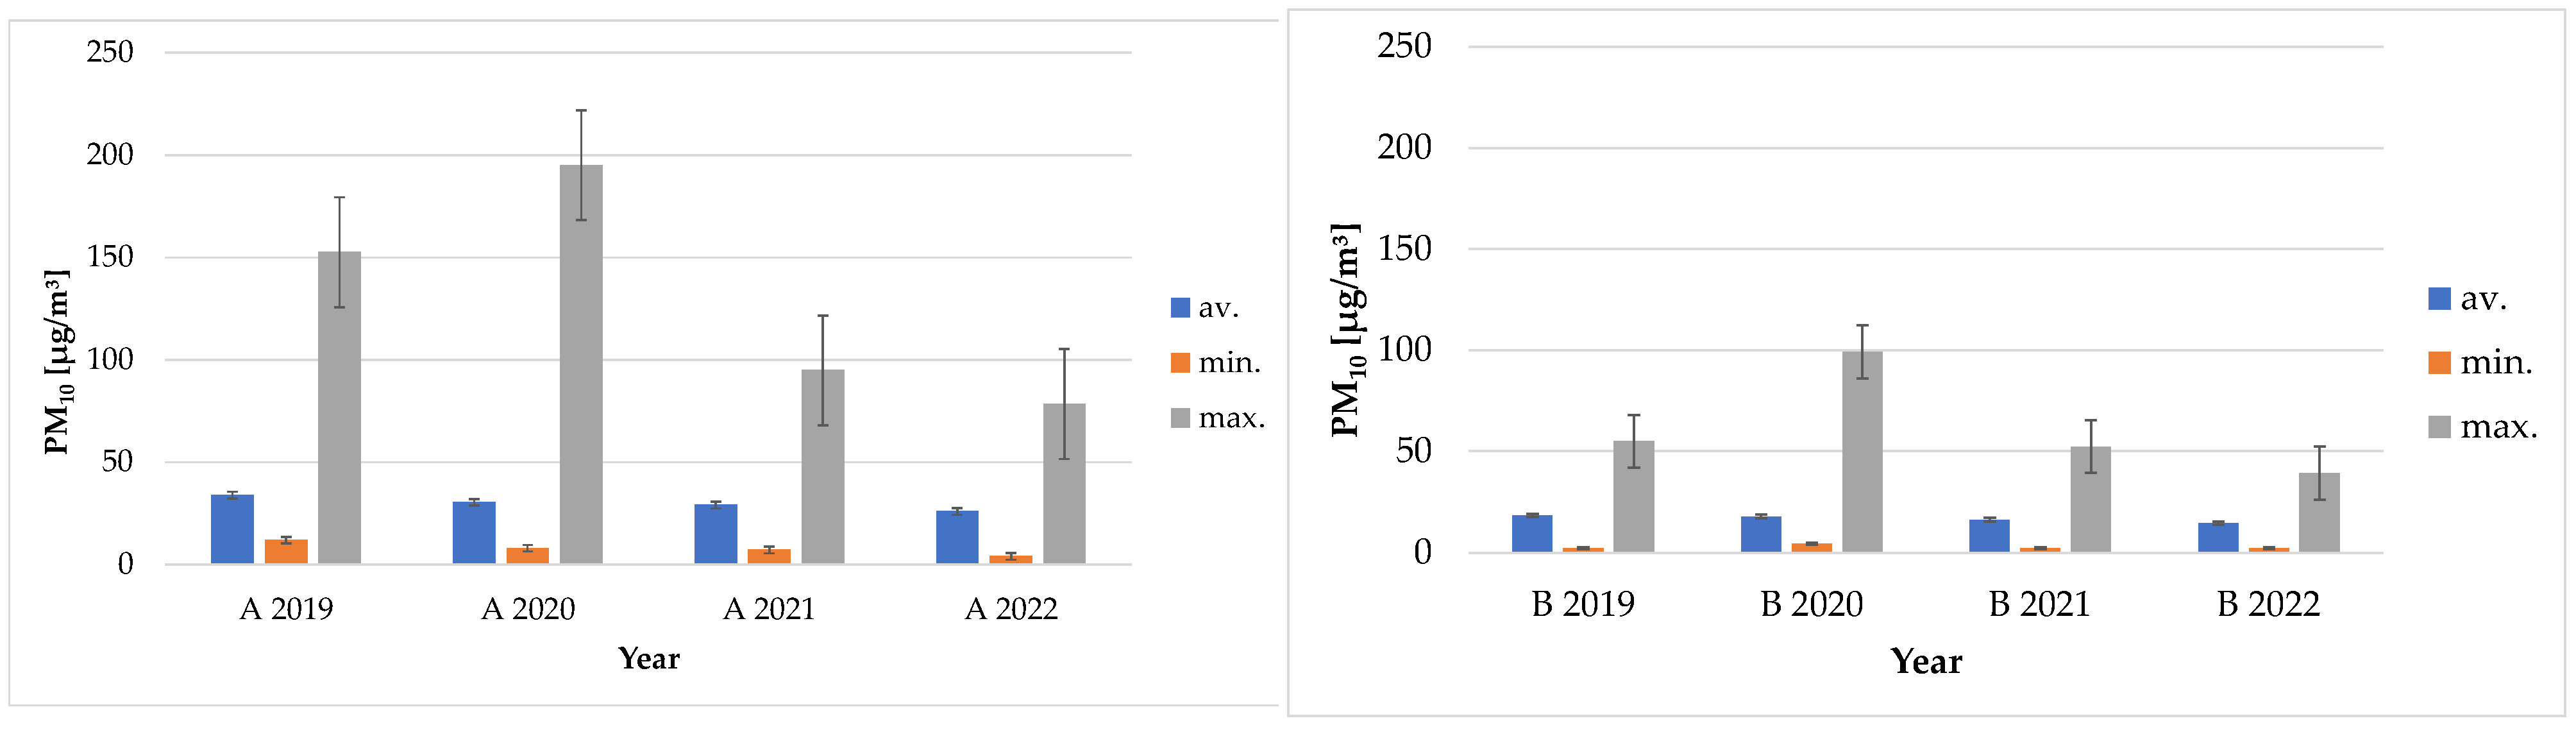
3.3. Analysis of Annual PM10 and PM2.5 Concentrations at Monitoring Station A and Monitoring Station B

A consistent downward trend in annual average PM10 concentrations was observed at both monitoring stations between 2019 and 2022. At site A, the highest value was measured in 2019 (~34 µg/m3), followed by gradual declines to 30 µg/m3 in 2020, 28 µg/m3 in 2021, and 26 µg/m3 in 2022. Similarly, site B reported ~20 µg/m3 in 2019, which decreased to 17 µg/m3 in 2020, 18 µg/m3 in 2021, and reached the lowest level of 14 µg/m3 in 2022. Although site A consistently exhibited higher PM10 levels, reflecting greater exposure in traffic-dominated urban areas, interannual variability was evident. Notably, site B experienced a slight increase in 2020, suggesting localized changes in emission patterns. The overall decrease may be attributed to stricter national policies, following the adoption of the revised WHO Air Quality Guidelines in 2021 [39]. In urban settings like site A, additional factors, such as increased promotion of public transport, cycling infrastructure, and rising environmental awareness, may also have contributed.
For PM2.5, the highest annual average at site A was recorded in 2019 (~22 µg/m3), declining to 20 µg/m3 in 2020, and further declining to 15 µg/m3 in 2021. However, 2022 saw a reversal, with concentrations rising to 18 µg/m3. This modest increase may be attributed to a combination of factors, including delayed policy impacts, unfavourable meteorological conditions—such as more frequent temperature inversions—and increased use of biomass for residential heating during the European energy crisis. At site B, levels began at 14 µg/m3 in 2019, increased slightly in 2020 (15 µg/m3), then declined to 12 µg/m3 in 2021, and reached a minimum of 8 µg/m3 in 2022. Overall, PM2.5 concentrations followed a decreasing trend, with the exception of a modest uptick at site A in 2022. The smaller disparity between the two stations for PM2.5 suggests that fine particles are more evenly distributed across urban and industrial areas, unlike PM10, which is more sensitive to local emission sources. In 2021, annual PM2.5 averages at both sites were nearly identical, indicating similar emission profiles and atmospheric dynamics.

3.4. Correlations Between PM10 and PM2.5: Seasonal Variability and Influencing Factors

The correlation between PM10 and PM2.5 at monitoring stations A and B across the four-year period is summarized in Table 2. At site A, the correlation coefficients were r = 0.95 (p = 0.045) in 2019, r = 0.99 (p = 0.020) in 2020, r = 0.98 (p = 0.010) in 2021, and r = 0.95 (p = 0.030) in 2022, indicating a consistently strong linear relationship between the two particulate fractions. The consistently high correlation (r > 0.95) suggests that PM10 and PM2.5 share similar emission sources and atmospheric behaviour, likely governed by urban combustion activities and meteorological influences. The statistical significance of these relationships (p < 0.05) confirms that the observed associations are unlikely due to random variation. At site B, the correlation coefficients were r = 0.92 (p = 0.070) in 2019, r = 0.87 (p = 0.040) in 2020, r = 1.00 (p = 0.000) in 2021, and r = 0.92 (p = 0.020) in 2022. Although slightly lower than at site A, these values still indicate strong correlations (r > 0.87), with statistical significance achieved in most years. The perfect correlation observed in 2021 (r = 1.00, p = 0.000) points to an exceptionally uniform emission regime, likely driven by stable heating practices and consistent meteorological conditions. In contrast, the weaker statistical significance in 2019 (p = 0.070) may reflect greater variability in PM10 sources, such as the increased resuspension of coarse particles. These results reinforce the understanding that both PM10 and PM2.5 in urban and industrial environments are shaped by common processes, including biomass burning, vehicular traffic, industrial emissions, and secondary aerosol formation. The consistently strong correlations between the two particle size fractions highlight the need for integrated air pollution control strategies, with a particular focus on PM2.5, which poses greater health risks, due to its ability to penetrate deep into the respiratory tract.
Moreover, these findings align with trends identified in our previous research [5,30,31], thereby confirming the reliability of long-term monitoring and the necessity of sustained, multi-pollutant management approaches.

3.5. Meteorological Conditions Through the Years

Meteorological conditions significantly influenced PM concentration variability at both sites. Table 3 and Table 4 show meteorological parameters obtained between studied years. At site A, the average annual temperatures ranged between 11.5 °C (2021) and 12.9 °C (2022), while the relative humidity gradually declined from 74% in 2019 to 69% in 2022. Precipitation peaked in 2021, at 1442.3 mm, with similar totals in 2019 (1378.9 mm), 2020 (1262.2 mm), and 2022 (1264.3 mm). Wind speed remained constant at 1.3 m/s throughout. Recorded temperature extremes ranged from −8.5 °C to 35.2 °C, reflecting pronounced seasonal contrasts [32]. At site B, the temperature trends were comparable, ranging from 8.9 °C (2021) to 10.2 °C (2019). The relative humidity stayed at 77% until 2021, slightly dropping to 75% in 2022. The annual precipitation was stable (~1700 mm), except for a small dip to 1600 mm in 2021. Unlike at site A, the wind speeds at site B varied, from a high of 1.227 m/s (2019) to a low of 0.836 m/s (2022) [32]. Extreme temperatures ranged between −11.3 °C and 33.0 °C at site B, again indicating high seasonal variability. The prevailing wind directions differed between the two sites: northeastern winds were dominant at site A, while southeasterly winds prevailed at site B [29]. These site-specific meteorological differences, shaped by local climate and topography, play a key role in pollutant dispersion, accumulation, and overall PM behaviour.

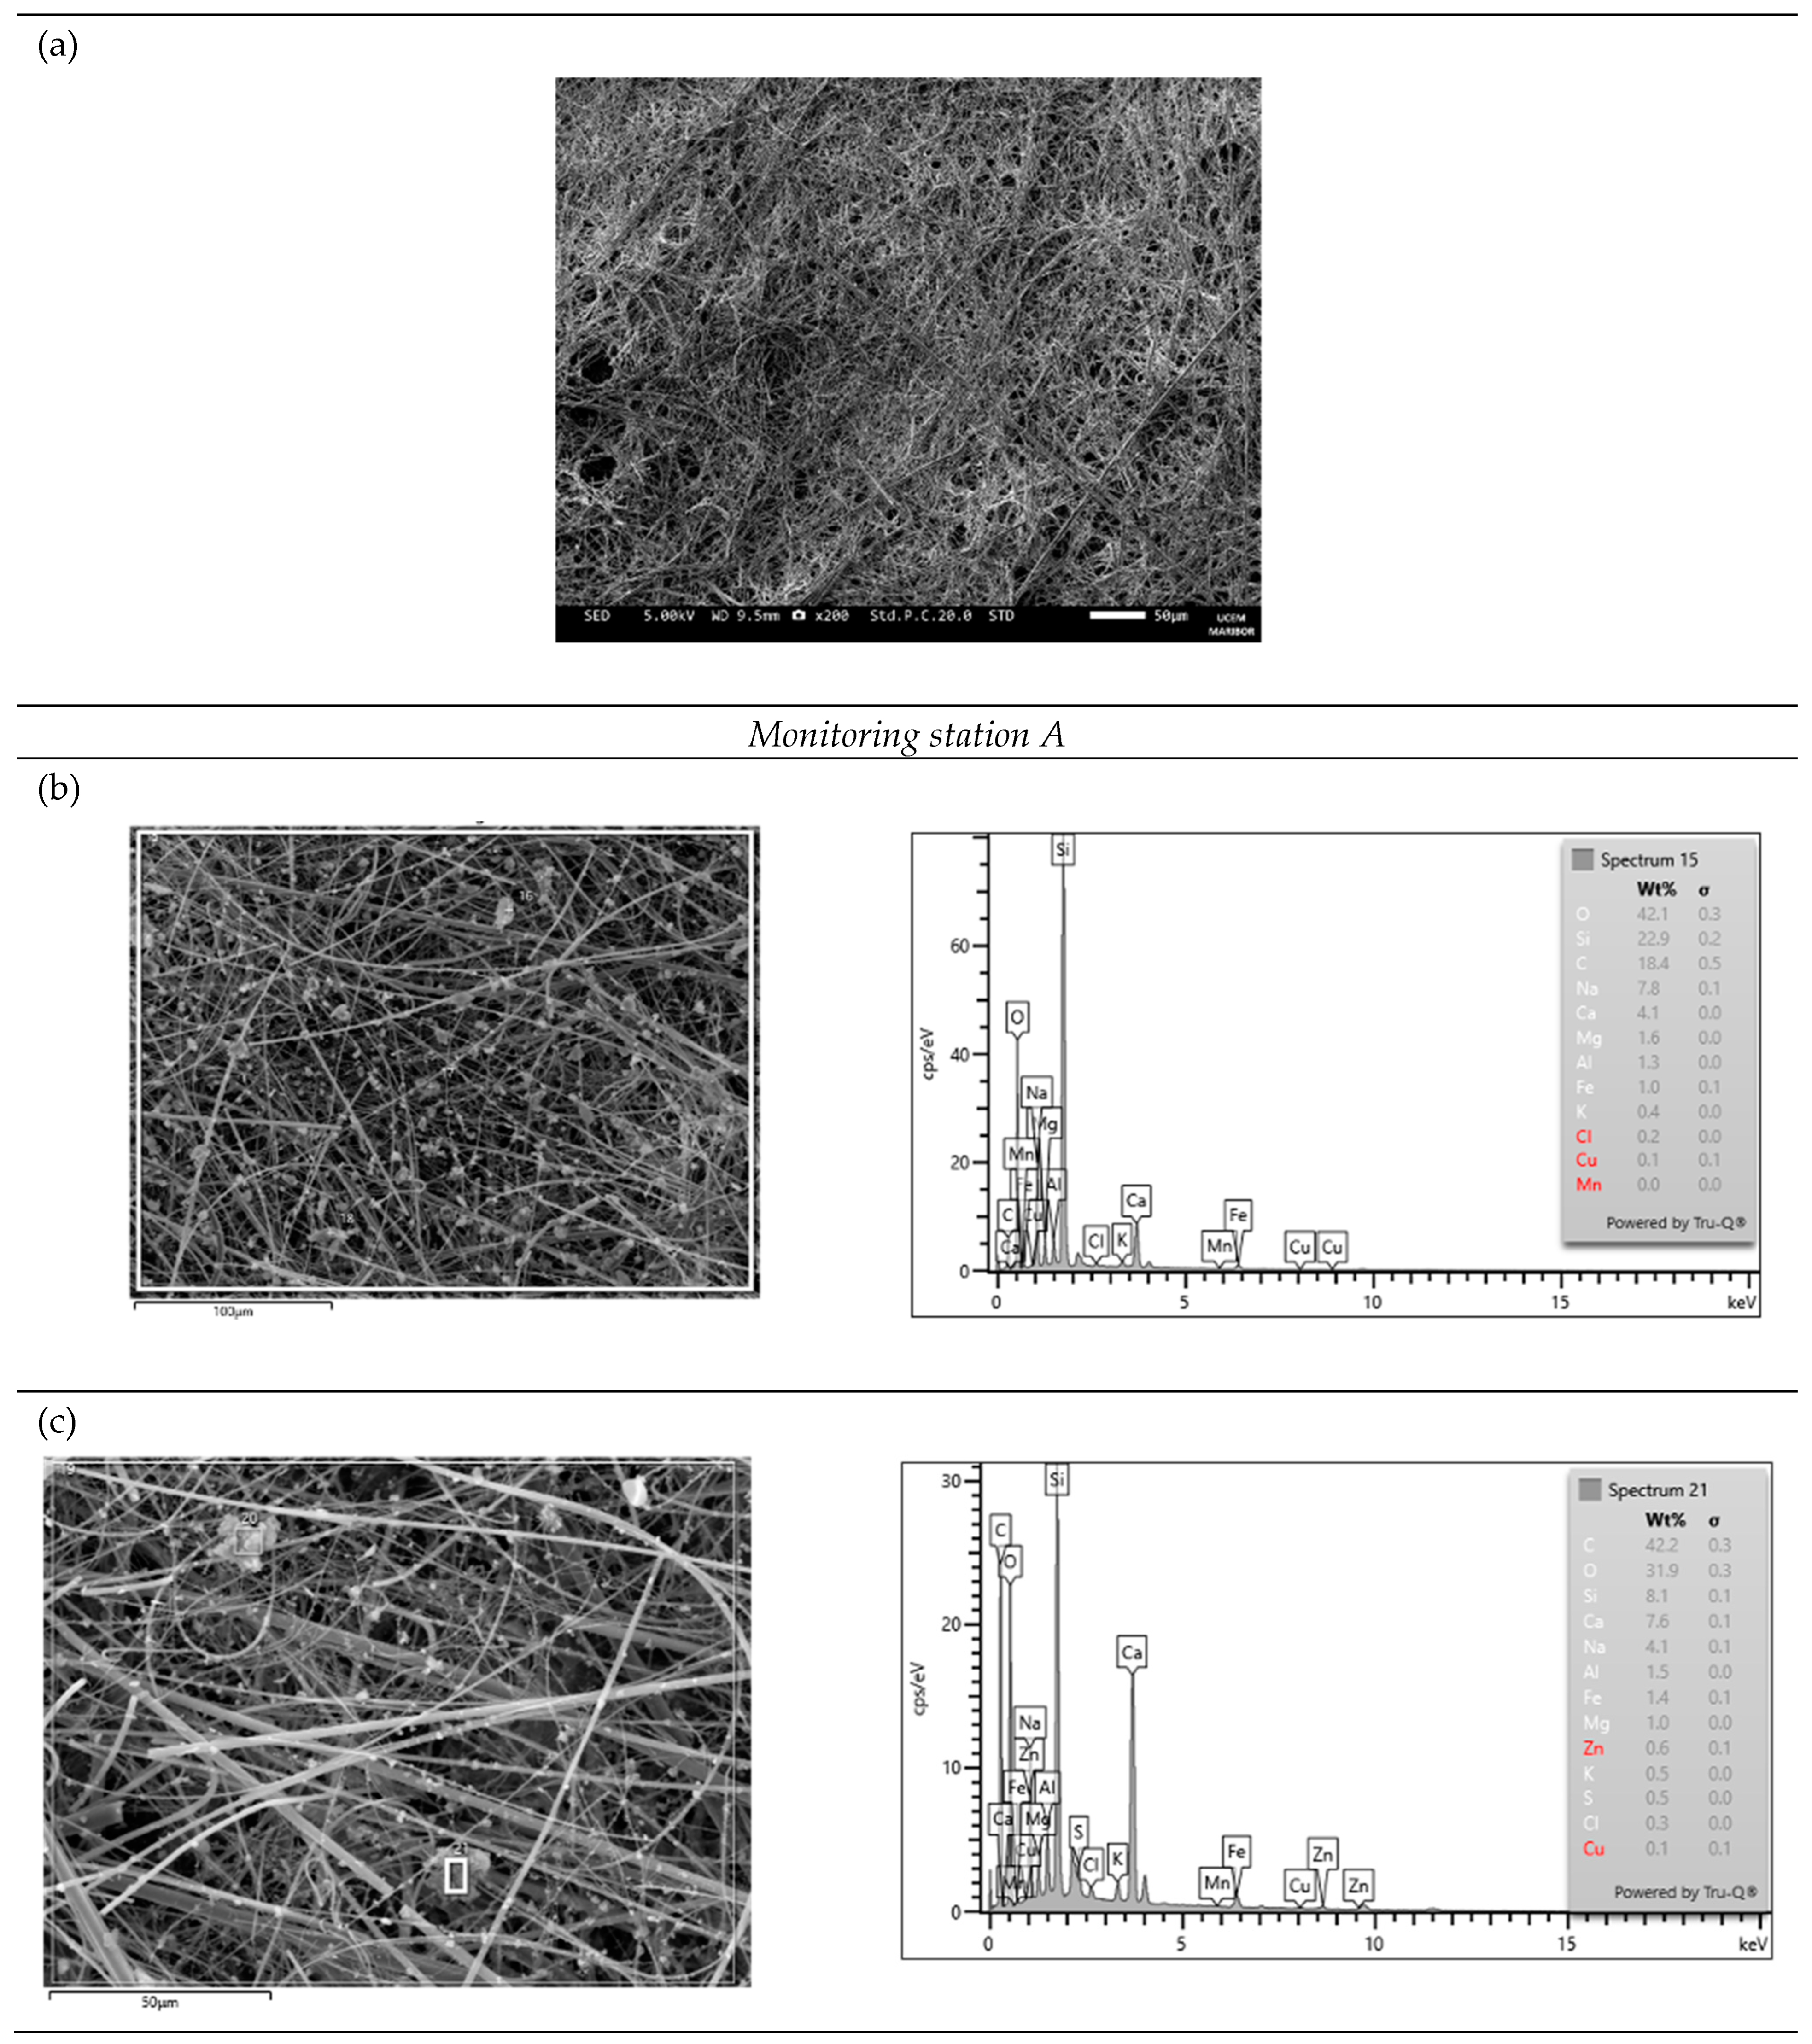
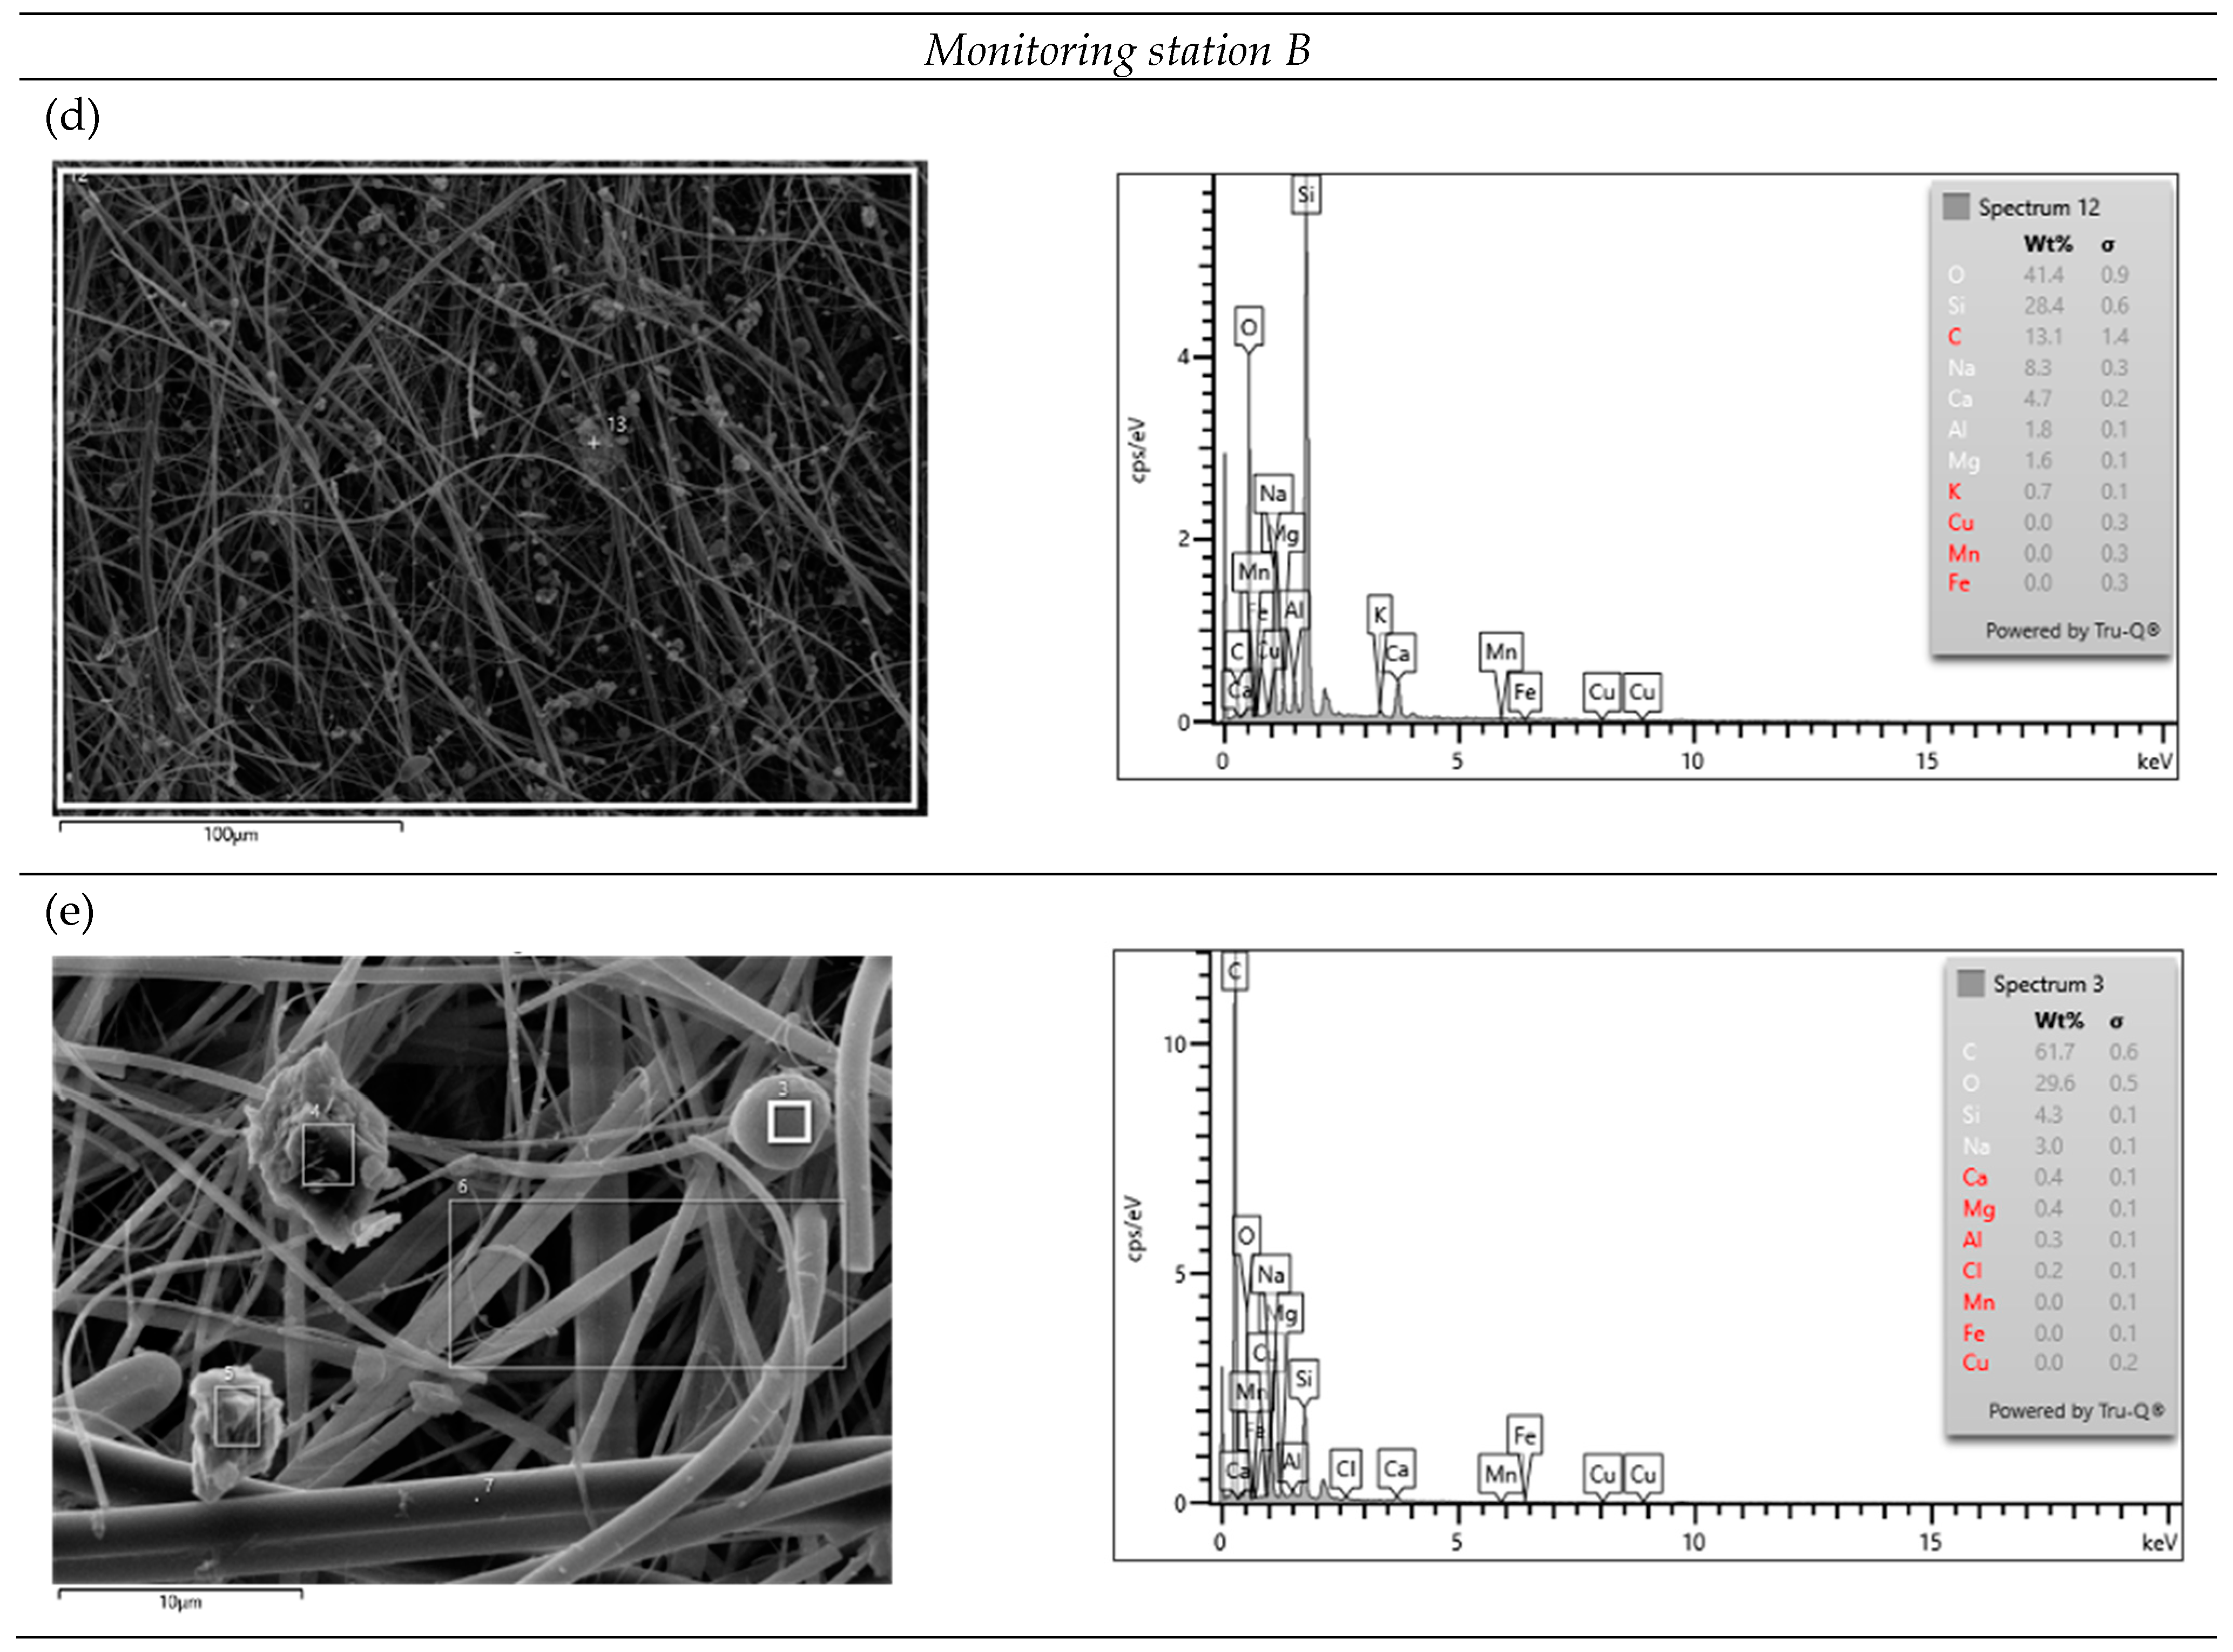
3.6. Elemental Composition and Morphological Characteristics of PM Analyzed by SEM-EDS

Scanning electron microscopy (SEM) images of PM10 and PM2.5 particles collected on filters from both monitoring stations revealed a broad spectrum of particle sizes and morphologies (Figure 6). The analyzed PM10 and PM2.5 samples were collected in August 2022, during the final phase of the four-year measurement campaign. This sampling period was selected to represent typical summer conditions. Particles were evaluated based on their size, shape, and elemental composition, and subsequently classified into two primary categories: natural and anthropogenic. Natural particles were predominantly composed of mineral dust, characterized by irregular geometries, rough surface textures, and a tendency to form agglomerates. These particles likely originated from soil resuspension and long-range dust transport. In contrast, anthropogenic particles—mainly from combustion sources—exhibited spherical or rounded shapes with smooth surfaces [40]. Energy-Dispersive Spectroscopy (EDS) confirmed the presence of various elements, with oxygen (O), carbon (C), and silicon (Si) being the most abundant. Their concentrations ranged from 29.6 to 42.1% for O, 13.1 to 61.7% for C, and 4.3 to 28.4% for Si (Figure 6). The high silicon content is attributed to geological sources, particularly Saharan dust transport, consistent with previous reports of transboundary aerosol movement across Europe [33,34,35,36]. Elevated carbon levels likely reflect fossil fuel combustion, especially from vehicular traffic in urban areas. Other elements were present in lower concentrations, including sodium (Na: 3.0–8.3%), calcium (Ca: 0.4–7.6%), magnesium (Mg: 0.4–1.6%), and aluminum (Al: 0.3–1.8%). These elements indicate a combination of crustal material, marine aerosols, industrial emissions, and resuspended dust. Among heavy metals, only zinc (Zn) and copper (Cu) were detected, both in trace amounts, suggesting minor but relevant anthropogenic contributions.
Altogether, these findings confirm the mixed natural and anthropogenic origin of both coarse (PM10) and fine (PM2.5) particulate matter, with composition influenced by regional sources, seasonal conditions, and local human activity.

4. Conclusions

This study examined daily and annual PM10 and PM2.5 concentrations in Slovenia between 1 January 2019–31 December 2022, with a focus on temporal variability. Measurements were conducted at two contrasting sites: an urban, traffic-influenced location (site A) and an industrial site (site B). The concentration levels were consistently higher at site A, underscoring the dominant role of vehicular emissions in urban air pollution. Peak concentrations occurred during winter months, particularly in January and February, due to increased residential heating and reduced atmospheric dispersion. PM10 levels were strongly influenced by local emission sources, seasonal dynamics, and meteorological conditions. Concentrations were lowest during warmer months, reflecting decreased heating demand and improved dispersion. The observed decline in exceedance days from 2019 to 2022 strongly suggests the effectiveness of air quality interventions and policy measures implemented during this period. Similarly, PM2.5 concentrations peaked in winter, driven by temperature inversions [33,34,35,36], stagnant air, solid fuel combustion, and intensified traffic. Episodic events, such as Saharan dust intrusions and forest fires, also contributed to short-term spikes.
To investigate PM10 and PM2.5 composition, SEM-EDS analysis was performed. Particles exhibited diverse morphologies, with combustion-derived and mineral dust aggregates prevalent. Elemental analysis revealed the presence of C, O, Na, Al, Si, S, Pb, Cd, Fe, and Zn, allowing for differentiation between natural and anthropogenic sources. The presence of Pb and Zn pointed to traffic and industrial emissions, while high Si suggested crustal dust and long-range transport.
These results underscore the need for integrated monitoring and targeted mitigation strategies to manage urban particulate pollution effectively.

Author Contributions

Conceptualization, M.I. and D.U.; methodology, M.I.; software, I.A.; investigation, M.I.; writing—original draft preparation, M.I.; writing—review and editing, M.I. and D.U.; supervision, D.G. All authors have read and agreed to the published version of the manuscript.

Funding

This research received no external funding.

Institutional Review Board Statement

Not applicable.

Informed Consent Statement

Not applicable.

Data Availability Statement

The original contributions presented in this study are included in the article. Further inquiries can be directed to the corresponding author(s).

Conflicts of Interest

The authors declare no conflicts of interest.

Abbreviations

The following abbreviations are used in this manuscript:
AASAtomic Absorption Spectroscopy
ARSOSlovenian Environment Agency
COPDChronic obstructive pulmonary disease
EEAEuropean Environment Agency
EUEuropean Union
EIMVElektroinštitut Milan Vidmar
FE-SEMField Emission Scanning Electron Microscopy
FT-IRFourier Transform Infrared Spectroscopy
ICP-OESInductively Coupled Plasma Optical Emission Spectroscopy
ICP-MSInductively Coupled Plasma Mass Spectroscopy
PpPrecipitation
PMParticulate matter
RHpRelative humidity
SEM-EDSScanning Electron Microscopy with Energy-Dispersive Spectroscopy
SEM-EDXScanning Electron Microscopy with Energy-Dispersive X-ray Spectroscopy
SURSSlovenian Statistical Biro
TpTemperature
VOCsVolatile organic compounds
XRDX-ray Diffraction
WHOWorld Health Organization
WSpWind speed

References

  1. Kumar, N.; Hamzah, F.M.; Diantoro, M.; Muhd Zailani, N.A. Suman Physiochemical characterization of ambient PM10 and PM2.5 in an urban environment. Curr. Appl. Phys. 2025, 71, 57–69. [Google Scholar] [CrossRef]
  2. Gal, O.; Eitan, O.; Rachum, A.; Weinberg, M.; Zigdon, D.; Assa, R.; Price, C.; Yovel, Y. Air Pollution likely reduces hemoglobin levels in urban fruit-bats. iScience 2025, 28, 111997. [Google Scholar] [CrossRef] [PubMed]
  3. World Helath Organization (WHO). WHO Global Air Quality Guidelines; Update 2021; WHO: Geneva, Switzerland, 2021. [Google Scholar]
  4. Air Quality Directive. 2024. Available online: https://www.consilium.europa.eu/sl/press/press-releases/2024/10/14/air-quality-council-gives-final-green-light-to-strengthen-standards-in-the-eu/ (accessed on 10 March 2025).
  5. Lavrič, P.D.; Ivanovski, M.; Goričanec, D.; Urbancl, D. Particulate Matter Air Pollution in the Republic of Slovenia and Its National Spatial Emissions Release. Available online: https://revue.cder.dz/index.php/rer/article/view/1149 (accessed on 10 March 2025).
  6. Moghimi Dehkordi, M.; Pournuroz Nodeh, Z.; Soleimani Dehkordi, K.; Salmanvandi, H.; Rasouli Khorjestan, R.; Ghaffarzadeh, M. Soil, air, and water pollution from mining and industrial activities: Sources of pollution, environmental impacts, and prevention and control methods. Results Eng. 2024, 23, 102729. [Google Scholar] [CrossRef]
  7. Bakirci, M. Evaluating the impact of unmanned aerial vehicles (UAVs) on air quality management in smart cities: A comprehensive analysis of transportation-related pollution. Comput. Electr. Eng. 2024, 119, 109556. [Google Scholar] [CrossRef]
  8. Dong, D.; Wang, J. Air pollution as a substantial threat to the improvement of agricultural total factor productivity: Global evidence. Environ. Int. 2023, 173, 107842. [Google Scholar] [CrossRef]
  9. Manzueta, R.; Kumar, P.; Ariño, A.H.; Martín-Gómez, C. Strategies to reduce air pollution emissions from urban residential buildings. Sci. Total Environ. 2024, 951, 175809. [Google Scholar] [CrossRef]
  10. Abhijith, K.V.; Kumar, P.; Omidvarborna, H.; Emygdio, A.P.M.; McCallan, B.; Carpenter-Lomax, D. Improving air pollution awareness of the general public through citizen science approach. Sustain. Horiz. 2024, 10, 100086. [Google Scholar] [CrossRef]
  11. Brauer, M.; Casadei, B.; Harrington, R.A.; Kovacs, R.; Sliwa, K. Taking a Stand Against Air Pollution—The Impact on Cardiovascular Disease: A Joint Opinion from the World Heart Federation, American College of Cardiology, American Heart Association, and the European Society of Cardiology. J. Am. Coll. Cardiol. 2021, 77, 1684–1688. [Google Scholar] [CrossRef]
  12. Kelly, F.J.; Fussell, J.C. Air pollution and public health: Emerging hazards and improved understanding of risk. Environ. Geochem. Health 2015, 37, 631–649. [Google Scholar] [CrossRef]
  13. Kyung, S.Y.; Jeong, S.H. Particulate-Matter Related Respiratory Diseases. Tuberc. Respir. Dis. 2020, 83, 116–121. [Google Scholar] [CrossRef]
  14. Stump, Á.; Szabó-morvai, Á. Journal of Environmental Economics and The effect of air pollution on fertility in 657 European regions. J. Environ. Econ. Manage. 2025, 130, 103111. [Google Scholar] [CrossRef]
  15. Sampath, V.; Aguilera, J.; Prunicki, M.; Nadeau, K.C. Mechanisms of climate change and related air pollution on the immune system leading to allergic disease and asthma. Semin. Immunol. 2023, 67, 101765. [Google Scholar] [CrossRef] [PubMed]
  16. Hrženjak, V.V.; Kukec, A.; Eržen, I.; Stanimirović, D. Effects of ultrafine particles in ambient air on primary health care consultations for diabetes in children and elderly population in ljubljana, Slovenia: A 5-year time-trend study. Int. J. Environ. Res. Public Health 2020, 17, 4970. [Google Scholar] [CrossRef] [PubMed]
  17. Dao, X.; Di, S.; Zhang, X.; Gao, P.; Wang, L.; Yan, L.; Tang, G.; He, L.; Krafft, T.; Zhang, F. Composition and sources of particulate matter in the Beijing-Tianjin-Hebei region and its surrounding areas during the heating season. Chemosphere 2022, 291, 132779. [Google Scholar] [CrossRef]
  18. Talbi, A.; Kerchich, Y.; Kerbachi, R.; Boughedaoui, M. Assessment of annual air pollution levels with PM1, PM2.5, PM10 and associated heavy metals in Algiers, Algeria. Environ. Pollut. 2018, 232, 252–263. [Google Scholar] [CrossRef]
  19. ARSO. Kakovost Zraka v Sloveniji v Letu 2023. 2024. Available online: http://hmljn.arso.gov.si/zrak/kakovostzraka/poročilainpublikacije/porocilo_2023-FINAL.pdf (accessed on 12 March 2025).
  20. Afifa, K.; Arshad, N.; Hussain, N.; Ashraf, M.H.; Saleem, M.Z. Air pollution and climate change as grand challenges to sustainability. Sci. Total Environ. 2024, 928, 172370. [Google Scholar] [CrossRef]
  21. Mohammed, G.; Karani, G.; Mitchell, D. Trace Elemental Composition in PM10 and PM2.5 Collected in Cardiff, Wales. Energy Procedia 2017, 111, 540–547. [Google Scholar] [CrossRef]
  22. Ramirez-Leal, R.; Valle-Martinez, M.; Cruz-Campas, M. Chemical and Morphological Study of PM10 Analysed by SEM-EDS. Open J. Air Pollut. 2014, 03, 121–129. [Google Scholar] [CrossRef]
  23. Sinha, A.; Ischia, G.; Straffelini, G.; Gialanella, S. A new sample preparation protocol for SEM and TEM particulate matter analysis. Ultramicroscopy 2021, 230, 113365. [Google Scholar] [CrossRef]
  24. Li, D.; Yue, W.; Gong, T.; Gao, P.; Zhang, T.; Luo, Y.; Wang, C. A comprehensive SERS, SEM and EDX study of individual atmospheric PM2.5 particles in Chengdu, China. Sci. Total Environ. 2023, 883, 163668. [Google Scholar] [CrossRef]
  25. Kukec, A.; Jereb, G.; Zaletel-Kragelj, L.; Farkaš-Lainščak, J.; Bizjak, M.; Eržen, I. Special Edition 2014 Kakovost zunanjega zraka kot determinanta zdravja. Int. J. Sanit. Eng. Res. 2014, 4. [Google Scholar]
  26. Dolšak Lavrič, P.; Ivanovski, M.; Vončina, R. Poročilo o Meritvah Kakovosti Zraka AMP Agenciji Republike Slovenije za Okolje, Leto 2020; Inštitut za elektrogospodarstvo in elektroindustrijo: Ljubljana, Slovenia, 2020; Available online: https://www.okolje.info/index.php/porocila-moc (accessed on 10 March 2025).
  27. Glojek, K.; Dinh Ngoc Thuy, V.; Weber, S.; Uzu, G.; Manousakas, M.; Elazzouzi, R.; Džepina, K.; Darfeuil, S.; Ginot, P.; Jaffrezo, J.L.; et al. Annual variation of source contributions to PM10 and oxidative potential in a mountainous area with traffic, biomass burning, cement-plant and biogenic influences. Environ. Int. 2024, 189, 108787. [Google Scholar] [CrossRef] [PubMed]
  28. Network, C.B. Air Pollution in the Balkans—Independent Monitoring. 2025. Available online: https://bankwatch.org/beyond-fossil-fuels/airpollution-balkans?utm_source (accessed on 12 March 2025).
  29. Ziernicka-Wojtaszek, A.; Zuśka, Z.; Kopcińska, J. Assessment of the Effect of Meteorological Conditions on the Concentration of Suspended PM2.5 Particulate Matter in Central Europe. Sustainability 2024, 16, 4797. [Google Scholar] [CrossRef]
  30. Ivanovski, M.; Lavrič, P.D.; Vončina, R.; Goričanec, D.; Urbancl, D. Improvement of Air Quality During the COVID-19 Lockdowns in the Republic of Slovenia and Its Connection with Meteorology. Aerosol Air Qual. Res. 2022, 22. [Google Scholar] [CrossRef]
  31. Ivanovski, M.; Alatič, K.; Urbancl, D.; Simonič, M.; Goričanec, D.; Vončina, R. Assessment of Air Pollution in Different Areas (Urban, Suburban, and Rural) in Slovenia from 2017 to 2021. Atmosphere 2023, 14, 578. [Google Scholar] [CrossRef]
  32. ARSO. ARSO Arhiv Meteo. 2025. Available online: https://meteo.arso.gov.si/met/sl/archive/ (accessed on 12 March 2025).
  33. Agencija Republike Slovenije za Okolje. Kakovost Zraka v Sloveniji v Letu 2019. 2020. Available online: https://www.arso.gov.si/zrak/kakovostzraka/poročilainpublikacije/Letno_Porocilo_2019_Za_Splet.pdf (accessed on 12 March 2025).
  34. Gjerek, M.; Koleša, T.; Logar, M.; Matevž, L.; Murovec, M.; Rus, M.; Žabkar, R. Kakovost Zraka v Slovniji v Letu 2020; Agencija Republike Slovenije za okolje: Ljubljana, Slovenia, 2021. Available online: http://www.arso.gov.si/zrak/kakovostzraka/poročilainpublikaci-je/kakovost_letna.html (accessed on 12 March 2025).
  35. Bec, D.Ž.R.; Ciglenički, D.; Dolšak Lavrič, P.; Gjerek, M.; Koleša, T.; Logar, M.; Matavž, L.; Murovec, M.; Rus, M. Kakovost Zraka v Republiki Sloveniji v Letu 2021. 2022. Available online: https://www.arso.gov.si/zrak/kakovostzraka/poročilainpublikacije/Letno_porocilo_2021_Final.pdf (accessed on 12 March 2025).
  36. ARSO. Kakovost Zraka v Sloveniji v Letu 2022. 2022. Available online: https://okolje.arso.gov.si/zrak/kakovost%20zraka/poročila%20in%20publikacije/porocilo_2022_Merged.pdf (accessed on 12 March 2025).
  37. Wang, L.; Guan, Q.; Wang, F.; Yang, L.; Liu, Z. Association between heating seasons and criteria air pollutants in three provincial capitals in northern China: Spatiotemporal variation and sources contribution. Build. Environ. 2018, 132, 233–244. [Google Scholar] [CrossRef]
  38. European Environmental Agency (EEA). Europe’s Air Quality Status 2023. 2023. Available online: https://www.eea.europa.eu/publications/europes-air-quality-status-2023/europes-air-quality-status2023 (accessed on 12 March 2025).
  39. World Health Organization. Air Quality Guidelines. 2021. Available online: https://www.who.int/news-room/questions-and-answers/item/who-global-air-quality-guidelines (accessed on 12 March 2025).
  40. Ramirez-Leal, R.; Cruz-Campas, M.; Estuardo-Moreno, H. Characterization of PM10 Particles by SEM-EDS. Microsc. Microanal. 2018, 24, 1070–1071. [Google Scholar] [CrossRef]
Figure 1. Graphical presentation of locations of monitoring stations A and B.
Atmosphere 16 00540 g001
Figure 2. Daily concentrations of PM10 at monitoring station A (left) and B (right), 2019–2022.
Atmosphere 16 00540 g002
Figure 3. Mean, minimum, and maximum PM10 concentrations, with standard deviation, at monitoring station A (left) and B (right), 2019–2022.
Atmosphere 16 00540 g003
Figure 4. Daily concentrations of PM2.5 at monitoring station A (left) and B (right), 2019–2022.
Atmosphere 16 00540 g004
Figure 5. Mean, minimum, and maximum PM2.5 concentrations, with standard deviation, at monitoring station A (left) and B (right), 2019–2022.
Atmosphere 16 00540 g005
Figure 6. SEM-EDS images of PM10 (b,d) and PM2.5 (c,e) particulates collected at both monitoring stations in August 2022. A blank filter is shown as an example in (a).
Atmosphere 16 00540 g006aAtmosphere 16 00540 g006b
Table 1. Characteristics of monitoring stations.
Sampling SiteAltitude (m)D96_E 1D96_N 1Area TypeMeasurement TypeCharacteristics of Area
A299504,134137,503UrbanTrafficResidential,
commercial
B362461,548102,067UrbanIndustrialResidential,
industrial
1—D96—national coordinate system.
Table 2. The correlation coefficients between the PM10 and PM2.5 fractions.
Monitoring Station2019202020212022
A0.95 (p = 0.045)0.99 (p = 0.020)0.98 (p = 0.010)0.95 (p = 0.030)
B0.92 (p = 0.070)0.87 (p = 0.040)1 (p = 0)0.92 (p = 0.020)
* Statistically significant at level < 0.05.
Table 3. Meteorological parameters at site A.
Monitoring Station A (Year)2019202020212022
Tp (°C)12.512.111.512.9
RHp (%)74717269
Pp (mm)1378.91262.21442.31264.3
WSp (m/s)1.31.31.31.3
Table 4. Meteorological parameters at site B.
Monitoring Station B (Year)2019202020212022
Tp (°C)10.29.58.910.1
RHp (%)77777775
Pp (mm)1226.71074.21083.6836.6
WSp (m/s)1.71.71.61.7
Disclaimer/Publisher’s Note: The statements, opinions and data contained in all publications are solely those of the individual author(s) and contributor(s) and not of MDPI and/or the editor(s). MDPI and/or the editor(s) disclaim responsibility for any injury to people or property resulting from any ideas, methods, instructions or products referred to in the content.

