Abstract
Ambient air pollution causes 4.2 million premature deaths annually. Ozone (O3), a secondary pollutant, is prevalent in urban areas with high transportation/industrial emissions. Chronic exposure to ozone is associated with cardiovascular and respiratory diseases and with metabolic disorders, such as type-2 diabetes (T2D). This study examined the relationship between chronic exposure to ground-level ozone, socioeconomic status, and T2D incidence. We found a significant positive correlation between ozone exposure and the T2D incidence in Israel’s urban population (municipalities with ≥20,000 residents). Univariate and multivariate linear regression analyses revealed that exposure to ground-level ozone significantly contributed to the T2D morbidity, mostly in ages ≥ 45 years. Our results emphasize the relationship between chronic ozone exposure and T2D in Israel’s unique heterogeneous populations and highlight health risks associated with ozone exposure. While socioeconomic status is a significant determinant of T2D, as shown in the current study, our findings suggest that environmental factors, such as exposure to ground-level ozone, exert independently potent effects. This emphasizes the need to consider both socioeconomic and environmental factors in public health strategies. Stricter air quality regulations and targeted public health interventions are essential, particularly in high-ozone areas. Reducing ambient ozone levels could also help mitigate the T2D burden, particularly among vulnerable populations.
1. Introduction
Air pollution, a significant environmental concern, comprises a complex mixture of gases, particles, and biological molecules that may critically impact human health [1]. Annually, 6.7 million to 8.8 million people die prematurely worldwide due to exposure to air pollution [2], with 4.2 million of them as a result of exposure to ambient air pollution [3]. Notably, more than 90% of the global population breathes air that contains pollutants at levels exceeding the World Health Organization’s (WHO’s) guideline limits, especially in low- and middle-income countries [4]. Ground-level ozone (O3), formed by photochemical reactions between NOx and VOCs in sunlight, significantly contributes to urban air pollution [5,6,7].
The health impacts of exposure to air pollution in general [8,9,10] and particularly to ozone are extensive [11,12,13]. High ozone levels are linked to compromised lung function [14,15] and respiratory conditions, such as asthma and chronic bronchitis [13,14]. Beyond these immediate effects, chronic exposure to ozone has been associated with more insidious health concerns, including cardiovascular diseases [11,15].
Recent studies suggest that ozone exposure may play a role in metabolic disorders, including associations with glucose intolerance and hyperlipidemia, which are precursors to diabetes [16,17]. As glucose intolerance often indicates pre-existing diabetes, recent studies have also been focusing on exploring the association between elevated ozone exposure and the incidence of diabetes, suggesting a complex interaction between environmental factors and glucose metabolism [18,19,20].
Several studies have provided initial support for a positive and robust association between long-term exposure to ozone and diabetes. This association has been observed among African American women living in 56 metropolitan areas across the United States [21,22], as well as among adults in China [19]. Long-term exposure to elevated ozone levels may increase the risk of type 2 diabetes (T2D) [23]. For example, it was found that individuals engaging in high levels of outdoor physical activity are particularly vulnerable to developing T2D when exposed to elevated ozone levels [24]. Additionally, a recent study revealed that daily ozone exposure during pregnancy increases the risk of developing Gestational Diabetes Mellitus (GDM). Reducing ambient ozone pollution may reduce the burden of both diseases [18]. Complementing these human studies, animal model studies have also provided critical insights into the mechanisms by which ozone contributes to diabetes, demonstrating that ozone exposure induces oxidative stress, inflammation, and impaired insulin sensitivity in rodents, which are factors known to increase the diabetes risk [25,26].
Socioeconomic status (SES), a multidimensional construct encompassing factors such as income, education, and occupation, profoundly influences individuals’ health trajectories [27,28,29]. This influence extends to environmental exposure, where SES can modulate both the likelihood and severity of exposure to environmental hazards, thereby exacerbating health disparities [30].
SES significantly influences health outcomes in the context of environmental exposure to ozone. Low-income areas often experience higher air pollution levels, including increased ozone exposure [31], leading to increased health risks, such as respiratory diseases and childhood asthma-related hospitalizations [32,33]. Similarly, during the COVID-19 pandemic, chronic air pollution exposure and low SES were associated with higher morbidity rates in the Israeli population [34].
A low SES is also associated with increased diabetes incidence [35]. Several key factors contribute to this association, including excessive weight and obesity [36]; racial differences, with a particularly high rate of T2D found among low SES African-Americans [37]; and economic transition, urbanization, and globalization, which have negative effects on lifestyle and diet [38]. Socioeconomic factors, such as illiteracy, unemployment, and low economic status, have also been linked to increased diabetes prevalence [39]. These findings highlight the complex interplay between biological, social, and environmental factors in shaping diabetes disparities.
Despite growing global evidence, few studies have examined the combined effects of ozone and SES on diabetes in a small, demographically diverse country like Israel. The ozone thresholds in Israel are higher than the WHO and EU (European Union) standards [40], making the population uniquely vulnerable.
This ecological study aimed to examine the relationships between chronic population-level exposure to ground-level ozone, the individual SES of residents, and the incidence of T2D in Israel. Based on the existing literature, we hypothesized that exposure to ground-level ozone would positively correlate with the incidence of T2D in the Israeli population. We assumed that this correlation would remain significant also when controlling for the SES. This study represents a pioneering effort to test this hypothesis at the municipal level in Israel, which involved analyzing data that encompassed the majority of the Israeli population. Employing univariate and multivariate linear regression models, this research meticulously accounted for a range of confounding factors to ensure robust and reliable findings. The original results underscore the critical importance of air pollution mitigation as a cornerstone for effective public health management. While additional epidemiological investigations are warranted to further validate these findings, the insights gained from this study provide a valuable foundation for evidence-based policymaking in public health.
2. Materials and Methods
2.1. Data Collection
The Israeli Central Bureau of Statistics (CBS) website [41] provides demographic information on all 280 Israeli cities and municipalities. To ensure sufficient data on T2D, we focused exclusively on municipalities with at least 20,000 residents. The resulting data pool included a total of 81 municipalities (ranging from small towns with a population ≥ 20,000 residents to the largest city with 936,000 residents). The following demographic and health data were collected:
- (a)
- A city’s 2017 socioeconomic cluster value. This value is determined by using a CBS socioeconomic index, ranging from 1—the lowest socioeconomic ranking to 10—the highest socioeconomic ranking. A municipality’s socioeconomic index includes 14 components related to demography, education, employment, and standard of living. The 14 index components are as follows:
Demography:
- 1.
- Median age.
- 2.
- Dependency ratio (ratio between working-age population (20–64) and dependents (0–19 and 65+)).
- 3.
- Percentage of households with four or more children.
Education:
- 4.
- Average years of schooling (ages 25–54).
- 5.
- Percentage of individuals with an academic degree (ages 27–54).
Employment and Benefits:
- 6.
- Percentage of individuals with income from employment (ages 25–54).
- 7.
- Percentage of women (ages 25–54) with no income from employment.
- 8.
- Percentage of employed individuals earning more than twice the average wage.
- 9.
- Percentage of employed individuals earning below the minimum wage.
- 10.
- Percentage of individuals aged 20+ receiving income support or old-age/survivors’ allowance.
Standard of Living:
- 11.
- Average monthly income per capita.
- 12.
- Average number of privately owned vehicles per 100 residents aged 17+.
- 13.
- Average vehicle license fee (used as an estimate of vehicle value).
- 14.
- Average number of days spent abroad per person.
- (b)
- Standardized rate of T2D per 1000 people for the entire Israeli population (general population’s T2D rate) between the years 2017 and 2019.
- (c)
- Standardized rate of T2D patients per 100,000 people aged ≥ 45 (rate of T2D among the adults aged ≥ 45 population) between the years 2017 and 2019.
The T2D data were downloaded from the CBS website [42]. These data were collected from all of Israel’s health maintenance organizations (HMOs), analyzed and summarized by the Israel Center for Disease Control (ICDC), and included patients who met the following criteria: (a) at least one glycated hemoglobin (HbA1c) test result above 6.5% in the past year; (b) purchase of at least three prescriptions for antidiabetic drugs in different months within the past year; and (c) blood glucose levels ≥ 200 mg/dL in two tests conducted at least one month apart in the past year.
A hybrid model, provided by the Israeli Ministry of Environmental Protection (IMoEP) was used to calculate the estimated population exposure to different air pollutants. The model is based on two sources of information: (a) the CHIMERE model [43], which provides hourly forecasts of different air pollutants at a spatial resolution of 3 km (covering the entire area of Israel), and (b) air pollution measurements obtained from an air-quality-monitoring network. We focused on the average ozone concentrations in both 2017 and 2019. Next, the weighted mean of the population ozone exposure was calculated per municipality by extracting the pollutants’ average concentrations in the areas attributed to the municipality in the aforementioned years [41,44]. Raw data on SES, ground ozone level, and diabetes prevalence per municipality can be found in Table S1.
2.2. Statistical Analyses
Since the distribution of ozone levels was non-linear, Spearman’s rank correlation was employed to assess the associations between the ozone levels and T2D morbidity. This non-parametric approach is robust to outliers and makes no assumptions about the normality of the data. To address potential biases related to the ecological fallacy, we performed additional Spearman correlations to evaluate the associations between ozone levels, T2D incidence, and population characteristics (population size and the percentage of young individuals aged 0–17 years), as well as heart disease incidence.
Next, we employed univariate linear regressions to evaluate the effect of the population-weighted ozone exposure with T2D morbidity.
Finally, we employed multivariate linear regressions to evaluate the independent associations of a municipality’s socioeconomic cluster value and the population-weighted ozone exposure with T2D morbidity. This regression analysis allows us to estimate the adjusted effect of ozone exposure on T2D morbidity after accounting for the influence of SES. The multivariate linear regressions formulas were as follows:
For each model, we calculated the statistical significance, root mean square error (RMSE), R2, Cohen’s f2 values, and the coefficient/p-value of each parameter. Additionally, to understand the relative contribution of each parameter (in the multivariate linear regressions), independent variables were normalized using min–max normalization.
All statistical analyses were performed using Python (version 3.9.13).
3. Results
This study examined the associations between the chronic exposure of a population to ground-level ozone, its SES (based on The Israeli CBS socioeconomic cluster index), and the incidence of T2D in Israel. The ozone concentrations in 2017 ranged between 55.8 and 95.9 µg/m3 (standard deviation (sd) of 9.02 µg/m3) and in 2019 between 57.1 and 94.8 µg/m3 (sd = 7.9 µg/m3).
The Spearman correlation analysis revealed positive correlations between the exposure to ozone and the T2D morbidity in 2017 and 2019: in 2017, the ozone and general population T2D rate (r = 0.4)/adults aged ≥ 45 years T2D rate (r = 0.43), and in 2019, the ozone and general population T2D rate (r = 0.41)/adults aged ≥ 45 years T2D rate (r = 0.4) (all p-values < 0.001) (Figure 1).
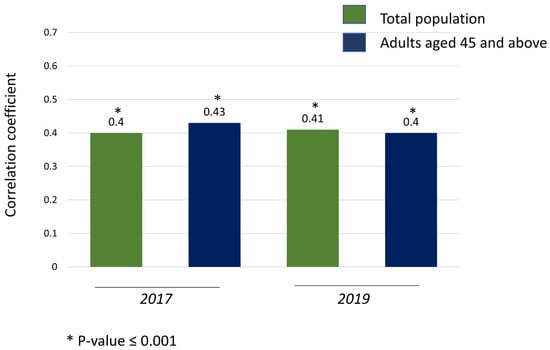
Figure 1.
Spearman correlation coefficient of the rates of T2D and ground-level ozone concentrations in 2017 and 2019.
The additional correlations examined to rule out potential bias revealed no significant associations between T2D incidence and population variables (population size and the percentage of young individuals aged 0–17 years). However, a moderate statistically significant correlation was observed between T2D incidence and heart disease incidence (r = 0.51, p < 0.0001 for the general population; r = 0.68, p < 0.0001 for adults aged ≥ 45 years). This finding aligns with the well-established relationship between heart disease and diabetes, as extensively discussed in the literature [45].
Similarly, no significant correlations were identified between the ozone levels and the aforementioned population variables. However, mild but statistically significant correlations were observed between ozone levels and heart disease incidence (r = 0.39, p = 0.002 for 2017; r = 0.28, p = 0.01 for 2019). These correlations may have stemmed from the significant association between ozone exposure and heart disease, as shown here.
Univariate linear regressions further emphasized the positive effect of exposure to ozone on T2D morbidity in both years and both analyzed populations. All linear regression models were statistically significant, with the root mean square error (RMSE) being smaller than the morbidity standard deviations (Table 1).

Table 1.
Univariate linear regressions to predict T2D morbidity based on exposure to average concentrations of ground-level ozone in 2017 and 2019.
Multivariate linear regressions revealed that the socioeconomic cluster had a negative effect on the T2D morbidity (higher socioeconomic clusters significantly correlated with the lower T2D incidence), while the exposure to ozone had a positive effect (populations with higher exposure had higher T2D incidence) in all the tested models. All multivariate linear regression models were statistically significant, with the root mean square error (RMSE) smaller than the morbidity standard deviations. Cohen’s f2 values (0.61 to 1.23) show very large effect sizes of the predictors (Table 2). Of note, linear regressions utilized to predict T2D morbidity based exclusively on socioeconomic cluster (without the variable of exposure to ozone) resulted in models with higher p-values, emphasizing the statistically significant contribution that the ozone exposure had on morbidity (Figure 2).
Table 2.
Multivariate linear regressions to predict T2D morbidity based on socioeconomic cluster and exposure to average concentrations of ground-level ozone in 2017 and 2019.
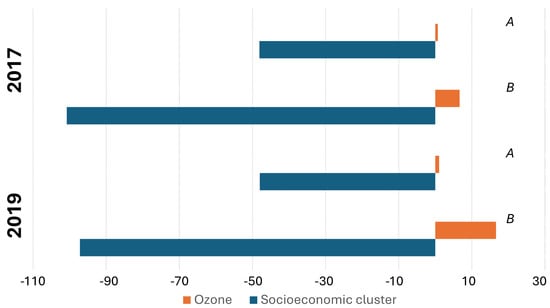
Figure 2.
Socioeconomic cluster and exposure to average concentrations of ground-level ozone coefficients of the multivariate linear regressions to predict T2D morbidity. (A) General population. (B) Adults aged ≥ 45 years.
4. Discussion
4.1. Associations Between the Ozone Concentrations and the Incidence of Type 2 Diabetes
The association between exposure to various air pollutants and the incidence of T2D has been reported in the literature. For example, in 2018, Alderete and his colleagues showed that increased exposure to air pollutants, such as particulate matter (PM) and nitrogen dioxide (NO2), contributed to metabolic dysfunction and T2D etiology [46]. Additionally, a borderline significant association between long-term exposure to traffic-related air pollution and confirmed cases of diabetes, particularly in nonsmokers and physically active individuals, was previously reported [47]. Recently, it was shown that exposure to NO2, SO2, CO, and ozone significantly increase diabetes-related hospitalizations, especially among women and older adults [48].
In this study, we observed a significant positive correlation between exposure to ground-level ozone and the incidence of T2D in the Israeli population (Figure 1). Exposure to ground-level ozone also contributed to the multivariable models’ predictions of T2D morbidity, primarily in adults aged 45 and above. These results align with findings that older individuals are more vulnerable due to age-related declines in pulmonary and immune function, which may amplify ozone’s systemic effects [6]. Previous studies conducted in Israel have reported high ozone levels that are regularly measured during the summer months, across both inland and mountainous regions. Back trajectory analysis of air masses responsible for these elevated levels elucidated that the ozone precursors originated from the industry and transportation emissions at the densely populated Israeli coastline [41,49], unlike much larger countries, where ozone hotspots are often localized around megacities [7]. The positive correlation between ozone exposure and T2D morbidity (Figure 1), and the positive effect found in the univariate and multivariate linear regressions (Table 1 and Table 2), align with previous findings in the literature, which highlight the health risks associated with ozone exposure [16,17,18,19,21,22,23,24]. These previous findings provided initial support for a positive association between long-term exposure to ozone and the incidence of T2D. This association has been observed across various regions, ethnicities and age groups, including African American women in the US, adults in China, residents of North Africa and the Middle East, as well as in a recently publish meta-analysis [13,18,19,21,22]. Furthermore, a similar impact was reported among Taiwanese adults aged 30 to 50 years old, where for every 3.3 ppb increase in ozone, the hazard ratio (HR) for the incidence of T2D was 1.093 (An HR greater than 1 indicates an increased risk). In this case, a 3.3 ppb rise in ozone was associated with a 9.3% increased risk of T2D [50].
Although associations between ozone exposure and T2D incidence can be found in different regions and countries around the globe, Israel’s arid climate and high solar radiation accelerate photochemical ozone formation, potentially intensifying ozone metabolic disruptions compared with temperate regions [41,49]. In Israel, as reported in the results section, ozone concentrations in 2017 and 2019 were between 55.8 and 95.9 µg/m3 and between 57.1 and 94.8 µg/m3, respectively. The Israeli environmental threshold for ozone exposure (8 h average) is higher than the EU, USA, and WHO thresholds, with 140 µg/m3 compared with 120, 138, and 100 µg/m3, respectively [40]. Additionally, differences in the ozone-monitoring density, urban spatial structure, and population demographics between Israel and other countries may contribute to the observed heterogeneity. For example, Israel’s relatively high density of air quality monitors and its urban planning patterns may reduce exposure misclassification compared with studies in larger, less densely monitored countries. All in all, regional differences in climate, urbanization, regulatory frameworks, and social structure must be considered when interpreting and comparing findings across studies.
The current study extended the body of knowledge by demonstrating the effects of ground-level ozone on the incidence of T2D in a unique demographic context—the Israeli population—and reinforced the notion that ozone is a critical environmental health hazard. Future research should prioritize longitudinal studies to clarify the dose–response relationship and evaluate mitigation strategies.
4.2. Type 2 Diabetes, Ground-Level Ozone Exposure, Socioeconomic Status, and Environmental Health Policy Recommendations
Our study, encompassing for the first time the entire Israeli urban population (population in municipalities ≥ 20,000 residents), corroborates prior evidence linking chronic ozone exposure and T2D, and emphasizes these associations in the uniquely heterogeneous Israeli population. Given the ecological nature of our study and the restricted literature evidence on a global population scale, further studies targeting diverse population groups (race, age, SES, health background etc.) are necessary to validate this link.
Our findings, when multivariate linear regressions revealed that lower socioeconomic clusters had higher T2D morbidity levels (Table 2 and Figure 2), also contribute to the understanding of the intersection between environmental health and SES. While SES is a significant determinant of health outcomes, as evidenced by its influence on T2D prevalence, our findings suggest that environmental factors, such as ground-level ozone exposure, are independently potent determinants of health. This highlights the importance of considering both socioeconomic and environmental factors in public health strategies, as was established by previous research on air pollution, SES, and other morbidities [34,51,52,53].
A holistic strategy for air pollution mitigation and public health enhancement is urgently needed. This strategy should include the following steps: reducing NOx and VOCs emissions from industrial and transport activities; reducing transport emissions by stricter vehicle emission regulations, incentives for low-emission technologies, and the promotion of electric vehicles; reducing industrial emissions by the adoption of cleaner best available technologies (BATs), as supported by regulatory policies enforcing stricter emission limits and control systems; transitioning to renewable energy can further mitigate emissions, with governments investing in renewable infrastructure and offering tax incentives or subsidies to accelerate adoption; implementing municipal low-emission zones, restricting traffic during high-ozone periods, promoting public transportation, and increasing urban green spaces to reduce ozone levels while enhancing citizen well-being; continuous monitoring through ground-based and satellite technology is essential for understanding ozone dynamics and assessing the effectiveness of policies; public education campaigns are crucial to raise awareness about relevant risks and encourage informed actions, such as using air quality apps or indoor air purifiers.
As a low SES may induce higher exposure levels due to residents living in close vicinity to industrial centers, main congested roads, or in poorly ventilated indoor environments [6], special care should be provided to protecting these weakened populations, focusing especially on young children, the elderly, and pregnant women.
This study analyzed data from 81 municipalities, representing the majority of Israel’s population. Given Israel’s compact geographical area and its long borders with five neighboring countries, international collaboration is crucial to address the transboundary movement of ozone precursors. Such cooperation can facilitate the development of shared strategies to effectively reduce the emissions of NOx and VOCs.
4.3. Research Strengths and Limitations and Policy Implications
Our findings suggest the need for stricter air quality regulations and targeted public health interventions, especially in areas with high ozone levels. Reducing ambient ozone pollution could be a crucial step in mitigating the burden of T2D, particularly in vulnerable populations. This goal could be achieved by addressing the above environmental health policy recommendations.
Overall, our findings align with the limited recent literature, which primarily focuses on regional or ethnic group scales. This study’s strengths included (a) the novel focus on all Israeli municipalities with ≥20,000 residents, comprising the majority (78%) of the highly ethnically and culturally diverse Israeli population; (b) the usage of the highly reliable databases of the Israeli CBS including health, socioeconomic, and demographic data, as well as the IMoEP air pollution exposure data for this study’s statistical analyses; and (c) the robustness of the results, as reflected by employing various statistical tools that all yielded consistent findings (Figure 1 and Figure 2).
This study, while robust and comprehensive, was not without limitations: (a) Given its ecological nature, this study pointed out correlations between T2D incidence and air pollution levels without indicating causation, for which further epidemiological research is needed. (b) The reliance on available data from specific years may not fully capture the dynamic relationship between ozone exposure and T2D incidence. Additionally, due to the unavailability of data at the municipal level, certain potential confounding factors—such as body mass index (BMI), smoking habits, dietary patterns, and levels of physical activity—could not be accounted for or analyzed in this study. Moreover, the T2D data lacked important details, such as sex and disaggregation into additional age groups, which limited the ability to conduct a more refined stratified analyses. Consequently, further epidemiological research is necessary to address these parameters and provide a more comprehensive understanding of the findings. (c) Since residents do not always spend their entire day in their city of residence, there might be some discrepancies between the actual air pollution exposure and the calculated exposure attributed to specific municipality residents. However, since the COVID-19 crisis and due to increasing global temperatures, an increasing number of people are working indoors or from home in air-conditioned environments; the extent to which this trend may have influenced our results remains uncertain. (d) Focusing on municipalities with ≥20,000 residents in Israel resulted in 81 municipalities. This relatively small sample size (n = 81) posed challenges to the statistical performance, which imposed constraints that limited the depth of this research investigation. (e) Variations in the SES within urban areas, specifically at the intra-municipal resolution, were not accounted for in this study due to the lack of access to high-resolution SES data. Consequently, the analysis could not be conducted at a finer spatial resolution.
Future research could benefit from a longitudinal approach, assessing changes over time and using a higher spatial resolution, or performing the analysis on individuals rather than municipalities. Additionally, exploring the specific mechanisms by which ozone contributes to diabetes development in humans could further elucidate this complex relationship and assist the scientific community to present policy makers research-based solutions for long-term air pollution, and more specifically, for ozone exposures. Following the anticipated implementation of a comprehensive policy for air pollution reduction, future research should also assist in monitoring and assessing the effectiveness of ozone reduction strategies in lowering T2D morbidity levels.
5. Conclusions
This study elucidated the complex interplay between chronic exposure to ground-level ozone, SES, and the incidence of T2D in Israel. Our major finding indicates a positive correlation between the chronic ozone exposure and the T2D morbidity, both in the general population and in adults aged ≥ 45 years old, residing in 81 municipalities (≥20,000 residents), even after controlling for SES. Multivariate linear regressions revealed that higher socioeconomic cluster (1 low–10 high) had a negative effect on T2D morbidity, while higher ozone chronic exposure had a positive effect on T2D morbidity. These findings indicate that ozone exposure may be a significant environmental risk factor for T2D, with potentially greater effects on populations with lower SES. Special care should be taken to protect these vulnerable population groups, focusing especially on young children, the elderly, and pregnant women. These findings underscore the vital need for integrating air quality management into T2D prevention strategies and addressing environmental health disparities through comprehensive municipal-, state-, and international-level public health policies. Future research should prioritize clarifying the biological mechanisms underlying this association, utilize higher-resolution data, and assess the effectiveness of holistic ozone reduction policies in mitigating T2D-associated morbidity.
Supplementary Materials
The following supporting information can be downloaded from https://www.mdpi.com/article/10.3390/atmos16050528/s1: Table S1. Raw data on socioeconomic status, ground ozone level, and diabetes prevalence per municipality.
Author Contributions
A.L.—conceptualization, data curation, investigation, methodology, project administration, validation, writing—original draft, and writing—review and editing; G.H.C.R.—investigation, writing—original draft, and writing—review and editing; Z.B.-I.—conceptualization, data curation, formal analysis, investigation, methodology, project administration, software, validation, visualization, writing—original draft, and writing—review and editing. All authors have read and agreed to the published version of the manuscript.
Funding
This research received no external funding.
Institutional Review Board Statement
Not applicable.
Informed Consent Statement
Not applicable.
Data Availability Statement
The original contributions presented in this study are included in the article/Supplementary Material. Further inquiries can be directed to the corresponding author.
Conflicts of Interest
The authors declare that they have no known competing financial interests or personal relationships that could have appeared to influence the work reported in this paper.
Abbreviations
| WHO | World Health Organization |
| O3 | Ozone |
| PM | Particulate matter |
| NO2 | Nitrogen dioxide |
| NOx | Nitrogen oxides |
| VOCs | Volatile Organic Compounds |
| CBS | Israel Central Bureau of Statistics |
| IMoEP | Israeli Ministry of Environmental Protection |
| GDM | Gestational Diabetes Mellitus |
| T2D | Type 2 diabetes |
| SES | Socioeconomic status |
| BATs | Best available technologies |
| EU | European Union |
| HMO | Health maintenance organization |
| ICDC | Israel Center for Disease Control |
| BMI | Body mass index |
References
- Kampa, M.; Castanas, E. Human health effects of air pollution. Environ. Pollut. 2008, 151, 362–367. [Google Scholar] [CrossRef]
- Roser, M. Data Review: How Many People Die from Air Pollution? Our World in Data, October 2023. Available online: https://ourworldindata.org/data-review-air-pollution-deaths (accessed on 19 November 2023).
- WHO. Ambient (Outdoor) Air Pollution. Available online: https://www.who.int/news-room/fact-sheets/detail/ambient-(outdoor)-air-quality-and-health (accessed on 19 November 2023).
- Mannucci, P.; Franchini, M. Health effects of ambient air pollution in developing countries. Int. J. Environ. Res. Public Health 2017, 14, 1048. [Google Scholar] [CrossRef] [PubMed]
- Brunekreef, B.; Holgate, S.T. Air pollution and health. Lancet 2002, 360, 1233–1242. [Google Scholar] [CrossRef] [PubMed]
- Donzelli, G.; Suarez-Varela, M.M. Tropospheric Ozone: A Critical Review of the Literature on Emissions, Exposure, and Health Effects. Atmosphere 2024, 15, 779. [Google Scholar] [CrossRef]
- Ni, J.; Jin, J.; Wang, Y.; Li, B.; Wu, Q.; Chen, Y.; He, C. Surface ozone in global cities: A synthesis of basic features, exposure risk, and leading meteorological driving factors. Geogr. Sustain. 2024, 5, 64–76. [Google Scholar] [CrossRef]
- Gozlu, M.; Senol, O.; Cirakli, U.; Aslan, H.; Akbulut, F.; Gokkaya, D. The effect of air pollution quality on lung cancer rates in middle-income and high-income countries: A panel data analysis approach. Front. Public Health 2024, 12, 1372320. [Google Scholar] [CrossRef]
- Barnett-Itzhaki, Z.; Levi, A. Effects of chronic exposure to ambient air pollutants on COVID-19 morbidity and mortality-A lesson from OECD countries. Environ. Res. 2021, 195, 110723. [Google Scholar] [CrossRef]
- Barnett-Itzhaki, Z.; Levi, A. Association between Chronic Exposure to Ambient Air Pollutants, Demography, Vaccination Level, and the Spread of COVID-19 during 2021 Delta Variant Morbidity Wave. Atmosphere 2022, 13, 1845. [Google Scholar] [CrossRef]
- Sun, F.; Gong, X.; Wei, L.; Zhang, Y.; Ge, M.; Xiong, L. Assessing the impact of short-term ozone exposure on excess deaths from cardiovascular disease: A multi-pollutant model in Nanjing, China’s Yangtze River Delta. Front. Public Health 2024, 12, 1353384. [Google Scholar] [CrossRef]
- Fu, G.; Cheng, H.; Lu, Q.; Liu, H.; Zhang, X.; Zhang, X. The synergistic effect of high temperature and ozone on the number of deaths from circulatory system diseases in Shijiazhuang, China. Front. Public Health 2023, 11, 1266643. [Google Scholar] [CrossRef]
- Fang, X.; Huang, S.; Zhu, Y.; Lei, J.; Xu, Y.; Niu, Y.; Chen, R. Short-term exposure to ozone and asthma exacerbation in adults: A longitudinal study in China. Front. Public Health 2023, 10, 1070231. [Google Scholar] [CrossRef] [PubMed]
- Zhou, X. Consequences of acute ozone exposure imposed on the culminated allergic pulmonary inflammation in an established murine model of asthma. Front. Biosci. 2013, 18, 838. [Google Scholar] [CrossRef]
- Surit, P.; Wongtanasarasin, W.; Boonnag, C.; Wittayachamnankul, B. Association between air quality index and effects on emergency department visits for acute respiratory and cardiovascular diseases. PLoS ONE 2023, 18, e0294107. [Google Scholar] [CrossRef]
- Shore, S.A. The metabolic response to ozone. Front. Immunol. 2019, 10, 2890. [Google Scholar] [CrossRef]
- Snow, S.J.; Henriquez, A.R.; Costa, D.L.; Kodavanti, U.P. Neuroendocrine regulation of air pollution health effects: Emerging insights. Toxicol. Sci. 2018, 164, 9–20. [Google Scholar] [CrossRef] [PubMed]
- Yu, S.; Zhang, M.; Zhu, J.; Yang, X.; Bigambo, F.M.; Snijders, A.M.; Wang, X.; Hu, W.; Lv, W.; Xia, Y. The effect of ambient ozone exposure on three types of diabetes: A meta-analysis. Environ. Health 2023, 22, 32. [Google Scholar] [CrossRef]
- Wang, Y.; Cao, R.; Xu, Z.; Jin, J.; Wang, J.; Yang, T.; Wei, J.; Huang, J.; Li, G. Long-term exposure to ozone and diabetes incidence: A longitudinal cohort study in China. Sci. Total Environ. 2022, 816, 151634. [Google Scholar] [CrossRef]
- Zhang, L.; Wang, P.; Zhou, Y.; Cheng, Y.; Li, J.; Xiao, X.; Yin, C.; Li, J.; Meng, X.; Zhang, Y. Associations of ozone exposure with gestational diabetes mellitus and glucose homeostasis: Evidence from a birth cohort in Shanghai, China. Sci. Total Environ. 2023, 857, 159184. [Google Scholar] [CrossRef]
- Jerrett, M.; Brook, R.; White, L.F.; Burnett, R.T.; Yu, J.; Su, J.; Seto, E.; Marshall, J.; Palmer, J.R.; Rosenberg, L.; et al. Ambient ozone and incident diabetes: A prospective analysis in a large cohort of african american women. ISEE Conf. Abstr. 2015, 2015, 3655. [Google Scholar] [CrossRef]
- Jerrett, M.; Brook, R.; White, L.F.; Burnett, R.T.; Yu, J.; Su, J.; Seto, E.; Marshall, J.; Palmer, J.R.; Rosenberg, L.; et al. Ambient ozone and incident diabetes: A prospective analysis in a large cohort of African American women. Environ. Int. 2017, 102, 42–47. [Google Scholar] [CrossRef]
- Zhan, Q.; Meng, X.; Wang, H.; Yu, Y.; Su, X.; Huang, Y.; Kan, H. Long-term low-level ozone exposure and the incidence of type 2 diabetes mellitus and glycemic levels: A prospective cohort study from Southwest China. Ecotoxicol. Environ. Saf. 2025, 293, 118028. [Google Scholar] [CrossRef]
- Yu, Y.; Jerrett, M.; Paul, K.C.; Su, J.; Shih, I.F.; Wu, J.; Lee, E.; Inoue, K.; Haan, M.; Ritz, B. Ozone exposure, outdoor physical activity, and incident type 2 diabetes in the SALSA cohort of older Mexican Americans. Environ. Health Perspect. 2021, 129, 097004. [Google Scholar] [CrossRef]
- Vella, R.E.; Pillon, N.J.; Zarrouki, B.; Croze, M.L.; Koppe, L.; Guichardant, M.; Pesenti, S.; Chauvin, M.A.; Rieusset, J.; Géloën, A.; et al. Ozone exposure triggers insulin resistance through muscle c-Jun N-terminal kinase activation. Diabetes 2015, 64, 1011–1024. [Google Scholar] [CrossRef]
- Ying, Z.; Allen, K.; Zhong, J.; Chen, M.; Williams, K.M.; Wagner, J.G.; Lewandowski, R.; Sun, Q.; Rajagopalan, S.; Harkema, J.R. Subacute inhalation exposure to ozone induces systemic inflammation but not insulin resistance in a diabetic mouse model. Inhal. Toxicol. 2016, 28, 155–163. [Google Scholar] [CrossRef]
- Lee, T.C.; Glynn, R.J.; Peña, J.M.; Paynter, N.P.; Conen, D.; Ridker, P.M.; Pradhan, A.D.; Buring, J.E.; Albert, M.A. Socioeconomic status and incident type 2 diabetes mellitus: Data from the Women’s Health Study. PLoS ONE 2011, 6, e27670. [Google Scholar] [CrossRef]
- Steptoe, A.; Hamer, M.; O’Donnell, K.; Venuraju, S.; Marmot, M.G.; Lahiri, A. Socioeconomic status and subclinical coronary disease in the Whitehall II epidemiological study. PLoS ONE 2010, 5, e8874. [Google Scholar] [CrossRef]
- Hu, X.; Wang, T.; Huang, D.; Wang, Y.; Li, Q. Impact of social class on health: The mediating role of health self-management. PLoS ONE 2021, 16, e0254692. [Google Scholar] [CrossRef]
- Evans, G.W.; Kantrowitz, E. Socioeconomic status and health: The potential role of environmental risk exposure. Annu. Rev. Public Health 2002, 23, 303–331. [Google Scholar] [CrossRef]
- Hajat, A.; Hsia, C.; O’Neill, M.S. Socioeconomic disparities and air pollution exposure: A global review. Curr. Environ. Health Rep. 2015, 2, 440–450. [Google Scholar] [CrossRef]
- Korc, M.E. A socioeconomic assessment of human exposure to ozone in the south coast air basin of California. J. Air Waste Manag. Assoc. 1996, 46, 547–557. [Google Scholar] [CrossRef]
- Son, J.-Y.; Kim, H.; Lee, J.T.; Kim, S.Y. Relationship between the exposure to ozone in Seoul and the childhood asthma-related hospital admissions according to the socioeconomic status. J. Prev. Med. Public Health 2006, 39, 81–86. [Google Scholar]
- Levi, A.; Barnett-Itzhaki, Z. Effects of chronic exposure to ambient air pollutants, demographic, and socioeconomic factors on COVID-19 morbidity: The Israeli case study. Environ. Res. 2021, 202, 111673. [Google Scholar] [CrossRef]
- Costa, I.G.; McConell, K.; Adduono, K.; Camargo-Plazas, P.; Koné, A. Exploring diabetes status and social determinants of health influencing diabetes-related complications in a Northwestern community, Ontario, Canada: A mixed method study protocol. PLoS ONE 2023, 18, e0273953. [Google Scholar] [CrossRef]
- Smith, J.P. Nature and causes of trends in male diabetes prevalence, undiagnosed diabetes, and the socioeconomic status health gradient. Proc. Natl. Acad. Sci. USA 2007, 104, 13225–13231. [Google Scholar] [CrossRef]
- Brancati, F.L.; Whelton, P.K.; Kuller, L.H.; Klag, M.J. Diabetes mellitus, race, and socioeconomic status a population-based study. Ann. Epidemiol. 1996, 6, 67–73. [Google Scholar] [CrossRef]
- Kapur, A.; Schmidt, M.I.; Barceló, A. Diabetes in socioeconomically vulnerable populations. Int. J. Endocrinol. 2015, 2015, 247636. [Google Scholar] [CrossRef]
- Peykari, N.; Djalalinia, S.; Qorbani, M.; Sobhani, S.; Farzadfar, F.; Larijani, B. Socioeconomic inequalities and diabetes: A systematic review from Iran. J. Diabetes Metab. Disord. 2015, 14, 8. [Google Scholar] [CrossRef]
- Berman, T.; Barnett-Itzhaki, Z. Environmental Health in Israel 2020; Israel Ministry of Health: Jerusalem, Israel, 2020; pp. 1–156. Available online: https://www.gov.il/BlobFolder/reports/health-and-environment-in-israel-2020/he/files_publications_environment_health-and-environment-in-israel-2020.pdf (accessed on 10 April 2025).
- Levy, I.; Karakis, I.; Berman, T.; Amitay, M.; Barnett-Itzhaki, Z. A hybrid model for evaluating exposure of the general population in Israel to air pollutants. Environ. Monit. Assess. 2020, 192, 4. [Google Scholar] [CrossRef]
- Israel Central Bureau of Statistics. Health Profile of Districts, Subdistricts and Localities with over 10,000 Inhabitants by Population Group—2014–2020. Updated 28 May 2022. Available online: https://www.gov.il/en/departments/central_bureau_of_statistics/govil-landing-page (accessed on 8 January 2024).
- Monteiro, A.; Miranda, A.I.; Borrego, C.; Vautard, R.; Ferreira, J.; Perez, A.T. Long-term assessment of particulate matter using CHIMERE model. Atmos. Environ. 2007, 41, 7726–7738. [Google Scholar] [CrossRef]
- Levy, Y.I.; Broday, D.M. Improving modeled air pollution concentration maps by residual interpolation. Sci. Total Environ. 2017, 598, 780–788. [Google Scholar] [CrossRef]
- Suman, S.; Biswas, A.; Kohaf, N.; Singh, C.; Johns, R.; Jakkula, P.; Hastings, N. The Diabetes-Heart Disease Connection: Recent Discoveries and Implications. Curr. Probl. Cardiol. 2023, 48, 101923. [Google Scholar] [CrossRef]
- Alderete, T.L.; Chen, Z.; Toledo-Corral, C.M.; Contreras, Z.A.; Kim, J.S.; Habre, R.; Chatzi, L.; Bastain, T.; Breton, C.V.; Gilliland, F.D. Ambient and traffic-related air pollution exposures as novel risk factors for metabolic dysfunction and type 2 diabetes. Curr. Epidemiol. Rep. 2018, 5, 79–91. [Google Scholar] [CrossRef]
- Andersen, Z.J.; Raaschou-Nielsen, O.; Ketzel, M.; Jensen, S.S.; Hvidberg, M.; Loft, S.; Tjønneland, A.; Overvad, K.; Sørensen, M. Diabetes incidence and long-term exposure to air pollution. Diabetes Care 2012, 35, 92–98. [Google Scholar] [CrossRef]
- Fu, Z.; Gong, H.; Hu, X.; Xie, Y.; Rui, D. The Impact of Air Pollutant Exposure on Diabetes Hospital Admissions in a City in Xinjiang. Atmosphere 2025, 16, 244. [Google Scholar] [CrossRef]
- Weinroth, E.; Luria, M.; Ben-Nun, A.; Kaplan, J.; Peleg, M.; Mahrer, I. Air pollution emission inventory survey for Israel. Isr. J. Chem. 2006, 46, 59–68. [Google Scholar] [CrossRef]
- Li, Y.L.; Chuang, T.W.; Chang, P.Y.; Lin, L.Y.; Su, C.T.; Chien, L.N.; Chiou, H.Y. Long-term exposure to ozone and sulfur dioxide increases the incidence of type 2 diabetes mellitus among aged 30 to 50 adult population. Environ. Res. 2021, 194, 110624. [Google Scholar] [CrossRef]
- Brandt, E.B.; Beck, A.F.; Mersha, T.B. Air pollution, racial disparities, and COVID-19 mortality. J. Allergy Clin. Immunol. 2020, 146, 61–63. [Google Scholar] [CrossRef]
- Commodore-Mensah, Y.; Selvin, E.; Aboagye, J.; Turkson-Ocran, R.A.; Li, X.; Himmelfarb, C.D.; Ahima, R.S.; Cooper, L.A. Hypertension, overweight/obesity, and diabetes among immigrants in the United States: An analysis of the 2010–2016 National Health Interview Survey. BMC Public Health 2018, 18, 773. [Google Scholar] [CrossRef]
- Wang, F.; Zhen, Q.; Li, K.; Wen, X. Association of socioeconomic status and health-related behavior with elderly health in China. PLoS ONE 2018, 13, e0204237. [Google Scholar] [CrossRef]
Disclaimer/Publisher’s Note: The statements, opinions and data contained in all publications are solely those of the individual author(s) and contributor(s) and not of MDPI and/or the editor(s). MDPI and/or the editor(s) disclaim responsibility for any injury to people or property resulting from any ideas, methods, instructions or products referred to in the content. |
© 2025 by the authors. Licensee MDPI, Basel, Switzerland. This article is an open access article distributed under the terms and conditions of the Creative Commons Attribution (CC BY) license (https://creativecommons.org/licenses/by/4.0/).