Article

Diurnal Variations in Greenspace Cooling Efficiency and Their Non-Linear Responses to Meteorological Change: Hourly Analysis of Air Temperature in Changsha, China

1
Hunan Provincial Key Laboratory of Landscape Ecology and Planning & Design in Regular Higher Educational Institutions, College of Landscape Architecture and Art Design, Hunan Agricultural University, Changsha 410128, China
2
Hunan Institute of Economic Geography, School of Economic Geography, Hunan University of Finance and Economics, Changsha 410205, China
*
Author to whom correspondence should be addressed.
Atmosphere 2025, 16(5), 527; https://doi.org/10.3390/atmos16050527
Submission received: 28 March 2025 / Revised: 24 April 2025 / Accepted: 28 April 2025 / Published: 30 April 2025
(This article belongs to the Section Biometeorology and Bioclimatology)

Abstract

:
Enhancing greenspace cooling efficiency (GCE) is a cost-effective nature-based solution to improve the urban thermal environment. The spatiotemporal patterns of GCE and their driving factors have been investigated mainly based on land surface temperature in a spatial comparison perspective. However, the diurnal change in GCE based on air temperature (AT) and its non-linear responses to meteorological factors are far from thoroughly understood. Taking the subtropical Chinese city of Changsha as an example, we quantified the hourly GCE based on AT in the hottest month of 2020, investigated its diurnal changes, and uncovered its non-linear responses to meteorological change using the Generalized Additive Model. The results showed that (1) the hourly GCE displayed a U-shaped temporal pattern with an average of 0.0128 °C%−1. The nighttime GCE (0.0134 °C%−1) was significantly higher than the daytime GCE (0.012 °C%−1). (2) Meteorological factors (i.e., temperature, relative humidity, and wind speed) significantly and non-linearly impacted GCE. (3) The responses of GCE to changes in relative humidity and wind speed followed an inverted U-shaped pattern, with the maximum values appearing at a relative humidity of 70% and a wind speed of 6m/s, respectively. GCE responded to temperature change more complexly, i.e., a negative response (<28 °C), then a positive response (30–35 °C), and finally a negative response (>35 °C). These findings extend our understanding of the diurnal variations of GCE and the non-linear responses to meteorological change and can help effective urban greenspace planning and management in Changsha, China, and other cities with similar climates in an era of rapid climate change. For example, expanding greenspace coverage as well as optimizing greenspace spatial configuration should be a priority action in areas where the AT is higher than 35 °C currently and will be in the future.

1. Introduction

Global warming and rapid urbanization have significantly increased temperatures at a faster speed in urban areas than their rural counterparts. This has caused numerous ecological and environmental consequences, such as decreasing human comfort and increasing mortality [1,2] and rising energy consumption for residential cooling [3,4]. As a cost-effective and nature-based solution, urban greening can effectively mitigate temperature rise through evapotranspiration and providing shading [5,6,7]. However, cities are dominantly covered by a variety of impervious surfaces such as buildings and roads, and there is usually limited space for expanding greenspace, especially in highly developed city centers. Enhancing greenspace cooling efficiency (GCE) is another cost-effective approach in addition to expanding greenspace coverage to improve the urban thermal environment. It is not surprising that GCE has received increasing attention from both the scientific community and decision makers, specifically concerning its spatiotemporal patterns and driving factors [8,9,10,11].
GCE, defined as the magnitude of temperature decrease generated by one unit (for example one percent coverage) increase of greenspace, has been increasingly quantified using both air temperature (AT) and remotely sensed land surface temperature (LST) and showed strong spatial variations. Wang et al. summarized the literature and showed GCE ranging from 0.023 to 0.318 °C [12]. They also estimated an average GCE of 0.168 °C (ranging from 0.040 to 0.574 °C) in the summer of 118 cities in the continental USA based on Landsat LST [12]. A study of 11 US cities reported GCE of up to 1.336 °C during heat waves and 0.022 °C during cold waves based on MODIS LST [8]. Using MODIS LST, GCE in African cities was quantified with positive mean values ranging from 0.11 to 1.26 °C and negative values in tropical cities (i.e., Bobo Dioulasso and Lubumbashi) [13]. GCE also shows strong temporal variations. A worldwide study of 550 cities from 2002 to 2020 demonstrated a substantial interannual variation of GCE, especially in developing regions like Africa, Asia, and South America [14]. The LST-based GCE was shown to range from 0.008 to 0.13 °C with a standard deviation of 0.04 °C during a 24 h cycle in the urban core area of the megacity of Paris, France [15].
The spatiotemporal variation of GCE has been attributed to many factors, such as meteorological factors, vegetation types, landscape patterns, and socioeconomic status [9,11,14,16,17]. Among them, meteorological factors (e.g., temperature, precipitation, and wind speed) are the most discussed. Wang et al. showed that the LST-based GCE non-linearly responded to climatic context (including air temperature, humidity, and wind speed), and these responses varied among different biomes in the continental USA [12]. In arid cities of Africa, the LST-based GCE showed very complex responses to temperature increase (i.e., increase for AT < 23 °C and 30–34 °C, decrease for AT > 34 °C), but for tropical and temperate cities, AT positively and linearly impacted GCE [13]. Wind speed showed negative impacts on GCM in arid and temperate cities but positively impacted GCM in tropical cities [13]. The LST-based GCE was shown to increase with the LST increase during heat waves but was almost kept stable during cold waves [8]. These studies inferred the impacts of meteorological factors on GCE by explaining the spatial variations of GCE, for example, among different cities. As different cities have distinct characteristics such as vegetation type, landscape pattern, and socioeconomic status, the relationships between GCE and meteorological factors may be misleading. Relating GCE to meteorological factors for a single city from the temporal perspective can generate more reliable results.
In addition, current understandings of GCE as well as its driving factors have mainly been gained based on LST [8,9,12,14,18,19], with limited studies focusing on AT [10,20,21]. As there are significant differences between LST and AT in terms of magnitude, seasonal and diurnal variations, as well as the driving factors [11,20,22,23,24,25], GCE estimated by AT and LST is not identical. GCE by estimated by LST is usually stronger than that by AT, for example, by an order of magnitude, and GCE by these two types of temperature has an opposite diurnal pattern, with a stronger value in the daytime by LST but a stronger value in nighttime by AT [20]. Though LST has the major advantage of data availability for long temporal and large spatial coverage, AT is increasingly recommended because it is more related to ecological processes and public health [23]. Therefore, GCE by AT should be highly strengthened.
Taking the subtropical city of Changsha, China, as an example, the objective of this study is to investigate the temporal changes in GCE by AT at a temporal resolution of the hour and uncover the non-linear response of GCE to meteorological changes. Specifically, we attempt to answer the following questions: (1) How does the hourly GCE change temporally? (2) How does the hourly GCE respond to the temporal change in meteorological variables (i.e., temperature, humidity, and wind speed)? We quantified the hourly GCE based on AT in the typical summer of August and a greenspace map derived from a spatial resolution of 1 m. The responses of GCE to meteorological variables were investigated using the Generalized Additive Model (GAM). The findings of this study can extend our understanding of the diurnal changes in GCE as well as the meteorological responses and can also help design effective strategies for local urban greenspace planning and management in an era of global meteorological change.

2. Materials and Methods

2.1. Study Area

Changsha (27°51′–28°40′ N, 111°53′–114°15′ E), the capital city of Hunan Province, is located in Central South China (Figure 1a). It has a subtropical monsoon climate with four distinct seasons. It has an annual average precipitation of 1445.3 mm and an average temperature of 18.9 °C with a maximum value of 40.8 °C in 2022. Changsha has 10.42 million people and reaches a gross domestic product of CNY 1396.6 billion with a per capita gross domestic product of CNY 13.52 thousand. Changsha is experiencing rapid urbanization, with the urbanization rate increasing from 20.5% in 1978 to 83.27% in 2022. Accompanying the rapid urban population increase is the rapid urban land expansion, with a built-up area of 577 km2 in 2022. The dominant vegetation type is subtropical evergreen broad-leaved forests, and the most common tree species is camphor (Cinnamomum camphora (L.) Presl).

2.2. Quantifying the Hourly GCE

We defined GCE as the magnitude of temperature decrease generated by a one percent greenspace coverage increase [8,9,11]. It is estimated by linear regression with AT as the dependent variable and percent greenspace coverage (PGC) as the independent variable. The linear regression is specified as follows in Equation (1):
AT = a + b* × PGC
where AT is the observed air temperature and PGC is the percent greenspace coverage surrounding the AT observation sites; a and b are regression coefficients, and the opposite value of b is treated as GCE. Hourly AT in August 2020 was observed at 36 meteorological stations set by Changsha Meteorological Bureau [26,27], and the corresponding PGC was calculated for a 50 m buffer surrounding the meteorological stations based on a 1 m resolution land cover map derived from Gaofen–2 satellite images using an object-oriented remote sensing image classification method [28]. GCE was calculated for each hour in the 31 days of August 2020. The hourly GCE was grouped as daytime (6:00 to 20:00) and nighttime (20:00 to 24:00 and 0 to 6:00), and their difference was tested by Welch’s t-test.

2.3. Exploring the Non-Linear Response of GCE to Meteorological Variables

We applied the Generalized Additive Model (GAM) to investigate the non-linear responses of GCE to meteorological variables. GAM has flexibility in fitting the relationship between dependent and independent variables by smooth functions and penalized regression splines without prior knowledge [29,30]. It has been widely applied to investigate the complex non-linear response of the dependent variable to the independent variables in multiple fields such as air pollution, climate change, human health, and others [31,32]. We specified the GAM model as follows in Equation (2):
g(y) = a + f1(AT) + f2(RHU) + f3(WIND)+ f4(HOUR)
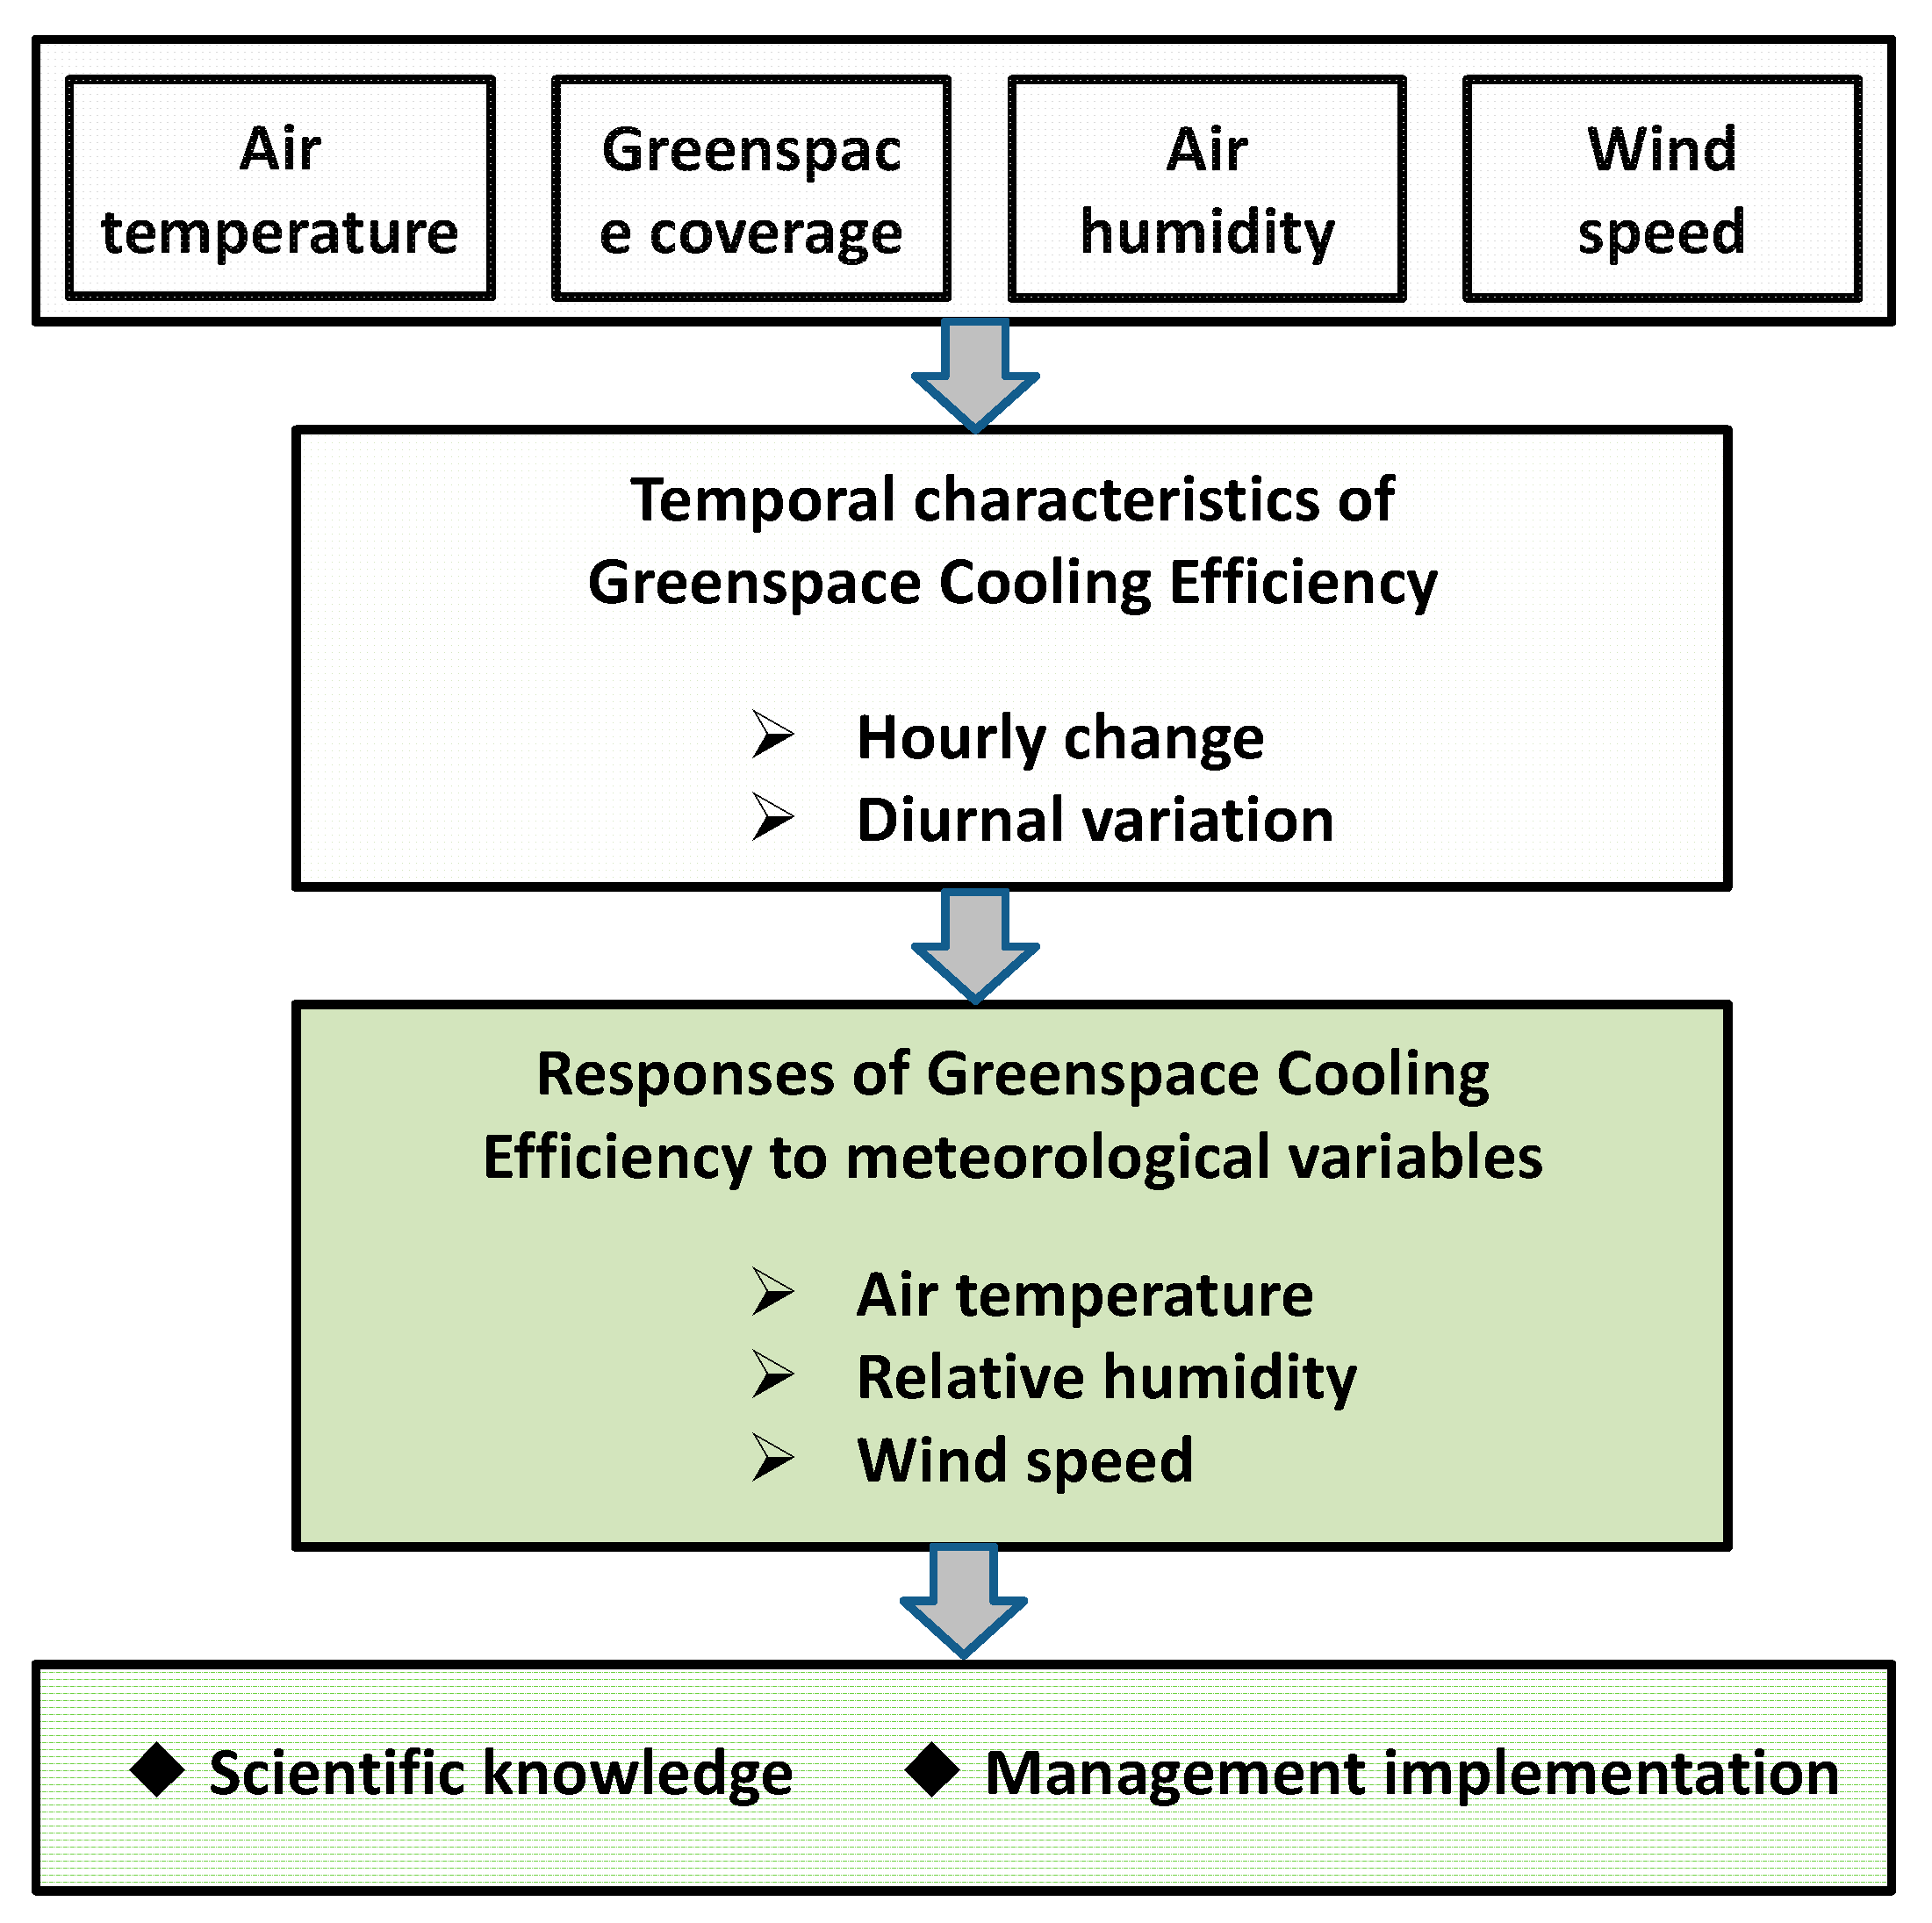
where y is the dependent variable; GCE, AT RHU, WIND, and HOUR are the independent variables for air temperature, relative humidity, wind speed, and hour, respectively; g( ) is a concatenation function; and f1, f2, f3, and f4 are smoothing functions of the linked explanatory variables. The smoothing function used in the model is cubic regression splines, which provide good smoothing effects and automatically select an appropriate number of knots, allowing the model to maintain flexibility while avoiding overfitting due to too many knots. In GAM, the effective degree of freedom is an indicator of the complexity of the response model. When the effective degree of freedom is 1, the function is a linear relationship, and when it is higher than 1, it indicates a non-linear relationship. We performed GAM using the R version 4.2.2 package of “mgcv” with the Gaussian distribution for the family parameter. Figure 2 shows the flowchart of this study.

3. Results

3.1. Temporal Variations in the Hourly GCE

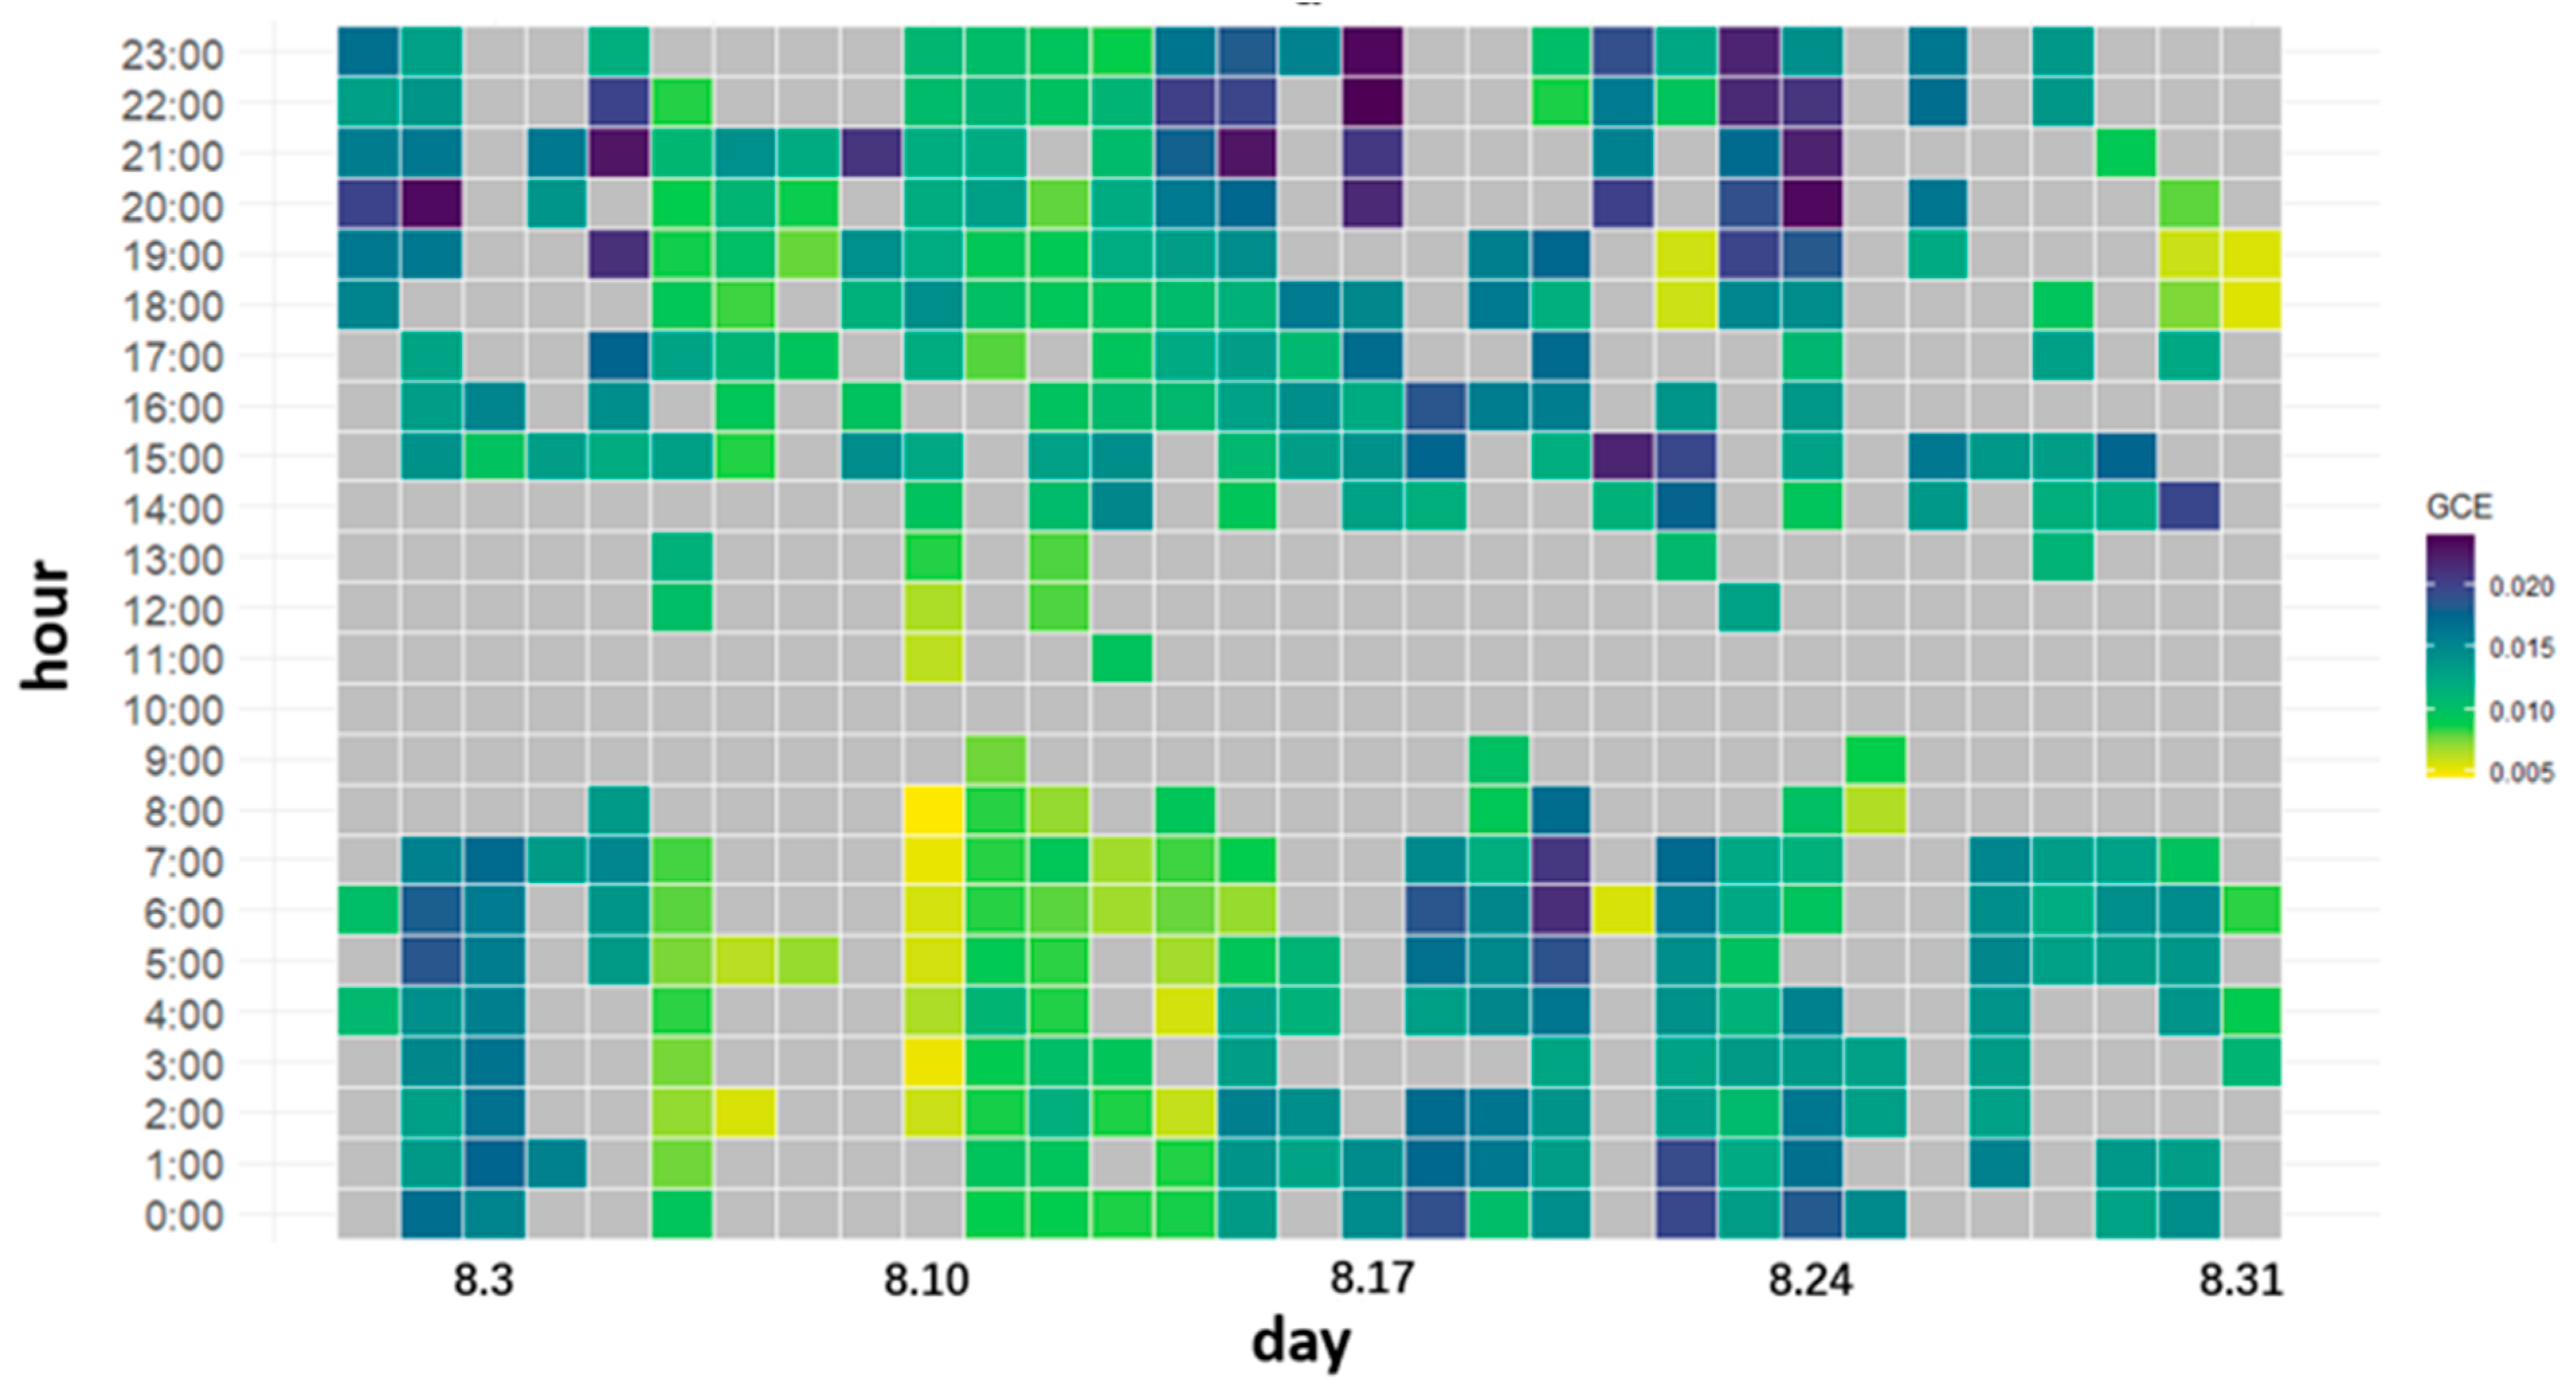
Of the 744 hourly GCE values, 365 were tested as significant (p < 0.05 for the slope of the linear regression between AT and percent greenspace coverage) (Figure 3). After excluding six outliers that were beyond three standard deviations of the average, 358 significant hourly GCE values are presented hereafter. The average GCE was 0.0128 °C with a standard deviation of 0.0041 °C. The minimum GCE was 0.0044 °C, appearing on August 10th at 8:00, and the maximum GCE was 0.024 °C, occurring on August 17th at 22:00.
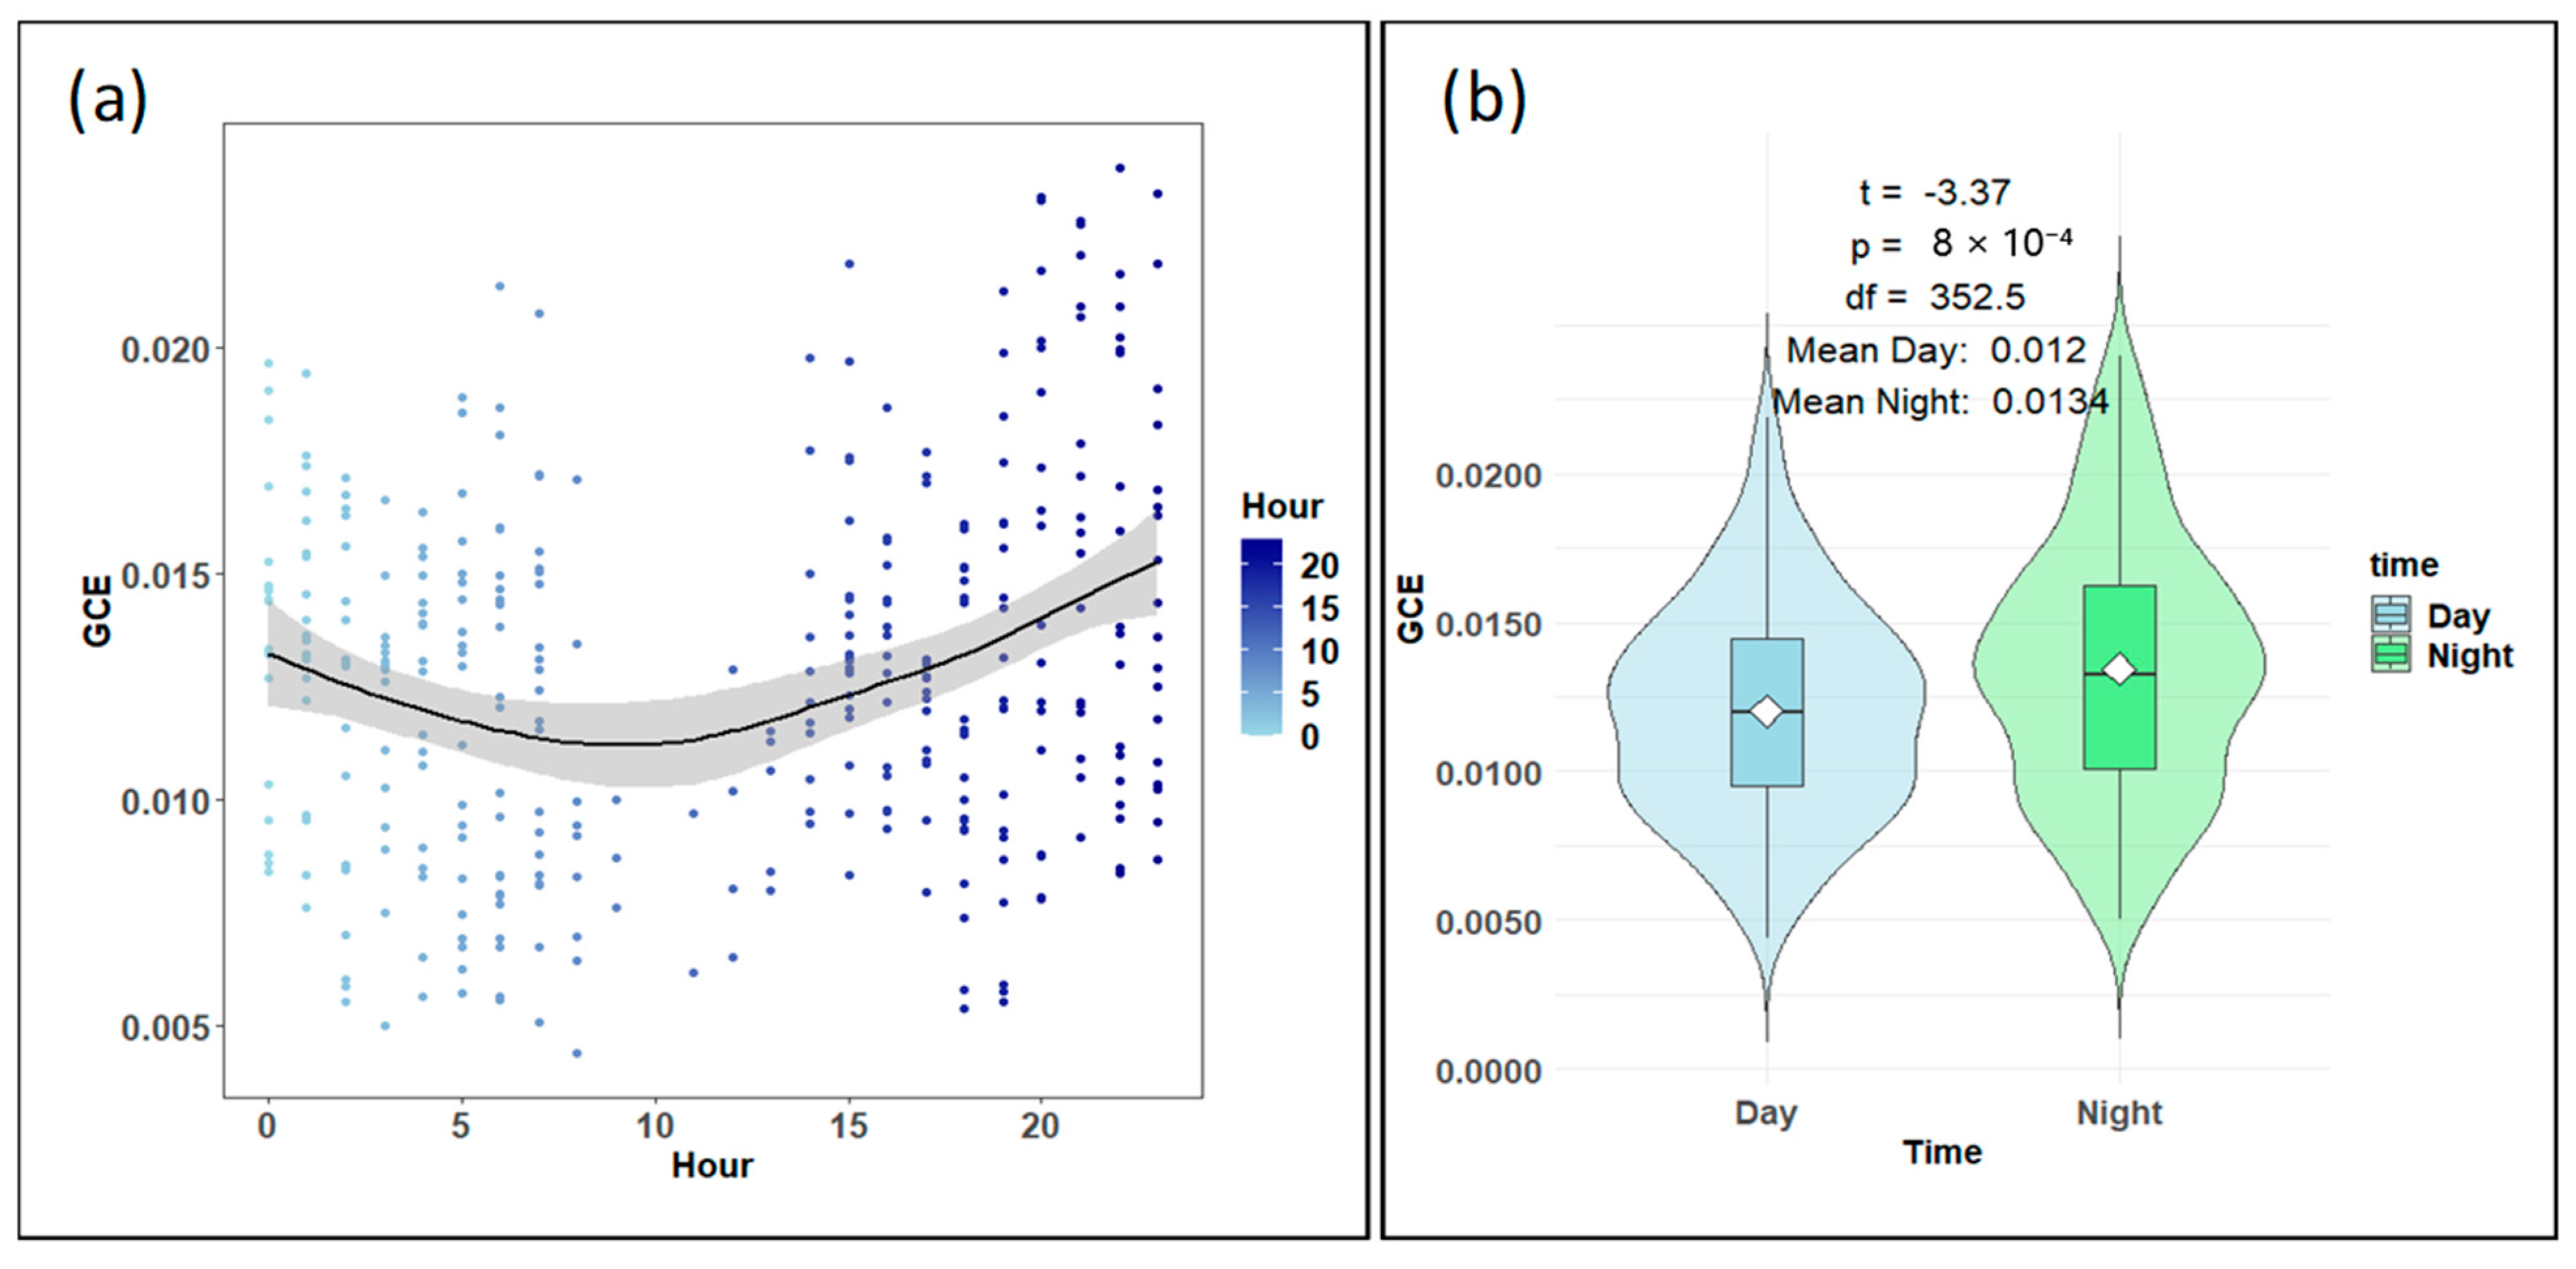
The temporal change in the hourly GCE displays a U shape, with the average minimum value appearing at around 10 pm (Figure 4a). Welch’s t-test showed that the nighttime GCE with an average of 0.0134 °C was significantly higher than the daytime GCE with an average of 0.012 °C (Figure 4b).

3.2. Non-Linear Responses of GCE to Meteorological Change

The developed GAM model showed that temperature, humidity, wind speed, and hour together explained 51.2% of the deviance of the hourly GCE with an adjusted R² of 47.8%. All three meteorological variables as well as hour were tested as significant. The Edf values of the four variables were 5.25, 4.70, 5.20, and 8.10 for temperature, humidity, wind speed, and hour, respectively, indicating strong non-linear responses of GCE to the changes in these variables (Table 1).
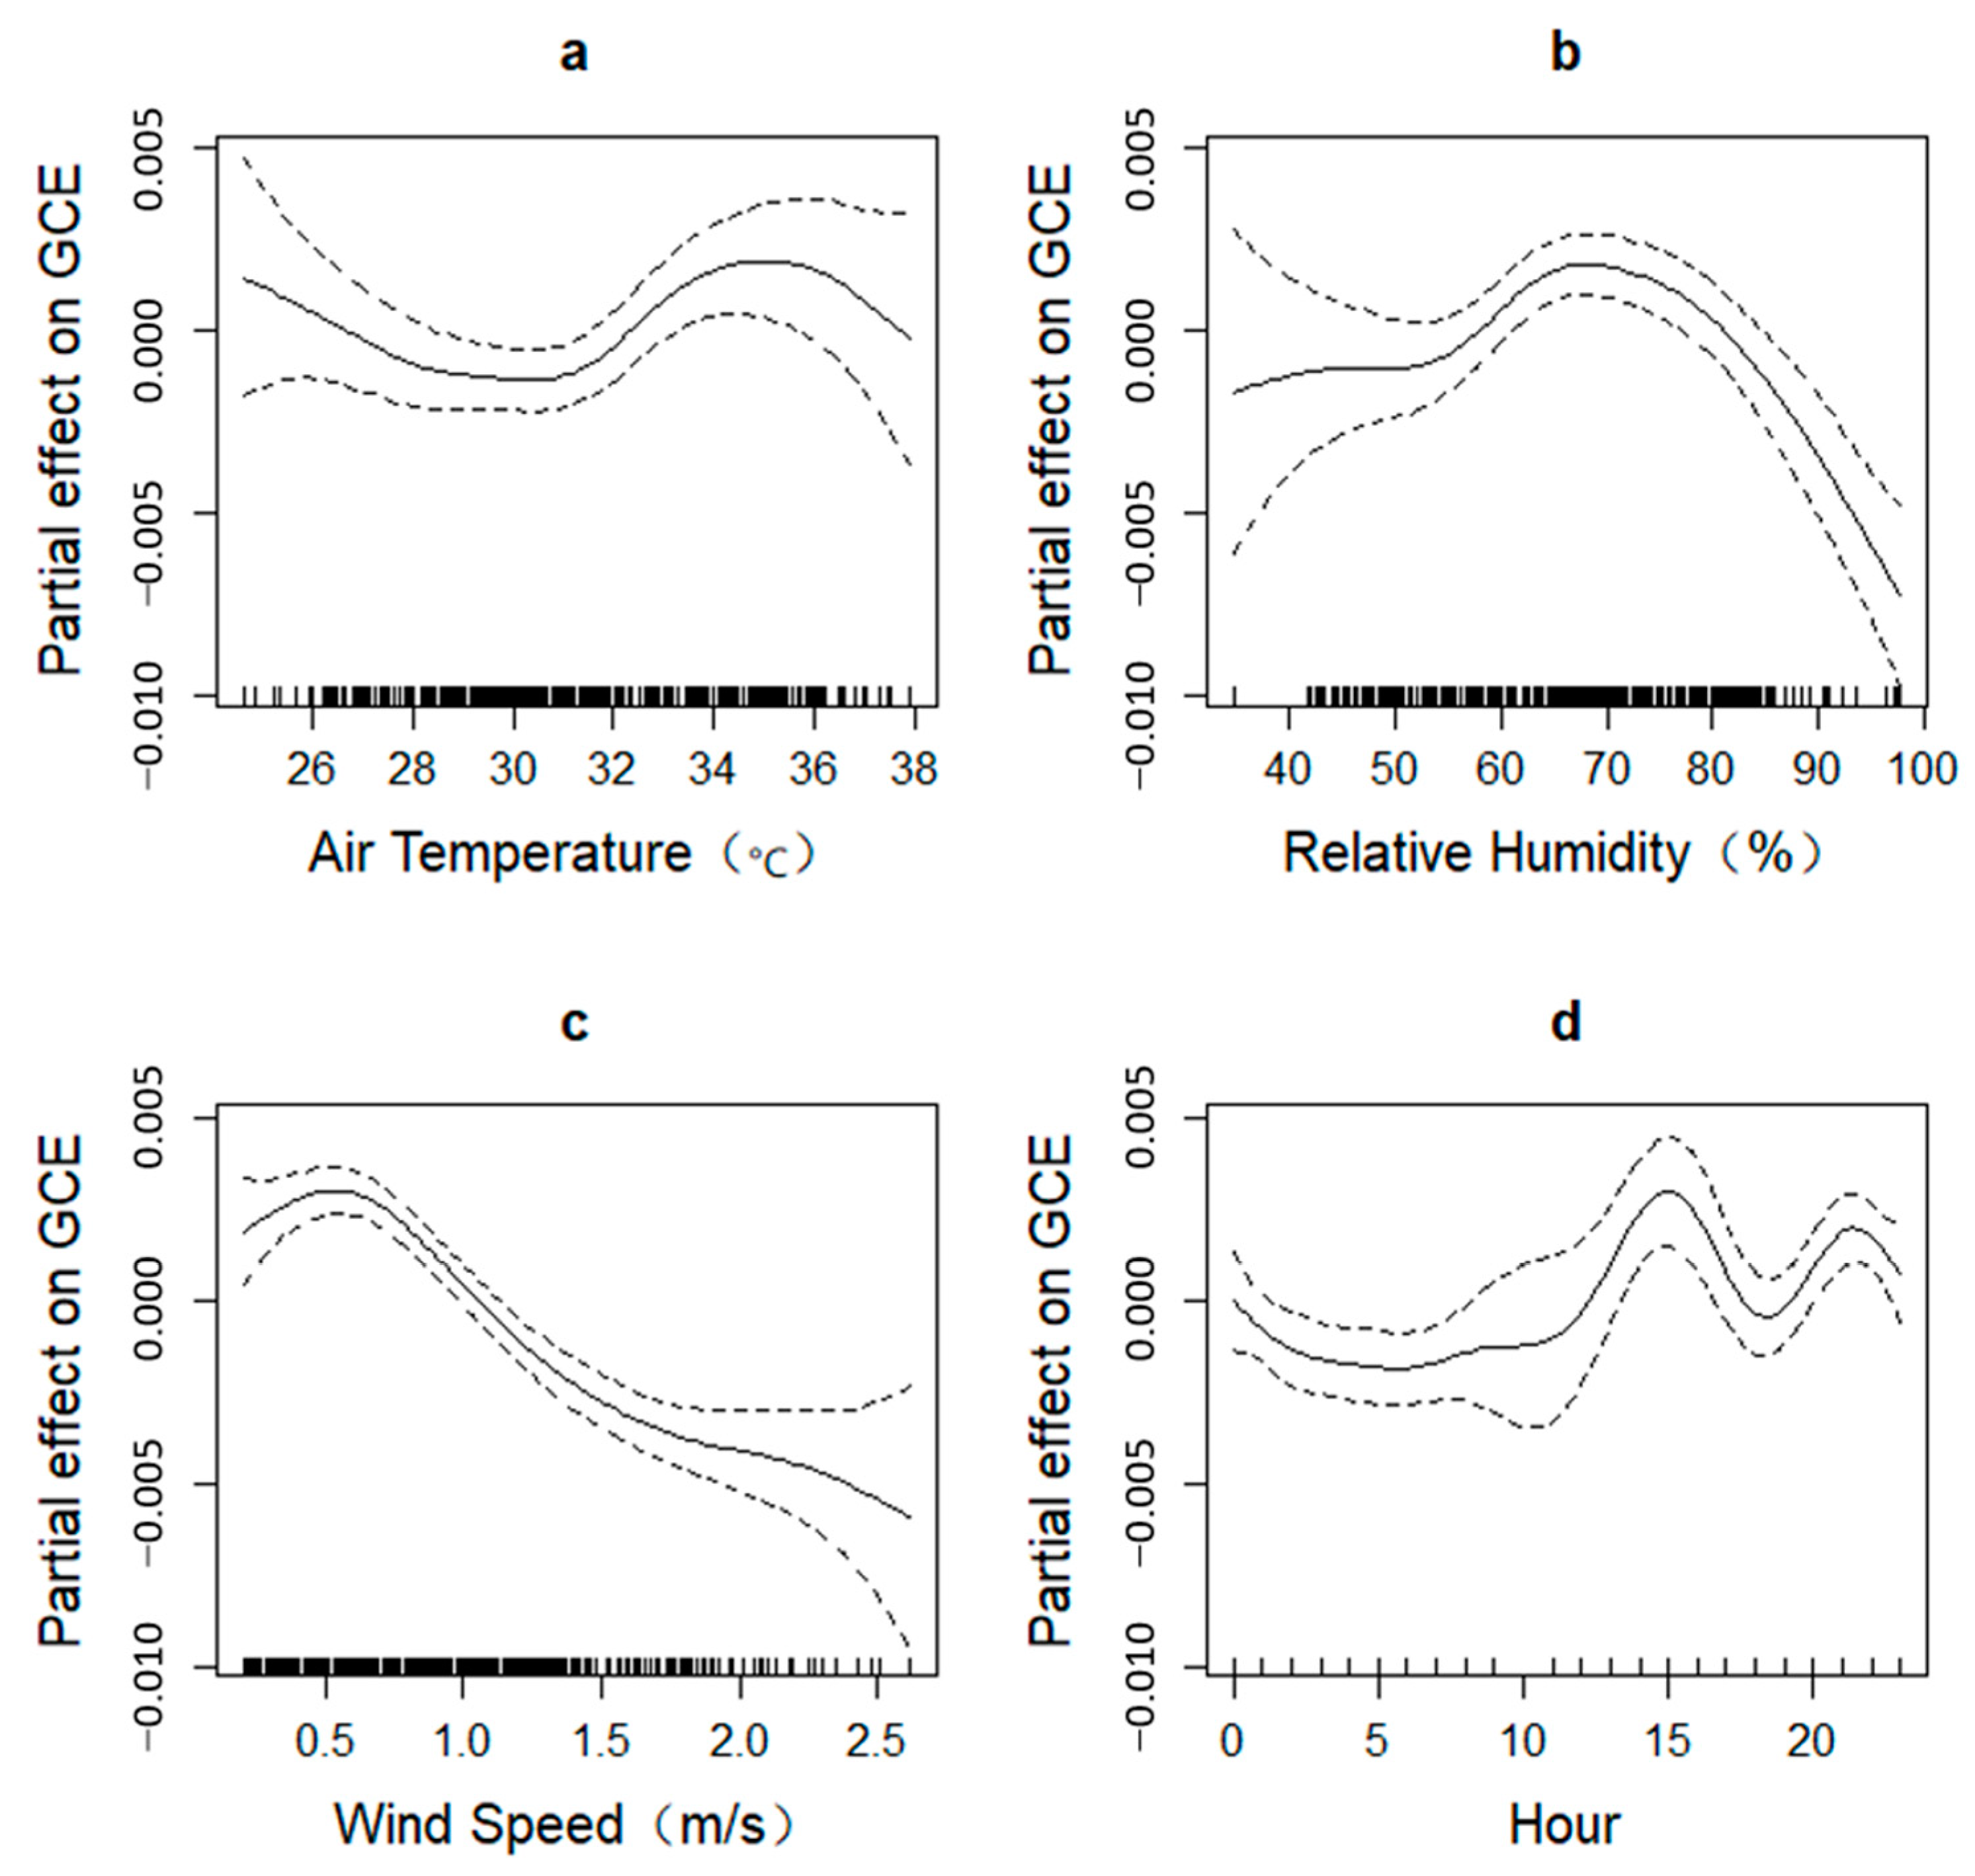
The partial effect graph shows a cubic response of GCE to AT change: decreasing (AT < 31 °C), increasing (31 °C < AT < 35 °C), and decreasing again (AT > 35 °C) (Figure 5a). GCE displayed a quadratic response to relative humidity change: increasing (relative humidity < 70%) and decreasing (relative humidity > 70%) (Figure 5b). GCE oppositely responded to wind speed change before and after 0.6 m/s (i.e., positively and negatively, respectively) (Figure 5c).

4. Discussion

4.1. Stronger Nighttime GCE than Daytime GCE

We observed significantly stronger nighttime GCE (0.0134 °C) than daytime GCE (0.012 °C) based on AT. This is consistent with previous findings. For example, a GCE of 0.056 °C was observed in the nighttime compared to that of 0.026 °C in the daytime in Beijing, China [33]. GCE of 0.008 °C at about 22:30 and 0.018 °C at about 1:30 are higher than 0.003 °C at about 13:30 and 0.006 °C at about 10:30 for the 392 European urban clusters [20]. We also found that more than half of the hourly GCE values during 8:00–12:00 am were insignificant, and none of the GCE values at 10 am during the whole month were significant. This is consistent with the widely reported insignificant relationship between greenspace coverage and temperature during daytime, for example, the maximum temperature [34] and temperature around 10 am [35,36]. The hourly change in GCE reflects the complex diurnal change of surface energy processes [26,37,38].

4.2. Non-Linear Responses of GCE to Meteorological Change

Our study showed a cubic response of GCE to temperature change (decrease, increase, then decrease), supporting previous findings of the non-linear response of GCE to temperature change observed, for example, in Africa [13], in the continental USA [12], and even in single cities [8]. We showed that GCE increased with AT increase when the AT was between 31 and 35 °C but decreased when the AT was higher than 35 °C. This is understandable, as vegetation transpiration, a major mechanism of greenspace cooling, had a non-linear response to temperature change. Generally, temperature increases can enhance vegetation transpiration by inducing stomata to open. However, with further temperature increases, the increased transpiration will cause a water deficit, and vegetation will close leaf stomata to avoid water stress [12,39,40,41].
We also observed a negative response of GCE to temperature increase when the AT was lower than 28 °C. Wang et al. reported negative responses of GCE to temperature increase when the temperature was lower than a certain threshold, which varies among different biomes in the continental USA [12]. It is suggested that GCE can be jointly explained by two temperature cooling regimes (transpiration cooling and pseudo-cooling) [8]. We speculated that the negative response of GCE to temperature increase when the AT is lower than 28 °C, observed in this study, is caused by the anthropogenic heat estimation that generated the pseudo-GCE [8].
We showed that the GCE response to relative humidity increase follows an inverted U-shaped pattern. The non-linear response of GCE to humidity change was widely reported in other studies [13,42]. In a dry environment with very low relative humidity, vegetation will close the stoma to avoid water loss and result in low GCE [12]. Higher humidity usually indicates more water availability, which can facilitate transpiration and enhance GCE. However, extremely high relative humidity (for example, higher than 70% in this study) will decrease the vapor pressure deficit between leaf stoma and air and then decrease transpiration, as well as GCE [9,43].
We found that GCE also non-linearly responds to wind speed change, which is consistent with previous studies [12,44]. Wind speed positively impacted GCE when it was lower than 0.6 m/s in this study. A global study based on LST showed that wind speed can enhance GCE when it does not surpass 0.8 m/s [9]. Wind can accelerate the energy exchange between leaves and the surrounding air and thus increase transpiration cooling in the gentle breeze [44,45]. However, strong wind will reduce leaf temperature, resulting in leaf stoma closing and a decrease in transpiration cooling [46].

4.3. Limitations and Future Research Recommendations

First, this study only investigated the hourly GCE and its non-linear response to meteorological variables in a subtropical Chinese city. As GCE, including the magnitude, the temporal changes, and the driving forces, is sensitive to many factors, such as vegetation type and urban development stage [8,13,14], similar studies in other cities are strongly recommended. Second, this study only investigated the hourly change in GCE in the hot summer. Because both AT and vegetation activity have strong seasonal rhythms [47], further investigation of the seasonal changes in GCE should be studied. Third, the non-linear response of GCE to meteorological variables was investigated. Other driving factors such as landscape pattern, greenspace coverage, land use type and intensity, greenspace management strategy, and socioeconomic status should be explicitly studied as driving forces of GCE to help local governments to better plan and manage greenspaces for cooler cities [11,48,49,50]. Fourth, we showed that the daytime GCE was lower than the nighttime GCE by using AT, which is opposite to the widely reported results by using LST. Explicitly comparing the diurnal pattern of GCE based on simultaneously monitored AT and LST is still lacking [20]. We strongly recommend explicitly comparing GCE based on AT and LST at a high temporal resolution to investigate the different mechanisms that control the different diurnal changes in GCE by these two types of temperatures.

5. Conclusions

This study uncovered the temporal variations in the hourly GCE with significantly stronger GCE in the daytime than in the nighttime in the summer of Changsha, China. GCE non-linearly responded to meteorological variables (i.e., temperature, relative humidity, and wind speed). Meteorological changes can enhance GCE when they do not surpass the thresholds (e.g., 35 °C for temperature, 70% for relative humidity, and 0.6 m/s for wind speed) but decrease GCE when they surpass these thresholds. In an era of rapid global climate change and urbanization-induced local urban warming, these findings can help quantitatively predict GCE in the future and help design effective solutions to cope with these changes. For example, expanding greenspace coverage, as well as additional strategies such as optimizing the spatial configuration of greenspaces [51,52], developing green buildings [53,54], and applying high reflectance paving [55], should be a priority action in areas where the AT is higher than 35 °C currently and will be in the future for Changsha and cities with similar climates.

Author Contributions

Y.L.: Data Curation, Formal Analysis, Investigation, Methodology, Resources, Validation, Visualization, Writing—Original Draft; W.W.: Data Curation, Investigation, Validation, Visualization; X.L. (Xin Li): Data Curation, Investigation, Validation, Visualization; W.L.: Investigation, Validation, Visualization; X.L. (Xiaoma Li): Conceptualization, Data Curation, Formal Analysis, Funding Acquisition, Investigation, Methodology, Project Administration, Resources, Supervision, Validation, Visualization, Writing—Original Draft, Writing—Review and Editing. All authors have read and agreed to the published version of the manuscript.

Funding

This research was funded by the National Natural Science Foundation of China, grant number 32371655 and 32001161.

Institutional Review Board Statement

Not applicable.

Informed Consent Statement

Not applicable.

Data Availability Statement

Data will be made available upon request.

Acknowledgments

We would like to thank the anonymous reviewers for their constructive comments and suggestions and the many colleagues and organizations that shared the data used in this project. The views and opinions expressed in this paper are those of the authors alone. All authors have read and agreed to the published version of the manuscript.

Conflicts of Interest

The authors declare no conflicts of interest.

References

  1. Zhang, K.; Cao, C.; Chu, H.; Zhao, L.; Zhao, J.; Lee, X. Increased heat risk in wet climate induced by urban humid heat. Nature 2023, 617, 738–742. [Google Scholar] [CrossRef]
  2. Ho, J.Y.; Shi, Y.; Lau, K.K.L.; Ng, E.Y.Y.; Ren, C.; Goggins, W.B. Urban heat island effect-related mortality under extreme heat and non-extreme heat scenarios: A 2010–2019 case study in Hong Kong. Sci. Total Environ. 2023, 858, 159791. [Google Scholar] [CrossRef] [PubMed]
  3. Li, X.; Zhou, Y.; Yu, S.; Jia, G.; Li, H.; Li, W. Urban heat island impacts on building energy consumption: A review of approaches and findings. Energy 2019, 174, 407–419. [Google Scholar] [CrossRef]
  4. Roxon, J.; Ulm, F.J.; Pellenq, R.J.M. Urban heat island impact on state residential energy cost and CO2 emissions in the United States. Urban Clim. 2020, 31, 100546. [Google Scholar] [CrossRef]
  5. Schwaab, J.; Meier, R.; Mussetti, G.; Seneviratne, S.; Burgi, C.; Davin, E.L. The role of urban trees in reducing land surface temperatures in European cities. Nat. Commun. 2021, 12, 6763. [Google Scholar] [CrossRef]
  6. Gilligan, C. Cooling effects of urban trees are strongest in under-resourced neighbourhoods. Nat. Rev. Earth Environ. 2023, 4, 517. [Google Scholar] [CrossRef]
  7. Su, Y.; Wu, J.; Zhang, C.; Wu, X.; Li, Q.; Liu, L.; Bi, C.; Zhang, H.; Lafortezza, R.; Chen, X. Estimating the cooling effect magnitude of urban vegetation in different climate zones using multi-source remote sensing. Urban Clim. 2022, 43, 101155. [Google Scholar] [CrossRef]
  8. Wang, C.; Wang, Z.-H.; Wang, C.; Myint, S.W. Environmental cooling provided by urban trees under extreme heat and cold waves in U.S. cities. Remote Sens. Environ. 2019, 227, 28–43. [Google Scholar] [CrossRef]
  9. Zhao, J.; Zhao, X.; Wu, D.; Meili, N.; Fatichi, S. Satellite-based evidence highlights a considerable increase of urban tree cooling benefits from 2000 to 2015. Glob. Change Biol. 2023, 29, 3085–3097. [Google Scholar] [CrossRef]
  10. Ibsen, P.C.; Crawford, B.R.; Corro, L.M.; Bagstad, K.J.; McNellis, B.E.; Jenerette, G.D.; Diffendorfer, J.E. Urban tree cover provides consistent mitigation of extreme heat in arid but not humid cities. Sustain. Cities Soc. 2024, 113, 105677. [Google Scholar] [CrossRef]
  11. Zhan, W.; Wang, C.; Wang, S.; Li, L.; Ji, Y.; Du, H.; Huang, F.; Jiang, S.; Liu, Z.; Fu, H. Fraction-dependent variations in cooling efficiency of urban trees across global cities. ISPRS J. Photogramm. Remote Sens. 2024, 216, 229–239. [Google Scholar] [CrossRef]
  12. Wang, J.; Zhou, W.; Jiao, M.; Zheng, Z.; Ren, T.; Zhang, Q. Significant effects of ecological context on urban trees’ cooling efficiency. ISPRS J. Photogramm. Remote Sens. 2020, 159, 78–89. [Google Scholar] [CrossRef]
  13. Cheng, X.; Peng, J.; Dong, J.; Liu, Y.; Wang, Y. Non-linear effects of meteorological variables on cooling efficiency of African urban trees. Environ. Int. 2022, 169, 107489. [Google Scholar] [CrossRef] [PubMed]
  14. Leng, S.; Sun, R.; Yan, M.; He, H.; Chen, L. Interannual variability and spatial diversification of global urban tree cooling effects. Environ. Int. 2024, 192, 109044. [Google Scholar] [CrossRef] [PubMed]
  15. Wu, W.; Guo, F.; Elze, S.; Knopp, J.; Banzhaf, E. Deciphering the effects of 2D/3D urban morphology on diurnal cooling efficiency of urban green space. Build. Environ. 2024, 266, 112047. [Google Scholar] [CrossRef]
  16. Yang, L.; Ge, J.; Cao, Y.; Liu, Y.; Luo, X.; Wang, S.; Guo, W. Enhanced Cooling Efficiency of Urban Trees on Hotter Summer Days in 70 Cities of China. Adv. Atmos. Sci. 2024, 41, 2259–2275. [Google Scholar] [CrossRef]
  17. Ouyang, W.; Morakinyo, T.E.; Ren, C.; Ng, E. The cooling efficiency of variable greenery coverage ratios in different urban densities: A study in a subtropical climate. Build. Environ. 2020, 174, 106772. [Google Scholar] [CrossRef]
  18. Alonzo, M.; Baker, M.E.; Gao, Y.; Shandas, V. Spatial configuration and time of day impact the magnitude of urban tree canopy cooling. Environ. Res. Lett. 2021, 16, 084028. [Google Scholar] [CrossRef]
  19. Wang, J.; Zhou, W.; Jiao, M. Location matters: Planting urban trees in the right places improves cooling. Front. Ecol. Environ. 2022, 20, 147–151. [Google Scholar] [CrossRef]
  20. Du, M.; Li, N.; Hu, T.; Yang, Q.; Chakraborty, T.C.; Venter, Z.; Yao, R. Daytime cooling efficiencies of urban trees derived from land surface temperature are much higher than those for air temperature. Environ. Res. Lett. 2024, 19, 044037. [Google Scholar] [CrossRef]
  21. Ibsen, P.C.; Borowy, D.; Dell, T.; Greydanus, H.; Gupta, N.; Hondula, D.M.; Meixner, T.; Santelmann, M.V.; Shiflett, S.A.; Sukop, M.C.; et al. Greater aridity increases the magnitude of urban nighttime vegetation-derived air cooling. Environ. Res. Lett. 2021, 16, 034011. [Google Scholar] [CrossRef]
  22. Shen, P.; Zhao, S.; Zhou, D.; Lu, B.; Han, Z.; Ma, Y.; Wang, Y.; Zhang, C.; Shi, C.; Song, L.; et al. Surface and canopy urban heat island disparities across 2064 urban clusters in China. Sci. Total Environ. 2024, 955, 177035. [Google Scholar] [CrossRef] [PubMed]
  23. Venter, Z.S.; Chakraborty, T.; Lee, X. Crowdsourced air temperatures contrast satellite measures of the urban heat island and its mechanisms. Sci. Adv. 2021, 7, eabb9569. [Google Scholar] [CrossRef] [PubMed]
  24. Cao, J.; Zhou, W.; Zheng, Z.; Ren, T.; Wang, W. Within-city spatial and temporal heterogeneity of air temperature and its relationship with land surface temperature. Landsc. Urban Plan. 2021, 206, 103979. [Google Scholar] [CrossRef]
  25. Naserikia, M.; Hart, M.A.; Nazarian, N.; Bechtel, B.; Lipson, M.; Nice, K.A. Land surface and air temperature dynamics: The role of urban form and seasonality. Sci. Total Environ. 2023, 905, 167306. [Google Scholar] [CrossRef]
  26. Tian, Q.; Qiu, Q.; Wang, Z.; Cai, Z.; Hu, L.; Liu, H.; Feng, Y.; Li, X. Spatial Configuration of Urban Greenspace Affects Summer Air Temperature: Diurnal Variations and Scale Effects. Atmosphere 2023, 14, 1433. [Google Scholar] [CrossRef]
  27. Li, X.; Li, X.; Guldmann, J.-M.; Cai, Z.; Liao, W.; Yang, C.; Qiu, Q. A novel approach to identify the microclimatic edge effect width of urban green spaces at the landscape level: A case study of Changsha, China. Urban For. Urban Green. 2024, 99, 128462. [Google Scholar] [CrossRef]
  28. Hu, L.; Fan, C.; Cai, Z.; Liao, W.; Li, X. Greening residential quarters in China: What are the roles of urban form, socioeconomic factors, and biophysical context? Urban For. Urban Green. 2023, 86, 128020. [Google Scholar] [CrossRef]
  29. Ziter, C.D.; Pedersen, E.J.; Kucharik, C.J.; Turner, M.G. Scale-dependent interactions between tree canopy cover and impervious surfaces reduce daytime urban heat during summer. Proc. Natl. Acad. Sci. USA 2019, 116, 7575–7580. [Google Scholar] [CrossRef]
  30. Diederich, A. Generalized additive models. An introduction with R. J. Math. Psychol. 2007, 51, 339. [Google Scholar]
  31. Ravindra, K.; Rattan, P.; Mor, S.; Aggarwal, A.N. Generalized additive models: Building evidence of air pollution, climate change and human health. Environ. Int. 2019, 132, 104987. [Google Scholar] [CrossRef]
  32. Magazzino, C.; Mele, M.; Schneider, N. The relationship between air pollution and COVID-19-related deaths: An application to three French cities. Appl. Energy 2020, 279, 115835. [Google Scholar] [CrossRef] [PubMed]
  33. Yan, H.; Dong, L. The impacts of land cover types on urban outdoor thermal environment: The case of Beijing, China. J. Environ. Health Sci. Eng. 2015, 13, 43. [Google Scholar] [CrossRef] [PubMed]
  34. Howe, D.A.; Hathaway, J.M.; Ellis, K.N.; Mason, L.R. Spatial and temporal variability of air temperature across urban neighborhoods with varying amounts of tree canopy. Urban For. Urban Green. 2017, 27, 109–116. [Google Scholar] [CrossRef]
  35. Shiflett, S.A.; Liang, L.L.; Crum, S.M.; Feyisa, G.L.; Wang, J.; Jenerette, G.D. Variation in the urban vegetation, surface temperature, air temperature nexus. Sci. Total Environ. 2017, 579, 495–505. [Google Scholar] [CrossRef]
  36. Kotharkar, R.; Dongarsane, P.; Keskar, R. Determining influence of urban morphology on air temperature and heat index with hourly emphasis. Build. Environ. 2023, 233, 110044. [Google Scholar] [CrossRef]
  37. Sheng, L.; Tang, X.; You, H.; Gu, Q.; Hu, H. Comparison of the urban heat island intensity quantified by using air temperature and Landsat land surface temperature in Hangzhou, China. Ecol. Indic. 2017, 72, 738–746. [Google Scholar] [CrossRef]
  38. Wang, K.; Jiang, S.; Wang, J.; Zhou, C.; Wang, X.; Lee, X. Comparing the diurnal and seasonal variabilities of atmospheric and surface urban heat islands based on the Beijing urban meteorological network. J. Geophys. Res. Atmos. 2017, 122, 2131–2154. [Google Scholar] [CrossRef]
  39. Jiao, M.; Zhou, W.; Zheng, Z.; Wang, J.; Qian, Y. Patch size of trees affects its cooling effectiveness: A perspective from shading and transpiration processes. Agric. For. Meteorol. 2017, 247, 293–299. [Google Scholar] [CrossRef]
  40. Kjelgren, R.; Montague, T. Urban tree transpiration over turf and asphalt surfaces. Atmos. Environ. 1998, 32, 35–41. [Google Scholar] [CrossRef]
  41. Mao, Q.; Peng, J.; Wang, Y. Resolution Enhancement of Remotely Sensed Land Surface Temperature: Current Status and Perspectives. Remote Sens. 2021, 13, 1306. [Google Scholar] [CrossRef]
  42. Yang, Q.; Huang, X.; Tong, X.; Xiao, C.; Yang, J.; Liu, Y.; Cao, Y. Global assessment of urban trees’ cooling efficiency based on satellite observations. Environ. Res. Lett. 2022, 17, 034029. [Google Scholar] [CrossRef]
  43. Konarska, J.; Uddling, J.; Holmer, B.; Lutz, M.; Lindberg, F.; Pleijel, H.; Thorsson, S. Transpiration of urban trees and its cooling effect in a high latitude city. Int. J. Biometeorol. 2016, 60, 159–172. [Google Scholar] [CrossRef] [PubMed]
  44. Cheng, X.; Liu, Y.; Dong, J.; Corcoran, J.; Peng, J. Opposite climate impacts on urban green spaces’ cooling efficiency around their coverage change thresholds in major African cities. Sustain. Cities Soc. 2023, 88, 104254. [Google Scholar] [CrossRef]
  45. Gunawardena, K.R.; Wells, M.J.; Kershaw, T. Utilising green and bluespace to mitigate urban heat island intensity. Sci. Total Environ. 2017, 584–585, 1040–1055. [Google Scholar] [CrossRef] [PubMed]
  46. Yu, Z.; Xu, S.; Zhang, Y.; Jorgensen, G.; Vejre, H. Strong contributions of local background climate to the cooling effect of urban green vegetation. Sci. Rep. 2018, 8, 67–98. [Google Scholar] [CrossRef]
  47. Luo, J.; Xu, T.; Yan, C. Seasonal variation in vegetation cooling effect and its driving factors in a subtropical megacity. Build. Environ. 2024, 266, 112065. [Google Scholar] [CrossRef]
  48. Jiao, M.; Jenerette, G.D.; Zhou, W.; Wang, J.; Zheng, Z. Adaptive shading: How microclimates and surface types amplify tree cooling effects? Urban For. Urban Green. 2024, 101, 128546. [Google Scholar] [CrossRef]
  49. Jung, M.C.; Dyson, K.; Alberti, M. Urban Landscape Heterogeneity Influences the Relationship between Tree Canopy and Land Surface Temperature. Urban For. Urban Green. 2020, 57, 126930. [Google Scholar] [CrossRef]
  50. He, C.; Zhou, L.; Yao, Y.; Ma, W.; Kinney, P.L. Cooling effect of urban trees and its spatiotemporal characteristics: A comparative study. Build. Environ. 2021, 204, 108103. [Google Scholar] [CrossRef]
  51. Li, M.; Liu, H. Enhancing the cooling effect of urban green infrastructure: An empirical analysis of interactive impacts and optimizing pathways over 310 Chinese cities. Landsc. Urban Plan. 2025, 259, 105344. [Google Scholar] [CrossRef]
  52. Liao, W.; Guldmann, J.-M.; Hu, L.; Cao, Q.; Gan, D.; Li, X. Linking urban park cool island effects to the landscape patterns inside and outside the park: A simultaneous equation modeling approach. Landsc. Urban Plan. 2023, 232, 104681. [Google Scholar] [CrossRef]
  53. Bungau, C.C.; Hanga Prada, F.I.; Bungau, T.; Bungau, C.; Bendea, G.; Prada, M.F. Web of Science Scientometrics on the Energy Efficiency of Buildings to Support Sustainable Construction Policies. Sustainability 2023, 15, 8772. [Google Scholar] [CrossRef]
  54. Bungau, C.C.; Bungau, T.; Prada, I.F.; Prada, M.F. Green Buildings as a Necessity for Sustainable Environment Development: Dilemmas and Challenges. Sustainability 2022, 14, 13121. [Google Scholar] [CrossRef]
  55. Wong, T.L.X.; Lim, E.L.; Mohd Hasan, M.R.; Sougui, O.O.; Milad, A.; Qu, X. Effectiveness of heat-reflective asphalt pavements in mitigating urban heat islands: A systematic literature review. J. Road Eng. 2024, 4, 399–420. [Google Scholar] [CrossRef]
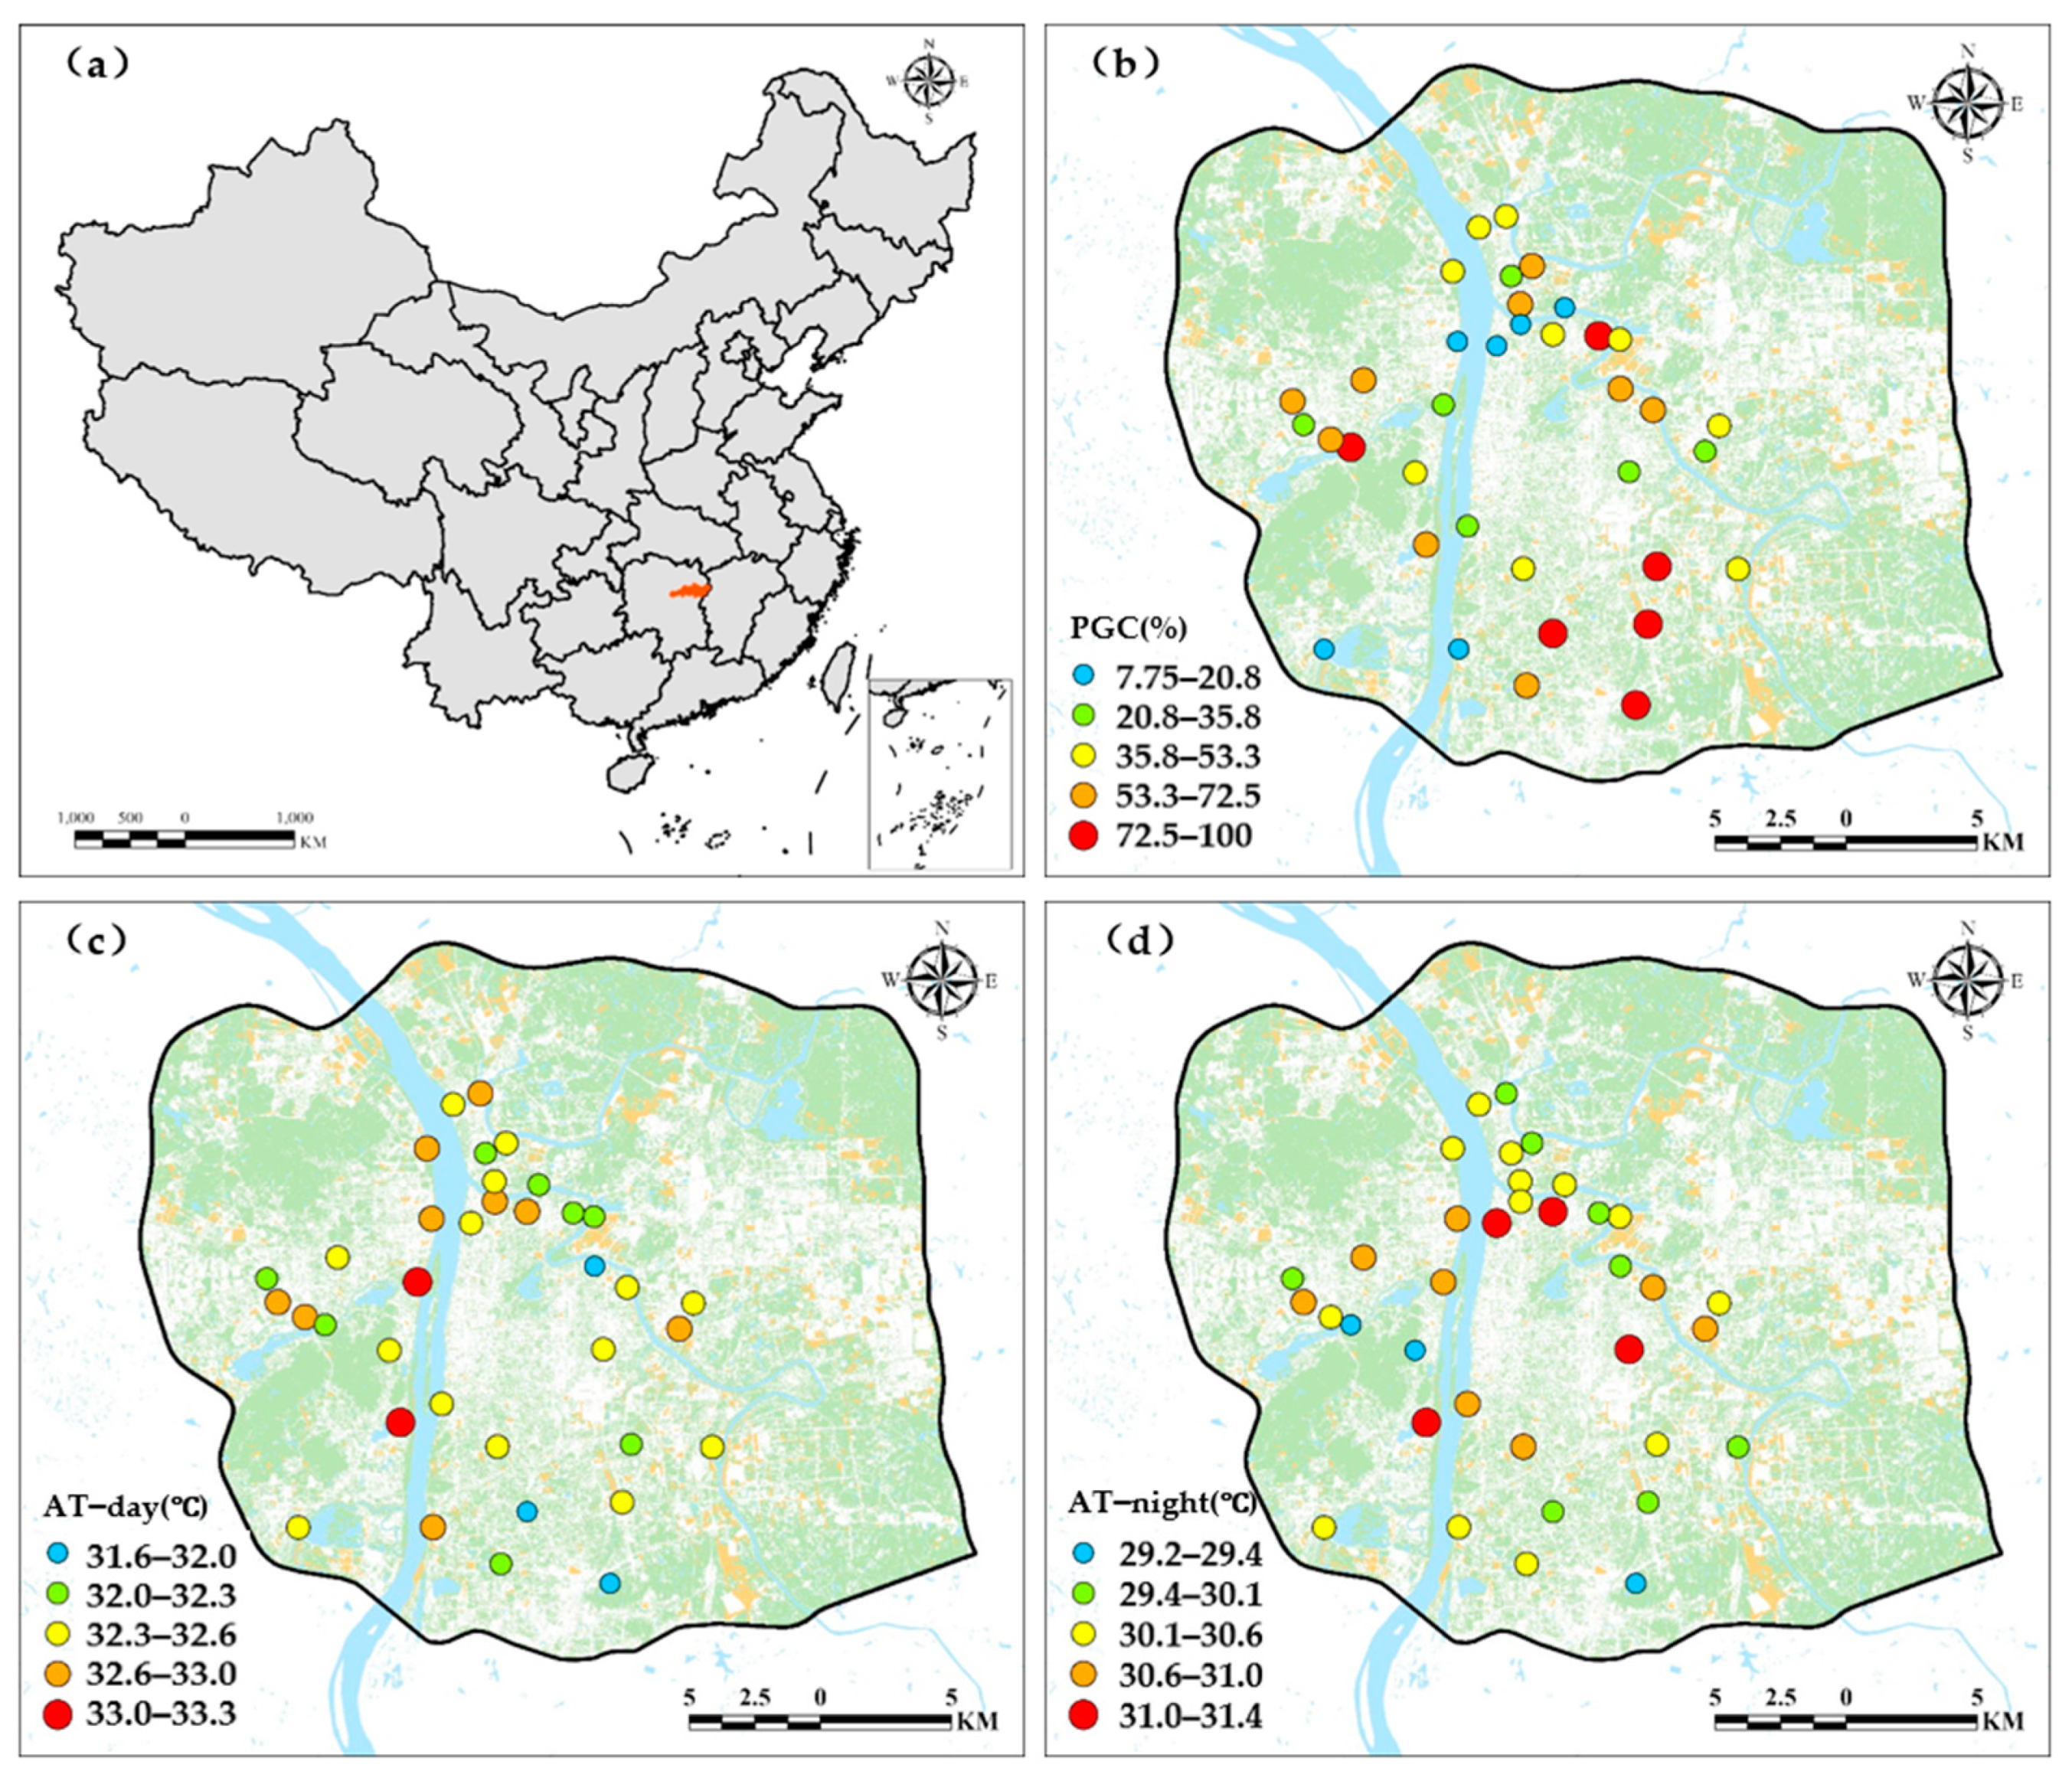
Figure 1. Location of Changsha City in China (a); percent greenspace coverage (%) within 50 m buffer around the meteorological stations (b); average daytime AT (°C) (c) and average nighttime AT (°C) (d) at each meteorological station.
Atmosphere 16 00527 g001
Figure 2. Flowchart of this study.
Atmosphere 16 00527 g002
Figure 3. Temporal distribution of the hourly GCE (°C%−1).
Atmosphere 16 00527 g003
Figure 4. Temporal change in the hourly GCE (a) and comparison of daytime and nighttime GCE (b).
Atmosphere 16 00527 g004
Figure 5. Partial effects on GCE for air temperature (a), relative humidity (b), wind speed (c), and hour of day (d).
Atmosphere 16 00527 g005
Table 1. Summary of the GAM.
Smoothed VariableEdfRef. dfp-ValueF-ValueAdjust R2Deviance Explained (%)
Air temperature5.2036.4130.01024 *2.7870.47851.2
Relative humidity5.2506.449<2 × 10⁻¹⁶ ***8.931
Wind speed4.7005.798<2 × 10⁻¹⁶ ***27.464
Hour8.0998.7661.03 × 10−6 ***5.529
* p < 0.05, *** p < 0.001.
Disclaimer/Publisher’s Note: The statements, opinions and data contained in all publications are solely those of the individual author(s) and contributor(s) and not of MDPI and/or the editor(s). MDPI and/or the editor(s) disclaim responsibility for any injury to people or property resulting from any ideas, methods, instructions or products referred to in the content.