Article

Red-Hot Portugal: Mapping the Increasing Severity of Exceptional Maximum Temperature Events (1980–2024)

by
Luis Angel Espinosa
1,* and
Maria Manuela Portela
2
1
Associação do Instituto Superior Técnico para a Investigação e Desenvolvimento (IST-ID), Civil Engineering Research and Innovation for Sustainability (CERIS), Avenida António José de Almeida 12, 1000-043 Lisbon, Portugal
2
Instituto Superior Técnico (IST), Civil Engineering Research and Innovation for Sustainability (CERIS), Av. Rovisco Pais 1, 1049-001 Lisbon, Portugal
*
Author to whom correspondence should be addressed.
Atmosphere 2025, 16(5), 514; https://doi.org/10.3390/atmos16050514
Submission received: 7 March 2025 / Revised: 18 April 2025 / Accepted: 24 April 2025 / Published: 28 April 2025
(This article belongs to the Section Climatology)

Abstract

:
This study examines exceptional maximum temperature (Tmax) events in mainland Portugal (1980–2024) using ERA5-Land reanalysis data at 1012 locations. To assess changes in the occurrence and temperature excess of exceptional events across two 22-year subperiods (or phases), percentile-based thresholds were adopted. An inventive severity heatmap is used to illustrate exceptional Tmax changes between the two phases, which constitutes an addition to climate change research. Locations are categorised in the heatmap according to whether they experienced (i) more occurrences and more temperature excess, (ii) more occurrences but less temperature excess, (iii) fewer occurrences but more temperature excess, or (iv) fewer occurrences and less temperature excess. From the historical (1980–2002) to the contemporary (2002–2024) phase, results indicate a significant increase in the severity of extreme heat, particularly in central and southern Portugal, with over 90% of locations exhibiting a rise in exceptional event occurrences. While the Student’s t-test indicated significant differences in both occurrence and temperature excess between the phases, Sen’s slope estimation showed steady upward trends. The results point to crucial regions in the interior and southern Portugal that have warmed the most, posing growing threats to agriculture, human health, and water resources. Although slight cooling trends were observed in a few northern and central coastal regions, the overall pattern highlights an increase in extreme heat. This research is particularly relevant given the recent changes in exceptional Tmax identified in Portugal, aligning with broader climate change patterns and trends.

1. Introduction

Climate change is driving shifts in patterns of temperature at the global scale, with increasing frequency and intensity of heatwaves, changing seasonal cycles, and exacerbating extreme weather events [1,2,3]. The Mediterranean region, and in particular, mainland Portugal (89,015 km 2 ), is especially susceptible to these changes, with worsening heatwaves, longer droughts, and altered rainfall patterns and totals. The dynamics of exceptionally high maximum temperature (Tmax) is not well understood, which hampers effective practices of climate adaptation and disaster risk reduction in response to extreme heat events. The growing occurrence and intensity of extreme temperature events have the potential to be catastrophic by endangering ecosystems and biodiversity, harming human health through aggravation of heat stroke and respiratory conditions, and negatively impacting socio-economic systems by hampering food production, stressing public utilities, and heightening energy consumption [4,5]. These risks are acute in Portugal [6], a country influenced by a Mediterranean climate. The country’s exceptional or extreme temperature events are caused by a combination of atmospheric circulation patterns, local topography, and changes in land use. Efforts addressing these issues, such as Ramos et al. [6] discussing the evolution of exceptional temperatures over Portugal and Cardoso et al. [7] stressing the exceptionally dangerous nature of extreme temperature events in a warming Portugal, do certainly help. However, there is still no continuous, up-to-date, long-term analysis focused on changes in exceptional Tmax values across the diverse landscapes of Portugal.
This knowledge gap is addressed by proposing a novel approach that scrutinises exceptional Tmax values in Portugal within a period of 44 hydrological years (from October 1980 to September 2024) using the most current reanalysis data available. The 44-year period is split into two equal 22-year subperiods, minimising biases that may result from unequal temporal divisions. This type of temporal segmentation is commonly used in climatological research, making it possible to identify long-term patterns and changes in climatic behaviour [8]. With the use of ERA5-Land reanalysis temperature data, which offers spatial resolution superiority to traditional meteorological station records [9] and have been validated for mainland Portugal [10], this study seeks to employ a multi-tiered threshold approach to analyse exceptional temperature events. This approach helps to capture the impacts of climate change, providing a robust understanding of the impacts of climate change through moderately extreme and exceptionally rare temperature events. The term “exceptional”, in the context of climate change, introduces a complex topic full of statistical pitfalls arising from the analysis of anomalous and rare hydrological events. For starters, what do “exceptional” temperatures entail? Defining the term comes with the challenge of choosing a boundary tainted with dichotomous heterogeneity and speckled with weather systems. The difference and frame from natural climate variability and long-term signals of climate change demand meticulous statistical analysis and interpretation. Having said that, the present study aims to develop temperature-related severity heatmaps—adopting the methodological framework of Espinosa et al. [10]—clearly highlighting changes in the exceptionality of Tmax events between the two subperiods: the historical phase (from October 1980 to September 2002) and the contemporary phase (from October 2002 to September 2024). This approach can evidence some climate change impacts by contrasting earlier and later phases, and potentially revealing non-stationarities in the occurrence of exceptional temperature events and their anomaly excess in recent years.
This research is motivated by the urgent need to better understand how climate change affects Portugal’s exceptional temperature events. While previous studies have explored temperature trends and heatwave occurrences, a comprehensive analysis focusing specifically on exceptional Tmax values over an extended period is lacking. The main objectives are to quantify changes in the characteristics of exceptional temperature events between a historical phase (1980/1981–2001/2002) and a contemporary phase (2002/2003–2023/2024), and assess the statistical significance of observed changes. The exceptional Tmax changes are depicted through an innovative severity heatmap, representing a novel contribution to climate change research. The colour-coded categorisation system allows for quick identification of areas experiencing the most significant changes in exceptional Tmax patterns, enhancing the practical application of the research findings.
The significance of this research lies in its potential to help guide climate adaptation plans and pinpoint areas that are more likely to experience increases in extreme temperature events. This might aid policymakers and urban planners prioritise adaptation efforts in areas that are most at risk. From a scientific perspective, this research contributes to the understanding of regional climate change dynamics, particularly in the Mediterranean region, including Portugal, which is often described as a “hot spot” for climate change, experiencing more rapid warming than the global average [11].

2. Materials and Methods

This comprehensive study investigates exceptional maximum daily temperatures (Tmax) throughout mainland Portugal using complete series of up-to-date, high-resolution reanalysis data. The methodology includes the acquisition and processing of data, division into distinct temporal phases, identification of exceptional Tmax events based on percentile-based thresholds, calculation of key variables, statistical analysis, and the development of a severity heatmap to spatially visualise changes in extreme temperature patterns over time.

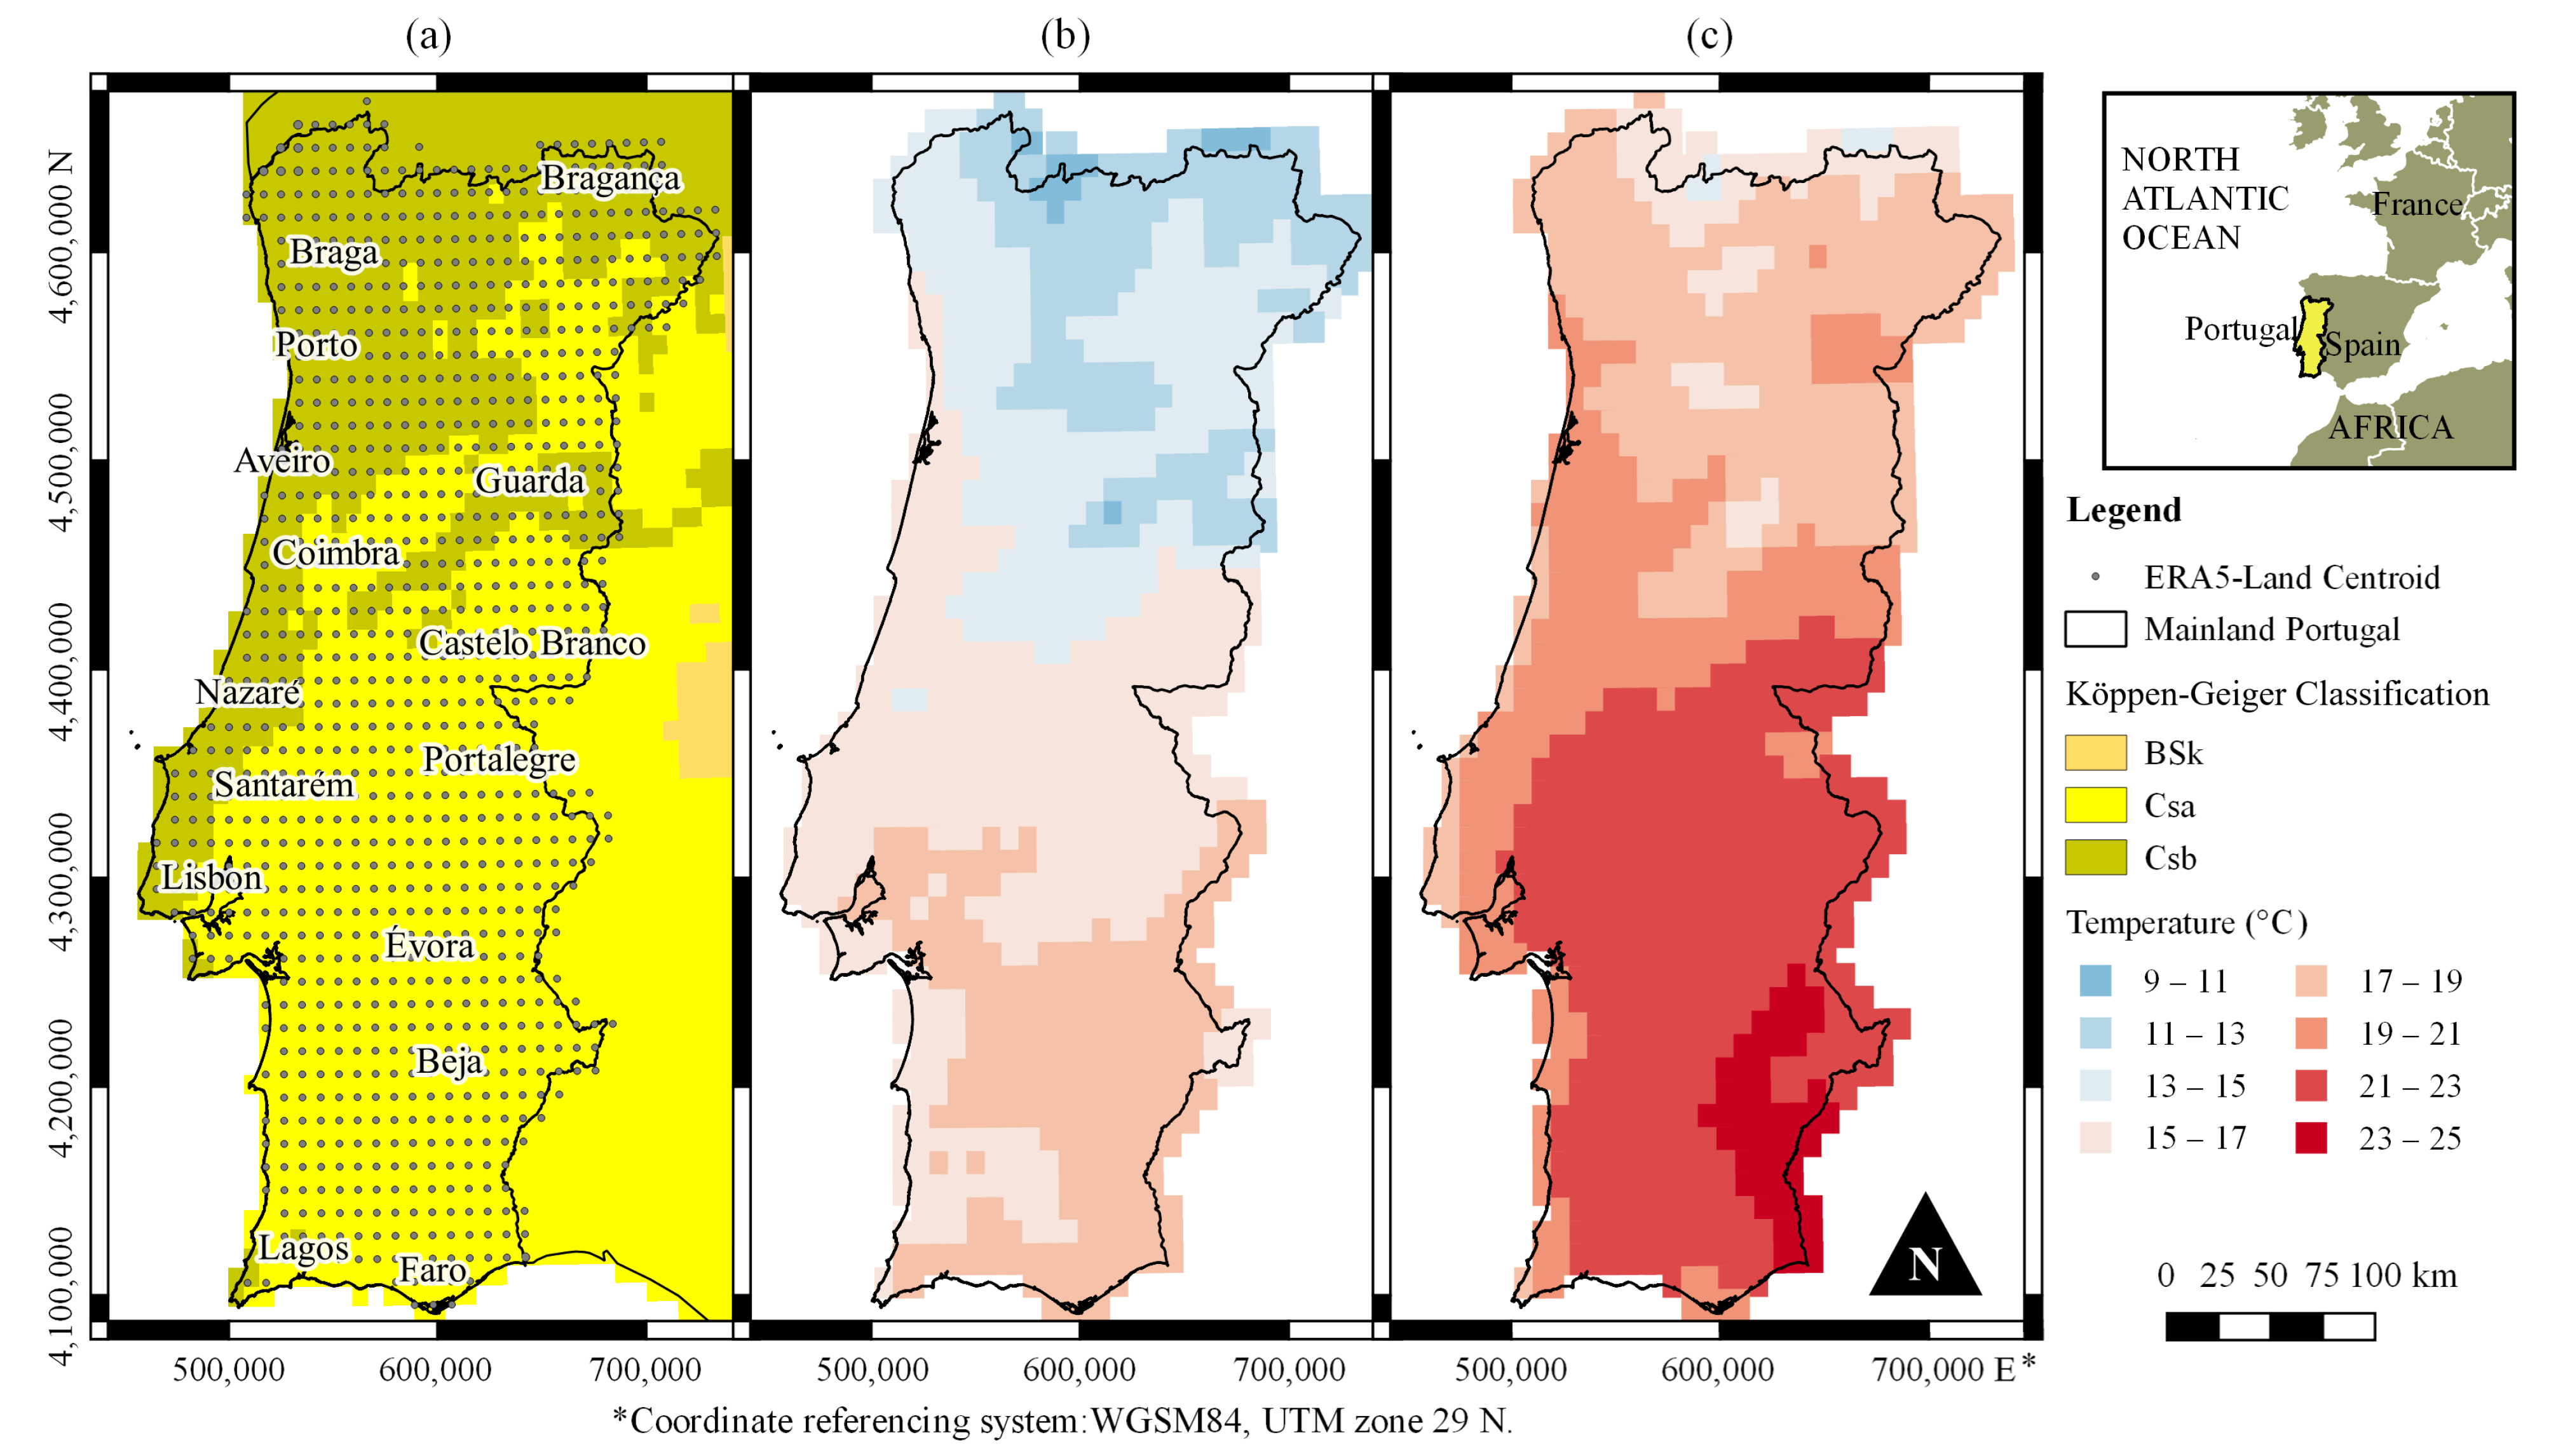
2.1. Background and Context of the Portuguese Setting

Portugal’s geographic location within the Iberian Peninsula, coupled with the influence of the North Atlantic Subtropical Anticyclone [12], results in a unique climatic profile. Based on the Köppen-Geiger climate classification, the country’s climate is predominantly characterised by two main types (see Figure 1a): Csa (Mediterranean hot summer climate) and Csb (Mediterranean warm/cool summer climate). The Csa type, found in much of Portugal, particularly in the southern and central regions, is characterised by hot, dry summers and mild wet winters. In contrast, the Csb type, prevalent in the northern regions and some coastal areas, features cooler summers whilst maintaining the pattern of dry summers and mild, wet winters. These two climate types cover the majority of Portugal’s mainland, with Csa dominating in the south and interior, and Csb more common in the north and along the coast. The diversity between these two climate regimes, coupled with the country’s varied topography and Atlantic influence [13], renders Portugal an exemplary case study for examining the spatial and temporal dynamics of extreme temperature events, particularly in the context of climate change.
The Portuguese setting has experienced a significant warming trend over the past century, with mean annual air temperatures increasing across all regions at a rate of 0.3   ° C per decade since the 1970s [14], affecting both minimum (Tmin) and maximum (Tmax) temperatures. This trend is exemplified by the exceptionally hot August of 2018, when the mean Tmax reached 32.41   ° C , the highest since 1931, with an anomaly of + 3.61   ° C , and notably, the five highest average maximum temperatures for August have all occurred after the year 2000: 2003, 2005, 2010, 2016, and 2018 [15]. The warming trend has been accompanied by an increase in both the frequency and intensity of heatwaves, particularly in the interior regions of the country. Espinosa et al. [16], utilising ERA5-Land reanalysis data, identified a widespread increase in heatwave days across mainland Portugal from October 1980 to September 2023, with northern and interior regions experiencing up to an average of about 21 Tmax heatwave days per year. The summer of 2003 stands out as a particularly severe example, resulting in significant excess mortality and widespread wildfires [17]. Looking ahead, Dupuy et al. [18] project that under a high greenhouse gas emissions scenario, Portugal could experience a 50% increase in extreme fire danger days by the end of the 21st century, with average temperatures rising by 4– 5   ° C .
Furthermore, Portugal’s position at the southwestern edge of Europe makes it particularly susceptible to the influences of large-scale atmospheric circulation patterns, such as the North Atlantic Oscillation (NAO) [19]. These patterns significantly affect the temperature and rainfall regimes, adding complexity to the analysis of extreme temperature events in the country. In urban areas, the Urban Heat Island (UHI) phenomenon further compounds the effects of rising temperatures [20]. Cities such as Lisbon and Porto may experience more pronounced temperature increases due to the heat-absorbing properties of urban infrastructure, potentially exacerbating the impacts of heatwaves on densely populated areas [21]. This complex interplay of geographical, climatological, and anthropogenic factors makes Portugal a particularly compelling subject for studying potential climate change impacts, especially in the context of exceptional temperature events.

2.2. ERA5-Land Daily Temperature Data

Daily temperature data from ERA5-Land were analysed at 1012 centroids that represent the central locations of the analysed grid cells in Portugal (see Figure 1a). Daily minimum (Tmin) and maximum (Tmax) temperatures were derived from hourly temperature ERA5-Land data at 2 metres above the ground surface—retrieved from the Copernicus Climate Data Store [22] (variable: 2m_temperature)—by selecting the lowest and highest hourly temperatures for each day, respectively. ERA5-Land provides high-resolution data ( 0 . 1 × 0 . 1 spatial resolution, 95 100 km 2 per grid cell) over land surfaces, omitting oceanic and marine data [9]. While ERA5-Land data go all the way back to 1950, researchers primarily use data from the 1980s and later, on account of the improved data quality, consistency, and accessibility. The assembled daily dataset (16,060 ×   1012 ) spans 44 hydrological years (1 October 1980 to 30 September 2024). Hydrological years [23] were chosen to align with the country’s rainfall patterns—in Portugal, the hydrological year begins on 1 October and ends on 30 September of the following year. This approach allows for a more accurate representation of the relationship between temperature variations and water availability. In each day, mean temperature (Tmean) was calculated as the average of daily Tmin and daily Tmax. To simplify calculations and maintain consistency in the dataset, leap year days were omitted from the analysis. Figure 1b,c illustrate a clear spatial pattern of temperature variations across the country, with warmer conditions observed in the southern regions and cooler conditions in the central and northern areas.

2.3. Temporal Phases

In order to compare exceptional temperature changes, the global 44-year period was split into two 22-year subperiods: a historical phase (from 1 October 1980 to 30 September 2002) and a contemporary phase (from 1 October 2002 to 30 September 2024). Equal subperiods, such as the comparative temporal baselines used by the Intergovernmental Panel on Climate Change (IPCC), are widely adopted in climatology to standardise comparisons, as seen in reanalysis-based studies of decadal variability [24]. This temporal division facilitates the identification of long-term temperature trends and the assessment of potential changes in the frequency or intensity of extreme temperature events [25].

2.4. Exceptional Tmax Identification and Thresholds Selection

Exceptional Tmax events were identified using empirical percentile-based thresholds calculated from the entire Tmax data grid throughout the 44 hydrological years. The 90th, 99th, and 99.9th percentiles were selected as empirical thresholds for identifying exceptional temperatures to capture different levels of extreme events. The 90th percentile (10-year return period, Q90) identifies relatively frequent extreme events, providing insights into “moderately extreme” events. The 99th percentile (100-year return period, Q99) represents more severe extreme events, which is valuable for long-term planning and infrastructure design. The 99.9th percentile (1000-year return period, Q99.9) captures the most extreme temperature events, crucial for understanding the upper limits of temperature variability and assessing risks associated with unusual climate conditions.
This methodology is in line with established practices in climate research to identify and classify extreme temperature events. For example, the Expert Team on Climate Change Detection and Indices (ETCCDI) recommends the 90th percentile of the daily maximum temperature as a threshold for defining temperature extremes [26]. Similarly, the National Oceanic and Atmospheric Administration (NOAA) adopts percentile-based thresholds, such as 10% (90th percentile) and 1% (99th percentile) annual exceedance probability levels, to categorise events expected to occur on average ten times and once per century, respectively [27]. The widespread adoption of these approaches highlights their robustness and reliability in the analysis of climate extremes. Based on the 44-year daily data, the thresholds were computed: Q 90 = 30.60   ° C , Q 99 = 37.04   ° C , and Q 99.9 = 40.40   ° C , representing increasingly rare and extreme Tmax events.

2.5. Variables

For each of the 1012 centroids and exceptional Tmax threshold (Q90, Q99, and Q99.9), yearly values of two main variables were calculated for the global period, as well as for the historical and contemporary phases:
1.
Occurrence of Exceptional Tmax Events, OTE, expressed in days, representing the annual number of days when Tmax exceeds the specified threshold.
2.
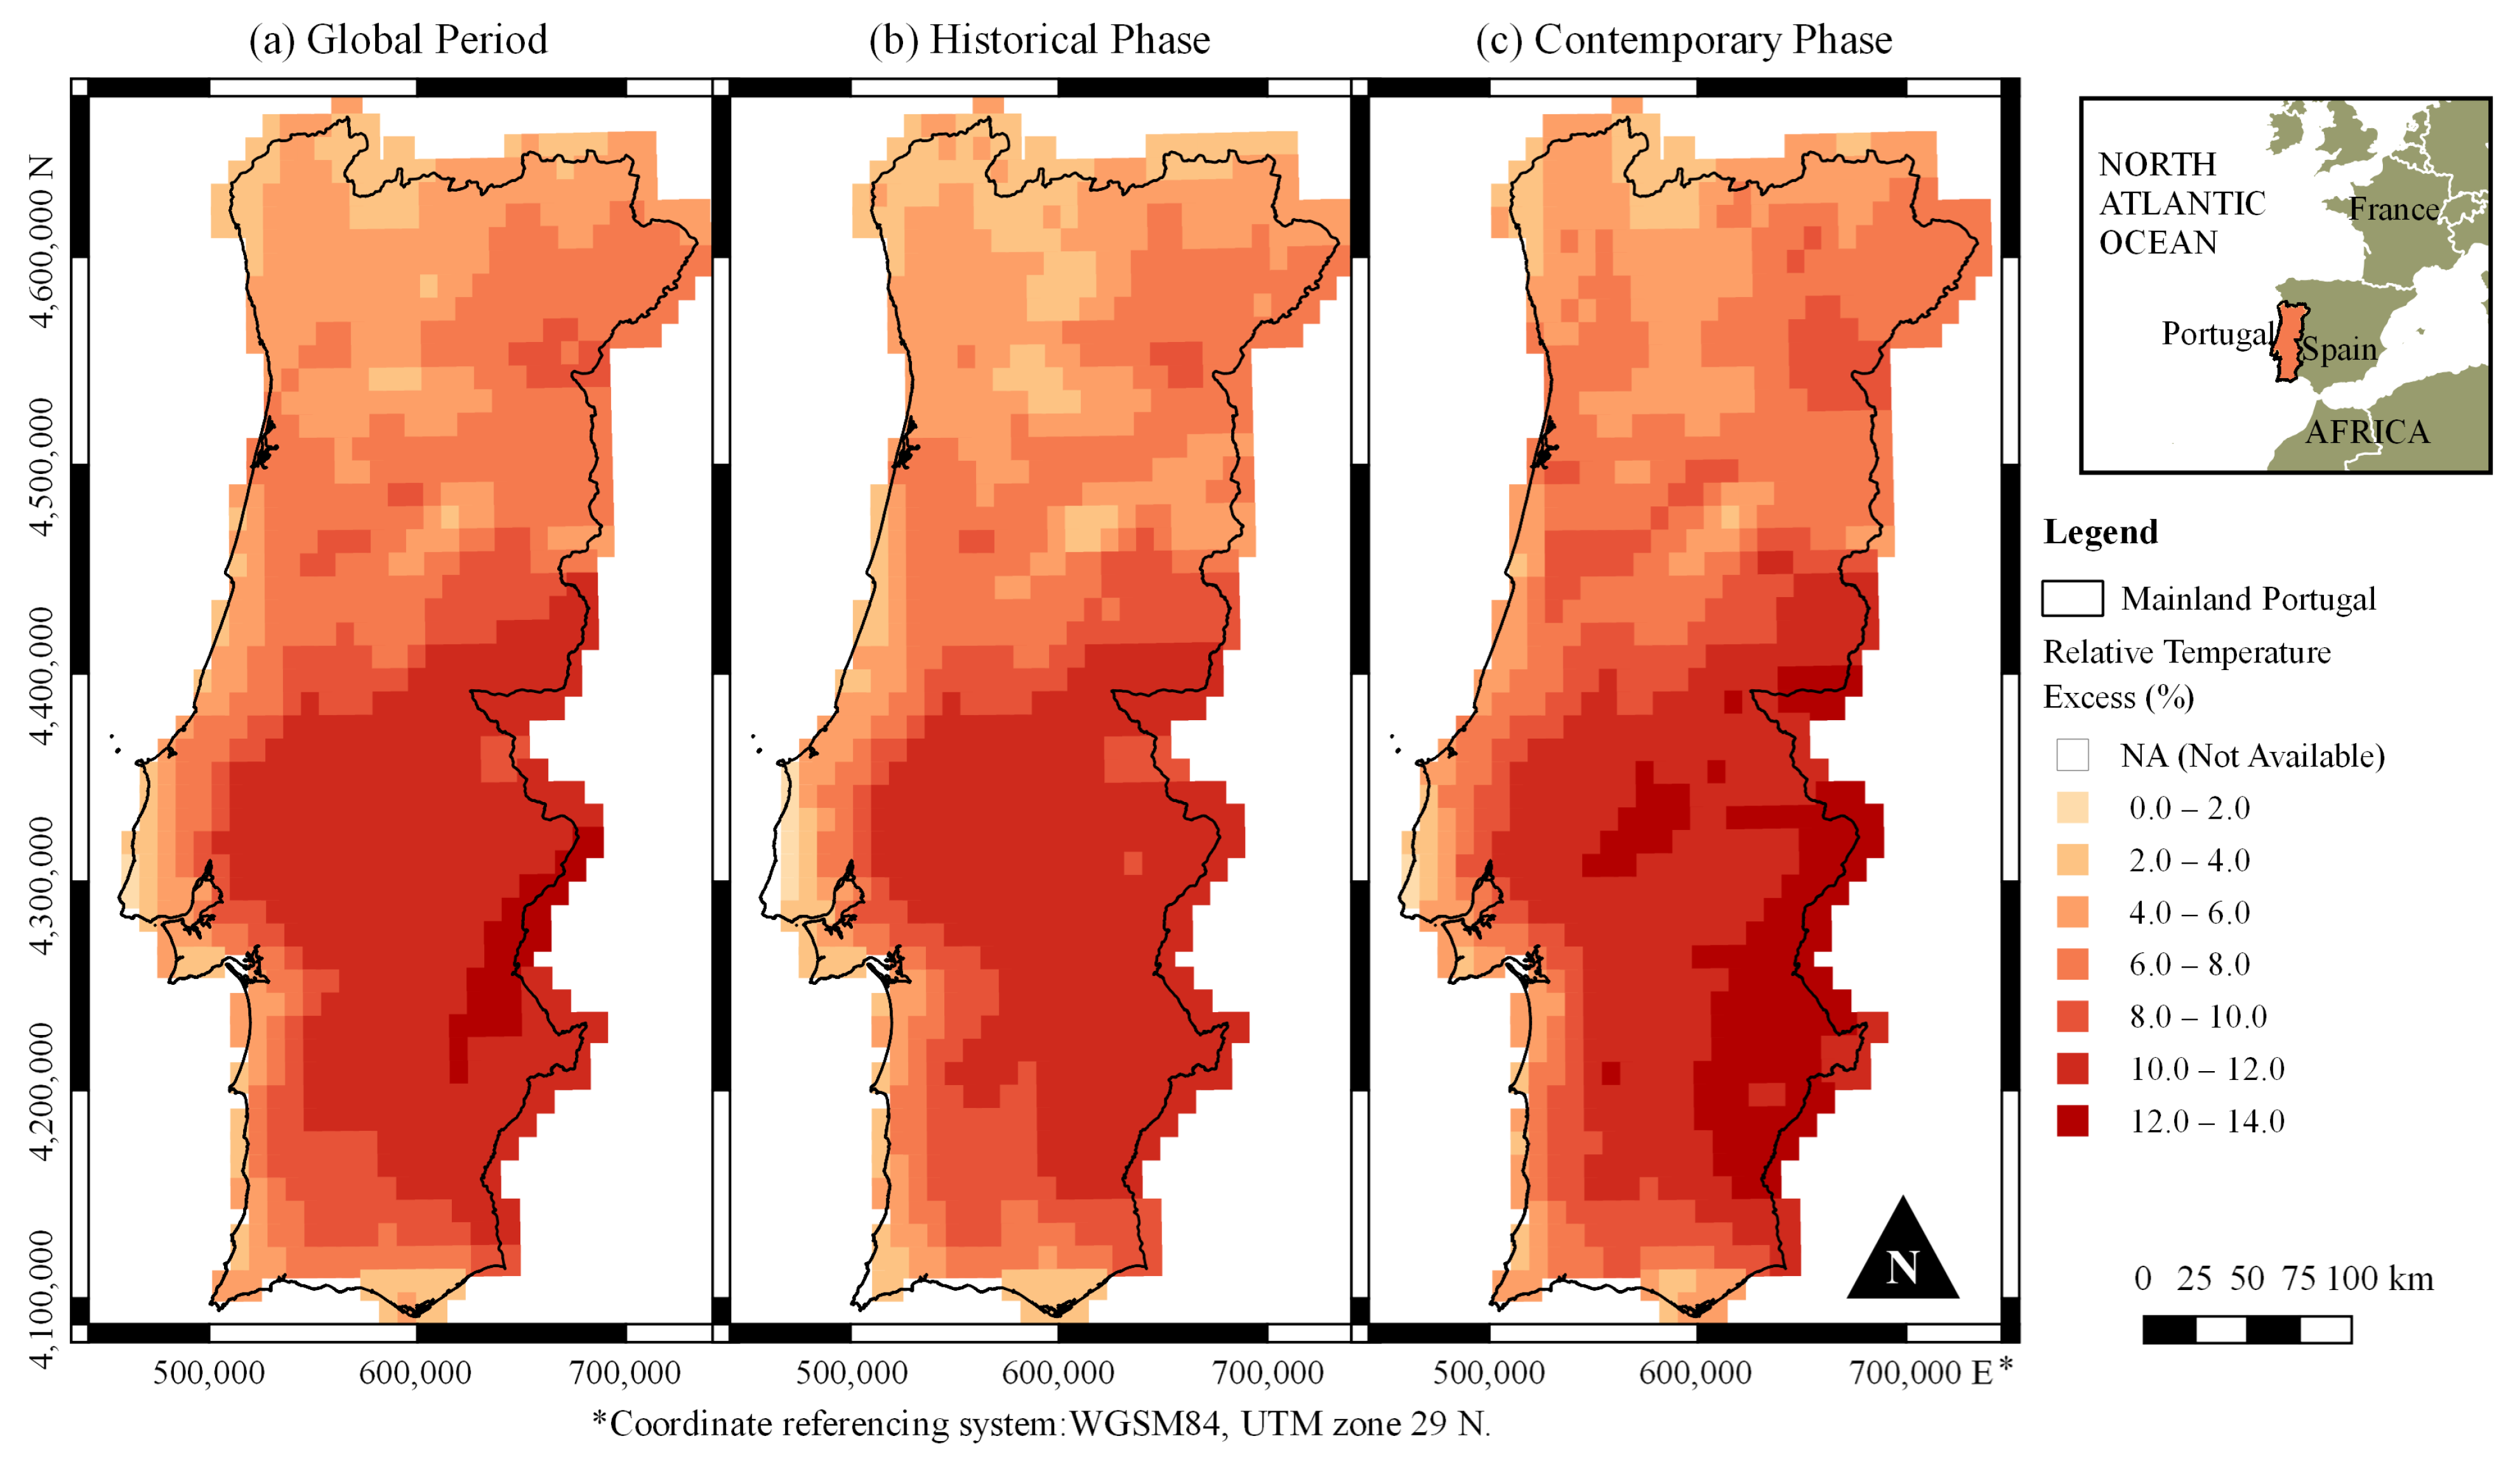
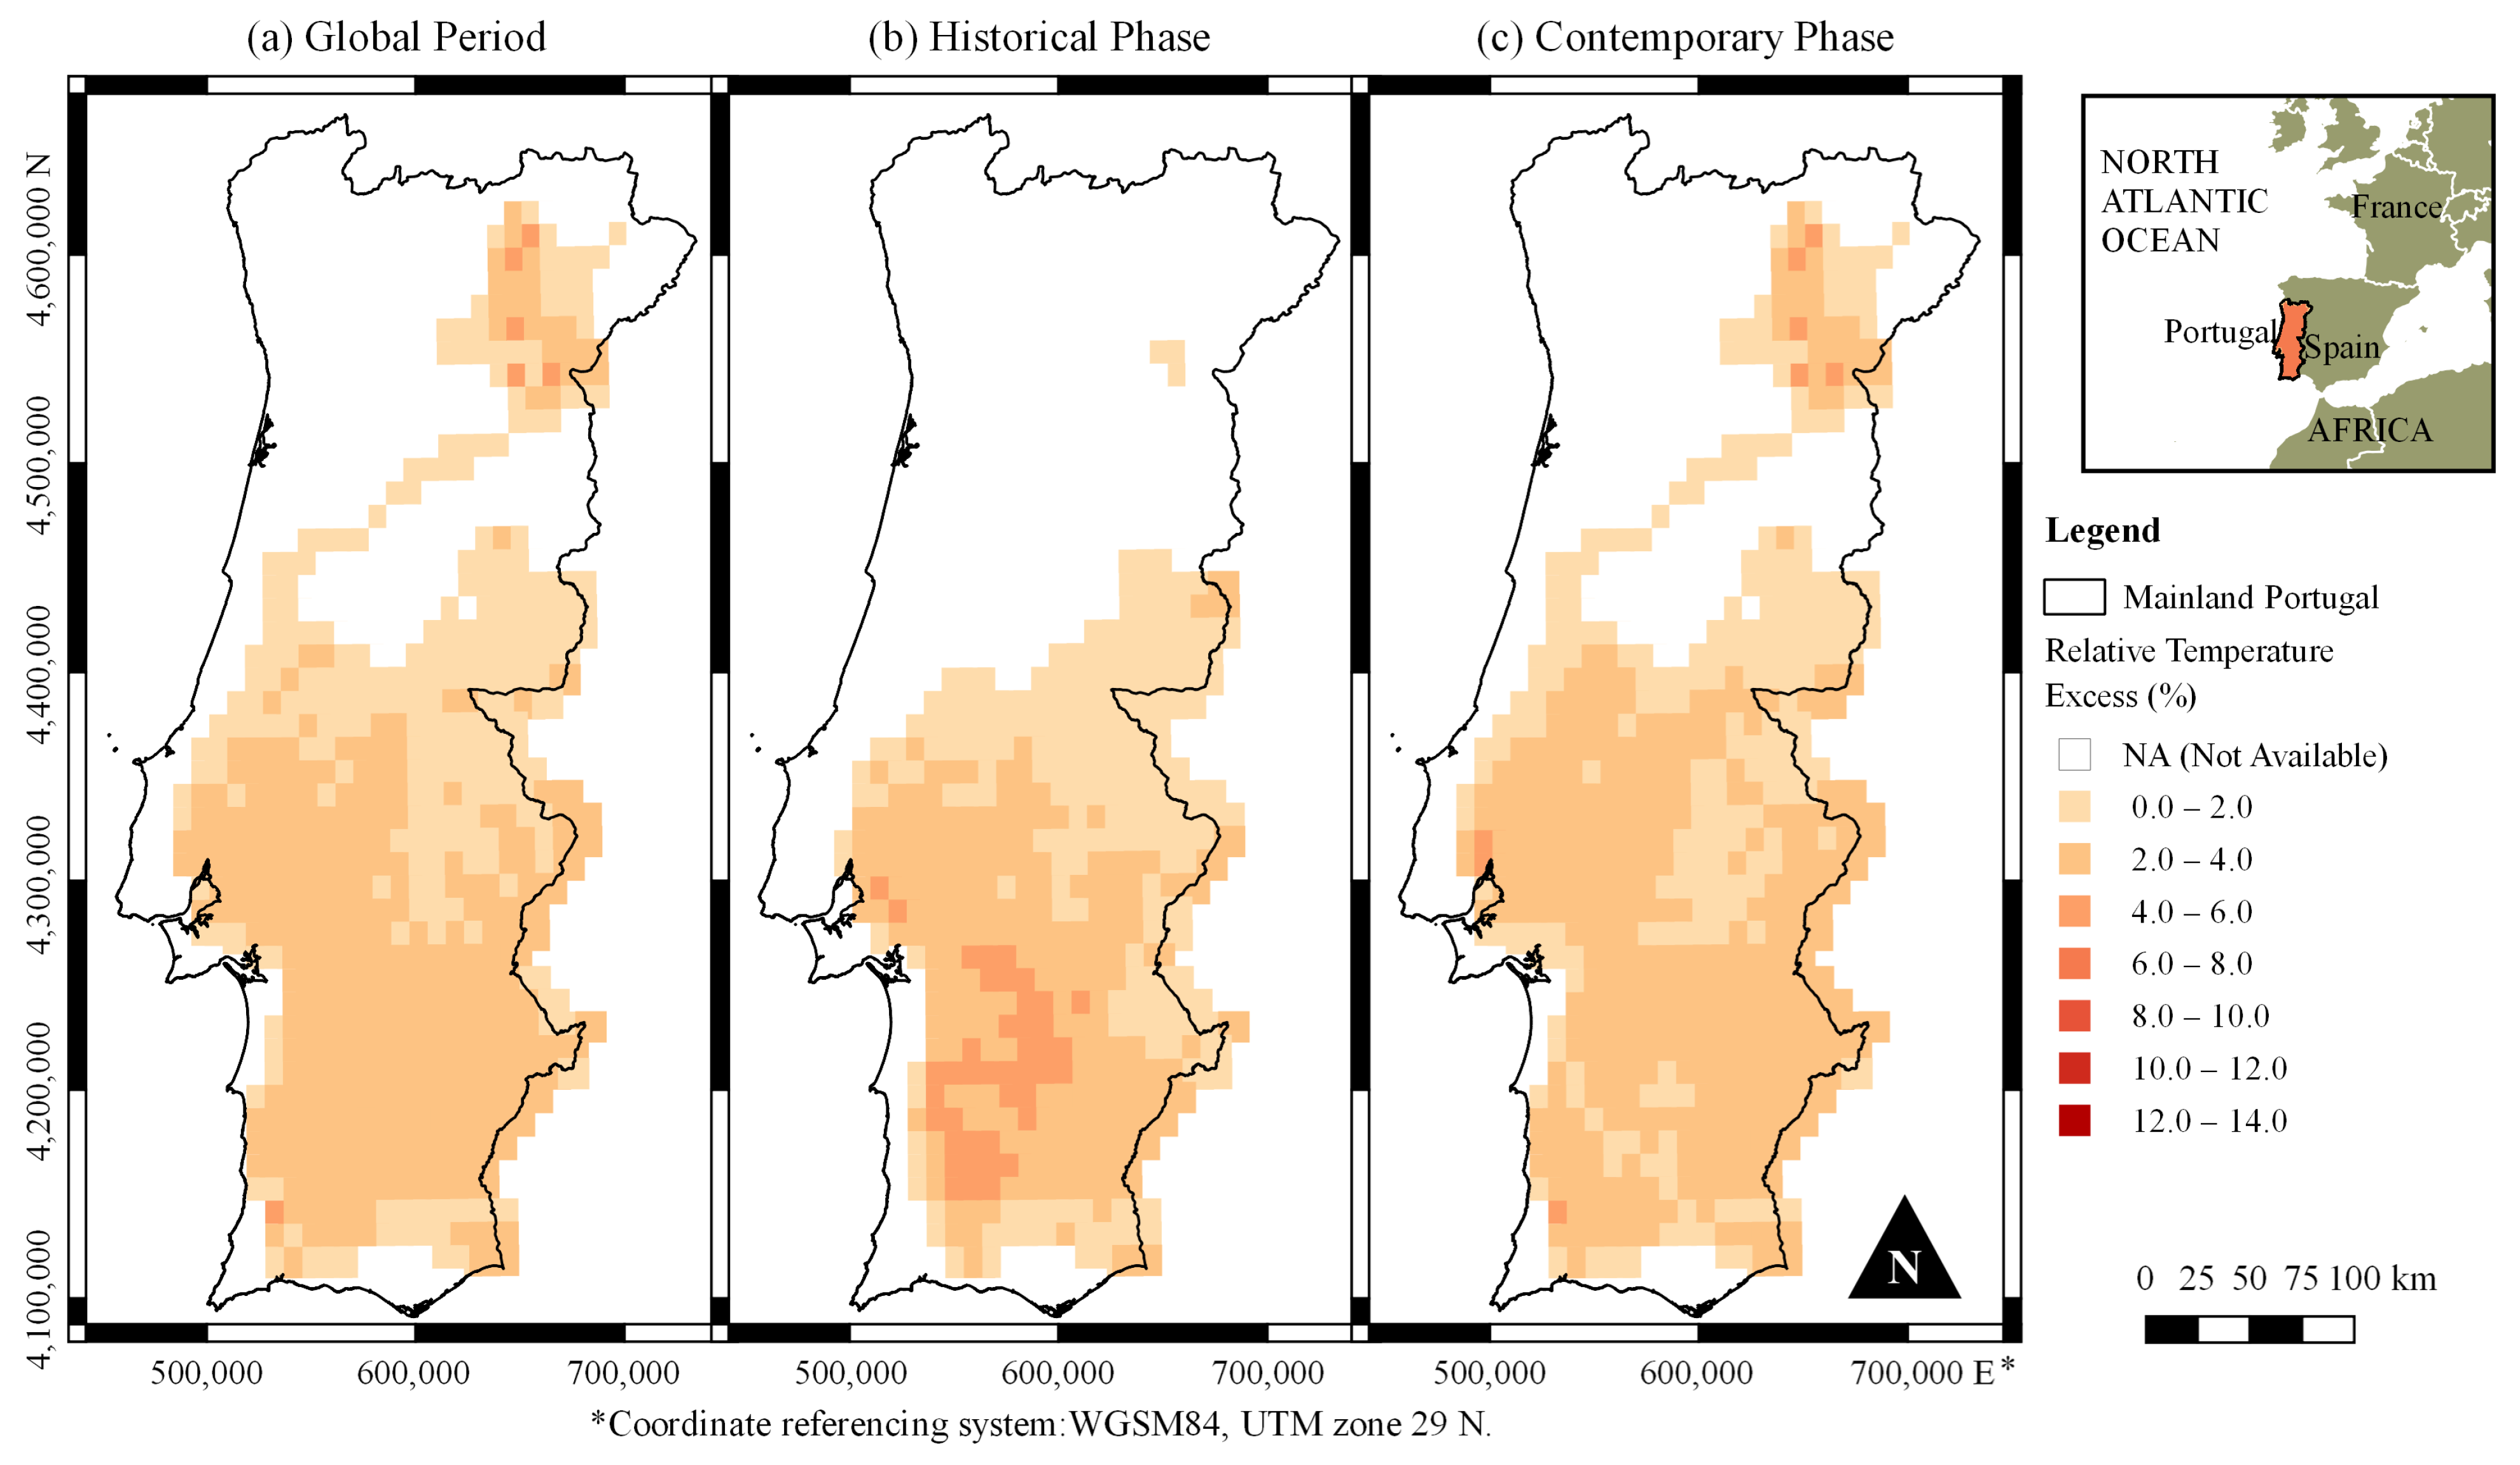
Relative Temperature Excess, RTE, expressed in %, defined as:
RTE = T exc ¯ Q 1 × 100 %
where T exc ¯ is the average Tmax on days exceeding the threshold in a given year, and Q is the threshold temperature. In other words, RTE quantifies how much warmer the exceptional events are compared to the threshold over the course of a selected year. For years with no occurrences of exceptional events, i.e., when OTE = 0 days, the calculation of the Relative Temperature Excess, RTE, was designated as “NA” (Not Available). This approach ensures that the RTE is only calculated and interpreted for years with exceptional temperature events, preventing misinterpretation of results in years where no exceedances occurred.

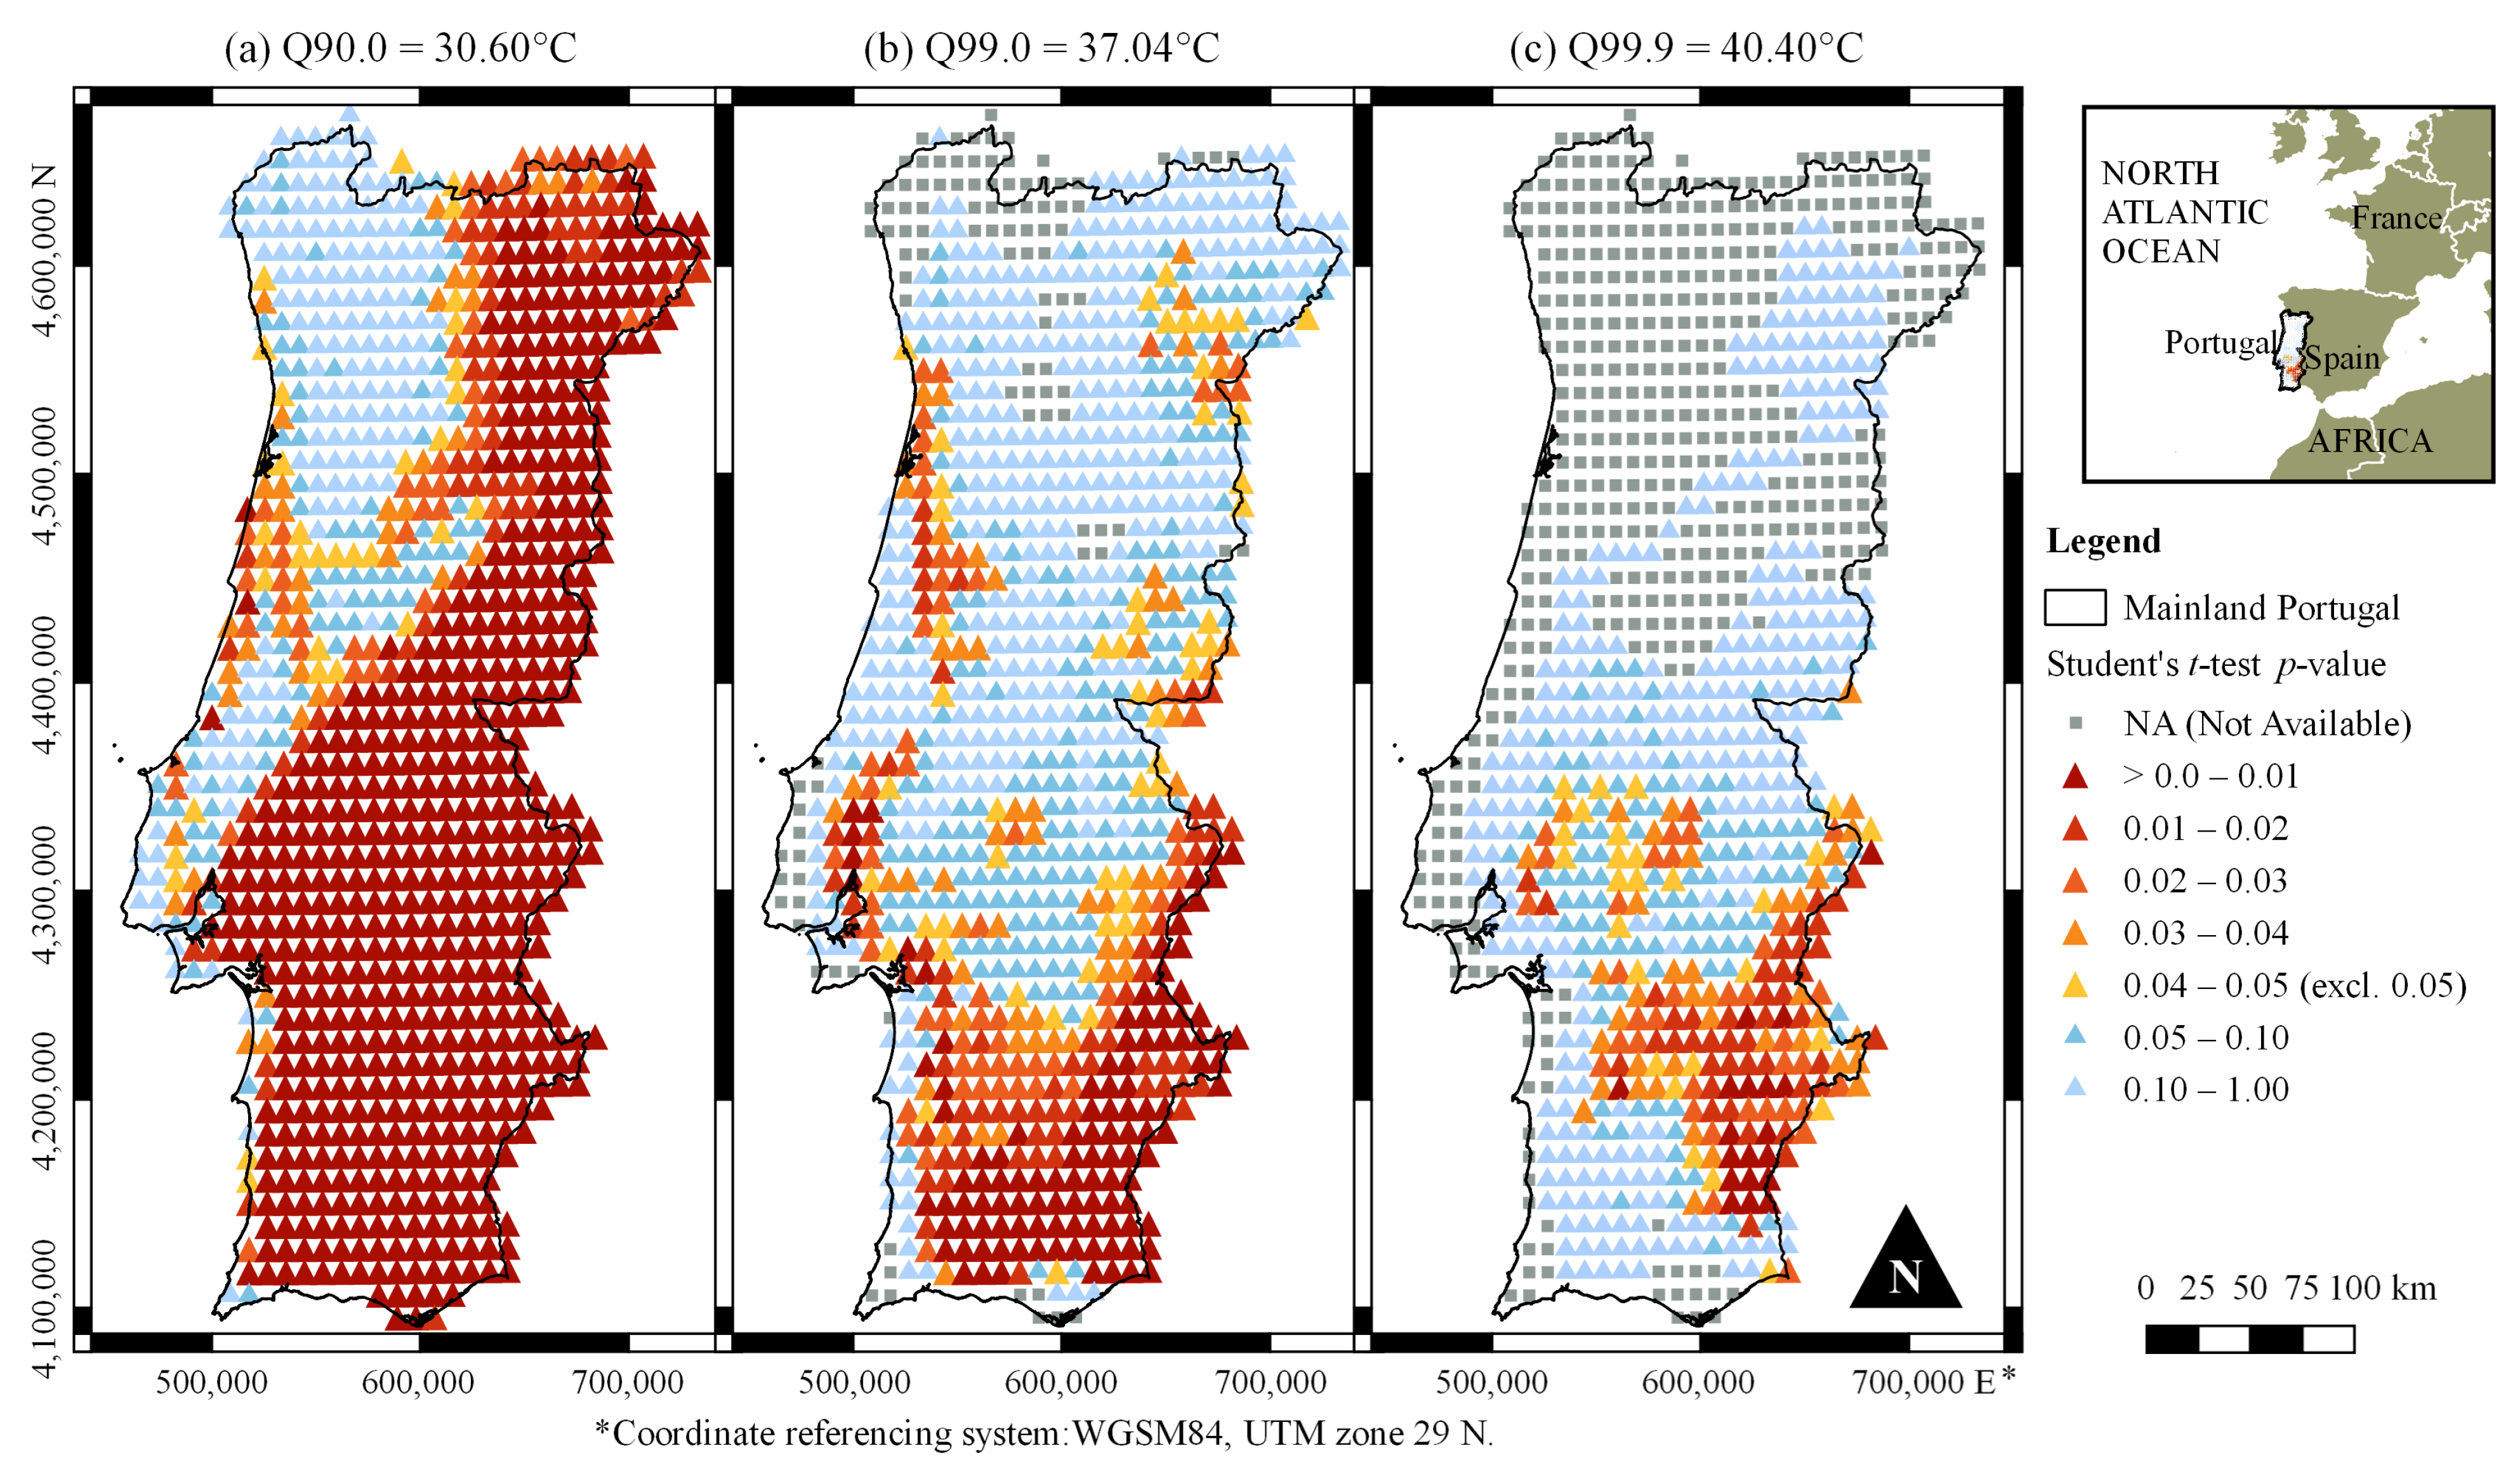
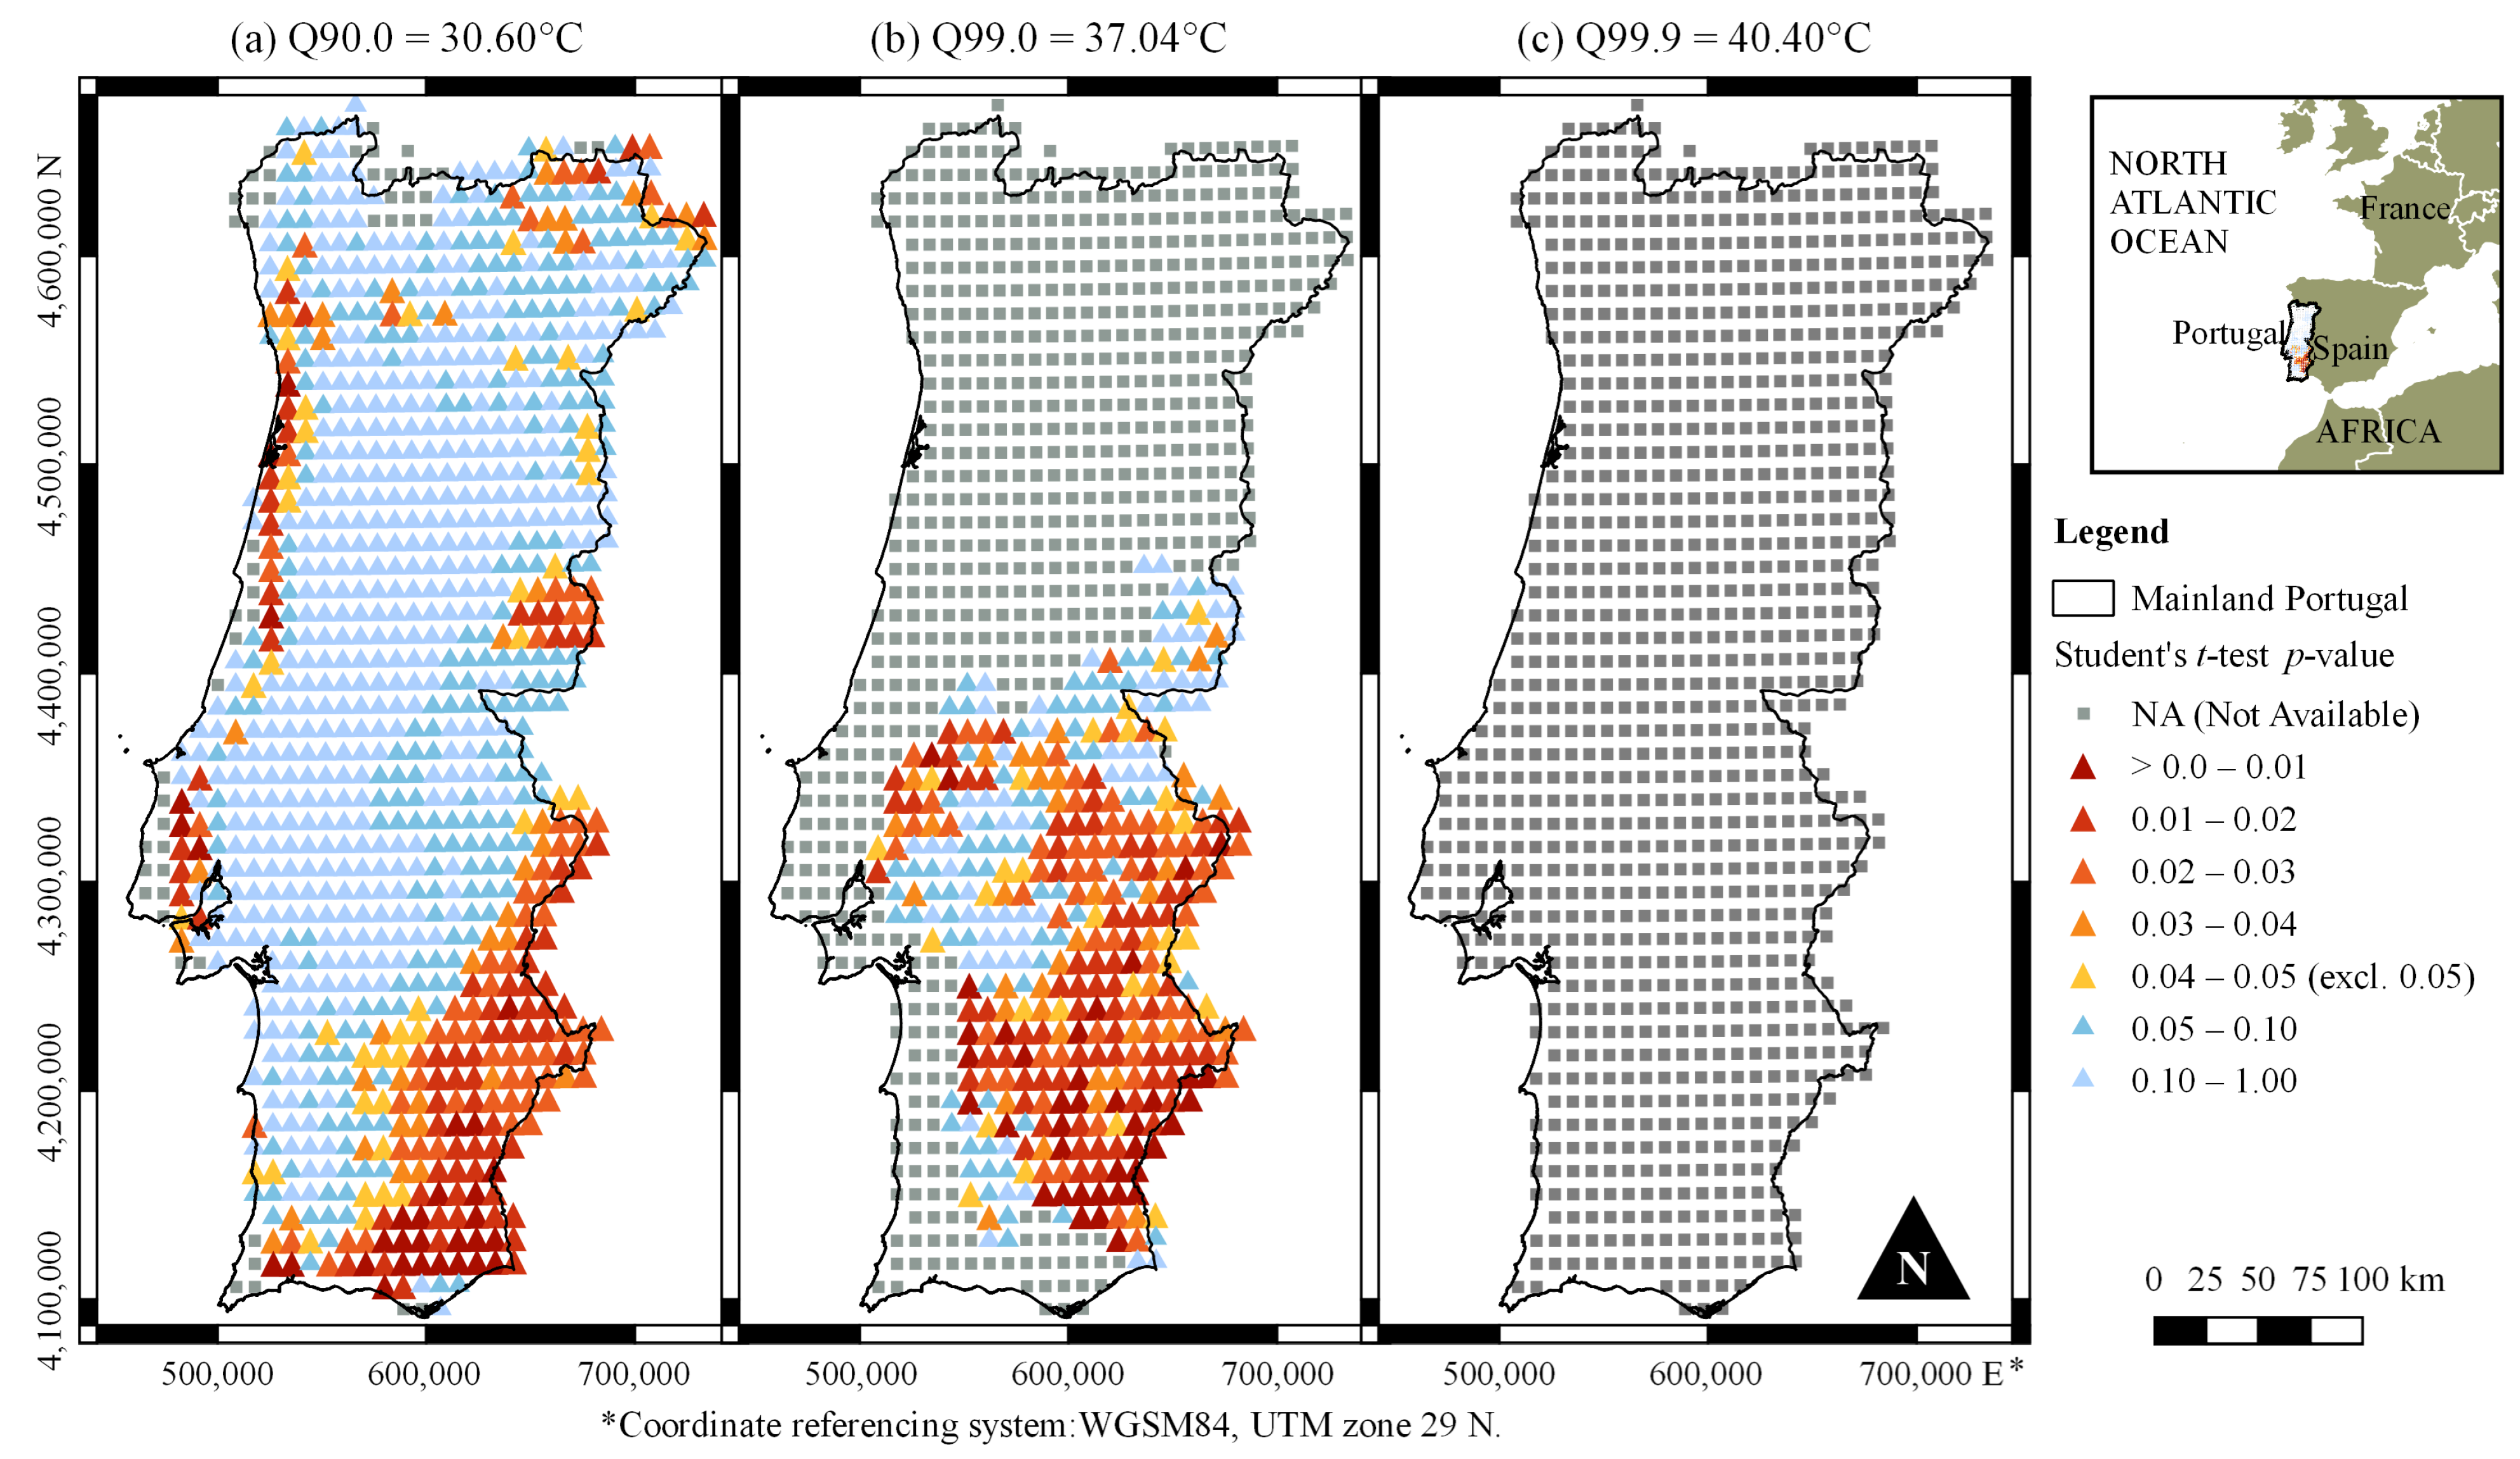
2.6. Statistical Significance Testing: Student’s t-Test

To assess the statistical significance of differences in the calculated variables (OTE and RTE) between the historical and contemporary phases at the different thresholds, the Student’s t-test was applied. To ensure the representativeness of the results, this test was conducted only when each phase contained a minimum of 15 out of the 22 possible annual values. This test, developed by Student [28], evaluates whether there is sufficient evidence to suggest a significant difference between the means of the two phases. Specifically, it assesses whether the contemporary phase shows more OTE and higher RTE compared to the historical phase, indicating more frequent occurrences and warmer temperatures. The resulting p-values were then mapped spatially, where possible, to visualise the geographical distribution of statistically significant differences in exceptional Tmax events’ characteristics. It is important to note that while the Student’s t-test is commonly used for comparing annual values, such as the total number of exceptional events in a year as in the present study, there are some limitations to consider [29,30]. The test assumes independent and identically distributed data, which may be less of an issue with aggregated annual values. Nevertheless, extreme temperature can still be prone to outliers and skewness, which could influence the t-test’s results. Additionally, the assumptions of normality and homogeneity of variance are critical for the validity of the test, and while these were considered, deviations from these assumptions could still affect the reliability of the results.

2.7. Severity Heatmap Colour Scale

A severity heatmap was constructed, for each threshold, to visualise the combined changes in the Occurrence of Exceptional Tmax Events (OTE) and Relative Temperature Excess (RTE) between the historical and contemporary phases. The severity heatmap, which integrates both frequency and intensity of exceptional temperatures, is a key contribution of this research. For each threshold, severity heatmaps were created using the following five colour-coded cases:
  • Case 0 (white) → No comparison: No occurrences in either phase.
  • Case 1 (red) → More & More: Higher number of occurrences (days) and higher temperature excess (%) in the contemporary phase compared to the historical phase.
  • Case 2 (orange) → More & Less: Higher number of occurrences (days) but lower temperature excess (%) in the contemporary phase compared to the historical phase.
  • Case 3 (yellow) → Less & More: Lower number of occurrences (days) but higher temperature excess (%) in the contemporary phase compared to the historical phase.
  • Case 4 (green) → Less & Less: Lower number of occurrences (days) and lower temperature excess (%) in the contemporary phase compared to the historical phase.
The 22-year duration of each phase ensures a substantial dataset for robust statistical analysis. In summary, the described methods provide a thorough and reliable framework for analysing changes in exceptional Tmax across Portugal.

3. Results

The results highlight significant regional variations in exceptional temperature events across (i) the global period, from 1980/1981 to 2023/2024, (ii) the historical period, from 1980/1981 to 2001/2002, and (iii) the contemporary period, from 2002/2003 to 2023/2024, phases.

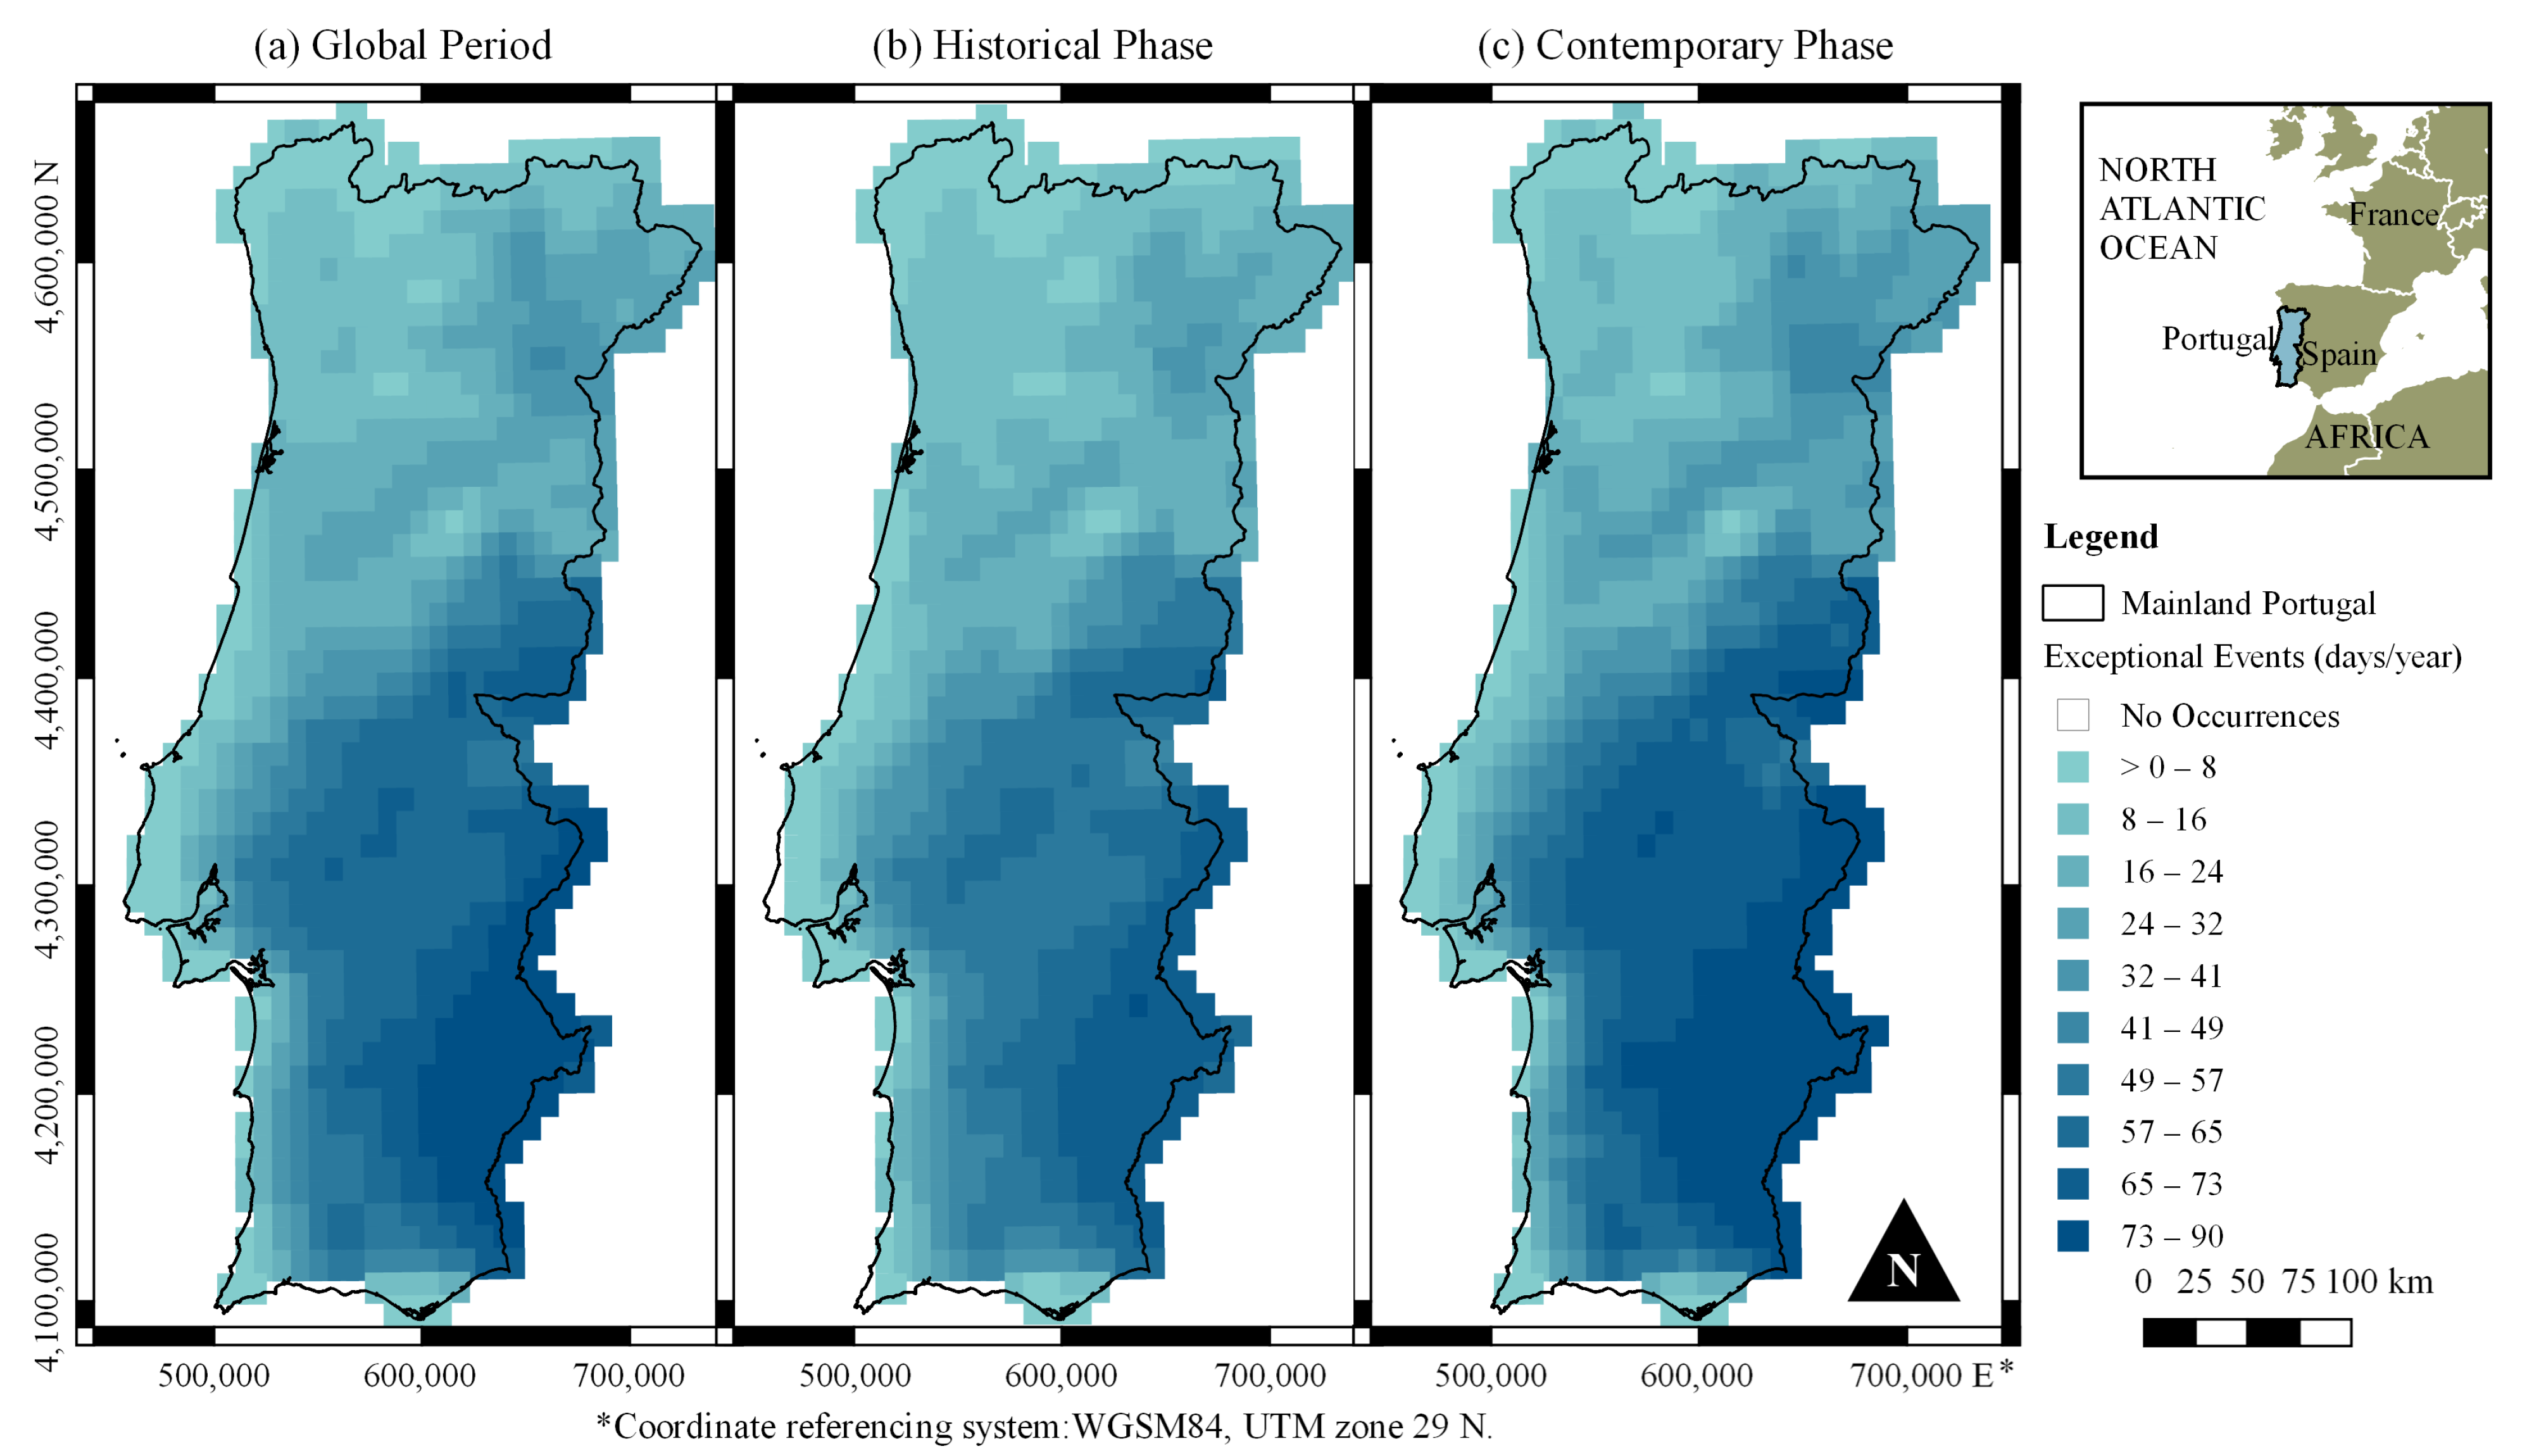
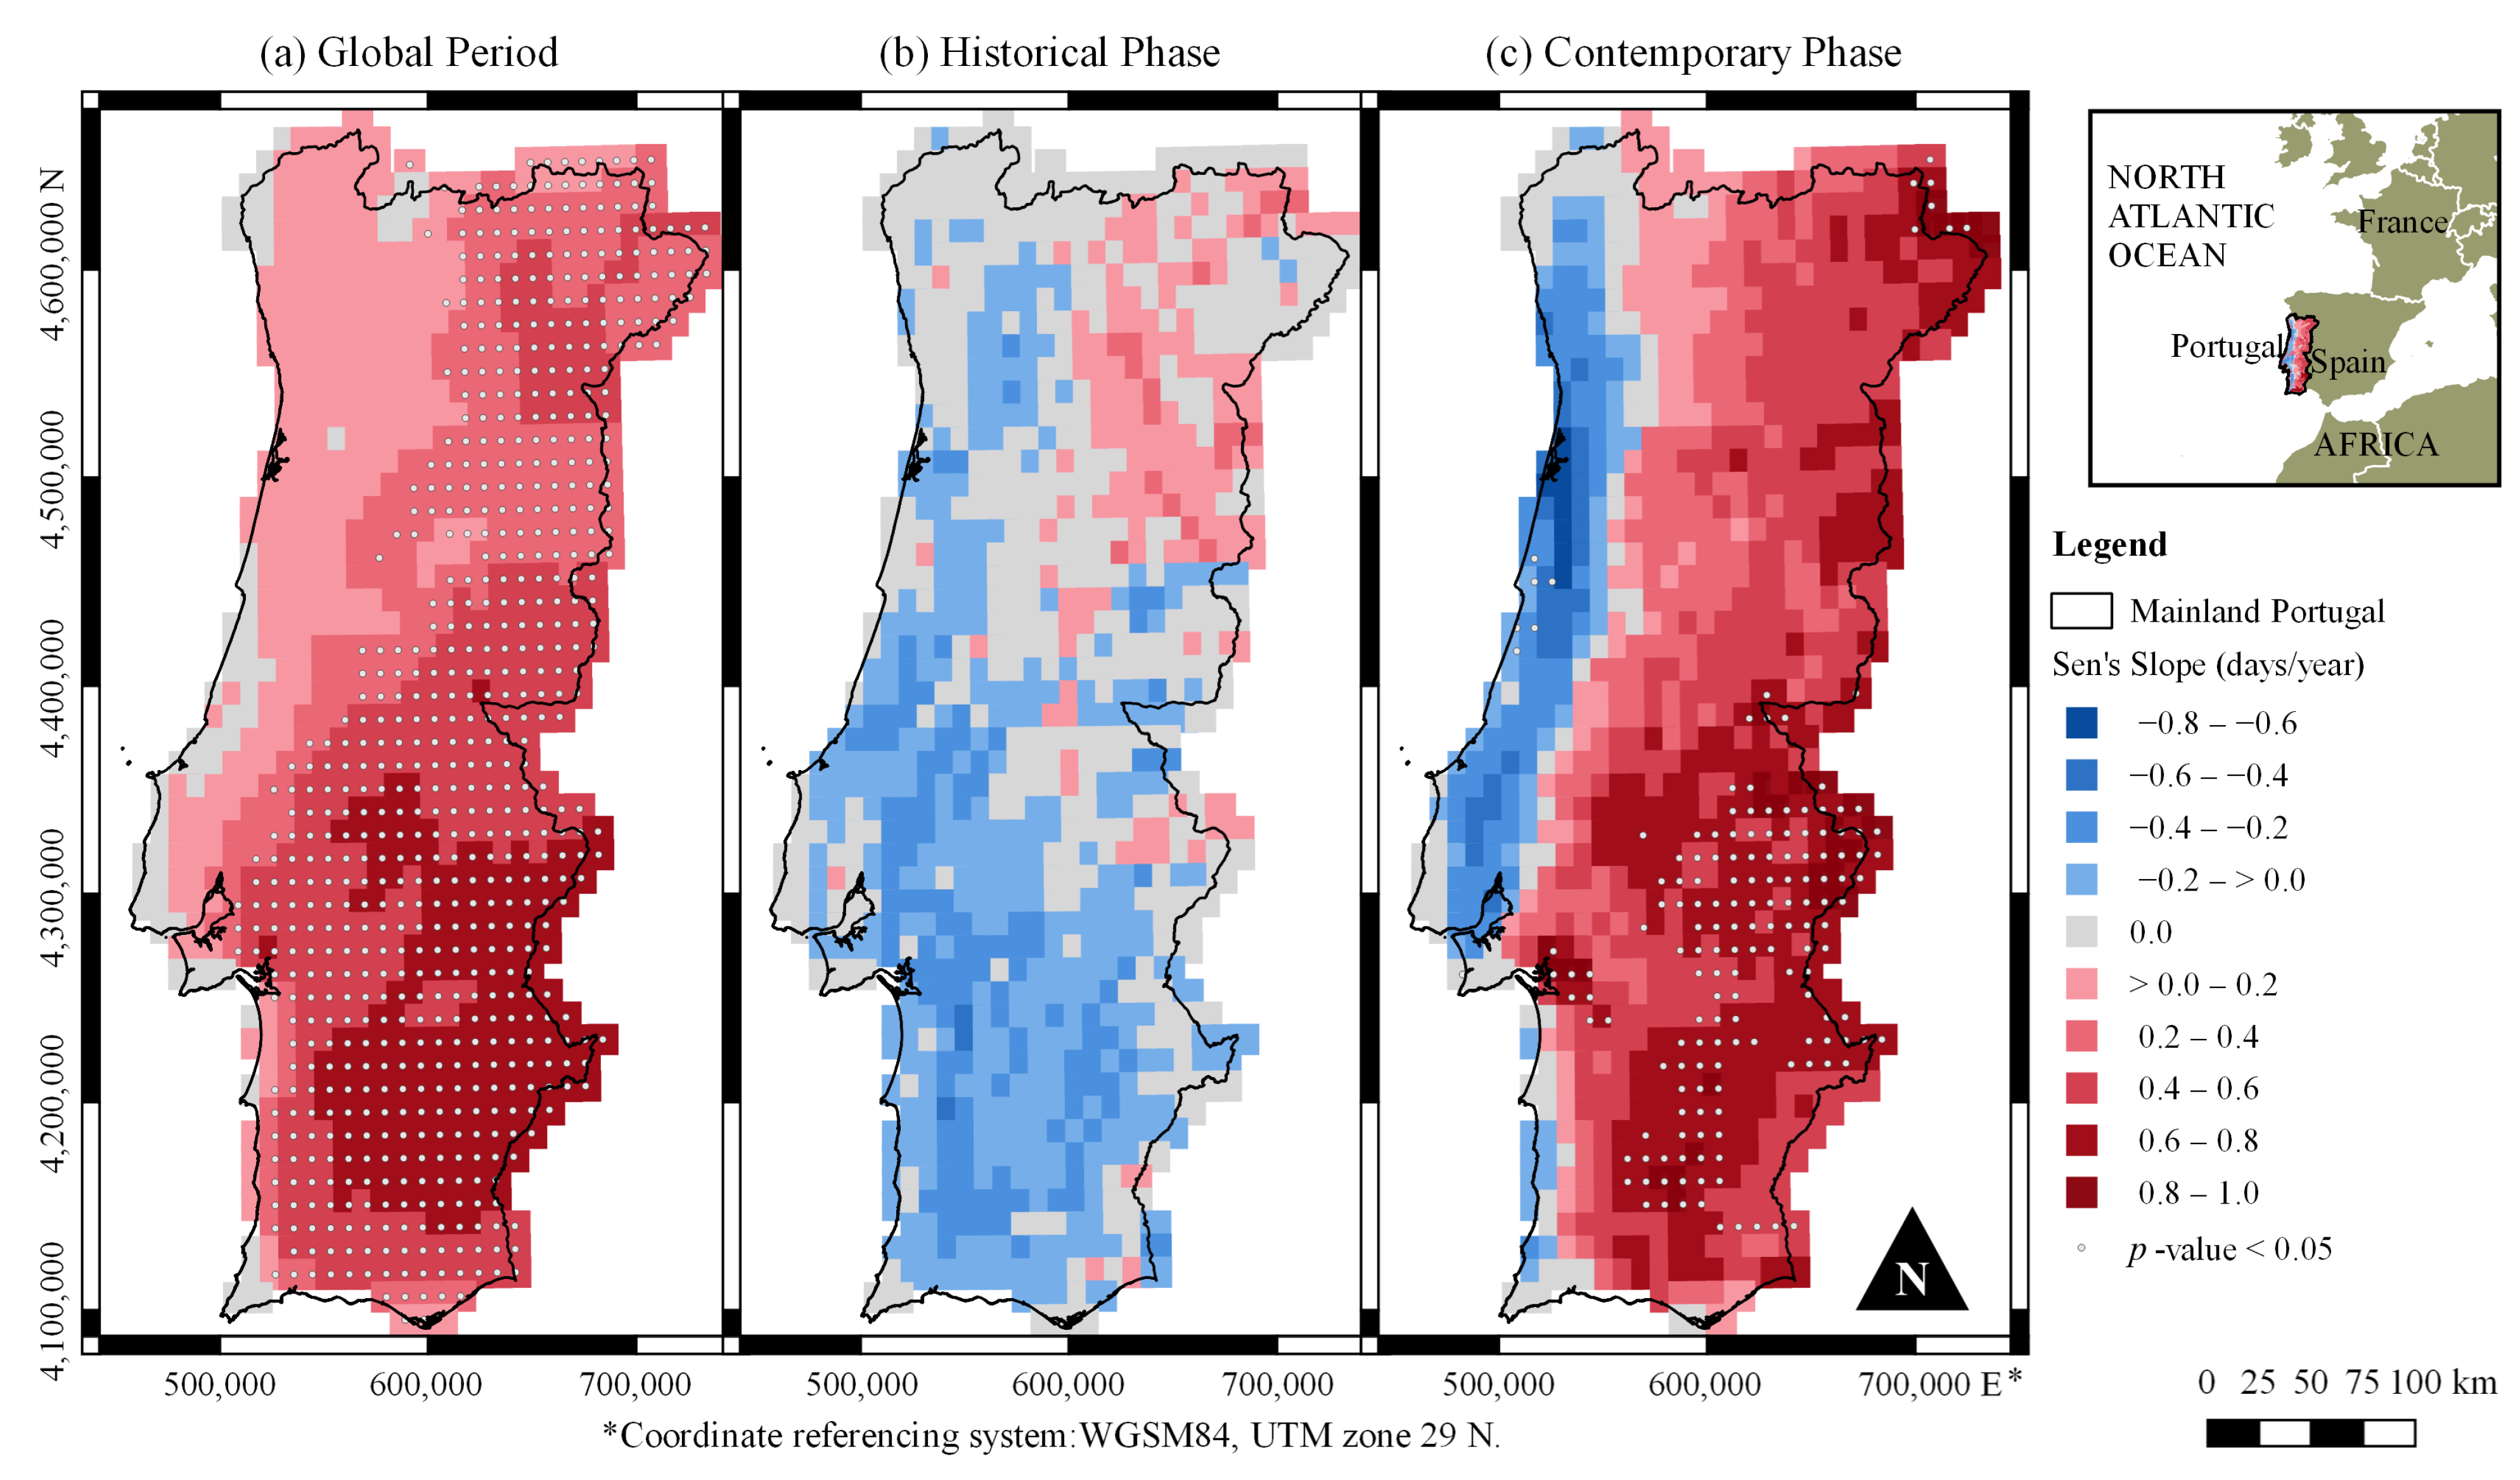
3.1. Spatial Distribution Across Portugal of Occurrence of Exceptional Tmax Events

Figure 2, Figure 3 and Figure 4 illustrate the spatial distribution of the annual average of Occurrence of Exceptional Tmax Events (OTE) across mainland Portugal for the three distinct temperature thresholds: Q 90 = 30.60   ° C , Q 99 = 37.04   ° C , and Q 99.9 = 40.40   ° C , respectively. Each figure presents results for the global period (1980/1981 to 2023/2024), the historical phase (1980/1981 to 2001/2002), and the contemporary phase (2002/2003 to 2023/2024). In calculating these annual averages, years with no exceedances were assigned a value of 0 days/year, ensuring comprehensive representation of exceptional event frequency. As expected, the frequency of OTE is inversely related to the temperature threshold across all periods. For the Q90 threshold (Figure 2), annual averages of OTE ranged from 0 to 90 days/year in the global period. The highest values were concentrated in the Alentejo region, specifically around Portalegre, Évora, and Beja. This pattern is consistent with Portugal’s established climatic trends, where southern and interior regions typically experience higher average temperatures. The historical phase (Figure 2b) showed similar spatial patterns but with generally lower frequencies. The contemporary phase (Figure 2c) exhibited a notable increase in OTE compared to the historical phase, particularly in the Alentejo region.
Examining the Q99 threshold (Figure 3), the frequency of OTE decreased across all periods compared to Q90, while maintaining similar spatial patterns with the highest occurrences in the Alentejo region. The contemporary phase (Figure 3c) showed an increase in OTE compared to the historical phase (Figure 3b), indicating a trend towards more numerous exceptional temperature events in recent decades. Figure 4 illustrates the spatial distribution of the annual average OTE for the even more extreme Q99.9 threshold (40.40 ° C ) across the global period, historical phase, and contemporary phase. This threshold is associated with rare and severe heat events, resulting, as expected, in substantially lower OTE compared to lower thresholds, with annual averages typically ranging from 0 to 8 days per year. The northern regions of Portugal, such as Bragança, Braga, and Porto (see Figure 1a), consistently show the lowest average number of occurrences across all periods. During the historical phase (Figure 4b), large parts of the northern and central regions have no exceedances, while the contemporary phase (Figure 4c) has more areas with an increase in OTE, although occurrences remain sparse.
These figures underscore a clear increase in the frequency of exceptional Tmax events in recent years, with the contemporary phase contributing more significantly to the general patterns observed in the global period across all thresholds. The results also highlight how the geographical distribution of exceptional temperature events changes as the threshold increases, with northern regions less susceptible to the most extreme heat.

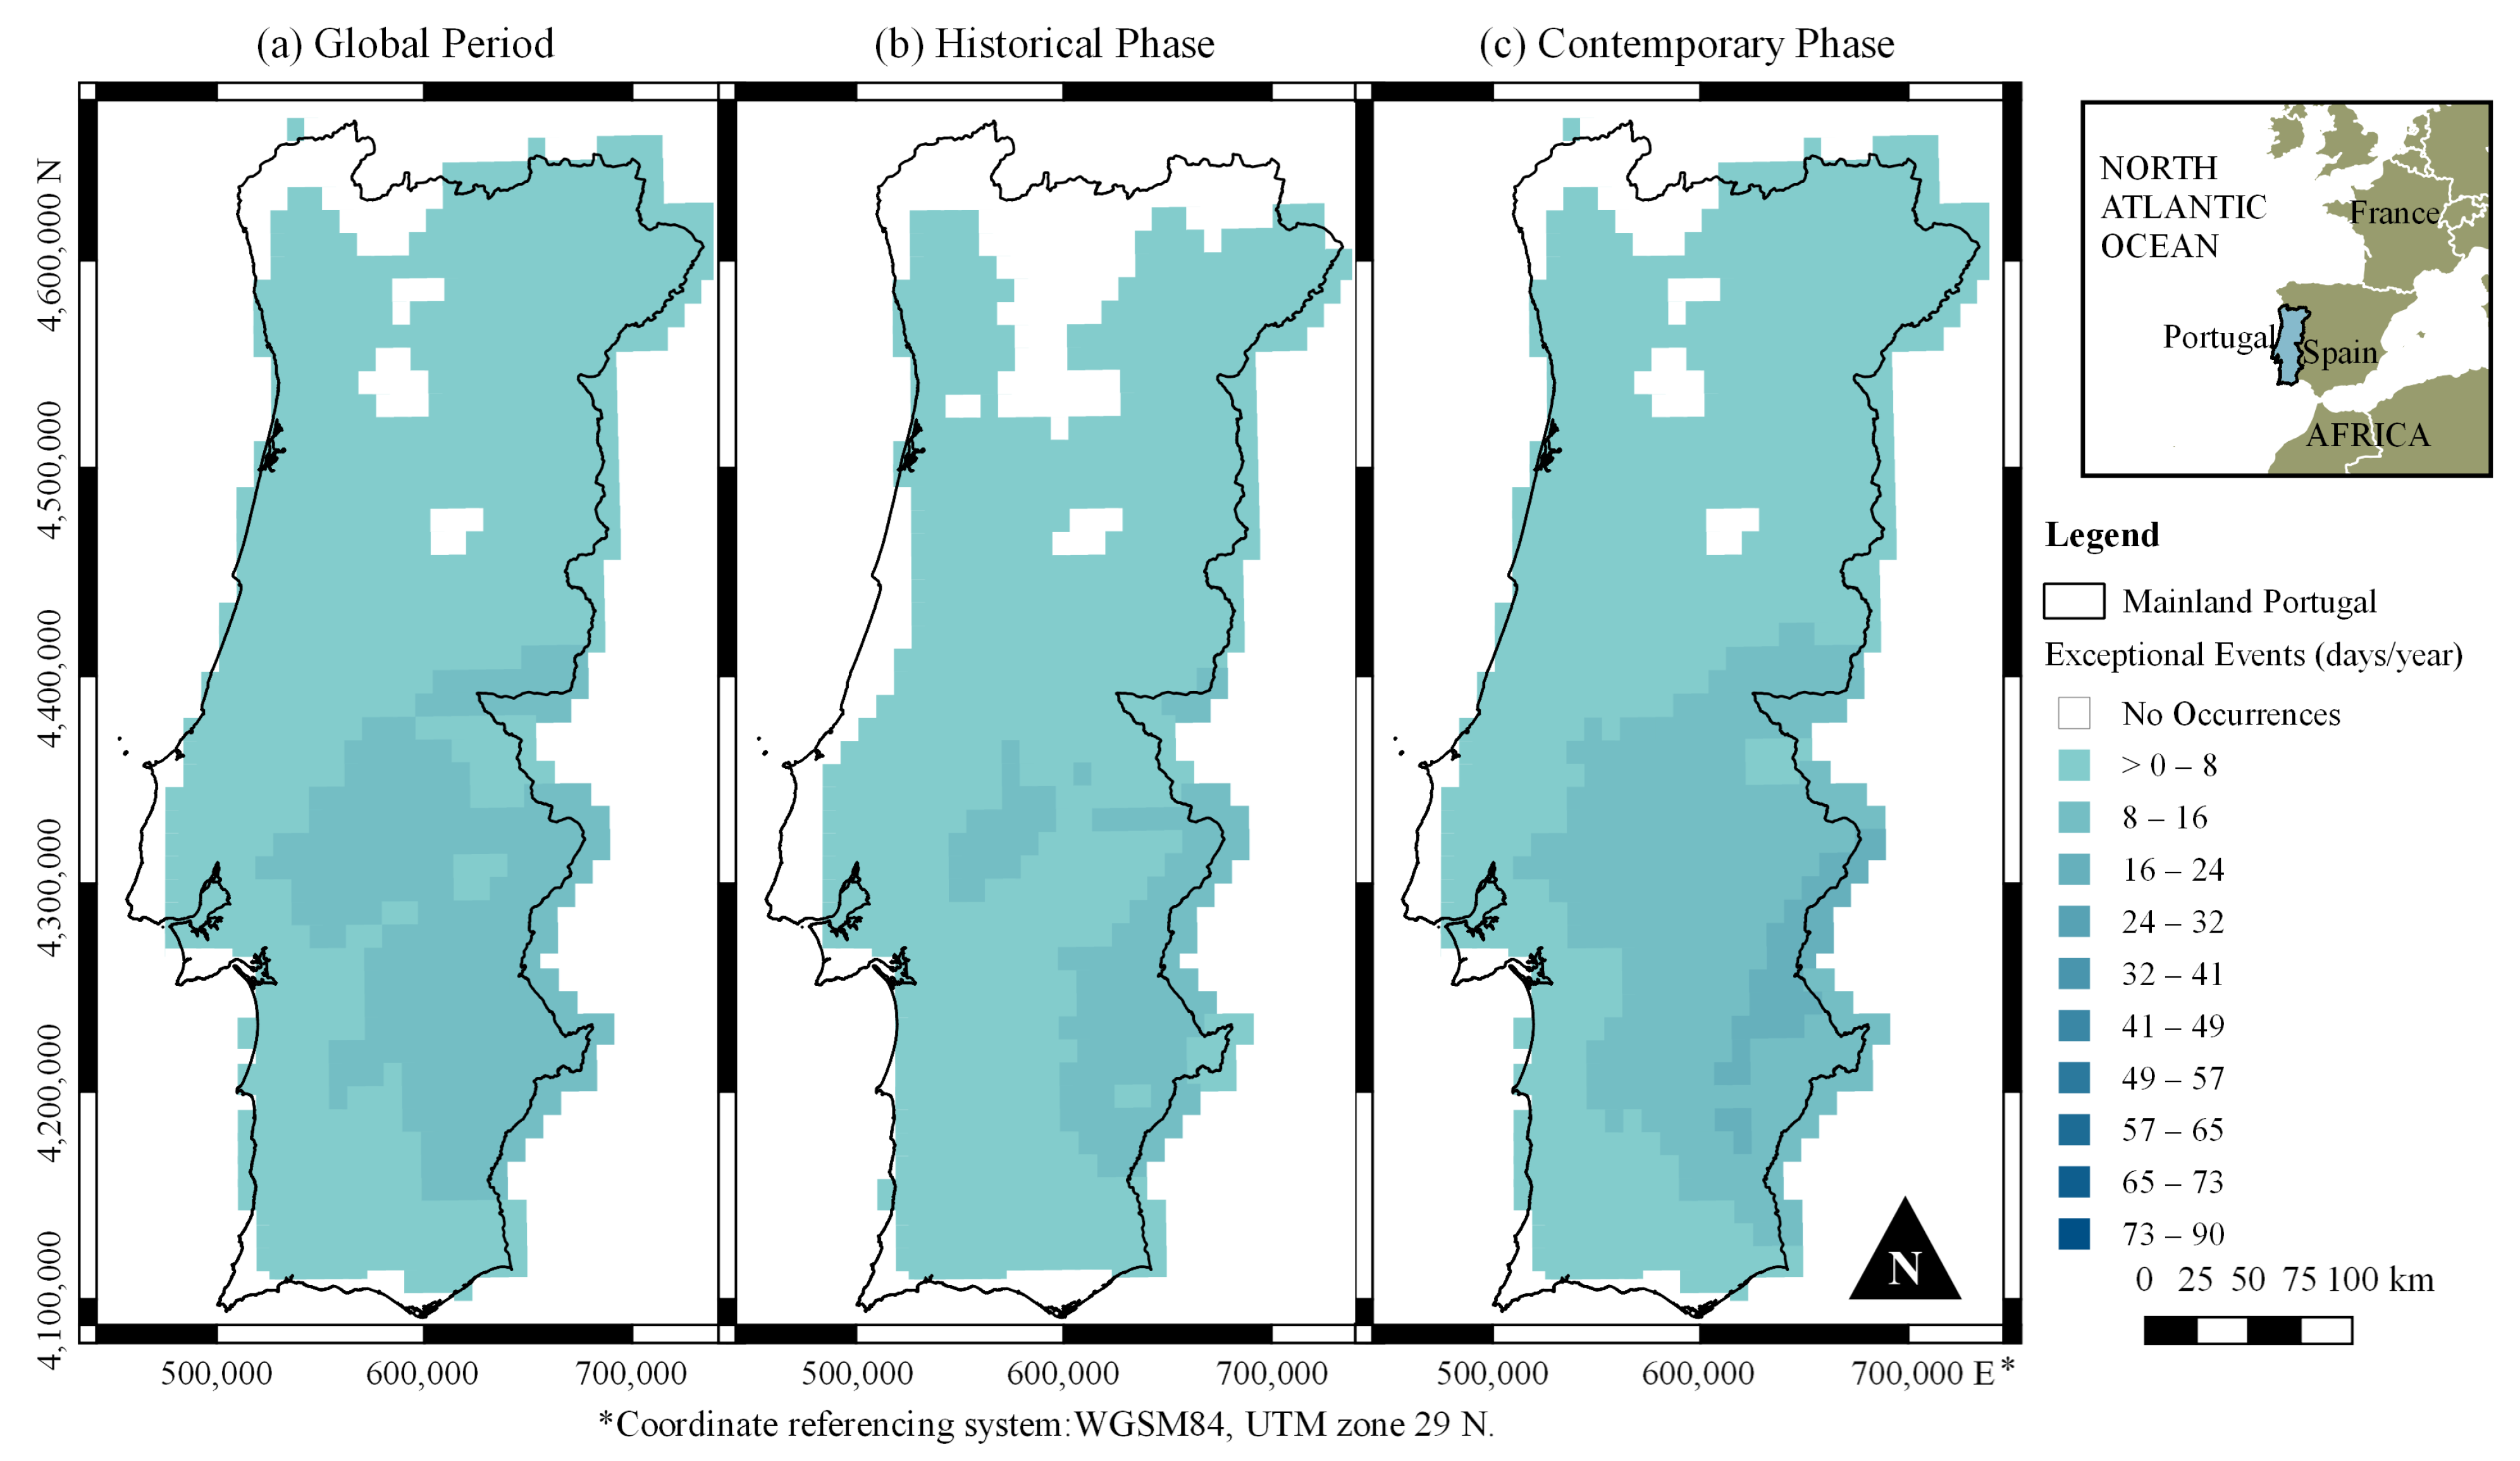
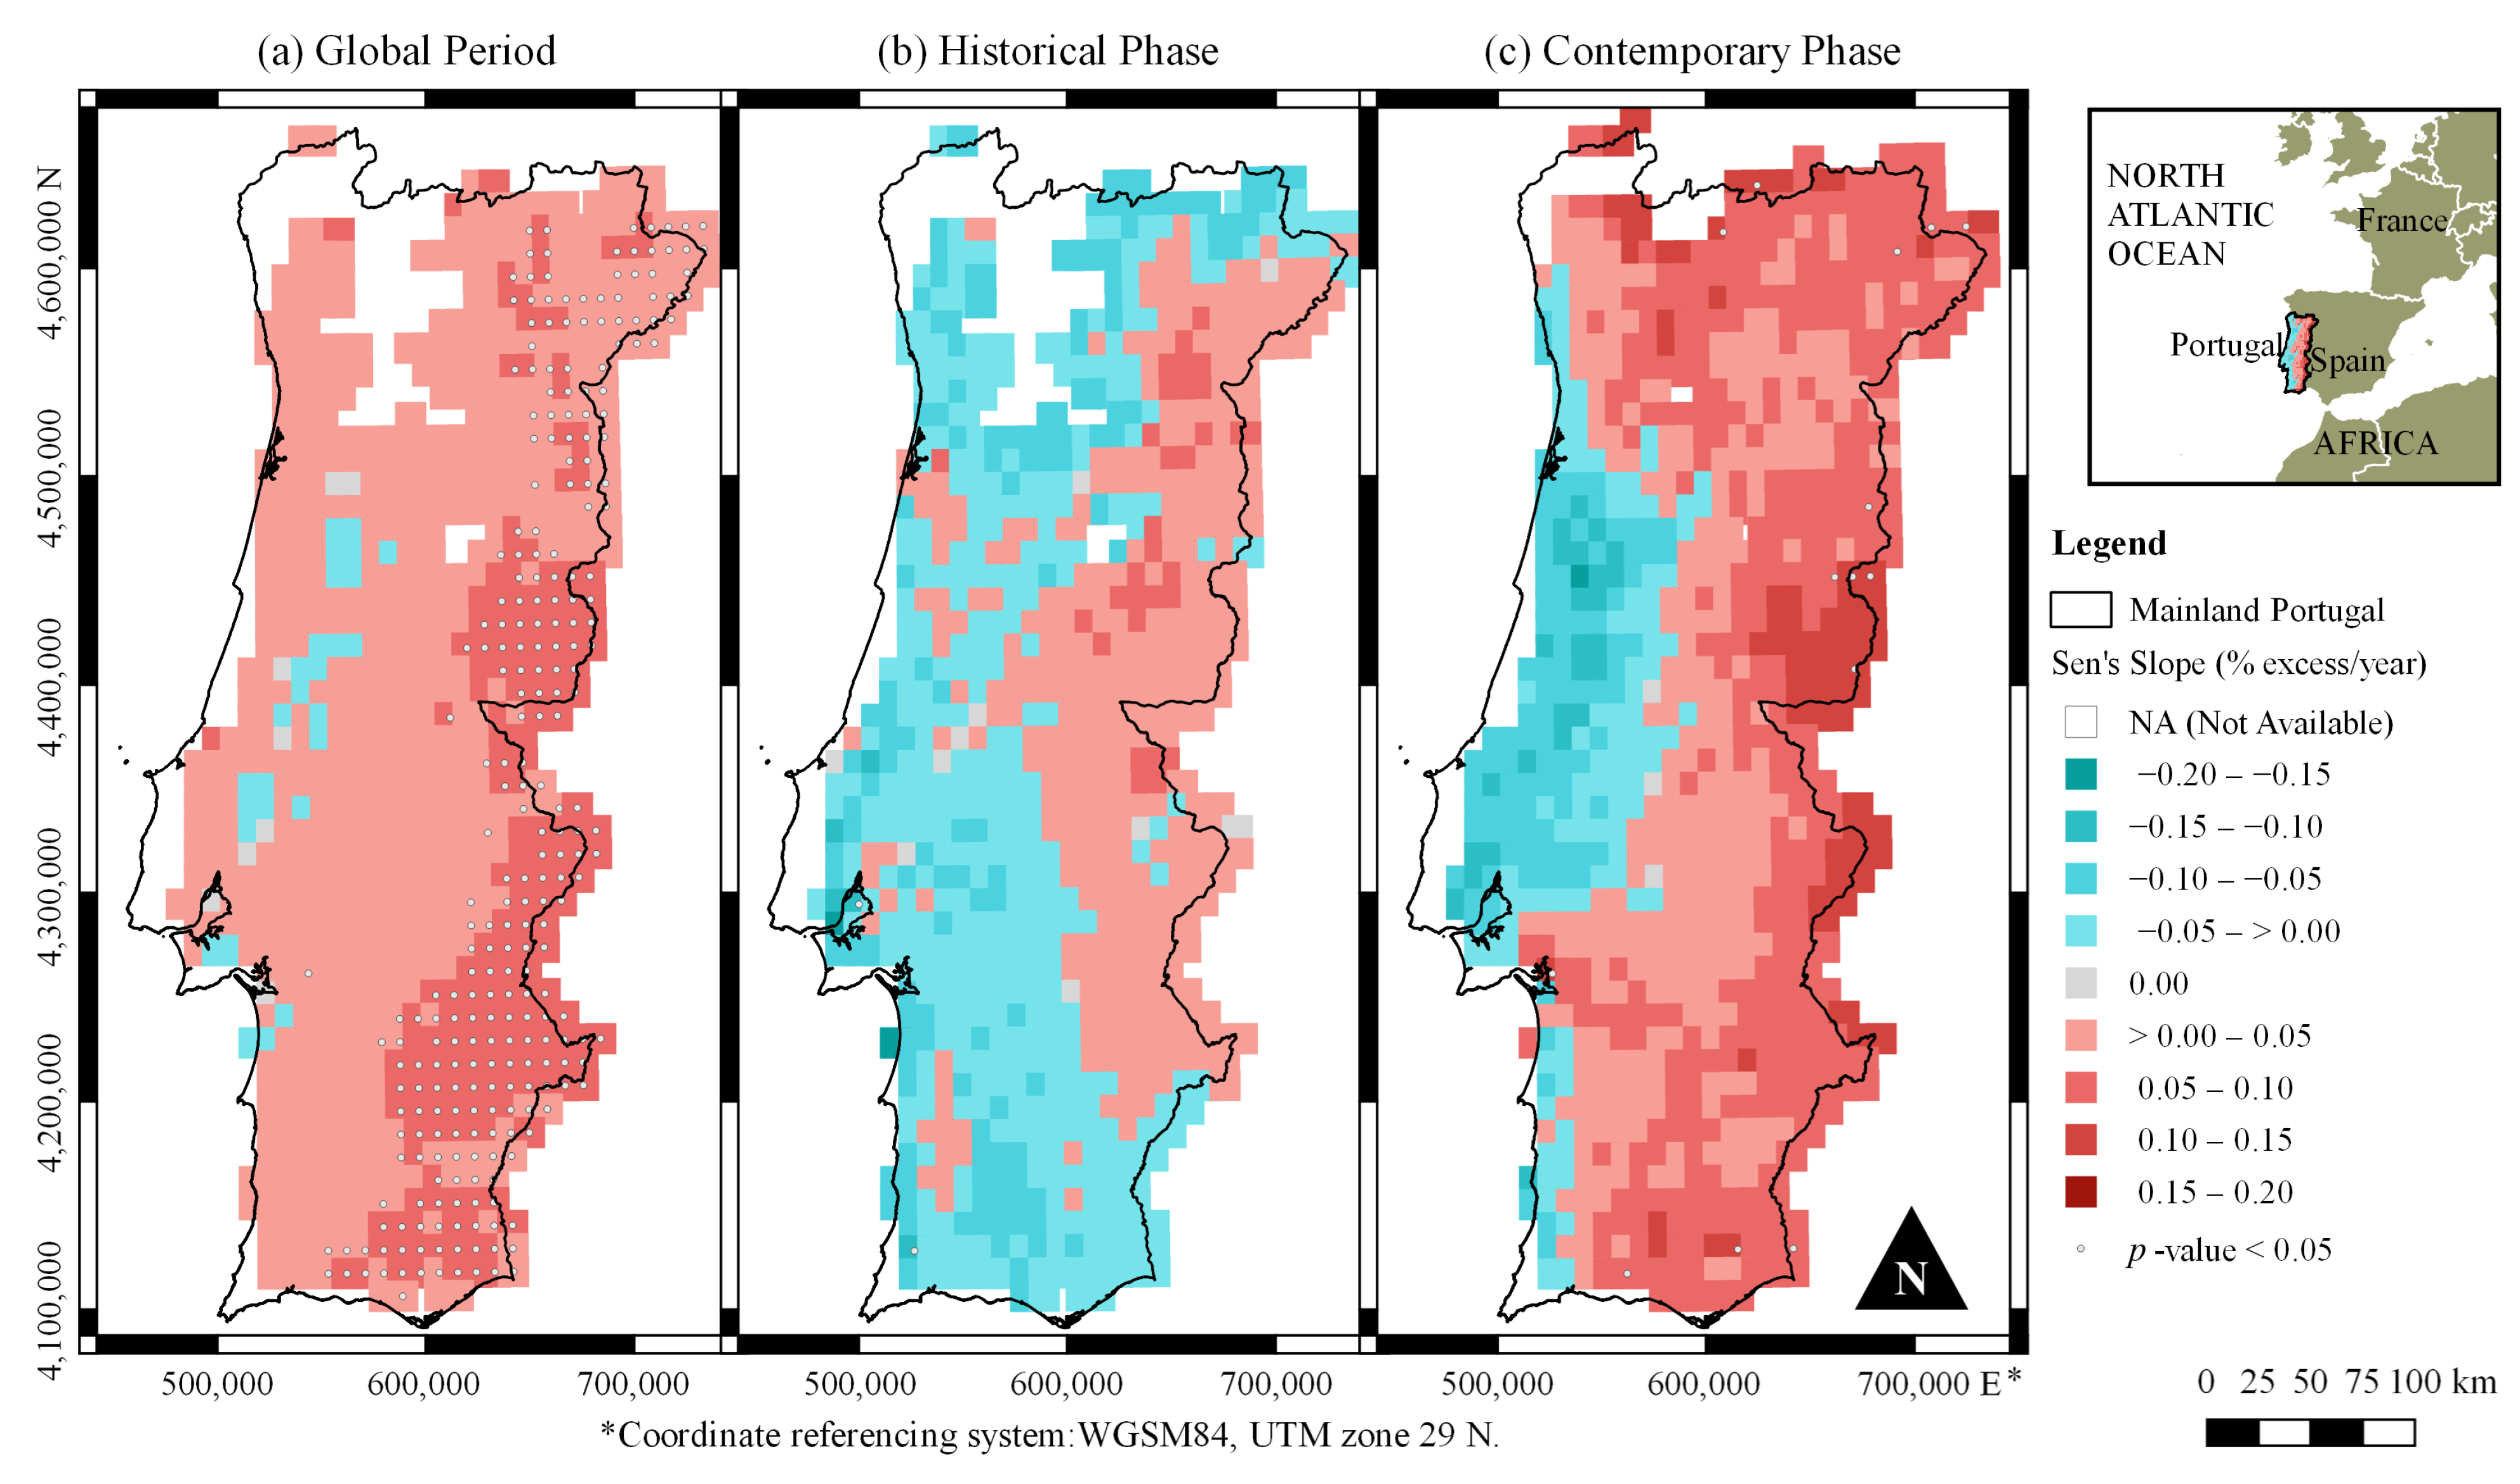
3.2. Spatial Distribution of Relative Temperature Excess in Portugal

The spatial distribution of the annual averages of Relative Temperature Excess (RTE) for the lowest threshold, Q90, is depicted across the global period and its two subperiods (historical and contemporary phases) in Figure 5. Unlike the annual averages of OTE, which encompass all years depending on the study period, RTE values are weighted by considering only years with available data (as shown in Equation (1), which is applicable only when OTE > 0 days), thus providing a more precise representation of the intensity of extreme temperature occurrences. RTE annual averages ranged from 0% to 14%, with the highest values predominantly occurring in the Alentejo region during the contemporary phase. While the spatial distribution of RTE in the global period and its subperiods shares some similarities, the contemporary phase consistently exhibits more pronounced RTE. This highlights an intensification of extreme temperature events in recent decades, with a growing deviation of exceptional Tmax events from their respective thresholds, particularly in southern Portugal. The more pronounced RTE values during the contemporary phase suggest a shift in climatic conditions, with extreme events not only becoming more frequent but also exceeding temperature thresholds by a greater margin.
Similarly, the spatial distribution of annual averages of RTE for the higher temperature thresholds, Q99 and Q99.9, is depicted in Figure 6 and Figure 7, respectively. These figures reveal an intensification of exceptional Tmax events over time, but also highlight distinct spatial and temporal patterns that vary across different phases and thresholds, revealing more marked trends than the Q90 threshold alone. For Q99 (Figure 6), RTE values ranged from 0% to 6%, with the highest excess temperatures concentrated in the Alentejo region during the contemporary phase.
While the overall distribution remains similar across periods, the contemporary phase consistently exhibits higher RTE values, reflecting a growing intensity of exceptional events. Furthermore, a notable increase in areas characterised by periods of years without exceptional occurrences (NA) is evident in the historical phase, particularly in northern regions such as Bragança, the central coastal region (e.g., Coimbra), and urbanised areas such as Lisbon and the Algarve (e.g., Lagos and Faro). In Figure 7, as with Figure 6, Relative Temperature Excess ranged from 0% to 6%. However, an interesting pattern emerges as higher occurrences were generally observed in the contemporary phase, yet RTE was surprisingly higher during the historical phase in certain areas, particularly in central Alentejo (e.g., Beja). This suggests that while extreme temperature events have become more frequent in recent decades, their intensity relative to the Q99.9 threshold was actually greater in specific regions during earlier decades. This seemingly contradictory finding could be attributed to several factors, including changes in land use, irrigation practices, or local atmospheric conditions that might have modulated the impact of extreme heat in the past [31].
Altogether, these findings indicate a significant evolution in both the spatial extent and worsening of extreme temperature events over time. In recent decades, there has been a marked increase in both the frequency and regional concentration of exceptional Tmax events, signifying a worrying trend towards more frequent and intense heat extremes. This shift highlights a spatial expansion of extreme Tmax events, with some regions that previously experienced fewer occurrences now seeing more intense events. The increasing intensity of these events may be linked to regional climate oscillations, such as the North Atlantic Oscillation (NAO), which influences temperature patterns across the region [32].

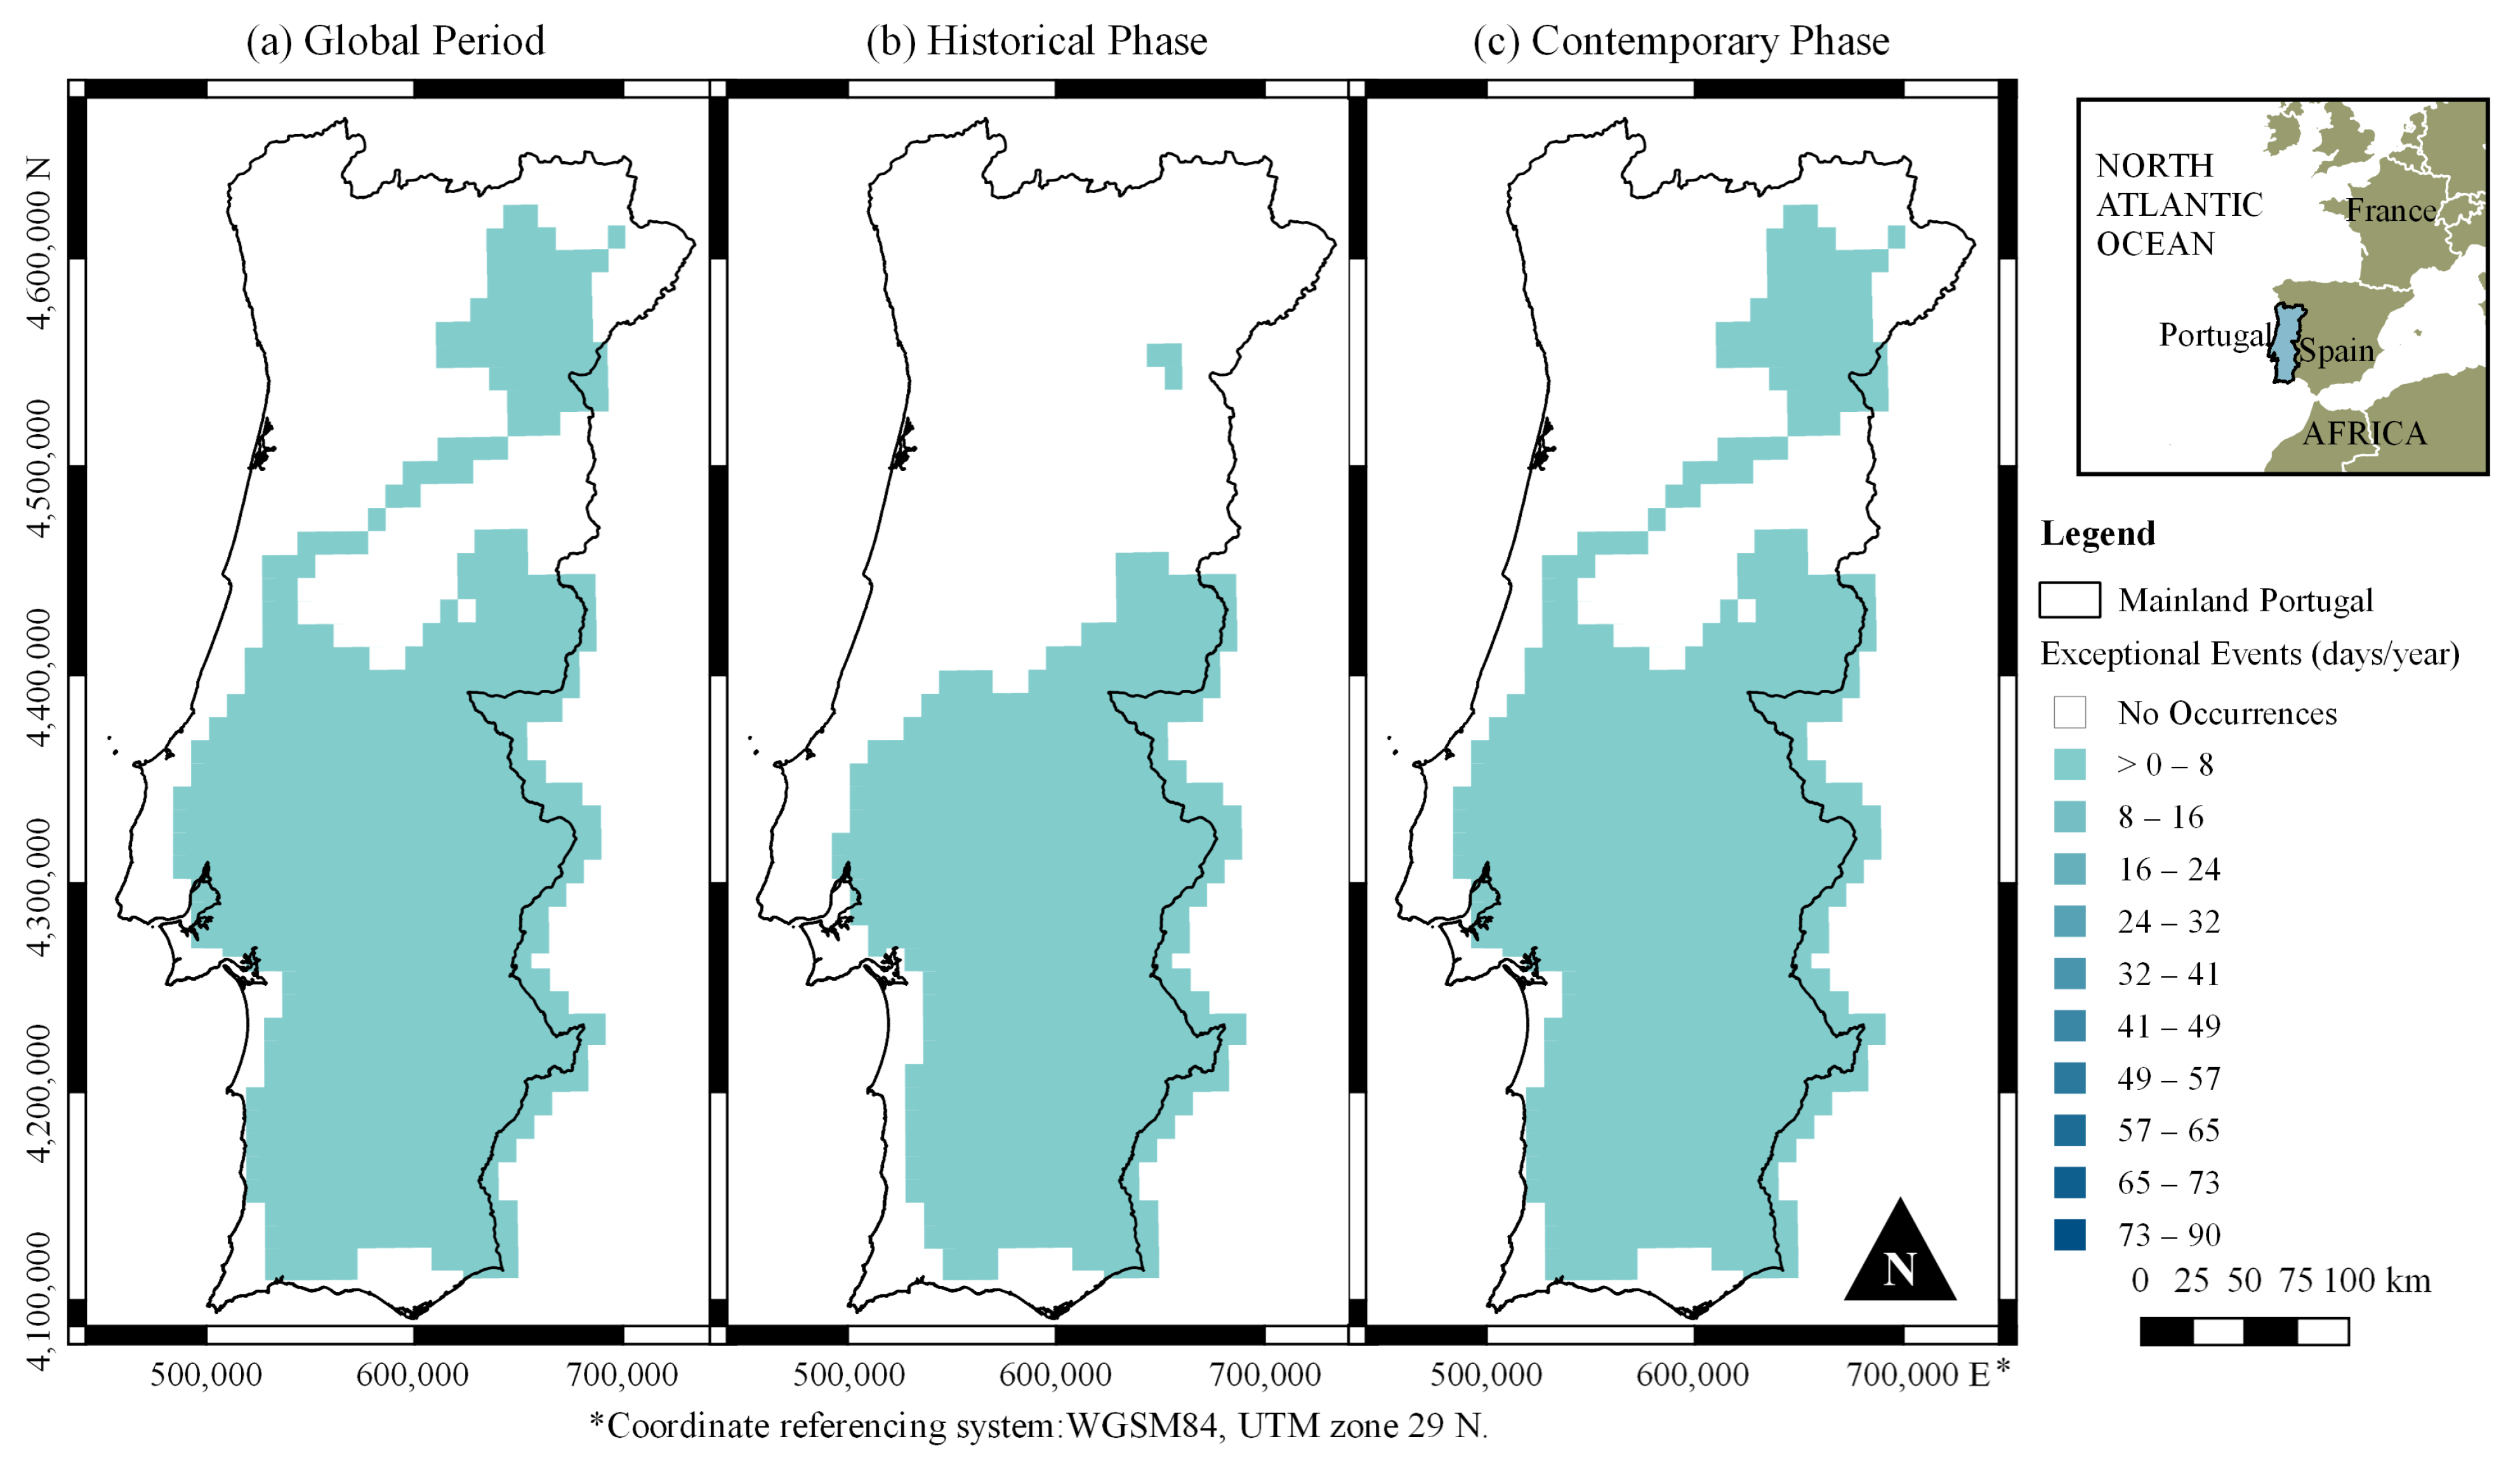
3.3. Comparative Analysis of Exceptional Temperature: Contemporary vs. Historical Phases

The Student’s t-test and spatial distribution analyses provide insight into the significance of changes in exceptional Tmax events between the contemporary (2002/2003–2023/2024) and historical (1980/1981–2001/2002) phases, examining both their occurrence (based on OTE) and intensity (based on RTE). To conduct the analysis for each centroid and temporal phase, a minimum number of 15 values of OTE or RTE out of 22 was set; otherwise, results were marked as NA. Figure 8 and Figure 9 highlight spatial patterns of statistically significant differences, revealing regions where these exceptional temperature events have become both more frequent and more intense in recent decades. In the figures, upward-pointing triangles were adopted to better enable the perception of the generalised worsening conditions in the more recent 22 years; p-values lower than 0.05 (indicating statistically significant differences) were represented by orange to red triangles. These results quantify and reinforce the general pattern of change observed in Figure 2, Figure 3, Figure 4, Figure 5, Figure 6 and Figure 7.
For OTE at Q90 (Figure 8a), very small p-values (< 0.01 ) were concentrated in southern Portugal, particularly in the Algarve and Alentejo, extending northwards along the eastern regions of Lisbon and further into central and northern Portugal. The statistical significance diminishes for higher thresholds: Q99 (Figure 8b) shows low p-values in Alentejo, Algarve, and some parts of Lisbon, while for Q99.9 (Figure 8c), significant changes in OTE were mostly confined to southeastern Portugal and isolated locations near Lisbon. The statistical difference analysis for RTE (Figure 9) reveals similar patterns to those observed for OTE. For Q90 (Figure 9a), relatively widespread statistically significant differences were observed across southern Portugal, particularly in Alentejo and Algarve, as well as along an eastern corridor extending from Castelo Branco to Bragança, with additional significant differences near Lisbon, Coimbra, and Porto. For Q99 (Figure 9b), the regions displaying significant differences were concentrated in Alentejo and Lisbon. For both OTE and RTE, the analysis of higher thresholds (Q99 and Q99.9) was constrained by data availability, with many central and northern regions excluded due to an insufficient number of observations under comparison. This limitation was particularly pronounced for Q99.9, where the scarcity of exceptional occurrences meant that most centroids could not be analysed statistically.
These results suggest that the most significant changes in both the frequency and intensity of exceptional Tmax events have occurred in southern Portugal, particularly for lower thresholds. This pattern aligns with climate change projections for the region, which indicate an increased likelihood of heatwaves and extreme temperature events in southern Europe [33]. The concentration of significant changes in southern Portugal, particularly in the Algarve and Alentejo regions, is noteworthy, as these areas are at risk of desertification [34]. For both OTE and RTE, the analysis also highlights the challenges in assessing very rare events (Q99.9) due to data limitations, especially in northern and central regions.

3.4. Severity Heatmap of Exceptional Tmax Events

In the context of this study, “severity” refers to the combined frequency and intensity of exceptional temperature events, particularly how these aspects change between the two analysed 22-year phases. This metric quantifies the potential impact of these events based on their frequency and intensity relative to given temperature thresholds (Q90, Q99, and Q99.9). Figure 10 presents severity heatmaps combining annual averages of OTE and RTE, based on the 1012 centroids, to assess changes between the historical and contemporary phases. The categories (outlined in Section 2.7) classify centroids based on variations in the number of occurrences (days) and temperature excess (%).
For the severity heatmap, the classification ranges from “Case 0” (white), where no comparison is possible due to a lack of occurrences in either phase, to “Case 1” (red), representing areas experiencing more frequent and intense events in the contemporary phase, i.e., “More” OTE & “More” RTE. Notably, the classification system distinguishes between areas with more frequent but less intense events—“Case 2” (orange), where higher number of exceptional events may potentially be more harmful than increased intensity alone [31]—and those with fewer occurrences but greater intensity—“Case 3” (yellow). The classification ends in identifying areas with both lower frequency and intensity in the most recent years, i.e., “Less” OTE & “Less” RTE, being the most favourable coupled conditions—“Case 4” (green).
For the threshold Q 90 = 30.60   ° C , most of the centroids fell into Case 1 (More & More), reflecting a clear pattern of both higher occurrences and greater excess during the contemporary phase compared to the historical phase (Figure 10a). This result underscores a widespread increase in the frequency and intensity of exceptional Tmax in recent years. A very small number of centroids, particularly in northern Portugal (ca. 16 centroids), fell into Case 2 (More & Less), indicating an increase in the frequency of exceptional events but a decrease in their intensity relative to the threshold. This suggests regional variability in the impact of extreme heat, with some areas experiencing more frequent but less intense temperature extremes. For the higher threshold Q 99 = 37.04   ° C (Figure 10b), about 90% of the centroids exhibited Case 1 behaviour, indicating that the vast majority of locations have experienced both a significant increase in the frequency and intensity of exceptional Tmax events during recent decades. This pattern is even more pronounced compared to Q90, showing a clearer and more widespread trend of intensifying extreme heat events in the contemporary phase. Around 135 centroids showed Case 2 behaviour, suggesting more frequent occurrences of exceptional temperatures but decreased intensity relative to the threshold. Interestingly, only three centroids near Guarda exhibited Case 3 patterns (Less & More), where fewer occurrences were observed, but the intensity of the events increased. Three centroids near Braga fell into Case 4 (Less & Less), indicating improvements over time with both a reduction in the frequency and intensity of extreme heat events.
At the highest threshold, Q 99.9 = 40.40   ° C (Figure 10c), a dominant proportion of the centroids (44%) fell into Case 0, particularly in northern, central, and coastal regions, where insufficient data from one or both phases made the comparison impossible. For the centroids where comparison was possible, Case 1 showed up prominently, especially in the inner northern and central regions, confirming that exceptional events at this high threshold have become more frequent and intense over time. Conversely, Case 2 patterns were more prominent in the Alentejo region, suggesting that while the frequency of extreme heat events at this threshold increased, their intensity relative to the it has decreased in more recent decades.
Interestingly, the scarcity of green areas (Case 4, Less & Less) across all maps underscores the rarity of locations experiencing a decrease in both frequency and intensity of extreme heat events. This observation reinforces the widespread trend towards more frequent and intense exceptional temperature events throughout mainland Portugal. The regional differences revealed by this analysis, particularly in areas such as Alentejo and northern Portugal, emphasise the need for targeted adaptation strategies tailored to local climate characteristics. These findings underscore the importance of understanding spatial variations in extreme heat impacts, especially in the context of ongoing climate change and its influence on temperature patterns.

4. Discussion

The results of this study are in line with the larger warming trends observed in the Mediterranean region, highlighting concerns about the increasing frequency and intensity of extreme temperature events [35]. The observed increase in the frequency of exceptional Tmax events in Portugal during the contemporary phase (2002/2003–2023/2024) is consistent with findings from other Mediterranean countries, where recent decades have been marked by prolonged and more intense heatwaves [36,37]. It should be noted that although this study uses a percentile-based threshold method to detect exceptional temperature events, other studies concentrate on heatwaves, which have different definitions even though they are signs of extreme heat. For instance, Russo et al. [38] and Russo and Domeisen [39] defined a heatwave as a duration of at least three days in which the daily maximum temperature surpasses the 90th percentile of the local historical distribution for that day. Nonetheless, within the climate and weather community, a plethora of approaches is still used to define an “extreme” heat event. Despite the differing definitions, the overall pattern of change in such extreme phenomena is expected to remain broadly consistent across methodologies. This methodological variation supports the robustness of the observed warming signal across different definitions of extreme heat and highlights the variety of approaches in the literature.
Studies in Spain have reported a sharp increase in the frequency of days exceeding high temperature percentiles, particularly in southern and interior regions such as Andalusia and Extremadura [40], which share similar climatic characteristics with Alentejo (southern Portugal). Similarly, research in Italy has shown a significant increase in heatwave duration and magnitude, particularly in urbanised areas such as Rome, Naples, and Milan [41,42]. These significant extreme heat changes in southern Spain and southern Italy, where semi-arid climatic conditions make these regions particularly vulnerable to temperature extremes, are mirrored in the observed spatial variability of exceptional Tmax events in Portugal, with a concentration in the Alentejo region as shown in Section 3.
Furthermore, in Greece, extreme heat episodes have increased, particularly in Athens and other densely populated coastal cities, where the Urban Heat Island (UHI) effect amplifies warming trends [43]. However, it is important to note that the use of ERA5-Land data to address the effect of UHI in urban areas may have certain limitations [44,45]. Although the ERA5-Land dataset has a relatively coarse resolution [9] and is useful for capturing broader climatic trends, as demonstrated in this study, it does not explicitly account for surface processes unique to urban areas, which are essential for accurately assessing the effects of the Urban Heat Island (UHI) and may therefore not accurately represent urban microclimates. This could result in an underestimation of urban temperature extremes, particularly in densely populated cities where the UHI effect is most pronounced. This limitation emphasises the importance of developing specific datasets that more accurately reflect the complex structure of urban heat islands and suggests that care must be taken when interpreting temperature extremes in urban areas. Moreover, the integration of alternative metrics—such as the Universal Thermal Climate Index (UTCI) or mean radiant temperature (MRT) [46,47]—may provide a more comprehensive and human-centred understanding of thermal stress and exposure during extreme heat events, particularly in urban areas. Unlike air temperature alone, these indices account for various environmental factors, including humidity, wind speed, solar radiation, and the thermal properties of surrounding surfaces, all of which influence how heat is actually perceived by the human body. For instance, the UTCI reflects physiological responses to combined meteorological conditions, while MRT captures the total radiant heat load from built environments, making both particularly relevant for assessing thermal comfort and health risks in cities. However, it is important to note that the primary aim of this study was to provide a broader, national-scale perspective based on ERA5-Land data in order to identify emerging spatial patterns and regional hotspots of increasing exceptional Tmax events. This “bigger picture” approach serves as a foundation for subsequent investigations focused on specific urban areas, where higher-resolution datasets and more nuanced thermal indices could be employed to better assess localised impacts and adaptation needs.
The UHI effect, in combination with broader climate change, has exacerbated temperature extremes across the Mediterranean, leading to increased risks of heat-related mortality, wildfires, and ecosystem stress [48]. These shared experiences suggest that the mechanisms driving changes in exceptional temperature events in Portugal are not isolated but rather part of a larger Mediterranean-wide phenomenon. However, Portugal’s pronounced maritime influence [13] tends to moderate temperature extremes, particularly in coastal areas—as evidenced by the lower temperature excess in regions such as Lisbon and around Faro, as shown in Figure 5. This moderating effect may partially account for the observed differences in the exceptional temperature events between Portugal and other Mediterranean regions. In contrast, the climates of eastern and southern Mediterranean countries are often more continental or semi-arid [49,50], which contributes to higher maximum temperatures during heatwaves. Furthermore, local temperature patterns can be influenced by differences in the degree of urbanisation, such as the presence of green infrastructure or the compactness of cities, which may either exacerbate or mitigate the UHI effects [51]. This is evident in the Lisbon area, where areas with higher building density and fewer green spaces experience greater heat stress, while tree-covered areas such as Monsanto Park exhibit significantly lower local temperatures [52]. Additionally, methodological differences in the definition of extreme heat events, distinct from the criteria adopted in this research, may also contribute to the limited disparities observed among regions.
The observed increase in the intensity and frequency of exceptional temperature events in Portugal in this study aligns not only with regional Mediterranean trends but also reflects global patterns of warming. Numerous studies have documented a widespread rise in extreme temperature events worldwide, with particular emphasis on Europe, North America, and parts of Asia [53,54]. The results of this study contribute to this growing body of evidence, highlighting how extreme temperatures in Portugal have evolved in line with broader global trends. Over the past four decades, temperature extremes have become more frequent and intense worldwide, a pattern highlighted in the IPCC Sixth Assessment Report, which attributes these changes mostly to human activities [3]. This global trend is also evident in Portugal, as illustrated in Figure 10, which depicts the rise in the characteristics of exceptional events over the last 44 years. The findings for the Portuguese setting are also consistent with those observed in France and Germany, where extreme heat events have intensified since the early 2000s [55,56,57]. The European heatwaves of 2003, 2010, and 2022 [58] serve as prime examples of how these extreme events are becoming more common, with cascading effects on health, agriculture, and infrastructure. Beyond Europe, similar trends have been observed, for instance, in the United States, where studies indicate an increase in the frequency and duration of heatwaves, particularly in southwestern states such as California, Arizona, and Texas [59]. Likewise, in Australia, recent decades have seen a rise in both the intensity and spatial extent of extreme heat events, particularly in regions already prone to high temperatures [35,60]. Collectively, these global trends underscore the importance of continued monitoring and analysis of exceptional temperature events, not only for scientific understanding but also for informing adaptation and mitigation strategies.

Long-Term Trends in Exceptional Tmax Events: Frequency (OTE) and Intensity (RTE)

A supplementary analysis was conducted to reinforce the previously detected trends in exceptional temperature occurrences and temperature excess across mainland Portugal. This additional investigation focused on the 44-year global period and two 22-year subperiods, employing the Mann–Kendall test and Sen’s slope estimator [61,62] to the time series (i.e., applied to 44 values for the global period and 22 values for each subperiod) at each centroid. The analysis specifically targeted the lowest temperature threshold (Q 90 = 30.60   ° C ) due to its higher number of yearly occurrences, which allowed for a more robust application of Sen’s slope in measuring monotonic trends. The Mann–Kendall test was used to detect monotonic trends in the chronological series of the Occurrence of Exceptional Tmax Events (OTE) and Relative Temperature Excess (RTE), while the Sen’s slope estimator was employed to calculate the magnitude of these trends— Figure 11 and Figure 12, respectively. This approach was selected for its robustness in measuring trend strength, requiring complete data series for all years to ensure accurate trend estimation.
Figure 11 illustrates the Sen’s slope estimates for trends in OTE (days/year) during the three distinct periods. In Figure 11a, representing the global period, from 1980/1981 to 2023/2024, a widespread positive trend (red shades) is evident, particularly in central and southern Portugal, indicating a general increase in the frequency of exceptional temperature events. The strongest positive trends (> 0.8 days/year) are concentrated in the southern interior and parts of the central region. Approximately 68 % of the 1012 centroids show statistically significant trends (p-value < 0.05 , indicated by light grey bullets), reinforcing the reliability of these results. In contrast, Figure 11b for the historical phase, from 1980/1981 to 2001/2002, reveals predominantly negative trends (blue shades) across most of the country, suggesting a decrease in exceptional temperature events during this period. However, no centroids exhibit statistically significant trends, indicating lower statistical certainty in these patterns. For the contemporary phase, from 2002/2003 to 2023/2024, shown in Figure 11c, a strong positive trend (red shades) dominates, similar to the global period. This phase exhibits the most widespread and intense increases in exceptional temperature events, with the highest trends (> 0.8 days/year) concentrated in the southern interior, central interior, and some northeastern regions. A large number of locations (162 centroids) show statistical significance, further reinforcing the reliability of these trends. While most of mainland Portugal shows strong positive trends, some coastal areas exhibit negative trends (blue shades), indicating localised decreases in frequency.
Figure 12 presents Sen’s slope estimates for RTE trends across mainland Portugal. In Figure 12a, representing the global period, most of the territory exhibits positive trends (shades of red), indicating an overall increase in temperature excess over time. The most intense warming signals (darker red shades) are concentrated in southern and central inner regions. In total, 163 centroids show statistically significant trends (p-value < 0.05 ), reinforcing the robustness of these findings. However, regions with unavailable data for Sen’s slope estimation (NA) are also present, particularly in areas where no occurrences of temperature excess were recorded. Figure 12b for the historical phase shows predominantly negative trends (blue shades) in central and southern inner Portugal, indicating a reduction in temperature excess during this period. Certain areas in the eastern central region and northern locations exhibit positive trends, suggesting localised warming despite the general cooling patterns elsewhere. Statistically significant results are limited during this phase, with only two centroids showing p-values below 0.05, highlighting greater uncertainty. Figure 12c depicts the contemporary phase, where strong positive trends (red shades) dominate most of mainland Portugal, indicating widespread warming. The most intense increases in temperature excess (dark red shades) are concentrated in central and southern regions, although some areas in the northwest show negative trends (blue shades), reflecting localised cooling. Statistically significant results remain limited, with only 14 scattered centroids displaying p-values below 0.05, and 92 centroids are marked as NA due to insufficient data. The presence of NA regions in all maps highlights an important limitation: Sen’s slope evaluates monotonic trends—either consistently increasing or decreasing over time—and cannot provide meaningful results for locations with irregular datasets or years without occurrences [63]. These areas are represented by white pixels on all maps.
In general, Figure 11 and Figure 12 highlight a temporal shift in both the frequency and intensity of exceptional temperature events. The significant spatial variability in the trends, including areas of cooling or no detectable change, emphasises the localised nature of climate change impacts across Portugal. Effect sizes and confidence intervals alongside p-values, which indicate the likelihood of observing a difference by chance [64], are recommended for a more complete understanding of the trends. Overall, this study adds to evidence linking climate change to increasing temperature extremes, highlighting the need for localised mitigation efforts.

5. Conclusions

The spatial and temporal trends in Occurrence of Exceptional Tmax Events (OTE) and Relative Temperature Excess (RTE) observed in this study carry significant practical implications. Although higher thresholds (e.g., Q99.0 and Q99.9) are infrequently exceeded, the observed increases in both the frequency and intensity of exceptional temperature events, particularly during the contemporary phase, indicates heightened exposure to heat extremes across mainland Portugal, with the Alentejo region in the south experiencing the most pronounced impacts. When considering thermal comfort classifications such as the Universal Thermal Climate Index (UTCI), which categorises temperatures above 38   ° C as “very strong heat stress” and above 46   ° C as “extreme heat stress” [65], the findings in this research indicate that some regions are increasingly experiencing conditions that might be associated with considerable health risks [66]. These conditions can exacerbate heat-related illnesses and mortality, especially among vulnerable populations such as the elderly, children, and outdoor workers. Furthermore, the intensification of extreme temperatures may reduce agricultural productivity, increase water demand, and place additional stress on ecosystems already affected by climate variability [67]. By contextualising these patterns within the framework of real-world impacts, the results highlight not only statistically significant trends but also meaningful signals of emerging regional climate vulnerabilities.
The severity heatmaps developed offer a valuable tool for identifying areas at high risk of extreme heat, providing spatially explicit assessments that can inform targeted adaptation measures. These findings highlight the need for sectoral adaptation strategies across various domains, including urban areas, public health, and agriculture, with an emphasis on strengthening early warning systems and heat action plans to protect vulnerable populations [58]. For the agricultural sector, particularly in Alentejo, increased resilience strategies are necessary, including the adoption of heat-tolerant crops, optimised irrigation techniques, and soil moisture conservation practices [68]. At the policy level, these trends reinforce the urgency of climate mitigation efforts, aligning with IPCC projections that indicate that temperature extremes will continue to intensify unless significant reductions in greenhouse gas emissions occur [3]. More research is required to refine the understanding of the drivers of extreme temperature events, while high-resolution regional climate models could provide more precise projections for local adaptation planning. In general, the heatmaps developed in this study aim to provide visual tools that are straightforward to interpret, potentially making them accessible to a wide range of stakeholders in Portugal. These visualisations may support informed decision making and targeted policy responses, offering a foundation for future climate adaptation and mitigation efforts in Portugal.

Author Contributions

Conceptualisation, L.A.E. and M.M.P.; methodology, L.A.E.; software, L.A.E.; validation, L.A.E. and M.M.P.; formal analysis, L.A.E.; investigation, L.A.E.; resources, L.A.E.; data curation, L.A.E.; writing—original draft preparation, L.A.E.; writing—review and editing, L.A.E. and M.M.P.; visualisation, L.A.E.; supervision, M.M.P. All authors have read and agreed to the published version of the manuscript.

Funding

This research received no external funding.

Institutional Review Board Statement

Not applicable.

Informed Consent Statement

Not applicable.

Data Availability Statement

The dataset supporting the findings of this study and all associated analyses are publicly available and can be accessed via the following reference: Espinosa, L. A. (2025). Exceptional Maximum Temperature Events in Portugal (1980–2024): Centroid Locations, Daily and Annual Tmax Data (Version 2). figshare. https://doi.org/10.6084/m9.figshare.28430228.v2, accessed on 21 February 2025.

Acknowledgments

This research was supported by the Foundation for Science and Technology (FCT) through funding UIDB/04625/2020 from the research unit CERIS and by the European Union’s Horizon 2020 research and innovation programme SCORE under grant agreement No. 101003534.

Conflicts of Interest

The authors declare no conflicts of interest.

References

  1. Hansen, J.; Sato, M.; Ruedy, R. Perceptions of climate change. Proc. Natl. Acad. Sci. USA 2012, 109, E2415–E2423. [Google Scholar] [CrossRef] [PubMed]
  2. Diffenbaugh, N.S.; Singh, D.; Mankin, J.S.; Horton, D.E.; Swain, D.L.; Touma, D.; Charland, A.; Liu, Y.; Haugen, M.; Tsiang, M.; et al. Quantifying the influence of global warming on unprecedented extreme climate events. Proc. Natl. Acad. Sci. USA 2017, 114, 4881–4886. [Google Scholar] [CrossRef] [PubMed]
  3. Intergovernmental Panel on Climate Change (IPCC). Climate Change 2021—The Physical Science Basis: Working Group I Contribution to the Sixth Assessment Report of the Intergovernmental Panel on Climate Change; Cambridge University Press: Cambridge, UK, 2023. [Google Scholar] [CrossRef]
  4. Tong, S.; Prior, J.; McGregor, G.; Shi, X.; Kinney, P. Urban heat: An increasing threat to global health. BMJ 2021, 375, n2467. [Google Scholar] [CrossRef] [PubMed]
  5. Yang, Y.; Zhao, N.; Wang, Y.; Chen, M. Variations in summertime compound heat extremes and their connections to urbanization in China during 1980–2020. Environ. Res. Lett. 2022, 17, 064024. [Google Scholar] [CrossRef]
  6. Ramos, A.M.; Trigo, R.M.; Santo, F.E. Evolution of extreme temperatures over Portugal: Recent changes and future scenarios. Clim. Res. 2011, 48, 177–192. [Google Scholar] [CrossRef]
  7. Cardoso, R.M.; Lima, D.C.; Soares, P.M. How persistent and hazardous will extreme temperature events become in a warming Portugal? Weather. Clim. Extrem. 2023, 41, 100600. [Google Scholar] [CrossRef]
  8. Thirumalai, K.; DiNezio, P.N.; Okumura, Y.; Deser, C. Extreme temperatures in Southeast Asia caused by El Niño and worsened by global warming. Nat. Commun. 2017, 8, 15531. [Google Scholar] [CrossRef]
  9. Muñoz-Sabater, J.; Dutra, E.; Agustí-Panareda, A.; Albergel, C.; Arduini, G.; Balsamo, G.; Boussetta, S.; Choulga, M.; Harrigan, S.; Hersbach, H.; et al. ERA5-Land: A state-of-the-art global reanalysis dataset for land applications. Earth Syst. Sci. Data 2021, 13, 4349–4383. [Google Scholar] [CrossRef]
  10. Espinosa, L.A.; Portela, M.M.; Gharbia, S. Assessing Changes in Exceptional Rainfall in Portugal Using ERA5-Land Reanalysis Data (1981/1982–2022/2023). Water 2024, 16, 628. [Google Scholar] [CrossRef]
  11. Giorgi, F. Climate Change Hot-Spots. Geophys. Res. Lett. 2006, 33, L08707. [Google Scholar] [CrossRef]
  12. Davis, R.E.; Hayden, B.P.; Gay, D.A.; Phillips, W.L.; Jones, G.V. The North Atlantic Subtropical Anticyclone. J. Clim. 1997, 10, 728–744. [Google Scholar] [CrossRef]
  13. Mora, C.; Vieira, G. The Climate of Portugal. In Landscapes and Landforms of Portugal; World Geomorphological Landscapes (WGLC); Springer: Berlin/Heidelberg, Germany, 2020; pp. 33–46. [Google Scholar] [CrossRef]
  14. Agency, I.E. Portugal Climate Resilience Policy Indicator. 2021. Available online: https://www.iea.org/articles/portugal-climate-resilience-policy-indicator (accessed on 5 February 2025).
  15. Instituto Português do Mar e da Atmosfera (IPMA). Boletim Climatológico—Agosto 2018. Climatological Bulletin ISSN 2183-1076, Instituto Português do Mar e da Atmosfera (IPMA), Lisbon, Portugal. 2018. Available online: https://www.ipma.pt/resources.www/docs/im.publicacoes/edicoes.online/20180924/QyzZvZwgxxBnLFiHkSkX/cli_20180801_20180831_pcl_mm_co_pt.pdf (accessed on 5 February 2025).
  16. Espinosa, L.A.; Portela, M.M.; Freitas, L.M.M.; Gharbia, S. Addressing the Spatiotemporal Patterns of Heatwaves in Portugal with a Validated ERA5-Land Dataset (1980–2021). Water 2023, 15, 3102. [Google Scholar] [CrossRef]
  17. Garcia-Herrera, R.; Díaz, J.; Trigo, R.; Luterbacher, J.; Fischer, E. A Review of the European Summer Heat Wave of 2003. Crit. Rev. Environ. Sci. Technol. 2010, 40, 267–306. [Google Scholar] [CrossRef]
  18. Dupuy, J.; Fargeon, H.; Martin-StPaul, N.; Pimont, F.; Ruffault, J.; Guijarro, M.; Hernando, C.; Madrigal, J.; Fernandes, P. Climate change impact on future wildfire danger and activity in southern Europe: A review. Ann. For. Sci. 2020, 77. [Google Scholar] [CrossRef]
  19. Trigo, R.M.; Osborn, T.J.; Corte-Real, J.M. The North Atlantic Oscillation influence on Europe: Climate impacts and associated physical mechanisms. Clim. Res. 2002, 20, 9–17. [Google Scholar] [CrossRef]
  20. Jabbar, H.K.; Hamoodi, M.N.; Al-Hameedawi, A.N. Urban heat islands: A review of contributing factors, effects and data. Proc. IOP Conf. Ser. Earth Environ. Sci. 2023, 1129, 012038. [Google Scholar] [CrossRef]
  21. Silva, R.; Carvalho, A.C.; Pereira, S.C.; Carvalho, D.; Rocha, A. Lisbon urban heat island in future urban and climate scenarios. Urban Clim. 2022, 44, 101218. [Google Scholar] [CrossRef]
  22. Copernicus Climate Change Service. Copernicus Climate Data Store. 2024. Available online: https://cds.climate.copernicus.eu/ (accessed on 15 December 2024).
  23. U.S. Geological Survey. Explanations for the National Water Conditions: What is a Water Year? Available online: https://water.usgs.gov/nwc/explain_data.html (accessed on 5 February 2025).
  24. Randall, D.A.; Wood, R.A.; Bony, S.; Colman, R.; Fichefet, T.; Fyfe, J.; Kattsov, V.; Pitman, A.; Shukla, J.; Srinivasan, J.; et al. Climate Models and Their Evaluation. In Climate Change 2007: The Physical Science Basis. Contribution of Working Group I to the Fourth Assessment Report of the Intergovernmental Panel on Climate Change; Solomon, S., Qin, D., Manning, M., Chen, Z., Marquis, M., Averyt, K., Tignor, M., Miller, H., Eds.; Cambridge University Press: Cambridge, UK; New York, NY, USA, 2007; pp. 589–662. [Google Scholar]
  25. Khan, F.; Ali, S.; Mayer, C.; Ullah, H.; Muhammad, S. Climate change and spatio-temporal trend analysis of climate extremes in the homogeneous climatic zones of Pakistan during 1962–2019. PLoS ONE 2022, 17, e0271626. [Google Scholar] [CrossRef]
  26. Expert Team on Climate Change Detection and Indices (ETCCDI). Climate Change Indices: Definitions of the 27 Core Indices. Available online: https://etccdi.pacificclimate.org/list_27_indices.shtml (accessed on 5 February 2025).
  27. National Oceanic and Atmospheric Administration (NOAA). Extreme Exceedance Probability Levels. Available online: https://tidesandcurrents.noaa.gov/est/northatlantic.html (accessed on 5 February 2025).
  28. Student. The Probable Error of a Mean. Biometrika 1908, 6, 1–25. [Google Scholar] [CrossRef]
  29. Linnet, K. Limitations of the Paired t-Test for Evaluation of Method Comparison Data. Clin. Chem. 1999, 45, 314–315. [Google Scholar] [CrossRef]
  30. Imam, A.; Mohammed, U.; Abanyam, M.C. On Consistency and Limitation of Paired t-Test, Sign and Wilcoxon Sign Rank Test. IOSR J. Math. (IOSR-JM) 2014, 10, 1–6. [Google Scholar] [CrossRef]
  31. Espinosa, L.A.; Portela, M.M.; Ocampo-Guerrero, N. Beyond Temperature Peaks: The Growing Persistence and Intensity of Tmin and Tmax Heatwaves in Portugal’s Changing Climate (1980/1981–2022/2023). Atmosphere 2024, 15, 1485. [Google Scholar] [CrossRef]
  32. Hurrell, J.W.; Kushnir, Y.; Ottersen, G.; Visbeck, M. (Eds.) The North Atlantic Oscillation: Climatic Significance and Environmental Impact; Geophysical Monograph Series; American Geophysical Union: Washington, DC, USA, 2003; Volume 134. [Google Scholar] [CrossRef]
  33. OECD. OECD Environmental Performance Reviews: Portugal 2023; OECD Environmental Performance Reviews; OECD Publishing: Paris, France, 2023. [Google Scholar] [CrossRef]
  34. Zêzere, J.L. Geohazards in Portugal: A State of the Art. Finisterra 2023, LVIII, 7–27. [Google Scholar] [CrossRef]
  35. Perkins, S.E. A review on the scientific understanding of heatwaves—Their measurement, driving mechanisms, and changes at the global scale. Atmos. Res. 2015, 164, 242–267. [Google Scholar] [CrossRef]
  36. Lange, M.A. Climate Change in the Mediterranean: Environmental Impacts and Extreme Events. In IEMed Mediterranean Yearbook; European Institute of the Mediterranean (IEMed). 2020, pp. 30–55. Available online: https://www.iemed.org/publication/climate-change-in-the-mediterranean-environmental-impacts-and-extreme-events/ (accessed on 5 February 2025).
  37. Bolle, H.J. (Ed.) Mediterranean Climate: Variability and Trends; Regional Climate Studies; Springer-Verlag: Berlin, Germany, 2003; Volume 1, pp. 1–320. [Google Scholar] [CrossRef]
  38. Russo, S.; Dosio, A.; Graversen, R.G.; Sillmann, J.; Carrao, H.; Dunbar, M.B.; Singleton, A.; Montagna, P.; Barbola, P.; Vogt, J.V. Magnitude of extreme heat waves in present climate and their projection in a warming world. J. Geophys. Res. Atmos. 2014, 119, 12–500. [Google Scholar] [CrossRef]
  39. Russo, E.; Domeisen, D.I. Increasing intensity of extreme heatwaves: The crucial role of metrics. Geophys. Res. Lett. 2023, 50, e2023GL103540. [Google Scholar] [CrossRef]
  40. López-Bueno, J.A.; Alonso, P.; Navas-Martín, M.Á.; Mirón, I.; Belda, F.; Díaz, J.; Linares, C. Determination of heat wave definition temperatures in Spain at an isoclimatic level: Time trend of heat wave duration and intensity across the decade 2009–2018. Environ. Sci. Eur. 2024, 36, 83. [Google Scholar] [CrossRef]
  41. Settanta, G.; Fraschetti, P.; Lena, F.; Perconti, W.; Piervitali, E. Recent tendencies of extreme heat events in Italy. Theor. Appl. Climatol. 2024, 155, 7335–7348. [Google Scholar] [CrossRef]
  42. Di Bernardino, A.; Falasca, S.; Iannarelli, A.M.; Casadio, S.; Siani, A.M. Effect of heatwaves on urban sea breeze, heat island intensity, and outdoor thermo-hygrometric comfort in Rome (Italy). Urban Clim. 2023, 52, 101735. [Google Scholar] [CrossRef]
  43. Founda, D.; Pierros, F.; Petrakis, M.; Zerefos, C. Interdecadal variations and trends of the Urban Heat Island in Athens (Greece) and its response to heat waves. Atmos. Res. 2015, 161, 1–13. [Google Scholar] [CrossRef]
  44. Oukawa, G.Y.; Krecl, P.; Targino, A.C. Fine-scale modeling of the urban heat island: A comparison of multiple linear regression and random forest approaches. Sci. Total Environ. 2022, 815, 152836. [Google Scholar] [CrossRef] [PubMed]
  45. Nogueira, M.; Hurduc, A.; Ermida, S.; Lima, D.C.; Soares, P.M.; Johannsen, F.; Dutra, E. Assessment of the Paris urban heat island in ERA5 and offline SURFEX-TEB (v8.1) simulations using the METEOSAT land surface temperature product. Geosci. Model Dev. 2022, 15, 5949–5965. [Google Scholar] [CrossRef]
  46. Błażejczyk, K.; Jendritzky, G.; Bröde, P.; Fiala, D. An Introduction to the Universal Thermal Climate Index (UTCI). Geogr. Pol. 2013, 86, 5–10. [Google Scholar] [CrossRef]
  47. Anders, J.; Schubert, S.; Maronga, B.; Salim, M. Simplifying heat stress assessment: Evaluating meteorological variables as single indicators of outdoor thermal comfort in urban environments. Build. Environ. 2025, 274, 112658. [Google Scholar] [CrossRef]
  48. Nastos, P.; Saaroni, H. Living in Mediterranean cities in the context of climate change: A review. Int. J. Climatol. 2024. [Google Scholar] [CrossRef]
  49. Huang, J.; Ji, M.; Xie, Y.; Wang, S.; He, Y.; Ran, J. Global semi-arid climate change over last 60 years. Clim. Dyn. 2016, 46, 1131–1150. [Google Scholar] [CrossRef]
  50. Drobinski, P.; Da Silva, N.; Bastin, S.; Mailler, S.; Muller, C.; Ahrens, B.; Christensen, O.B.; Lionello, P. How warmer and drier will the Mediterranean region be at the end of the twenty-first century? Reg. Environ. Change 2020, 20, 1–12. [Google Scholar] [CrossRef]
  51. Yuan, T. The Role of Green Infrastructure in Mitigating the Urban Heat Island Effect. Open J. Appl. Sci. 2024, 14, 3155–3164. [Google Scholar] [CrossRef]
  52. Oliveira, A.; Lopes, A.; Correia, E.; Niza, S.; Soares, A. Heatwaves and Summer Urban Heat Islands: A Daily Cycle Approach to Unveil the Urban Thermal Signal Changes in Lisbon, Portugal. Atmosphere 2021, 12, 292. [Google Scholar] [CrossRef]
  53. Donat, M.G.; Alexander, L.V.; Yang, H.; Durre, I.; Vose, R.; Caesar, J. Global land-based datasets for monitoring climatic extremes. Bull. Am. Meteorol. Soc. 2013, 94, 997–1006. [Google Scholar] [CrossRef]
  54. Seneviratne, S.I.; Zhang, X.; Adnan, M.; Badi, W.; Dereczynski, C.; Luca, A.D.; Ghosh, S.; Iskandar, I.; Kossin, J.; Lewis, S.; et al. Weather and climate extreme events in a changing climate. In Climate Change 2021: The Physical Science Basis; Masson-Delmotte, V., Zhai, A., Pirani, S.L., Connors, C., Péan, C., Berger, S., Caud, N., Chen, Y., Goldfarb, L., Gomis, M.I., et al., Eds.; Cambridge University Press: Cambridge, UK, 2021; pp. 1513–1766. [Google Scholar] [CrossRef]
  55. Ouzeau, G.; Soubeyroux, J.M.; Schneider, M.; Vautard, R.; Planton, S. Heat waves analysis over France in present and future climate: Application of a new method on the EURO-CORDEX ensemble. Clim. Serv. 2016, 4, 1–12. [Google Scholar] [CrossRef]
  56. Richter, M. Urban climate change-related effects on extreme heat events in Rostock, Germany. Urban Ecosyst. 2016, 19, 849–866. [Google Scholar] [CrossRef]
  57. Kabisch, N.; Remahne, F.; Ilsemann, C.; Fricke, L. The urban heat island under extreme heat conditions: A case study of Hannover, Germany. Sci. Rep. 2023, 13, 23017. [Google Scholar] [CrossRef] [PubMed]
  58. European Commission. State of the Energy Union 2023: Further Action Needed to Accelerate Climate Action. 2023. Available online: https://ec.europa.eu/commission/presscorner/detail/en/ip_23_5188 (accessed on 5 February 2025).
  59. Ren, D.; Hu, A. Persistent trends and geographic traits of heat waves in a changing climate. Environ. Res. Commun. 2024, 6, 115025. [Google Scholar] [CrossRef]
  60. Perkins-Kirkpatrick, S.E.; Lewis, S.C. Increasing trends in regional heatwaves. Nat. Commun. 2020, 11, 3357. [Google Scholar] [CrossRef]
  61. Mann, H.B. Nonparametric Tests Against Trend. Econometrica 1945, 13, 245–259. [Google Scholar] [CrossRef]
  62. Sen, P.K. Estimates of the regression coefficient based on Kendall’s tau. J. Am. Stat. Assoc. 1968, 63, 1379–1389. [Google Scholar] [CrossRef]
  63. Weatherhead, E.C.; Reinsel, G.C.; Tiao, G.C.; Meng, X.L.; Choi, D.; Cheang, W.K.; Keller, T.; DeLuisi, J.; Wuebbles, D.J.; Kerr, J.B.; et al. Factors affecting the detection of trends: Statistical considerations and applications to environmental data. J. Geophys. Res. Atmos. 1998, 103, 17149–17161. [Google Scholar] [CrossRef]
  64. Stahel, W.A. New relevance and significance measures to replace p-values. PLoS ONE 2021, 16, e0252991. [Google Scholar] [CrossRef]
  65. European Environment Agency. High UTCI Days. 2025. Available online: https://climate-adapt.eea.europa.eu/en/metadata/indicators/high-utci-days (accessed on 5 February 2025).
  66. Ebi, K.L.; Capon, A.; Berry, P.; Broderick, C.; de Dear, R.; Havenith, G.; Honda, Y.; Kovats, R.S.; Ma, W.; Malik, A.; et al. Hot weather and heat extremes: Health risks. Lancet 2021, 398, 698–708. [Google Scholar] [CrossRef]
  67. Thornton, P.K.; Ericksen, P.J.; Herrero, M.; Challinor, A.J. Climate variability and vulnerability to climate change: A review. Glob. Change Biol. 2014, 20, 3313–3328. [Google Scholar] [CrossRef] [PubMed]
  68. Serpa, D.; Nunes, J.P.; Santos, J.; Sampaio, E.; Jacinto, R.; Veiga, S.; Lima, J.C.; Moreira, M.; Corte-Real, J.; Keizer, J.J.; et al. Impacts of climate and land use changes on the hydrological and erosion processes of two contrasting Mediterranean catchments. Sci. Total Environ. 2015, 538, 64–77. [Google Scholar] [CrossRef] [PubMed]
Figure 1. (a) Spatial distribution of the 1012 ERA5-Land centroids, represented by bullets, analysed within mainland Portugal (89,015 km 2 ), with Köppen-Geiger climate classification. (b) Average of daily mean temperature, T m e a n ¯ , and (c) average of daily maximum temperature, T m a x ¯ , both calculated for the global 44-year period from 1 October 1980 to 30 September 2024.
Atmosphere 16 00514 g001
Figure 2. Spatial distribution of the annual average of Occurrence of Exceptional Tmax Events, OTE, for the threshold Q 90 = 30.60   ° C in the (a) global period, from 1980/1981 to 2023/2024, (b) historical phase, from 1980/1981 to 2001/2002, and (c) contemporary phase, from 2002/2003 to 2023/2024.
Atmosphere 16 00514 g002
Figure 3. Spatial distribution of the annual average of Occurrence of Exceptional Tmax Events, OTE, for the threshold Q 99 = 37.04   ° C in the (a) global period, from 1980/1981 to 2023/2024, (b) historical phase, from 1980/1981 to 2001/2002, and (c) contemporary phase, from 2002/2003 to 2023/2024.
Atmosphere 16 00514 g003
Figure 4. Spatial distribution of the annual average of Occurrence of Exceptional Tmax Events, OTE, for the threshold Q 99.9 = 40.40   ° C in the (a) global period, from 1980/1981 to 2023/2024, (b) historical phase, from 1980/1981 to 2001/2002, and (c) contemporary phase, from 2002/2003 to 2023/2024.
Atmosphere 16 00514 g004
Figure 5. Spatial distribution of the annual average of Relative Temperature Excess, RTE, for the threshold Q 90 = 30.60   ° C in the (a) global period, from 1980/1981 to 2023/2024, (b) historical phase, from 1980/1981 to 2001/2002, and (c) contemporary phase, from 2002/2003 to 2023/2024.
Atmosphere 16 00514 g005
Figure 6. Spatial distribution of the annual average of Relative Temperature Excess, RTE, for the threshold Q 99 = 37.04   ° C in the (a) global period, from 1980/1981 to 2023/2024, (b) historical phase, from 1980/1981 to 2001/2002, and (c) contemporary phase, from 2002/2003 to 2023/2024.
Atmosphere 16 00514 g006
Figure 7. Spatial distribution of the annual average of Relative Temperature Excess, RTE, for the threshold Q 99.9 = 40.40   ° C in the (a) global period, from 1980/1981 to 2023/2024, (b) historical phase, from 1980/1981 to 2001/2002, and (c) contemporary phase, from 2002/2003 to 2023/2024.
Atmosphere 16 00514 g007
Figure 8. Spatial distribution of p-values from Student’s t-test for Occurrence of Exceptional Tmax Events (OTE), comparing the contemporary and historical phases across the different thresholds.
Atmosphere 16 00514 g008
Figure 9. Spatial distribution of p-values from Student’s t-test for Relative Temperature Excess (RTE), comparing the contemporary and historical phases across the different thresholds.
Atmosphere 16 00514 g009
Figure 10. Severity heatmaps combining OTE and RTE changes between the historical (from 1980/1981 to 2001/2002) and contemporary (from 2002/2003 to 2023/2024) phases for different temperature thresholds. The centroids are classified into five cases: Case 0 (white) indicates no comparison possible due to absence of occurrences in either of the two phases; Case 1 (red) represents higher occurrences and higher excess in the contemporary phase; Case 2 (orange) shows higher occurrences but lower excess; Case 3 (yellow) reflects lower occurrences with higher excess; and Case 4 (green) denotes lower occurrences and lower excess in the contemporary phase.
Atmosphere 16 00514 g010
Figure 11. Sen’s slope estimates for trends in the Occurrence of Exceptional Tmax Events (days/year) across Portugal at Q90 threshold during: (a) the global period, from 1980/1981 to 2023/2024, (b) the historical phase, from 1980/1981 to 2023/2024, and (c) the contemporary phase, from 2002/2003 to 2023/2024.
Atmosphere 16 00514 g011
Figure 12. Sen’s slope estimates for trends in the Relative Temperature Excess (% excess/year) across Portugal at Q90 threshold during: (a) the global period, from 1980/1981 to 2023/2024, (b) the historical phase, from 1980/1981 to 2023/2024, and (c) the contemporary phase, from 2002/2003 to 2023/2024.
Atmosphere 16 00514 g012
Disclaimer/Publisher’s Note: The statements, opinions and data contained in all publications are solely those of the individual author(s) and contributor(s) and not of MDPI and/or the editor(s). MDPI and/or the editor(s) disclaim responsibility for any injury to people or property resulting from any ideas, methods, instructions or products referred to in the content.

