Article

Extreme Precipitation and Low-Lying Urban Flooding in Bahía Blanca, Argentina

by
Natalia Verónica Revollo
1,2,*,
Verónica Gil
3 and
Flavio Tiago Couto
4
1
Departamento de Ingeniería Eléctrica y de Computadoras, Universidad Nacional del Sur-CONICET, Bahía Blanca 8000, Argentina
2
Instituto de Ciencias e Ingeniería de la Computación (ICIC), CONICET-UNS, Bahía Blanca 8000, Argentina
3
Departamento de Geografía y Turismo, Universidad Nacional del Sur-CONICET, Bahía Blanca 8000, Argentina
4
Center for Sci-Tech Research in Earth System and Energy (CREATE), Institute for Advanced Research and Training—IIFA, Department of Physics, School of Science and Technology—ECT, University of Évora, Romão Ramalho Street, 59, 7000-671 Évora, Portugal
*
Author to whom correspondence should be addressed.
Atmosphere 2025, 16(5), 511; https://doi.org/10.3390/atmos16050511
Submission received: 31 March 2025 / Revised: 21 April 2025 / Accepted: 23 April 2025 / Published: 28 April 2025
(This article belongs to the Section Meteorology)

Abstract

:
On the morning of 7 March 2025, the Argentine district of Bahía Blanca experienced a severe flooding that led to at least 15 fatalities. This study presents the main aspects of the event based on different data sources that helped to explain the exceptional precipitation of about 300 mm and rapid flooding. The results indicated that Bahía Blanca district presented flooded areas of approximately 33 km2 (1.4% of the total area) on 10 March, most of them concentrated in the non-urbanized zones. However, a total of 18 km2 (0.8% of the total area) was still identified on 11 March, with a greater impact on the low-lying urban areas of the Bahía Blanca, General Daniel Cerri, and Ingeniero White towns. The likelihood of severe weather development was confirmed from instability indices. The very high moisture content along a low-level convergence line, jointly with upper-level divergence, contributed to deep convective cloud development that affected Bahía Blanca for at least 6 h. Increasing knowledge of urban floods from different data sources can support weather forecasts to provide timely warnings, essential to mitigate the adverse impacts of these extreme weather events on low-lying urban areas.

1. Introduction

Catastrophic flooding events are reported worldwide every year, resulting in significant economic losses beyond the fatalities. These events are a combination of several factors that depend on meteorological and surface conditions. For instance, a large-scale omega blocking pattern led to extreme weather events on a continental scale in early September 2023, in particular to precipitation anomalies. The positioning of the low-pressure systems associated with this weather pattern was essential to produce intense precipitating systems that resulted in catastrophic flooding in Spain, Greece, and Libya [1]. In Libya, the disaster killed more than 5923 people after the burst of two dams produced a devastating flood wave that swept Derna city during the passage of the Daniel Storm, e.g., [2,3].
In addition to large-scale conditions favoring the development of intense precipitating systems, local factors can contribute to extreme precipitation events with immediate impacts at the surface. In 2010, the southern regions of Madeira Island, Portugal, were severely damaged by a flood that killed more than 40 people and led to huge economic losses. The meridional water vapor transport by an atmospheric river combined with orographic effects was fundamental in generating torrential rain [4]. In 2012, flash floods were reported in the northern region of the island [5] but resulted from the repeated development of localized orographic precipitating systems that remained quasi-stationary over the same region [6].
In tropical and subtropical regions, torrential rains often produce flooding and landslides. In Timor-Leste, heavy rainfall during the passage of a tropical storm in April 2021 caused extensive damage to the local communities, in particular in the capital Dili and surrounding low-lying areas, as well as dozens of fatalities, e.g., [7,8]. A similar situation was reported in Hong Kong during the passage of Tropical Cyclone Haikui (2311), which produced floods and landslides in September 2023 [9], or even in Cuba, where Hurricane Irma produced coastal flooding in September 2017 [10]. These are just a few examples that reveal the complexity of flooding events worldwide, since the different factors in their source.
The orography and atmospheric conditions of South America are recognized as influencing the formation and behavior of different precipitating systems that can lead to extreme weather events. In the La Plata Basin, encompassing parts of Argentina, Brazil, Uruguay, and Paraguay, precipitating systems can be particularly intense and produce different hazards (e.g., lightning, tornadoes, hail, and floods) [11,12,13,14,15,16,17]. The combination of moist air from the Amazon Basin and the orographic influence of the Andes contributes to the meridional transport of tropical moisture within the extratropical regions, also known as the South American low-level jet (SALLJ), e.g., [18,19,20,21]. This environment can produce deep convective cloud systems that play a significant role in the regional hydrological cycle, e.g., [22,23]. In 2024, the city of Porto Alegre, located in Rio Grande do Sul state, Southern Brazil, was severely impacted by extreme precipitation that started in late April, causing at least 180 fatalities from a devastating flood that lasted several weeks [24,25,26].
The interaction of extreme precipitating systems with urban areas can lead to significant challenges, mainly the immediate public policy responses and decision making. Recently, the term “burst flooding” has been used to refer to urban floods caused by intense, short-duration precipitation [27]. Therefore, identifying vulnerable areas is crucial, and several studies have shown alternatives to risk assessment and/or flooding modeling, e.g., [28,29,30,31]. Remote sensing can be a valuable tool to assess flooding in remote zones, e.g., [32], but the remote monitoring of such extreme events, e.g., storms or flash floods, through imagery is still a challenge due to their short-term and large-scale occurrence. Remote sensors play an important role in these cases; however, the recording depends on the temporal frequency and spatial resolution of each satellite. In this sense, monitoring with optical sensors can be affected by meteorological conditions such as clouds or the presence of smoke or ash, which obscure visibility and make image acquisition difficult. Another important factor is the low temporal resolution of these sensors, which can result in no images being recorded during the event’s duration or time, preventing the availability of key data on its magnitude. Synthetic Aperture Radar (SAR) images are widely used because they cover large areas, have high spatial resolution, and are independent of weather conditions. Regardless of the capabilities of each satellite, it may happen that no images of the event exist. In this case, images obtained in subsequent days can be valuable for assessing damage or detecting changes in the Earth’s surface. These images provide information for understanding the phenomenon and serve as a basis for decision making, emergency management, and the planning of social and environmental action plans. The availability of satellite imagery, computer vision algorithms and models, and technological programming tools provides valuable resources for the monitoring of the surface features of the Earth, enabling the analysis of spatio-temporal changes [33,34,35,36,37,38].
Furthermore, in the context of documenting a smaller-scale event, another important resource emerges: citizen science and collaborative networks that allow for the collection of additional information through online platforms, social media, and other technologies. Citizens can contribute with images, videos, locations, and observation points that provide new information and/or complement satellite data. This intersection of remote monitoring and community participation is key to learning from the event and developing future courses of action.
As already mentioned, Northern Argentina is well known for the occurrence of severe weather events; however, the southern part of the Pampas biome has recently experienced several extreme weather phenomena with high impact on society (e.g., extreme winds in December 2023 [39] and large hail in February 2025 [40]).
This study presents a preliminary analysis of the general aspects of the deadly flooding episode that affected Bahía Blanca on 7 March 2025. Since the region is not frequently affected by torrential rains, the lack of studies on this phenomenon for the region reveals the importance of documenting the meteorological mechanisms leading to extreme situations. When combined with remote monitoring information, it is possible to highlight surface and societal aspects linked to vulnerability and preparedness for such extreme weather events. The next section presents the data and methodology adopted, whereas the results are presented and briefly discussed in Section 3. The concluding remarks are stated in Section 4.

2. Materials and Methods
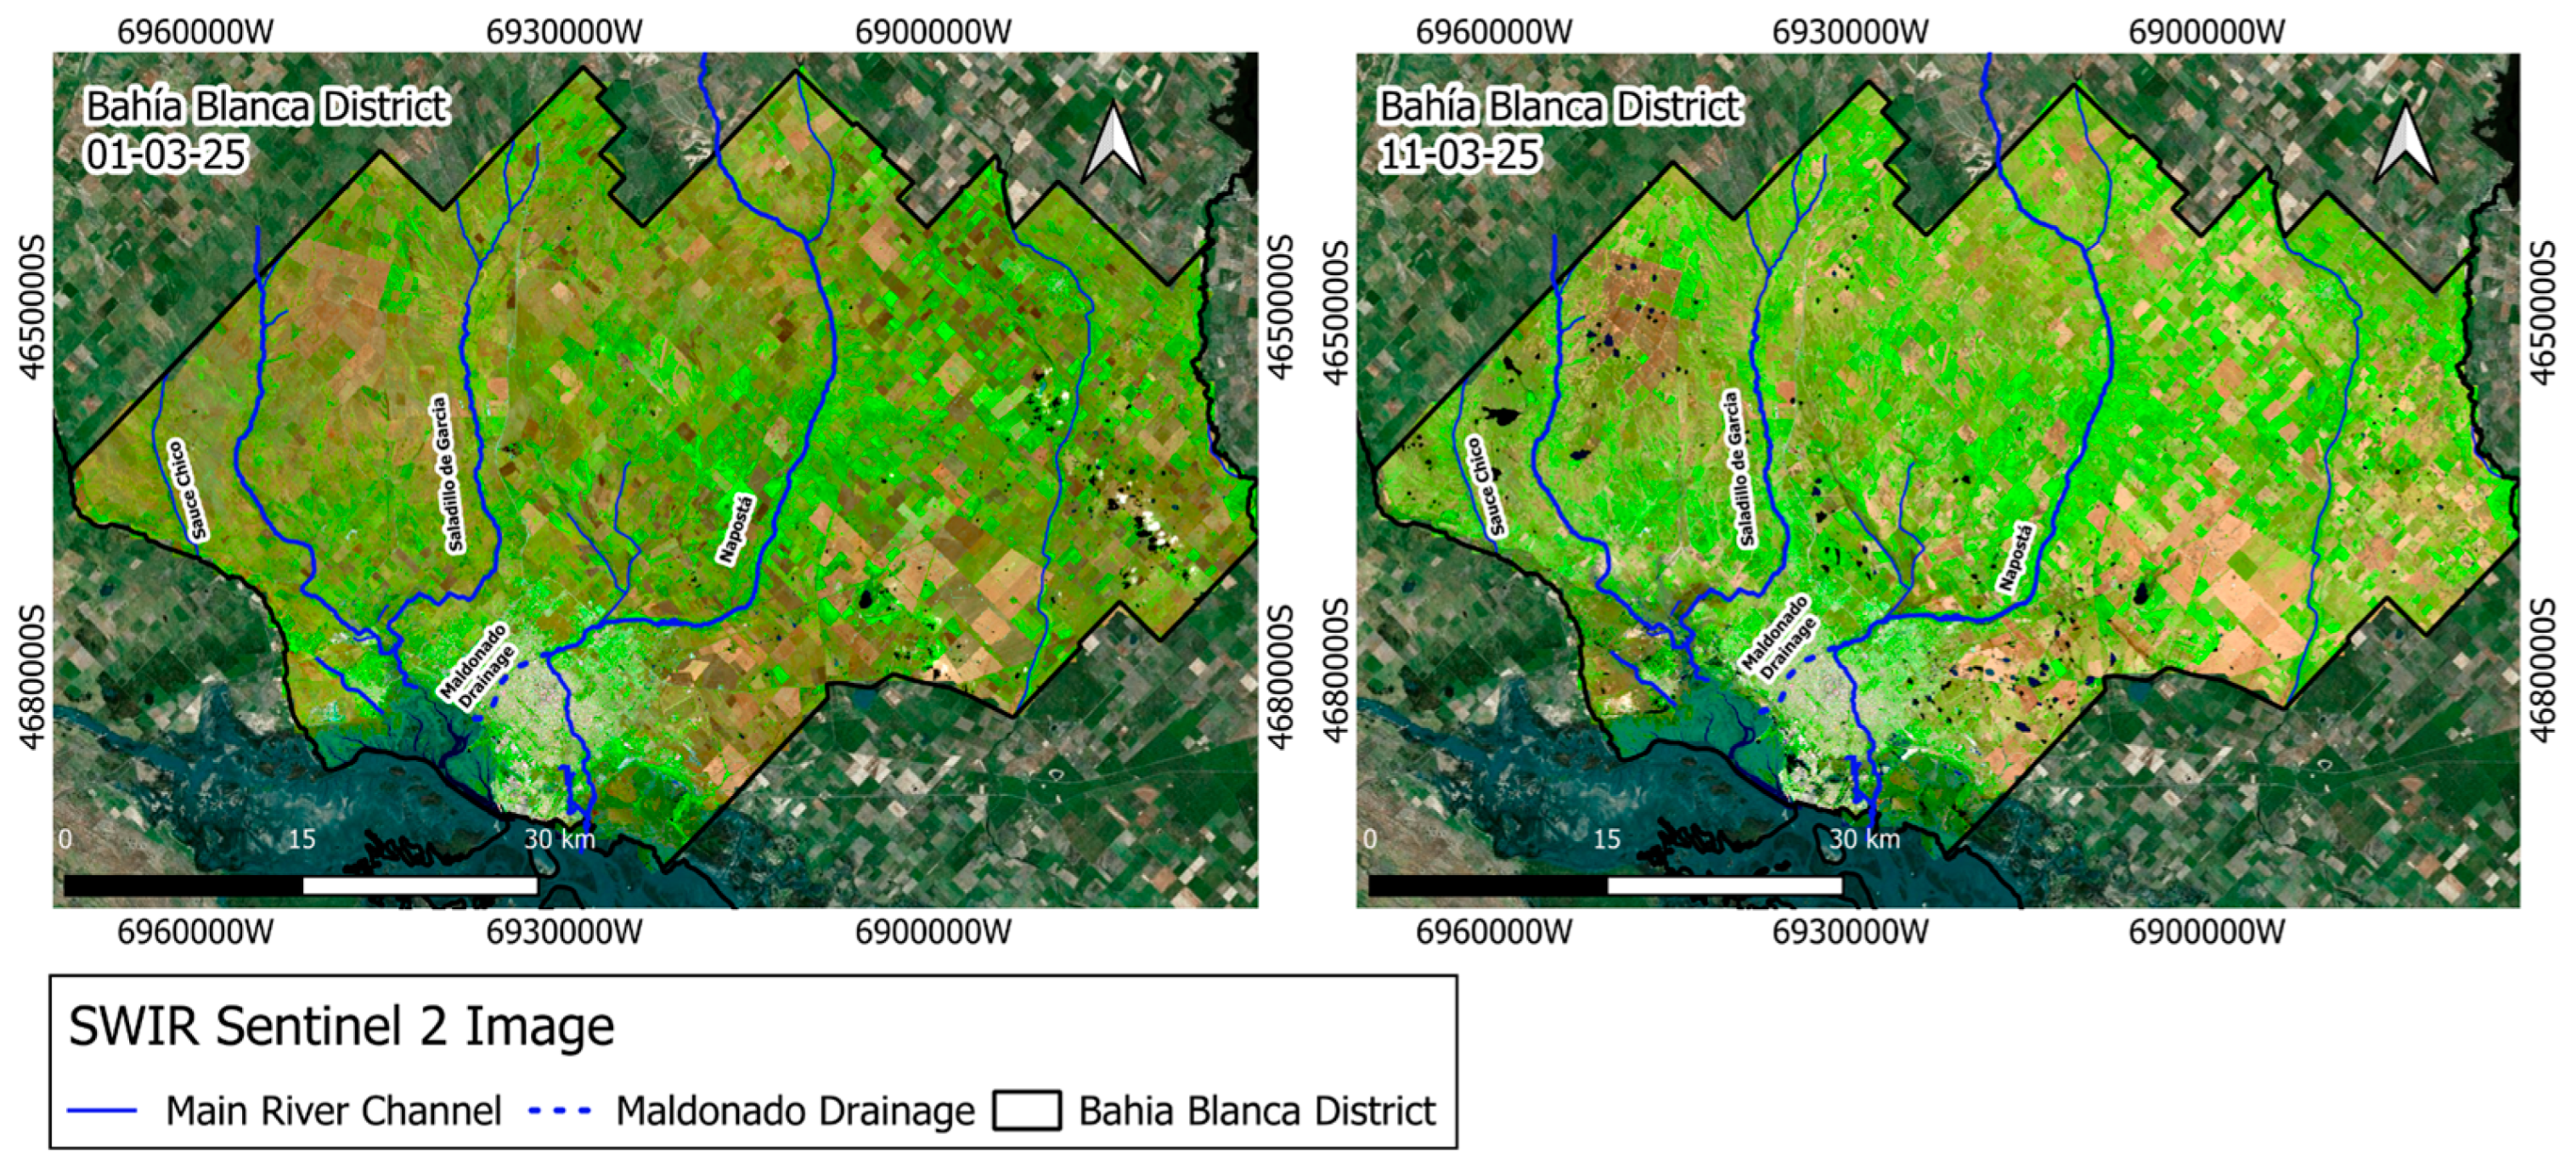
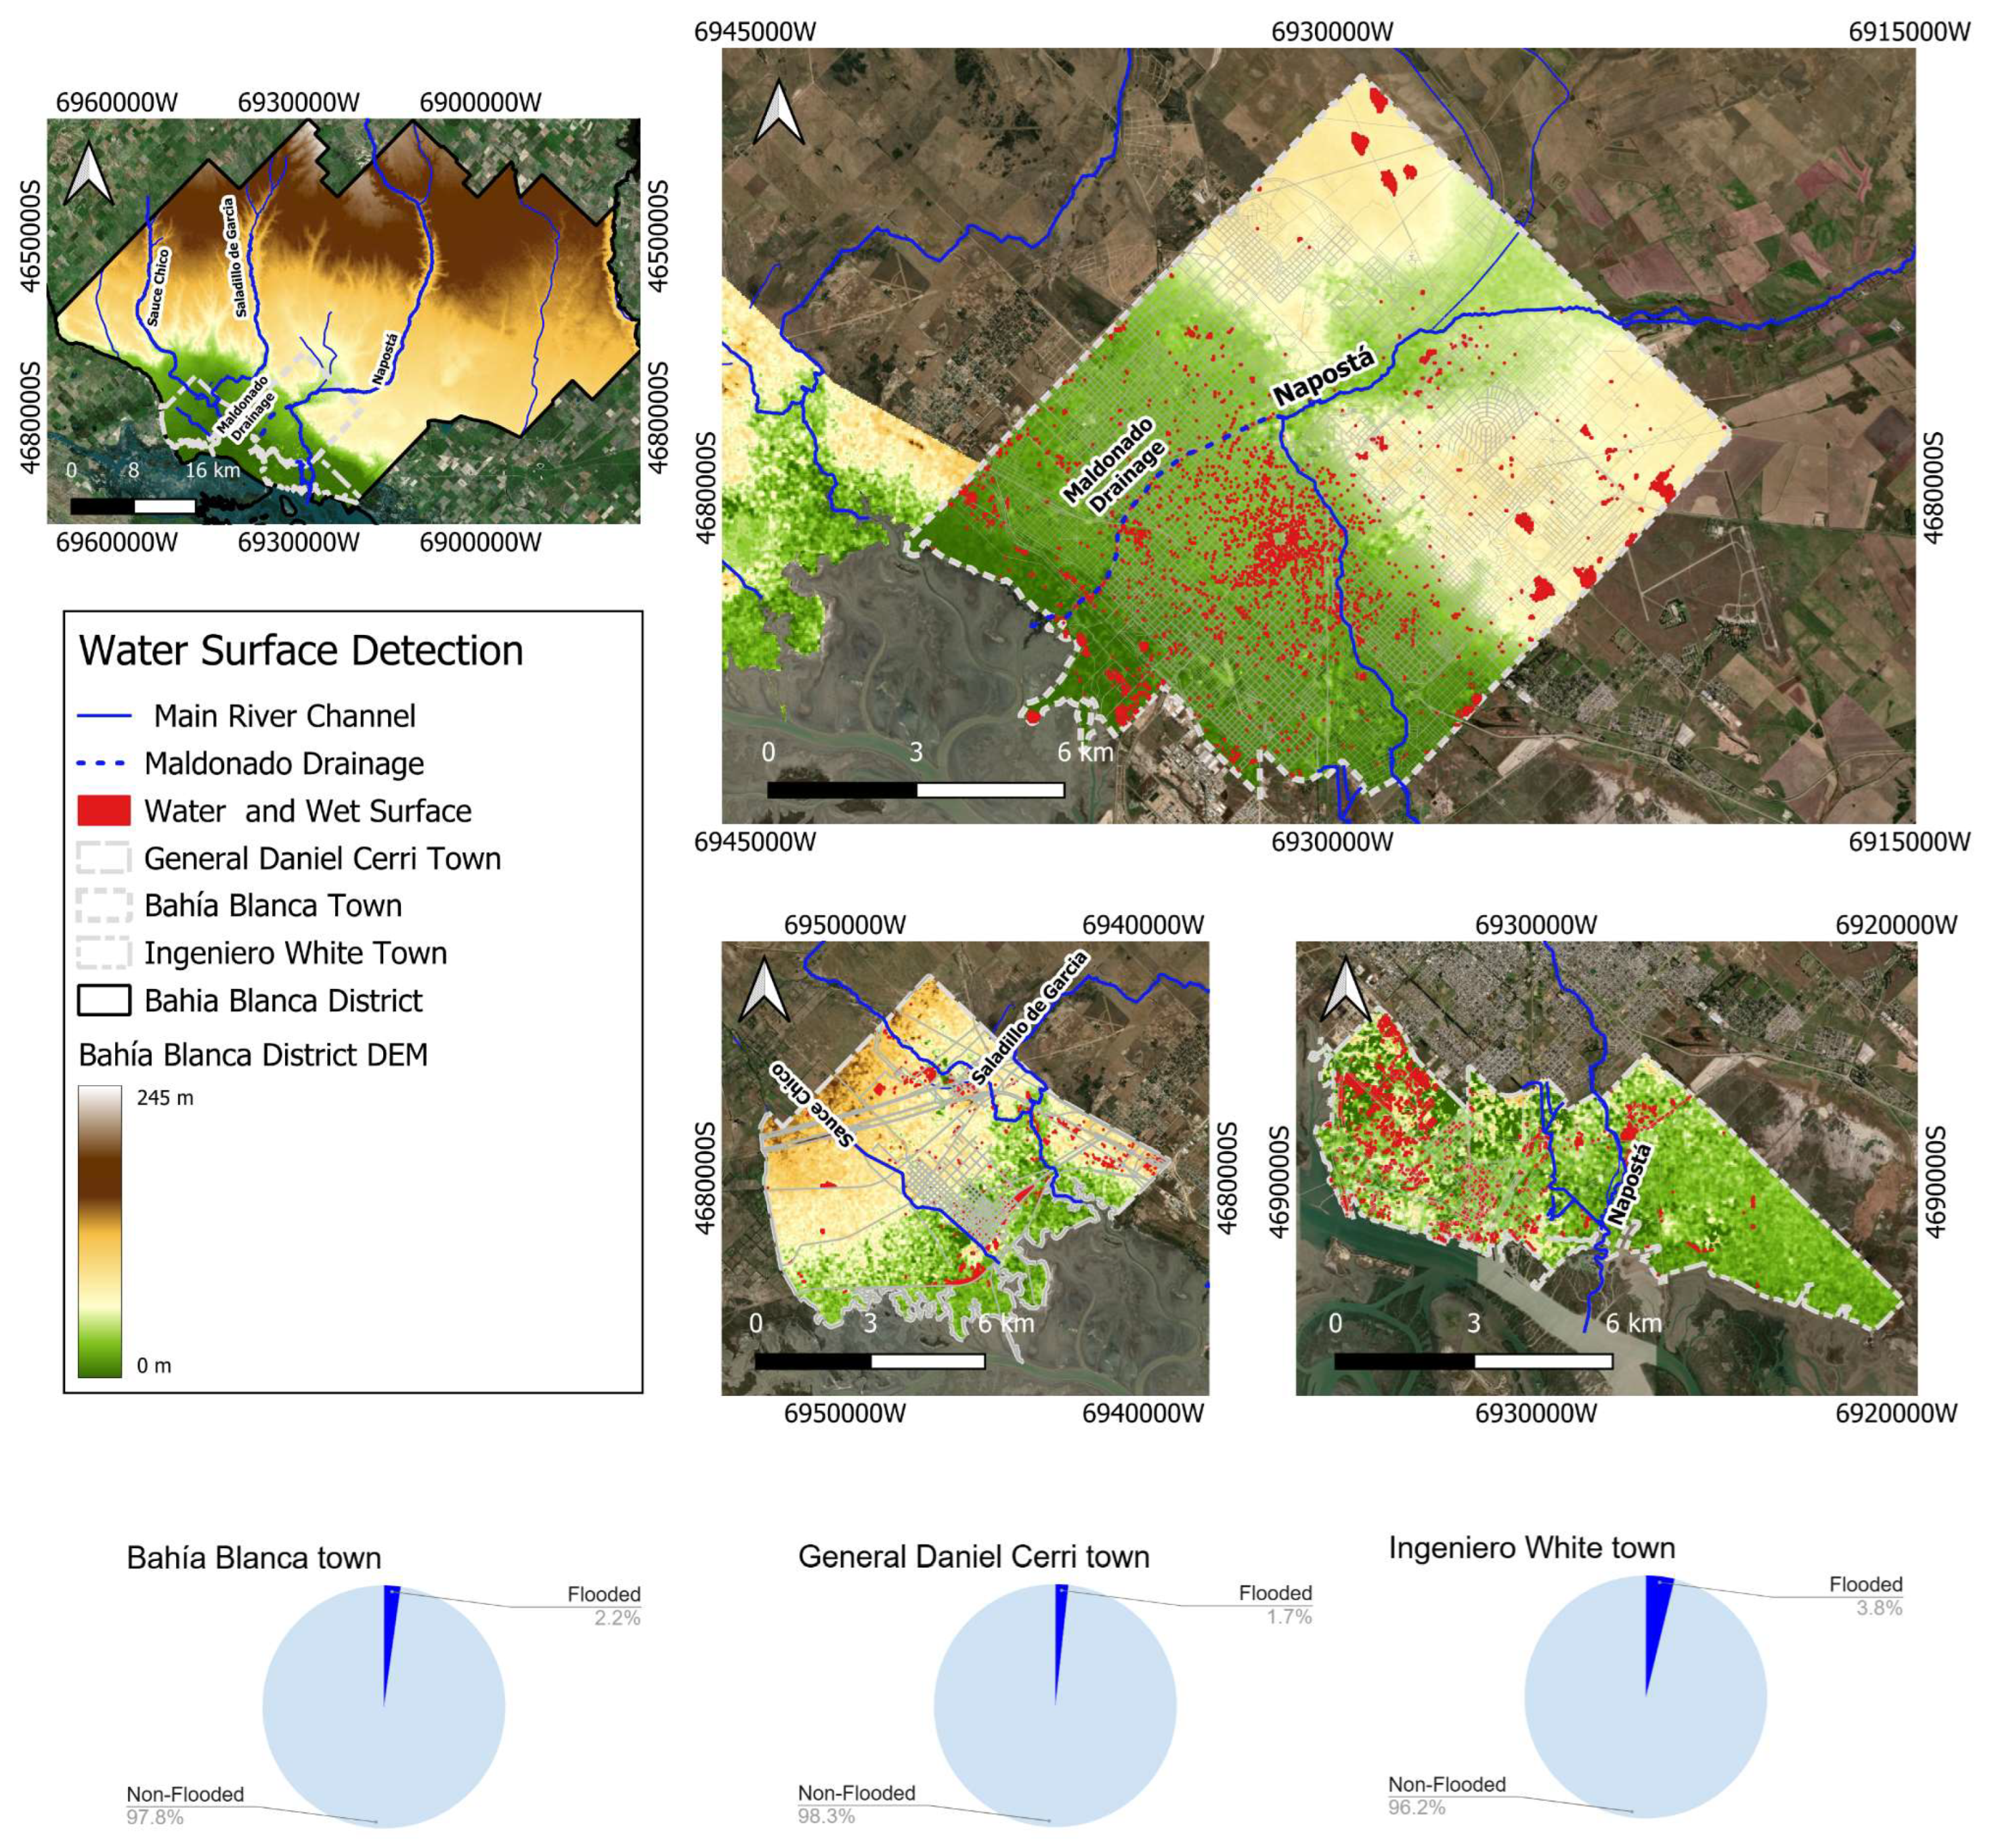
2.1. Study Area

The study area includes the Bahía Blanca district, located in the southwest of Buenos Aires Province, Argentina. The city of Bahía Blanca has expanded, occupying areas in the lower basins of the Napostá Grande, Saladillo de García, and Sauce Chico rivers, as well as the coastal area of the Bahía Blanca Estuary. During the March 7th flood, these three basins were activated in the middle and lower areas, draining water to the towns of Bahía Blanca, Ingeniero White, and General Daniel Cerri (Figure 1).

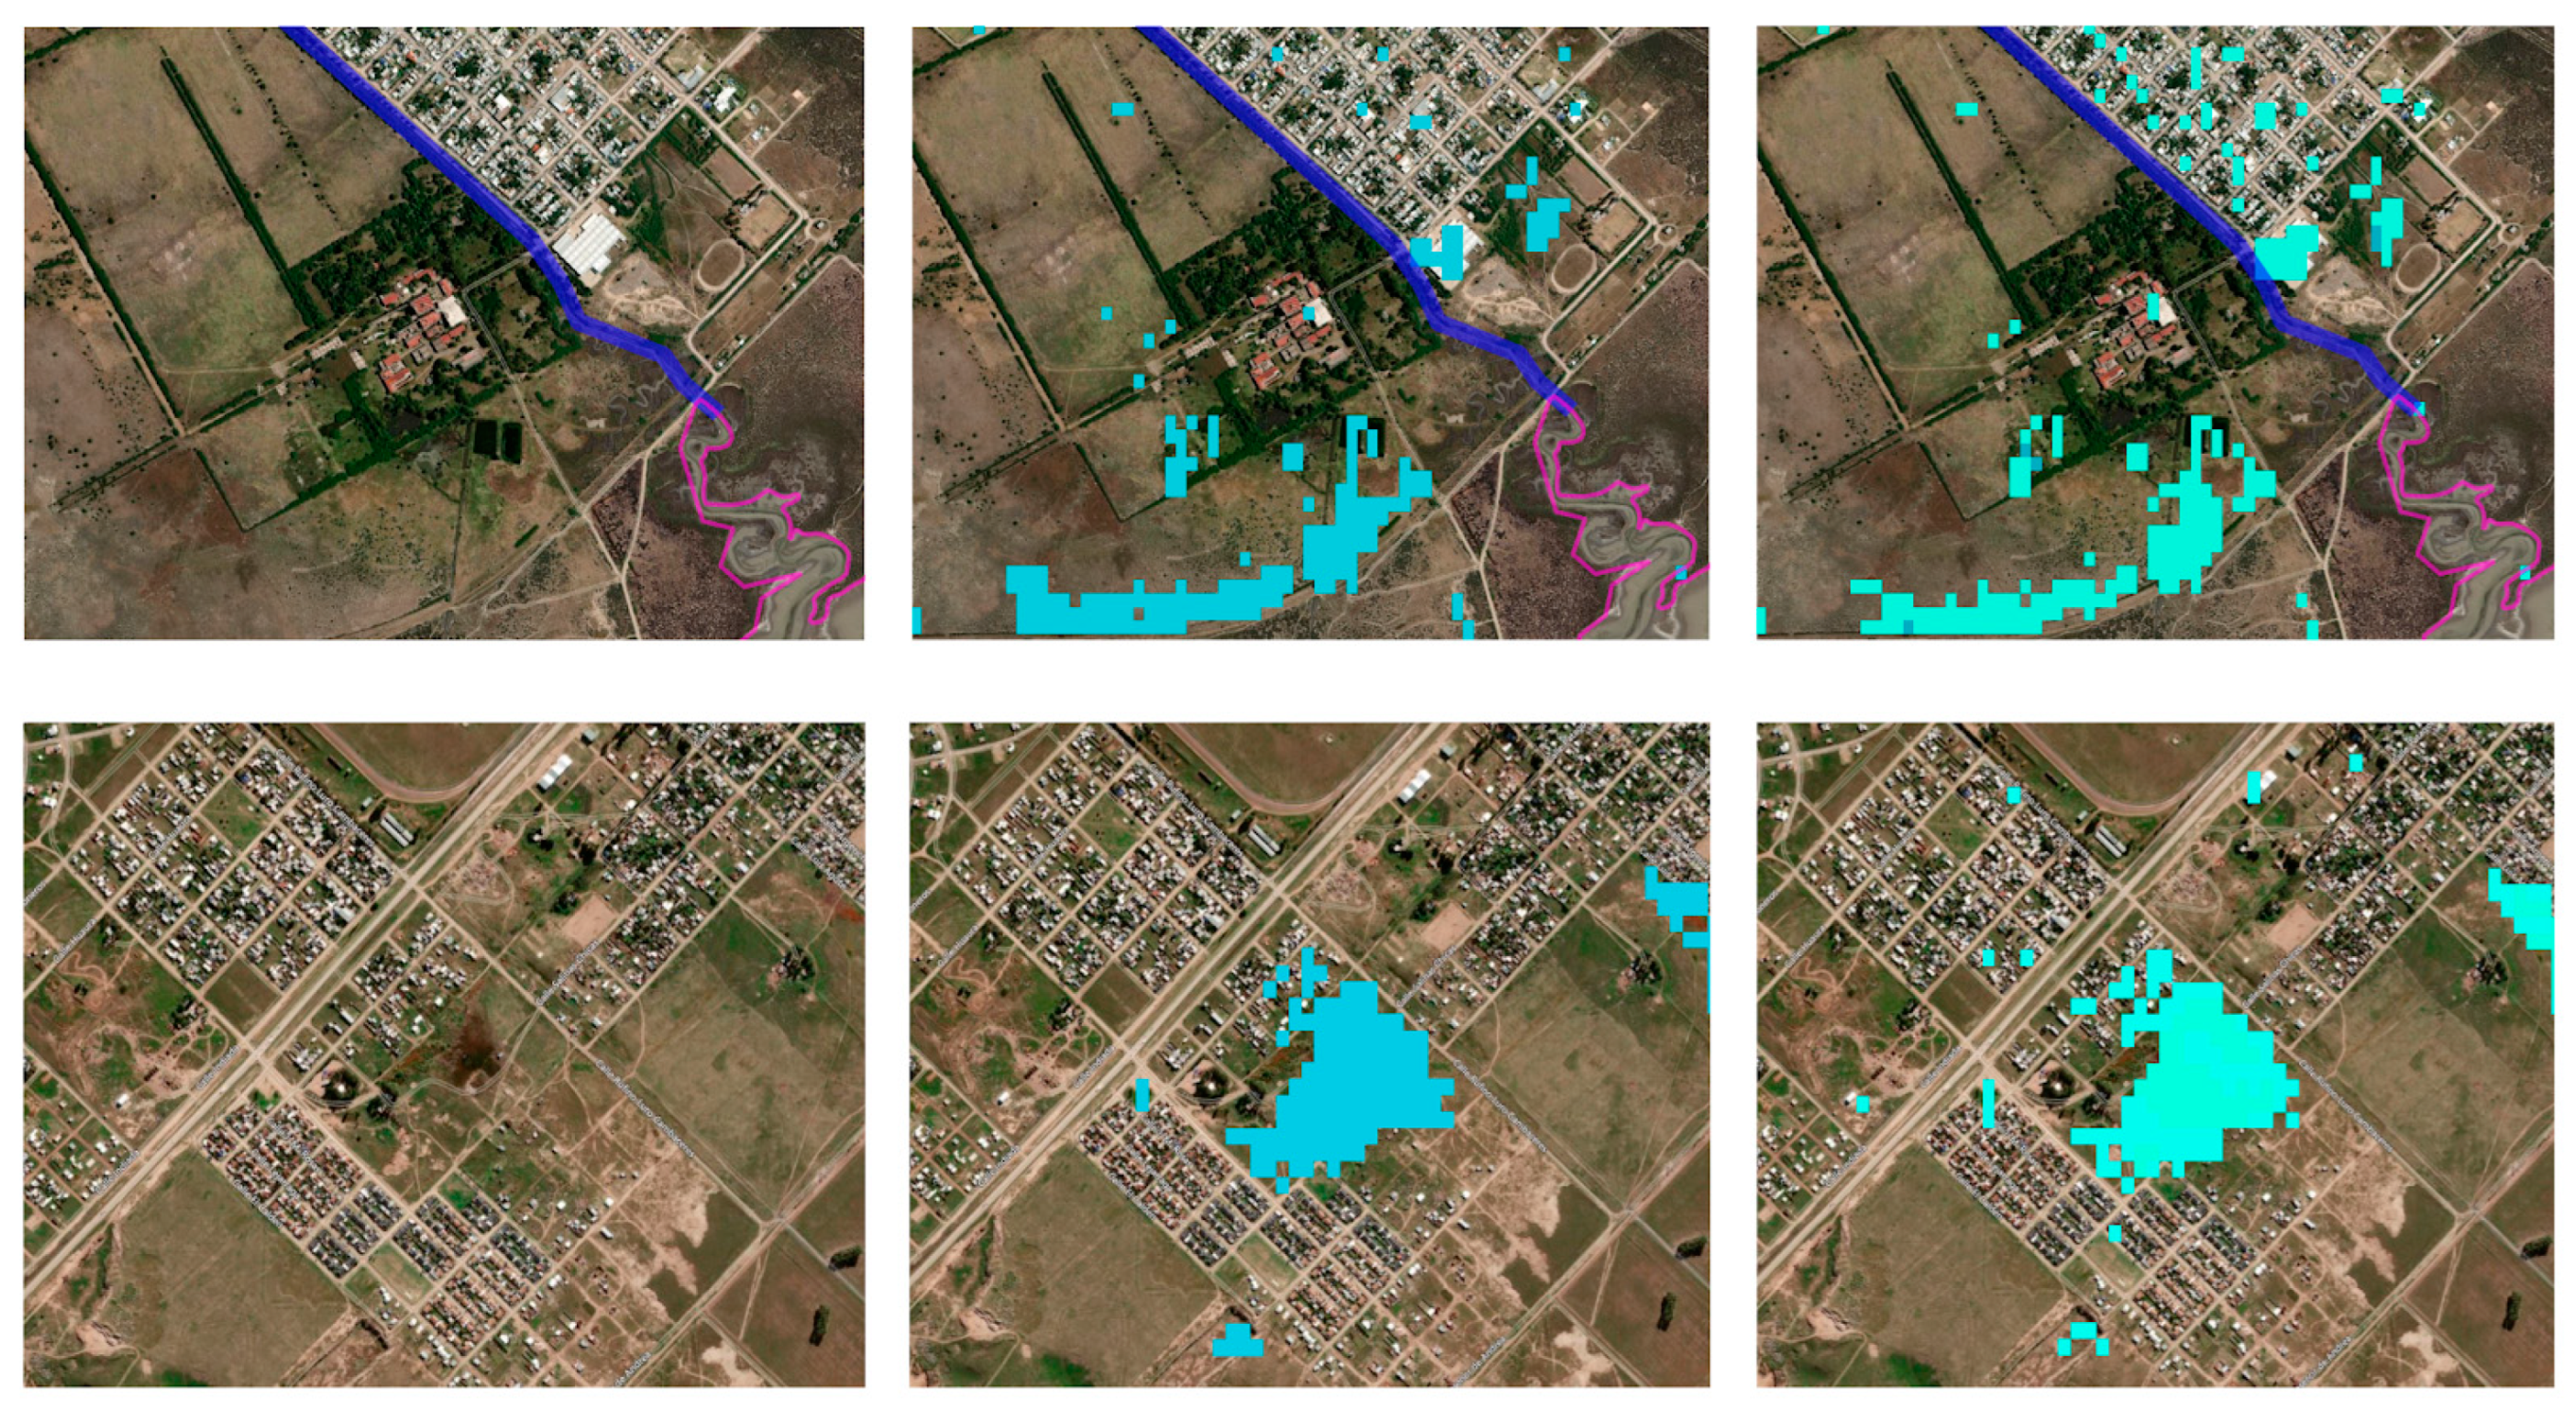
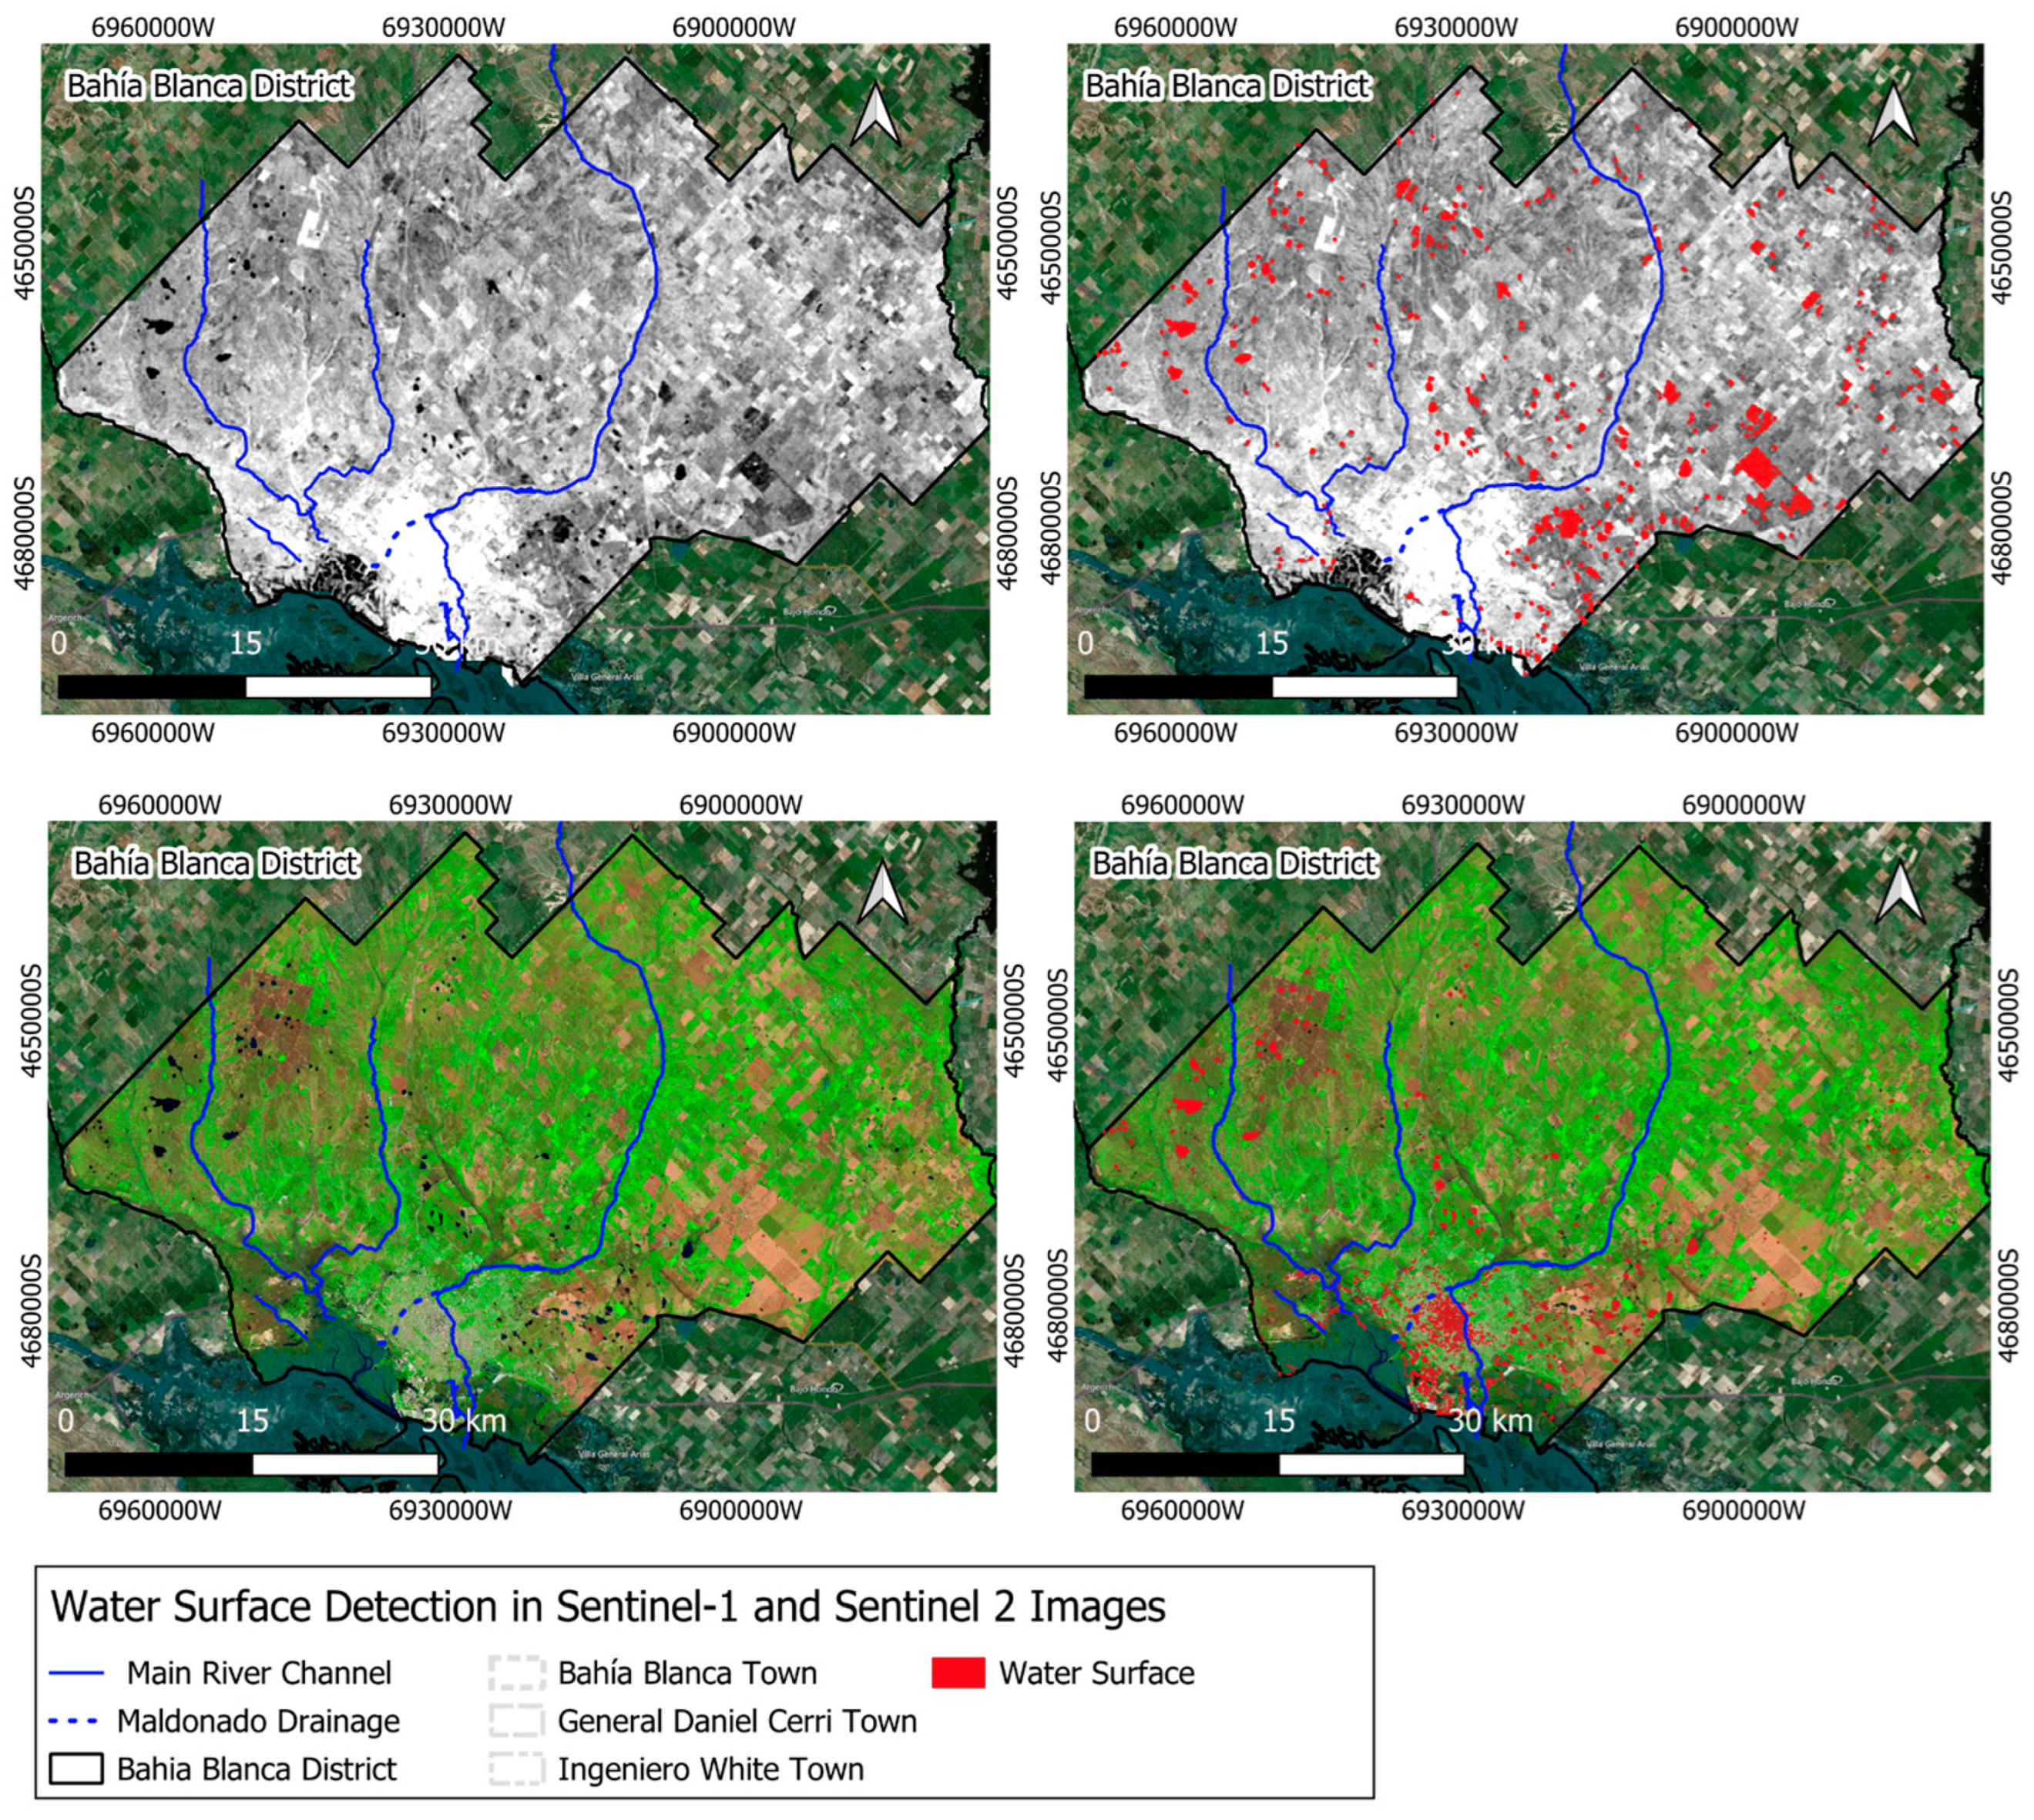
2.2. Flooding Detection

To estimate the areas affected by the event, information from satellite imagery, vector information, in situ reports, field measurements, images and videos from social media, and websites created for the event were integrated, digitized, and extracted.
Satellite images were downloaded from the European Space Agency’s Sentinel-2 satellite [41]. These Sentinel-2 images have 13 spectral bands with a temporal frequency of five days and a spatial resolution of 10 m. The images have top-of-atmosphere (TOA) reflectance values and were preprocessed with radiometric calibration and atmospheric and geometric correction. Images were downloaded from 1 to 11 March 2025, four days after the event. To highlight the characteristics of the water present on the surface, the false-color short-wave infrared composite (SWIR) was used, which includes bands 12 (SWIR), 8A (near infrared), and 04 (red). This composite highlights the amount of water present in plants and soil, as water absorbs SWIR wavelengths. Areas with vegetation appear in shades of green, soils and buildings in shades of brown, and water in black. From these images, the Normalized Difference Water Index (NDWI) and Normalized Difference Vegetation Index (NDVI) are obtained.
Figure 1. Bahía Blanca District, located in the southwest of Buenos Aires Province, Argentina. The towns of Bahía Blanca, General Daniel Cerri, and Ingeniero White are the most urbanized areas affected by the extreme rainfall event that occurred on 7 March 2025.
Atmosphere 16 00511 g001
NDWI is widely used to detect and map water bodies in satellite images [42]. To evaluate this index, a combination of visible green and near-infrared wavelengths is used. The former maximizes the usual reflectance of the water surface. The latter maximize the high reflectance of terrestrial vegetation and soil areas while minimizing the low reflectance of water bodies. NDWI values are positive for water elements and negative or near zero for soil and terrestrial vegetation.
NDVI is the most commonly used vegetation index and is highly revealing of the physiological conditions of vegetation, the vegetation distribution over geographical areas, and the vegetation dynamics [43,44,45]. NDVI values range from −1 to 1. Negative NDVI values correspond to water. NDVI values close to zero correspond to barren areas of rock, sand, or snow. Low, positive values represent shrub and grassland, while high values indicate temperate and tropical rainforests.
The segmentation of pixels corresponding to water was carried out using the threshold segmentation method. This threshold is defined empirically and was selected based on in-situ observations and measurements of NDVI and NDWI values in the study area. Each pixel is classified based on whether its NDVI and NDWI value is greater or less than the threshold defined for each image. In this way, the image is labeled as water areas and other areas. The area of the pixels corresponding to water is then estimated. This process is applied to the district of Bahía Blanca and the localities of Bahía Blanca, General Daniel Cerri, and Ingeniero White (Figure 1). In addition to optical images, a radar satellite image from 10 March 2025, was used [41]. The image has VV and VH polarizations and was acquired in interferometry (IW) mode. It is in raw format and was radiometrically, geometrically, and orthorectified. To reduce spatial noise, the Lee filter (quote) was used. This filter smooths homogeneous areas of the image while preserving important details such as edges and structures. VV polarization is widely used for water detection. Water, due to its smooth, homogeneous surface, reflects radar waves more efficiently in the vertical direction. This generates intense backscatter in radar images, which is indicated by dark areas in SAR images. Water detection is performed using segmentation with an empirically selected threshold. This value is chosen after analyzing the area with an expert. This binarized image in raster format is then polygonized, and the surface area occupied by water in the district is determined. The implementation of the index calculation, segmentation, and area measurement algorithms used the Python 3.13 programming language with the GDAL geographic information management libraries and Numpy matrix operations.

2.3. Meteorological Data

The atmospheric conditions at the surface were assessed from the following meteorological variables: air temperature, sea level pressure (psl), and at station level, wind (speed and direction) and amount of precipitation in 6 h. Data are collected by the weather station located at Bahía Blanca Aerodrome (38-42-53° S, 062-09-46° W, 75 m altitude; Station WMO index: 87750), made available in SYNOP code format, and available online from the Weather Information Service provided by OGIMET [46].
The synoptic analysis is based on the surface synoptic chart produced by the Centro de Hidrografia da Marinha and available online [47] and complemented by upper-air data derived from the sounding in Santa Rosa (87623) and Neuquen (87715) stations, obtained from the University of Wyoming [48]. Both data correspond to the observation at the synoptic time of 1200 UTC on 7 March 2025. In the case of upper air observations, the thermodynamic diagram “Skew-T Log P” also helped to characterize the atmosphere in terms of instability and the likelihood of severe weather conditions. The analysis was based on the following indices: Convective Available Potential Energy (CAPE), Severe Weather Threat (SWEAT), Total Totals (TT), Lifted Index (LI), Showalter (SW), and the K Index (K) [49].
Cloud system identification and cloud-top characterization were based on brightness temperature (BT) from infrared satellite imagery (channel 13 with 2 km horizontal resolution), obtained by the Geostationary Operational Environmental Satellite-16 (GOES-16) from the Advanced Baseline Imager (ABI) [50]. The data were accessed from the National Institute for Space Research (INPE) through the “Programa Base de Informações Georreferenciadas (BIG)” [51,52].
The observational dataset was supplemented with European Centre for Medium-Range Weather Forecasts (ECMWF) analysis located in ECMWF’s Meteorological Archival and Retrieval System—MARS archive [53], accessed through the interactive website and available in NetCDF format. The data were produced at the surface and pressure levels (925 hPa, 850 hPa, 500 hPa, 250 hPa) with a horizontal resolution of 0.125 × 0.125 degrees and downloaded for the four main synoptic times (0000 UTC, 0600 UTC, 1200 UTC, 1800 UTC) on 7 March 2025. Among the main variables analyzed, for example, the U and V components of wind, air temperature, and specific humidity, the variables total column water vapor, vertical velocity, and divergence were chosen to have a general perspective of the main mechanisms behind the flooding in the Bahía Blanca district.
For instance, vertical velocity (Pa·s−1) is helpful to identify areas of upward motion/ascent (negative values) and downward motion/subsidence (positive values). The ECMWF Integrated Forecasting System (IFS) uses a pressure-based vertical coordinate system, and pressure decreases with height; therefore, negative values of vertical velocity indicate upward motion. In the case of divergence (s−1), this variable is the horizontal divergence of velocity, being positive for air that is spreading out, or diverging, and negative for the opposite, for air that is concentrating, or converging (convergence). Furthermore, total column vertically integrated water vapor (kg·m−2), also known as the integrated water vapor or precipitable water vapor, is the total amount of water vapor in a vertical column of air, i.e., an amount that could precipitate. The description of the entire variable can be found online at [54].

3. Results and Discussion

3.1. Flooding Characterisation

Although the event affected the Bahía Blanca district, the consequences of the rainfall had a greater impact on the urban areas of the Bahía Blanca, General Daniel Cerri, and Ingeniero White towns, which experienced significant flooding, along with soil erosion and gully formation in areas close to the canals or streams and in interfluvial areas. The false-color images enable the observation of the Bahía Blanca District’s condition before and after the extreme rainfall event. In Figure 2, the image on the left corresponds to 1 March 2025, before the event occurred, while the image on the right shows in black the areas with high soil moisture or water content even four days after the event.
The images corresponding to the localities of Bahía Blanca, General Daniel Cerri, and Ingeniero White reveal the presence of water or highly saturated soil on a larger scale during the analyzed dates (Figure 3). The use of multispectral information allowed for the calculation of NDVI and NDWI indices, which highlight areas of the district with moist soils, vegetation with high humidity, water, or rivers. Thresholding was allowed for the segmentation of pixels considered to be water. For the NDWI images, a threshold value greater than 0 was applied, while for the NDVI, a value less than zero was applied. As shown in Figure 4, the segmentation results of the NDVI and NDWI indices applied to an area near the lower basin of the Saladillo de García and Sauce Chico (above) and another image of one of the most affected neighborhoods, Villa Hardeen Green, in the town of Bahía Blanca (below). The validation of the results was carried out visually by selecting points from the segmented image obtained and data provided by an application that was developed to report incidents; in this case, the data entries corresponding to floods were considered [55].
The validation of the segmentation results was performed using flood zone incidents reported by citizens through a collaborative platform. These points were cross-checked with the points detected using NDWI thresholding segmentation, and spatial operations were applied to calculate the points intersecting water surfaces or wetland areas. Additionally, empirical visual inspections were conducted through direct observation of various zones, supported by local experts familiar with the area to ensure a robust validation process [55]. In this case, 88% of the reported incidents coincided with the pixels detected as water. The results obtained in this preliminary work indicate that the Bahía Blanca district had approximately 33 km2 of surface water in the radar images from 10 March 2025 (Figure 5, top). Most of the surface water detected was concentrated in the northern and southeastern areas of the district, in the non-urbanized zone. These areas correspond on average to lowlands, depressions, or crop fields.
In contrast, optical images detected 18 km2 of surface water from 11 March of 2025 (Figure 5, bottom). It is visually evident that water in the northern and southeastern areas decreased significantly on 11 March. However, surface water or high humidity is still present in the urban area. This detection is clearly due to the multispectral infrared bands, which allow for the identification of surface features, such as very humid areas in this case. This high percentage of humidity may be due to the distribution of fine sedimentary deposits (clay and silt) in the streets left by the flooding and by people removing mud from their homes. Furthermore, during this time, water was pumped from underground spaces into the city streets; the values of surface water for the localities of Bahía Blanca, General Daniel Cerri, and Ingeniero White correspond to 3.7 km2, 0.52 km2, and 1.4 km2, respectively (Figure 6). If we compare these values with the size of FIFA football fields, this suggests that this amount of water or very wet soil corresponds to 519, 73, and 209 football fields for the towns of Bahía Blanca, General Cerri, and Ingeniero White, respectively. Furthermore, water levels in sectors adjacent to the Maldonado Canal (Maldonado drainage) and the Napostá stream (within the city) ranged from 0.5 m to 1.7 m. This coincides with the red areas in Figure 6.

3.2. Meteorological Conditions

3.2.1. Weather Measurements at the Surface

Table 1 shows the SYNOP code reported at Bahia Blanca Aerodrome at three instants throughout 7 March 2025. From the records, a variation of about 2 °C in the air temperature near the surface is verified, with a temperature of 19.8 °C (1200 UTC) being lower than the record at 0600 UTC (22 °C). The record at 1800 UTC maintains milder temperatures of 20 °C. Regarding the atmospheric pressure, it is worth highlighting the drop in surface pressure of almost 3 hPa between 0600 UTC (1009.8 hPa of psl and 1000.2 hPa at station level) and 1200 UTC (1007.0 hPa of psl and 997.4 hPa at station level). Pressure remains low at 1800 UTC, although it is slightly rising to 1008.3 hPa (psl) and 998.6 hPa at station level.
The most significant changes are found in the wind direction and precipitation variables. The wind record shows a slight increase in intensity, going from 8 kt (14.8 km/h, 4.1 m/s) at 0600 UTC to 13 kt (24.1 km/h, 6.7 m/s) at 1200 UTC. Winds at Bahía Blanca station also change direction throughout the event, with winds from WSW (245–254°) at 0600 UTC, from S (175–184°) at 1200 UTC, and from NE (45–54°) at 1800 UTC. Finally, the 6 h total precipitation shows 0.0 mm at 0600 UTC, 210.0 mm at 1200 UTC, and 80 mm at 1800 UTC. The extreme precipitation in Bahía Blanca was not verified at the nearest weather stations, although some precipitation had been recorded throughout the study period: Rio Colorado (68 mm/24 h, Station WMO index: 87736) and Pigue Aerodrome (34 mm/24 h, Station WMO index: 87679). This rainfall in Bahía Blanca exceeded the historical record of 150.9 mm that occurred on February 23, 1975. An event of this magnitude has a recurrence period of more than 100 years [57].

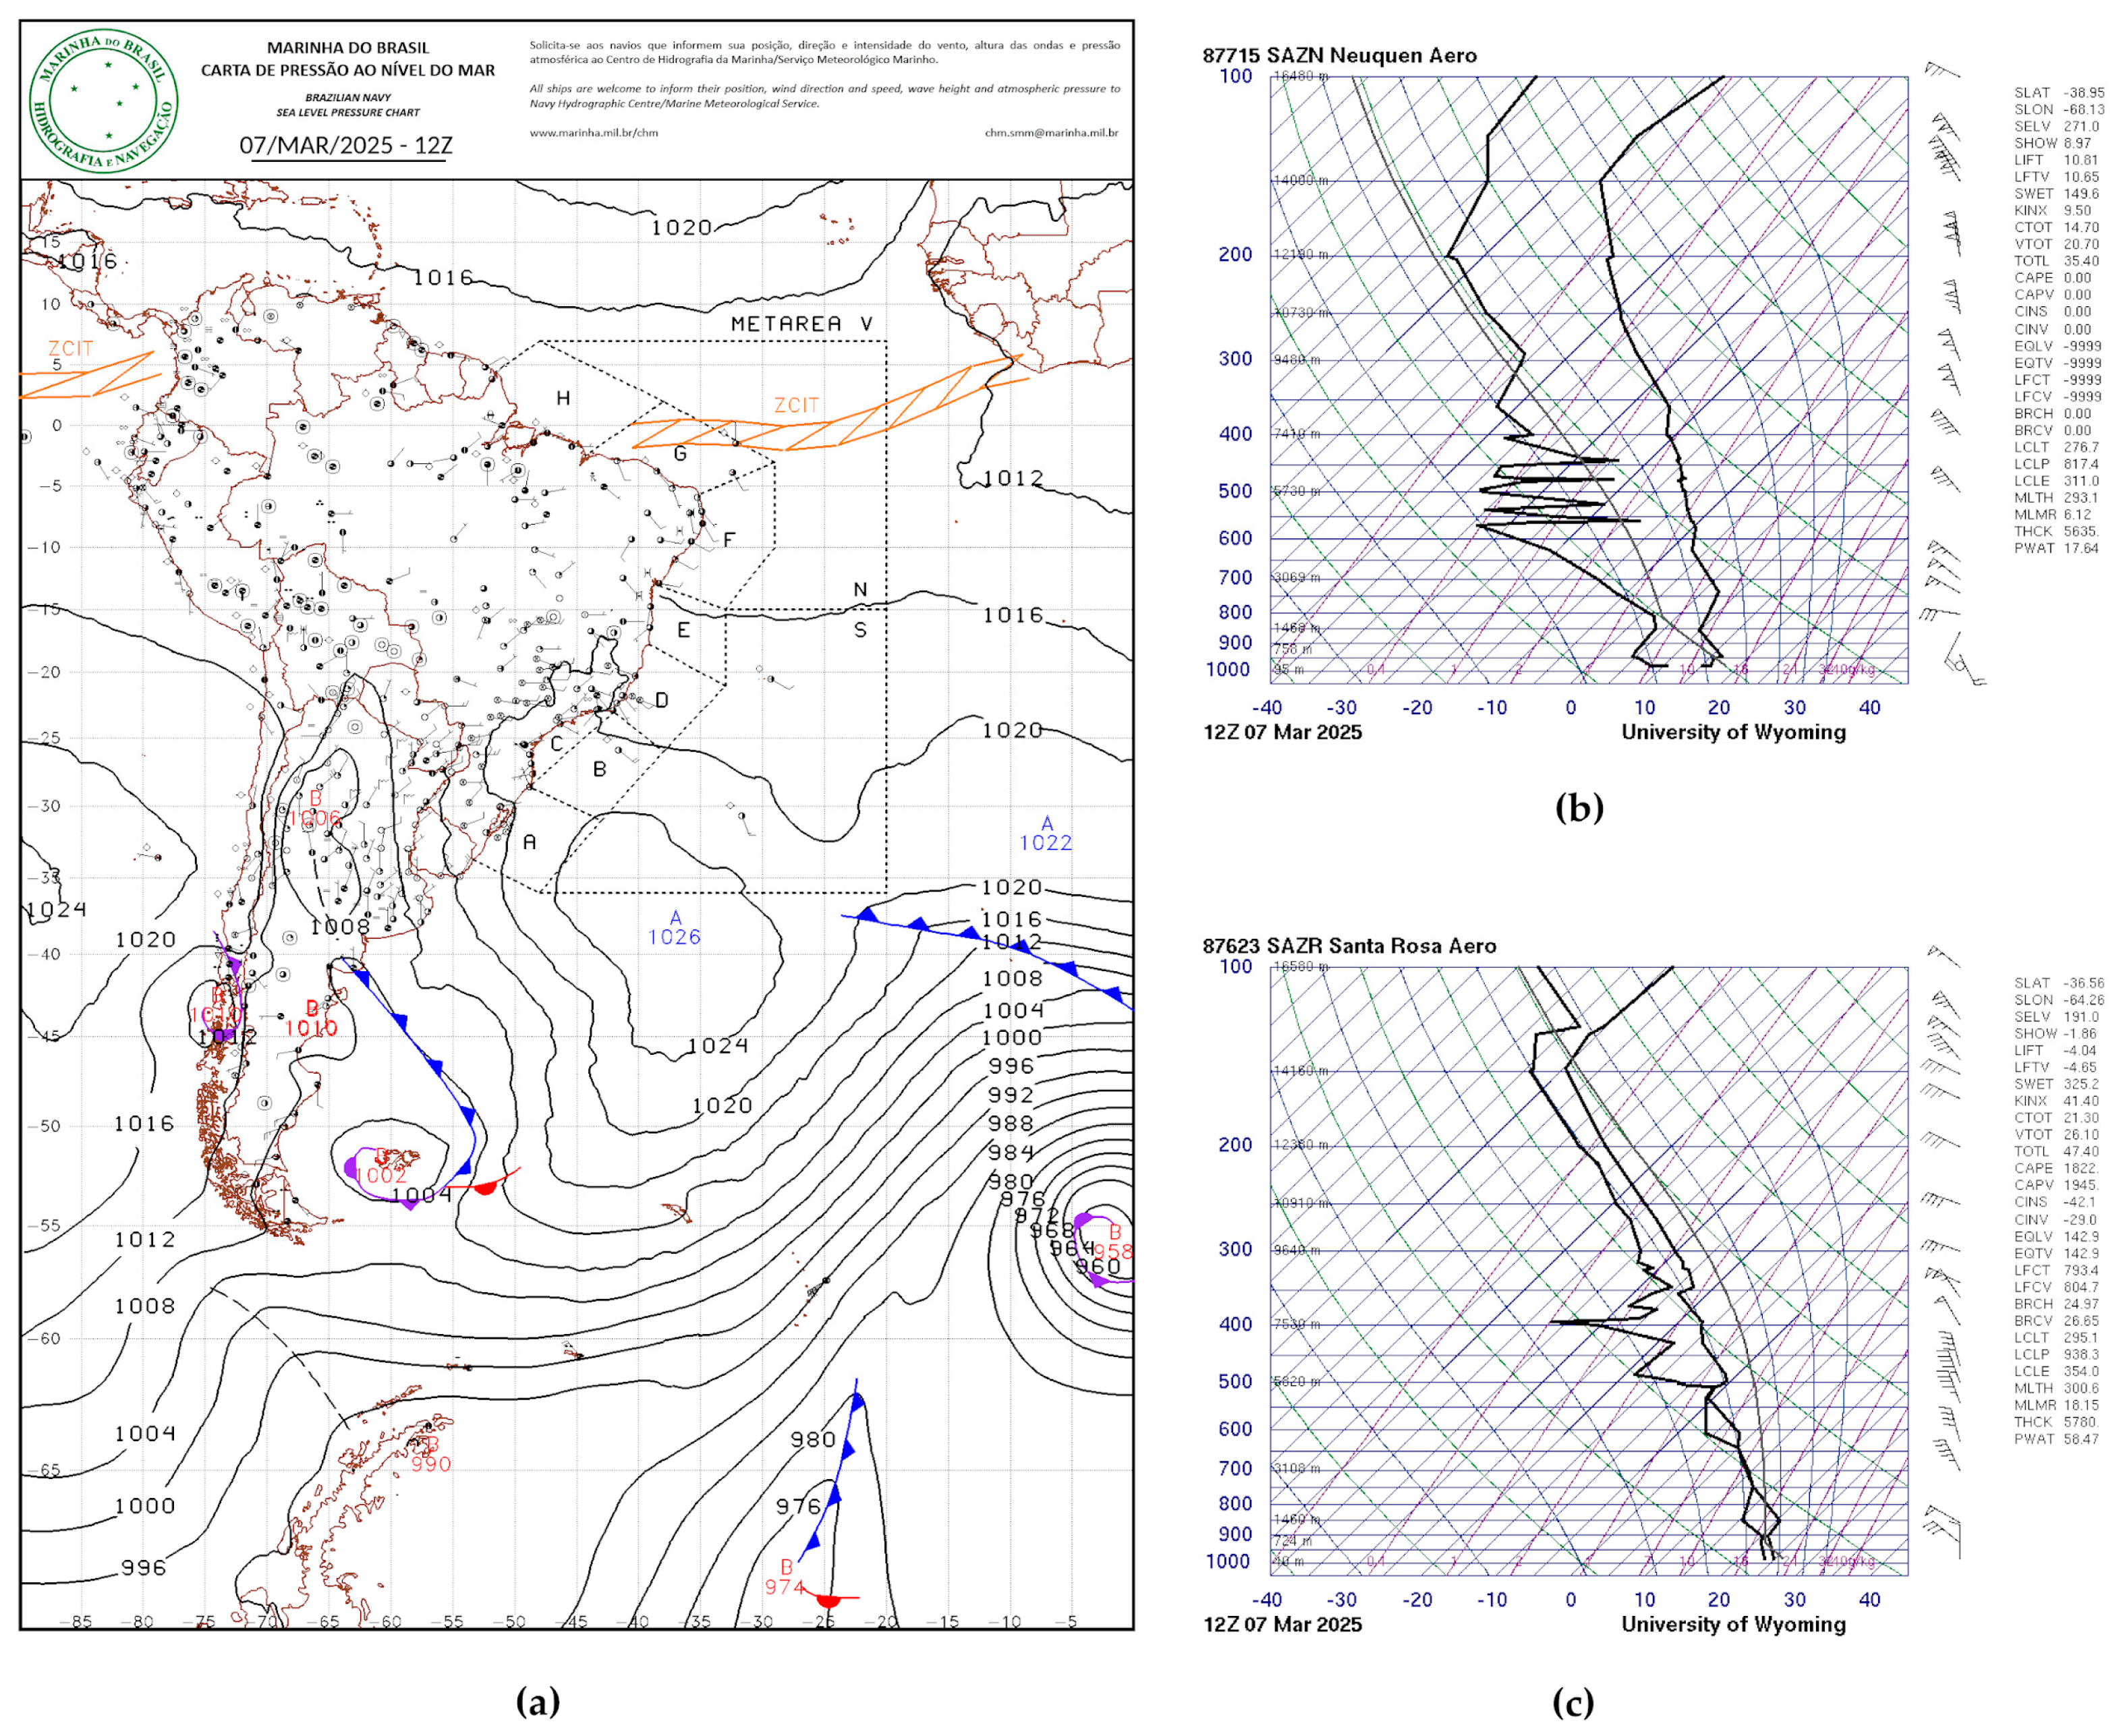
3.2.2. Atmospheric Circulation and Instability

Synoptic flow over Bahía Blanca was dominated by a complex interaction of weather patterns. The synoptic chart at 1200 UTC (Figure 7a) displays a low-pressure system centered at approximately 52° S and 62° W, with the cold front extending toward the coastline of Argentina at a latitude of 41° S, southward of Bahía Blanca. Over the continent, there is an instability line that extends from the frontal system to a north–northwesterly (NNW) direction within a region of lower pressure (minimum pressure of 1006 hPa at 30° S and 66° W). Over the Atlantic Ocean, in turn, a high-pressure system is identified with a center at 37° S and 37° W. However, it is noteworthy that the Bahía Blanca region is under the influence of these weather systems that favor northerly winds in the region.
The difference between the air masses affecting the region is clearly seen when comparing the two thermodynamic diagrams shown in Figure 7b,c. The Neuquen station (Figure 7b), located further south, presents a stable atmospheric condition, with a low amount of precipitable water (17.64 mm), south/southeastern (SSE) winds at 950 hPa, and temperatures of 15.2 °C at the surface. At a distance of approximately 550 km northwestward, Santa Rosa station is found with completely opposite atmospheric conditions. Figure 7c shows northwestern (NW) winds at 925 hPa with an air temperature of 24.8 °C near the surface and an unstable atmospheric condition. Furthermore, very high values of precipitable water (58.47 mm) and a moderate CAPE (1822.98 J/kg; CAPE = 1000 to 2500: moderately unstable) are measured from the sounding. In addition, the lower heights of the lifted condensation level (938.31 hPa, around 700 m above ground level) and level of free convection (793.45 hPa, around 2 km above ground level) give and estimative of the cloud base height and the level at which a lifted parcel becomes positively buoyant with a free acceleration upward to the equilibrium level, which in this case was at 142.93 hPa (around 14.5 km above ground level).
The instability indices evaluation shows favorable conditions for the development of severe thunderstorms, given the values of the following parameters: Lifted Index (LI, unit: °C) of −4.04 (LI = −3 to −6: moderately unstable), Showalter Index (SI, unit: °C) of −1.86 (SI = 0 to −3: moderately unstable), Totals Totals Index (°C) of 47.40 (45 to 50: thunderstorms possible), SWEAT Index of 325.21 (SWEAT over 300: potential for severe thunderstorms), and K Index (°C) of 41.40 (K = 40: best potential for thunderstorms with very heavy rain). The thresholds and their meaning can be consulted online at [58].
Satellite observation (Figure 8a) shows the development of several convective clouds at 0600 UTC, with cloud tops presenting brightness temperatures below −60 °C. These cloud systems follow the instability line identified in the synoptic chart (Figure 7a). However, it is noteworthy that the convective system near Bahía Blanca presents cloud top temperatures below −70 °C, indicating a deep convective cloud. The ECMWF Analysis (Figure 8b) shows a northerly flow at the 850 hPa level reaching Central Argentina with a wind speed of around 25 m·s−1, consistent with the wind speed measured at the Santa Rosa sounding, i.e., 48 kt (24.6 m·s−1) at 857 hPa (Figure 7c). This intense flow, a jet-like wind, produces a convergence line that extends up to the Bahía Blanca region (red asterisk in Figure 8b), also identified in the divergence field at 850 hPa from the negative values (Figure 8c).
The SYNOP report (see Table 1) indicated that the extreme precipitation of 210.0 mm occurred between 0600 UTC and 1200 UTC. The satellite image sequence during this period is shown in Figure 9a–i. The convective system previously identified at 0600 UTC (Figure 8a) remains almost stationary as it intensifies until 0800 UTC (Figure 9a,b). Figure 9a displays overshooting tops of brightness temperature (BT) of −75 °C. These BTs are seen no longer as isolated overshooting tops but as a larger region (Figure 9b). The region of deep convection over Bahía Blanca starts decaying in the next hour, although the west side portion remains with the lowest BT (Figure 9c). During this period (Figure 9a–c), other convective systems that develop to the west move towards the Bahía Blanca region, merging with the convective system and forming an agglomerate of convective cells (Figure 9d) that organizes a WNW–ESE oriented band of intense convection with BT still below −70 °C (Figure 9e). The cloud system stays over the region until 1200 UTC (Figure 9f), when the dissipation stage begins as it moves east–northeastward (Figure 9g–i).

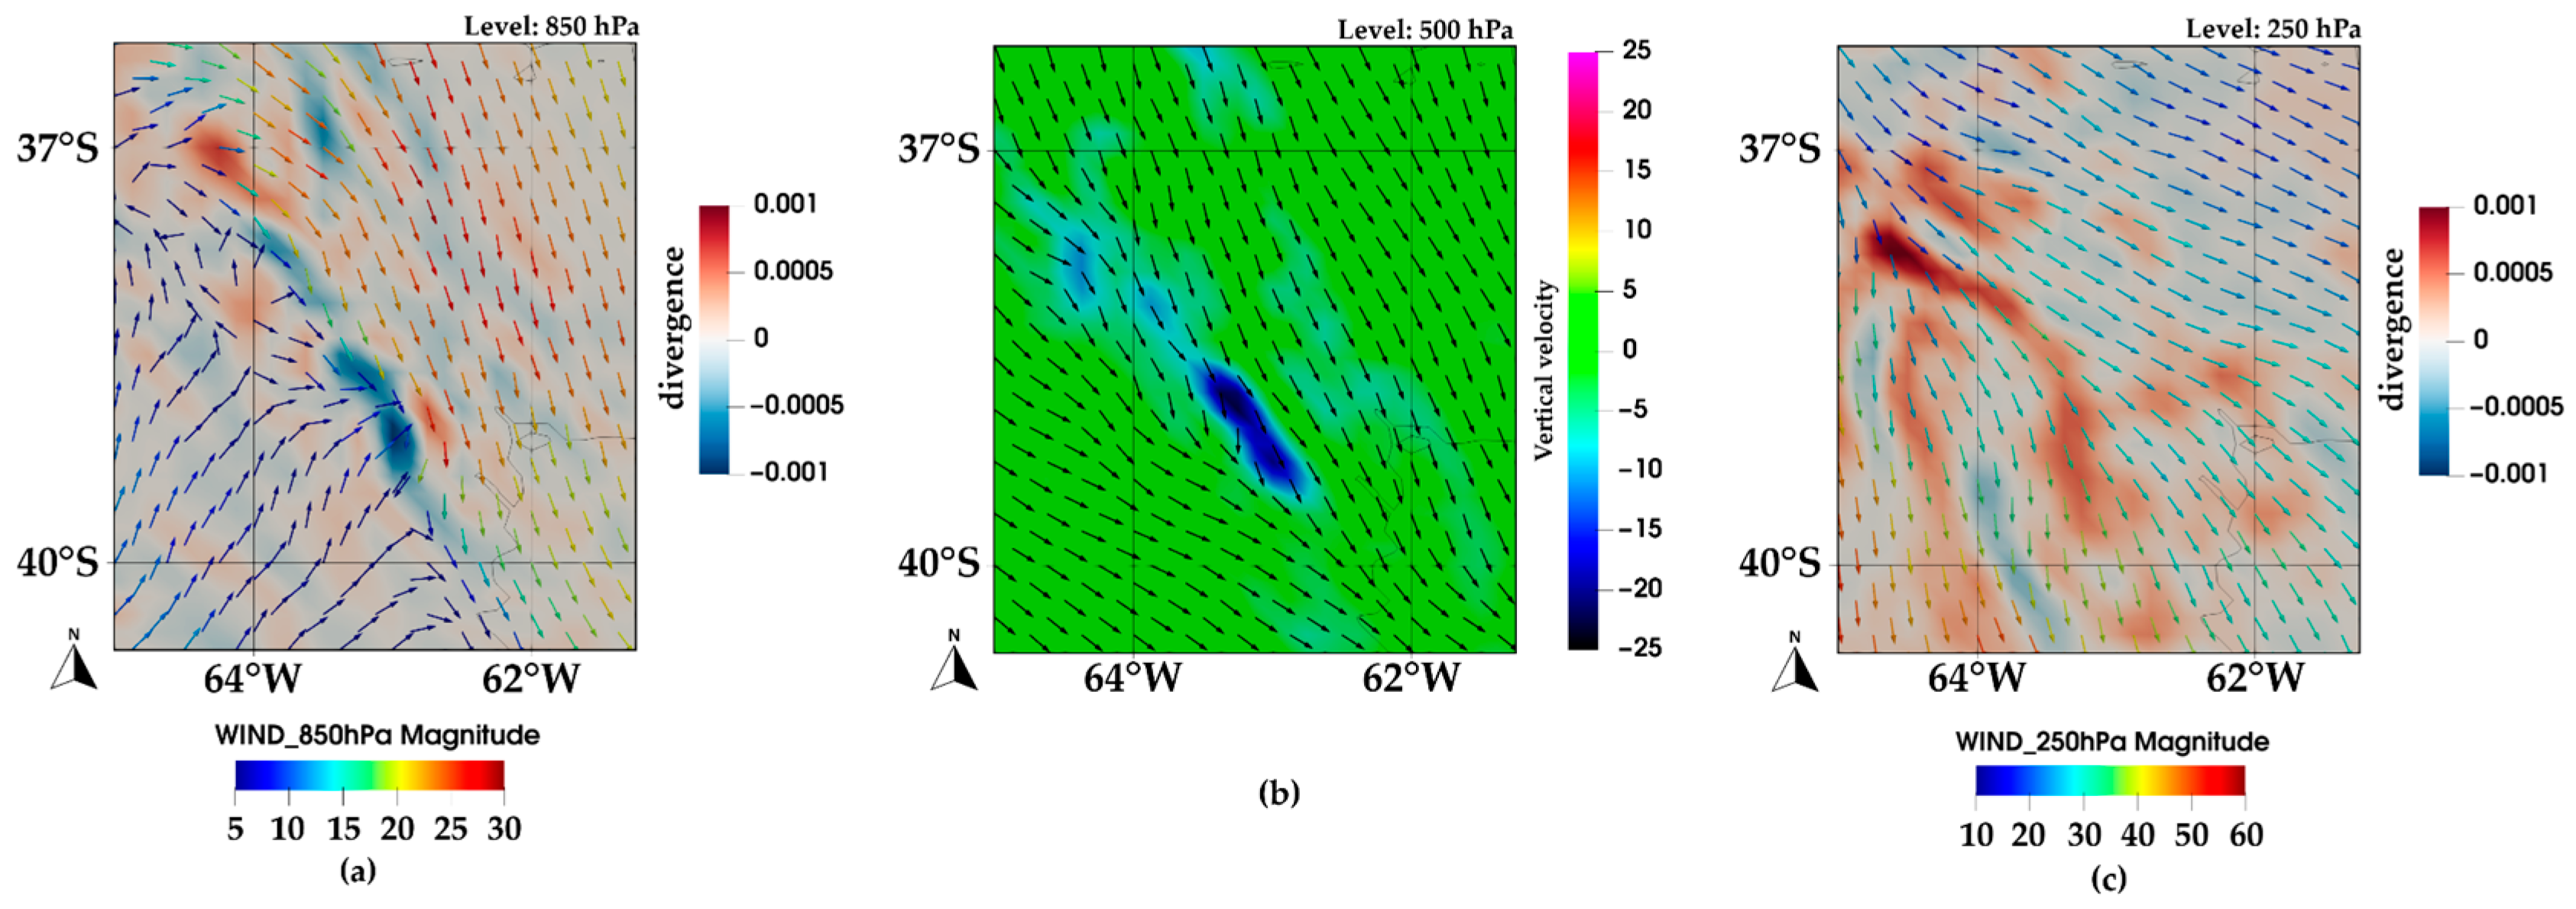
3.2.3. Mesoscale Environment

Figure 10a displays an NW–SE oriented band of precipitable water greater than 50 mm affecting Bahía Blanca at 1200 UTC. The 850 hPa level can be characterized by a well-defined convergence line between an SW airflow and the intense NW airflow that presents significant specific humidity of above 0.016 kg·kg−1 (Figure 10b). Besides that, Figure 10c shows that this convergence line is also marked by a temperature gradient at lower levels (e.g., at 925 hPa), as seen by the colder air to the southwest and a warmer air mass to the north/northeast, which is advected toward the Bahía Blanca region.
The divergence field at 1200 UTC reveals a line of intense convergence at the 850 hPa level (negative divergence, Figure 11a), which is followed by intense upward motions in the middle troposphere (Figure 11b). Figure 11c also shows divergence of the horizontal flow at upper levels (250 hPa) over the region with intense ascending motion displayed in Figure 11b.
The development of a convergence line at lower levels associated with a jet-like wind and high moisture content was the main atmospheric mechanism behind the formation and maintenance of the convective systems in the region. The visual appearance of deep convective clouds is remarkable in satellite imagery, and its formation is supported by the instability indices that indicated favorable conditions for severe weather phenomena. The deep convection was sustained by upper-level divergence and associated with intense upward motions at middle levels identified at 1200 UTC. Despite the temporal resolution of 6 h of the ECMWF analysis, this dataset revealed, even in a preliminary point of view, the main atmospheric mechanism behind the formation of the precipitating system that caused the extreme precipitation of 210 mm (6 h period) in Bahía Blanca and the flooding in the urban areas (Figure 12). The rescue teams lost their response capacity on the morning of 7 March, with the overflows causing the loss of ambulances, patrol cars, trucks, and vans, and representing nearly 70% operational capacity. Moreover, there were 1300 evacuees, and USD 400 million was estimated to rebuild the city [59,60].
Several studies have revealed that low-lying urban areas are susceptible to hydrological disasters, namely flash floods or storm surges, e.g., [3,7,10,62]. This preliminary study reveals that the Bahía Blanca region is one of these areas, particularly the low-lying urban areas. Studies have already highlighted the impact that rainfall events have on floods in the Bahía Blanca urban areas [63,64]. However, Bahía Blanca does not frequently experience torrential rains, according to Argentina’s national weather service [57], the last extreme rainfall event occurring in 1975 presented rainfall of practically half of what was recorded in the present episode, making this a remarkable case. The two causes of flooding in Bahía Blanca occur when (1) rainfall falls on the city and its area of influence and (2) the Napostá Stream overflows [63], also due to rainfall in its upper basin and in its middle and lower basins. Historical data obtained from the local newspaper indicate that the Napostá Stream overflowed its banks in 1884 (200 mm), in 1933 (167.6 mm), and in 1944 (300 mm). Since that year, various hydraulic works have been carried out that helped mitigate the overflows. However, the city continued to experience flooding in different areas of the city due to rainfall of different millimeters and periods of time [63,65]. In the meteorological context, different weather systems can produce extreme amounts of precipitation, which were briefly mentioned in the introduction. For instance, linked to tropical storms, orographic precipitation systems, and mid-latitude systems. Here, the low-level jet phenomenon is well documented in the literature by producing deep convection and causing significant precipitation, often in northern Argentina and southern Brazil e.g., [18,22,66,67].
The study provides the main surface and atmospheric conditions related to this flooding event, but limitations of the study need to be stated. First, the meteorological dataset lacks weather radar observations and high temporal resolution of the rainfall measurement at the surface. This makes the analysis of the precipitating system difficult, in particular the identification of rainbands that affected Bahía Blanca. This limitation is enhanced by the 6 h temporal resolution of the ECMWF analysis, which showed the large-scale ingredients leading to the deep convective clouds’ development but not the small-scale convective cloud dynamics. Finally, the remote sensing data showed the surface characteristics and flooded areas only 3 and 4 days after the event. This study shows the utility of Sentinel-2 and Sentinel-1 SAR imagery for rapid flood mapping in the Bahía Blanca district while highlighting critical limitations of non-simultaneous multi-sensor analysis. The qualitative comparison with optical (Sentinel-2) data revealed agreement in water detection areas, though there were temporal discrepancies in 24 h acquisition time. However, although there are images with higher spatio-temporal resolution, their use in a large-scale context of monitoring is still a challenge, and the dataset used here can be useful for identifying regions of interest that require or justify an analysis at a finer scale. In addition, a more in-depth study of the conditions of the underground water regime in the region may provide cutting-edge results on the dynamics of this event in the metropolitan area of Bahía Blanca. An example of how groundwater systems can respond to extreme hydrological events was explored for a flood event in Serbia [68].

4. Concluding Remarks

The main aspects of the flooding in the Bahía Blanca district on 7 March 2025 are investigated, and the preliminary results are shown in this study. The event had a high impact on the local community, damaging urban infrastructures and causing at least 15 fatalities. The study revealed the following highlights:
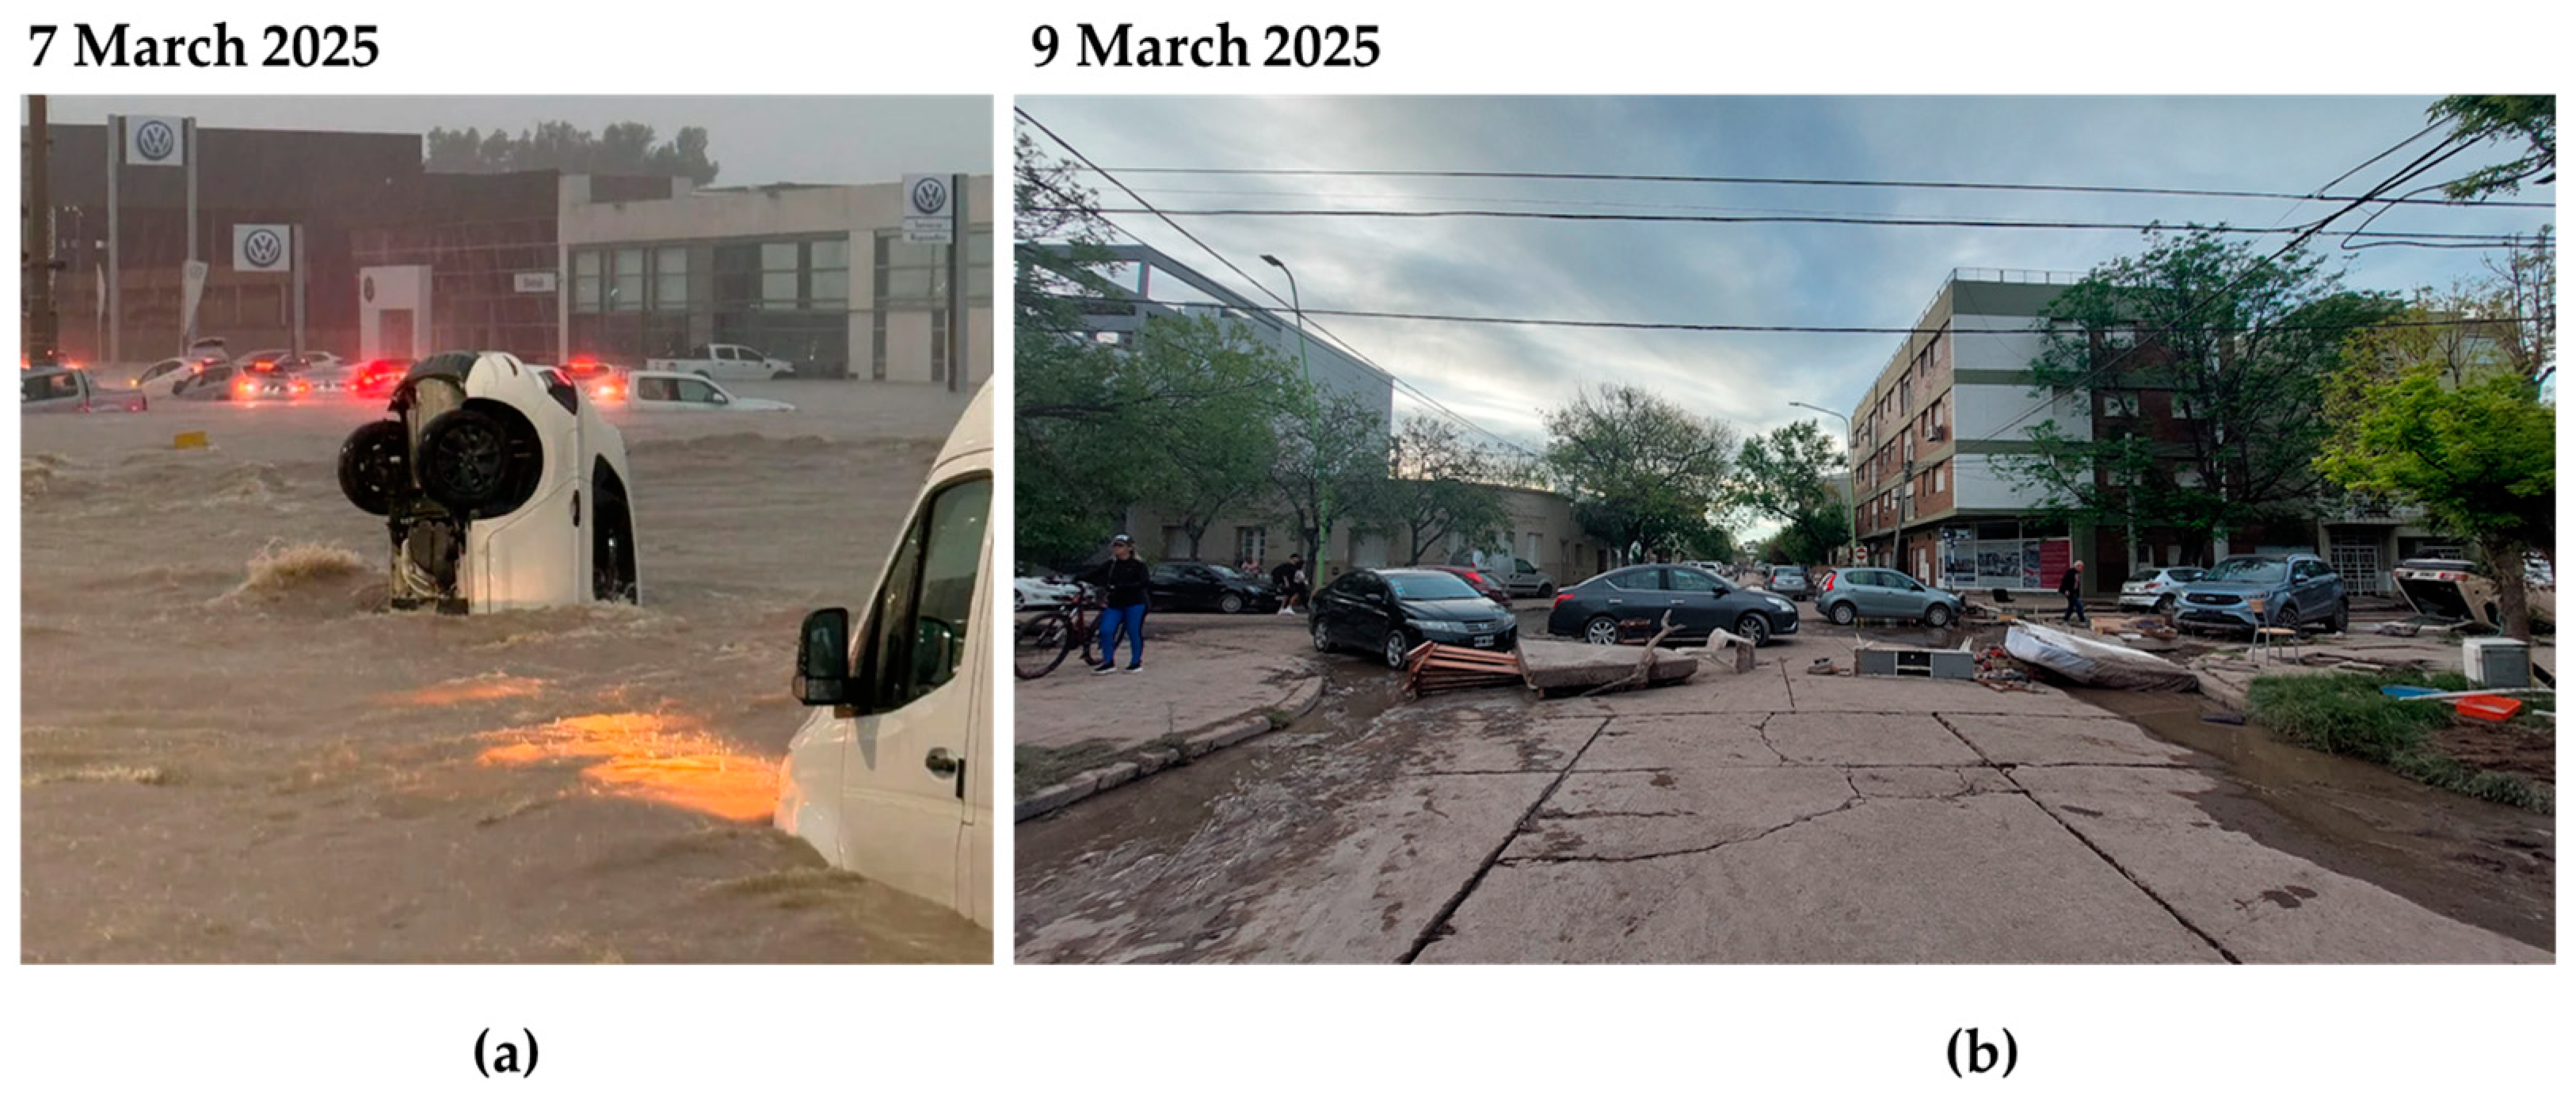
  • Bahía Blanca district presented flooded areas of approximately 33 km2 on 10 March (1.4% of the total area), most of them concentrated in the non-urbanized zones. A total of 18 km2 (0.8% of the total area) was still identified on 11 March, with a greater impact on the low-lying urban areas of the Bahía Blanca, General Daniel Cerri, and Ingeniero White towns. The study includes an interactive Earth Engine visualization tool for examining flood impacts through temporal urban condition comparisons [Supplementary Material: https://ee-revollonatalia.projects.earthengine.app/view/floodapp] (accessed on 21 April 2025).
  • The low-lying urban flooding was produced by an exceptional precipitation of at least 290 mm in Bahía Blanca, with a total amount of 210 mm between 0600 UTC and 1200 UTC and 80 mm in the following 6 h period.
  • The likelihood of severe weather conditions was confirmed from instability indices (e.g., Lifted Index, Showalter, Totals Totals, SWEAT, and K).
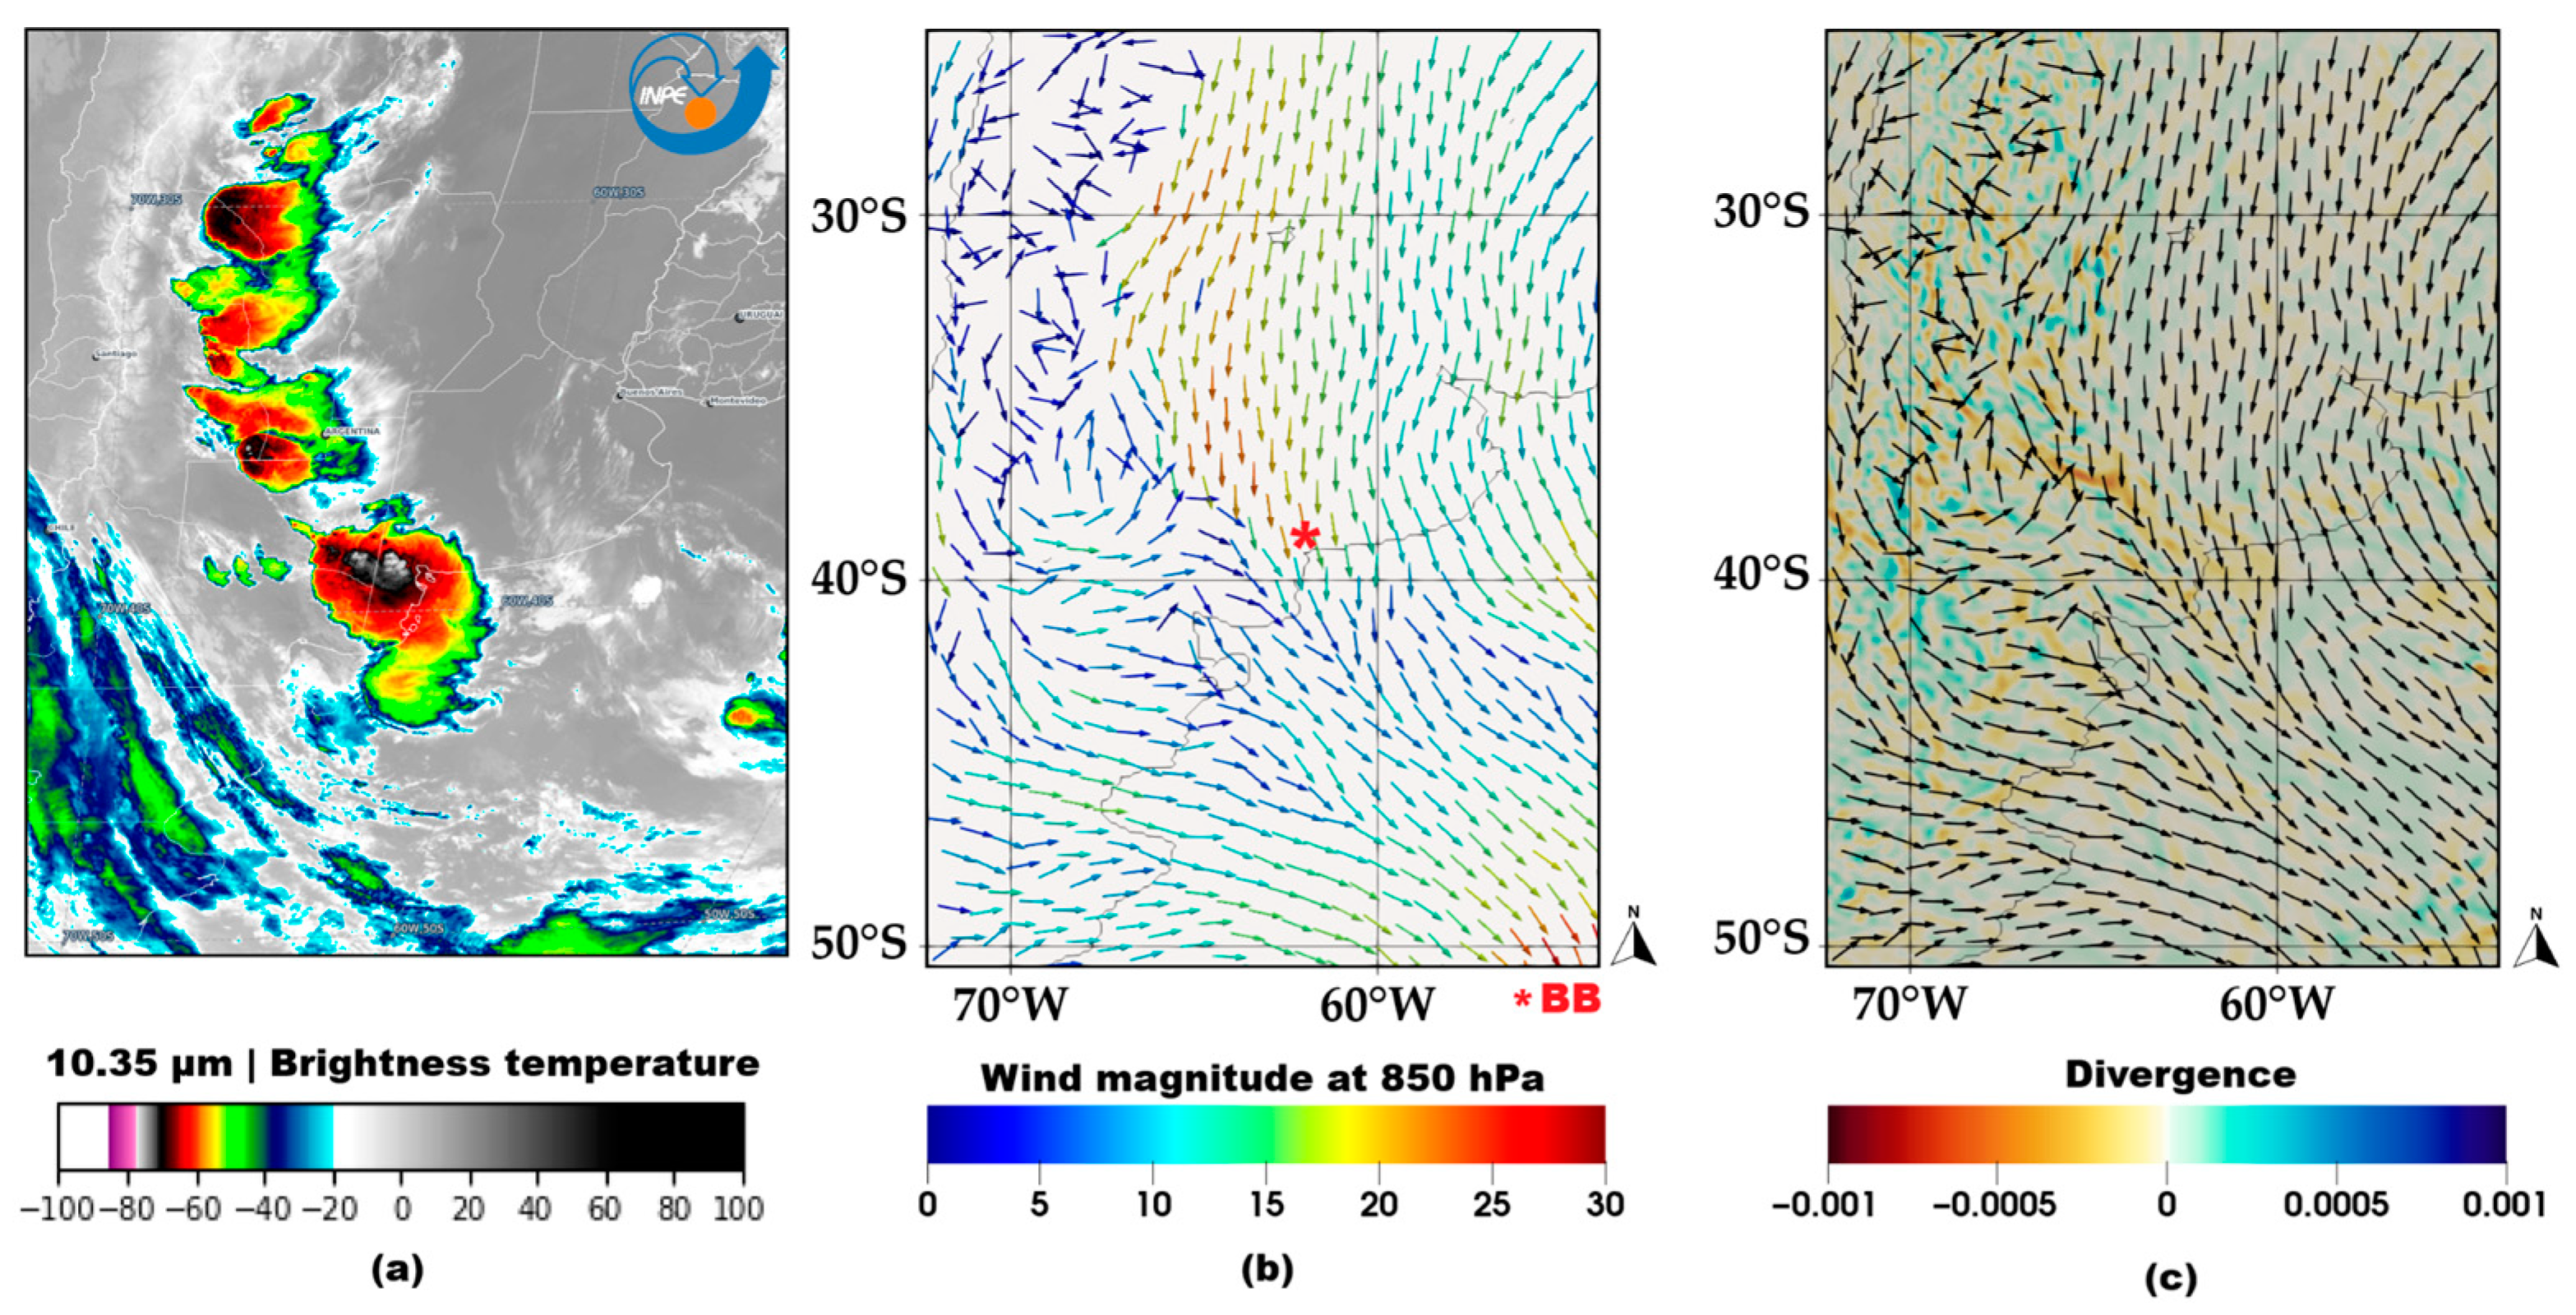
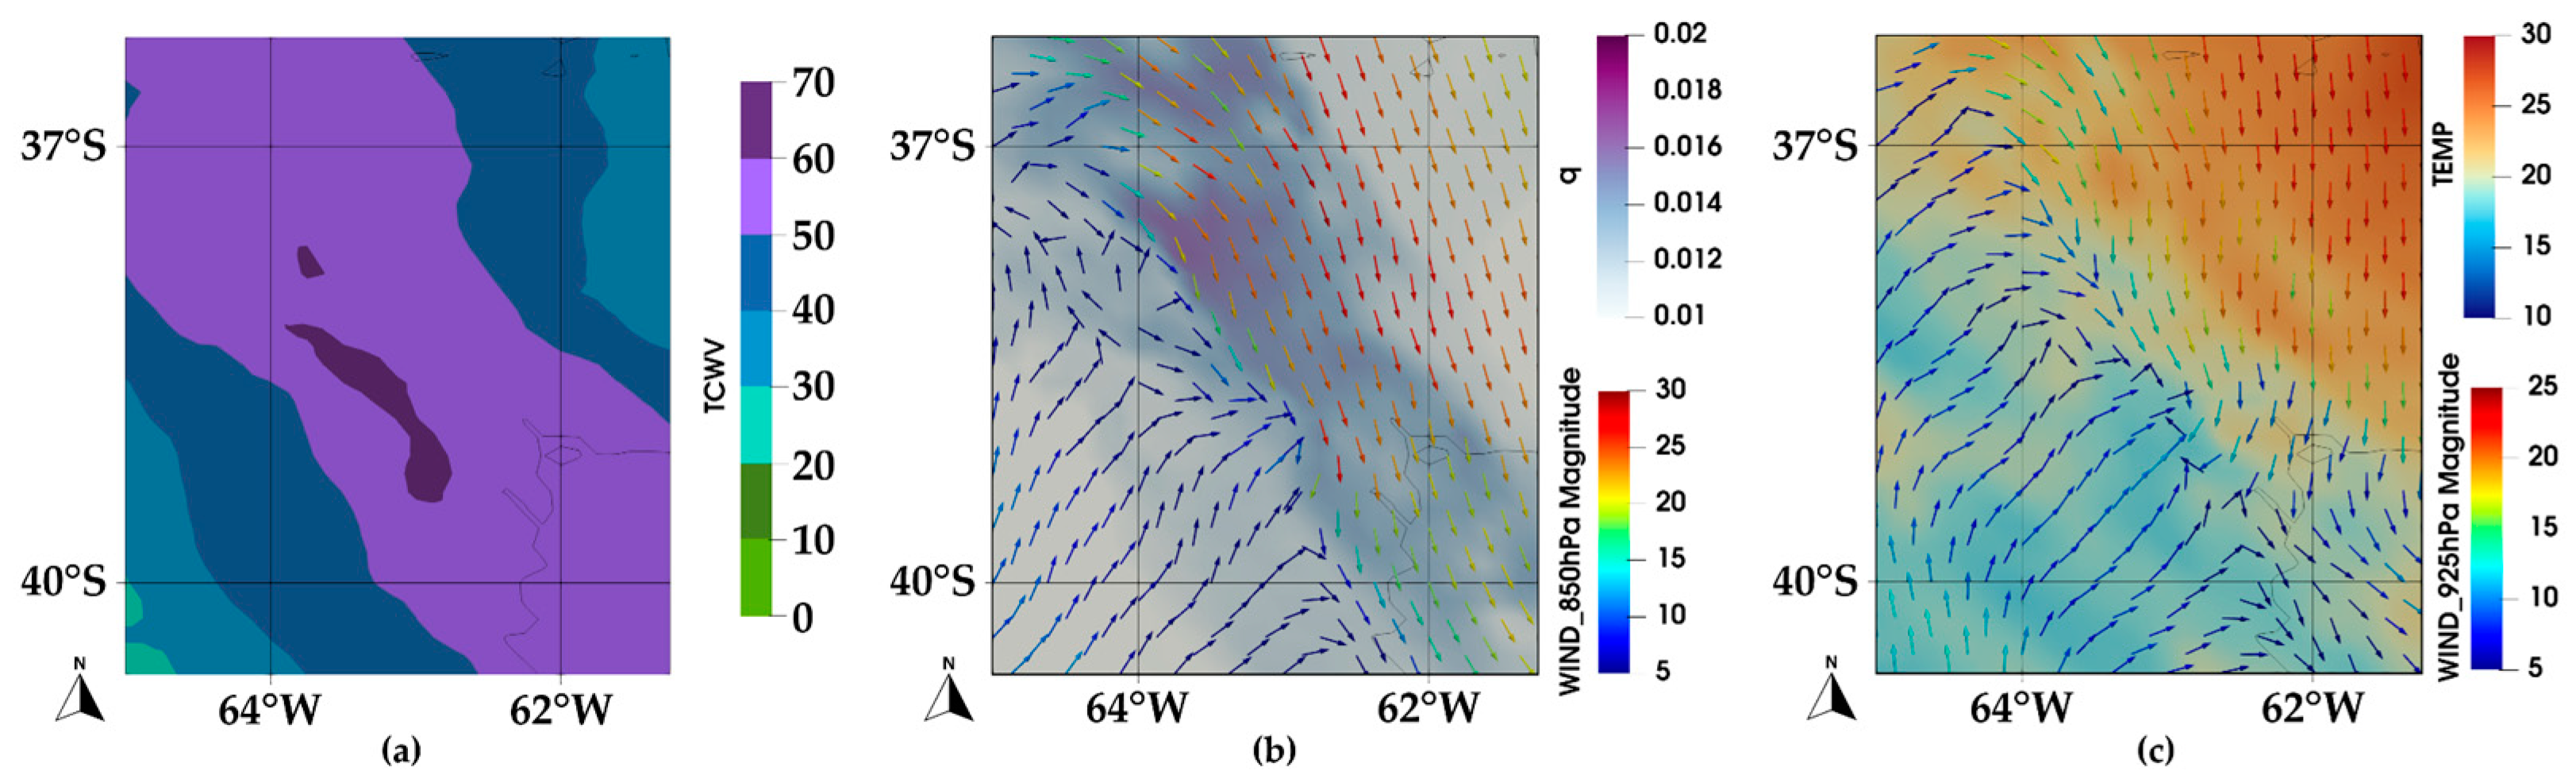
  • The existence of a low-level convergence line, also characterized by warm air advection and very high atmospheric moisture content. In parallel, the upper-level divergence contributed to the development and maintenance of deep convective clouds that affected Bahía Blanca for at least 6 h.
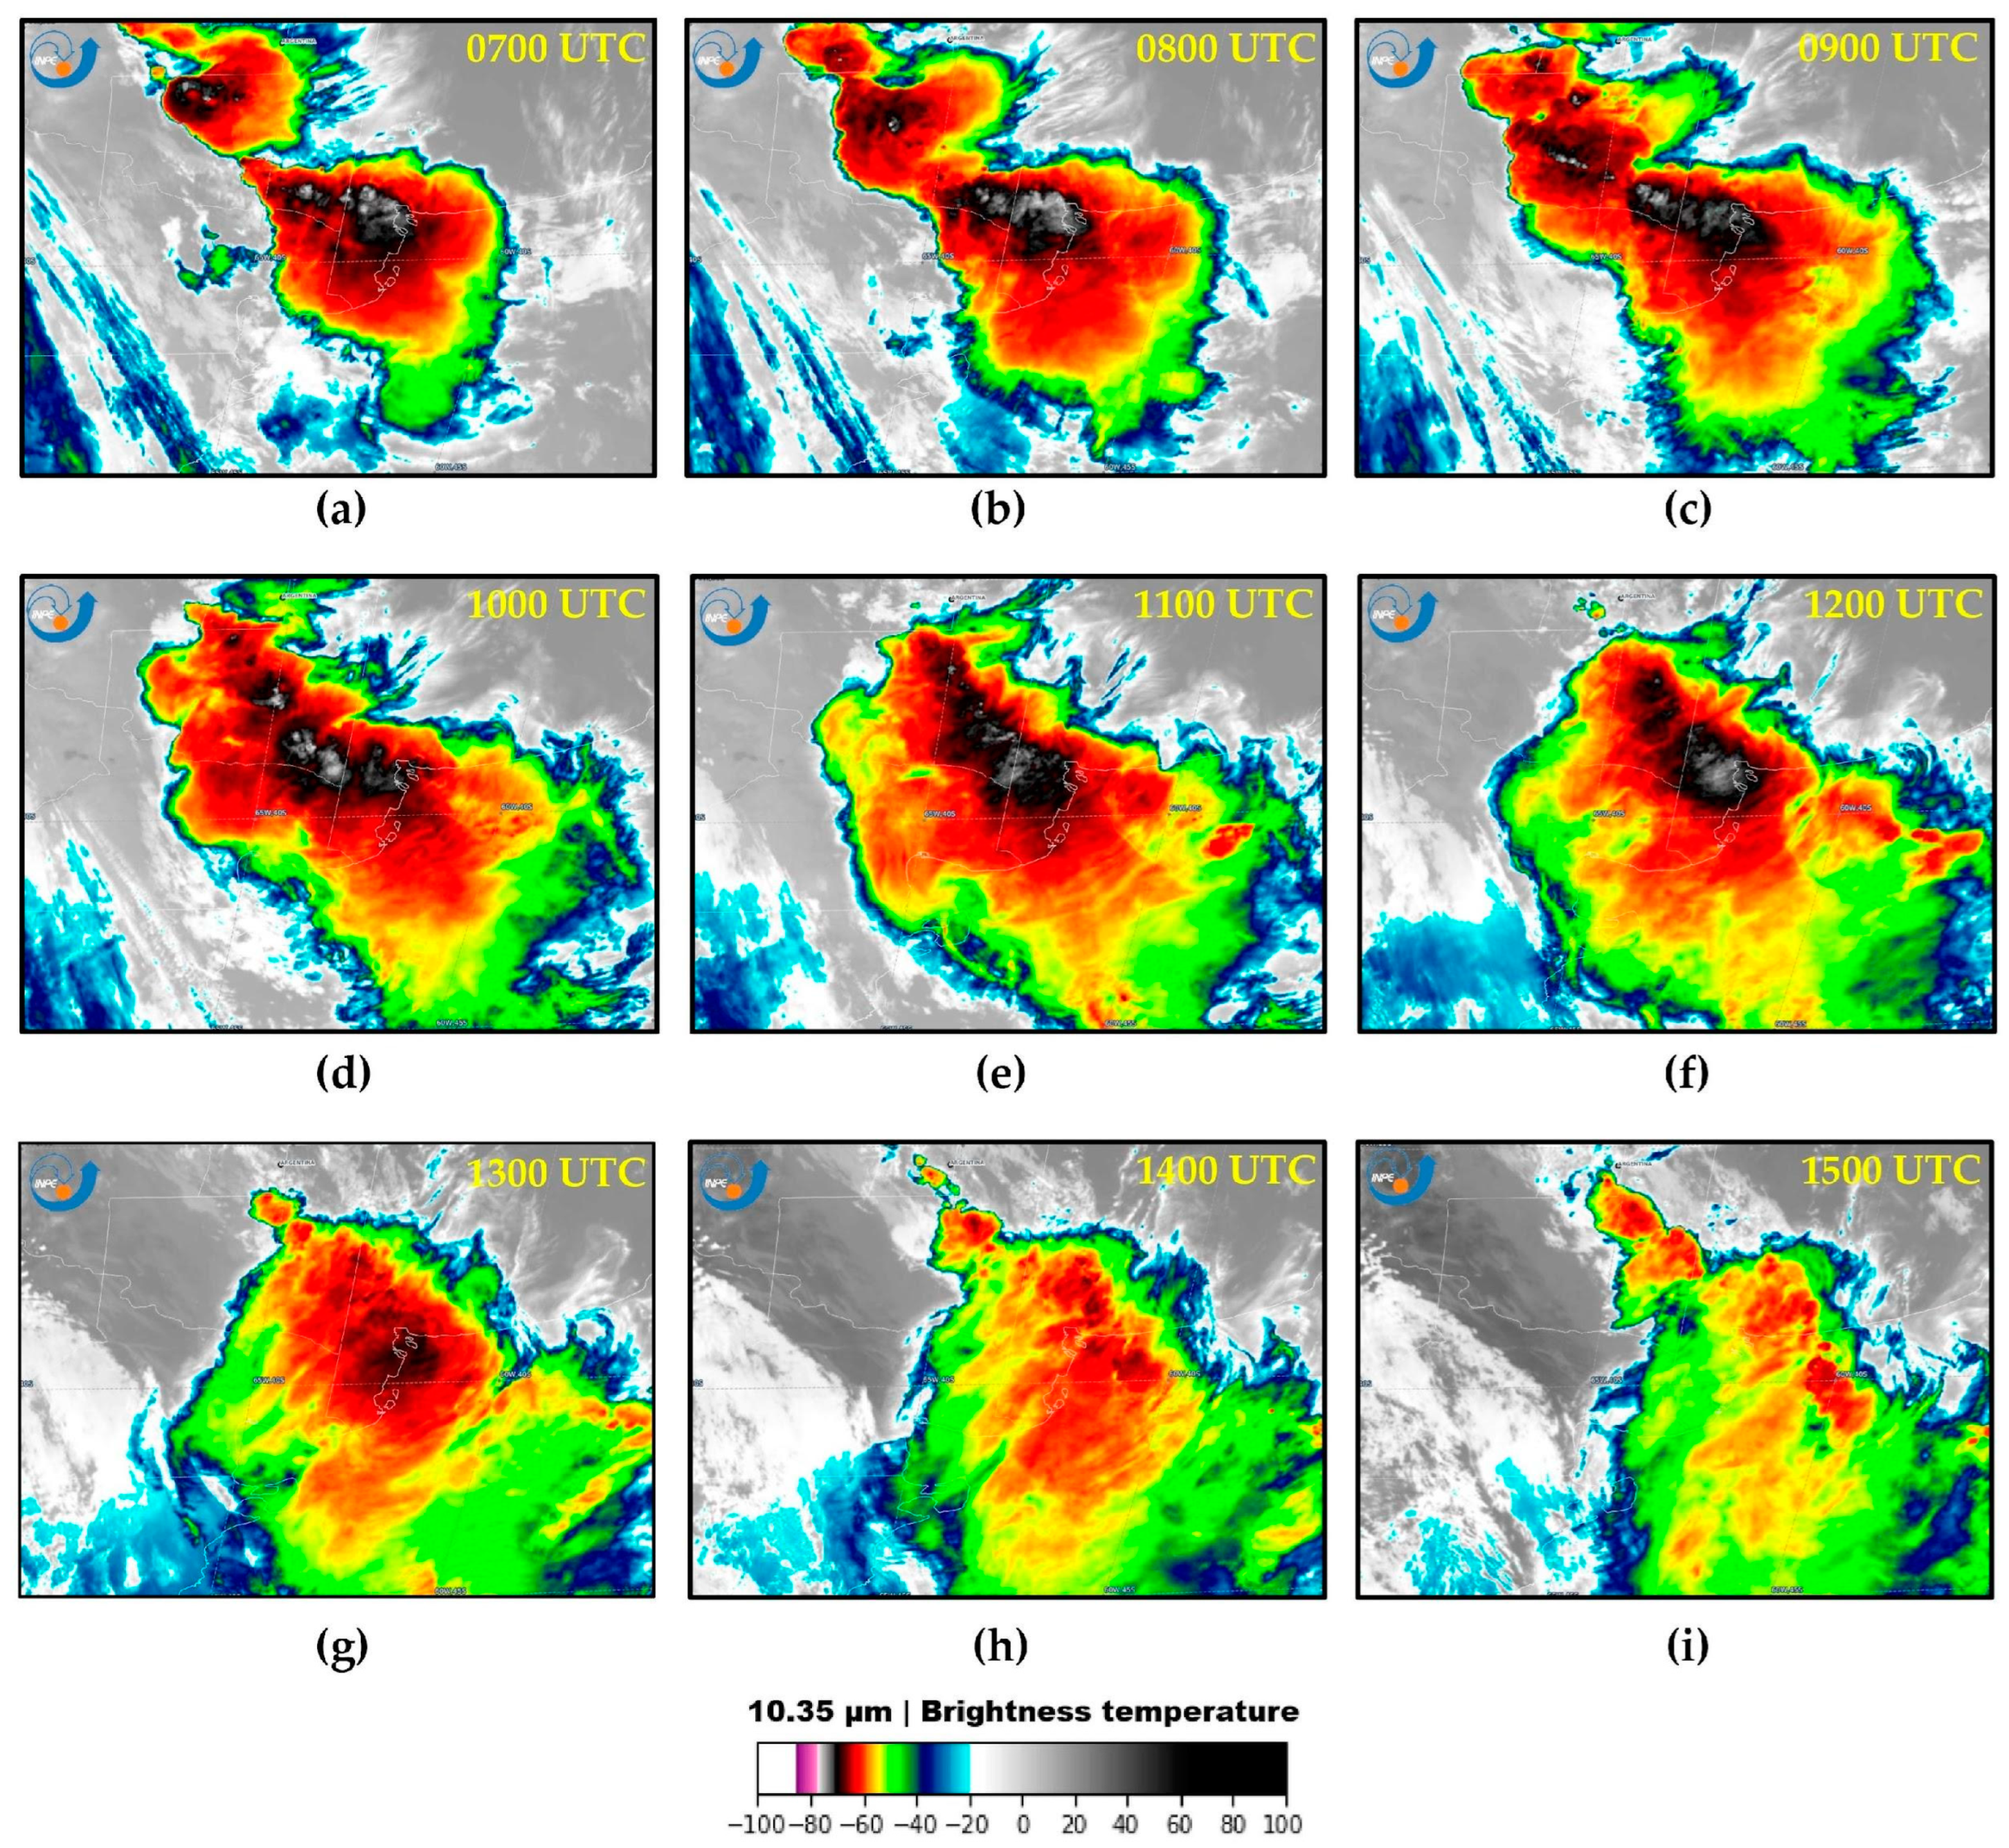
  • Satellite imagery indicated an agglomerate of convective clouds with brightness temperatures of around −70 °C most of the time, as well as overshooting tops at several moments.
This preliminary work highlights the importance of using different data sources, namely collaborative networks that allowed for the collection of additional information through online platforms, social media, and other technologies. Such information was crucial to complement the flood assessment made by remote monitoring. As future work, we aim to include a more detailed micro-scale approach, using higher-resolution images with a focus on the most vulnerable areas during the event. Furthermore, the use of artificial intelligence models is planned to detect surface water, high-humidity areas, gullies, and eroded soils, which would enable monitoring at various scales for social, environmental, and economic decision making.
The present study brings evidence for regional decision-makers that, under the current climate change conditions, regions that do not usually experience extreme weather events may be more susceptible to them as climate change intensifies.
Increasing knowledge of urban floods from different data sources can support weather forecasts to provide timely warnings, essential to mitigate the adverse impacts of these extreme weather events on low-lying urban areas. To complement this preliminary study and, as a first step toward a better understanding of this deadly event, the study will continue in order to assess the antecedent surface and atmospheric conditions in the region, namely the precipitation regime in previous days that could have contributed to enhancing the flooding risk in the Bahía Blanca district. Furthermore, atmospheric modeling is expected to help us in assessing the main aspects of the precipitating system from very high-resolution numerical simulation. Increasing spatial and temporal resolution will allow the evaluation of rain dynamics associated with the convective clouds identified from satellite images. Besides that, a study about how climatic patterns influenced the intensity and occurrence of such an extreme event is important for a full understanding of the Bahia Blanca flooding and also for communities that are looking to adapt to climate changes.

Supplementary Materials

The following supporting interactive Earth Engine visualization tool for examining flood impacts through temporal urban condition comparisons can be assessed at https://ee-revollonatalia.projects.earthengine.app/view/floodapp (accessed on 21 April 2025).

Author Contributions

Conceptualization, N.V.R. and F.T.C.; methodology, N.V.R., V.G. and F.T.C.; software, N.V.R.; validation, N.V.R. and V.G.; formal analysis, N.V.R., V.G. and F.T.C.; investigation, N.V.R., V.G. and F.T.C.; resources, N.V.R. and F.T.C.; data curation, N.V.R. and F.T.C.; writing—original draft preparation, N.V.R.; writing—review and editing, F.T.C. and V.G.; visualization, N.V.R. and F.T.C.; supervision, n/a; project administration, n/a; funding acquisition, n/a. All authors have read and agreed to the published version of the manuscript.

Funding

This research received no external funding.

Institutional Review Board Statement

Not applicable.

Informed Consent Statement

Not applicable.

Data Availability Statement

ECMWF—MARS catalogue: https://www.ecmwf.int/en/forecasts/dataset/operational-archive (accessed on 10 March 2025); CPTEC/INPE: https://www.cptec.inpe.br/dsat/ (accessed on 17 March 2025); OGIMET: www.ogimet.com (accessed on 18 March 2025); Centro de Hidrografia da Marinha (CHM): https://www.marinha.mil.br/chm/dados-do-smm-cartas-sinoticas/cartas-sinoticas (accessed on 18 March 2025); University of Wyoming: https://weather.uwyo.edu/upperair/sounding.html. The Sentinel-1 image, acquired on 10 March 2025, and the Sentinel-2 image, acquired on 11 March 2025, were obtained from the Copernicus Open Access Hub (https://browser.dataspace.copernicus.eu/).

Acknowledgments

The authors are grateful to the European Centre for Medium-Range Weather Forecasts (ECMWF; https://www.ecmwf.int/) (accessed on 10 March 2025) for the provided meteorological analysis, OGIMET (www.ogimet.com) (accessed on 18 March 2025) for SYNOP data, Centro de Hidrografia da Marinha (CHM). (https://www.marinha.mil.br/chm/dados-do-smm-cartas-sinoticas/cartas-sinoticas) (accessed on 18 March 2025) for synoptic charts, University of Wyoming (https://weather.uwyo.edu/upperair/sounding.html) (accessed on 18 March 2025) for upper-air data, and CPTEC/INPE (https://www.cptec.inpe.br/dsat/) (accessed on 17 March 2025) for the satellite imagery.

Conflicts of Interest

The authors declare no conflicts of interest.

References

  1. Couto, F.T.; Kartsios, S.; Lacroix, M.; Andrade, H.N. A Quick Look at the Atmospheric Circulation Leading to Extreme Weather Phenomena on a Continental Scale. Atmosphere 2024, 15, 1205. [Google Scholar] [CrossRef]
  2. FinalReport. 2024. Available online: https://www.unocha.org/attachments/8dce9c2a-5774-42c3-84d1-f3300c9db7cf/Libya_Flash_Appeal_Final_Report_17%20November%202024.pdf (accessed on 16 March 2025).
  3. Normand, J.C.L.; Heggy, E. Assessing flash flood erosion following storm Daniel in Libya. Nat. Commun. 2024, 15, 6493. [Google Scholar] [CrossRef] [PubMed]
  4. Couto, F.T.; Salgado, R.; Costa, M.J. Analysis of intense rainfall events on Madeira Island during the 2009/2010 winter. Nat. Hazards Earth Syst. Sci. 2012, 12, 2225–2240. [Google Scholar] [CrossRef]
  5. Couto, F.T.; Ducrocq, V.; Salgado, R.; Costa, M.J. Numerical simulations of significant orographic precipitation in Madeira island. Atmos. Res. 2016, 169, 102–112. [Google Scholar] [CrossRef]
  6. Couto, F.T.; Ducrocq, V.; Salgado, R.; Costa, M.J. Understanding significant precipitation in Madeira island using high-resolution numerical simulations of real cases. Q. J. R. Meteorol. Soc. 2017, 143, 251–264. [Google Scholar] [CrossRef]
  7. Report. Available online: https://timorleste.un.org/en/129347-joint-appeal-flood-response-plan-timor-leste (accessed on 22 March 2025).
  8. Faria, M.; Ximenes, M.; de Jesus, O. Assessing Future Flooding Risk in a Coastal Lagoon Using Hydrogeological Approaches and Analysis of the 2021 Flood Event: A Case Study of Tasi-Tolu Lagoon, Dili, Timor-Leste. J. Water Resour. Prot. 2023, 15, 276–298. [Google Scholar] [CrossRef]
  9. Tam, H.C.; He, Y.-H.; Chan, P.W.; Yu, S.; Mo, H.; Su, H.; Hsiao, L.-F.; Gong, Y. Historical rainstorm in Hong Kong on 7–8 September 2023: Diagnosis, forecasting and nowcasting. Atmos. Sci. Lett. 2025, 26, e1284. [Google Scholar] [CrossRef]
  10. Matos-Pupo, F.; Peros, M.C.; González-De Zayas, R.; Valero-Jorge, A.; Pérez-López, O.E.; Álvarez-Taboada, F.; Sorí, R. Coastal Flooding Associated with Hurricane Irma in Central Cuba (Ciego de Ávila Province). Atmosphere 2023, 14, 1445. [Google Scholar] [CrossRef]
  11. Rasmussen, K.L.; Zuluaga, M.D.; Houze, R.A., Jr. Severe convection and lightning in subtropical South America. Geophys. Res. Lett. 2014, 41, 7359–7366. [Google Scholar] [CrossRef]
  12. Zipser, E.J.; Cecil, D.J.; Liu, C.; Nesbitt, S.W.; Yorty, D.P. Where are the most intense thunderstorms on earth? Bull. Am. Meteorol. Soc. 2006, 87, 1057–1072. [Google Scholar] [CrossRef]
  13. DiGangi, E.; Lapierre, J.; Stock, M.; Hoekzema, M.; Cunha, B. Analyzing Lightning Characteristics in Central and Southern South America. Electr. Power Syst. Res. 2022, 213, 108704. [Google Scholar] [CrossRef]
  14. Veloso-Aguila, D.; Rasmussen, K.L.; Maloney, E.D. Tornadoes in Southeast South America: Mesoscale to Planetary-Scale Environments. Mon. Weather Rev. 2024, 152, 295–318. [Google Scholar] [CrossRef]
  15. Cecil, D.J.; Blankenship, C.B. Toward a Global Climatology of Severe Hailstorms as Estimated by Satellite Passive Microwave Imagers. J. Clim. 2012, 25, 687–703. [Google Scholar] [CrossRef]
  16. Elkins, C.M.; Hence, D.A. Radar Survey of Hail-Producing Storms and Environments during the 2018–19 Severe-Weather Season in the Córdoba Region of Argentina. J. Appl. Meteor. Climatol. 2024, 63, 575–593. [Google Scholar] [CrossRef]
  17. Beal, A.; Hallak, R.; Martins, L.D.; Martins, J.A.; Biz, G.; Rudke, A.P.; Tarley, C.R. Climatology of hail in the triple border Paraná, Santa Catarina (Brazil) and Argentina. Atmos. Res. 2020, 234, 104747. [Google Scholar] [CrossRef]
  18. Salio, P.; Nicolini, M.; Zipser, E.J. Mesoscale Convective Systems over Southeastern South America and Their Relationship with the South American Low-Level Jet. Mon. Weather Rev. 2007, 135, 1290–1309. [Google Scholar] [CrossRef]
  19. Yabra, M.S.; Nicolini, M.; Borque, P.; Skabar, Y.G.; Salio, P. Observational study of the South American low-level jet during the SALLJEX. Int. J. Climatol. 2022, 42, 9676–9696. [Google Scholar] [CrossRef]
  20. Jones, C.; Mu, Y.; Carvalho, L.M.V.; Ding, Q. The South America Low-Level Jet: Form, variability and large-scale forcings. npj Clim. Atmos. Sci. 2023, 6, 175. [Google Scholar] [CrossRef]
  21. Sasaki, C.R.S.; Rowe, A.K.; McMurdie, L.A.; Varble, A.C.; Zhang, Z. Influences of the South American Low-Level Jet on the Convective Environment in Central Argentina Using a Convection-Permitting Simulation. Mon. Weather Rev. 2024, 152, 629–648. [Google Scholar] [CrossRef]
  22. Rehbein, A.; Prein, A.F.; Ambrizzi, T.; Ikeda, K.; Liu, C.; Rasmussen, R.M. 20 Years of MCSs simulations over South America using a convection-permitting model. Clim. Dyn. 2025, 63, 38. [Google Scholar] [CrossRef]
  23. Escobar, G.C.J.; Rosa, M.B. Synoptic patterns associated with heavy rainfall events in the metropolitan region of Porto Alegre, Brazil. Meteorol. Atmos. Phys. 2024, 136, 40. [Google Scholar] [CrossRef]
  24. Reboita, M.S.; Mattos, E.V.; Capucin, B.C.; Souza, D.O.D.; Ferreira, G.W.d.S. A Multi-Scale Analysis of the Extreme Precipitation in Southern Brazil in April/May 2024. Atmosphere 2024, 15, 1123. [Google Scholar] [CrossRef]
  25. NASA. Earth Observatory. Available online: https://earthobservatory.nasa.gov/images/152795/floods-engulf-porto-alegre (accessed on 18 March 2025).
  26. OCHA. United Nations. 2024. Available online: https://www.unocha.org/attachments/1a29a4e4-116d-4b66-b3e4-bb7399dd52f2/20240708%20BRAZIL%20Flooding%20Emergency%20-%20Snapshot.pdf (accessed on 16 March 2025).
  27. Lommen, D.; Wang, J.; Su, H.; Zhi, X.; Wang, X.; Park, E.; Zhang, H.; Lee, J.; Wong, M.C. Burst flooding in Singapore: An emerging urban flooding type revealed by high-temporal-resolution observations. Environ. Res. Lett. 2025, 20, 014012. [Google Scholar] [CrossRef]
  28. Shen, Y.; Zhang, B.; Chue, C.Y.; Wang, S. Improving Risk Projection and Mapping of Coastal Flood Hazards Caused by Typhoon-Induced Storm Surges and Extreme Sea Levels. Atmosphere 2023, 14, 52. [Google Scholar] [CrossRef]
  29. Farooq, U.; Taha Bakheit Taha, A.; Tian, F.; Yuan, X.; Ajmal, M.; Ullah, I.; Ahmad, M. Flood Modelling and Risk Analysis of Cinan Feizuo Flood Protection Area, Huaihe River Basin. Atmosphere 2023, 14, 678. [Google Scholar] [CrossRef]
  30. Basu, T.; Mondal, B.K.; Abdelrahman, K.; Fnais, M.S.; Praharaj, S. Assessing Urban Flood Hazard Vulnerability Using Multi-Criteria Decision Making and Geospatial Techniques in Nabadwip Municipality, West Bengal in India. Atmosphere 2023, 14, 669. [Google Scholar] [CrossRef]
  31. Louis, R.; Zech, Y.; Joseph, A.; Gonomy, N.; Soares-Frazao, S. Flood Modeling of the June 2023 Flooding of Léogâne City by the Overflow of the Rouyonne River in Haiti. Water 2024, 16, 2594. [Google Scholar] [CrossRef]
  32. Kang, S.; Lim, C. Detecting Inaccessible Flood Damage in North Korea Using Sentinel-1 Synthetic Aperture Radar Imagery: A Case of Flooding at 2023 Summer. Korean J. Remote Sens. 2025, 41, 173–184. [Google Scholar] [CrossRef]
  33. López, N.; Casado, A.; Revollo, N.V.; Gil, V. Potencial de escorrentía en función del número de curva en una cuenca serrana, Napostá Grande (Argentina): Runoff potential in function of the curve number in a mountain watershed, Napostá Grande (Argentina). Geosciences=Geociências 2023, 42, 402–418. [Google Scholar] [CrossRef]
  34. Galvanin, E.A.; Revollo, N.V.; de la Puente, F.J.B.; Gil, V.; da Silva Neves, S.M.A.; Zapperi, P. Monitoring and Mapping of the Brazilian Pantanal Wetland. In Vegetation Index and Dynamics-Methodologies for Teaching Plant Diversity and Conservation Status; IntechOpen: London, UK, 2023. [Google Scholar] [CrossRef]
  35. Rey, A.; Revollo, N.V.; Frery, A.C.; Delrieux, C. Automatic Delineation of Water Bodies in SAR Images with a Novel Stochastic Distance Approach. Remote Sens. 2022, 14, 5716. [Google Scholar] [CrossRef]
  36. Sarmiento, G.N.R.; Revollo, N.V.; Delrieux, C.A.; Perillo, G.M. Morphological characterization of ponds and tidal courses in coastal wetlands using Google Earth imagery. Estuar. Coast. Shelf Sci. 2020, 246, 107041. [Google Scholar] [CrossRef]
  37. Revollo, N.V.; Sarmiento, G.N.R.; Cisneros, M.A.H.; Delrieux, C.A.; Piccolo, M.C. Assessing the evolution in remotely sensed vegetation index using image processing techniques. Anuário Inst. Geociências–UFRJ 2019, 42, 27–41. [Google Scholar] [CrossRef]
  38. Cisneros, M.A.H.; Sarmiento, N.V.R.; Delrieux, C.A.; Piccolo, M.C.; Perillo, G.M. Beach carrying capacity assessment through image processing tools for coastal management. Ocean Coast. Manag. 2016, 130, 138–147. [Google Scholar] [CrossRef]
  39. Lambrecht, Y.; Picone, N.; Zapperi, P.; Gil, V. Evento de bow-echo y sus efectos sobre la ciudad de Bahía Blanca. Rev. FACENA 2024, 34, 138–157. [Google Scholar] [CrossRef]
  40. Bahía Blanca Large Hail in February 2025. Available online: https://tn.com.ar/sociedad/2025/02/02/una-fuerte-tormenta-de-granizo-y-viento-provoco-danos-calles-inundadas-y-cortes-de-luz-en-bahia-blanca/ (accessed on 21 March 2025).
  41. Sentinel-2, European Space Agency. Sentinel-2 Image, Bahía Blanca, Buenos Aires, Argentina. Copernicus Open Access Hub. 2025. Available online: https://browser.dataspace.copernicus.eu/ (accessed on 20 March 2025).
  42. McFeeters, S.K. The use of the Normalized Difference Water Index (NDWI) in the delineation of open water features. Int. J. Remote Sens. 1996, 17, 1425–1432. [Google Scholar] [CrossRef]
  43. Eidenshink, J.C. The 1990 conterminous U. S. AVHRR data set. Photogramm. Eng. Remote Sens. 1992, 58, 809–881. [Google Scholar]
  44. Marsh, S.E.; Walsh, J.L.; Lee, C.T.; Beck, L.; Hutchinson, C.F. Comparison of multi temporal NOAA-AVHRR and SPOT-XS data for mapping land cover dynamics in the West African Sahel. Int. J. Remote Sens. 1992, 13, 2997–3016. [Google Scholar] [CrossRef]
  45. Lyon, J.G.; Yuan, D.; Lunetta, R.; Elvidge, C. A change detection experiment using vegetation indices. (R825152). Photogramm. Eng. Remote Sens. 1998, 64, 143–150. [Google Scholar]
  46. OGIMET. Available online: www.ogimet.com (accessed on 18 March 2025).
  47. Centro de Hidrografia da Marinha (CHM). Available online: https://www.marinha.mil.br/chm/dados-do-smm-cartas-sinoticas/cartas-sinoticas (accessed on 18 March 2025).
  48. University of Wyoming. Upper-Air Data. Available online: https://weather.uwyo.edu/upperair/sounding.html (accessed on 18 March 2025).
  49. University of Wyoming. Instability Indices. Available online: https://weather.uwyo.edu/upperair/indices.html (accessed on 18 March 2025).
  50. Schmit, T.J.; Griffith, P.; Gunshor, M.M.; Daniels, J.M.; Goodman, S.J.; Lebair, W.J. A Closer Look at the ABI on the GOES-R Series. Bull. Am. Meteor. Soc. 2017, 98, 681–698. [Google Scholar] [CrossRef]
  51. INPE. Available online: https://www.cptec.inpe.br/dsat/ (accessed on 15 March 2025).
  52. Uba, D.M.; Machado, L.A.T.; de Paula Pereira, S.; de Souza, D.R.M.; Negri, R.G.; da Silva Batista, R. DSAT—Aplicação para visualização interativa dos dados recebidos pela estação GOES-R do INPE. In Proceedings of the Anais do XX Simpósio Brasileiro de Sensoriamento Remoto, Florianópolis, Brazil, 2–5 April 2023; Anais eletrônicos. INPE: São José dos Campos, Brazil, 2023. Available online: http://marte2.sid.inpe.br/col/sid.inpe.br/marte2/2023/05.02.23.47/doc/155358.pdf (accessed on 21 April 2025).
  53. ECMWF—MARS User Documentation. Available online: https://confluence.ecmwf.int/display/UDOC/MARS+user+documentation (accessed on 15 March 2025).
  54. ECMWF. Variable Description. Available online: https://codes.ecmwf.int/grib/param-db/ (accessed on 15 March 2025).
  55. Website. Available online: https://aguantebahia.com/ (accessed on 28 March 2025).
  56. Digital Elevation/Terrain Model (DEM). Available online: https://www.earthdata.nasa.gov/topics/land-surface/digital-elevation-terrain-model-dem (accessed on 20 March 2025).
  57. Servicio Meteorológico Nacional. Informe Sobre las Lluvias e Inundaciones en Bahía Blanca y Alrededores (4–8 de Marzo de 2025). 2025. Available online: https://www.smn.gob.ar/sites/default/files/Informe_Bahia%20Blanca_SMN_marzo_2025.pdf (accessed on 21 April 2025).
  58. Instability Indices. Available online: https://www.weather.gov/lmk/indices (accessed on 20 March 2025).
  59. Infobae. Available online: https://www.infobae.com/sociedad/2025/03/10/temporal-en-bahia-blanca-en-vivo-tras-las-consecuencias-de-la-inundacion-como-estara-el-clima-en-la-ciudad-este-lunes/ (accessed on 18 April 2025).
  60. Infobae. Available online: https://www.infobae.com/sociedad/2025/03/08/tragico-temporal-en-bahia-blanca-10-muertos-mas-de-mil-evacuados-y-perdidas-incalculables/ (accessed on 18 April 2025).
  61. Photo. Available online: https://www.mdzol.com/sociedad/2025/3/11/bahia-blanca-que-cubren-los-seguros-de-autos-frente-las-inundaciones-1193921.html (accessed on 30 March 2025).
  62. Shi, X.; Zhang, Y.; Liu, S.; Yang, L.; Yu, L.; Zhang, Y.; Jia, N.; Tian, Z. Mapping Storm Surge Risk at County Level in Coastal Areas of China. J. Mar. Sci. Eng. 2025, 13, 427. [Google Scholar] [CrossRef]
  63. Zapperi, P. Hidrografía Urbana de Bahía Blanca. Ph.D. Thesis, Universidad Nacional del Sur, Bahía Blanca, Argentina, 2012. Repositorio Institucional Digital de la Biblioteca Central “Profesor Nicolás Matijevic” de la Universidad Nacional del Sur. Available online: http://repositoriodigital.uns.edu.ar/handle/123456789/485 (accessed on 21 April 2025).
  64. Lambrecht, Y.; Zapperi, P. Impactos Directos de Eventos Pluviométricos en Áreas Urbanas. El Caso de la Ciudad Intermedia de Bahía Blanca (Provincia de Buenos Aires, República Argentina). Párrafos Geográficos. 2024. Available online: https://www.revistas.unp.edu.ar/index.php/parrafosgeograficos/article/view/1084 (accessed on 29 March 2025).
  65. Mastrandrea, A.; Perez, M.I. Representaciones sociales del riesgo hídrico: Análisis Crítico del Discurso periodístico en la cuenca del arroyo Napostá Grande (Bahía Blanca, Argentina). Rev. Univ. Geogr. 2022, 31, 19–22. [Google Scholar] [CrossRef]
  66. Vera, C.; Baez, J.; Douglas, M.; Emmanuel, C.B.; Marengo, J.; Meitin, J.; Nicolini, M.; Nogues-Paegle, J.; Paegle, J.; Penalba, O. The South American Low-Level Jet Experiment. Bull. Amer. Meteor. Soc. 2006, 87, 63–78. [Google Scholar] [CrossRef]
  67. Santiago, M.M.; Nunes, A.B.; Couto, F.T.; Almeida Bressiani, D.D.; Freitas, R.A.P.D.; Cardoso, I.P. Relationship Between the Water Vapor Transport from the Amazon Basin and the Rainfall Regime over a Watershed on Brazil’s Southern Border. Earth 2025, 6, 13. [Google Scholar] [CrossRef]
  68. Polomčić, D.; Bajić, D.; Ratković, J. Assessment of Historical Flood Risk to the Groundwater Regime: Case Study of the Kolubara Coal Basin, Serbia. Water 2018, 10, 588. [Google Scholar] [CrossRef]
Figure 2. Bahía Blanca District in the Province of Buenos Aires, Argentina. These images were taken from the Sentinel-2 satellite on 1 March 2025 (left), and 11 March 2025 (right), before and after the extreme rainfall event that occurred on 7 March 2025. The presence of water is observed in black, even four days after the event.
Atmosphere 16 00511 g002
Figure 3. The towns of Bahía Blanca, General Daniel Cerri, and Ingeniero White were the most affected by the event. The presence of water is shown in black.
Atmosphere 16 00511 g003
Figure 4. Images of the locality of General Daniel Cerri (top) and Bahía Blanca (bottom). Google Earth images overlaid with NDVI detection (second column) and NDWI (third column).
Atmosphere 16 00511 g004
Figure 5. Water surface detection in a radar image from 10 March 2025 (Sentinel-1; top), and an optical image from 11 March 2025 (Sentinel-2; bottom).
Atmosphere 16 00511 g005
Figure 6. Results of the detected affected areas overlaid on the DEM [56]. Water and high humidity are still noticeable in the urban area four days after the extreme event.
Atmosphere 16 00511 g006
Figure 7. Large-scale environment on 7 March 2025 at 1200 UTC: (a) synoptic chart South America; thermodynamic diagram for (b) Neuquen station, and (c) Santa Rosa aerodrome station.
Atmosphere 16 00511 g007
Figure 8. Cloud system identification: (a) brightness temperature (°C) infrared satellite image at 0600 UTC on 7 March 2025; low-level flow at 0600 UTC on 7 March 2025: (b) horizontal wind at 850 hPa level (m·s−1) and Bahía Blanca (BB) location represented by a red asterisk, and (c) divergence (s−1) at 850 hPa.
Atmosphere 16 00511 g008
Figure 9. Brightness temperature (°C) infrared satellite image hourly sequence (a) 0700 UTC, (b) 0800 UTC, (c) 0900 UTC, (d) 1000 UTC, (e) 1100 UTC, (f) 1200 UTC, (g) 1300 UTC, (h) 1400 UTC, and (i) 1500 UTC on 7 March 2025.
Atmosphere 16 00511 g009
Figure 10. Mesoscale environment on 7 March 2025 at 1200 UTC obtained from the ECMWF Analysis: (a) precipitable water (kg·m−2), (b) specific humidity (kg·kg−1) and wind (speed, m·s−1, and direction) at 850 hPa, and (c) air temperature and wind (speed, m·s−1, and direction) at 925 hPa.
Atmosphere 16 00511 g010
Figure 11. Mesoscale environment on 7 March 2025 at 1200 UTC obtained from the ECMWF Analysis: (a) divergence (s−1) and wind (speed, m·s−1, and direction) at 850 hPa, (b) vertical velocity and wind vectors at 500 hPa, and (c) divergence (s−1) and wind (speed, m·s−1, and direction) at 250 hPa.
Atmosphere 16 00511 g011
Figure 12. Photo (a) during the flooding on 7 March [61], and (b) after the episode on 9 March.
Atmosphere 16 00511 g012
Table 1. SYNOP code reported at Bahia Blanca Aerodrome (Station WMO index: 87750) on 7 March 2025.
HourSYNOP Code
0600 UTC202503070600 AAXX 07064 87750 11765 82508 10220 20205 30002 40098 55008 60001 71392 8197/
333 56779 57961 81950 88360=
1200 UTC202503071200 AAXX 07124 87750 01262 81813 10198 20195 39974 40070 56001 62104 71799 81987
333 10244 20198 56777 57900 62101 88605 81940 87360 88270=
1800 UTC202503071800 AAXX 07184 87750 11762 80511 10200 20194 39986 40083 56027 60801 76096 87027
333 56077 87556 88270=
Disclaimer/Publisher’s Note: The statements, opinions and data contained in all publications are solely those of the individual author(s) and contributor(s) and not of MDPI and/or the editor(s). MDPI and/or the editor(s) disclaim responsibility for any injury to people or property resulting from any ideas, methods, instructions or products referred to in the content.

