Article

Assessing the PM2.5–O3 Correlation and Unraveling Their Drivers in Urban Environment: Insights from the Bohai Bay Region, China

1
State Key Laboratory of Environmental Criteria and Risk Assessment, Chinese Research Academy of Environmental Sciences, Beijing 100012, China
2
Dongying Municipal Ecology and Environment Bureau, Dongying 257000, China
3
Institute of Atmospheric Environment Planning, Chinese Academy of Environmental Planning, Beijing 100041, China
*
Authors to whom correspondence should be addressed.
Atmosphere 2025, 16(5), 512; https://doi.org/10.3390/atmos16050512
Submission received: 27 March 2025 / Revised: 20 April 2025 / Accepted: 24 April 2025 / Published: 28 April 2025
(This article belongs to the Section Air Quality)

Abstract

:
Understanding the correlation between PM2.5 and O3 is critical for complex air pollution control. This study comprehensively analyzed PM2.5 and O3 pollution characteristics, uncovered spatiotemporal variations in their correlation, and investigated the driving mechanisms of their association in Dongying, a typical petrochemical city in China’s Bohai Bay region. Results showed that PM2.5–O3 correlation in Dongying exhibited significant seasonal variations, spatial patterns, and concentration threshold effects from 2017 to 2023. PM2.5 and O3 showed strong positive correlations in summer, negative in winter, and weak positive in spring/autumn, with strongest links in western areas. The strongest positive PM2.5–O3 correlation occurred in summer when PM2.5 ≤ 35 μg·m−3 and O3 >160 μg·m−3, while the strongest negative correlation was exhibited in winter with PM2.5 > 75 μg·m−3 and O3 ≤ 100 μg·m−3. Meteorological conditions (T > 20 °C, RH < 30%, wind speed < 1.73 m/s, Ox > 125 μg·m−3) and non-sea-breeze periods enhanced the PM2.5–O3 positive correlation. During the four typical pollution episodes, the positive PM2.5–O3 correlation in summer was propelled by synchronous increases in O3 and secondary components via shared precursors. In autumn, strong positivity resulted from secondary component–O3 correlations (r > 0.7) and dominance of secondary formation in PM2.5. In winter, the negative correlation stemmed from primary emissions inhibiting photochemistry. Random forest analysis showed that Ox, RH, and T drove positive PM2.5–O3 correlation via photochemistry in summer, whereas winter primary emissions and NO titration caused negative correlation. This study offers guidance for the collaborative PM2.5 and O3 control in the petrochemical cities of the Bay region.

1. Introduction

The issue of combined fine particulate matter (PM2.5) and ozone (O3) complex pollution has garnered significant attention from the government and various regions [1,2,3]. Both PM2.5 and O3 pollution pose serious health risks, with high concentrations of PM2.5 linked to cardiovascular and respiratory diseases, while high O3 levels can cause eye irritation, sore throat, chest tightness, and headaches [4,5]. Globally, the combined exposure to PM2.5 and O3 leads to 37,651 premature deaths, far surpassing the sum of deaths from PM2.5 (18,113) and O3 (3649) exposure alone. PM2.5 and O3 complex pollution exhibits synergistic effects on overall mortality rates and those specifically related to cardiovascular and respiratory systems [6]. Moreover, more than 50% of cities worldwide are affected by the PM2.5 and O3 complex pollution [7]. China, as a pollution hotspot, has most of its cities classified as having “high risk” to “stable” exposure levels [8]. Besides the direct health impacts, PM2.5 and O3 pollution also lead to significant economic burdens [9,10]. According to World Bank data [11], the economic losses due to PM2.5 exposure in 2019 ranged from 1.7% of GDP in North America to 10.3% in South Asia, with a global total of $8.1 trillion. Selin et al. [12] predict that, by 2050, global health-related economic losses due to O3 pollution will reach $580 billion. In addition, an OECD report [13] indicates that Asia is the region most severely affected by the health and economic impacts of air pollution. Xie et al. [14] found that, if China does not mitigate PM2.5 and O3 pollution, GDP losses could range from 0.09% to 2.0% by 2030. In this context, there is an urgent need to advance the coordinated management of PM2.5 and O3 pollution to achieve the goal of controlling complex pollution.
The interaction between PM2.5 and O3 is coupled through three mechanisms [15,16]: (1) Shared precursors (NOx/VOCs) form secondary inorganic aerosols (SIAs) and secondary organic aerosols (SOAs) via gas-particle conversion processes, establishing interdependent relationships with ozone formation; (2) aerosols modulate photochemical radiation flux, thereby influencing photochemical reaction processes and ozone generation; (3) aerosols participate in heterogeneous chemical reactions, providing abundant reaction beds and complicating chemical processes. In atmospheric chemistry, emissions of chemicals are internal factors, while meteorological conditions serve as external factors [17]. The PM2.5–O3 correlation is influenced by two main factors. On the one hand, the interaction between PM2.5 and O3 formation involves PM2.5 scattering and absorbing shortwave radiation, which reduces the amount of radiation reaching the ground, thus enhancing ground-level O3 photochemical formation [18]. Additionally, PM2.5 indirectly affects O3 concentrations by altering cloud microphysical processes (e.g., cloud optical thickness, effective cloud droplet radius) [19], while heterogeneous chemical reactions occurring on its surface also influence O3 and secondary particle concentrations. Meanwhile, O3, being a strong oxidant, drives the gas-to-particle conversion of atmospheric precursors, like SO2, NOx, and VOCs, thereby accelerating new particle formation [20]. On the other hand, meteorological factors, such as temperature, precipitation, humidity, wind, cloud cover, and atmospheric stability, influence the concentrations of PM2.5 and O3 through photochemical and physical processes, thereby affecting their correlation [21,22]. Therefore, it is essential to clarify the interactions and correlations between PM2.5 and O3 to provide scientific support for the development of effective joint control strategies for both pollutants.
Current research on the PM2.5–O3 correlation primarily focuses on countries such as China, the United States, South Korea, and those in Southeast Asia, revealing significant regional variability in their spatiotemporal correlation. For example, the PM2.5–O3 correlation was predominantly negative in Los Angeles, USA during the COVID-19 pandemic [23]. In summer, strong positive correlations (r > 0.6) between PM2.5 and O3 were observed in Bangalore (India) and Seoul (Republic of Korea), with negative correlations observed in winter [24]. In China, PM2.5 and O3 generally exhibit a positive correlation in summer and a negative correlation in winter [25,26], with South China showing an overall positive correlation and North China showing an overall negative correlation [27]. Research has also explored the mechanisms influencing the PM2.5–O3 correlation. From a chemical perspective, Hong et al. [22] and Zhu et al. [28] analyzed PM2.5 secondary components and found that the positive correlation in summer is attributed to the synergistic production of O3 and secondary inorganic components in PM2.5 (primarily sulfate, nitrate, and ammonium, collectively referred to as “SNA”) driven by atmospheric photochemical reactions. In contrast, the wintertime negative correlation arises from high emissions and stagnant meteorological conditions promoting heterogeneous formation of SNA and secondary organic carbon (SOC), while the NO titration effect significantly suppresses O3 concentrations. On a spatiotemporal scale, Chen et al. [29] revealed that the PM2.5–O3 correlation shows diurnal and regional variations—lower in the morning and higher in the afternoon, with predominantly positive relationships in southern and coastal regions and negative relationships in northern and inland regions. Changes in PM2.5 and O3 concentrations also affect the PM2.5–O3 correlation. Wang et al. [30] and Qiu et al. [26] found that, in developed regions, PM2.5 and O3 exhibit positive correlations when PM2.5 concentrations are below 50 μg·m−3, conversely turning negative above this threshold. Additionally, local circulation patterns (such as sea-breeze winds) may modulate the synergistic effects between PM2.5 and O3 through their transport-accumulation impacts on pollutants, but relevant research remains scarce. The relationship between PM2.5 and O3 varies significantly across research fields, time scales, and methodologies, leading to differing conclusions under the influence of complex topography, meteorological conditions, and pollutant emissions. Overall, the current research on the underlying causes of the PM2.5–O3 correlation remains insufficiently comprehensive [31,32,33].
In 2017, the national ozone non-compliance rate increased significantly, and the peak concentration rose remarkably, making this period a crucial juncture for ozone pollution research [34]. In the same year, with the implementation of China’s Air Pollution Prevention and Control Action Plan, urban PM2.5 levels have significantly dropped, yet O3 pollution has emerged as a new challenge, becoming a key factor affecting air quality [35]. Bay areas become global oil and gas-rich regions due to geological features, ancient marine deposits, and thermal conditions [36,37], with petrochemical cities boosting regional economies but causing air pollution and climate crises [38]. Dongying, located in Shandong Province, China, is situated in the southwest of the Bohai Bay and faces the Bohai Sea to the east. It is one of the typical coastal cities around the Bohai Bay. Its role as a major oil base in China—characterized by Shengli Oilfield resource development and a road-dominated transportation structure—has created high-intensity NOx and VOCs emission sources [39,40], making it prone to PM2.5 and O3 complex pollution [41]. In Dongying, the SNA and SOA account for 31.64% to 48.30% of PM2.5 [42], indicating that secondary pollution plays a critical role in regional air quality. Given the atmospheric complex pollution caused by the mutual influence between PM2.5 and O3 in Dongying in recent years, it is highly imperative to conduct a study on the correlation and underlying mechanisms between PM2.5 and O3 in this typical petrochemical city during the period from 2017 to 2023. This research is crucial for the synergistic control of both pollutants.
This study investigates Dongying, a representative petrochemical city in the Bohai Bay region of China. Using environmental air quality monitoring data and meteorological information from 2017 to 2023, the study analyzes the pollution characteristics of PM2.5 and O3 in Dongying, as well as the spatiotemporal variations in their correlation. The research also explores the impact of meteorological conditions, sea–land breeze, atmospheric oxidizing capacity, PM2.5 and O3 concentration levels, PM2.5 chemical components, and precursor substances on the PM2.5–O3 correlation. The findings of this study provide important guidance for the targeted implementation of collaborative control measures for PM2.5 and O3 in petrochemical cities of the Bay region.

2. Materials and Methods

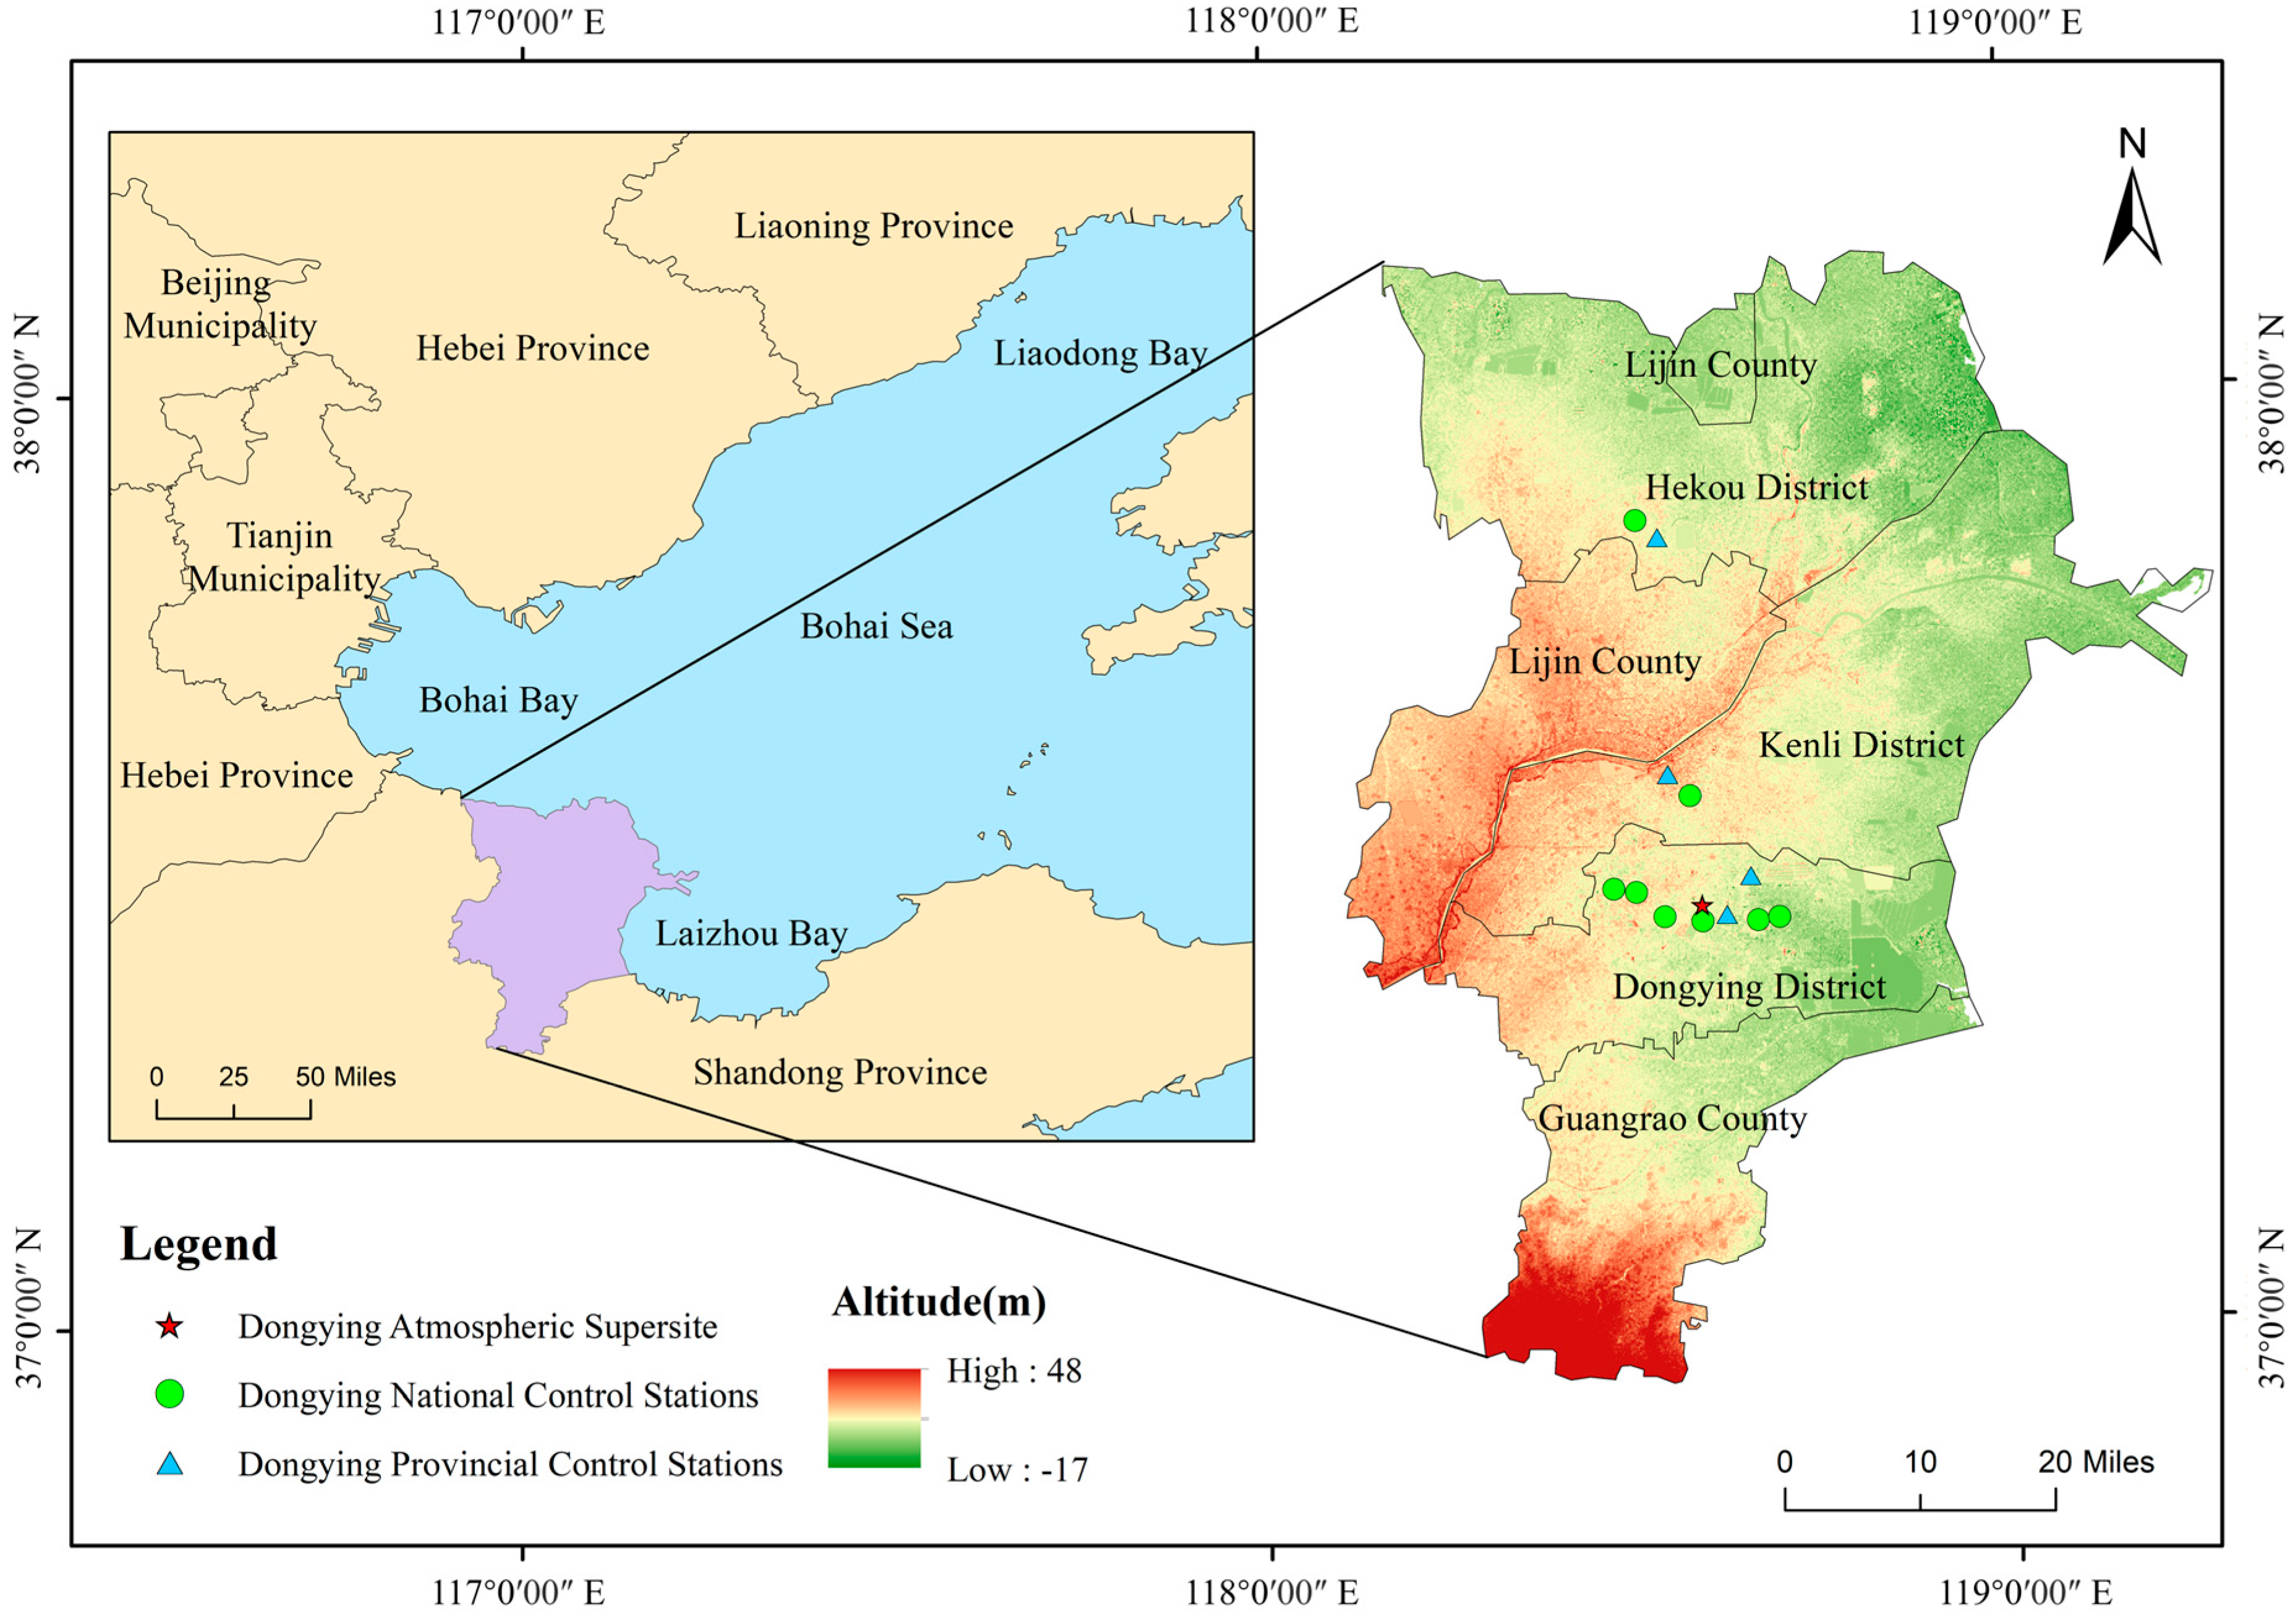
2.1. Research Region

Dongying, located in northern Shandong Province, China, borders the Bohai Sea to the east and serves as a key outlet for the Yellow River Basin. Its developed petrochemical industry results in substantial VOCs and NOx emissions, making the city prone to atmospheric complex pollution under unfavorable meteorological dispersion conditions [43]. Between 2017 and 2023, eight national ambient air quality monitoring stations were established in Dongying (Figure 1), including four in Dongying District: Shengli Station (operational since January 2020, replacing the Xicheng Yangguang Huanbao site), Ideal City Station (operational since November 2020, replacing Gengjingcun Station), Xicheng Yangguang Huanbao Company Station (ceased operation in April 2021), and Gengjingcun Station (ceased operation in November 2020). One station was located in Hekou District (Hekou Urban Station), one in Kenli District (Minfeng Road Station), and two in the Dongying Economic and Technological Development Zone (Dongying Municipal Environmental Protection Bureau Station and Development Zone Management Committee Station). The abbreviations for these stations can be found in Table S1.

2.2. Data Sources

2.2.1. Criteria Air Pollutants

The data for conventional air pollutants used in this study were the data from the national control stations in Dongying from January 2017 to December 2023. These data included the hourly, daily, monthly and annual average values of conventional pollutants such as PM2.5, PM10, SO2, CO, NO, NO2 and NOx, the monthly and annual evaluation values of PM2.5, the hourly average value of O3, the maximum daily 8-h average O3 concentration (MDA8 O3), as well as the monthly and annual evaluation values for O3. The data were sourced from the Shandong Provincial Environmental Air Quality Data Monitoring and Management System “http://123.232.114.95:8001/ (accessed on 19 July 2024)”.

2.2.2. Super Station Observation Programs

The data used in this study were obtained from the Dongying Atmospheric Super Observation Station (hereafter referred to as “Super Station”, located at 118.59° E, 37.45° N). The hourly PM2.5 component data and Organic Carbon/Elemental Carbon (OC/EC) data from August 2021 to July 2022, and hourly online data for VOCs and meteorological parameters (including temperature, relative humidity, atmospheric pressure, wind speed, and wind direction) were collected from May 2021 to December 2023. Details of the Super Station observation programs and associated instrumentation in Dongying are summarized in Table S2. A five-parameter compact meteorological station was employed for real-time online monitoring of wind speed, wind direction, atmospheric pressure, temperature, and humidity (Table S3).

2.2.3. Cloud Data

Hourly total cloud cover (TCC) data were acquired from ERA-5 reanalysis datasets provided by the European Centre for Medium-Range Weather Forecasts (https://cds.climate.copernicus.eu/datasets/reanalysis-era5-single-levels?tab=overview, accessed on 19 July 2024) for the period from 2021 to 2022. Grid data at 118.6° E, 37.43° N (0.25° × 0.25° spatial resolution) were extracted for analysis.

2.2.4. Quality Control and Quality Assurance

Quality Control of Monitoring Instruments

Online monitoring of criteria air pollutants strictly complied with the Technical Specifications for Continuous Automated Monitoring Systems of Ambient Air Gaseous Pollutants (SO2, NO2, O3, CO) Operation and Quality Control (HJ 818-2018) [44]. OC/EC analysis followed the thermal–optical transmission methodology outlined in QX/T 70-2007 [45] standards for atmospheric aerosol characterization. Inorganic ion analysis demonstrated excellent reproducibility (RSD 2%, n ≥ 7) and high internal standard recovery rates (>99%), ensuring precise quantification of ionic components in PM2.5. VOC measurements were validated through multi-concentration standard gas calibrations (R2 ≥ 0.9), routine internal verifications (deviation 10%), and daily retention time window adjustments. Quality assurance for all instrumentation is detailed in Table S2.

Data Quality Control

The data collection frequency, timing, quality assurance, and quality control for all monitoring projects adhere to the standards outlined in the following guidelines: Automatic Methods for Ambient Air Quality Monitoring (HJ/T193-2005) [46], Specifications and Test Procedures for Ambient Air Quality Continuous Monitoring System with Gas Chromatography for Volatile Organic Compounds (HJ 1010-2018) [47], Technical Specifications for Continuous Automated Monitoring of Organic carbon and Elemental Carbon in Ambient Air Particulate Matter (PM2.5) (HJ 1327-2023) [48], Technical Specifications for Continuous Automated Monitoring of Water-Soluble Ions in Ambient Air Particulate Matter (PM2.5) (HJ 1328-2023) [49], and Technical Specifications for Continuous Automated Monitoring of Inorganic Elements in Ambient Air Particulate Matter (PM2.5) (HJ 1329-2023) [50].
To ensure the reliability of the research data, this study conducted quality control on the dataset and removed missing values and outliers in line with the Ambient Air Quality Standards (GB 3095-2012) [51], Technical Specification for Ambient Air Quality Evaluation (on trial) (HJ 663-2013) [52], and Technical Regulation for Air Quality Index (AQI) (on trial) (HJ 663-2012) [53].

2.3. Data Processing

2.3.1. Identification of Primary Pollutants and Statistical Analysis of Polluted Days

In accordance with the Technical Regulation on Ambient Air Quality Index (on trial) (HJ 633-2012) [53], when the AQI exceeds 50, the primary air pollutant is defined as the one with the highest Individual Air Quality Index (IAQI). Meanwhile, the Technical Specification for Ambient Air Quality Evaluation (on trial) (HJ 663-2013) [52] defines various pollution types, such as PM2.5-P (Standalone PM2.5 pollution), O3-P (Standalone O3 pollution), and PM2.5+O3-P (PM2.5+O3 complex pollution). A detailed description of polluted days can be found in Text S1, and the statistical results are presented in Table S4. Based on the variations in O3 and PM2.5 pollution in Dongying, this study selects different pollution episodes for case analysis across all four seasons. The selection criteria for pollution episodes are outlined in Text S1, and the results are shown in Table S5.

2.3.2. Correlation Analysis

Ambient air quality data from eight monitoring stations in Dongying spanning 2017–2023 were analyzed to compute Pearson correlation coefficients (r) between PM2.5 and O3 concentrations using Excel 2019. Among them, the annual, monthly, and seasonal correlations between PM2.5 and O3 were calculated based on the daily mean concentration of PM2.5 and the daily maximum 8-h sliding average values of O3, while the daily correlation was calculated based on the hourly average values of PM2.5 and O3. Considering the seasonal characteristics of pollutants, the data from each station were divided by season (spring: March–May; summer: June–August; autumn: September–November; winter: December–February of the following year).

2.3.3. Quantification of Primary and Secondary PM2.5

The maximum daily concentration of 8-h moving average O3 [MDA8] is used as the indicator for photochemical activity levels [54]. Based on this, atmospheric photochemical activity is categorized into four levels: low photochemical activity level ([MDA8] ≤ 100 μg·m−3), mild photochemical activity level (100 μg·m−3 < [MDA8] ≤ 160 μg·m−3), moderate photochemical activity level (160 μg·m−3 < [MDA8] ≤ 200 μg·m−3), and high photochemical activity level ([MDA8] > 200 μg·m−3). This study excludes data from dust storm events in Dongying and estimates secondary PM2.5 in PM2.5 concentrations based on photochemical activity levels. The equation is as follows:
  PM 2 . 5 pri , I , t = CO I , t   ×   PM 2 . 5 / CO pri , L   ,
PM 2 . 5 sec , I , t = PM 2 . 5 obs , I , t     PM 2 . 5 pri , I , t ,
where [PM2.5]pri represents the primary PM2.5 concentration (μg·m−3), [PM2.5]sec refers to the secondary pollutant concentration (μg·m−3), and [PM2.5]obs is the observed PM2.5 concentration (μg·m−3). ‘t’ represents the observation day (d), while the subscript L denotes low photochemical activity level, and the subscript I corresponds to low, moderate, or high photochemical activity levels (I = 1, 2, 3). For detailed calculation methods, please refer to the study by Li et al. [54].

2.3.4. Quantification of Organic Aerosol Mass Concentration

In urban areas, OC may primarily originate from SOC. To investigate the secondary transformation process of organic matter, this study further analyzed the OC/EC ratio, which is commonly used to identify the presence of secondary organic pollution. A threshold of OC/EC > 2.0 is generally accepted as an indicator of SOC formation [55]. SOC concentration was calculated using the empirical formula
  SOC = OC tot EC × OC / EC min  
where OCtot represents total organic carbon, and (OC/EC)min denotes the minimum OC/EC ratio observed over 24 h each day during the study period.

2.3.5. Objective Synoptic Classification

This study selected synoptic models most representative of pollution formation and dissipation in China’s central and eastern regions based on relevant literature [56]. To minimize the influence of local mesoscale systems, the analysis focused on synoptic-scale systems characteristics, with the surface synoptic system analyzed using the average fields from four times (02:00, 08:00, 14:00, and 20:00 local standard time).

2.3.6. Sea–Land Breeze Identification Criteria

Based on existing studies on the classification of land–sea winds [57,58,59] and the natural geographic features, such as the coastline of Dongying City, we propose the following criteria for identifying land–sea breezes in the region: winds from the SSE to NW direction (157.5° to 315°) are defined as land breezes, while winds from the NNW to SE direction (0° to 135° and 337.5° to 360°) are defined as sea breezes, as shown in Figure 1. A natural day was classified as a sea–land breeze day if three criteria were met: ① 24-h average surface wind speed < 10 m/s; ② during land breeze hours (01:00–08:00), land breeze occurrence duration ≥ 4 h and sea breeze occurrence duration ≤ 2 h; ③ during sea breeze hours (13:00–20:00), sea breeze occurrence duration ≥ 4 h and land breeze occurrence duration ≤ 2 h.
This study selected land–sea breeze days from 2022 to 2023 in Dongying. The correlations between the concentrations of PM2.5 and O3 during the sea–land breeze periods and non-sea–land breeze periods were comparatively analyzed, and the seasonal, diurnal and nocturnal impacts of the sea–land breeze on the correlation between PM2.5 and O3 were explored.

2.3.7. Random Forest

To further investigate how meteorological factors (temperature, relative humidity, atmospheric pressure, wind speed, and wind direction) and gaseous pollutants affect PM2.5 and O3 concentration variations (given our prior focus on seasonal trends), this study employs Breiman’s [60] random forest model to quantify the importance of contributing factors [61,62,63] (model details in Text S1). By integrating model predictions with analytical findings, this study evaluates the influence of these factors on the PM2.5–O3 correlation. The random forest model was developed and run using Python (Version 3.6.3) for this analysis.

3. Results

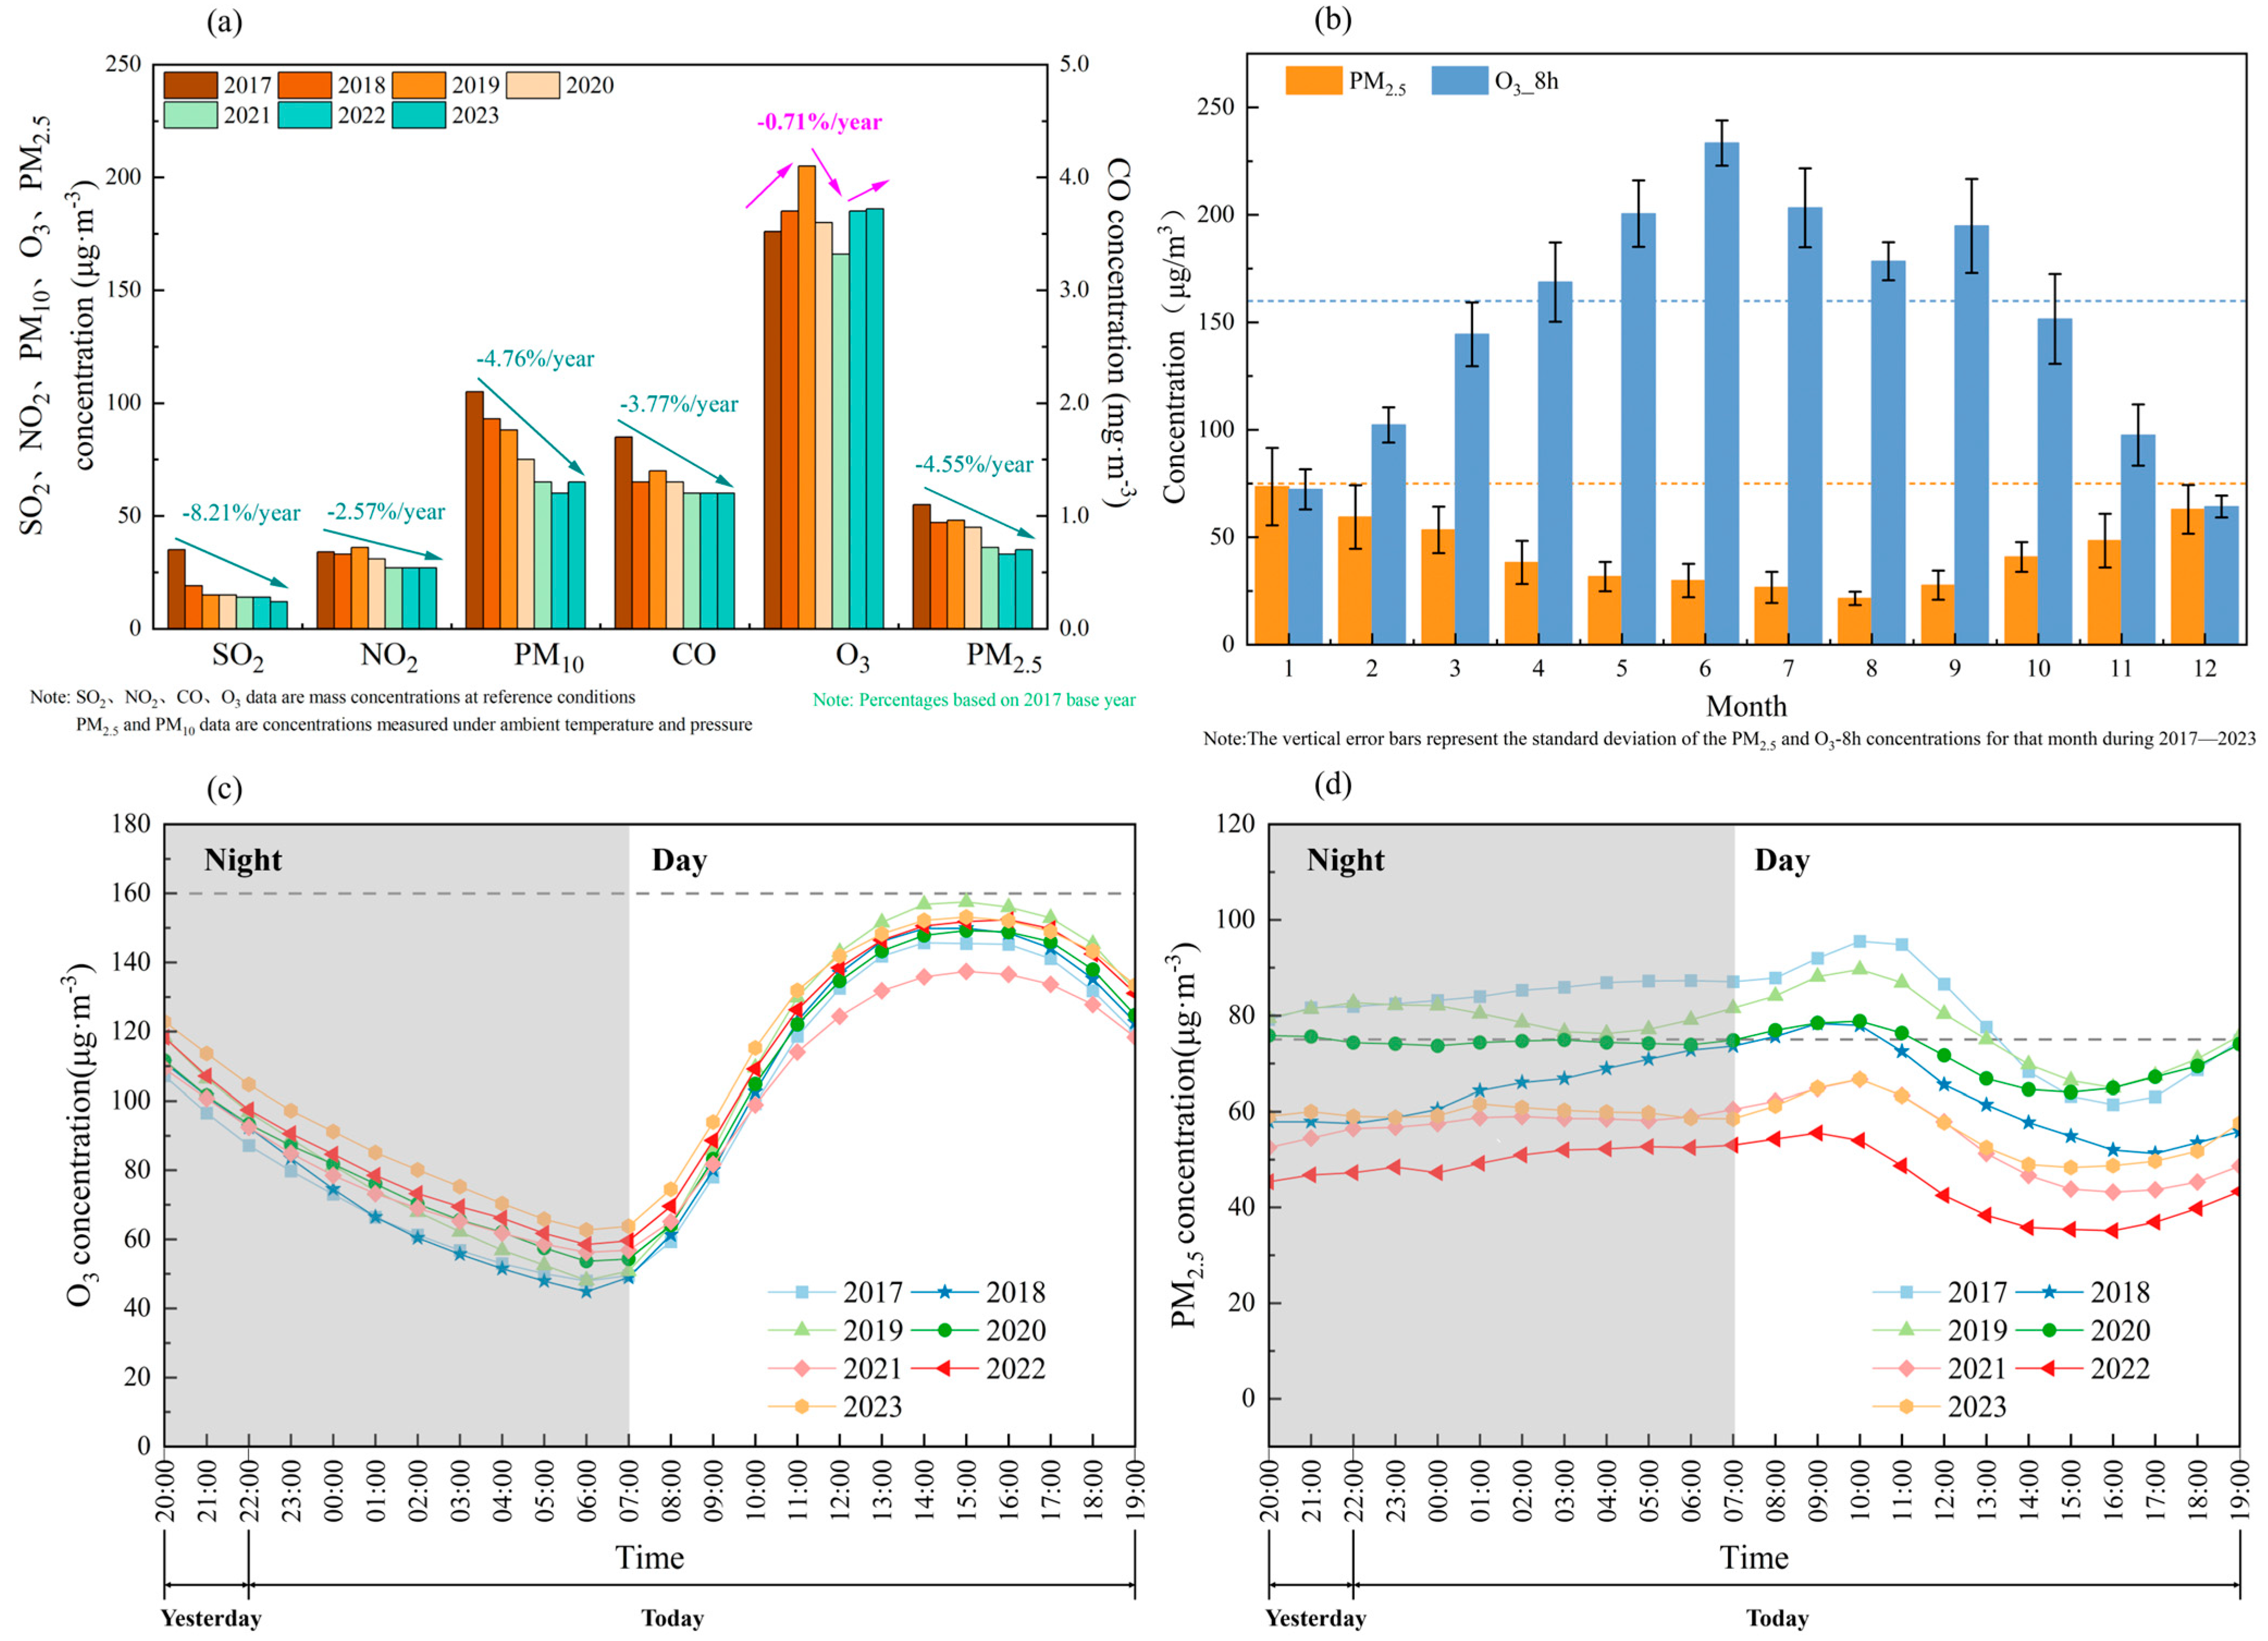
3.1. Variation Patterns in PM2.5 and O3 Concentration Levels

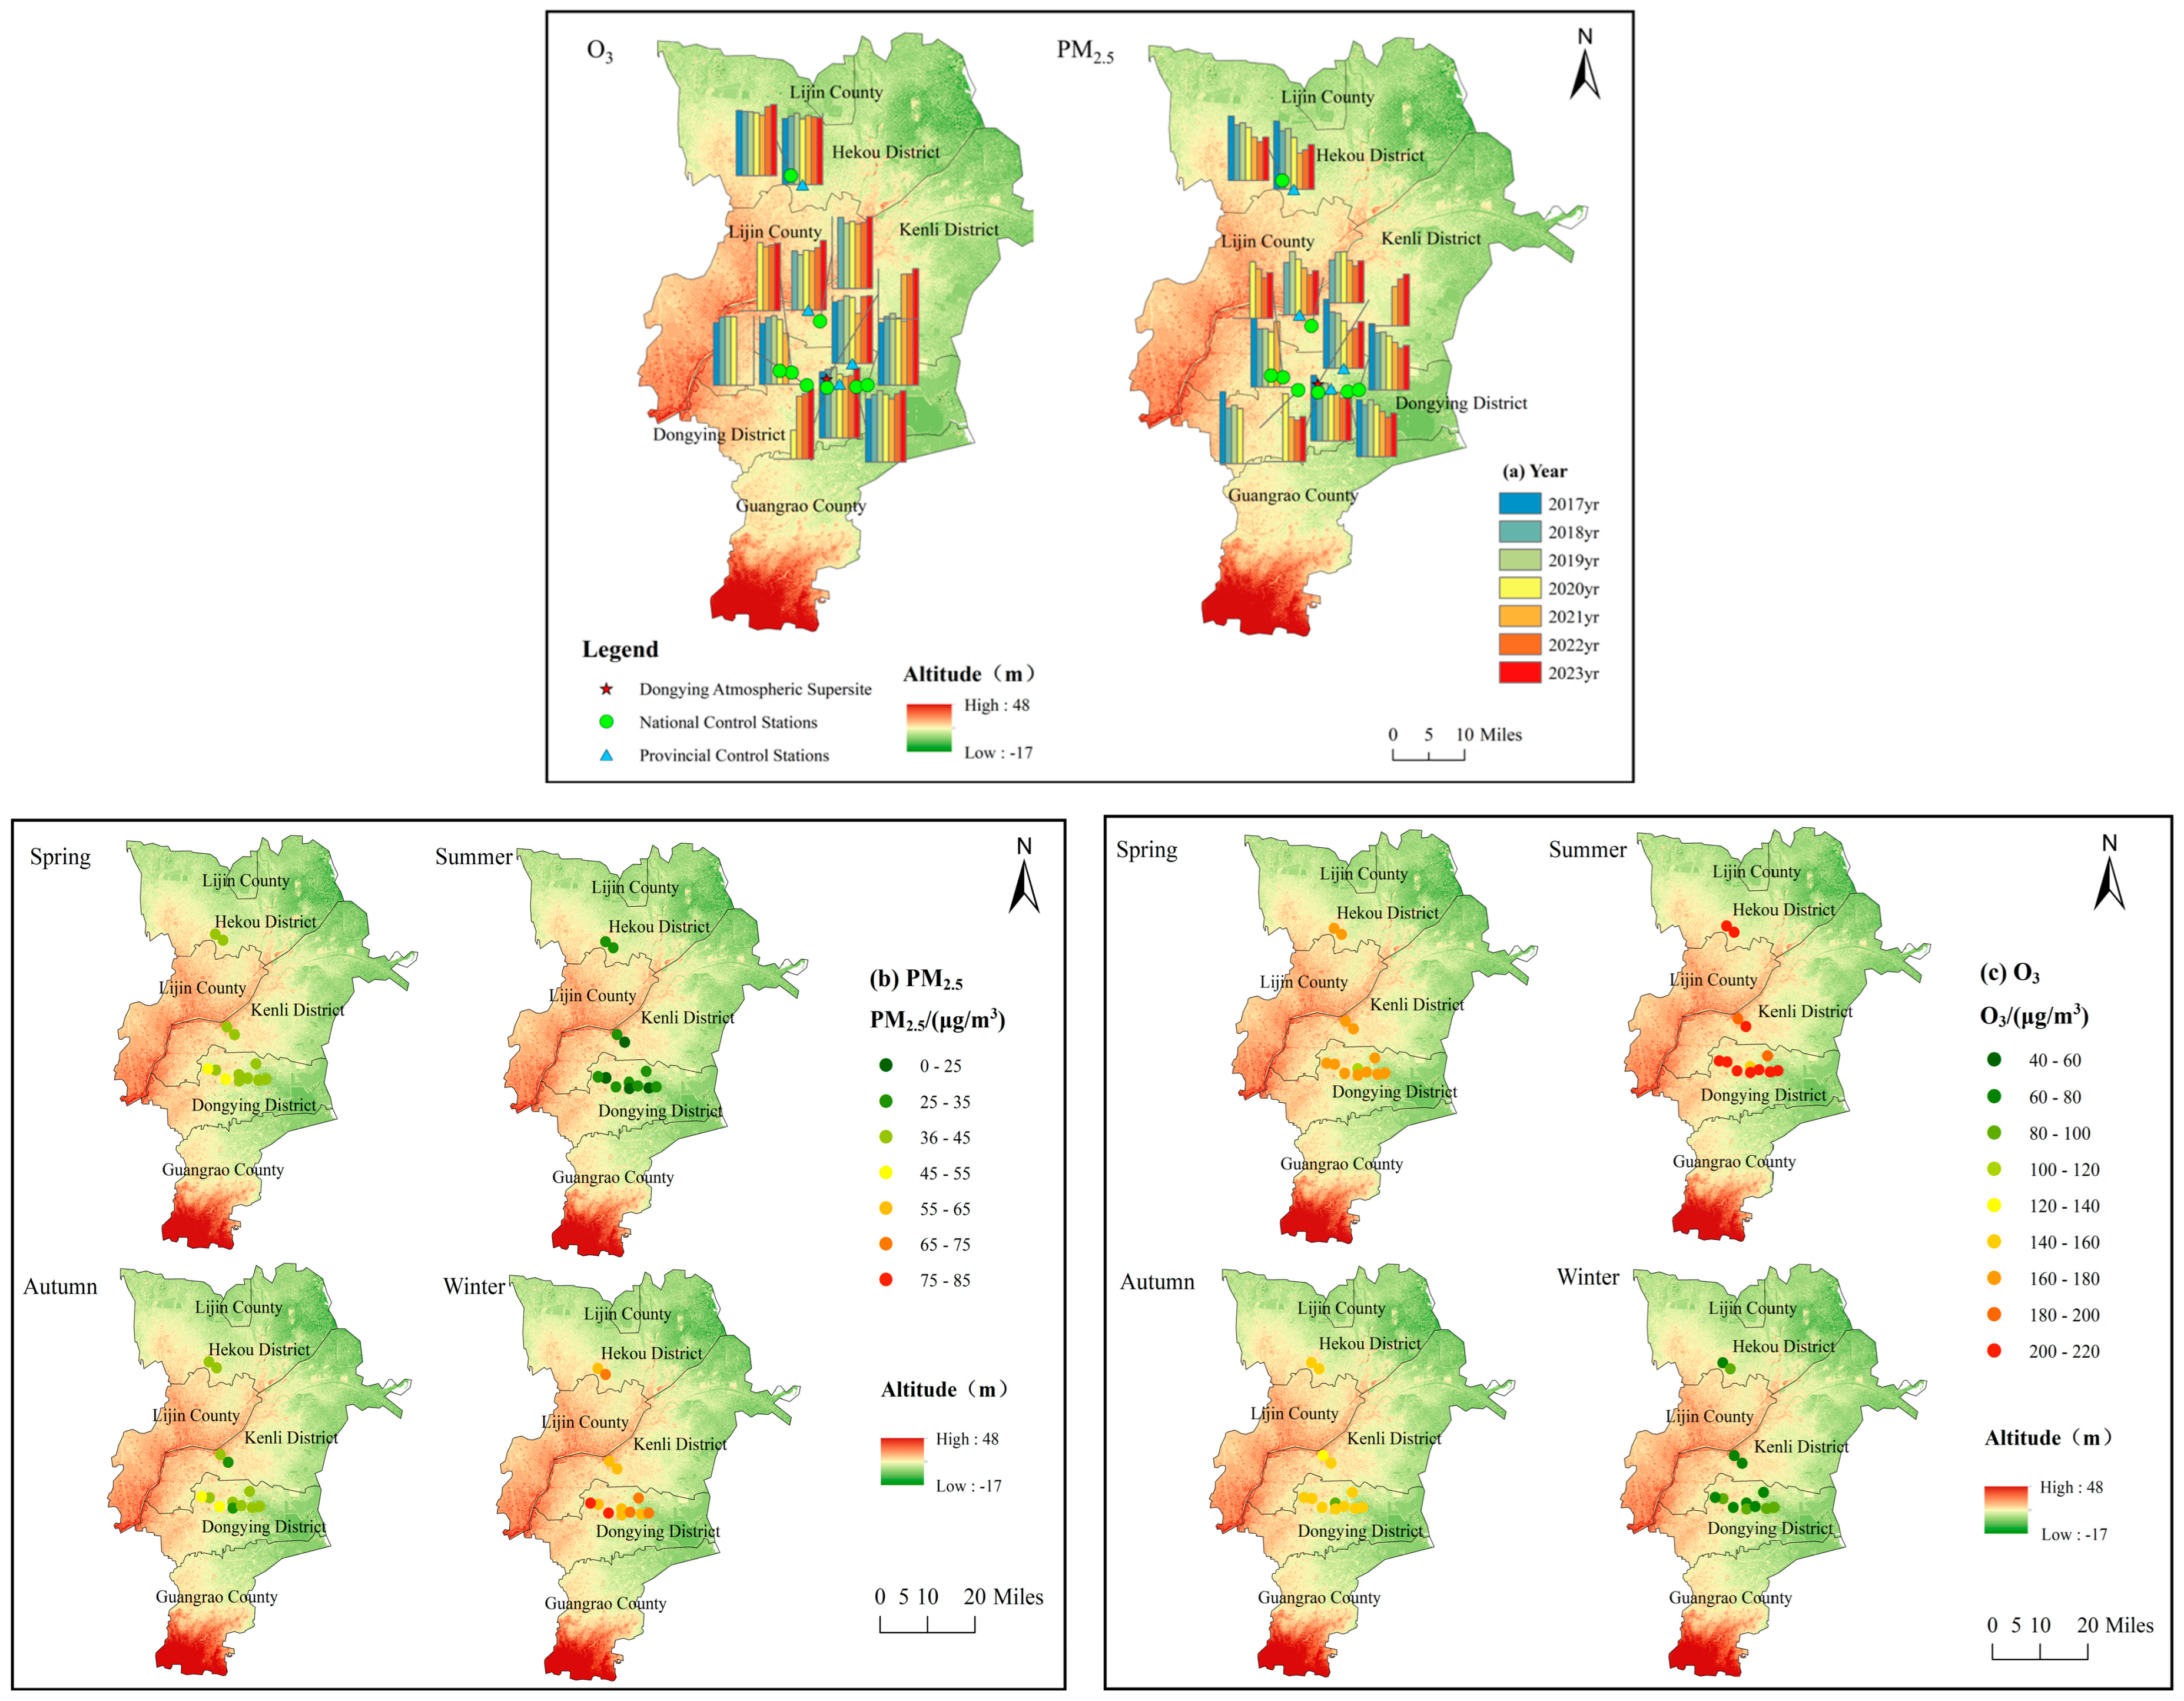
3.1.1. Spatiotemporal Distribution Characteristics of PM2.5 and O3

From 2017 to 2023, concentrations of SO2, NO2, PM10, CO, and PM2.5 in Dongying showed significant declines, leading to overall air quality improvement, whereas O3 pollution intensified (Figure 2a). Specifically, the annual evaluation value of PM2.5 decreased by 36%, from 55 μg·m−3 to 35 μg·m−3, while the 90th percentile of MDA8 O3 increased from 176 μg·m−3 to 186 μg·m−3. The monthly evaluation value of PM2.5 and O3 displayed opposite trends (Figure 2b), with PM2.5 concentrations peaking in winter and reaching a maximum of 74 μg·m−3 in January, while O3 concentrations were highest in summer and lowest in winter. During the PM2.5 pollution season (from December to February), daily concentrations showed a declining trend, with daytime and nighttime levels in 2023 decreasing by 23 μg·m−3 and 24 μg·m−3, respectively, compared to 2017. Meanwhile, the O3 pollution season (from April to September) showed an increasing trend in daily concentrations, with daytime concentrations rising by 11 μg·m−3 and nighttime levels increasing even more significantly by 17 μg·m−3.
In terms of spatial distribution, PM2.5 concentrations in Dongying from 2017 to 2023 generally followed a “high in the south and east, low in the north and west” pattern, with an overall decreasing trend (an average reduction of 23.5%). Notably, PM2.5 concentrations were higher in the western part of the city (ranging from 55 to 76 μg·m−3) and lower in the central and eastern regions in winter. The overall spatial distribution of O3 concentrations was characterized by higher levels in the northern, central, and eastern regions and lower levels in the western region, while also showed a consistent annual increase (Figure 3).

3.1.2. Pollution Regime Characterization of PM2.5 and O3

From 2017 to 2023, primary air pollutants in Dongying included O3, PM2.5, PM10, and NO2, with no occurrences of SO2 or CO as primary pollutants (Figure S1). The annual total days with PM2.5 and PM10 as primary pollutants decreased, NO2 increased initially before declining, while O3 showed a year-by-year upward trend.
From 2017 to 2023, PM2.5 pollution days (PM2.5-P) in Dongying decreased from 73 to 34 days, with mild pollution accounting for 60.8% of PM2.5-P, while moderate, severe, and extreme pollution represented 24.4%, 14.5%, and 0.3%, respectively (Figure S2). PM2.5-P occurred primarily during spring, autumn, and winter, with January and December in winter being the most dominant months (Figure S2). Typical winter PM2.5 pollution episodes were triggered by elevated precursor concentrations coupled with stagnant meteorological conditions. Analysis of two pollution phases revealed concurrent increases in PM2.5 and O3 concentrations (detailed in Text S2). In contrast, O3 pollution days (O3-P) increased from 52 to 91 days, with 80.6% mild, 18.5% moderate, and 0.9% severe pollution events (Figure S2). O3-P occurred in spring, summer, and autumn, with June in summer showing the highest frequency (21 days) (Figure S2). Typical summer O3 pollution episodes formed under elevated temperatures, poor dispersion, and high precursor concentrations. Two pollution phases revealed divergent PM2.5 and O3 trends, with atmospheric oxidizing capacity enhancing PM2.5 formation and meteorological conditions synergistically exacerbating pollution (Text S3).

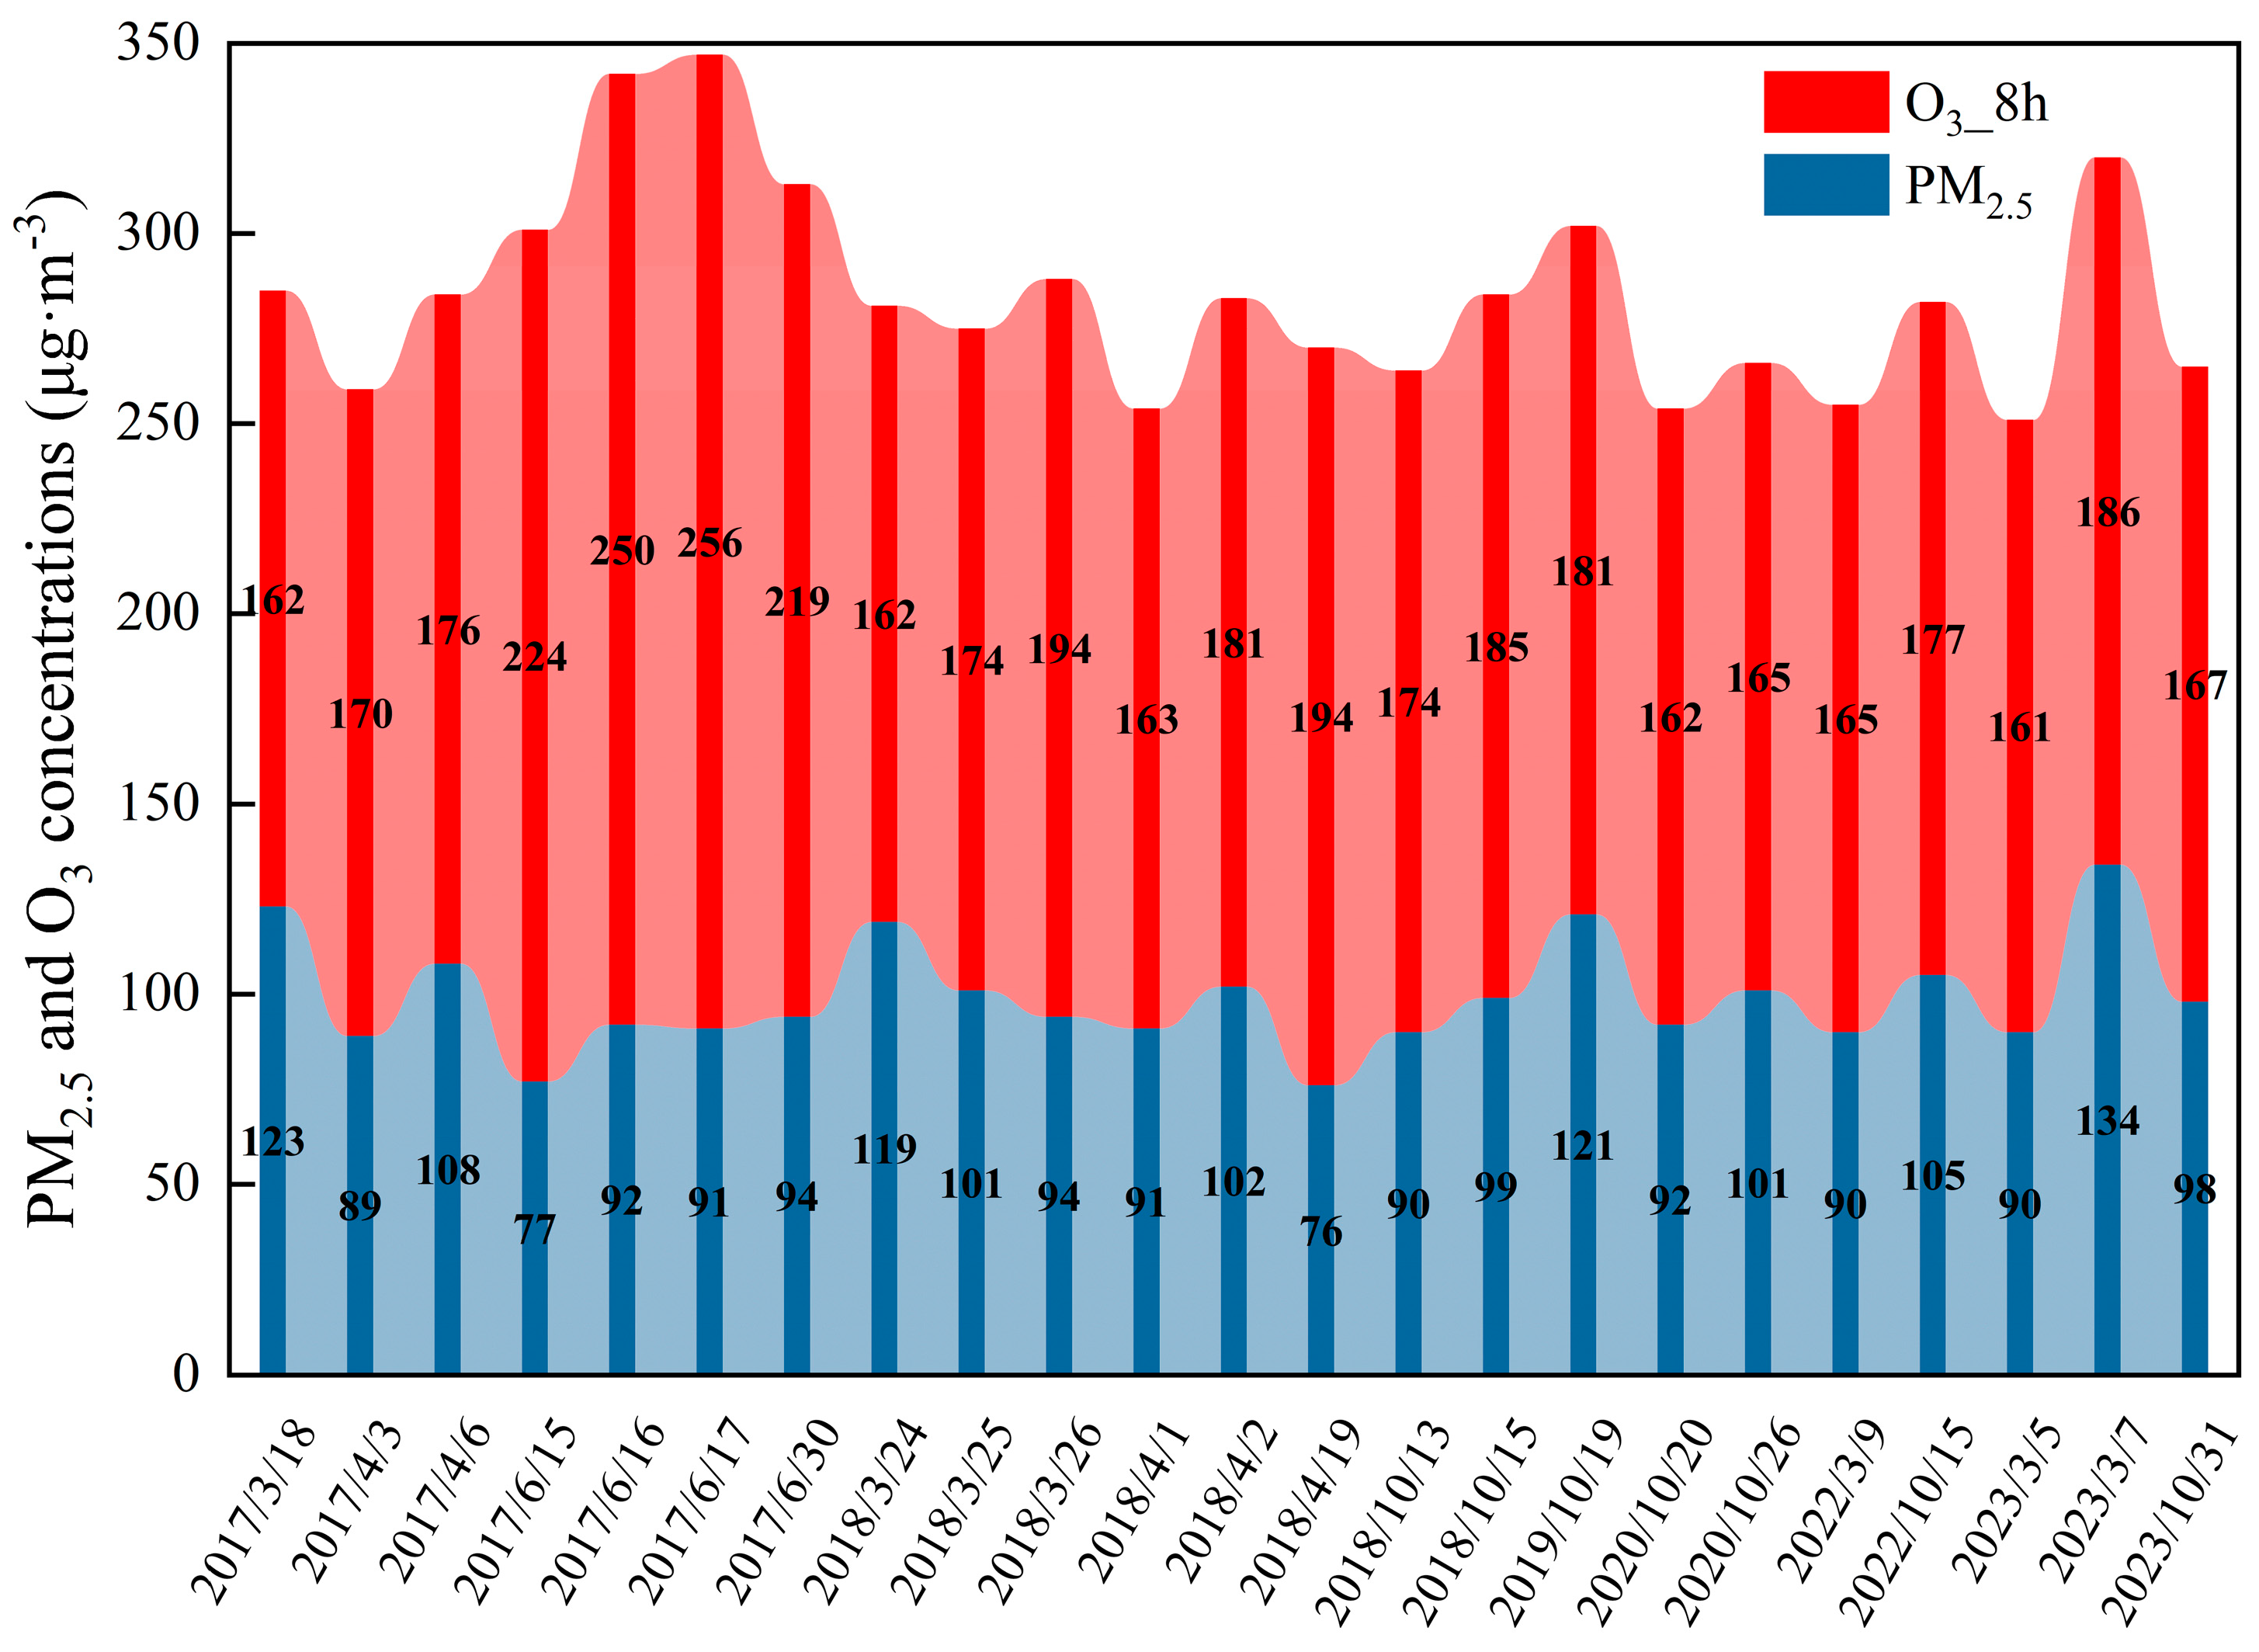
3.1.3. Complex Pollution Characterization of PM2.5 and O3

Between 2017 and 2023, the complex pollution days of PM2.5 and O3 (PM2.5+O3-P) in Dongying primarily occurred in March to April during spring and October in autumn, accounting for over 70% of the total. High-concentration O3-type PM2.5+O3-P events were occasionally observed in June during the summer (Figure S2). The number of PM2.5+O3-P days peaked in 2018, gradually decreased, and began to rise again starting in 2022. The concentration range of PM2.5 in PM2.5+O3-P events was between 76 and 134 μg·m−3 (higher in spring than autumn), while O3 concentrations ranged from 161–256 μg·m−3. Four days of PM2.5+O3-P events occurred in the summer of 2017, indicating that the increase in O3 concentrations during this period facilitated the formation of PM2.5 (Figure 4). Typical PM2.5 and O3 complex pollution events in spring and autumn were triggered by an increase in precursor concentrations combined with stable meteorological conditions. During spring pollution events, the atmospheric oxidative capacity significantly promoted PM2.5 formation. In autumn, the trends in PM2.5 and O3 concentration changes were similar (see detailed explanation in Text S4).

3.2. Spatiotemporal Analysis of PM2.5 and O3 Correlation Characteristics

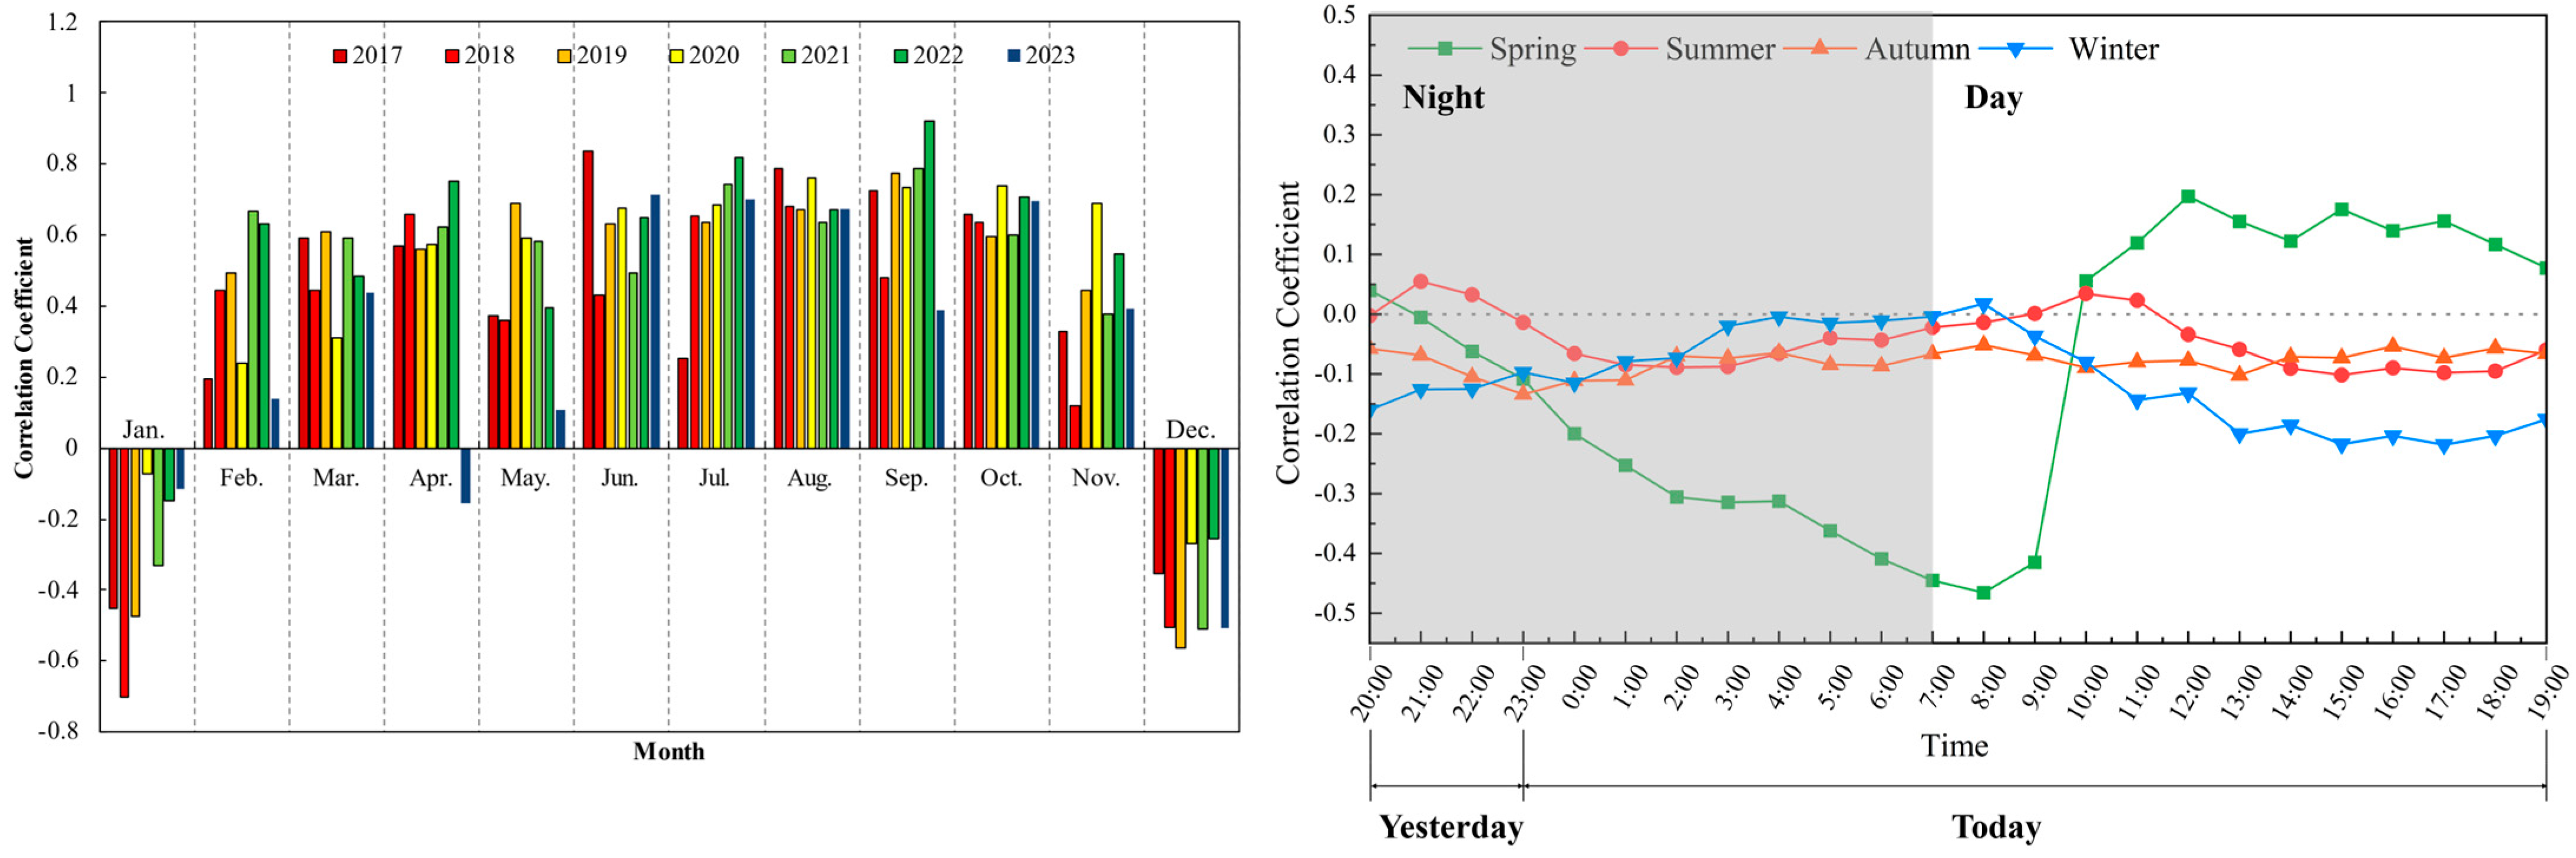
3.2.1. Temporal Variation in PM2.5 and O3 Correlation

Dongying exhibited significant seasonal variations in PM2.5–O3 correlation from 2017 to 2023 (Figure 5 and Figure 6). Among these, summer showed the strongest positive correlation (r = 0.60), winter a negative correlation (r = −0.19), and spring/autumn weak positive correlations (r = 0.18 and 0.13, respectively). Notably, PM2.5 and O3 reached their highest correlation in September 2022 (r = 0.92). The PM2.5–O3 correlation variability was greater during the daytime than the nighttime. Notably, spring exhibited significant daytime positive correlations, while summer showed positive associations during 9:00–11:00. Nighttime PM2.5 and O3 were positively correlated only in summer (20:00–23:00), with negative correlations observed in other seasons.
Figure 6 revealed significant positive correlations between PM2.5 and O3 in spring and autumn at PM2.5 < 50 μg·m−3, whereas at PM2.5 > 60 μg·m−3, MDA8 O3 concentrations decreased with increasing PM2.5 levels. Notably, winter exhibited negative correlations across all PM2.5. concentrations, where O3 concentrations declined as PM2.5 increased. Although summer showed overall synchronous increases in PM2.5 and O3, the rate of O3 growth significantly slowed when PM2.5 exceeded 60 μg·m−3. When PM2.5 levels were high and O3 levels low, the PM2.5–O3 correlation tended to be negative, consistent with findings of Chen et al. [29].
There was a strong positive correlation between PM2.5 and O3 in summer, while a negative correlation was observed in winter. In spring and autumn, a positive correlation was found when the concentration of PM2.5 was low (PM2.5 < 50 μg·m−3), and a negative correlation emerged when the concentration of PM2.5 was high (PM2.5 > 60 μg·m−3).

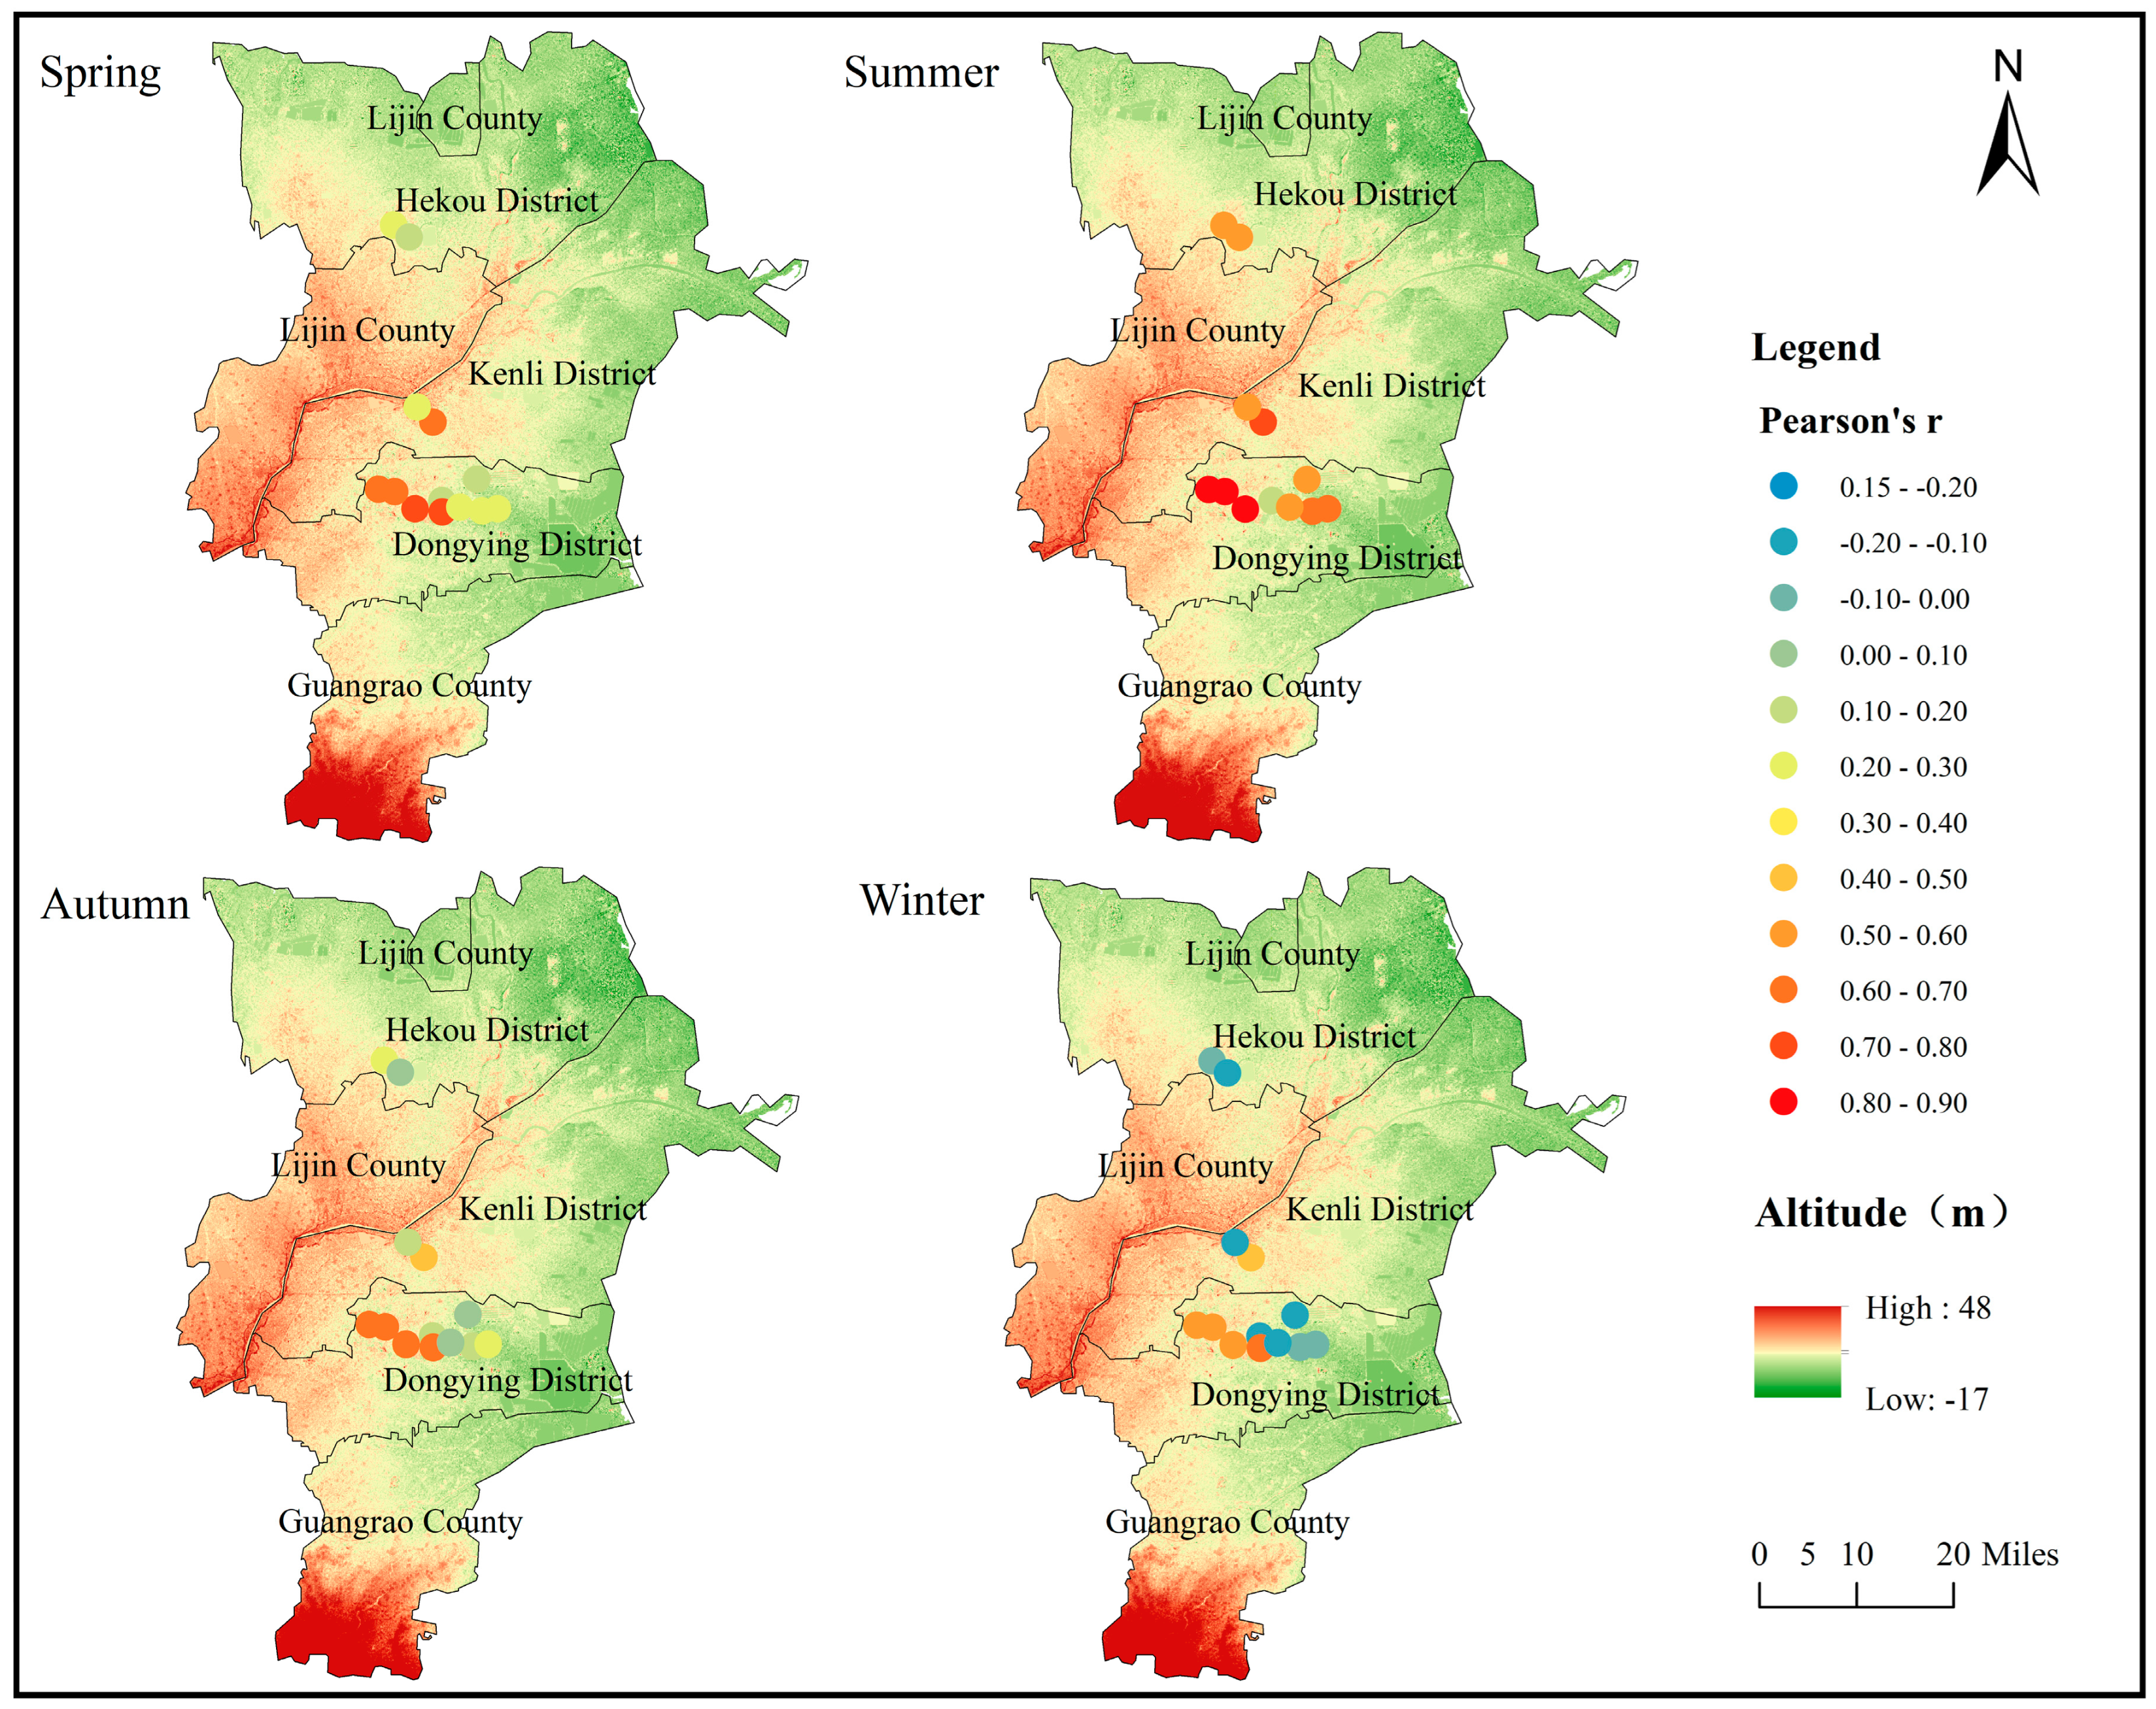
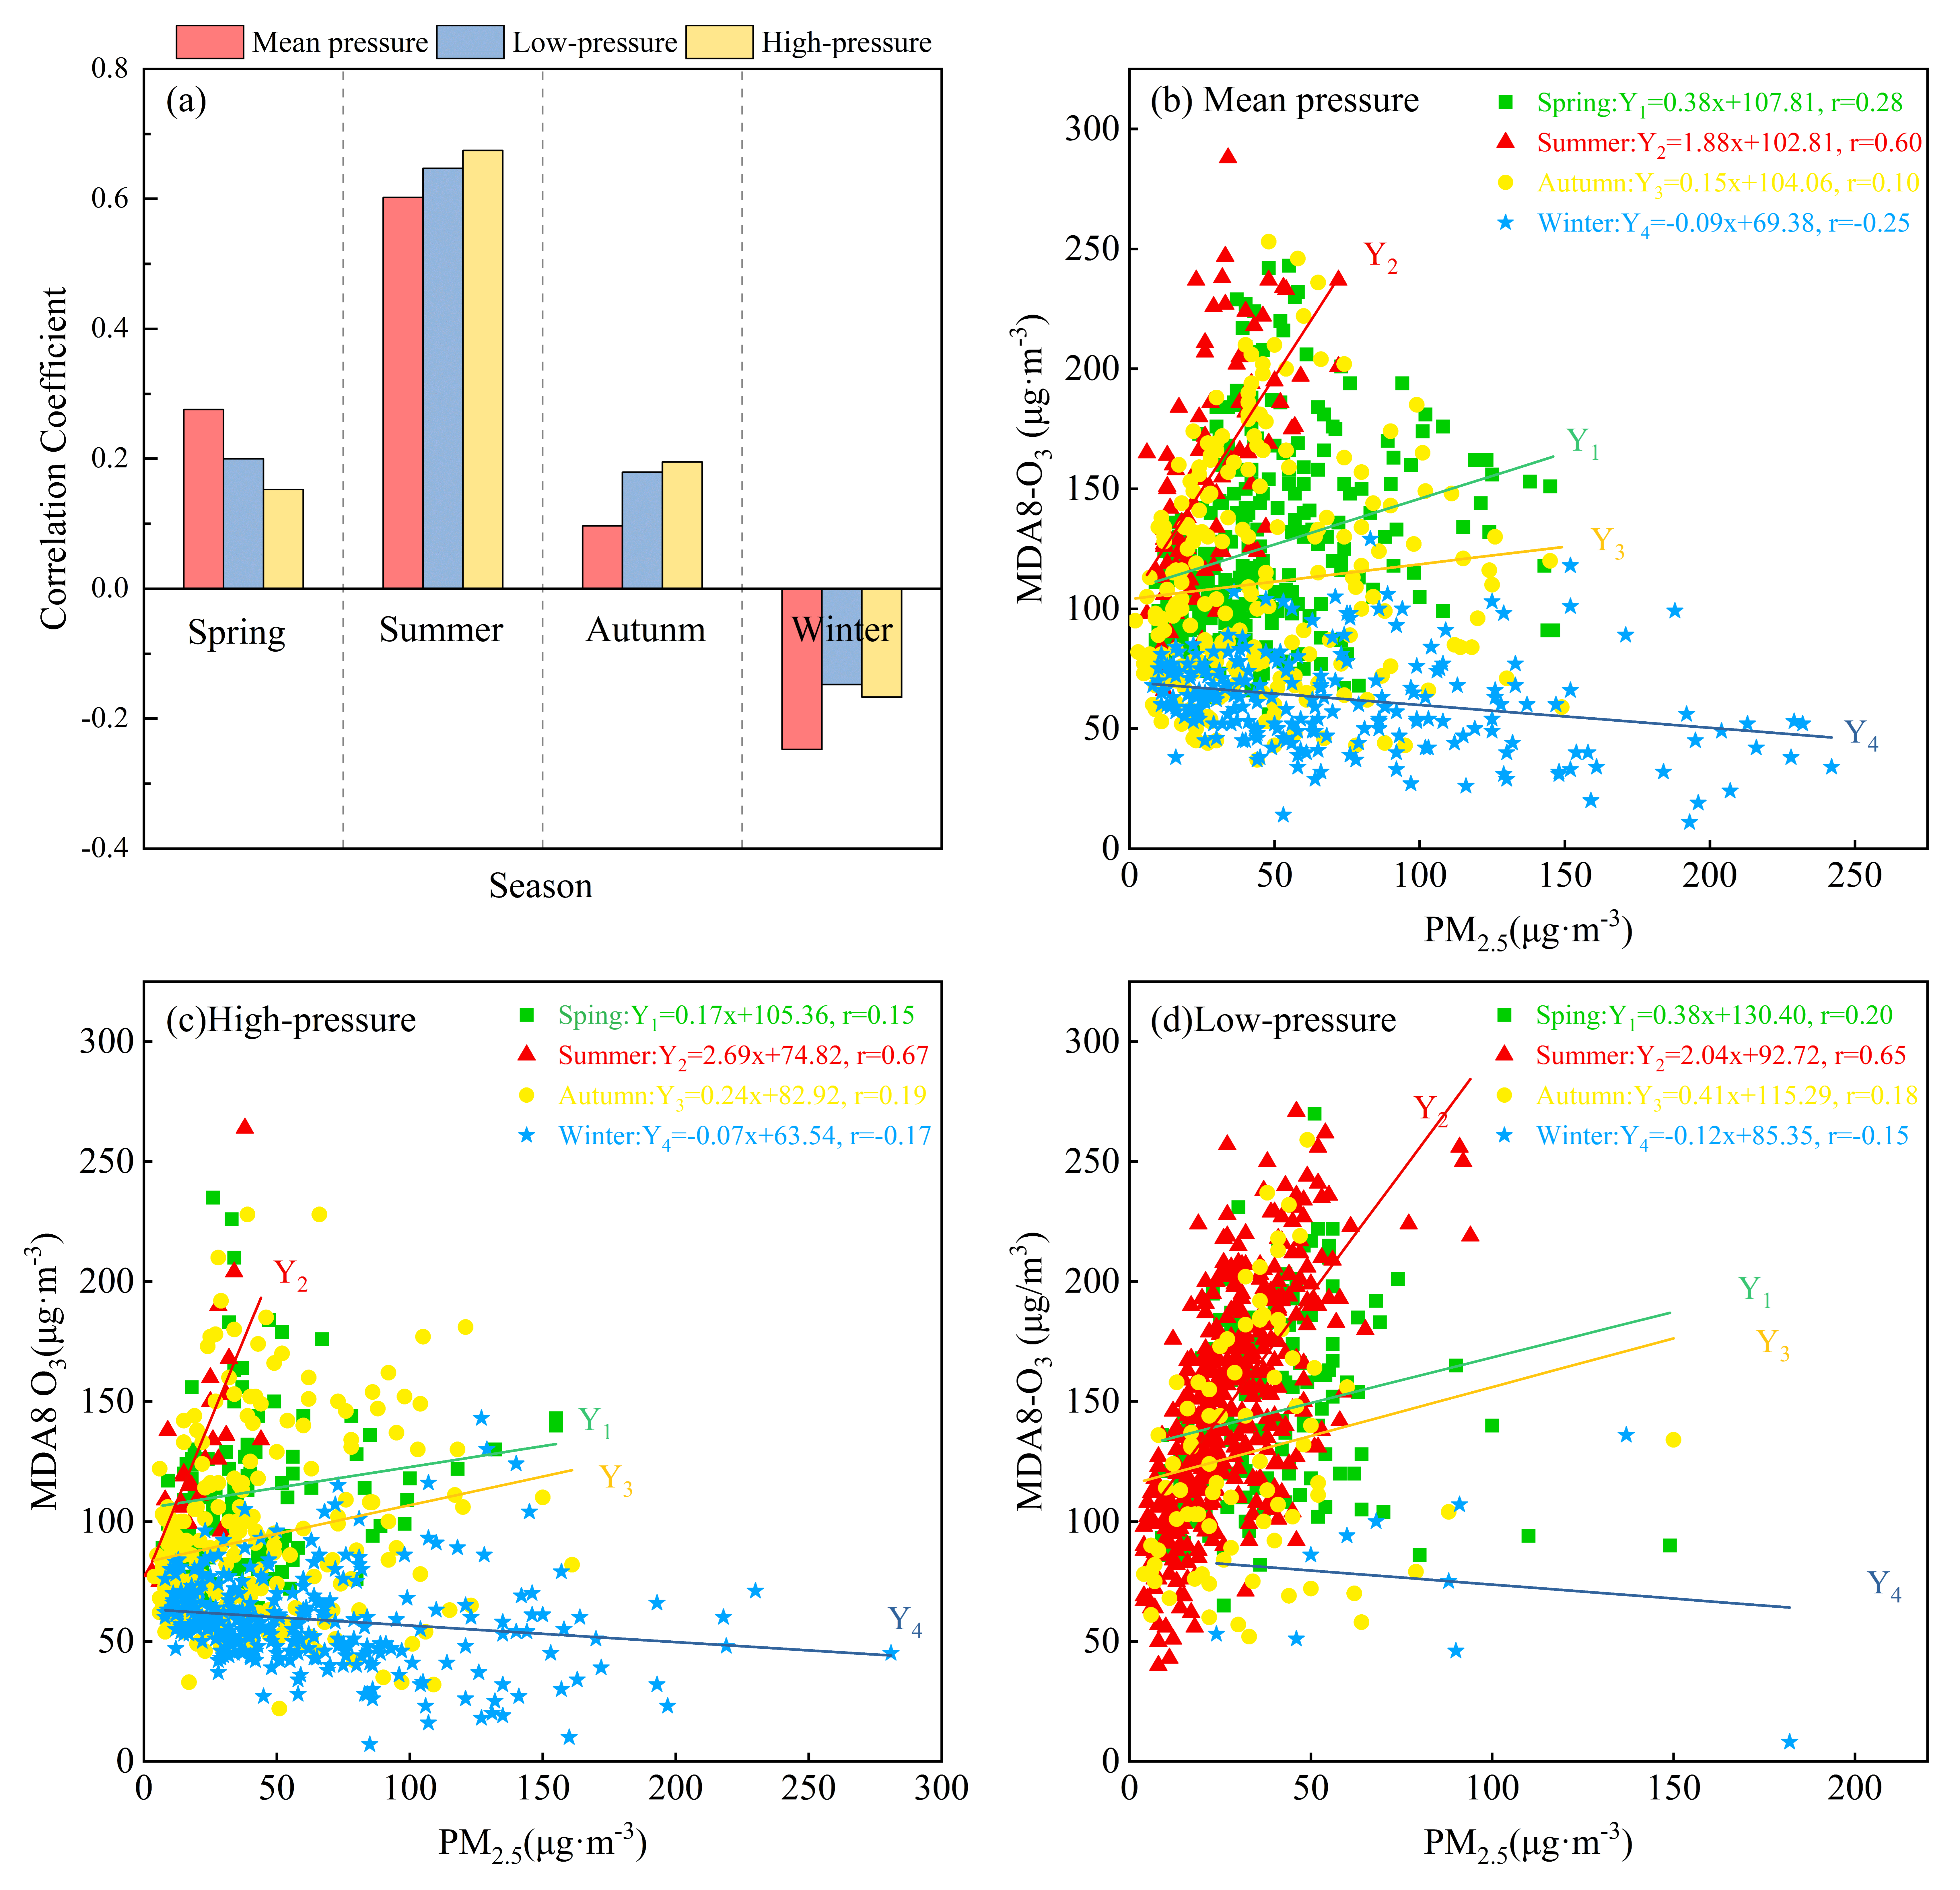
3.2.2. Spatial Heterogeneity of PM2.5 and O3 Association

From 2017 to 2023, the correlations between daily evaluated PM2.5 and O3 values in Dongying showed a spatially heterogeneous distribution. Annually, central stations (ICC, r = 0.72) in 2020 and western stations (XSEPC, r = 0.76) in 2021 exhibited positive correlations, while super monitoring and provincial-controlled stations generally showed negative correlations (Figure S7). Seasonally, in winter, the PM2.5 and O3 correlation in the northern and eastern regions were weakly negative, whereas the western region had weak positive correlation. Summer demonstrated a universally positive correlation between PM2.5 and O3 across all areas, with strong positive correlations observed at western stations. Western regions PM2.5 and O3 exhibited stronger positive correlations in spring/autumn (Figure 7). Overall, a significant synergistic effect between PM2.5 and O3 was observed in the western region of Dongying.

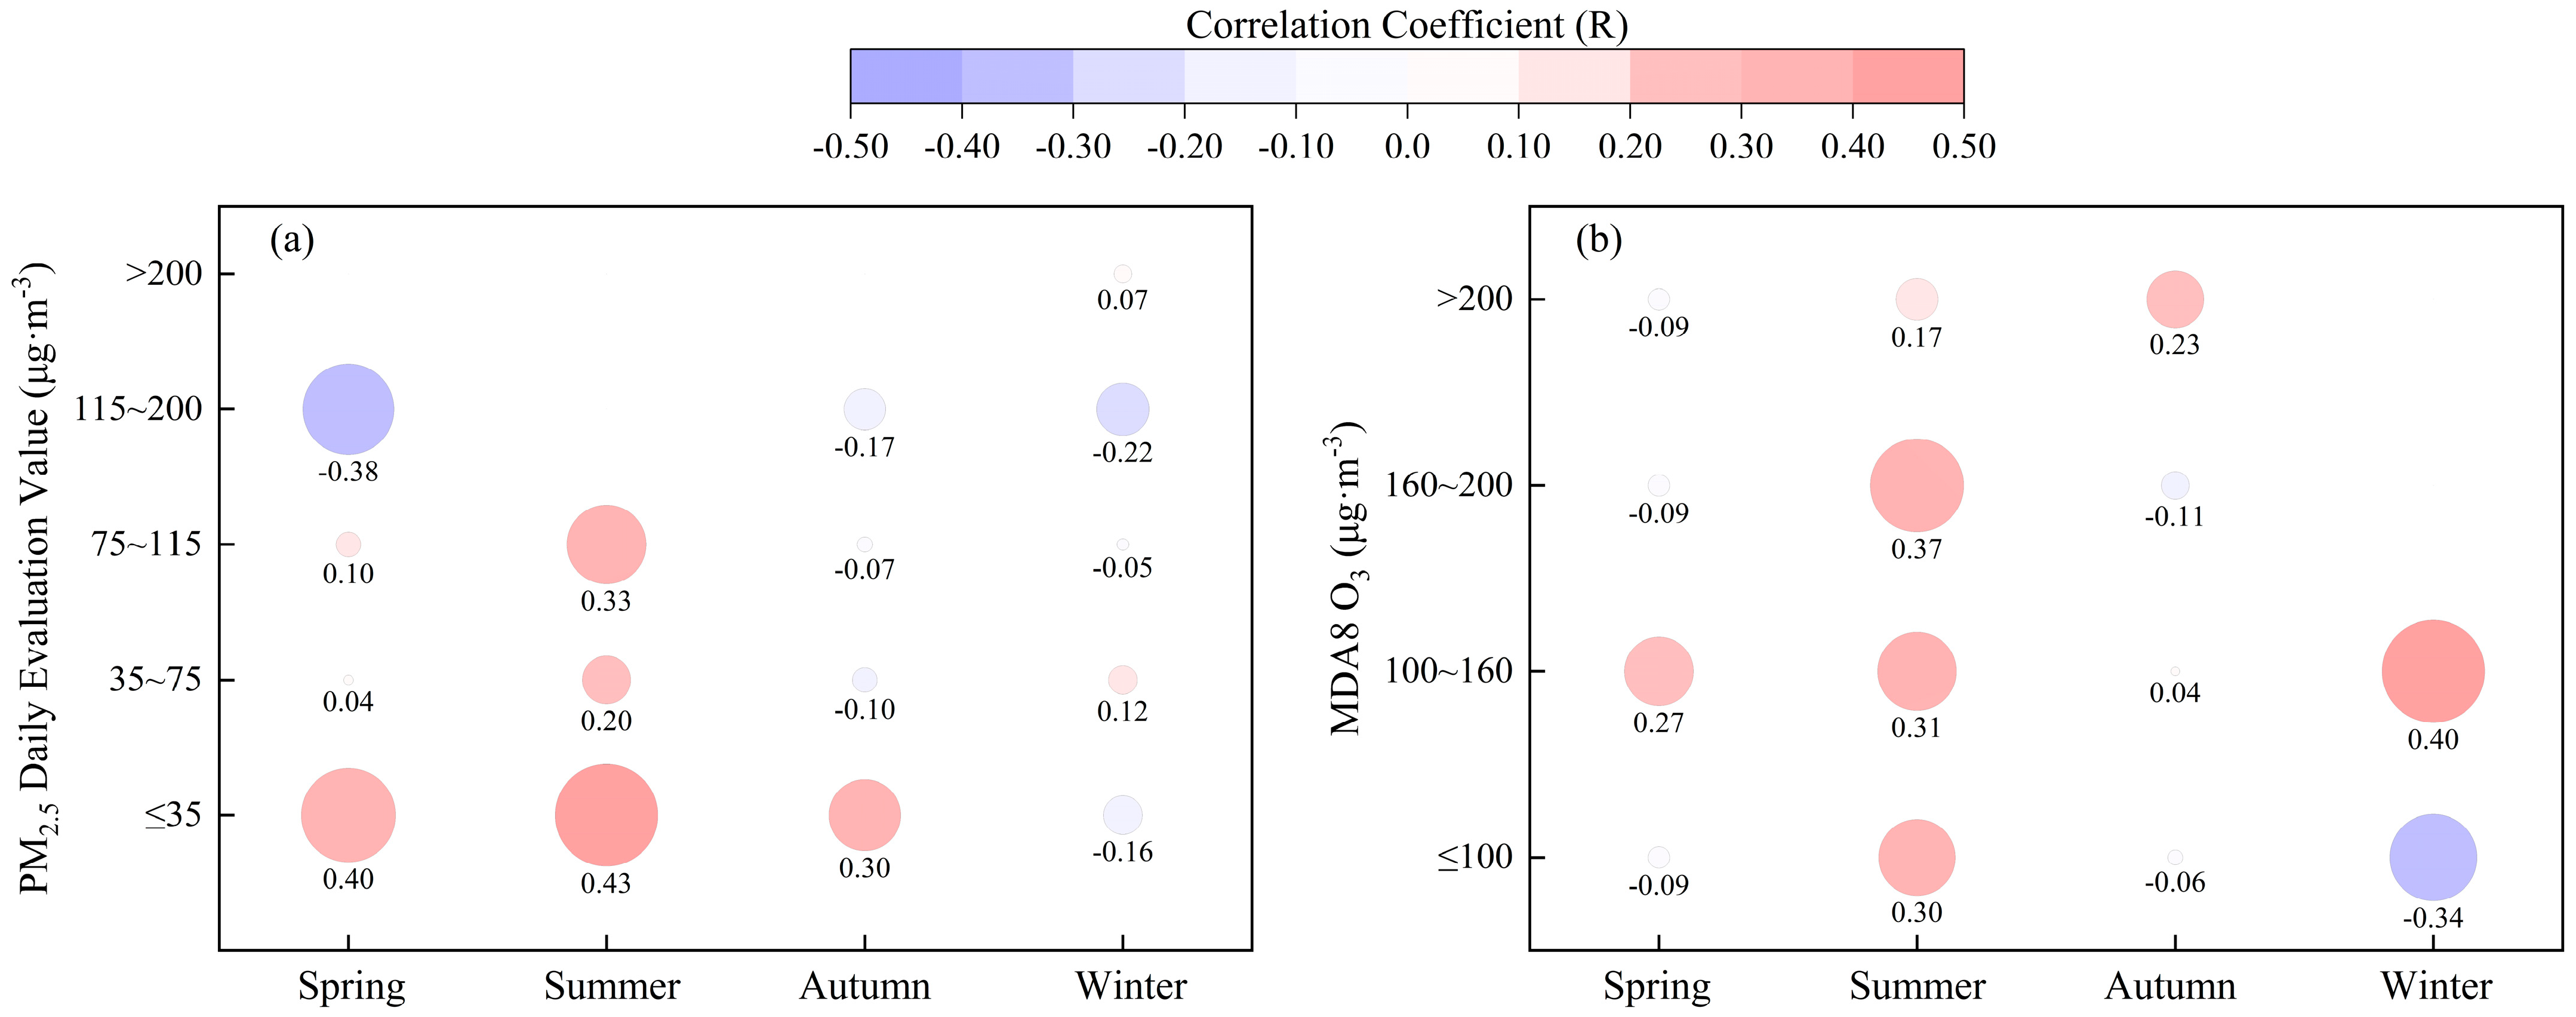
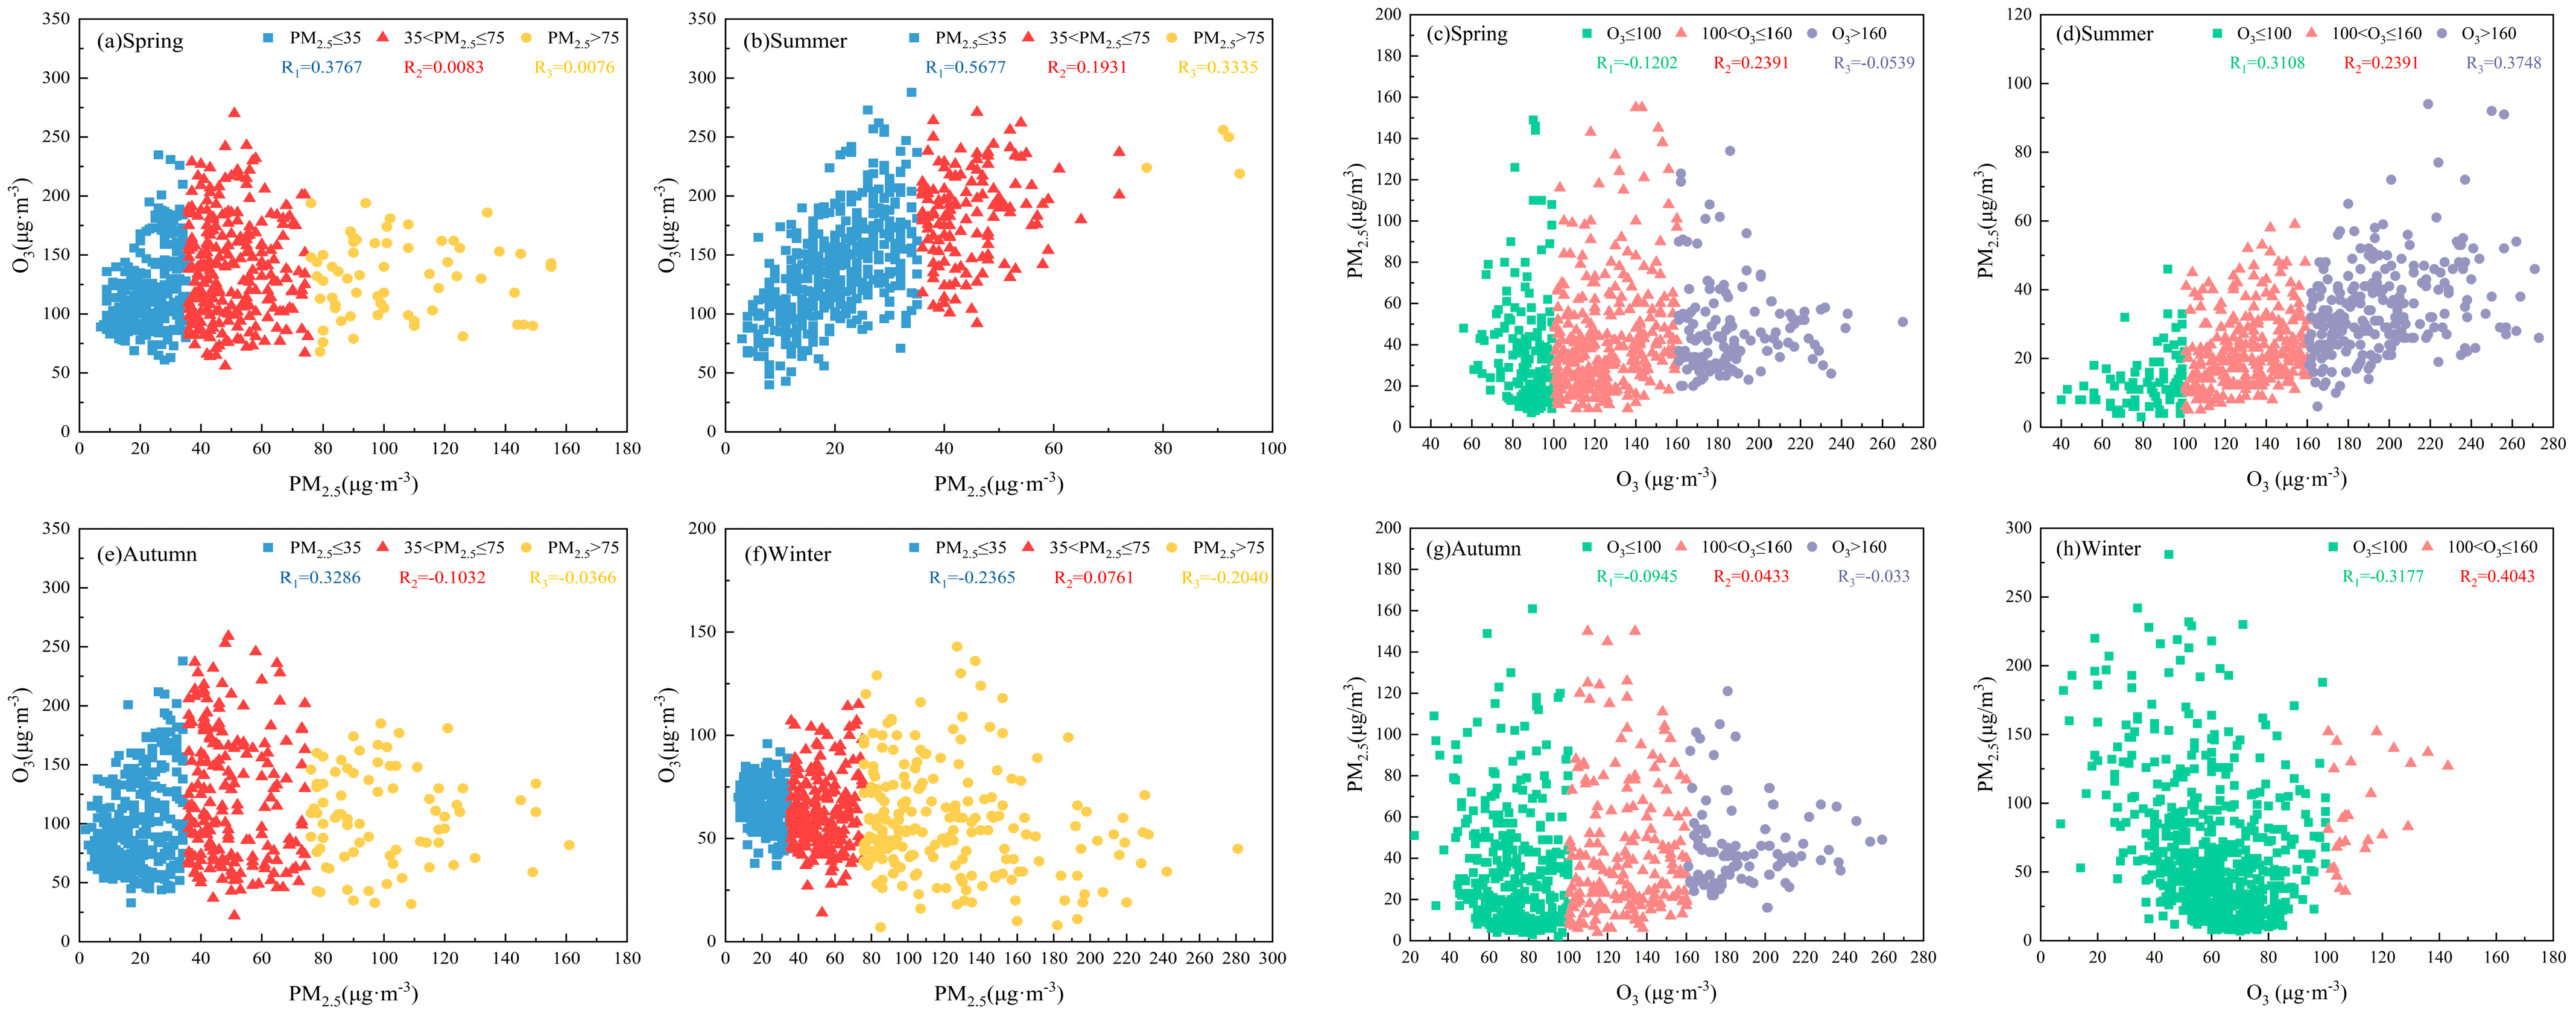
3.2.3. Pollution Level-Dependent Correlation Patterns

The daily evaluated PM2.5 and O3 values were classified according to Table S6. Dongying’s PM2.5 ≥ 75 μg·m−3 days were more frequent in autumn and winter than spring/summer. Summer dominated O3 ≥ 160 μg·m−3 days (39.5%, significantly higher than other seasons), while spring recorded the highest O3 100–160 μg·m−3 frequency. Autumn had the largest O3 ≤ 100 μg·m−3 proportion (14.6% for O3 ≥ 160 μg·m−3), and winter exhibited the highest O3 ≤ 100 μg·m−3 percentage (95.9%).
The PM2.5–O3 correlation was influenced by the gradient of PM2.5 concentrations (Figure 8a). In summer, the strongest positive correlation of the year (r = 0.43) was observed when PM2.5 ≤ 35 μg·m−3, while winter exhibited negative correlations at both PM2.5 ≤ 35 μg·m−3 and 75 μg·m−3 < PM2.5 ≤ 200 μg·m−3. In autumn, the correlation was positive when PM2.5 ≤ 35 μg·m−3 but it transitioned to negative correlations with progressively stronger negative trends as PM2.5 concentrations increased. Additionally, the PM2.5–O3 correlation was influenced by the level of photochemical activity (Figure 8b). In summer, the strongest positive correlation (r = 0.37) occurred under moderate photochemical activity whereas, in winter, the most significant negative correlation (r = −0.34) emerged under low activity despite light activity yielding positive trends (r = 0.40). In autumn, negative correlations were predominant during low-to-moderate activity periods but, under high activity, positive correlations strengthened by 30%. In spring, positive correlations between PM2.5 and O3 were maintained only under light photochemical activity, with negative correlations prevailing during other periods.
In summer, the strongest positive correlation between PM2.5 and O3 occurred when PM2.5 ≤ 35 μg·m−3 and 160 μg·m−3 < O3 ≤ 200 μg·m−3. In winter, the strongest negative correlation emerged at 115 μg·m−3 < PM2.5 ≤ 200 μg·m−3 and O3 ≤ 100 μg·m−3. In spring, significant positive correlation was found at PM2.5 ≤ 35 μg·m−3 and 100 μg·m−3 < O3 ≤ 160 μg·m−3 but weakened as their concentrations rose. In autumn, a significant positive correlation was observed when PM2.5 ≤ 35 μg·m−3 and 200 μg·m−3 < O3.

3.3. Impact Analysis of Meteorological Conditions

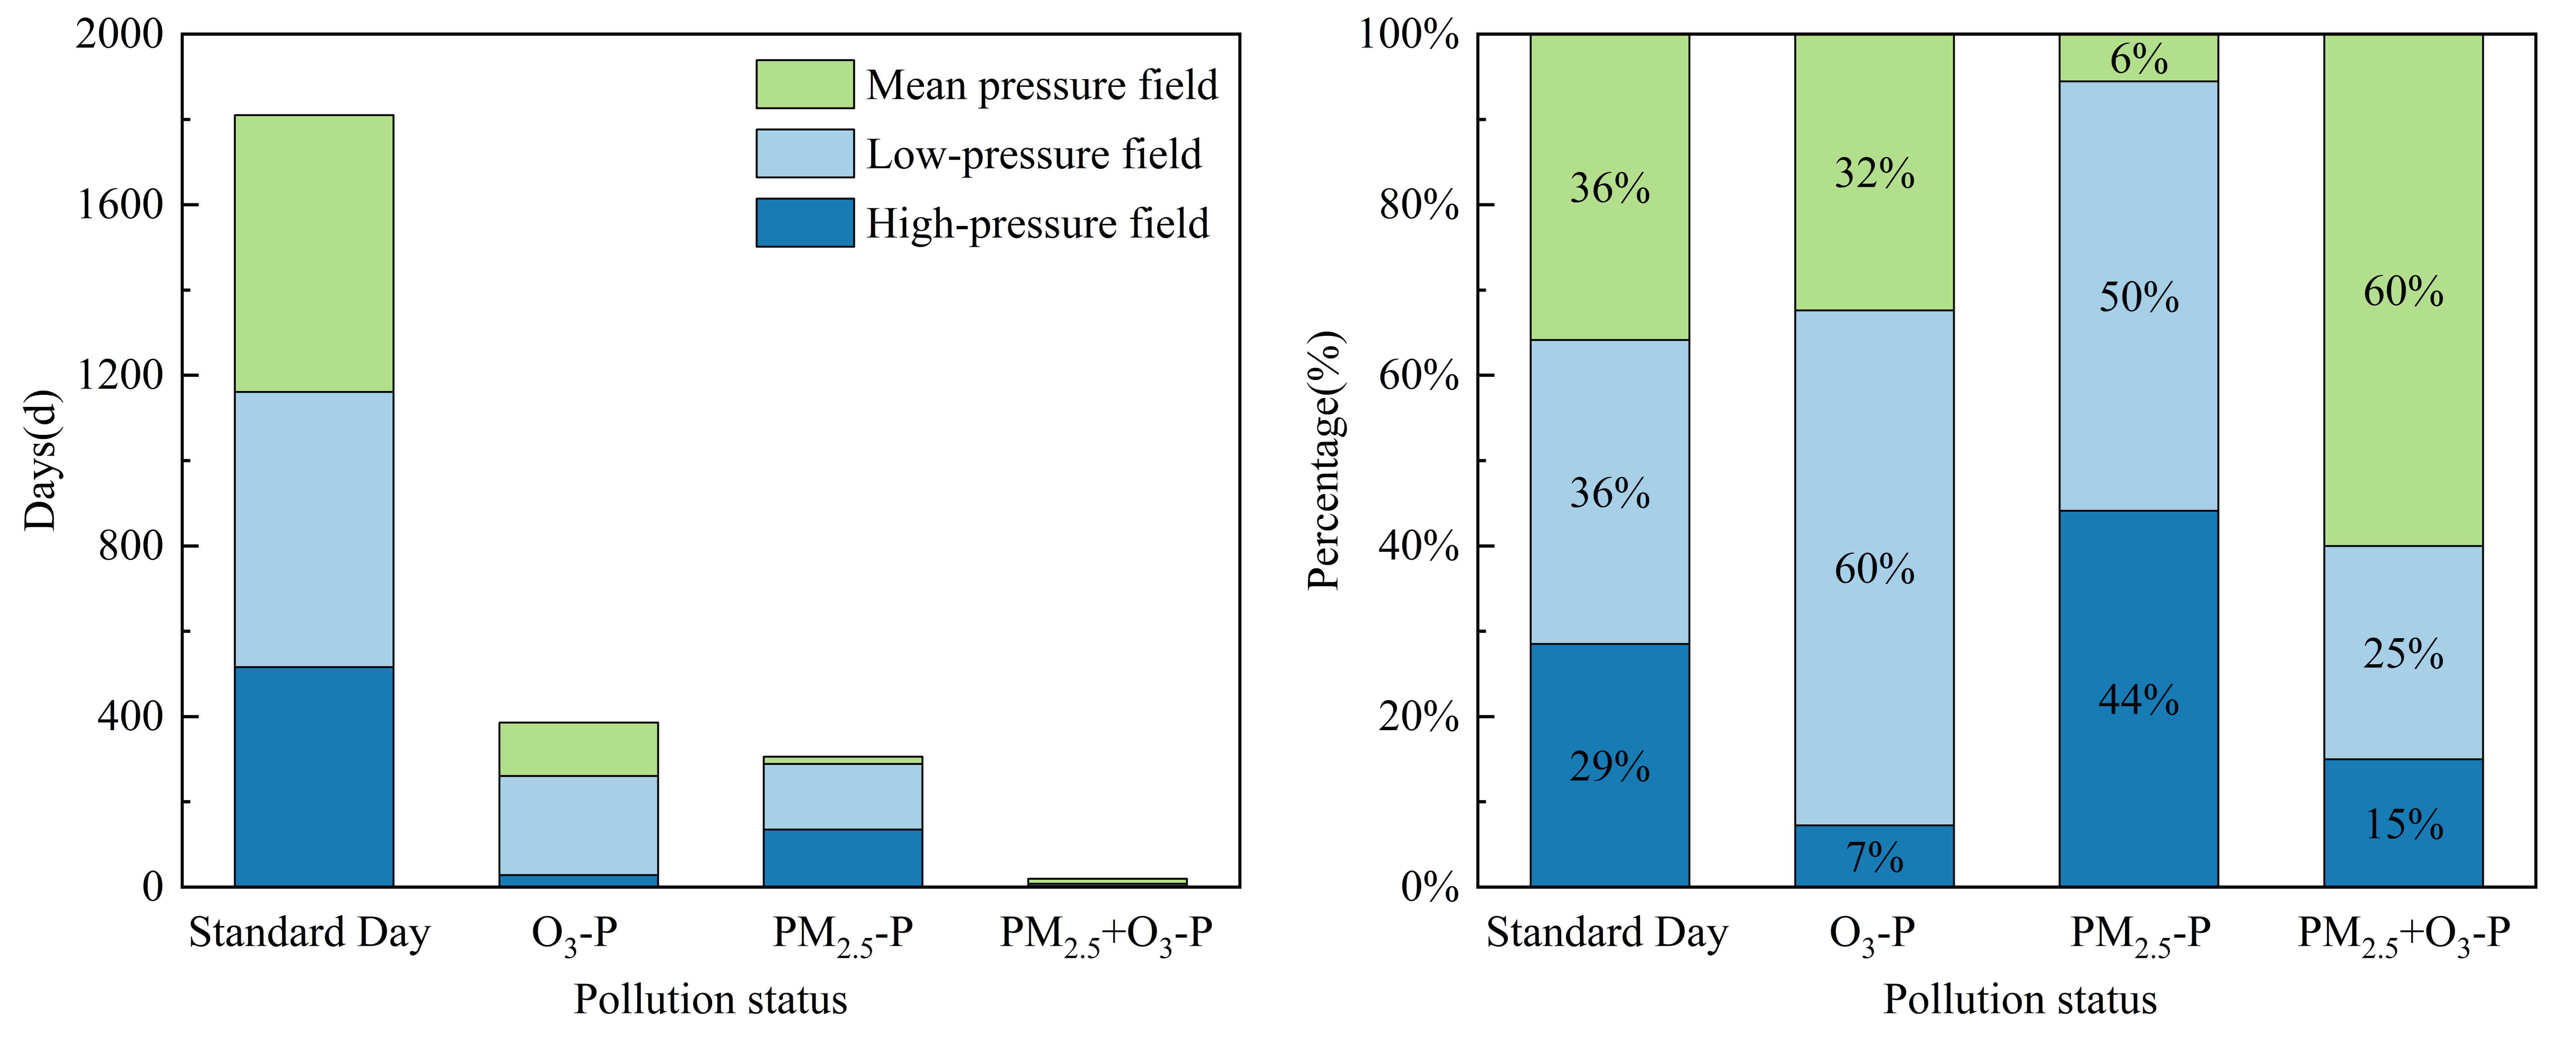
3.3.1. Synoptic Weather Patterns

The nine weather types were categorized into three types: high-pressure field, low-pressure field, and mean pressure field (Table S7 and Figure S8). In the “standard day” scenario, the dominant weather types were mean pressure field (36%), low-pressure field (36%), and high-pressure field (29%). Low-pressure field types dominated both O3-P (60%) and PM2.5-P (50%) episodes, which typically featured southeasterly horizontal winds inhibited by northwestern mountainous terrain, thereby promoting O3 formation and accumulation. Mean pressure fields accounted for 60% of PM2.5+O3-P events, associated with stable weather and stagnant conditions that promoted pollutant buildup (Figure 9). In Dongying, O3 and PM2.5 accumulations were more significantly influenced by low-pressure weather, whereas concurrent high PM2.5–O3 days were strongly dependent on mean pressure field conditions.
Among the three weather patterns, the correlation between daily evaluated PM2.5 and O3 values reached its strongest positive correlations in summer, was weaker in spring and autumn, while winter exhibited negative correlations (Figure 10a). In both summer and autumn, the most significant positive correlation between PM2.5 and O3 occurred under a high-pressure field (high-pressure field > low-pressure field > mean pressure field), while spring showed an opposite pattern (mean pressure > low-pressure > high-pressure). In winter, the negative correlation between PM2.5 and O3 followed the order: mean pressure field > high-pressure field > low-pressure field. Under spring’s mean pressure field and low-pressure field, a 1 μg/m3 increase in MDA8 O3 concentration led to a 0.38 μg/m3 increase in PM2.5 concentration (ΔPM2.5/ΔO3 = 0.38, Figure 10b,d). In summer, ΔPM2.5/ΔO3 was 2.69 under a high-pressure field (Figure 10c) and 2.04 under a low-pressure field (Figure 10d). In autumn, ΔPM2.5/ΔO3 was 0.41 under a low-pressure field (Figure 10d). In winter, under a low-pressure field, a 1 unit increase in MDA8 O3 concentration resulted in a 0.12 μg/m3 decrease in PM2.5 concentration (ΔPM2.5/ΔO3 = −0.12, Figure 10d).
The dynamic uplifting effect of the northwestern mountain range on southeastern airflows, combined with low-pressure systems, creates OPA/PPA pollution hotspots, while the mean pressure field, through thermal stability effects, becomes a key trigger for PM2.5–O3 complex pollution. Summer high-pressure systems promote PM2.5–O3 synergistic accumulation (ΔPM2.5/ΔO3 = 2.69) through enhanced photochemical reactions and vertical mixing, and the role of uniform pressure fields in facilitating this accumulation should not be overlooked.

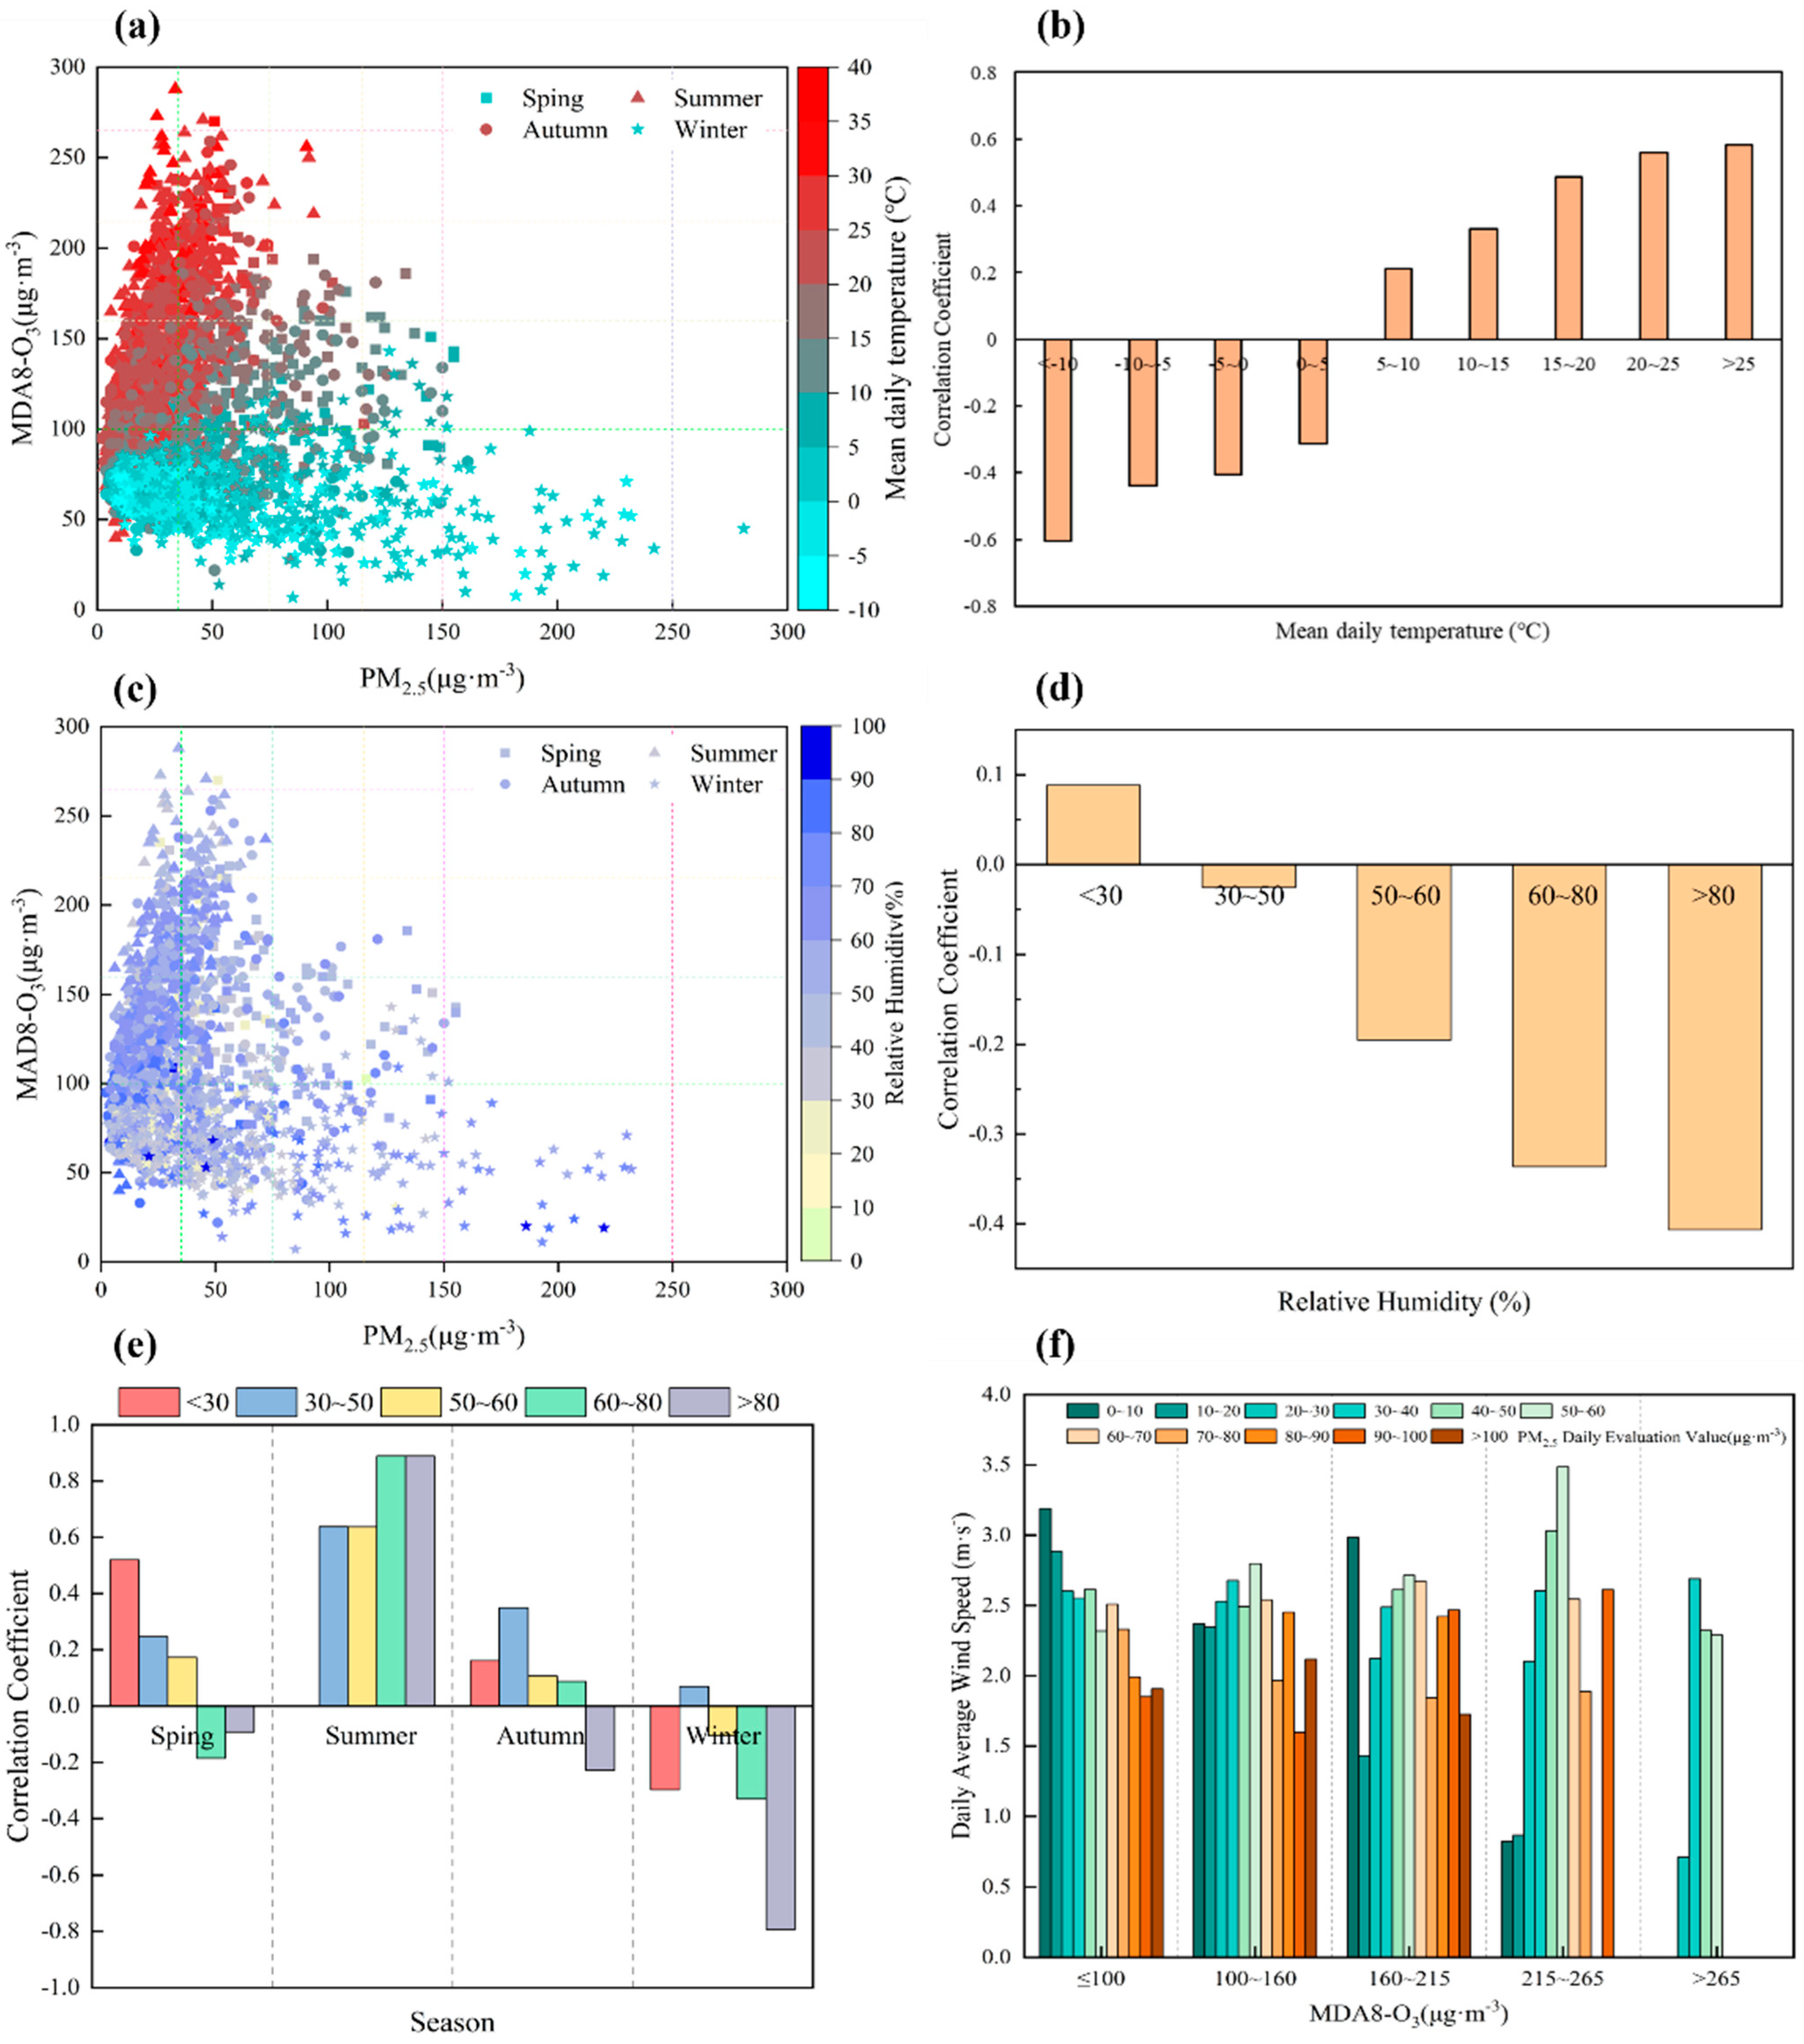
3.3.2. Key Meteorological Parameters

Temperature

PM2.5 and O3 formation conditions varied with temperature, where high temperatures favored O3 production and accumulation, whereas low temperatures promoted PM2.5 formation and buildup (Figure 11a). In summer, under high temperatures, PM2.5 and O3 showed a strong positive correlation (r = 0.60), while in winter, under low temperatures, PM2.5 and O3 exhibited a negatively correlation (r = −0.19). During spring and autumn, due to temperature fluctuations, PM2.5 and O3 displayed a transitional weak positive correlation (r = 0.13 and 0.19, respectively). Scatter plots for all four seasons revealed a triangular distribution, where the positive correlation between PM2.5 and O3 strengthened significantly with increasing temperature. The correlation coefficient between PM2.5 and O3 increased from 0.21 to 0.56 as temperatures rose from 5–10 °C to 20–25 °C, peaking at 0.58 during high-temperature periods (>25 °C). Conversely, negative correlation deepened sharply as temperatures dropped, with the correlation coefficient between PM2.5 and O3 changing from −0.40 to −0.60 as temperatures fell from 0–5 °C to −10~−5 °C (Figure 11b). Qian et al. [64] found that both O3 and PM2.5 concentrations significantly increased with rising temperatures, with MDA8 O3 and PM2.5 increasing by 4.8 ppb and 1.9 μg·m−3 for each 1 °C temperature rise, respectively.
Studies showed [65,66] that the most significant meteorological factor influencing PM2.5 and O3 concentrations in northern regions was temperature, followed by wind speed, humidity, pressure, and solar radiation. Within the temperature range of 20 °C to 25 °C and above 25 °C, as temperature increased, enhanced sunlight and higher emissions of VOCs and NOx from biogenic sources and motor vehicles [67,68] activated photochemical reactions, leading to an increase in both O3 and PM2.5 concentrations. Furthermore, during the summer, stratospheric O3 intrusion [69,70] and the increased oxidizing potential of O3 promoted the formation of secondary aerosols [54,68], further strengthening the positive correlation between O3 and PM2.5. When temperatures were below 5 °C, suppression of photochemical reactions reduced O3 formation. PM2.5, on the other hand, accumulated through processes such as the formation of particulate-phase SNA at low temperatures [71], and hygroscopic growth in high humidity (with winter peaks in water-soluble ions [72,73]). Additionally, the increase in PM2.5 concentration could have enhanced aerosol optical thickness [74], significantly reducing the intensity of solar radiation reaching the surface, which in turn decreased the amount of O3 produced by NO2 photolysis. Therefore, O3 formation was suppressed by low temperatures while PM2.5 concentrations continued to rise, significantly strengthening in the negative correlation of PM2.5 and O3.

Humidity

As shown in Figure 11c, during the summer, relative humidity (RH) ranged from 30% to 90%, with higher O3 concentrations when the daily PM2.5 mean concentration was below 75 μg·m−3. In winter, RH concentrated between 20% and 70%, and PM2.5 and O3 exhibited a negative correlation. As RH increased, the PM2.5–O3 correlation changed from positive (r = 0.09 when RH < 30%) to negative (r = −0.41 when RH > 80%) (Figure 11d). In spring, when RH < 30%, PM2.5 and O3 showed a significant positive correlation (r = 0.52). As RH increased, the correlation weakened. In summer, the correlation was strongest when RH > 60%. In autumn, the correlation was strongest when RH was between 30% and 50%. In winter, when RH > 80%, a significant negative correlation was observed (r = −0.79) (Figure 11e). Overall, when RH < 30%, PM2.5 and O3 showed a positive correlation. As RH increased, the correlation shifted from positive to negative and, when RH > 80%, a negative correlation was observed.
Under high humidity conditions (>60%), PM2.5 and O3 exhibited a negative correlation. On the one hand, the increased hygroscopicity of particles enhanced the contribution of sulfate and nitrate ions [75], while also boosting the liquid-phase oxidation of SO2 and NOx [76,77]. Additionally, high humidity promoted the reaction of VOCs with oxidants in the liquid phase to form SOA [78,79], collectively driving an increase in PM2.5 concentration. On the other hand, the increased cloud cover associated with high humidity reduced solar radiation, weakening photochemical reactions and affecting the heterogeneous reactions on PM2.5 surfaces. Furthermore, the liquid water content of aerosols dissolved HO2 free radicals, promoting liquid-phase reactions (e.g., HO2(aq) + O3 → OH + 2O2), significantly reducing the concentration of HO2 in the gas phase and thereby decreasing the rate of O3 production [80,81,82]. Under low humidity conditions (<30%), PM2.5 and O3 exhibited a positive correlation. Reduced water vapor decreased UV radiation absorption, increasing the photolysis rate of NO2 and directly promoting O3 formation. In the high temperature and low humidity haze conditions, the OH radical-driven oxidation of NOx was enhanced, which increased the formation rate of NO3, further driving an increase in PM2.5 concentrations [83].

Wind Speed

Wind speed influenced the concentration of atmospheric pollutants by affecting diffusion conditions. As shown in Figure 11f, with increasing daily average values of PM2.5 and O3, the daily wind speed gradually decreased. This indicated that wind speed significantly influenced PM2.5 and O3 accumulation while stable weather conditions favored their local formation and accumulation. When the daily O3 concentration exceeded 265 μg·m−3, the daily average wind speed ranged from 0.71 to 2.69 m/s. Similarly, when the daily PM2.5 concentration exceeded 100 μg·m−3, the wind speed ranged from 1.73 to 2.12 m/s. When both PM2.5 exceeded 100 μg·m−3 and O3 exceeded 160 μg·m−3, the daily wind speed was 1.73 m/s. Therefore, as the concentrations of PM2.5 and O3 increased, wind speed decreased, suggesting that low wind speeds associated with stable weather conditions contributed to the simultaneous increase in PM2.5 and O3.
Under stable meteorological conditions (wind speed < 1.73 m/s), the diffusion ability of PM2.5 and O3 was significantly restricted, leading to a prolonged retention time of local pollutants. NOx and VOCs precursors accumulated continuously, efficiently generating O3 through photochemical chain reactions. Meanwhile, O3 and OH radicals released during these reactions oxidized SO2 and NOx into sulfates and nitrates, driving VOC oxidation into SOA and resulting in a simultaneous rise in PM2.5 and O3 concentrations.

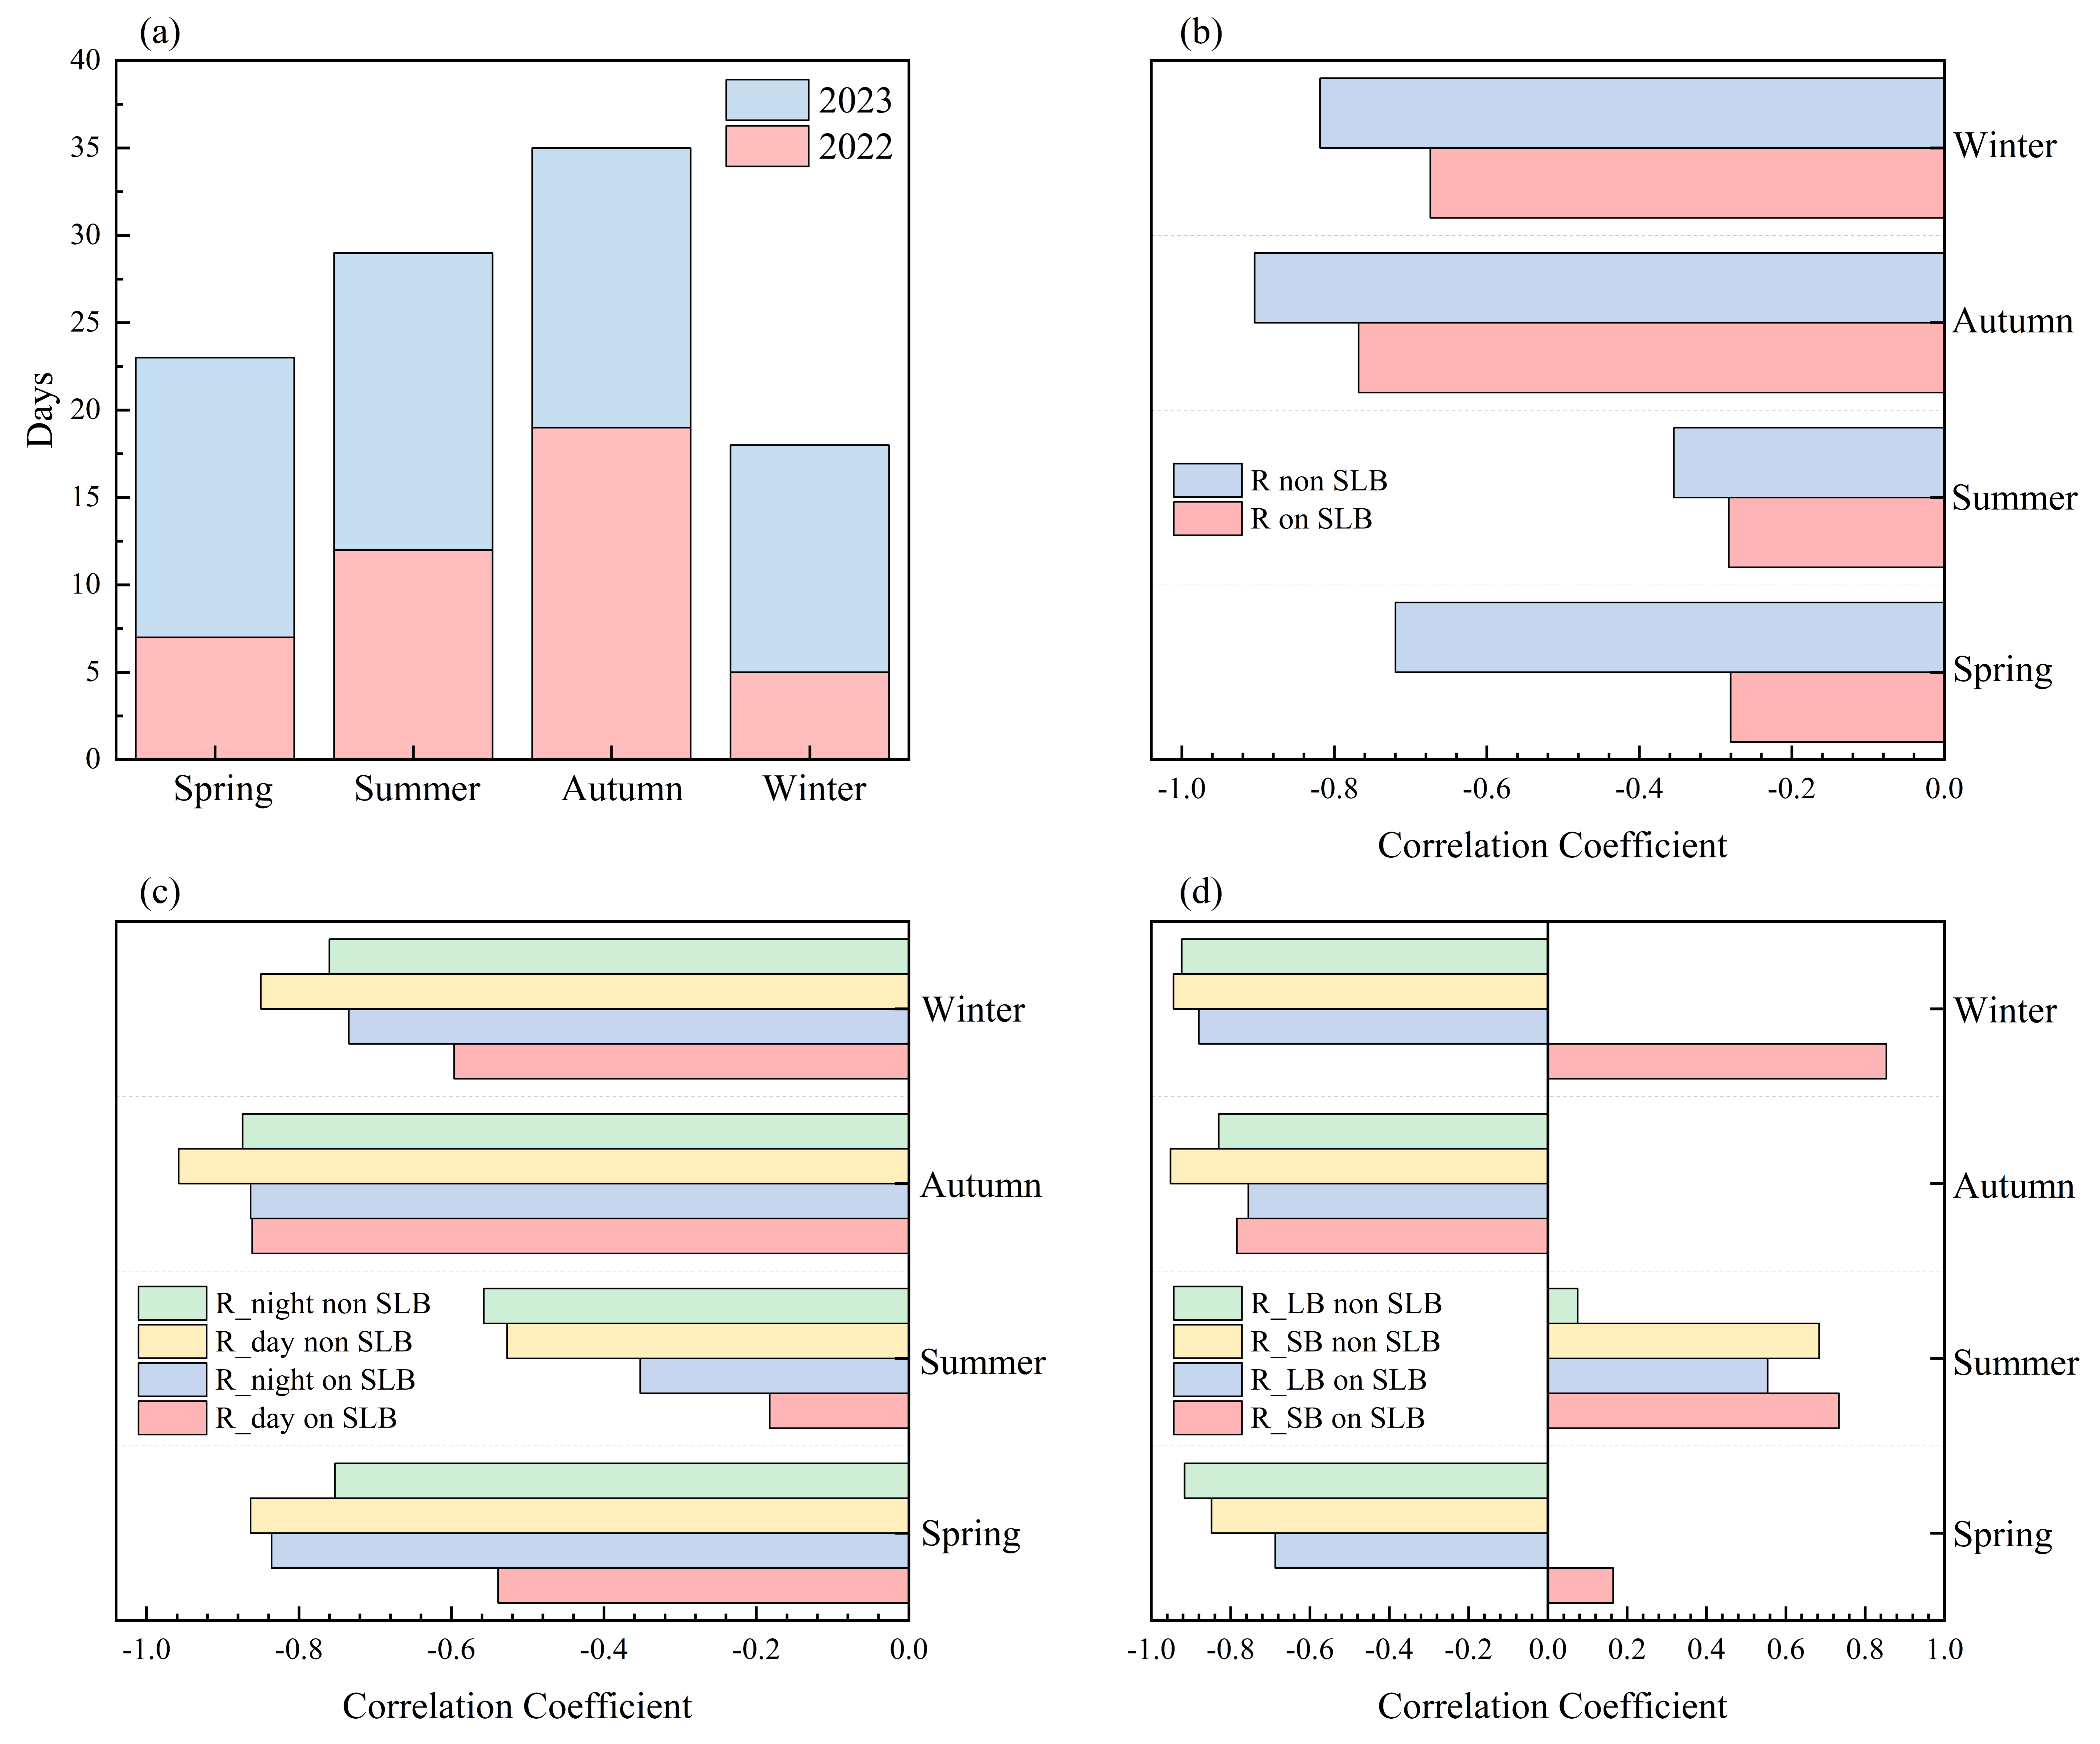
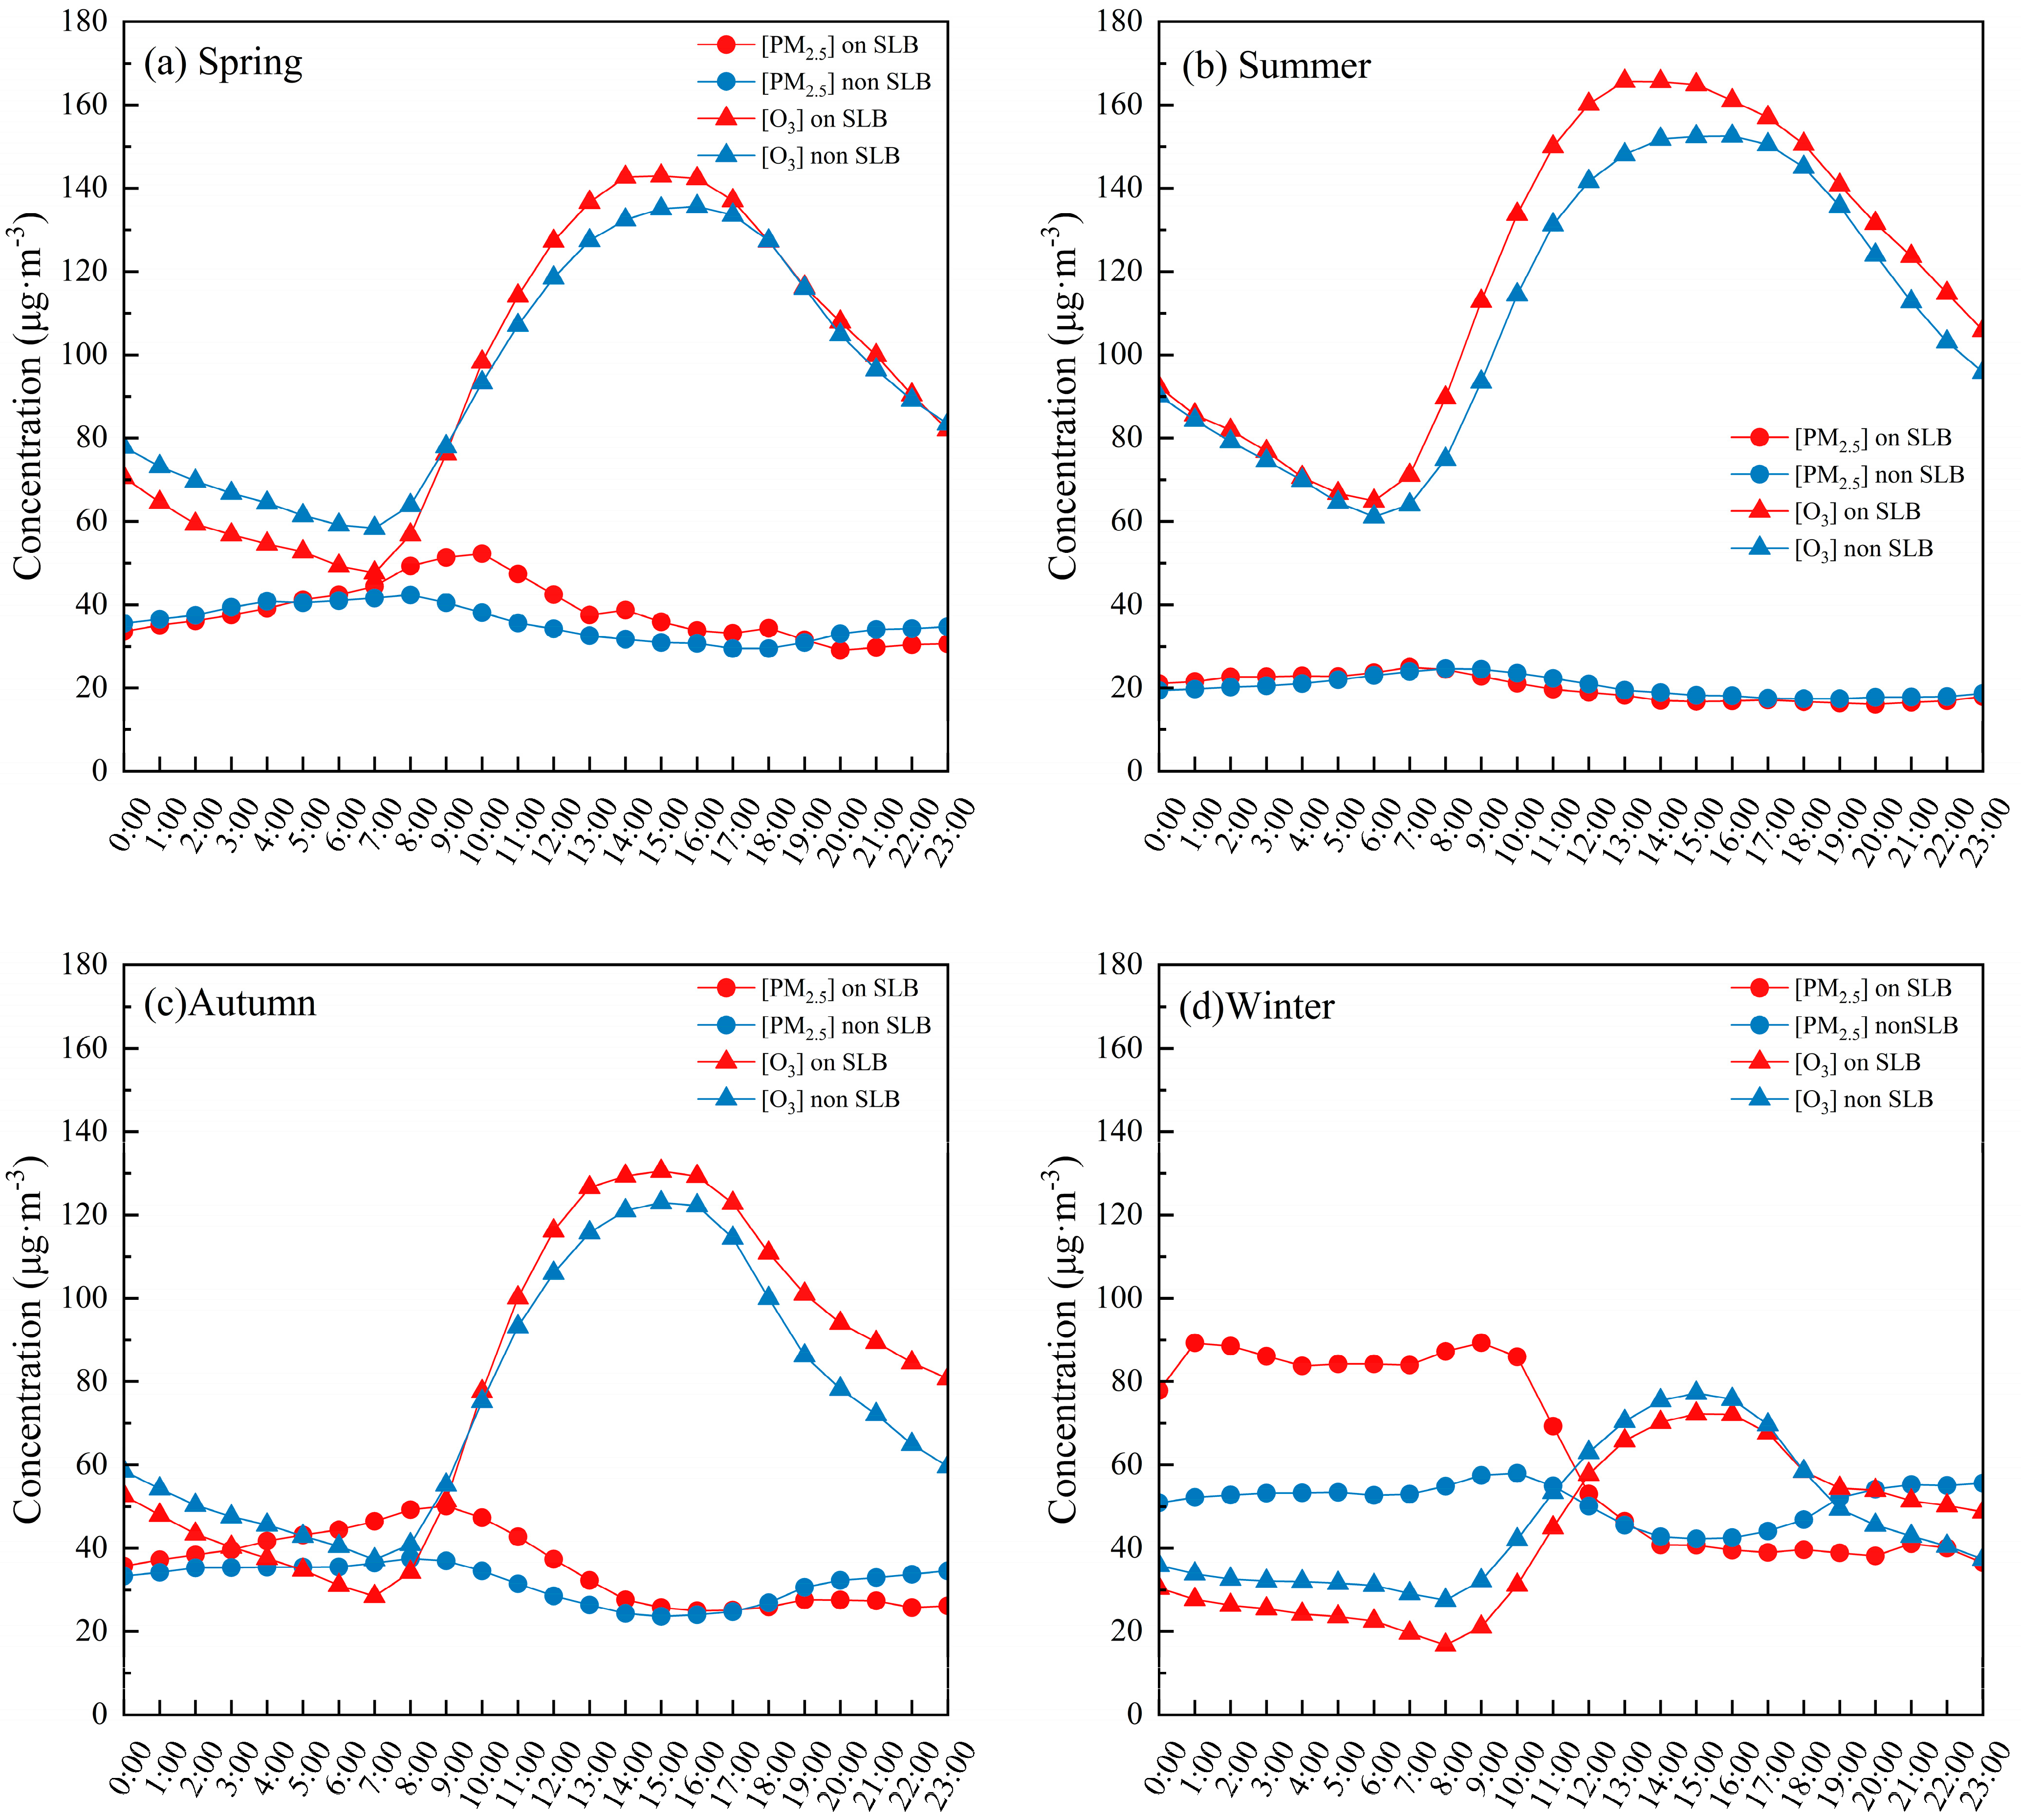
3.3.3. Sea–Land Breeze

Between 2022 and 2023, Dongying experienced 105 sea–land breeze days, peaking in autumn (35 days) and lowest in winter (18 days), with 2023 showing an increase from the previous year (Figure 12a). During both sea–land breeze and non-sea–land breeze periods, there was a negative correlation between PM2.5 and O3, but the negative correlation during the sea–land breeze period was generally weaker than in the non-sea–land breeze period. The maximum attenuation occurred in spring, followed by autumn. During the non-sea–land wind period, the negative correlation between PM2.5 and O3 during day and night was stronger than during the sea–land breeze period, with maximal autumn gradients (Figure 12b,c). When comparing sea–land breeze (Figure 12d), in the non- sea–land breeze period, the negative correlation between PM2.5 and O3 was stronger during the sea breeze time (13:00–20:00) in spring/autumn/winter. During sea–land breeze periods, the sea breeze hours in summer and autumn exhibited stronger PM2.5–O3 correlations than land wind hours, while in spring and winter the opposite was observed. Collectively, sea–land breeze circulation significantly weakened the PM2.5–O3 correlation.
PM2.5 and O3 diurnal variations were modulated by sea–land breeze (Figure 13). PM2.5 concentrations followed a unimodal pattern in spring/summer/autumn but a bimodal pattern in winter, with winter recording the highest peak–trough values, followed by spring, autumn, and summer. O3 concentration showed unimodal patterns across all seasons, with summer having the highest peak–trough values, followed by spring, autumn, and winter. Summer’s O3 peak (166 μg·m−3 during 13:00–16:00 sea–land breeze periods) matched Meng et al. [32] findings. During the land–sea breeze periods, the PM2.5 peak value increased by 15–36%, while the O3 peak value rose by 5–8%. The PM2.5 trough value decreased by 10–20%, and the O3 trough value decreased by 15–25%. During the land–sea breeze periods, the O3 peak value occurred 1–2 h earlier compared to non-land–sea breeze periods (summer: land–sea breeze period 13:00–16:00, non-land–sea breeze period 15:00–18:00). The trough value occurred 2 h earlier (summer: land–sea breeze period 05:00–07:00, non-land–sea breeze period 07:00–09:00). The land–sea breeze might promote the generation and accumulation of O3, accelerating its diffusion and removal, while also facilitating the diffusion and removal of PM2.5 and inhibiting its formation and accumulation.

3.4. Impact Analysis of Atmospheric Oxidative Capacity

3.4.1. Seasonal Modulation of Atmospheric Oxidation Potential

As shown in Table S8, the atmospheric oxidative capacity in Dongying exhibited significant seasonal variation. In summer, the average Ox value was the highest (167 μg·m−3), with O3 accounting for 90% and showing a very strong positive correlation with Ox (r = 0.99) due to photochemical reactions driving Ox formation. In autumn, Ox (129 μg·m−3) was still predominantly influenced by O3 (83%, r = 0.96). In winter, Ox reached its lowest value (83 μg·m−3), with a reduced contribution from O3 (75%, r = 0.65) and an increased influence from NO2 (r = 0.96). Spring served as a transitional period (Ox = 153 μg·m−3), where NO2 was the dominant factor (O3 accounted for only 34%). Although the dominance of O3 in winter was slightly weaker than in summer and autumn, it remained the primary contributing factor, while the influence of NO2 was also significant. Ox and PM2.5 showed a positive correlation across all four seasons. The strongest correlation was observed in summer (r = 0.63), followed by winter (r = 0.35). In summer, Ox mainly consisted of O3, and the highly oxidative environment promoted the formation of secondary components in PM2.5 [75,84,85]. In winter, the contribution of NO2 to Ox increased, but the photochemical reactions were weaker. The contribution of O3 to Ox was less than that in summer. High NO2 concentrations promoted the formation of nitrates through chemical reactions [86], which in turn enhanced the formation of PM2.5, thereby strengthening the correlation between PM2.5 and Ox. In spring, starting from April, polluted days with ozone as the primary pollutant began to occur in Dongying, and local photochemical reactions generated O3, leading to a simultaneous increase in both Ox and PM2.5. In autumn, NOx participated in photochemical reactions to generate O3 and also directly contributed nitrates to PM2.5 [87].
PM2.5 and O3 exhibited bidirectional interactions: atmospheric oxidation promoted PM2.5 formation, while PM2.5 accumulation attenuated O3 generation. During the summer, Ox concentrations typically exceeded 125 μg·m−3, with O3 levels ranging from 170 to 300 μg·m−3 and PM2.5 concentrations ranging from 35 to 75 μg·m−3. During summer, daily evaluated O3 values showed a significant positive correlation with daily evaluated PM2.5 values, with MDA8 O3 increases of 1 μg·m−3 corresponding to PM2.5 increases of 1.99 μg·m−3—a ratio significantly stronger than other seasons (Figure 14). High temperatures and intense radiation favored O3 formation and accumulation, increasing atmospheric oxidation that accelerated the rapid oxidation of gaseous pollutants (NOx, SO2, VOCs, etc.) into secondary particulate matter and promoted PM2.5 generation. Consequently, PM2.5 and O3 exhibited a strong positive correlation. In winter, Ox concentrations ranged from 50 to 100 μg·m−3, and a negative correlation was observed between PM2.5 and O3 (ΔPM2.5/ΔO3 = −0.19) (Figure 14). Ox had little impact on this correlation, which was mainly due to increased primary emissions [17], suppressed photochemistry [18,88], and heterogeneous reactions [87]. In spring and autumn, Ox concentrations ranged from 75 to 150 μg·m−3, with a weak positive correlation observed between PM2.5 and O3 (Figure 14). NOx and SO2 formed nitrates and sulfates through heterogeneous reactions [89,90], while local photochemical reactions produced O3. Overall, higher Ox concentrations strengthened the positive correlation between PM2.5 and O3, while lower concentrations weakened or reversed it. In high Ox environments, photochemistry generally dominated, leading to the co-generation of O3 and secondary components of PM2.5, resulting in a significant positive correlation. In low Ox environments, primary emissions prevailed, photochemical reactions were suppressed, and the NO titration effect was enhanced. These factors collectively reduced the correlation between O3 and PM2.5 or even caused a negative correlation.

3.4.2. Diurnal Variation in Oxidizing Capacity

The Ox concentrations in Dongying exhibited a clear diurnal pattern, with higher levels during the day and lower levels at night. Summer showed the most significant variation, while winter showed the least (Figure S9). In spring, Ox concentrations were lowest between 5:00 and 7:00 (approximately 90 μg·m−3), then gradually increased, peaking between 16:00 and 18:00 (around 140 μg·m−3). During summer, Ox concentrations were relatively low between 5:00 and 7:00 (around 80 μg·m−3), reaching their highest values between 14:00 and 16:00, exceeding 160 μg·m−3. In autumn, the Ox concentration was lower between 5:00 and 7:00 (approximately 80 μg·m−3), with a peak occurring between 14:00 and 16:00 (around 120 μg·m−3). In winter, concentrations were lowest between 5:00 and 7:00 (about 70 μg·m−3), reaching a peak between 16:00 and 18:00 (around 90 μg·m−3).
Ox-PM2.5 correlations were significantly negative during both diurnal and nocturnal periods in spring and autumn. Summer correlations were weaker, whereas winter showed moderate negative relationships (Figure 15a,b). Spring daytime Ox-PM2.5 correlations (r = −0.59) were slightly stronger than nighttime (r = −0.56), with weak diurnal-nocturnal covariation (r = 0.05). Summer daytime correlations (r = −0.55) were stronger than nighttime (r = −0.45). Winter diurnal and nocturnal correlations were both −0.40, indicating moderate negative trends.

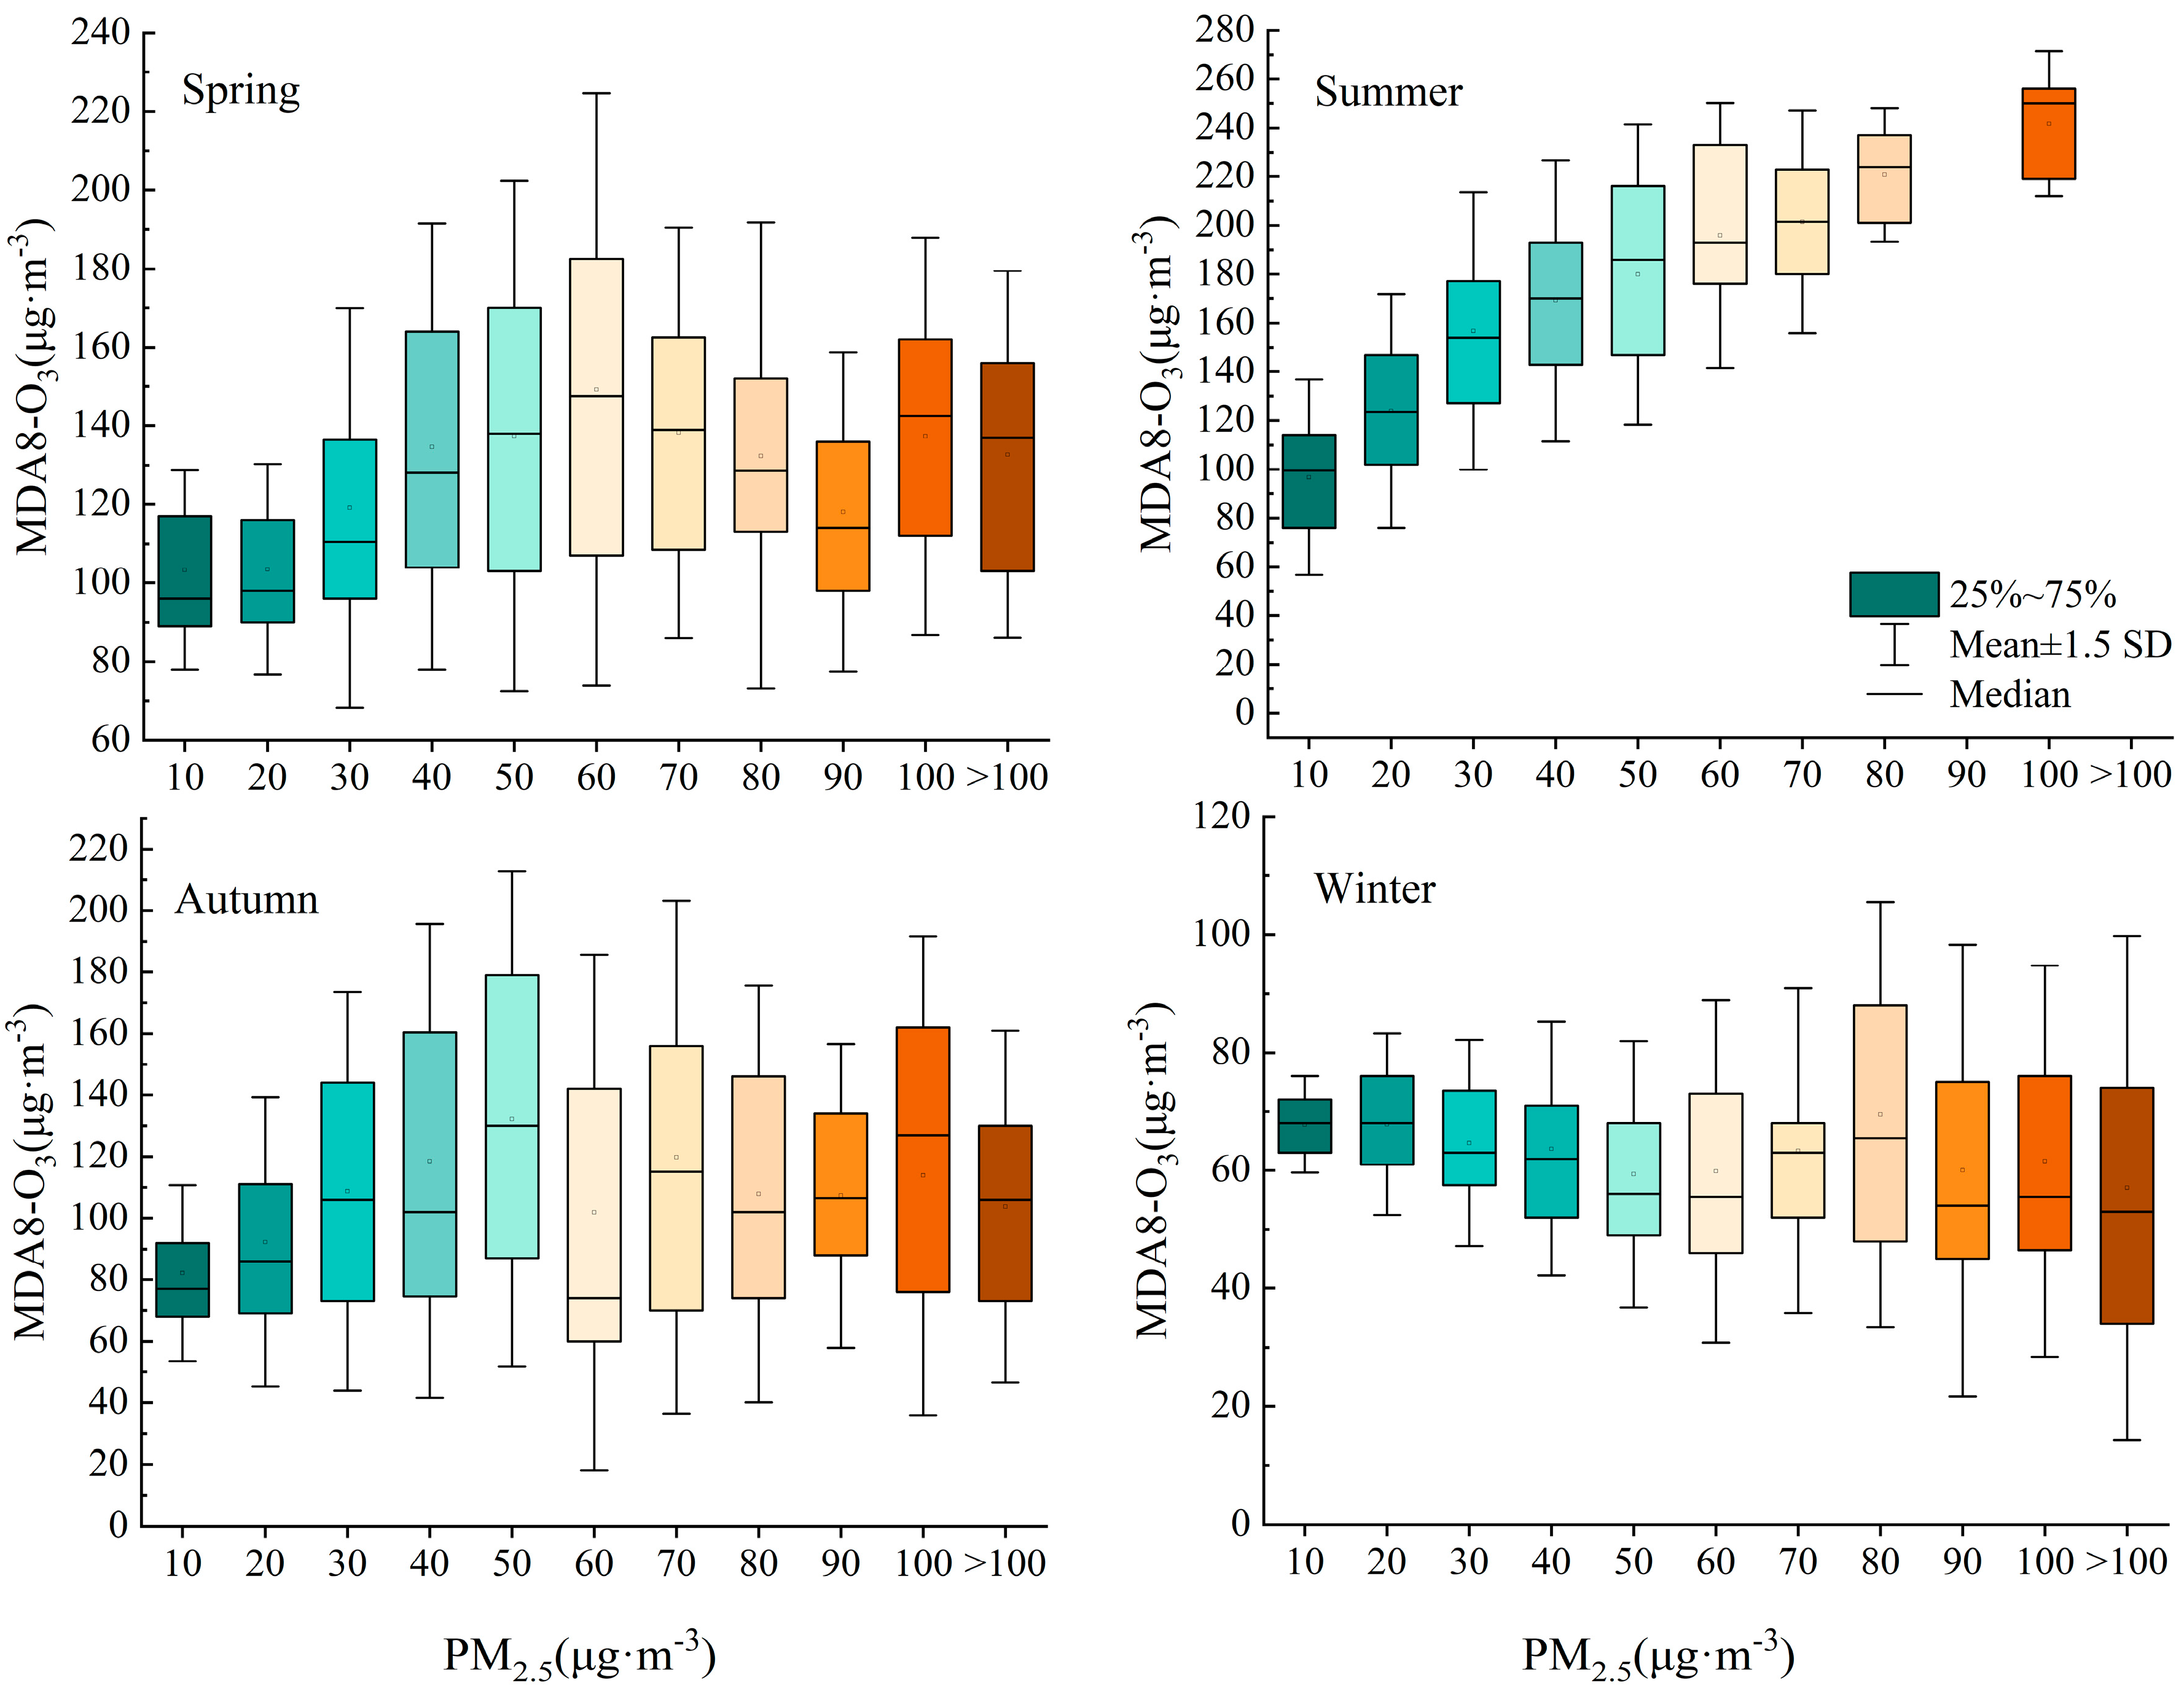
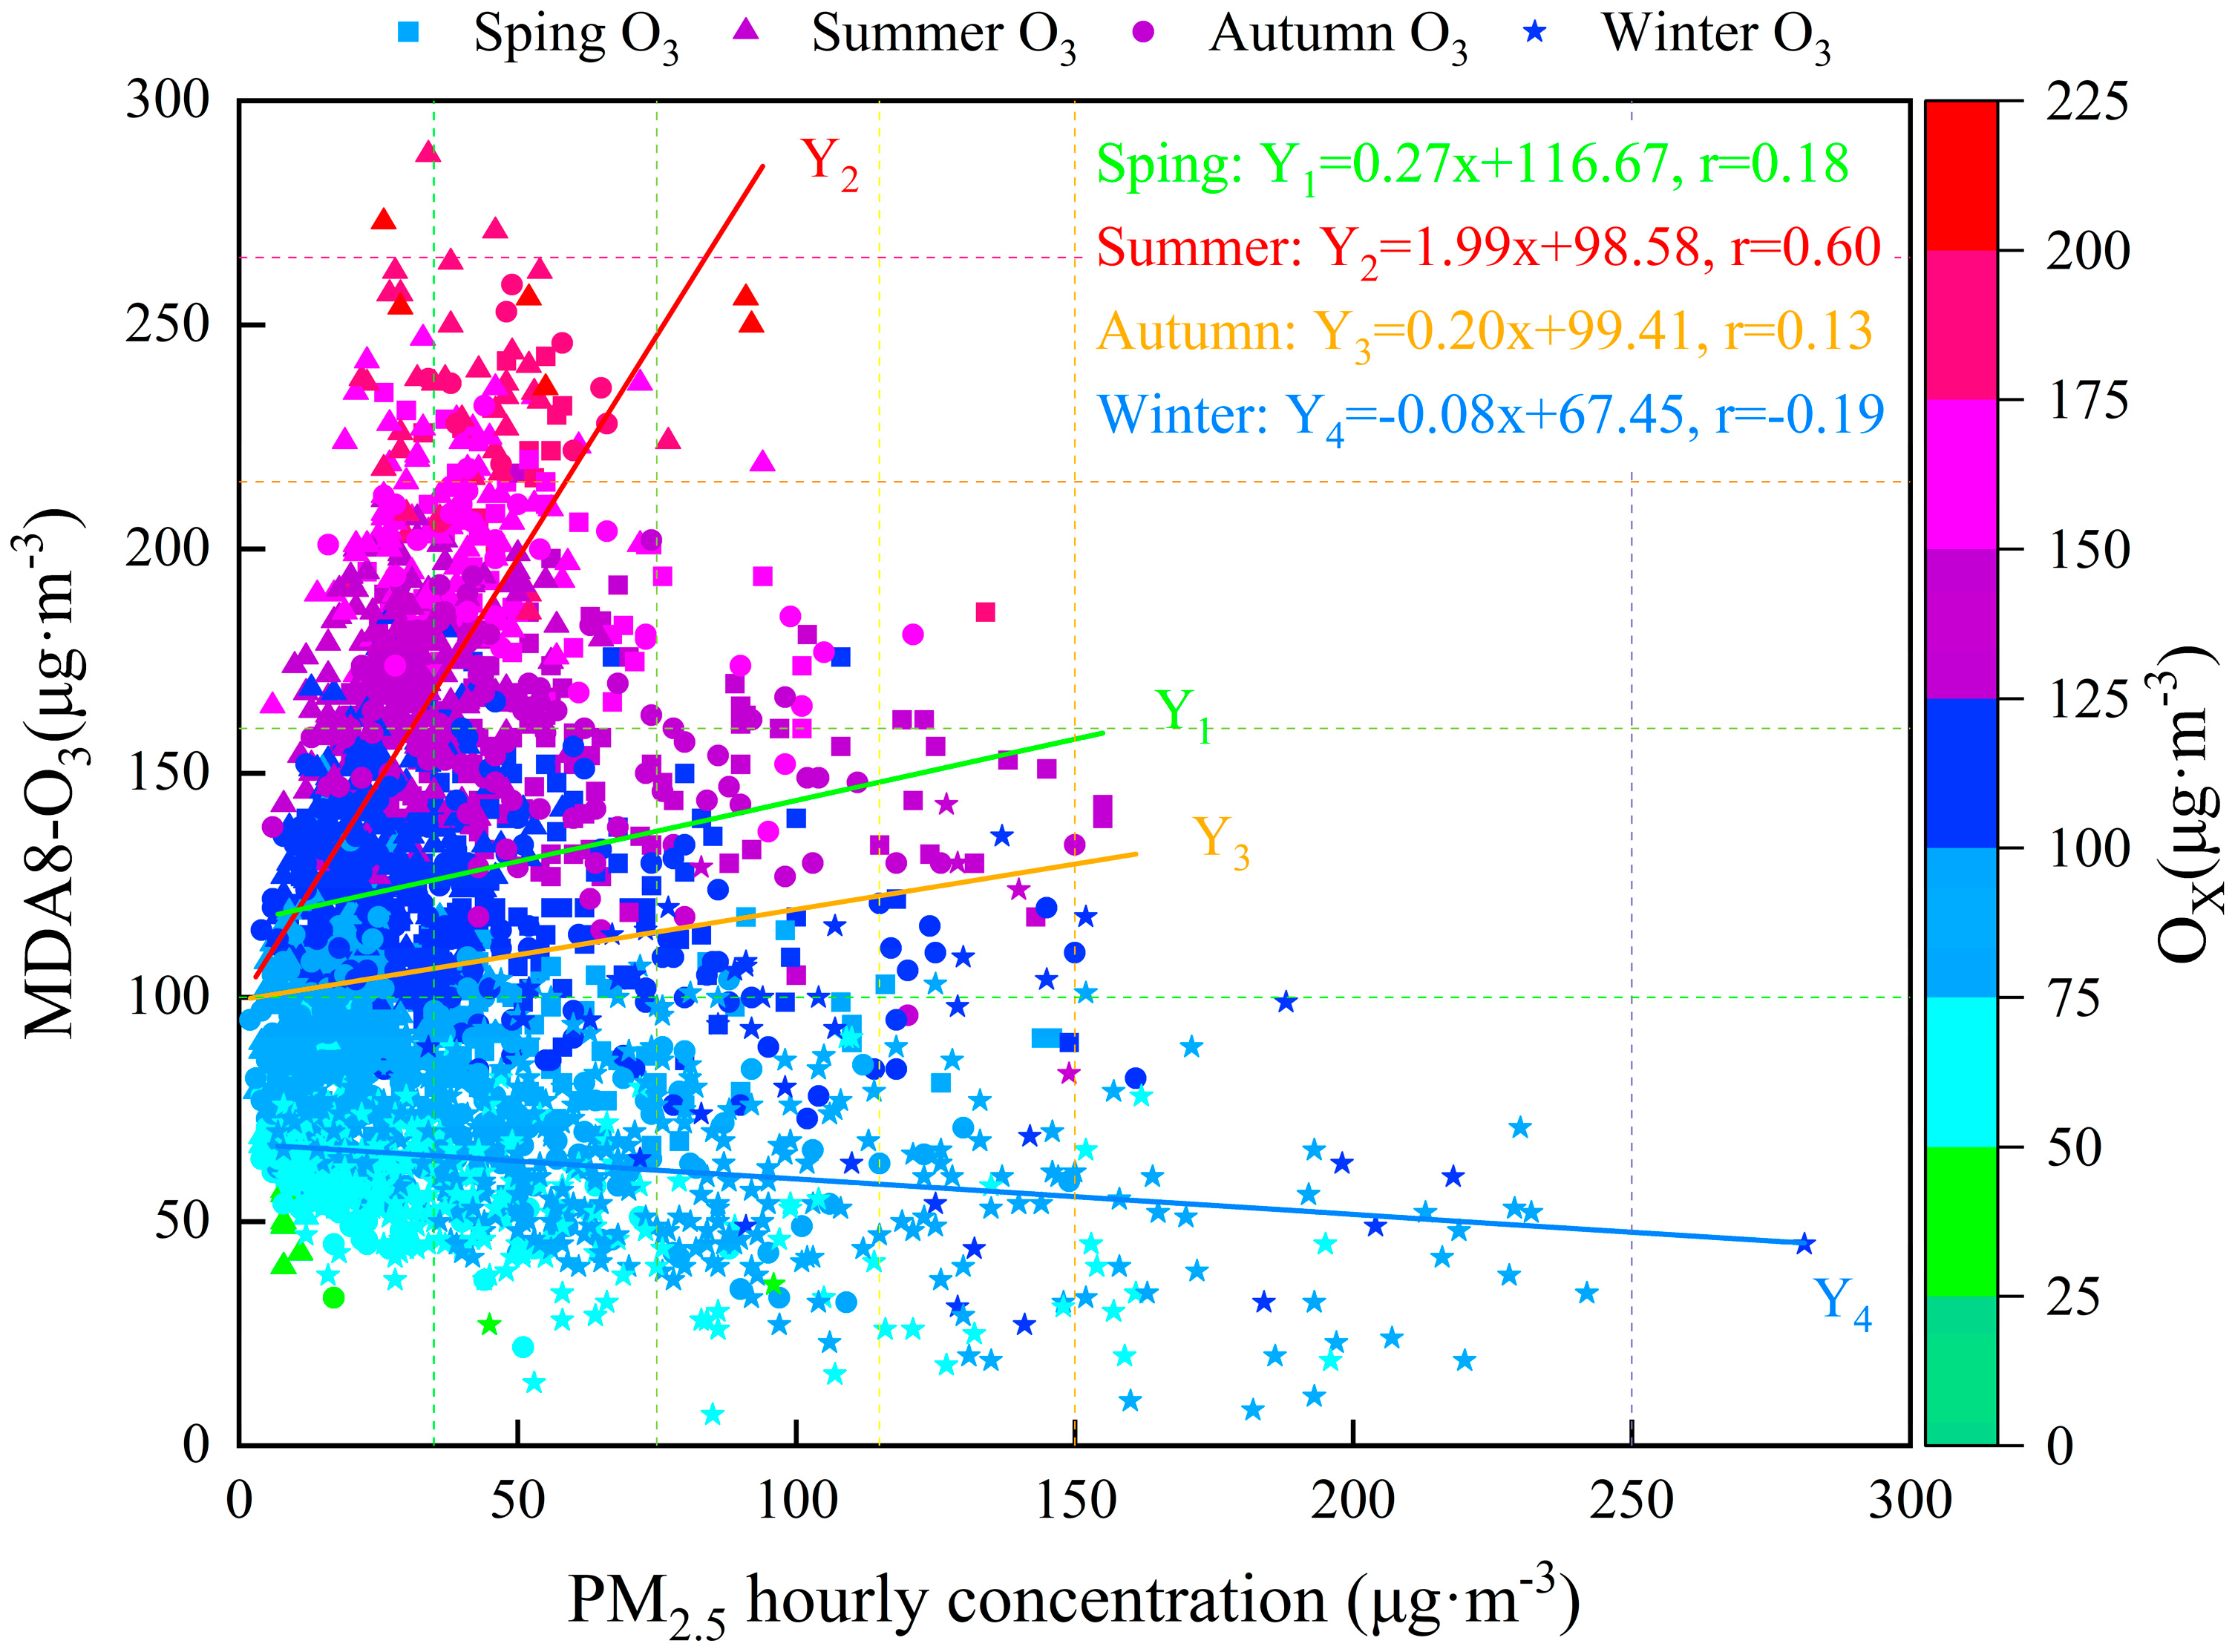
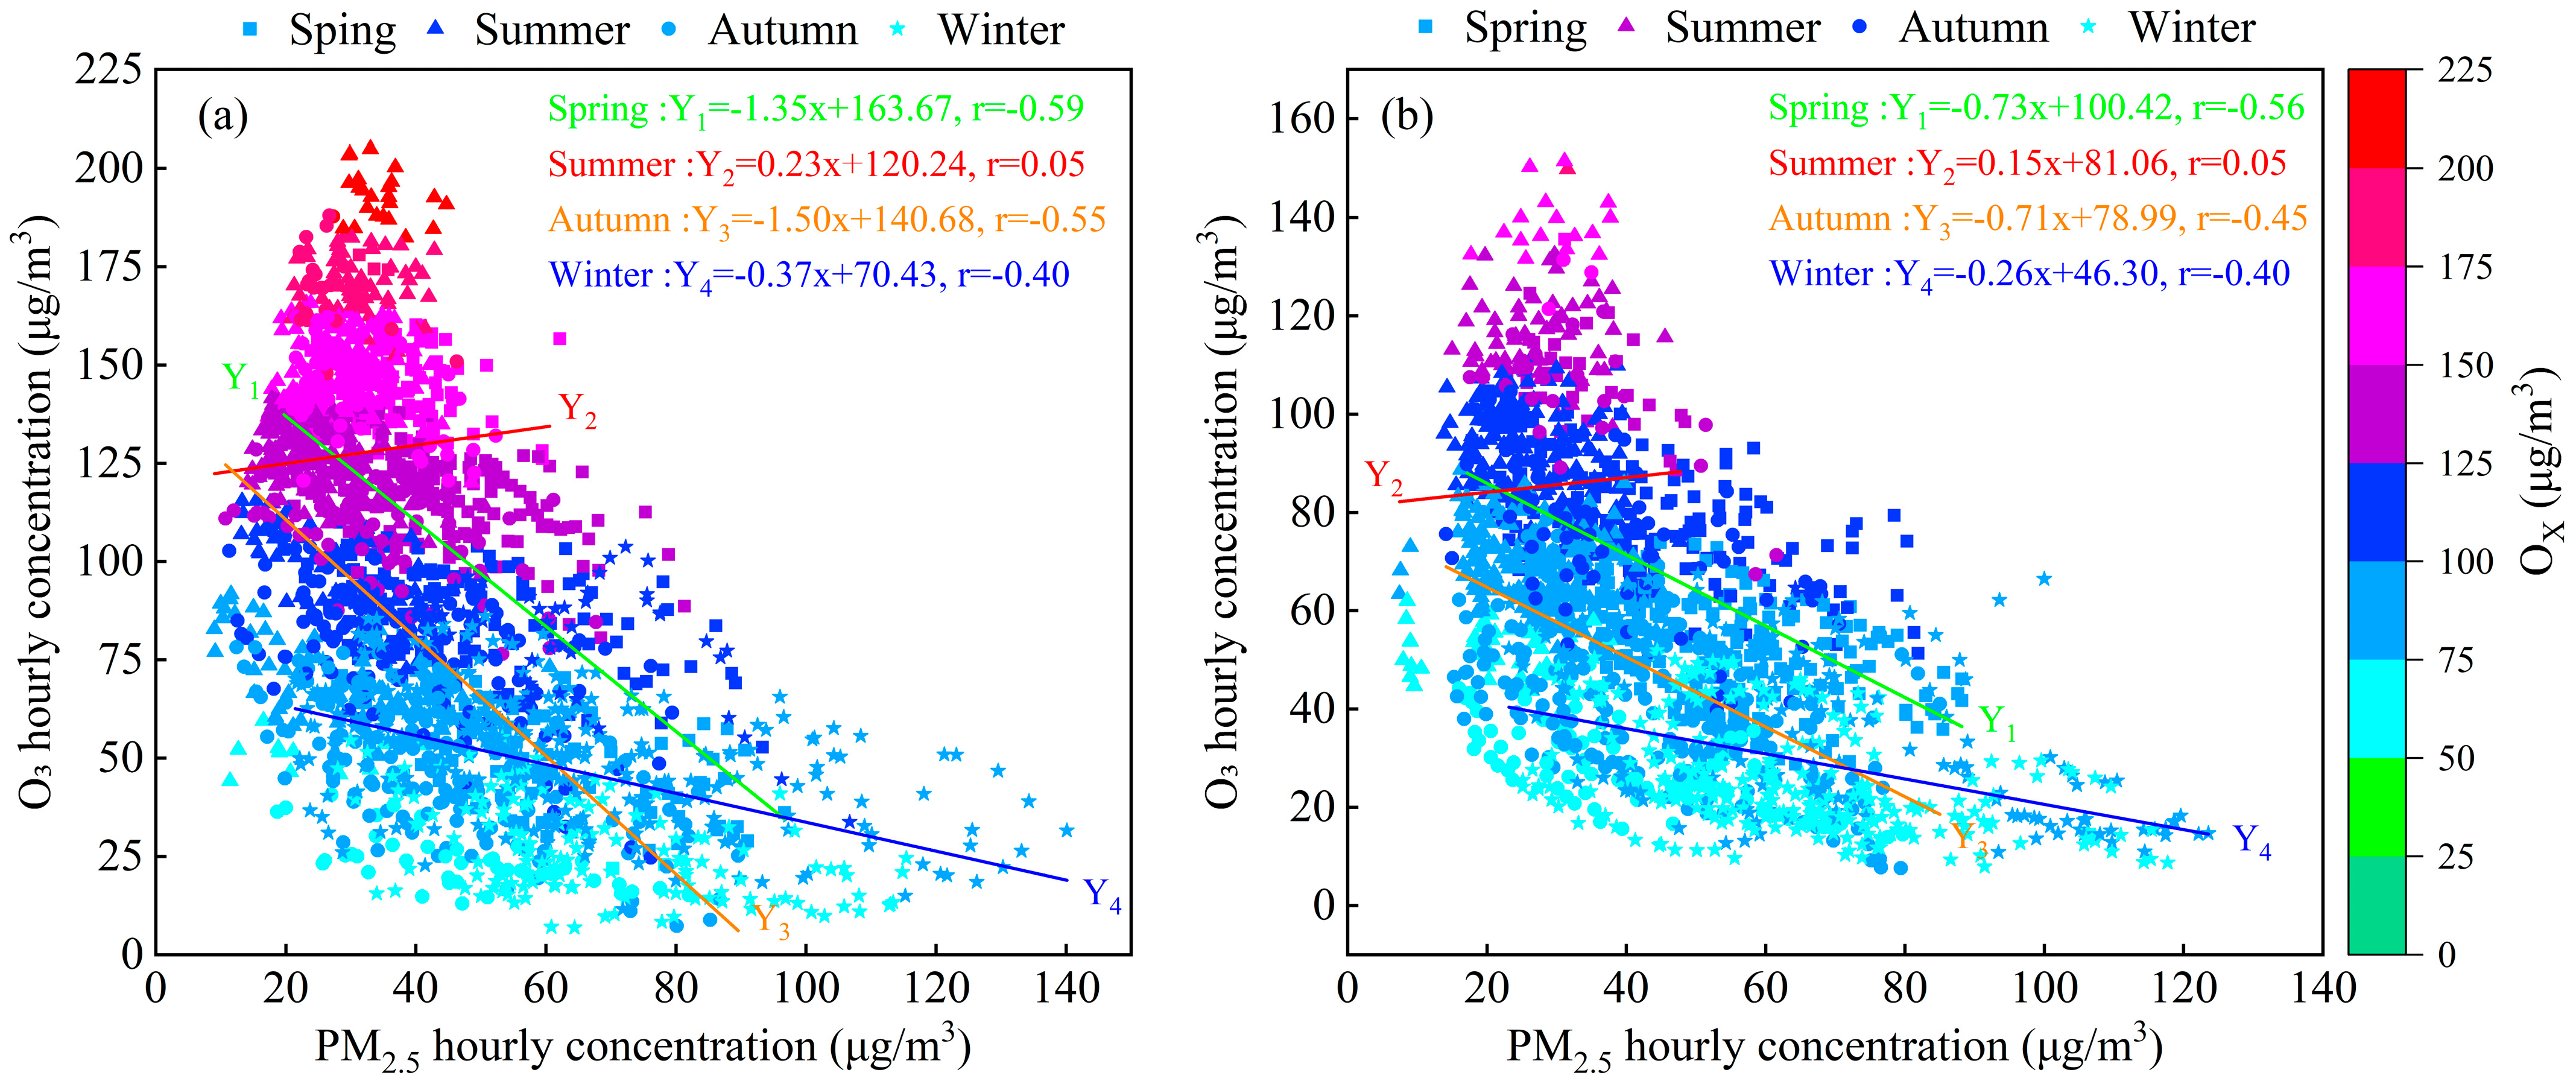
3.5. Concentration-Dependent Effects of PM2.5 and O3

The PM2.5 daily mean concentration was divided into three categories: PM2.5 ≤ 35 μg·m−3, 35 μg·m−3 < PM2.5 ≤ 75 μg·m−3, and PM2.5 > 75 μg·m−3. When PM2.5 ≤ 35 μg·m−3, PM2.5 and O3 showed a positive correlation in spring, summer, and autumn, with the strongest correlation in summer (r = 0.57), while in winter, the correlation was negative. When PM2.5 concentrations ranged between 35 and 75 μg·m−3, the correlation between PM2.5 and O3 was positive in spring, summer, and winter, and weakly negative in autumn. When PM2.5 > 75 μg·m−3, the correlation between PM2.5 and O3 in summer was positive (r = 0.33), although the results were uncertain due to limited data, while in winter it showed a negative correlation (r = −0.20), and in spring and autumn, the correlation between PM2.5 and O3 was poor (Figure 8 and Figure 16a,b,e,f). Aerosols at appropriate concentrations (PM2.5 ≤ 35 μg·m−3) promoted O3 formation by enhancing solar radiation through scattering effects, thereby increasing radiation flux and intensity within the boundary layer. A moderate increase in aerosol concentration also enhanced the photolysis rate of NOx, further promoting O3 production [68].
The O3 daily evaluation values were divided into three intervals: O3 ≤ 100 μg·m−3, 100 μg·m−3 < O3 ≤ 160 μg·m−3, and O3 > 160 μg·m−3. When O3 ≤ 100 μg·m−3, summer and winter showed good PM2.5–O3 correlations. In summer, PM2.5 and O3 showed a positive correlation (r = 0.31), in winter, they showed a negative correlation (r = −0.32), with spring and autumn exhibiting weaker correlations. When 100 μg·m−3 < O3 ≤ 160 μg·m−3, all four seasons exhibited synergistic PM2.5–O3 effects, with winter showing the strongest correlation (r = 0.40) followed by spring and autumn (both r = 0.24). When O3 > 160 μg·m−3, summer displayed a positive correlation between PM2.5 and O3 (r = 0.37), while in spring and autumn, the correlation was weakly negative (Figure 8 and Figure 16c,d,g,h).

3.6. Chemical Speciation Effects of PM2.5

In the spring and summer, elevated O3 concentrations (>160 μg·m−3) significantly enhanced atmospheric oxidizing capacity, driving the formation of secondary PM2.5. Its concentration responded positively to O3 levels, with the secondary PM2.5 fraction increasing by 12.7% for every 40 μg·m−3 increase in MAD8 O3 during the summer (Figure 17a,b). In the autumn, a decrease in atmospheric oxidizing capacity led to a sharp reduction in secondary PM2.5 contribution, with the high O3 group in autumn accounting for only 12.9% (Figure 17c). During winter, primary PM2.5 dominated across all O3 concentrations. As O3 concentrations rose in spring and summer, atmospheric oxidizing capacity increased, enhancing photochemical reactions that promoted secondary aerosol formation.
The four typical episodes showed a weak positive correlation between PM2.5 and O3 in spring (r = 0.01), a significant positive correlation in summer (r = 0.42), a strong positive correlation in autumn (r = 0.99), and a significant negative correlation in winter (r = −0.57) (Figure 18a).
In spring, the correlation between PM2.5 and O3 was the weakest, with O3 showing a positive correlation with NH4⁺, OC, and EC, while a negative correlation was observed with NO3 and SOC (Figure 18b,c, Table S9). This might be due to the dust input from Dongying, which carried SO42− and NH4⁺, along with the early-phase photochemical reaction where NOx consumption inhibited NO3 formation [91,92] (Table S9). The differentiation of secondary components ultimately led to a weak correlation between PM2.5 and O3 in spring. In summer, the significant positive correlation between PM2.5 and O3 was due to the synergistic effects of shared precursors, with SO42−, OC, SOC, and O3 all showing positive correlations (Figure 18b,c, Table S9). Under high temperature and strong sunlight, secondary components like SO42− and SOC shared precursors, such as SO2, VOCs, and NOx, with O3, leading to coordinated growth. Additionally, NH4NO3 was more volatile and decomposed under high temperatures, with some NOx preferentially participating in O3 formation pathways, resulting in a negative correlation between NO3, NH4⁺, and O3. Photochemical reactions simultaneously drove both O3 generation and the increase of PM2.5 secondary components, strengthening their positive correlation.
In autumn, PM2.5 and O3 were strongly positively correlated, mainly due to the dominant contribution of secondary transformation to PM2.5. Secondary components (SO42−, NO3, NH4⁺, SNA, and SOC) showed a strong positive correlation with O3 (r > 0.70) (Figure 18b,c, Table S9). The formation of secondary inorganic components, like SNA, in autumn depended on precursors such as NOx and SO2 [86]. The strong positive correlation between these components and O3 was driven by high radiation, high temperatures, and unstable atmospheric conditions, which synergistically promoted VOCs and NOx photochemical reactions. HOx radicals enhanced atmospheric oxidation [93], leading to O3 generation and the oxidation of SNA and SOC, causing a coordinated increase in PM2.5 and O3. As a result, autumn was prone to PM2.5 and O3 complex pollution. In winter, PM2.5 and O3 exhibited a significant negative correlation, with secondary components negatively correlated with O3, while PM2.5-sec overall had a positive correlation with O3 (Figure 18b–d, Table S9). Winter PM2.5 concentrations were primarily driven by primary emissions, with coal burning and biomass combustion releasing large amounts of primary OC and EC [87], which suppressed photochemical reactions (due to low temperatures and low radiation), leading to reduced O3 formation. Low temperatures inhibited the volatility of ammonium nitrate and SOC, while stable meteorological conditions promoted heterogeneous reactions (such as N2O5 hydrolysis generating NO3). Only a small amount of secondary components (such as PM2.5-sec) accumulated in stable weather, showing a weak positive correlation with O3. Other studies have similarly found that, during winter haze in northeastern regions, OC and SNA contributed significantly to PM2.5, with their combined contribution accounting for more than 50% of the PM2.5 [88,92].
Overall, in spring, the input of dust (SO42−/NH4⁺) and the consumption of NOx in the initial stage of photochemical reactions led to the differentiation of secondary components, weakening PM2.5–O3 correlation. In summer, common precursors (VOCs/NOx), boosted by high temperatures and sunlight, jointly promoted O3 and secondary components formation, strengthening PM2.5 and O3 positive correlation. In autumn, secondary transformation of SNA/SOC under high oxidation conditions maximized the positive correlation, increasing compound pollution risk. In winter, primary emissions of OC and EC dominated PM2.5, low temperature inhibited photochemistry resulting in decreased O3, which led to a significant negative correlation between PM2.5 and O3.

3.7. Influence of Precursor Concentration Gradients

Between 2017 and 2023, O3 in Dongying exhibited a significant negative correlation with other pollutants, while PM2.5 showed a positive correlation with all pollutants except for O3 (Figure S10a). The daily variations in pollutant concentrations were distinct (Figure S10b–f). At night, the PM2.5–O3 correlation was low. During the day, with increased solar radiation and human activities, O3 concentrations rose, accelerating the oxidation of gaseous pollutants and particulate matter formation, leading to an increase in PM2.5 concentrations and strengthening the PM2.5–O3 correlation, particularly in the afternoon [28]. NO2, PM10, PM2.5, and SO2 exhibited higher concentrations during the morning and evening peak hours, which were associated with traffic emissions and the influence of temperature inversions [90]. O3 concentrations showed a clear upward trend during the night, which may be related to the increased atmospheric oxidation capacity [94].
When PM2.5 levels were ≤35 μg·m−3, PM2.5 and O3 exhibited a positive correlation in spring, summer, and autumn, with the strongest correlation observed in the summer. At this time, PM2.5 and O3 were positively correlated with NO2, and weakly correlated with VOCs, indicating that, when PM2.5 ≤ 35 μg·m−3, the PM2.5–O3 correlation was significantly influenced by NO2. This finding was similar to the case when O3 > 160 μg·m−3 in summer (Figure 19). In the summer, high temperatures and strong radiation accelerated the photolysis of NO2, promoting O3 formation. At the same time, the conversion of NOx led to an increase in PM2.5 concentrations (NOx + OH → HNO3 → reacts with NH3 to form NH4NO3) [95]. The low aerosol concentration weakened the atmospheric extinction effect, enhancing surface ultraviolet radiation and forming a positive feedback loop between NO2 photolysis and O3 generation. If the city was located in a VOC-sensitive area, high temperatures promoted the release of VOCs, but were insufficient to consume the excess NOx. In this case, an increase in NOx concentration directly enhanced the rate of O3 and nitrate formation, leading to a simultaneous rise in both PM2.5 and O3 levels [96]. Under conditions of high O3 concentrations (O3 > 160 μg·m−3), the photochemical reactions were already intense. NO2 continued to supply O3 through photolysis, enhancing atmospheric oxidative capacity and further promoting the secondary formation of PM2.5. Therefore, under conditions of excess NOx, the PM2.5–O3 correlation mainly depended on NO2 concentrations. In winter, PM2.5 and O3 exhibited a negative correlation. At this time, PM2.5 was positively correlated with NO2 and VOCs, while O3 was negatively correlated with NO2. This suggested that the PM2.5–O3 correlation was influenced by common precursors, NO2 and VOCs, and this result was similar to the case when PM2.5 > 75 μg·m−3 in winter (Figure 19).
When PM2.5 levels exceeded 75 μg·m−3, PM2.5 and O3 showed a negative correlation in winter. During this period, PM2.5 showed a positive correlation with NO2 and VOCs, while O3 was negatively correlated with NO2 and VOCs. This indicated that, when PM2.5 exceeded 75 μg·m−3, the relationship between PM2.5 and O3 was primarily influenced by NO2 and VOCs. This result was consistent with the findings in spring, autumn, and winter when O3 levels were ≤ 100 μg·m−3 (Figure 19). Heterogeneous chemistry reduced ozone concentrations by absorbing NOx and hydroxyl radicals [97]. Under conditions of low temperature, high humidity, and excessive NOx, VOCs reacted with NOx free radicals to form low-volatility organic compounds (e.g., RO2 → RONO2) [98,99]. These reaction pathways were generally more conducive to SOA formation than reactions with O3 [98,100], which led to an increase in PM2.5 levels and consumed O3 precursors. It was important to note that emission reduction measures had a dual effect. Shao et al. [97] found that, from 2006 to 2016, the decrease in PM2.5 levels in Beijing resulted in a 37% increase in ozone formation. Li et al. [101] found that emission reductions alleviated the suppressive effect of aerosol-radiation interactions on meteorological fields and photolysis rates. Model simulations showed that, in the absence of aerosol feedback effects, emission reductions alone would lead to a decrease of 22.89 μg·m−3 in PM2.5 levels and an increase of 5.43 ppb in O3 levels.
During a typical autumn pollution event, PM2.5 and O3 showed a strong positive correlation (r = 0.99) with the concentrations of related pollutants, with highly synchronized fluctuations and significant overlap in peak-to-valley periods (Figure 20). Between 25 and 28 October, both reached their peaks at around 9:00 a.m. and dropped to their lowest values at around 4:00 p.m. On October 29, two peaks were observed (at 11:00 a.m. and 8:00 p.m.) along with a valley at 3:00 p.m. On 31 October, the concentration peaked at midnight, reached its highest point, and then decreased gradually after forming a secondary peak at 11:00 a.m. Pollution continued to fluctuate thereafter, with another peak observed at 4:00 a.m. on 4 and 5 November, while the concentration dropped to a valley at 4:00 p.m. on 3 and 4 November. The concentration changes in common precursor substances, such as NO2 and non-methane hydrocarbons (NMHC), were highly synchronized with the concentration changes in PM2.5 and O3. The trends in NO2 and NMHC concentrations closely matched the variations in PM2.5 and O3, and correlation analysis revealed a positive relationship between PM2.5 and O3 with NO2 (rO3-NO2 = 0.38, rPM2.5-NO2 = 0.39), and between PM2.5 and O3 with NMHC (rO3-NMHC = 0.50, rPM2.5-NMHC = 0.51). NMHC, as a key component of VOCs, along with VOCs and NO2, were crucial precursors in photochemical reactions. These substances not only contributed to the formation of O3 through photochemistry but also reacted with substances like NH3 to form SNA and SOC, which further elevated PM2.5 concentrations [89,102]. Therefore, the increase in NOx and NMHC concentrations during this pollution event may have been a key factor contributing to the high correlation between PM2.5 and O3.

3.8. Random Forest-Based Importance Analysis of PM2.5 and O3 Drivers

Using the random forest algorithm in machine learning, it was found that Ox, T, and NO2 had significant effects on O3 concentration, with RH also being important in summer (Figure 21a). In spring, Ox had the most significant impact on O3 concentration, accounting for 51%, followed by T at 16% and NO2 at 14%. In summer, Ox had the highest importance (57%), with RH (17%) and T also being significant (15%). In autumn, Ox held the highest importance (43%), followed by T at 19%, and NO2 also played a significant role (17%). In winter, NO2 had the highest importance (37%), followed by Ox (24%). CO (8%), PM2.5 (6%), T (6%), and RH (6%) were also important in winter. PM10 had the greatest impact on PM2.5 concentrations across all seasons (Spring: 51%, Summer: 46%, Autumn: 43%, Winter: 44%). Following PM10, CO played a significant role (Spring: 17%, Summer: 27%, Autumn: 28%, Winter: 26%). NO2 also significantly affected PM2.5 concentrations (Spring: 8%, Summer: 6%, Autumn: 9%, Winter: 10%). The impacts of SO2, RH, and Ox should also be considered (Figure 21b).
The study’s mechanism diagram appeared in Figure 22. In summer, PM2.5 and O3 showed positive correlations driven by Ox, RH, and temperature through photochemical pathways. Under hot-humid conditions (T > 20 °C, RH > 60%) with Ox > 125 μg·m−3, the PM2.5–O3 correlation reached maximal strength. Conversely, in winter, PM2.5 and O3 showed negative correlations due to primary emissions and NO2 titration, maintaining negative relationships across all PM2.5 levels, while PM2.5-NO2 correlations remained positive and O3-NO2 correlations negative. Spring and autumn represented transitional states. In spring, PM2.5 and O3 weak positive correlations (r = 0.18) stemmed from dust inputs and intermittent photochemistry, particularly when T > 15 °C and RH < 30%, which enhanced the PM2.5–O3 correlation. In autumn, due to Ox decay and lower temperatures, NO2 drove a positive correlations with PM2.5 and O3 at low PM2.5 levels (≤35 μg·m−3).

4. Conclusions

(1) From 2017 to 2023, Dongying’s annual evaluation values of PM2.5 decreased by 36% (from 55 to 35 μg·m−3), maintaining a spatial pattern of higher south-eastern and lower north-western concentrations. In contrast, the annual evaluation values of O3 fluctuated upward (from 176 to 186 μg·m−3), with higher north-central-eastern and lower western concentrations. During the PM2.5 pollution season (December–February), daytime and nighttime concentrations decreased by 23 and 24 μg·m−3, respectively, from 2017 levels while, in the O3 pollution season (April–September), diurnal concentrations rose, with a 17 μg·m−3 nighttime increase surpassing the 11 μg·m−3 daytime rise. Between 2017 and 2023, there were 23 days of PM2.5 and O3 complex pollution, primarily in March, April, and October.
(2) From 2017–2023, the PM2.5–O3 correlation reached its maximum positive strength in summer (r = 0.60), showed negativity in winter (r = −0.19), and demonstrated weak positivity in spring (r = 0.18) and autumn (r = 0.13). Spatially, PM2.5 and O3 exhibited strong positive correlations in western areas, contrasting with weak negative trends in northern and eastern regions. In summer, the strongest positive correlation between PM2.5 and O3 occurred when PM2.5 ≤ 35 μg·m−3 and 160 μg·m−3 < O3 ≤ 200 μg·m−3, but high PM2.5 levels (>60 μg·m−3) weakened the O3 formation rate. In winter, the strongest negative correlation emerged at 115 μg·m−3 < PM2.5 ≤ 200 μg·m−3 and O3 ≤ 100 μg·m−3. In spring, significant positive correlation was found at PM2.5 ≤ 35 μg·m−3 and 100 μg·m−3 < O3 ≤ 160 μg·m−3 but weakened as their concentrations rose. In autumn, a significant positive correlation was observed when PM2.5 ≤ 35 μg·m−3 and 200 μg·m−3 < O3.
(3) The mean pressure field enhanced the positive correlation of PM2.5 and O3, while the high-pressure field weakened it. Yet in summer, the high-pressure field had a more pronounced enhancement effect on their positive correlation. The positive correlation between PM2.5 and O3 emerged at temperatures 20 °C, strongest between 20 and 25 °C, while temperatures < 5 °C induced negative correlations. At high humidity (>60%), PM2.5 and O3 had a negative correlation, while at low humidity (<30%), PM2.5 and O3 showed a positive correlation. Average daily wind speeds of 1.73 m/s facilitated concurrent PM2.5–O3 increases. In summer, due to stronger atmospheric oxidation (Ox > 125 μg·m−3), PM2.5 and O3 exhibited the strongest positive correlation (r = 0.60); in winter, with weaker atmospheric oxidation (Ox < 100 μg·m−3), PM2.5 and O3 showed a negative correlation (r = −0.19). During sea–land breeze periods, the negative correlation between PM2.5 and O3 was generally weaker than during non-sea–land breeze periods, with the largest reduction in spring.
(4) When PM2.5 ≤ 35 μg·m−3 and O3 > 160 μg·m−3, PM2.5 and O3 showed a strong positive correlation in summer, with NO2 affecting their relationship, and in spring and autumn, it was a weak positive correlation, influenced by common NO2 and VOCs. When PM2.5 > 75 μg·m−3 and O3 ≤ 100 μg·m−3, PM2.5 and O3 had a significant negative correlation in winter, influenced by common NO2 and VOCs. The correlation coefficients of the four typical pollution episodes in spring, summer, autumn and winter were 0.01, 0.42, 0.99 and −0.57 respectively. The positive correlation in summer was driven by synchronous increases in O3 and secondary components via shared precursors (SO2, VOCs, NOx). In autumn, strong positivity resulted from secondary component–O3 correlations (r > 0.7) and dominance of secondary formation in PM2.5; in winter, the negative correlation was a result of primary emissions inhibiting photochemical reactions. y. The random forest results indicated that in summer, Ox, RH, and temperature drove a positive correlation between PM2.5 and O3 through photochemical reactions. In winter, primary emissions and NO2 titration led to a negative correlation between PM2.5 and O3.
(5) Dongying should focus on PM2.5–O3 complex pollution in spring and autumn by strengthening collaborative emission reductions in western regions. In summer, under high-temperature and low humidity conditions with low PM2.5 (≤35 μg·m−3) but excessive O3, NOx emissions should be prioritized for reduction to prevent moderate-severe O3 pollution and high hourly PM2.5 values. In autumn, when PM2.5 > 35 μg·m−3 and O3 > 160 μg·m−3, precise VOCs-NOx controls should be implemented, focusing on highly reactive VOCs, like alkenes and aromatic hydrocarbons, to avoid PM2.5–O3 complex pollution. In winter, during cold and humid periods with high PM2.5 (>75 μg·m−3), coordinated reduction of VOCs and NOx should be enhanced to avoid moderate-severe PM2.5 pollution.
This study’s innovation lies in overcoming the limitations of single-factor analysis by exploring the causes of the PM2.5–O3 correlation from meteorological, emission (common precursor), and chemical multi-factor perspectives. It also discusses the impact of sea–land breeze circulation on this correlation. Based on PM2.5 and O3 pollution intensity levels, the study proposes seasonal control measures for PM2.5–O3 complex pollution. However, this study had several limitations. (1) The analysis of the causes of the PM2.5–O3 correlation was based solely on observational data and statistical methods, with conclusions regarding the mechanisms of this correlation derived primarily from literature, without quantitative analysis using Observation-Based Model or Three-Dimensional Air Quality Model. (2) The correlation between PM2.5 and O3 at different concentration levels across seasons was not fully quantified. (3) The random forest algorithm struggled to capture the non-linear relationship between PM2.5 and O3 concentrations and could not explain the physical or chemical mechanisms behind the joint influence of multiple factors on their concentration variations. For future research, three improvements are planned: first, refining the concentration gradients of PM2.5 and O3 based on seasonal characteristics; second, using model simulations to examine the contributions of meteorological conditions, atmospheric oxidizing capacity, and precursor substances to the concentrations of PM2.5 and O3, and further analyzing the quantitative impacts of these factors on their correlation; third, combine random forest with other algorithms to better capture complex non-linear relationships. On this basis, precise emission reduction strategies will be proposed for PM2.5 and ozone complex pollution in petrochemical cities in the Bay region, with a focus on zoning, seasonality, and source-based approaches.

Supplementary Materials

The following supporting information can be downloaded at: https://www.mdpi.com/article/10.3390/atmos16050512/s1, Text S1. Methodology; Text S2. Case Study of Wintertime PM2.5 Pollution Episode; Text S3. Case Study of Summertime O3 Pollution Episode; Text S4. Autumn PM2.5 and O3 Complex pollution Characteristics; Text S5. Spring PM2.5 and O3 Complex pollution Characteristics; Table S1. Distribution of PM2.5 and O3 concentration in four seasons in Dongying; Table S2. Meteorological five elements micro weather station measurement parameters table; Table S3. Meteorological five elements micro weather station measurement parameters table; Table S4. Statistical table of polluted days in Dongying from 2017 to 2023; Table S5. Selection of four typical cases from 2021 to 2022; Table S6. Distribution of PM2.5 and O3 concentration in four seasons in Dongying; Table S7. Nine types and main characteristics of the sea level pressure field and 10 m wind field in Dongying from 2017 to 2022; Table S8. Seasonal variations in atmospheric oxidation levels in Dongying during 2017–2023; Table S9. Correlation legend for pollutant concentrations and O3 in typical pollution episodes in Dongying; Table S10. Seasonal distribution of days with different PM2.5 and O3 concentration gradients from May 2021 to December 2023 (Days); Figure S1. Annual statistics of primary pollutant days in Dongying from 2017 to 2023; Figure S2. Monthly distribution of different types of polluted days in Dongying from 2017 to 2023; Figure S3. Changes of conventional pollutants and meteorological elements in Dongying Atmospheric Superstation from 23 December 2021–4 January 2022; Figure S4. Changes of conventional pollutants and meteorological elements at Dongying Atmospheric Superstation from 7–22 June 2022; Figure S5. Variation of conventional pollutants and meteorological elements at Dongying atmospheric superstation from 23 October–5 November 2021; Figure S6. Changes of conventional pollutants and meteorological elements at Dongying atmospheric superstation from 16–26 April 2021; Figure S7. Annual variations in the correlation between daily values of PM2.5 and O3 in Dongying during 2017–2023. Figure S8. Classification of sea level pressure field and 10 m wind field from 2017–2022; Figure S9. Diurnal and seasonal variations in the concentration of OX in Dongying during 2017–2023. Figure S10. Concentration variations of conventional pollutants in Dongying during 2017–2023: (a) monthly variation, (b) daily variation, and (c–f) daily variations in different seasons.

Author Contributions

Conceptualization, H.L.; Formal analysis, Y.Y. and Y.J.; Funding acquisition, F.S. and J.L.; Methodology, R.G., Y.R. and F.B.; Software, Y.N., Y.Y. and W.C.; Writing—original draft, Y.N. and W.C., Writing—review and editing, Y.N. All authors have read and agreed to the published version of the manuscript.

Funding

This work was supported by the Ministry of Ecology and Environment of China under the project (DQGG202121) and the Dongying Ecological and Environmental Bureau (2021DFKY-0779).

Institutional Review Board Statement

Not applicable.

Informed Consent Statement

Informed consent was obtained from all subjects involved in the study.

Data Availability Statement

The data presented in this study are available on request from the corresponding author. The data are not publicly available due to privacy.

Conflicts of Interest

The paper reflects the views of the scientists, and not the company. The remaining authors declare that the research was conducted in the absence of any commercial or financial relationships that could be construed as potential conflicts of interest.

References

  1. Deng, C.; Tian, S.; Li, Z.; Li, K. Spatiotemporal Characteristics of PM2.5 and Ozone Concentrations in Chinese Urban Clusters. Chemosphere 2022, 295, 133813. [Google Scholar] [CrossRef] [PubMed]
  2. Xiao, X.N.; Yan, M.Z.; Lu, V.; Jia, H.Y.; Hang, M.; Qian, W.; Song, H.; Chao, H. Spatiotemporal Evolution Characteristics of PM2.5-O3 Compound Pollution in Chinese Cities from 2015 to 2020. Huanjing Kexue 2023, 44, 1830–1840. [Google Scholar]
  3. Duan, W.J.; Wang, X.Q.; Cheng, S.Y.; Wang, R.P. Regional Division and Influencing Mechanisms for the Collaborative Control of PM2.5 and O3 in China: A Joint Application of Multiple Mathematic Models and Data Mining Technologies. J. Clean. Prod. 2022, 337, 130607. [Google Scholar] [CrossRef]
  4. Dong, C.; Gao, R.; Zhang, X.; Li, H.; Wang, W.; Xue, L. Assessment of O3-Induced Crop Yield Losses in Northern China During 2013–2018 Using High-Resolution Air Quality Reanalysis Data. Atmos. Environ. 2021, 259, 118527. [Google Scholar] [CrossRef]
  5. Feng, Z.; De Marco, A.; Anav, A.; Gualtieri, M.; Sicard, P.; Tian, H.; Fornasier, F.; Tao, F.; Guo, A.; Paoletti, E. Economic Losses due to Ozone Impacts on Human Health, Forest Productivity and Crop Yield Across China. Environ. Int. 2019, 131, 104966. [Google Scholar] [CrossRef]
  6. Liu, C.; Chen, R.; Sera, F.; Vicedo-Cabrera, A.M.; Guo, Y.; Tong, S.; Lavigne, E.; Correa, P.M.; Ortega, N.V.; Achilleos, S. Interactive Effects of Ambient Fine Particulate Matter and Ozone on Daily Mortality in 372 Cities: Two Stage Time Series Analysis. BMJ 2023, 383, e075203. [Google Scholar] [CrossRef]
  7. He, C.; Liu, J.; Zhou, Y.; Zhou, J.; Zhang, L.; Wang, Y.; Liu, L.; Peng, S. Synergistic PM2.5 and O3 Control to Address the Emerging Global PM2.5-O3 Compound Pollution Challenges. Eco-Environ. Health 2024, 3, 325–337. [Google Scholar] [CrossRef]
  8. Liu, J.; He, C.; Si, Y.; Li, B.; Wu, Q.; Ni, J.; Zhao, Y.; Hu, Q.; Du, S.; Lu, Z. Toward Better and Healthier Air Quality: Global PM2.5 and O3 Pollution Status and Risk Assessment Based on the New WHO Air Quality Guidelines for 2021. Glob. Chall. 2024, 8, 2300258. [Google Scholar] [CrossRef]
  9. Yang, P.; Zhang, Y.; Wang, K.; Doraiswamy, P.; Cho, S.-H. Health Impacts and Cost-Benefit Analyses of Surface O3 and PM2.5 over the US under Future Climate and Emission Scenarios. Environ. Res. 2019, 178, 108687. [Google Scholar] [CrossRef]
  10. Wang, J.; Gao, A.; Li, S.; Liu, Y.; Zhao, W.; Wang, P.; Zhang, H. Regional Joint PM2.5-O3 Control Policy Benefits Further Air Quality Improvement and Human Health Protection in Beijing–Tianjin–Hebei and Its Surrounding Areas. J. Environ. Sci. 2023, 130, 75–84. [Google Scholar] [CrossRef]
  11. Awe, Y.A.; Larsen, B.K.; Sanchez-Triana, E. The Global Health Cost of PM2.5 Air Pollution: A Case for Action Beyond 2021; World Bank Group: Washington, DC, USA, 2022. [Google Scholar]
  12. Selin, N.E.; Wu, S.; Nam, K.-M.; Reilly, J.M.; Paltsev, S.; Prinn, R.G.; Webster, M.D. Global Health and Economic Impacts of Future Ozone Pollution. Environ. Res. Lett. 2009, 4, 044014. [Google Scholar] [CrossRef]
  13. Lanzi, E. The Economic Consequences of Outdoor Air Pollution; Organization for Economic Cooperation and Development: Paris, France, 2016. [Google Scholar]
  14. Xie, Y.; Dai, H.; Zhang, Y.; Wu, Y.; Hanaoka, T.; Masui, T. Comparison of Health and Economic Impacts of PM2.5 and Ozone Pollution in China. Environ. Int. 2019, 130, 104881. [Google Scholar] [CrossRef]
  15. Xu, X. Recent Advances in Studies of Ozone Pollution and Impacts in China: A Short Review. Curr. Opin. Environ. Sci. Health 2021, 19, 100225. [Google Scholar] [CrossRef]
  16. Meng, Z.; Dabdub, D.; Seinfeld, J.H. Chemical Coupling Between Atmospheric Ozone and Particulate Matter. Science 1997, 277, 116–119. [Google Scholar] [CrossRef]
  17. Liao, H.; Zhou, Y.; Dai, H.; Gong, C. Influence of Weather and Climate Conditions on the Formation of Atmospheric PM2.5 and Ozone Pollution. Sci. Technol. Rev. 2022, 40, 41–48. [Google Scholar]
  18. Qu, Y.; Wang, T.; Wu, H.; Shu, L.; Li, M.; Chen, P.; Zhao, M.; Li, S.; Xie, M.; Zhuang, B.; et al. Vertical Structure and Interaction of Ozone and Fine Particulate Matter in Spring at Nanjing, China: The Role of Aerosol’s Radiation Feedback. Atmos. Environ. 2020, 222, 117162. [Google Scholar] [CrossRef]
  19. Zhang, Y.; Zhao, T.; Yin, C.; Wang, Z.; Ge, B.; Liu, R.; Du, X. Seasonal Variation of the Relationship Between Surface PM2.5 and O3 Concentrations in Xuzhou. China Environ. Sci. 2019, 39, 2267–2272. [Google Scholar]
  20. Jia, C.; Tong, S.; Zhang, X.; Li, F.; Zhang, W.; Li, W.; Wang, Z.; Zhang, G.; Tang, G.; Liu, Z.; et al. Atmospheric Oxidizing Capacity in Autumn Beijing: Analysis of the O3 and PM2.5 Episodes Based on Observation-Based Model. J. Environ. Sci. 2023, 124, 557–569. [Google Scholar] [CrossRef]
  21. Li, K.; Jacob, D.J.; Liao, H.; Zhu, J.; Shah, V.; Shen, L.; Bates, K.H.; Zhang, Q.; Zhai, S. A Two-Pollutant Strategy for Improving Ozone and Particulate Air Quality in China. Nat. Geosci. 2019, 12, 906–910. [Google Scholar] [CrossRef]
  22. Ye, H.; Jun, M.Y.; Cong, S.C.; Feng, W.Y.; Hui, R.W.; Kang, W.J.; Dong, W.D.; Bin, X.X. Analysis of the Relationship between O3 and PM2.5 and the Main Factors Controlling Air Pollution in Shenyang. Sci. Technol. Rev. 2024, 37, 455–468. [Google Scholar]
  23. Yang, J.; Wen, Y.; Wang, Y.; Zhang, S.; Pinto, J.P.; Pennington, E.A.; Wang, Z.; Wu, Y.; Sander, S.P.; Jiang, J.H. From COVID-19 to Future Electrification: Assessing Traffic Impacts on Air Quality by a Machine-Learning Model. Proc. Natl. Acad. Sci. USA 2021, 118, e2102705118. [Google Scholar] [CrossRef]
  24. Yadav, R.K.; Gadhavi, H.; Arora, A.; Mohbey, K.K.; Kumar, S.; Lal, S.; Mallik, C. Relation Between PM2.5 and O3 over Different Urban Environmental Regimes in India. Urban Sci. 2023, 7, 9. [Google Scholar] [CrossRef]
  25. Jia, M.; Zhao, T.; Cheng, X.; Gong, S.; Zhang, X.; Tang, L.; Liu, D.; Wu, X.; Wang, L.; Chen, Y. Inverse Relations of PM2.5 and O3 in Air Compound Pollution between Cold and Hot Seasons over an Urban Area of East China. Atmosphere 2017, 8, 59. [Google Scholar] [CrossRef]
  26. Qiu, Y.; Wu, Z.; Shang, D.; Zhang, Z.; Xu, N.; Zong, T.; Zhao, G.; Tang, L.; Guo, S.; Wang, S. The Temporal and Spatial Distribution of the Correlation Between PM2.5 and O3 Contractions in the Urban Atmosphere of China. Chin. Sci. Bull. 2022, 67, 2008–2017. [Google Scholar] [CrossRef]
  27. Qiu, P.; Zhang, L.; Wang, X.; Liu, Y.; Wang, S.; Gong, S.; Zhang, Y. A New Approach of Air Pollution Regionalization Based on Geographically Weighted Variations for Multi-Pollutants in China. Sci. Total Environ. 2023, 873, 162431. [Google Scholar] [CrossRef] [PubMed]
  28. Zhu, J.; Chen, L.; Liao, H.; Dang, R. Correlations Between PM2.5 and Ozone over China and Associated Underlying Reasons. Atmosphere 2019, 10, 352. [Google Scholar] [CrossRef]
  29. Chen, J.; Shen, H.; Li, T.; Peng, X.; Cheng, H.; Ma, C. Temporal and Spatial Features of the Correlation between PM2.5 and O3 Concentrations in China. Int. J. Environ. Res. Public Health 2019, 16, 4824. [Google Scholar] [CrossRef]
  30. Wang, L.; Zhao, B.; Zhang, Y.; Hu, H. Correlation Between Surface PM2.5 and O3 in Eastern China During 2015–2019: Spatiotemporal Variations and Meteorological Impacts. Atmos. Environ. 2023, 294, 119520. [Google Scholar] [CrossRef]
  31. Tian, L.; Jiao, Y.W.; Peng, L.Z.; Rui, L.; Yong, F.; Na, Z.L.; Kang, F.W. Comparison of PM2.5 and O3 Pollution Changes in Inland and Coastal Megacities in Shandong Province. EST China 2023, 36, 47–52+69. [Google Scholar]
  32. Hong, M.L.; Hua, L.Y.; Qin, H.S.; Yi, H.T. Influence of Sea-Land Breeze on the Concentrations of PM2.5 and O3 in Tianjin City. Sci. Technol. Rev. 2019, 32, 390–398. [Google Scholar]
  33. Wang, B.; Zhang, C.; Huang, L.; Zhang, G.; Yuan, X.; Yao, R.; Zhang, M. Spatiotemporal Assessment of Atmospheric Pollutants in Yancheng City, Eastern Coastal City of China. Atmosphere 2023, 14, 851. [Google Scholar] [CrossRef]
  34. Zhan, Y.; Luo, Y.; Deng, X.; Grieneisen, M.L.; Zhang, M.; Di, B. Spatiotemporal Prediction of Daily Ambient Ozone Levels across China Using Random Forest for Human Exposure Assessment. Environ. Pollut. 2018, 233, 464–473. [Google Scholar] [CrossRef] [PubMed]
  35. Tie, X.; Wu, D.; Brasseur, G. Lung Cancer Mortality and Exposure to Atmospheric Aerosol Particles in Guangzhou, China. Atmos. Environ. 2009, 43, 2375–2377. [Google Scholar] [CrossRef]
  36. Fei, L.; Xiugen, F.; Jian, W.; Chunyan, S. Mechanism of Organic Matter Accumulation in a Marine-Terrestrial Transitional Residual Bay Environment: A Case of Early Cretaceous Organic-Rich Shales in the Qiangtang Basin. China Geol. 2023, 50, 1093–1106. [Google Scholar]
  37. Hou, L.; Luo, X.; Yu, Z.; Wu, S.; Zhao, Z.; Lin, S. Key Factors Controlling the Occurrence of Shale Oil and Gas in the Eagle Ford Shale, the Gulf Coast Basin: Models for Sweet Spot Identification. J. Nat. Gas Sci. Eng. 2021, 94, 104063. [Google Scholar] [CrossRef]
  38. Guo, W.; Yang, Y.; Chen, Q.; Zhu, Y.; Zhang, Y.; Zhang, Y.; Liu, Y.; Li, G.; Sun, W.; She, J. Chemical Reactivity of Volatile Organic Compounds and Their Effects on Ozone Formation in a Petrochemical Industrial Area of Lanzhou, Western China. Sci. Total Environ. 2022, 839, 155901. [Google Scholar] [CrossRef]
  39. Zhao, M.; Shen, H.Q.; Chen, T.S.; Li, J.-D.; Sun, Z.Q.; Ji, Y.Y.; Xue, L.K.; Li, H.; Wang, W.X.; Shang, F.Y. Characteristics and Sensitivity Analysis of Ozone in the Representative City of the Yellow River Delta in Summer. Sci. Technol. Rev. 2022, 35, 1351–1361. [Google Scholar]
  40. Lin, W. Volatile Organic Compound Emissions from the Oilfield in the Yellow River Delta Region, Northern China and Their Impact on Regional Ozone Pollution. Master’s Thesis, Shandong University, Jinan, China, 2019. [Google Scholar]
  41. Chen, L.; Zhu, J.; Liao, H.; Yang, Y.; Yue, X. Meteorological Influences on PM2.5 and O3 Trends and Associated Health Burden since China’s Clean Air Actions. Sci. Total Environ. 2020, 744, 140837. [Google Scholar] [CrossRef]
  42. Qiang, B.H. Characterization of Secondary Components in PM2.5 and Traceability Study Based on CMB-CMAQ Modeling in Jinan City. Master’s Thesis, Shandong Jianzhu University, Jinan, China, 2023. [Google Scholar]
  43. Ji, Y.; An, C.; Tang, J.; Li, J.; Yan, X.; Gao, X.; Chu, W.; Zhong, X.; Shang, F.; Li, J. Causes Investigation of PM2.5 and O3 Complex Pollution in a Typical Coastal City in the Bohai Bay Region of China in Autumn: Based on One-Month Continuous Intensive Observation and Model Simulation. Atmosphere 2024, 15, 73. [Google Scholar] [CrossRef]
  44. HJ 818-2018; Technical Specifications for Operation and Quality Control of Ambient Air Quality Continuous Automated Monitoring System for SO2, NO2, O3 and CO. Ministry of Ecology and Environment of the People’s Republic of China: Beijing, China, 2018.
  45. QX/T 70-2007; Determination of Elemental Carbon and Organic Carbon in Atmospheric Aerosols—Thermal-Optical Analysis Method. China Meteorological Administration: Beijing, China, 2007.
  46. HJ/T 193-2005; Automated Methods for Ambient Air Quality Monitoring. State Environmental Protection Administration: Beijing, China, 2005.
  47. HJ 1010-2018; Specifications and Test Procedures for Ambient Air Quality Continuous Monitoring System with Gas Chromatography for Volatile Organic Compounds. Ministry of Ecology and Environment of the People’s Republic of China: Beijing, China, 2019.
  48. HJ 1327-2023; Technical Specifications for Continuous Automated Monitoring of Organic Carbon and Elemental Carbon in Ambient Air Particulate Matter (PM2.5). Ministry of Ecology and Environment of the People’s Republic of China: Beijing, China, 2024.
  49. HJ 1328-2023; Technical Specifications for Continuous Automated Monitoring of Water-Soluble Ions in Ambient Air Particulate Matter (PM2.5). Ministry of Ecology and Environment of the People’s Republic of China: Beijing, China, 2024.
  50. HJ 1329-2023; Technical Specifications for Continuous Automated Monitoring of Inorganic Elements in Ambient Air Particulate Matter (PM2.5). Ministry of Ecology and Environment of the People’s Republic of China: Beijing, China, 2024.
  51. GB 3095-2012; Ambient Air Quality Standards. Ministry of Ecology and Environment of the People’s Republic of China: Beijing, China, 2016.
  52. HJ 663-2013; Technical Regulation for Ambient Air Quality Assessment (on Trial). Ministry of Ecology and Environment of the People’s Republic of China: Beijing, China, 2013.
  53. HJ 663-2012; Technical Regulation on Ambient Air Quality Index (on Trial). Ministry of Ecology and Environment of the People’s Republic of China: Beijing, China, 2016.
  54. Li, H.; Wang, Y.; Huang, L.; Liu, Z.; Wang, W.; Feng, J. Analysis of Synergistic Growth Effects between Ozone and Secondary Aerosol in Typical Cities in China. Acta Sci. Circumstantiae 2020, 40, 4368–4379. [Google Scholar]
  55. Chow, J.C.; Watson, J.G.; Lu, Z.; Lowenthal, D.H.; Frazier, C.A.; Solomon, P.A.; Thuillier, R.H.; Magliano, K. Descriptive Analysis of PM2.5 and PM10 at Regionally Representative Locations During SJVAQS/AUSPEX. Atmos. Environ. 1996, 30, 2079–2112. [Google Scholar] [CrossRef]
  56. Ivatt, P.D.; Evans, M.J.; Lewis, A.C. Suppression of Surface Ozone by an Aerosol-Inhibited Photochemical Ozone Regime. Nat. Geosci. 2022, 15, 536–540. [Google Scholar] [CrossRef]
  57. Cheng, M.Z.; Ming, X.J.; Hao, Q.Y.; Qin, Y.C.; Dan, Y.D.; Qiang, Z.G. Classification Characteristics, Circulation Background and Its Effect on O3 of Land and Sea Breeze in Shanghai. China Environ. Sci. 2023, 43, 1002–1013. [Google Scholar]
  58. Zeren, Y.; Zhou, B.; Zheng, Y.; Jiang, F.; Lyu, X.; Xue, L.; Wang, H.; Liu, X.; Guo, H. Does Ozone Pollution Share the Same Formation Mechanisms in the Bay Areas of China? Sci. Total Environ. 2022, 56, 14326–14337. [Google Scholar] [CrossRef]
  59. An, C.; Ji, Y.-Y.; Chu, W.-H.; Yan, X.-Y.; Bi, F.; Gao, R.; Xue, L.-K.; Shang, F.-Y.; Li, J.-D.; Li, H. Spatiotemporal Distribution Characteristics of Ground-Level-Ozone and Its Relationship with Meteorological Conditions in a Representative City in the Bohai Rim from 2017 to 2022. Huanjing Kexue 2024, 45, 4398–4410. [Google Scholar] [PubMed]
  60. Breiman, L. Random Forests. Mach. Learn. 2001, 45, 5–32. [Google Scholar] [CrossRef]
  61. Shang, Y.J.; Mao, Y.H.; Liao, H.; Hu, J.L.; Zou, Z.Y. Response of PM2.5 and O3 to Emission Reductions in Nanjing Based on Random Forest Algorithm. Huanjing Kexue 2023, 44, 4250–4261. [Google Scholar] [PubMed]
  62. Liu, Y.; Cai, Q.; Tong, L.; Pan, Y.; Hu, S.; Zhu, X.; Gu, Z.; Zheng, J.; Wu, K.; Gong, Y.; et al. Influence of Sea-Land Breeze on the Variation Characteristics and Prediction of Ozone in the Suburbancoastal Atmosphere of Southeast Ningbo. Acta Sci. Circumst. 2023, 43, 27–39. [Google Scholar]
  63. Zhou, Z.; Qiu, C.; Zhang, Y. A Comparative Analysis of Linear Regression, Neural Networks and Random Forest Regression for Predicting Air Ozone Employing Soft Sensor Models. Sci. Rep. 2023, 13, 22420. [Google Scholar] [CrossRef]
  64. Qian, J.; Liao, H. Effectiveness of Precursor Emission Reductions for the Control of Summertime Ozone and PM2.5 in the Beijing–Tianjin–Hebei Region Under Different Meteorological Conditions. Adv. Atmos. Sci. 2024, 42, 653–669. [Google Scholar] [CrossRef]
  65. Chen, Z.; Zhuang, Y.; Xie, X.; Chen, D.; Cheng, N.; Yang, L.; Li, R. Understanding Long-Term Variations of Meteorological Influences on Ground Ozone Concentrations in Beijing During 2006–2016. Environ. Pollut. 2019, 245, 29–37. [Google Scholar] [CrossRef] [PubMed]
  66. Jing, Q.; Sheng, L.; Zhang, W.; An, X. Characteristics of PM2.5 and O3 Pollution and Related Meteorological Impacts in ‘2 + 26’ cities of Beijing–Tianjin–Hebei and Its Surrounding Areas from 2018 to 2021. Res. Environ. Sci. 2023, 36, 875–886. [Google Scholar]
  67. Long, J.; Shan, Y.S.; Fu, X.Y. Physicochemical Processes of a Typical Ozone Pollution in Suburb of Beijing. Chin. J. Atmos. Sci. 2024, 48, 391–404. [Google Scholar]
  68. Li, H.; Peng, L.; Bi, F.; Li, L.; Bao, J.; Li, J.; Zhang, H.; Chai, F. Strategy of Coordinated Control of PM2.5 and Ozone in China. Res. Environ. Sci. 2019, 32, 1763–1778. [Google Scholar]
  69. Wang, X.; Wu, Y.; Randel, W.; Tilmes, S. Stratospheric Contribution to the Summertime High Surface Ozone Events over the Western United States. Environ. Res. Lett. 2020, 15, 1040a6. [Google Scholar] [CrossRef]
  70. Hu, J.; Zhao, T.; Liu, J.; Cao, L.; Wang, C.; Li, Y.; Shi, C.; Tan, C.; Sun, X.; Shu, Z.; et al. Exploring the Ozone Pollution over the Western Sichuan Basin, Southwest China: The Impact of Diurnal Change in Mountain-Plains Solenoid. Sci. Total Environ. 2022, 839, 156264. [Google Scholar] [CrossRef]
  71. Yang, L.M.; Wang, S.B.; Hao, Q.; Han, S.J.; Li, C.; Zhao, Q.Y.; Yan, Q.S.; Zhang, R.Q. Characteristics and Source Analysis of water-Soluble Ions in PM2.5 in Zhengzhou. Huanjing Kexue 2019, 40, 2977–2984. [Google Scholar]
  72. Jiang, N.; Guo, Y.; Wang, Q.; Kang, P.; Zhang, R.; Tang, X. Chemical Composition Characteristics of PM2.5 in Three Cities in Henan, Central China. Aerosol Air Qual. Res. 2017, 17, 2367–2380. [Google Scholar] [CrossRef]
  73. Ram, K.; Sarin, M.M. Day-Night Variability of EC, OC, WSOC and Inorganic Ions in Urban Environment of Indo-Gangetic Plain: Implications to Secondary Aerosol Formation. Atmos. Environ. 2011, 45, 460–468. [Google Scholar] [CrossRef]
  74. Shao, P.; Xin, J.; An, J.; Wang, J.; Wu, F.; Wang, Y. An Analysis on the Relationship between Ground-Level Ozone and Particulate Matter in an Industrial Area in the Yangtze River Delta During Summer Time. Chin. J. Atmos. Sci. 2017, 41, 618–628. [Google Scholar]
  75. Zhang, R.; Sun, X.; Shi, A.; Huang, Y.; Yan, J.; Nie, T.; Yan, X.; Li, X. Secondary Inorganic Aerosols Formation During Haze Episodes at an Urban Site in Beijing, China. Atmos. Environ. 2018, 177, 275–282. [Google Scholar] [CrossRef]
  76. Sievering, H.; Boatman, J.; Galloway, J.; Keene, W.; Kim, Y.; Luria, M.; Ray, J. Heterogeneous Sulfur Conversion in Sea-Salt Aerosol Particles: The Role of Aerosol Water Content and Size Distribution. Atmos. Environ. Part A Gen. Top. 1991, 25, 1479–1487. [Google Scholar] [CrossRef]
  77. Fang, Y.; Ye, C.; Wang, J.; Wu, Y.; Hu, M.; Lin, W.; Xu, F.; Zhu, T. Relative Humidity and O3 Concentration as Two Prerequisites for Sulfate Formation. Atmos. Chem. Phys. 2019, 19, 12295–12307. [Google Scholar] [CrossRef]
  78. Han, Y.; Gong, Z.; Ye, J.; Liu, P.; McKinney, K.A.; Martin, S.T. Quantifying the Role of the Relative Humidity-Dependent Physical State of Organic Particulate Matter in the Uptake of Semivolatile Organic Molecules. Environ. Sci. Technol. 2019, 53, 13209–13218. [Google Scholar] [CrossRef] [PubMed]
  79. Luo, H.; Jia, L.; Wan, Q.; An, T.; Wang, Y. Role of Liquid Water in the Formation of O3 and SOA Particles from 1,2,3-Trimethylbenzene. Atmos. Environ. 2019, 217, 116955. [Google Scholar] [CrossRef]
  80. Möller, D. Atmospheric Hydrogen Peroxide: Evidence for Aqueous-Phase Formation from a Historic Perspective and a One-Year Measurement Campaign. Atmos. Environ. 2009, 43, 5923–5936. [Google Scholar] [CrossRef]
  81. Herrmann, H.; Schaefer, T.; Tilgner, A.; Styler, S.A.; Weller, C.; Teich, M.; Otto, T. Tropospheric Aqueous-Phase Chemistry: Kinetics, Mechanisms, and Its Coupling to a Changing Gas Phase. Chem. Rev. 2015, 115, 4259–4334. [Google Scholar] [CrossRef]
  82. Cao, Y.; Liu, J.; Ma, Q.; Zhang, C.; Zhang, P.; Chen, T.; Wang, Y.; Chu, B.; Zhang, X.; Francisco, J.S.; et al. Photoactivation of Chlorine and Its Catalytic Role in the Formation of Sulfate Aerosols. J. Am. Chem. Soc. 2024, 146, 1467–1475. [Google Scholar] [CrossRef]
  83. Su, T. Isotope Based Source Apportionment of Atmospheric Nitrate and Its Application to Source Apportionment of PM2.5 in the Pearl River Delta. Ph.D. Thesis, University of Chinese Academy of Sciences, Beijing, China, 2022. [Google Scholar]
  84. Lee, B.-K.; Choi, S.-D.; Shin, B.; Kim, S.-J.; Lee, S.-J.; Kim, D.-G.; Lee, G.; Kang, H.-J.; Kim, H.-S.; Park, D.-Y. Sensitivity Analysis of Volatile Organic Compounds to PM2.5 Concentrations in a Representative Industrial City of Korea. Asian J. Atmos. Environ. 2023, 17, 3. [Google Scholar] [CrossRef]
  85. Ye, S.; Ma, T.; Duan, F.; Li, H.; He, K.; Xia, J.; Yang, S.; Zhu, L.; Ma, Y.; Huang, T. Characteristics and Formation Mechanisms of Winter Haze in Changzhou, a Highly Polluted Industrial City in the Yangtze River Delta, China. Environ. Pollut. 2019, 253, 377–383. [Google Scholar] [CrossRef]
  86. Wang, Y.; Zhang, Q.; Jiang, J.; Zhou, W.; Wang, B.; He, K.; Duan, F.; Zhang, Q.; Philip, S.; Xie, Y. Enhanced Sulfate Formation During China’s Severe Winter Haze Episode in January 2013 Missing from Current Models. J. Geophys. Res.-Atmos. 2014, 119, 10,425–10,440. [Google Scholar] [CrossRef]
  87. Zheng, B.; Zhang, Q.; Zhang, Y.; He, K.; Wang, K.; Zheng, G.; Duan, F.; Ma, Y.; Kimoto, T. Heterogeneous Chemistry: A Mechanism Missing in Current Models to Explain Secondary Inorganic Aerosol Formation During the January 2013 Haze Episode in North China. Atmos. Chem. Phys. 2015, 15, 2031–2049. [Google Scholar] [CrossRef]
  88. Hong, Y.; Ma, Y.; Sun, J.; Li, C.; Zhang, Y.; Li, X.; Zhou, D.; Wang, Y.; Liu, N. Water-Soluble Ion Components of PM10 During the Winter-Spring Season in a Typical Polluted City in Northeast China. Environ. Sci. Pollut. Res. 2019, 26, 7055–7070. [Google Scholar] [CrossRef]
  89. Wang, Y.; Pavuluri, C.M.; Fu, P.; Li, P.; Dong, Z.; Xu, Z.; Ren, H.; Fan, Y.; Li, L.; Zhang, Y.-L.; et al. Characterization of Secondary Organic Aerosol Tracers over Tianjin, North China during Summer to Autumn. ACS Earth Space Chem. 2019, 3, 2339–2352. [Google Scholar] [CrossRef]
  90. Li, X.; Bei, N.; Hu, B.; Wu, J.; Pan, Y.; Wen, T.; Liu, Z.; Liu, L.; Wang, R.; Li, G. Mitigating NOX Emissions Does Not Help Alleviate Wintertime Particulate Pollution in Beijing-Tianjin-Hebei, China. Environ. Pollut. 2021, 279, 116931. [Google Scholar] [CrossRef]
  91. Wang, Z.; Wang, R.; Wang, J.; Wang, Y.; McPherson Donahue, N.; Tang, R.; Dong, Z.; Li, X.; Wang, L.; Han, Y.; et al. The Seasonal Variation, Characteristics and Secondary Generation of PM2.5 in Xi’an, China, Especially During Pollution Events. Environ. Res. 2022, 212, 113388. [Google Scholar] [CrossRef] [PubMed]
  92. Zhang, J.; Liu, L.; Xu, L.; Lin, Q.; Zhao, H.; Wang, Z.; Guo, S.; Hu, M.; Liu, D.; Shi, Z. Exploring Wintertime Regional Haze in Northeast China: Role of Coal and Biomass Burning. Atmos. Chem. Phys. 2020, 20, 5355–5372. [Google Scholar] [CrossRef]
  93. Jacob, D.J. Heterogeneous Chemistry and Tropospheric Ozone. Atmos. Environ. 2000, 34, 2131–2159. [Google Scholar] [CrossRef]
  94. An, C.; Li, H.; Ji, Y.; Chu, W.; Yan, X.; Chai, F. A Review on Nocturnal Surface Ozone Enhancement: Characterization, Formation Causes, and Atmospheric Chemical Effects. Sci. Total Environ. 2024, 921, 170731. [Google Scholar] [CrossRef]
  95. Zhao, M.; Zhang, Y.; Pei, C.; Chen, T.; Mu, J.; Liu, Y.; Wang, Y.; Wang, W.; Xue, L. Worsening Ozone Air Pollution with Reduced NOx and VOCs in the Pearl River Delta Region in Autumn 2019: Implications for National Control Policy in China. J. Environ. Manag. 2022, 324, 116327. [Google Scholar] [CrossRef]
  96. Seinfeld, J.H.; Pandis, S.N. Atmospheric Chemistry and Physics: From Air Pollution to Climate Change; John Wiley & Sons: Hoboken, NJ, USA, 2016. [Google Scholar]
  97. Shao, M.; Wang, W.; Yuan, B.; Parrish, D.D.; Li, X.; Lu, K.; Wu, L.; Wang, X.; Mo, Z.; Yang, S. Quantifying the Role of PM2.5 Dropping in Variations of Ground-Level Ozone: Inter-Comparison between Beijing and Los Angeles. Sci. Total Environ. 2021, 788, 147712. [Google Scholar] [CrossRef]
  98. Kroll, J.H.; Seinfeld, J.H. Chemistry of Secondary Organic Aerosol: Formation and Evolution of Low-Volatility Organics in the Atmosphere. Atmos. Environ. 2008, 42, 3593–3624. [Google Scholar] [CrossRef]
  99. Zhang, Q.; Jimenez, J.L.; Canagaratna, M.; Allan, J.D.; Coe, H.; Ulbrich, I.; Alfarra, M.; Takami, A.; Middlebrook, A.; Sun, Y. Ubiquity and Dominance of Oxygenated Species in Organic Aerosols in Anthropogenically-Influenced Northern Hemisphere Midlatitudes. Geophys. Res. Lett. 2007, 34, 13. [Google Scholar] [CrossRef]
  100. Kroll, J.H.; Ng, N.L.; Murphy, S.M.; Flagan, R.C.; Seinfeld, J.H. Secondary Organic Aerosol Formation from Isoprene Photooxidation. Environ. Sci. Technol. 2006, 40, 1869–1877. [Google Scholar] [CrossRef]
  101. Li, Y.; Wang, T.; Wang, Q.g.; Li, M.; Qu, Y.; Wu, H.; Xie, M. Impact of Aerosol-Radiation Interaction and Heterogeneous Chemistry on the Winter Decreasing PM2.5 and Increasing O3 in Eastern China 2014–2020. J. Environ. Sci. 2025, 151, 469–483. [Google Scholar] [CrossRef]
  102. Liang, C.S.; Duan, F.K.; He, K.B.; Ma, Y.L. Review on Recent Progress in Observations, Source Identifications and Countermeasures of PM2.5. Environ. Int. 2016, 86, 150–170. [Google Scholar] [CrossRef]
Figure 1. Geographical location and observation stations in Dongying.
Atmosphere 16 00512 g001
Figure 2. Annual variations of conventional pollutants (a) and monthly variations (b) and diurnal variations during pollution seasons of PM2.5 (c) and O3 (d) in Dongying during 2017–2023. Note: (b) The vertical error bars represent the standard deviation of the PM2.5 and O3-8 h concentrations for that month from 2017 to 2023.
Atmosphere 16 00512 g002
Figure 3. Spatial Comparison of Annual and Seasonal Variations of PM2.5 and O3 in Dongying during 2017–2023.
Atmosphere 16 00512 g003
Figure 4. Concentration Variations of PM2.5 and O3 on Compound Pollution Days (PM2.5+O3-P) in Dongying during 2017–2023.
Atmosphere 16 00512 g004
Figure 5. Seasonal and daily variations in the correlation coefficient between PM2.5 and O3 in Dongying during 2017–2023.
Atmosphere 16 00512 g005
Figure 6. Comparison of daily values of PM2.5 and O3 in Dongying during spring, summer, autumn and winter from 2017 to 2023. Note: The x-axis represents an increment of daily PM2.5 concentration by 10 μg·m−3, while the y-axis corresponds to MAD8–O3 under the respective PM2.5 concentrations.
Atmosphere 16 00512 g006
Figure 7. Seasonal variations in the correlation between daily values of PM2.5 and O3 in Dongying during 2017–2023.
Atmosphere 16 00512 g007
Figure 8. Variations in the correlation coefficient between PM2.5 and O3 under different concentration levels in Dongying. Note: (a) In spring and autumn, there was no situation where PM2.5 concentration exceeded 200 μg·m−3. (a) In summer, PM2.5 concentration did not exceed 110 μg·m−3. (b) In winter, there was no situation where MAD8 O3 concentration was greater than 160 μg·m−3.
Atmosphere 16 00512 g008
Figure 9. Comparison of days for different weather conditions under different pollution conditions during 2017–2023.
Atmosphere 16 00512 g009
Figure 10. Correlation and seasonal concentration comparison of PM2.5 and O3 daily values under different weather patterns: (a) Correlation coefficient, (b) Mean pressure field, (c) High pressure field, (d) Low pressure field.
Atmosphere 16 00512 g010
Figure 11. Influence of meteorological factors on the correlation between daily values of PM2.5 and O3 from 2017 to 2023. (a) Daily average temperature. (b) Correlation coefficients under different temperature levels. (c) Daily average relative humidity. (d) Correlation coefficients under different relative humidity levels. (e) Seasonal variation of correlation coefficients under different relative humidity levels. (f) Daily average wind speeds under different daily values of PM2.5 and O3 levels. Note: The humidity data from 2017 to 2018 is missing.
Atmosphere 16 00512 g011
Figure 12. Impact of sea–land breeze on PM2.5 and O3 correlation in Dongying during 2022–2023: Seasonal distribution of sea–land breeze days (a); seasonal (b) and diurnal (c) variations of PM2.5 and O3 correlation coefficients; distribution on sea breeze (SB) and land breeze (LB) periods (d). Note: Daytime is from 7:00–19:00, nighttime from 20:00–6:00 next day. Land-breeze time is from 01:00–8:00, sea-breeze time from 13:00–20:00.
Atmosphere 16 00512 g012
Figure 13. Hourly variations in PM2.5 and O3 concentrations on sea–land breeze days and non-sea–land breeze days in Dongying during spring (a), summer (b), autumn (c), and winter (d) during 2022–2023.
Atmosphere 16 00512 g013
Figure 14. Variations of O3 with daily assessed value of PM2.5 in Dongying during 2017–2023.
Atmosphere 16 00512 g014
Figure 15. Variations in O3 concentration with the daily evaluation value of PM2.5 in Dongying during 2017–2023: (a) Daytime, (b) Nighttime.
Atmosphere 16 00512 g015
Figure 16. Seasonal comparison of the influence of PM2.5 daily mean concentration and O3 daily evaluation values in Dongying during 2017–2023. Left column (a,b,e,f) Seasonal distribution of O3 daily evaluation values under different PM2.5 daily mean concentration levels. Right column (c,d,g,h) Seasonal distribution of PM2.5 daily mean concentration under different O3 daily evaluation value levels.
Atmosphere 16 00512 g016
Figure 17. Seasonal variations in the contribution of secondary PM2.5 to total PM2.5 concentrations under different O3 concentration levels in Dongying during 2021–2023.
Atmosphere 16 00512 g017
Figure 18. Correlation for PM2.5 secondary components and O3 in four typical pollution episodes in Dongying.
Atmosphere 16 00512 g018
Figure 19. Variations in correlations of PM2.5 and O3 with NO2, VOCs, and each other at different concentration levels, May 2021–December 2023.
Atmosphere 16 00512 g019
Figure 20. Variations in pollutant concentrations during a typical PM2.5–O3 complex pollution episode in autumn in Dongying from 25 October–9 November 2021.
Atmosphere 16 00512 g020
Figure 21. Seasonal distribution of the importance of factors affecting O3 (a) and PM2.5 (b) in Dongying from May 2021 to December 2023.
Atmosphere 16 00512 g021
Figure 22. Diagram of the influence mechanism of the correlation between PM2.5 and O3. Note: (a) Red denotes positive correlation, with upward arrows indicating its enhancement; blue signifies negative correlation, and downward arrows represent its intensification. Black arrows show that sea - land breezes weaken the correlation between PM2.5 and O3. (b) Correlations between PM2.5 and O3 at different concentration levels across spring, summer, autumn and winter. (c) Effects of secondary components of PM2.5 and common precursors of PM2.5 and O3 on their correlations during four typical pollution processes. Herein, ** indicates statistical significance at the 0.01 level.
Atmosphere 16 00512 g022
Disclaimer/Publisher’s Note: The statements, opinions and data contained in all publications are solely those of the individual author(s) and contributor(s) and not of MDPI and/or the editor(s). MDPI and/or the editor(s) disclaim responsibility for any injury to people or property resulting from any ideas, methods, instructions or products referred to in the content.

