Abstract
With recognized adverse effects on human health and the environment, surface ozone constitutes a major problem within and downwind of urbanized areas. In this work, we first analyzed 5 years of hourly concentrations of ozone measured in two megacities with contrasting climates: Paris and Cairo. In both cases, the maximal daily concentrations were observed in summer and they exceeded the 35 ppb threshold recommended by the World Health Organization in 45% and 69% of the days, respectively. During periods of forced reduced activities, these concentrations decreased in Cairo but not in Paris. This indicates that low-emission zones are not necessarily effective to help curb the ozone problem. In a second stage, the ozone retrievals of two satellite-based atmospheric sounding methods (AIRS, and the multispectral approach IASI+GOME2) were compared to the surface measurements. A systematic overestimation, larger for AIRS than IASI+GOME2, was observed. This is likely linked to the fact that satellite approaches retrieve ozone concentrations at higher atmospheric levels than the surface. However, a significantly high linear correlation was obtained at the monthly temporal resolution. Therefore, shift adjustments of the satellite measurements provide efficient proxies of surface observations with significant monthly correlations. This may help complete lacunar surface measurements.
1. Introduction
Unlike stratospheric ozone, which, by shielding the most dangerous solar UV radiation, is essential to life on Earth, ozone that is formed closer to the Earth’s surface (in the lower troposphere) is harmful to humans, animals, and vegetation. It can worsen asthma, lower lung function, raise the risk of cardiovascular disease, and induce respiratory issues in humans [1]. Animals might also experience respiratory distress similar to that of humans [2]. Additionally, because ozone interferes with photosynthesis, slows plant growth, and affects soil microbial communities, it can destroy forests, crops, and yields (e.g., [3]). Finally, tropospheric ozone is a greenhouse gas that contributes to global warming by trapping heat in the atmosphere [4,5,6,7].
Tropospheric ozone is a secondary pollutant produced by the complex photochemical transformation of precursors such as NOx (=NO + NO2) and volatile organic compounds (VOCs) [8]. In urbanized areas, and particularly megacities, large quantities of these precursors are emitted by human activities, and the ozone concentration frequently exceeds the 35 ppb target of the World Health Organization (WHO) [3] between spring and autumn, when abundant shortwave radiation is available to initiate their transformation. In the formation of these concentration peaks, geographical (latitude, altitude, orography) and meteorological (wind, relative humidity, cloud cover, rain…) factors play an important role (e.g., [9,10,11]).
Moreover, because the residence time of ozone in the free troposphere may reach several weeks [12], it can accumulate and be transported a long distance [13,14]. This means that advection of ozone from upwind regions or subsidence from aloft can add their effect to the local production and favor the occurrence of ozone peaks [15,16]. The subsidence phenomenon has been reported in the Mediterranean region, and particularly its eastern basin that constitutes a hot spot of ozone concentration [17,18]. During winter, some precursors (e.g., the VOCs) accumulate in the free troposphere, and this results in the massive production of ozone in spring [19,20,21,22]. Moreover, stratosphere-to-troposphere exchanges, particularly at the midlatitudes of the northern hemisphere, contribute to enhance this spring O3 maximum in the free troposphere [23,24]. Finally, the subsidence of these concentrated air masses towards lower tropospheric levels could explain, at least in part, the springtime maximum of ozone concentration reported by some authors [24,25]. However, other studies of the surface concentration measurements in megacities around the Mediterranean rather suggest the existence of a summer maximum [26,27,28,29,30,31]. This is also the case of Cairo, where [32] reported a maximum of the ozone concentration in June, July, and August.
Another debate is related to the effect of a reduction in ozone precursors on its concentration in megacities of the World. Most studies of the data acquired during the 2020 COVID-19 lockdown detected an increase in ozone in Europe [33,34]. The authors explained the increase by a less efficient titration of ozone by NO during the night. However, in India and China, the ozone response was more contrasted with an increase in most megacities but a decrease in some others [35,36]. Here, the decrease was attributed to the influence of meteorological factors which slowed the ozone production directly (more clouds and rain, lower temperatures) or indirectly through the less efficient emission of volatile organic compounds by the vegetation. In summary, this absence of a general rule suggests that the response must be evaluated in each megacity before new measures are taken to mitigate their specific ozone problem.
To perform this evaluation, measurements performed in situ are necessary but, unfortunately, they may be lacking in some megacities of the developing world. Therefore, the question arises of the possibility of using alternative measurements instead, such as those derived from satellites. Indeed, a rather recent generation of satellite-borne sounders allows for measuring the ozone concentration in the lower part of the troposphere. This is the case of the Atmospheric Infrared Sounder (AIRS) aboard NASA’s Aqua satellite [37] and of the Infrared Atmospheric Sounding Interferometer (IASI) aboard ESA’s MetOp satellite. The combined analysis of the measurements of IASI in the infrared and of the Global Ozone Monitoring Instrument-2 (GOME-2) in the UV currently achieves the largest sensitivity to the ozone concentration in the so-called lowermost troposphere, which is to say below 3 km of altitude [38]. Satellite data of IASI+GOME2 have been shown to reproduce surface measurements during regional ozone pollution outbreaks over both Europe [39] and Asia well [40]. However, comparisons at more specific locations, such as megacities, and over longer annual and pluri-annual durations have not yet been performed. Moreover, it is worth mentioning that in most applications, satellite retrievals are compared to ozone concentrations integrated over the whole troposphere, which is to say up to about 12 km of altitude in the mid-latitudes [41,42].
In this work, our general aim is to analyze in detail the cases of two megacities located in completely different climate zones: (1) Cairo (Egypt), whose climate is dry, hot, and influenced by the surrounding deserts, and (2) Paris (France), which has a typical western European temperate climate.
More precisely, after detailing the available data and the methods used in the next section (Materials and Methods), the Results section will address the following points:
- The variability in the surface ozone concentration in the two megacities will be analyzed to understand how it is modulated by the emission of precursors and possibly by the subsidence of higher-level air masses.
- The performance of the sounding methods will be evaluated by comparison of their products with the direct measurements of the surface ozone concentration. If necessary, a way to adjust the satellite retrievals to provide near-surface ozone abundances will be sought.
The first point is particularly important when elaborating strategies aimed at controlling the surface ozone concentration. Indeed, should the concentration peaks be essentially due to subsidence, limiting the emission of precursors would not be as efficient as expected.
Depending on the outcome of the second point, remote sensing techniques could be used to depict the ozone variations in areas where observations are lacunar or missing.
2. Materials and Methods
2.1. Available Data
2.1.1. Surface Measurements
More than 11 million inhabitants live in the Greater Paris area, and 2.1 million in Paris itself. With a density of 20,000 inhabitants/km2, the French capital is the most densely populated city in western Europe (INSEE, https://www.insee.fr/fr/statistiques/8274695, in French; accessed on: 14 April 2025). The AirParif association maintains a network of about 70 stations, more than 50 of which are permanent, to control the air quality in the megapole, and after a careful quality check, the results of their measurements are distributed free of charge through a public website (https://data-airparif-asso.opendata.arcgis.com/; accessed on 18 June 2024). The data of the automated stations are available at an hourly resolution since September 2018. Each hourly value is the average of 4 measurements performed every 15′.
Within the city of Paris and in a circle of about 60 km around it, 23 stations measure the surface concentration of ozone. Of the 20 that had more than 70% valid data, 13 are situated in urban or peri-urban areas and 7 in rural ones. A careful analysis of their measurements (cf. Supplementary Materials) shows that, independently of the large distance sometimes separating them, the measurements performed at all the 13 urbanized locations are quite strongly correlated (0.78 < R2 < 0.95). This means that the spatial variability in the ozone concentration is quite limited within the Parisian region and that the point measurements performed at any individual urban station could be considered representative of the whole metropolitan area. In the following, we selected Paris-Les Halles as the reference station because it is located right in the center of Paris (lat: 48.8627° N, long: 2.3447° E) and has no missing data in the 2018–2023 period.
In Egypt, the metropolitan area includes three governorates (Cairo, Giza, and Qalyubia) and is referred to as Greater Cairo (GC). The GC region covered an area of 5020 km2 at the end of 2023 [43] and it has a population of around 26.02 million, according to the most recent National Census. This makes it the largest city in Africa and the Middle East, and the 17th largest metropolitan area in the world. GC has its highest population density in the old urban area and its surroundings but lower densities in the new urban communities. The Egyptian Meteorological Authority (EMA) operates a network of 7 air-quality-measuring ground stations. The one located at EMA’s headquarter in El-Abbasseya, an urban area, is the only one measuring ground ozone. The measurements are performed on an hourly basis using the Thermo Scientific™ (Waltham, MA, USA) Model 49i Ozone Analyzer. The device automatically reports the ozone concentration data in a standard format. The quality assurance procedure of the measured data comprises regular site visits to the station and data quality control checks. During the site visits, visual checks are made to the device, the performance of the ozone-monitoring system is evaluated against specific criteria, such as shelter condition, moisture level, etc., and the quality of the recorded data is documented in an ozone-monitoring logbook. This logbook also contains site activities and device calibration. The data quality control checks consist of standard manual steps carried out to ensure the high-quality level of the recorded data, such as the analysis of the percentage of missing data (data gaps), analysis of the logicality of measurements, outliers’ detection, data consistency evaluation, and so forth. There are sometimes important gaps in the Cairo datasets. To avoid biasing the results by including non-representative periods, only years with at least 70% of valid data were retained for the subsequent analysis. After the application of this criterion, the periods used in this work are 2012 (as of April), 2013, 2018, 2019, and 2020. Note that the comparison with the results of [44], who had analyzed the data of 4 previous years (2002–2005), is useful to detect any possible long-term evolution of the ozone concentration.
2.1.2. Remote Sensing of the Tropospheric Ozone by Satellite-Borne Sounders
The Atmospheric Infrared Sounder (AIRS) was launched in May 2002 aboard NASA’s Aqua satellite. The globe is measured one time during the day along an ascending orbit (equatorial crossing at 1.30 p.m., local time) and one time during the night (descending orbit with equatorial crossing at 1:30 a.m.). The spatial resolution is 13.5 km at nadir (https://aqua.nasa.gov/content/airs, accessed on 15 December 2024). Beside 4 visible/near-infrared channels, its high-frequency measurements in 2378 channels of the infrared domain are exploited to retrieve cloud and surface properties, along with atmospheric profiles of temperature, water vapor, and various trace gases, among which ozone. Several studies have shown the capacity of AIRS to retrieve the total ozone column and the stratospheric content (e.g., [45]). The ozone products of the latest inversion protocol (V7) are made available through NASA’s Giovanni portal (https://giovanni.gsfc.nasa.gov/, accessed on 15 December 2024) where they are proposed at several nominal pressure levels (1000, 950, 850, and 700 hPa, for the lowest part of the atmosphere).
The Infrared Atmospheric Sounding Interferometer (IASI) was developed by the French Space Agency (CNES) in collaboration with the European Organisation for the Exploitation of Meteorological Satellites (EUMESAT). The instrument is a Fourier-transform infrared (FTIR) spectrometer whose first version was launched in October 2006 onboard the MetOp-A satellite. In 2012 and 2018, it was followed by other versions of the instrument aboard MetOp-B and MetOp-C, respectively. As with AIRS, the measurements are performed in thermal infrared (TIR). The globe is nearly fully covered twice a day at local overpass times of 9:30 a.m. and p.m., and the spatial resolution at nadir is about 12 km [46].
However, the space-borne observations performed only in TIR have a limited sensitivity for ozone in the first 3 km above the surface [38]. Because this is a limitation for air-quality applications, the latter authors proposed to exploit the synergy of IASI observations in TIR with those made in UV by the Global Ozone Monitoring Experiment-2 (GOME-2), also aboard MetOp. They showed that the sensitivity of the new multispectral method to ozone peaked at altitudes around 2 to 2.5 km above land, which was a clear improvement in comparison of the 3 to 4 km achieved in TIR or UV alone. It allowed for a quantitative observation of ozone in the lowermost part of the troposphere (LMT). Data of the multispectral IASI+GOME2 method have been publicly available at the global and daily scales since 2017 at the AERIS French data Centre (https://iasi.aeris-data.fr/o3_iago2/, accessed on 22 January 2025). In the present work, we use IASI+GOME2 after 2018 compared to 3 years of surface observations in Cairo (2018–2020) and to 5 years (2019–2023) in Paris.
2.2. Analysis of the Temporal Variability in the Surface Ozone
The first stage of the analysis consisted of performing a refined analysis of the temporal variability the surface observations. For the years with the most complete data (see above), we first calculated the mean of the hourly concentrations for each day (Cmean). However, because the short- and long-terms effects of ozone on human health and the environment are more sensitive to the diurnal peaks of ozone concentration than to its mean, we followed the recommendation of the WHO and also calculated the daily maximum of the 8 h running mean (C8max) of the hourly concentrations.
The difference between C8max and Cmean can be considered a proxy of the amplitude of the diurnal variations in the ozone concentration. From a physical point of view, it can be expected that Cmean and C8max should be correlated, at least in the spring, summer, and autumn months. Indeed, in these seasons, the production of ozone by photochemistry during the day will increase at the same time as the amplitude of the diurnal cycle and the average ozone concentration.
In a second stage, we will evaluate the performance of the remote sensing products. In this evaluation, the surface measurements and the lessons learnt from their previous analysis will serve as the reference.
Then, the results obtained in the two contrasted megacities of Cairo and Paris will be thoroughly discussed and conclusions drawn as regards the ability of satellite-borne sounders to assess the variability in surface ozone.
3. Results and Discussion
3.1. Surface Ozone Concentration
3.1.1. Cairo
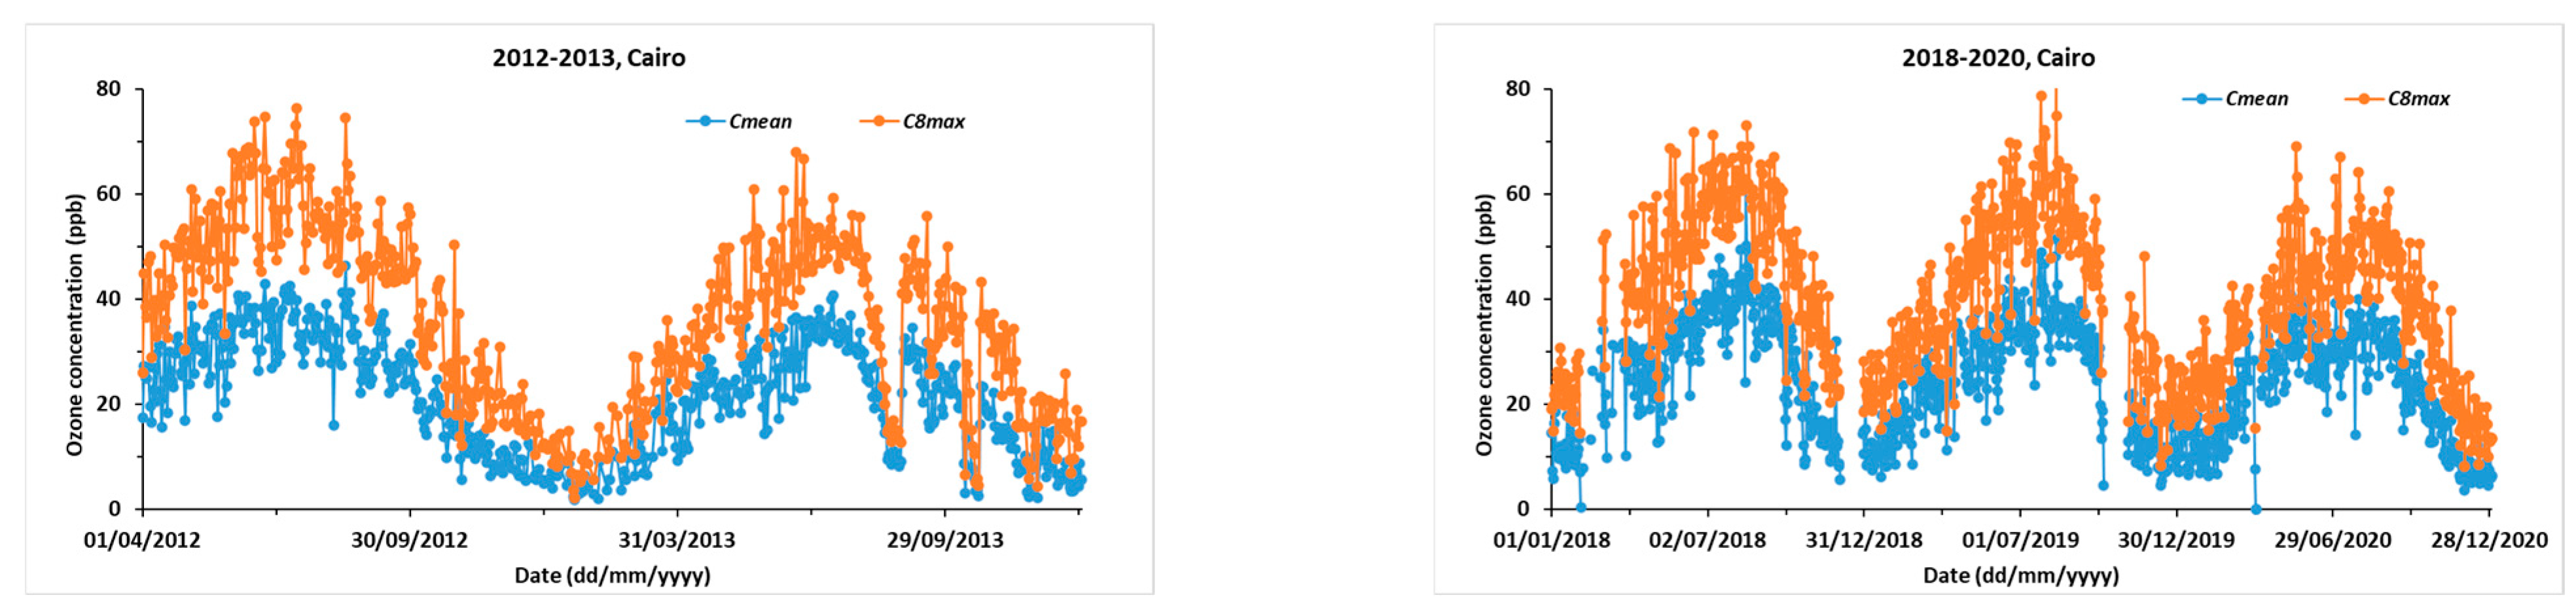
A rapid visual examination of 5 years of measurements in Cairo (Figure 1) indicates that Cmean and C8max achieve their maximal values in the summer months and are the lowest in winter. This is consistent with the fact that surface ozone is mainly produced between spring and autumn by the photochemical transformation of its precursors, and with previous observations [44,47]. The temporal patterns of Cmean and C8max appear to be very similar, a point that is confirmed by the strong linear correlation (R2 > 0.88) linking the two variables (Figure 2). However, upon closer examination of Figure 1, 2013 and 2020 appear as singular in that they do not follow exactly the same pattern as the other years. In 2013, there were three dramatic drops in both Cmean and C8max. The first of these drops occurred in August, the second one in October, and the last one in November. They coincide with periods of political and social unrest during which all activities, and particularly motorized traffic, were quite limited in Cairo. The ensuing reduction in the emission of ozone precursors had a direct impact on its formation. For instance, the concentration levels during most of August were similar to the low ones usually observed during the winter months.

Figure 1.
Temporal evolution of the daily mean (Cmean) and daily maximum of the 8 h running mean concentration (C8max) in Cairo during the years 2012–2013 (left panel) and 2018–2020 (right panel).
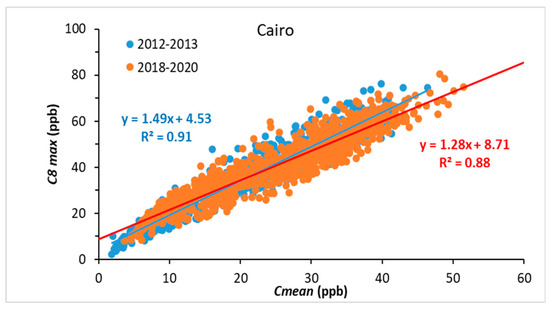
Figure 2.
Correlation between the concentrations (C8max and Cmean) of Figure 1 during the periods of 2012–2013 and 2018–2020.
As compared to the summers of 2018 and 2019, the ozone concentration levels also seemed smaller in 2020 (Figure 1), assumingly as a follow-up of the curfew installed to curb the COVID-19 pandemic. In order to quantify more precisely the difference between the two singular years (2013 and 2020) and business as usual (BAU) ones, statistical indicators (5th, 50th, 95th percentiles, and standard deviation) of the frequency distribution of C8max were calculated for 2013, 2020, and 2018/2019. To detect any possible longer-term evolution, these indicators were also determined for the older 4-year period (2002–2005) considered by [44] in their study of the impact of outdoor air pollution on health in the Greater Cairo area (Table 1).

Table 1.
The 5th, 50th, 95th percentiles, and standard deviation (SD) of the statistical distribution of the daily values of C8max in Cairo. Business-as-usual periods (2002–2005 and 2018–2019) are distinguished from years with reduced activity (i.e., 2013 and 2020) [44]. The proportion of C8max daily values exceeding the 35 ppb guideline of the World Health Organization is also reported.
Between 2002–2005 and 2018–2019, there was no significant modification in the 95th percentile of the distributions: in the two periods, 5% of the C8max values was above 65 ppb. However, the 5th percentile increased from 12 to 20 ppb, which shows that the very low C8max values became rarer. This narrowing of the width of the statistical distribution is reflected by the increase in the mean (50th percentile) that rose from 40 to 44 ppb, and by the proportion of the values exceeding the 35 ppb WHO guideline: this proportion increased from 58 to 67% in about 15 years.
The effect of the reduction in anthropogenic activities in 2013 and 2020 is denoted by the decrease in all the indicators of Table 1. In these two years with lockdown periods, the 95th and 50th percentiles of the C8max distributions were about 10 and 8 ppb, respectively, lower than in the BAU years. As compared to 2002–2005, the rate of exceedance of the 35 ppb threshold was 14% lower in 2013. The reduction was similar (13%) between 2018–2019 and 2020.
3.1.2. Paris
As in Cairo, the Cmean and C8max reach their maximal values between late spring and early autumn (Figure 3a), and with an R2 = 0.86, they are as strongly correlated (Figure 3b). This indicates that local photochemistry in Paris is also the main driver of the variability in the ozone mean concentration and in the amplitude of the diurnal variation.
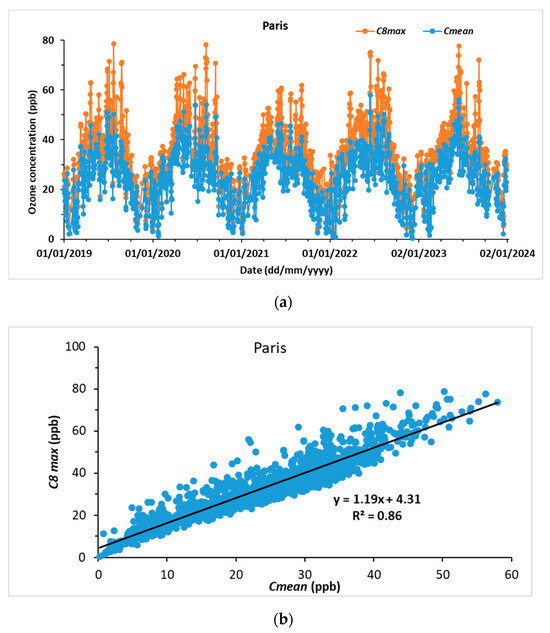
Figure 3.
(a) Temporal evolution of the daily mean (Cmean) and daily maximum of the 8 h running mean concentration (C8max) in Paris between 2019 and 2023, and (b) correlation between C8max and Cmean.
However, the comparison of the percentiles of the frequency distribution of C8max (Table 2) reveals two major differences between Paris and Cairo.
Table 2.
Same as Table 1, but for Paris. The year of the COVID-19 lockdown (2020) is compared to the preceding and 3 following years, which were ‘business as usual’ (BAU).
- The 5th, 50th, and 95th percentiles of the BAU years in Paris (11, 38, and 59 ppb, respectively) are all smaller than in Cairo (19, 44, and 65 ppb, respectively). Logically, the rate of exceedance of the 35 ppb WHO recommendation (42 to 46%) is also smaller than in Cairo (67%).
- Despite the severe lockdown imposed in Paris, the statistical indicators of 2020 do not differ significantly from those of the preceding and 3 following years, which were not affected by circulation restrictions.
3.2. Remote Sensing of the Tropospheric Concentration
3.2.1. AIRS
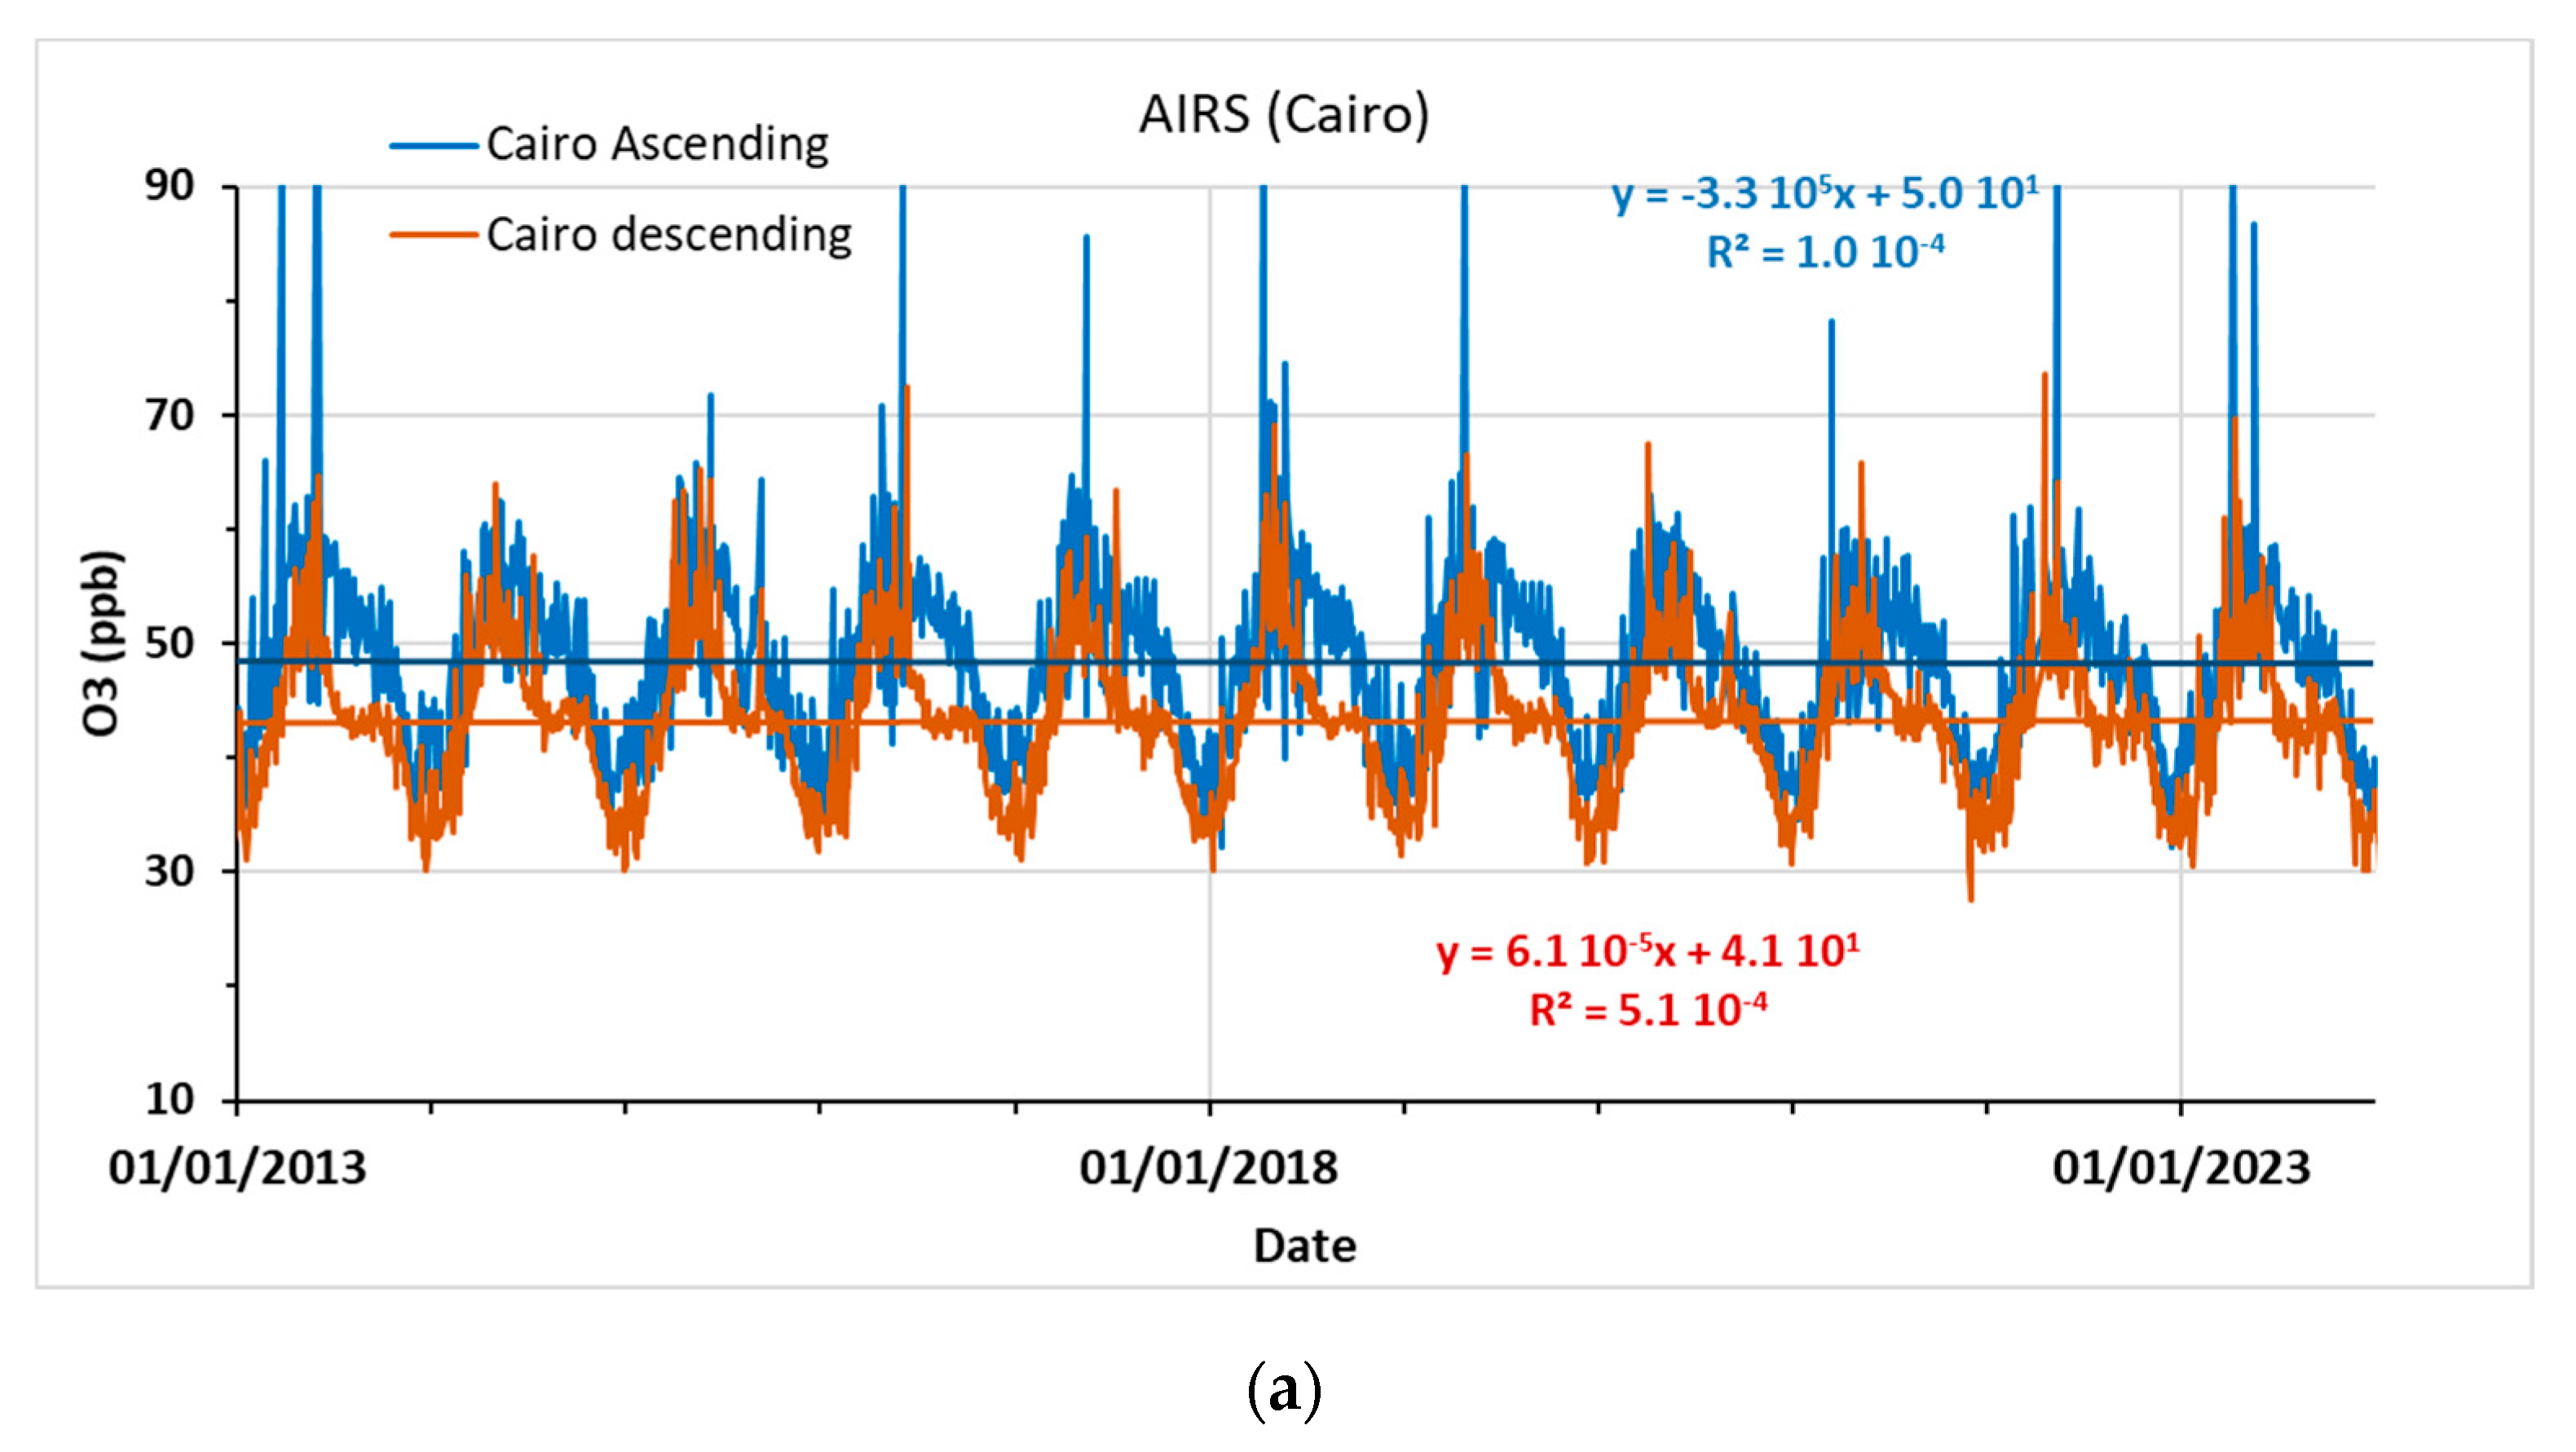
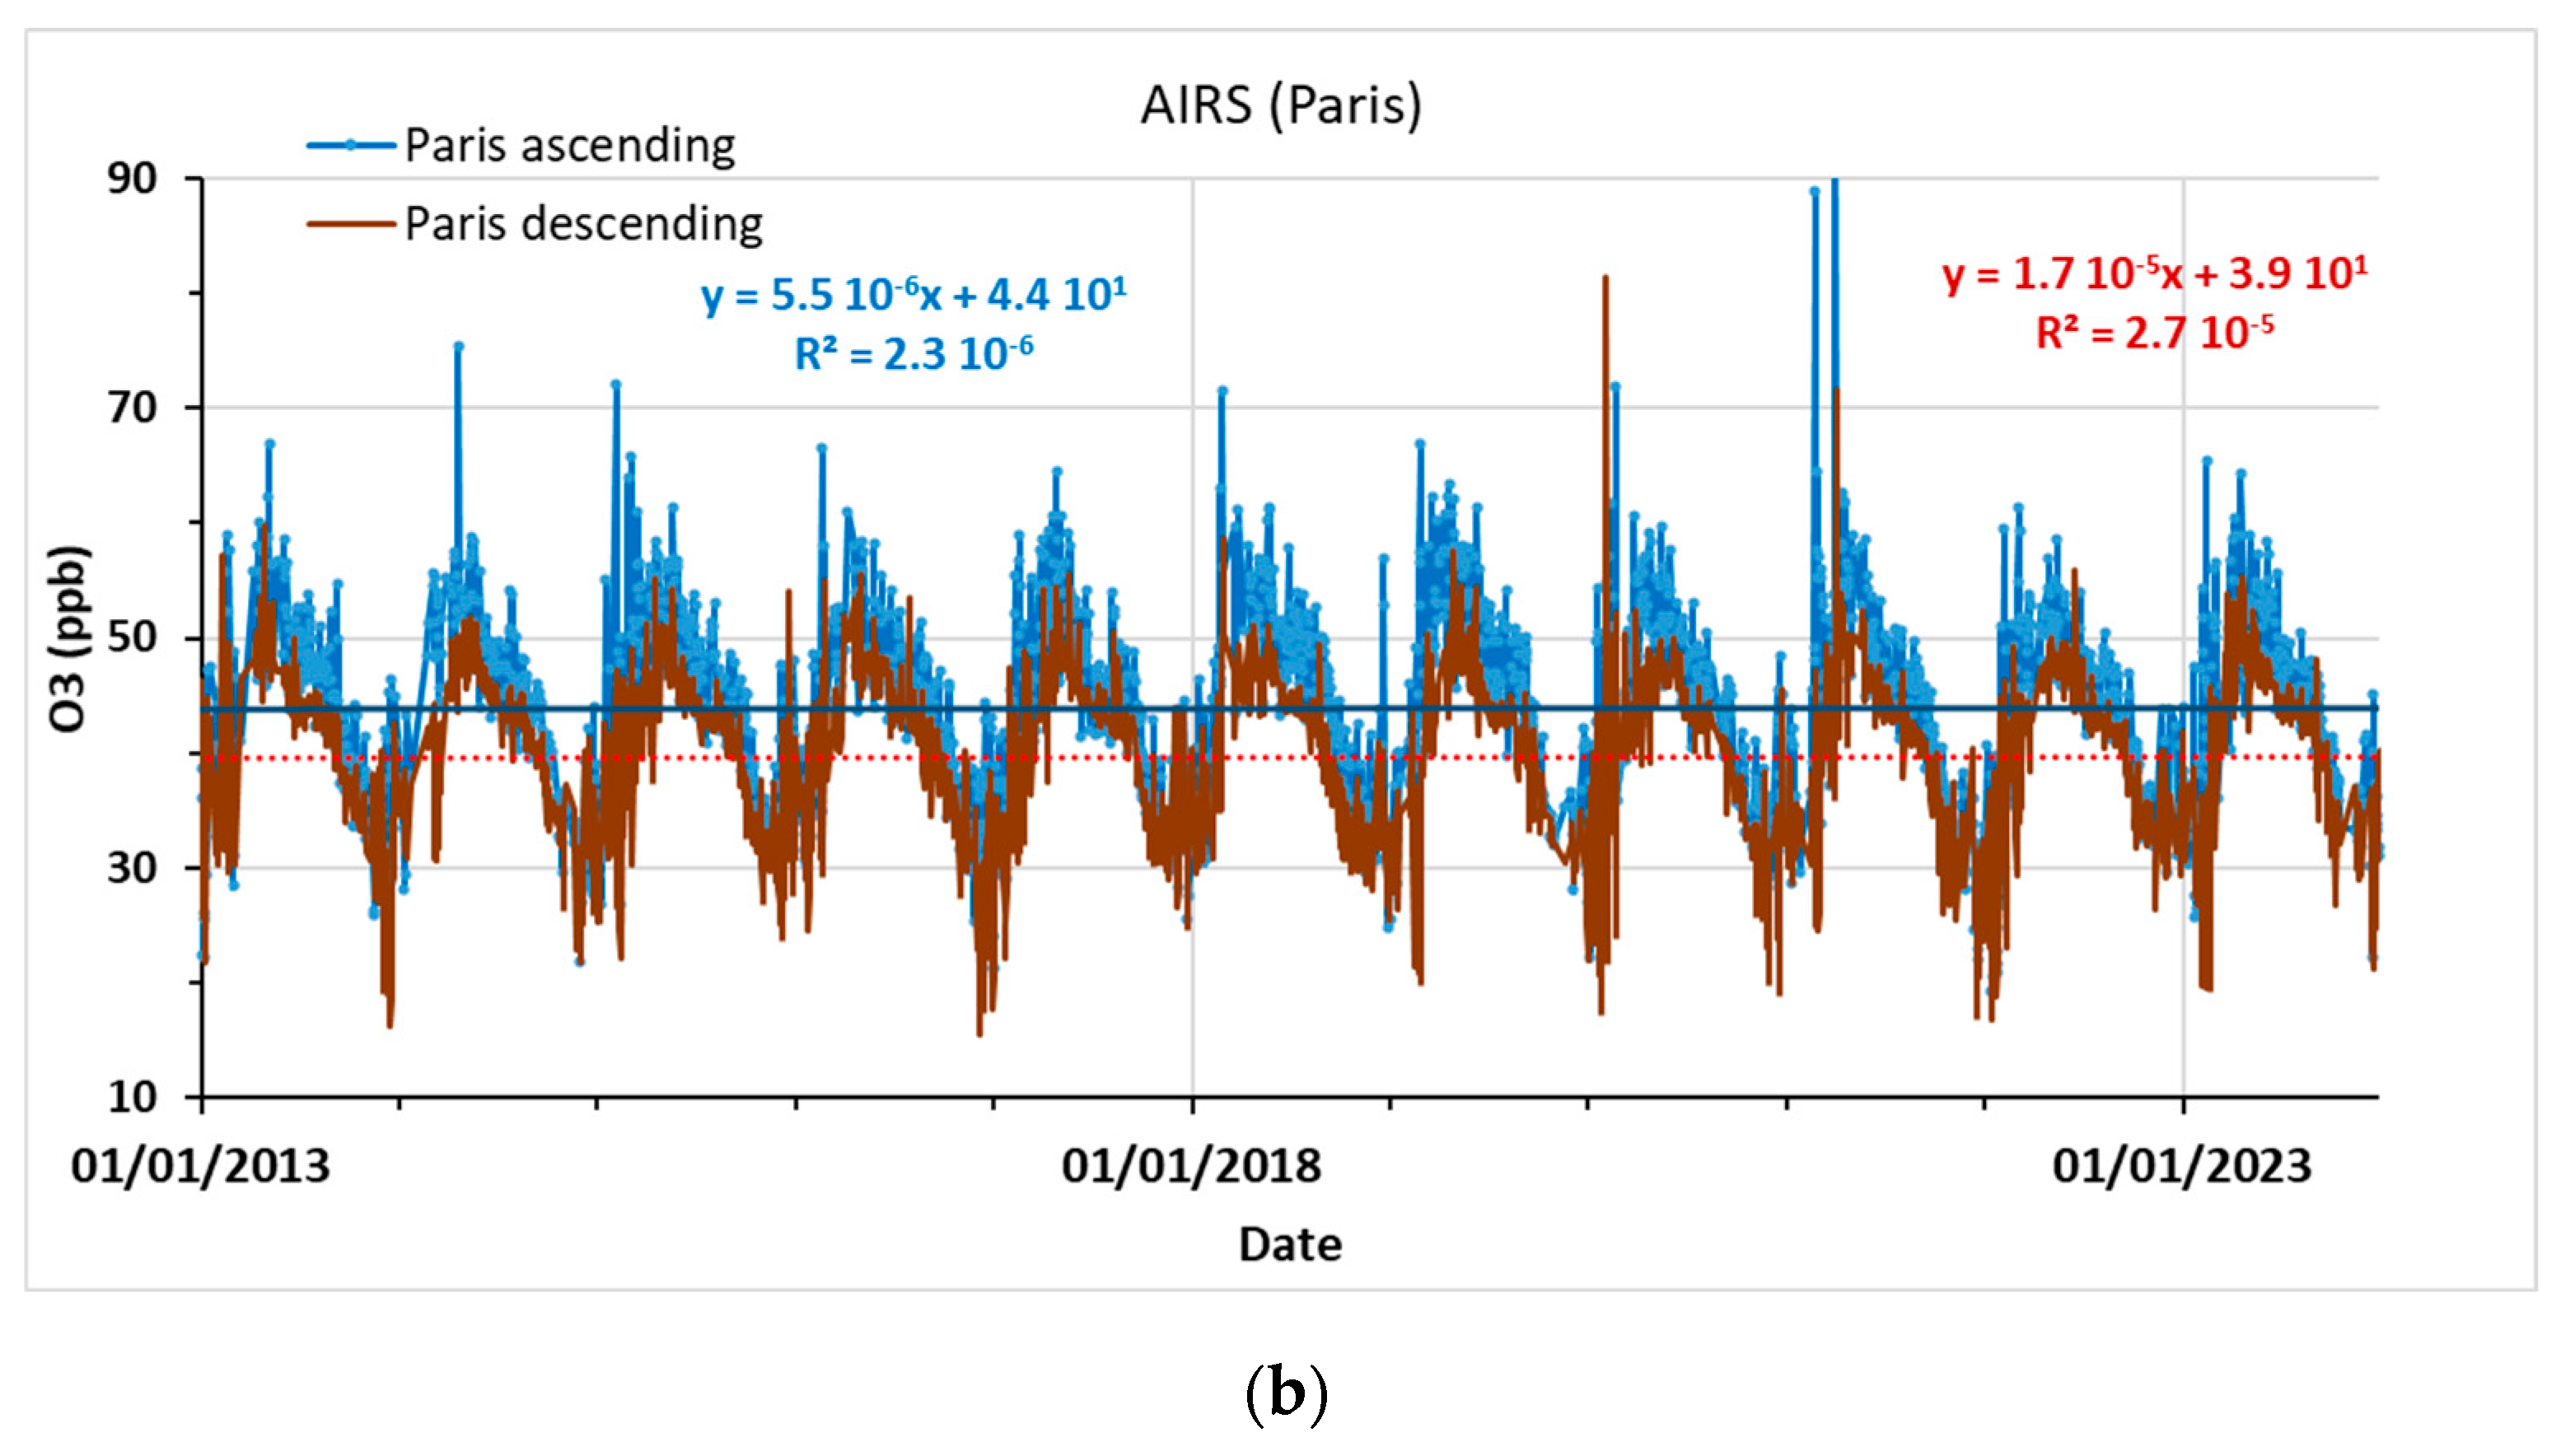
Both in Cairo and Paris, the examination of the daytime (ascending) and nighttime (descending) AIRS data for 1000 hPa does not reveal any trend in the ozone concentration between 2003 and 2023. Note that, for legibility, only the last 11 years of these time series are displayed in Figure 4a (Cairo) and Figure 4b (Paris), but the regressions were performed over the whole 21-year period.

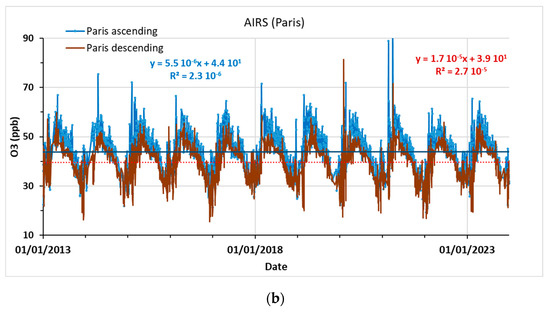
Figure 4.
Tropospheric ozone concentration measured by AIRS during the day (‘ascending’, at 1:00 p.m. local time, blue curve) and the night (‘descending’, at 1:30 a.m. local time, in brown) above Cairo (a) and Paris (b). For legibility, only the period of 2013–2024 is represented but the linear regression lines were calculated using the whole dataset (2003–2024).
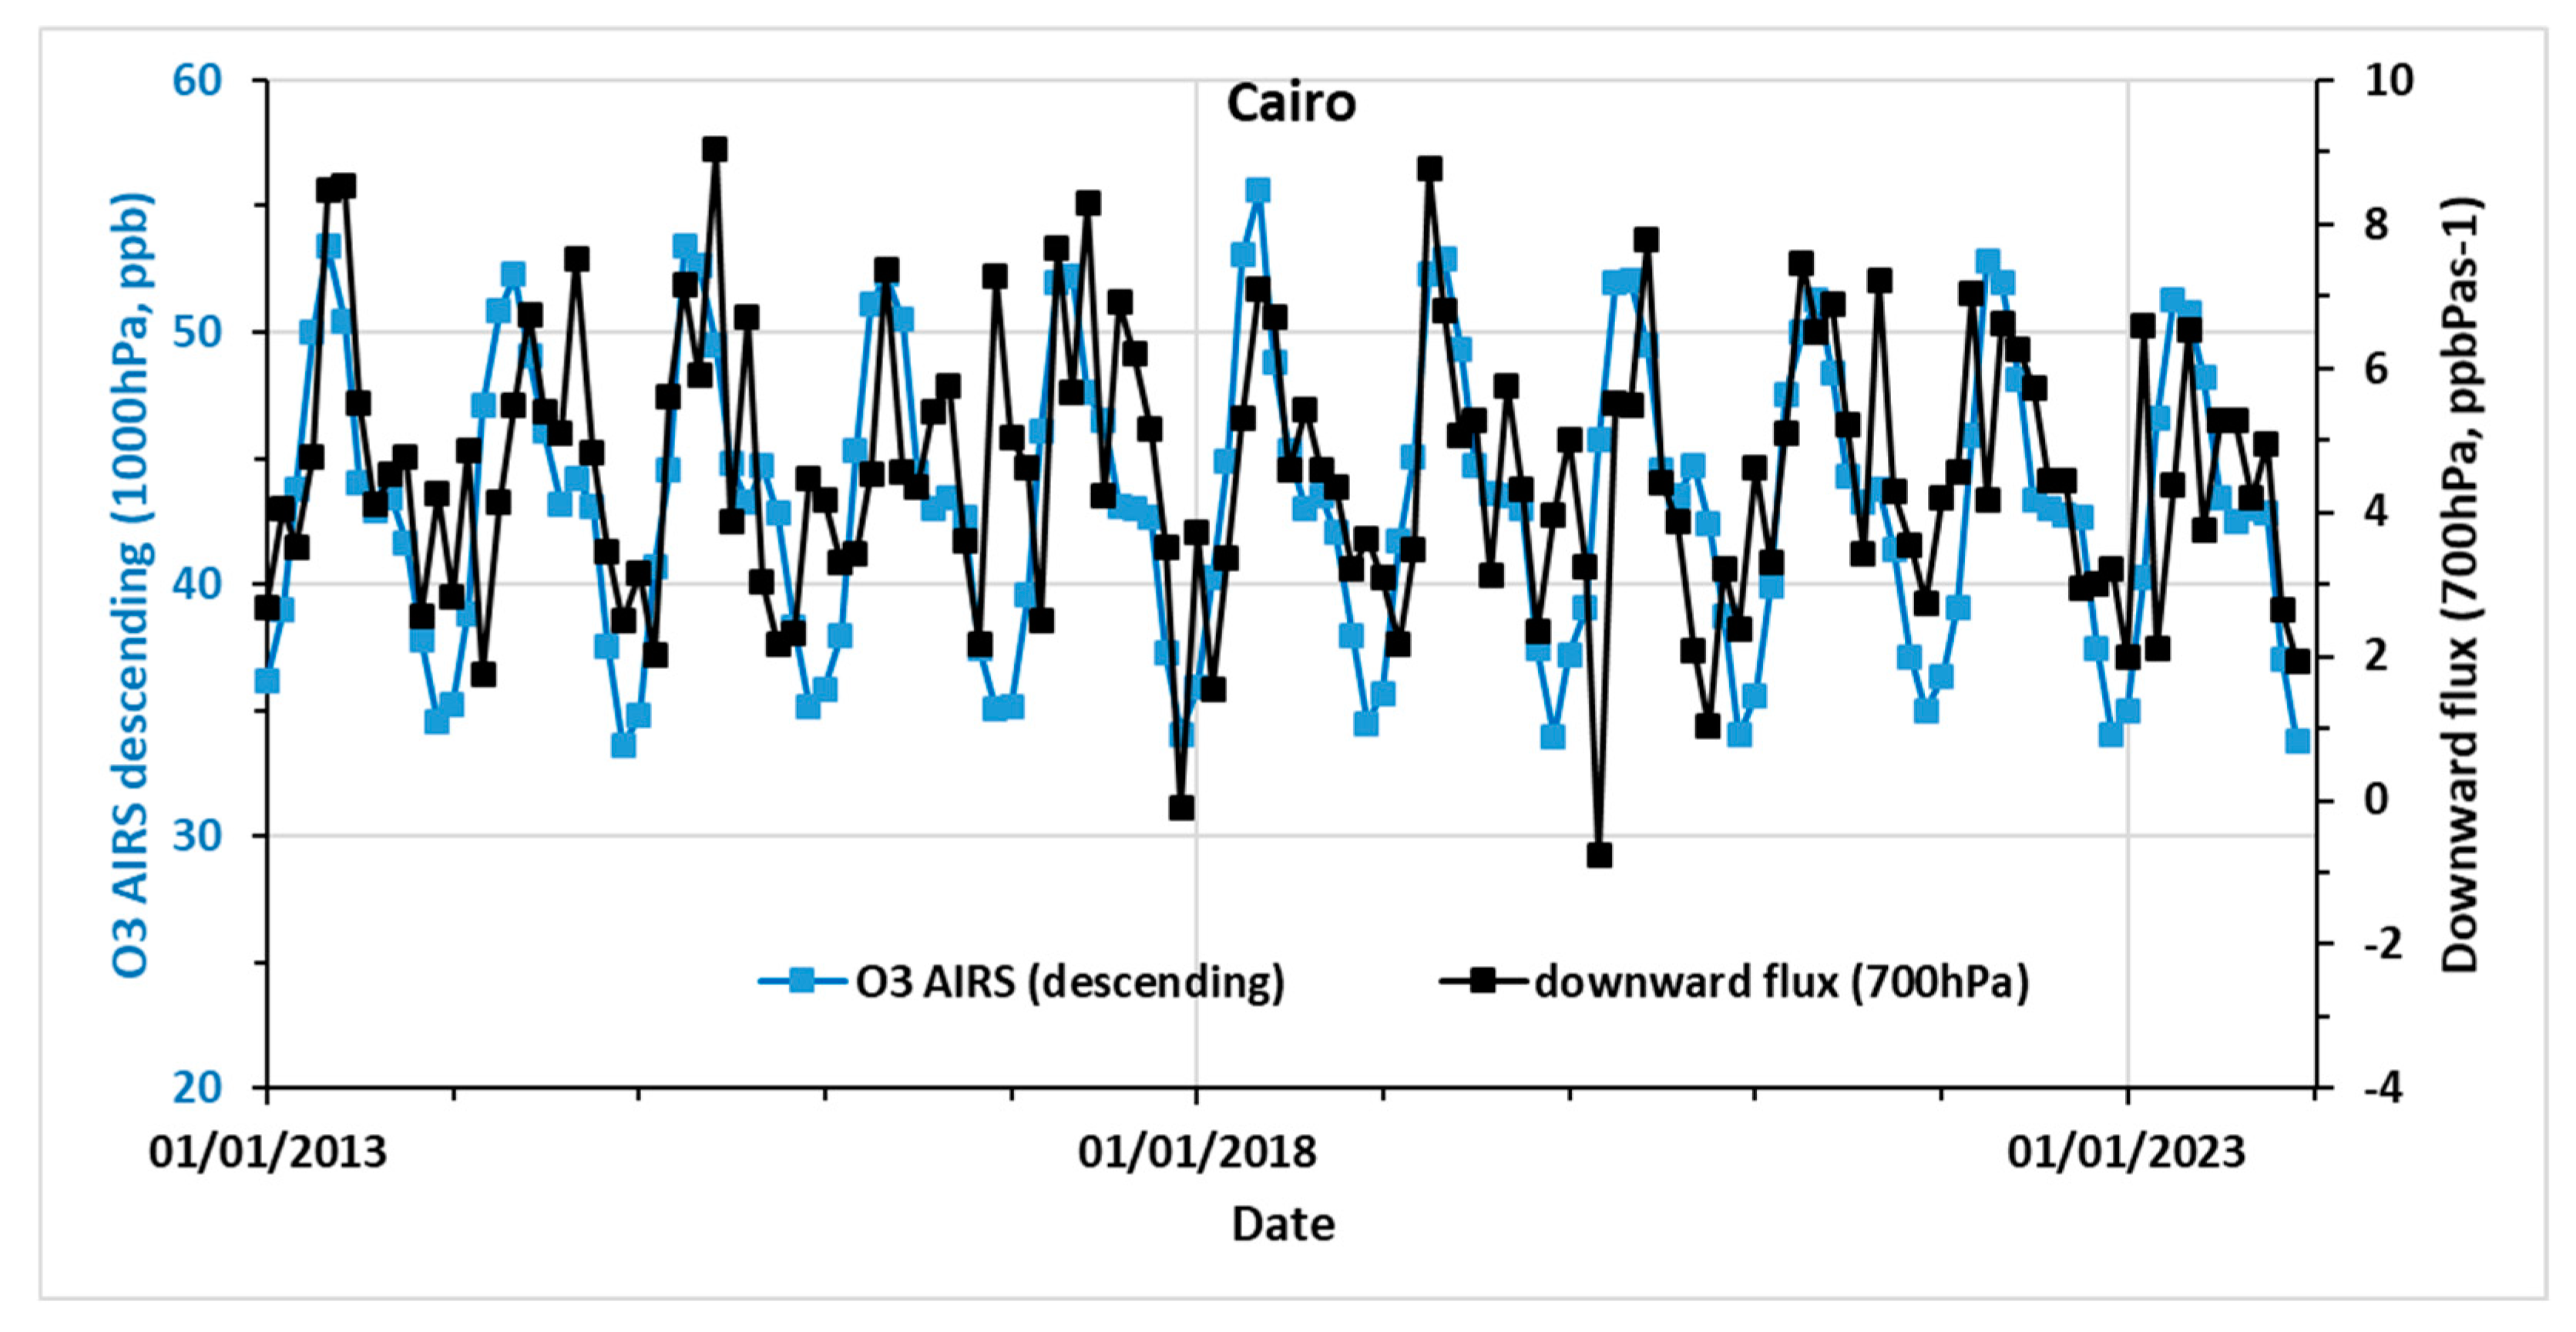
Above Cairo, AIRS detects a marked ozone maximum in spring and, at this time, the difference between the day and night concentrations is relatively small (Figure 4a). This suggests that the concentration peaks might not only be associated with photochemical production, which is active during the day, but also with subsidence of air masses with enhanced ozone mixing ratios from upper atmospheric levels. In order to confirm this assumption, the downward flux of ozone at the altitude of 700 hPa was evaluated (this altitude was chosen because it corresponds approximatively to the top of the lowest atmospheric layer ‘seen’ by the infrared sounders). The downward flux is simply the product of the ozone concentration at 700 hPa by the vertical velocity in pressure coordinates (Omega, in Pa·s−1) at the same altitude. Omega, which is positive when pointing downward, is one of the products of the MERRA-2 re-analyses and its values for 700 hPa were downloaded at a monthly resolution from the NASA Giovanni portal. The examination of the monthly variations in the downward flux reveals that it is maximal in April/May, which coincides with the peaks of ozone concentration measured by AIRS (Figure 5) and supports the subsidence hypothesis.

Figure 5.
Time series of the monthly ozone concentration detected by AIRS above Cairo (in blue) and of the downward ozone flux at 700 hPa (in black).
Conversely, in summer, the ozone concentration measured by AIRS above Cairo during the day is significantly larger than during the night (Figure 4a), which is consistent with the daytime production of ozone by photochemistry.
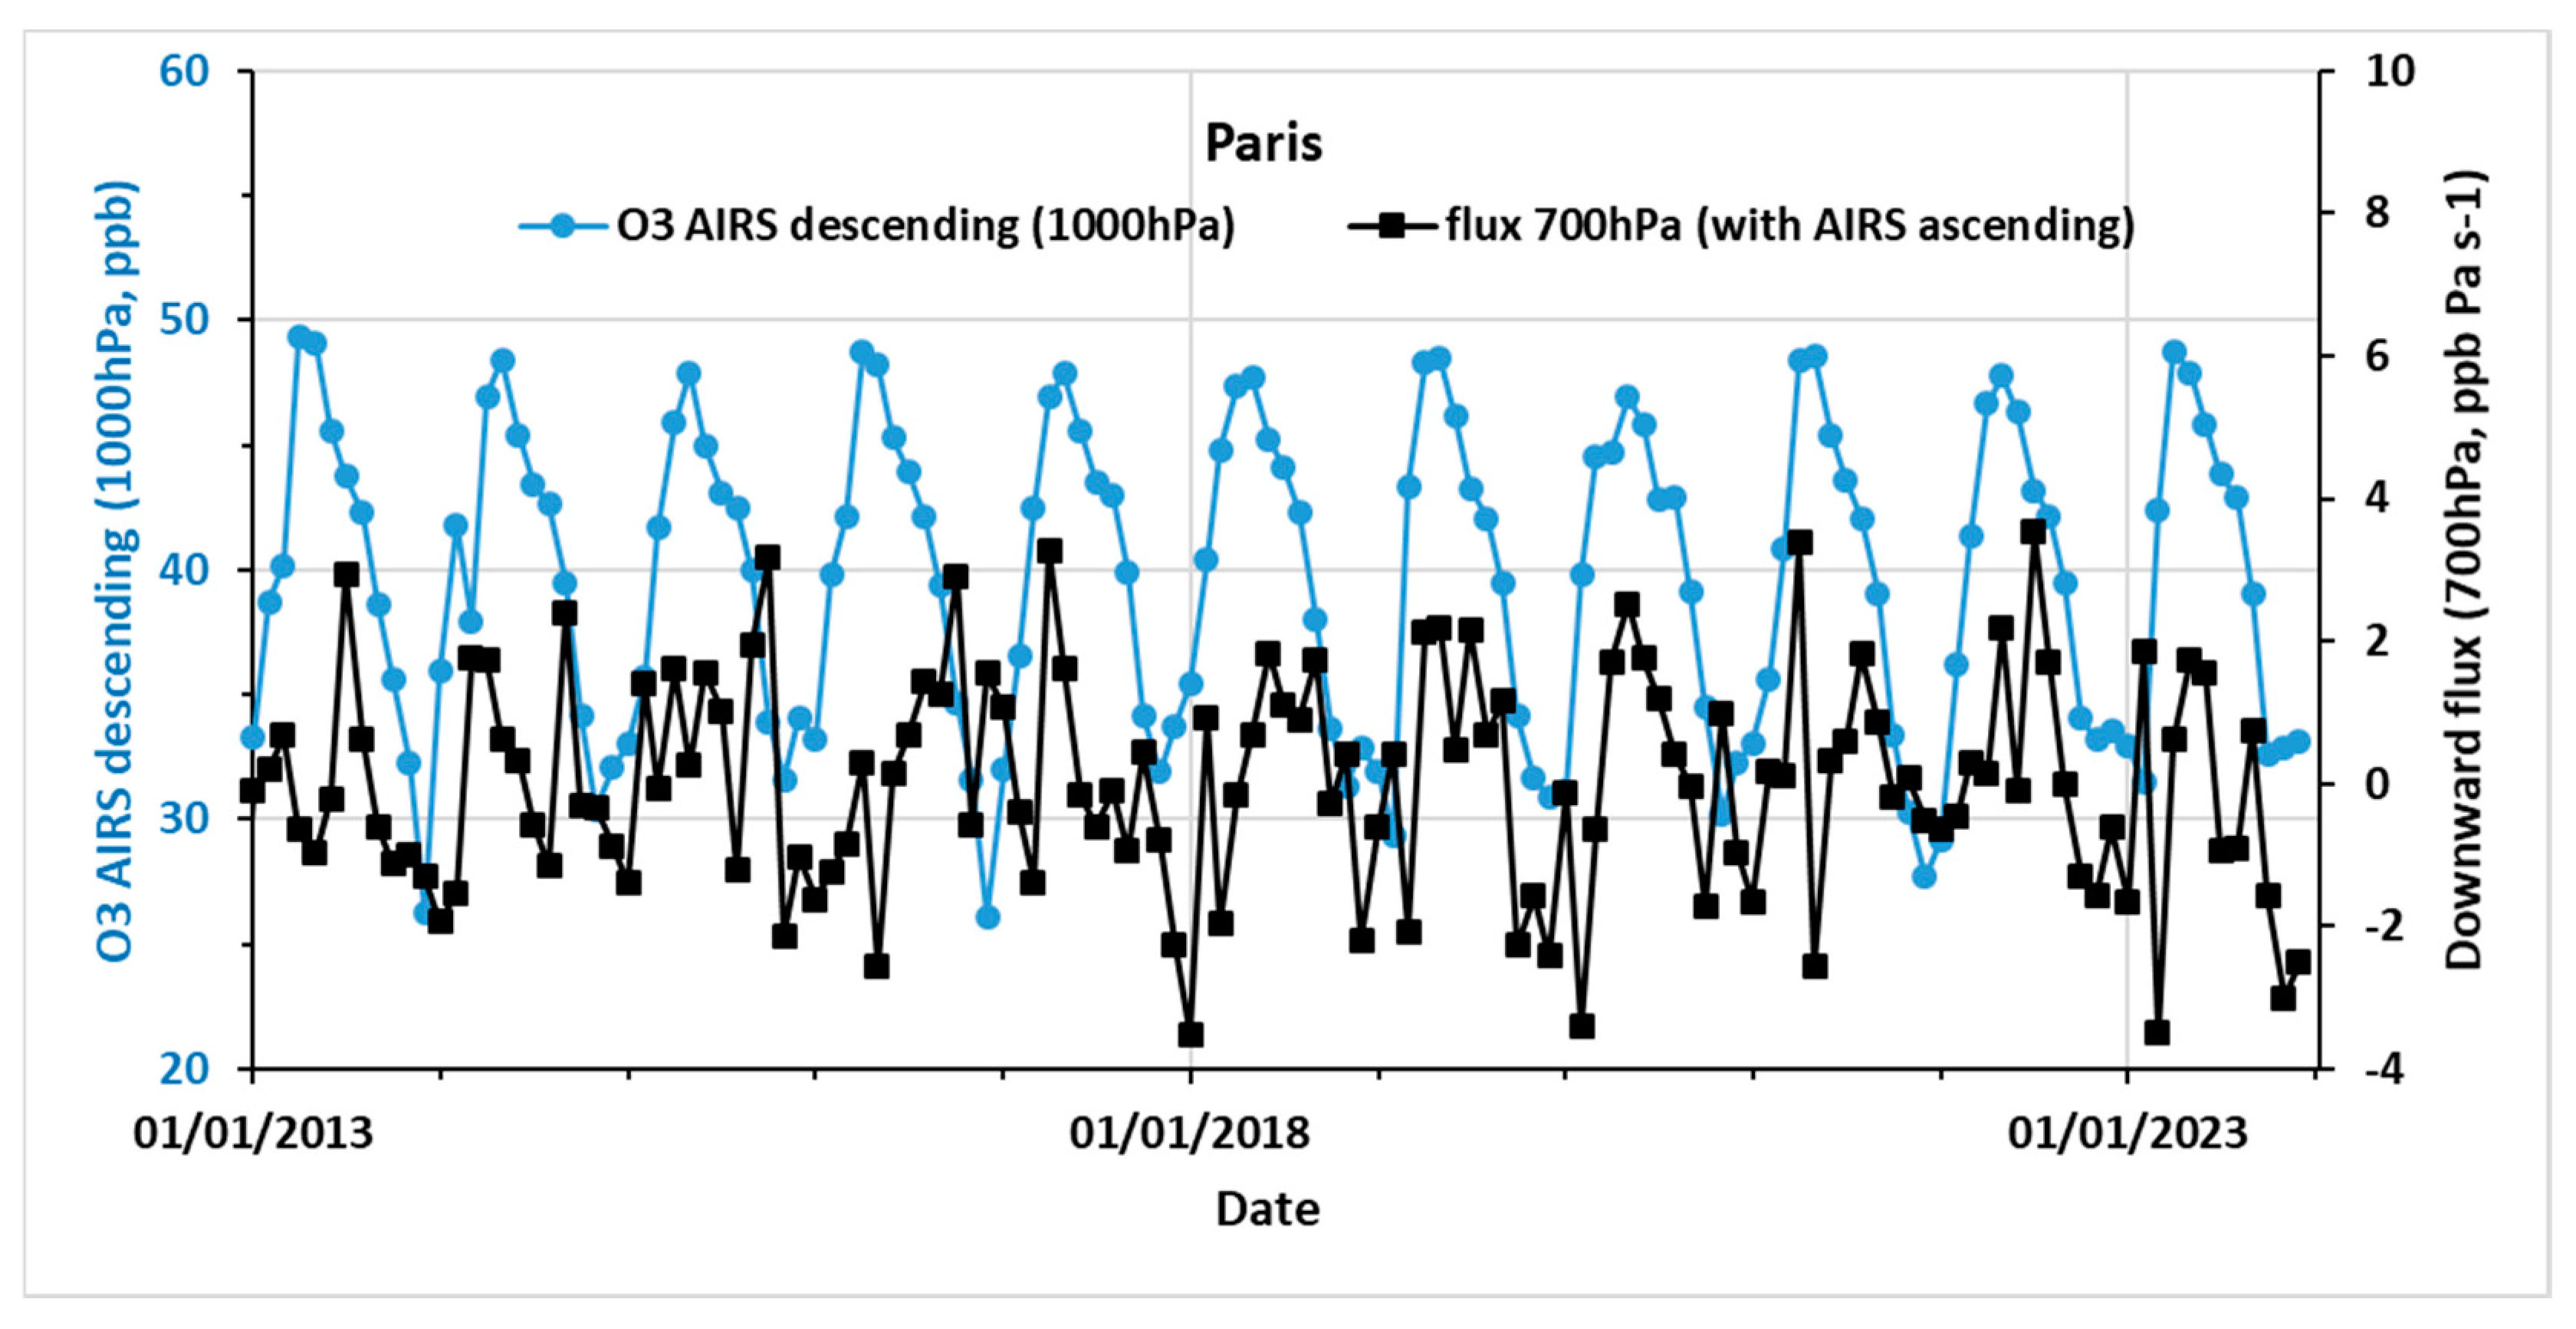
Above Paris, the maxima of ozone concentration are also detected in spring by AIRS (Figure 4b). However, these spring maxima cannot be explained by subsidence. Indeed, the average downward flux at 700 hPa is not only found to be much lower than in Cairo (0.1 ± 1.5 and 4.7 ± 1.8 ppb·Pa·s−1, respectively), but it is also not characterized by a clear spring maximum (Figure 6), as it was above the Egyptian capital.
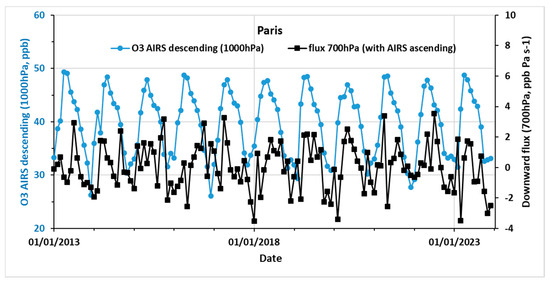
Figure 6.
Same as Figure 5, but for Paris.
3.2.2. IASI+GOME2
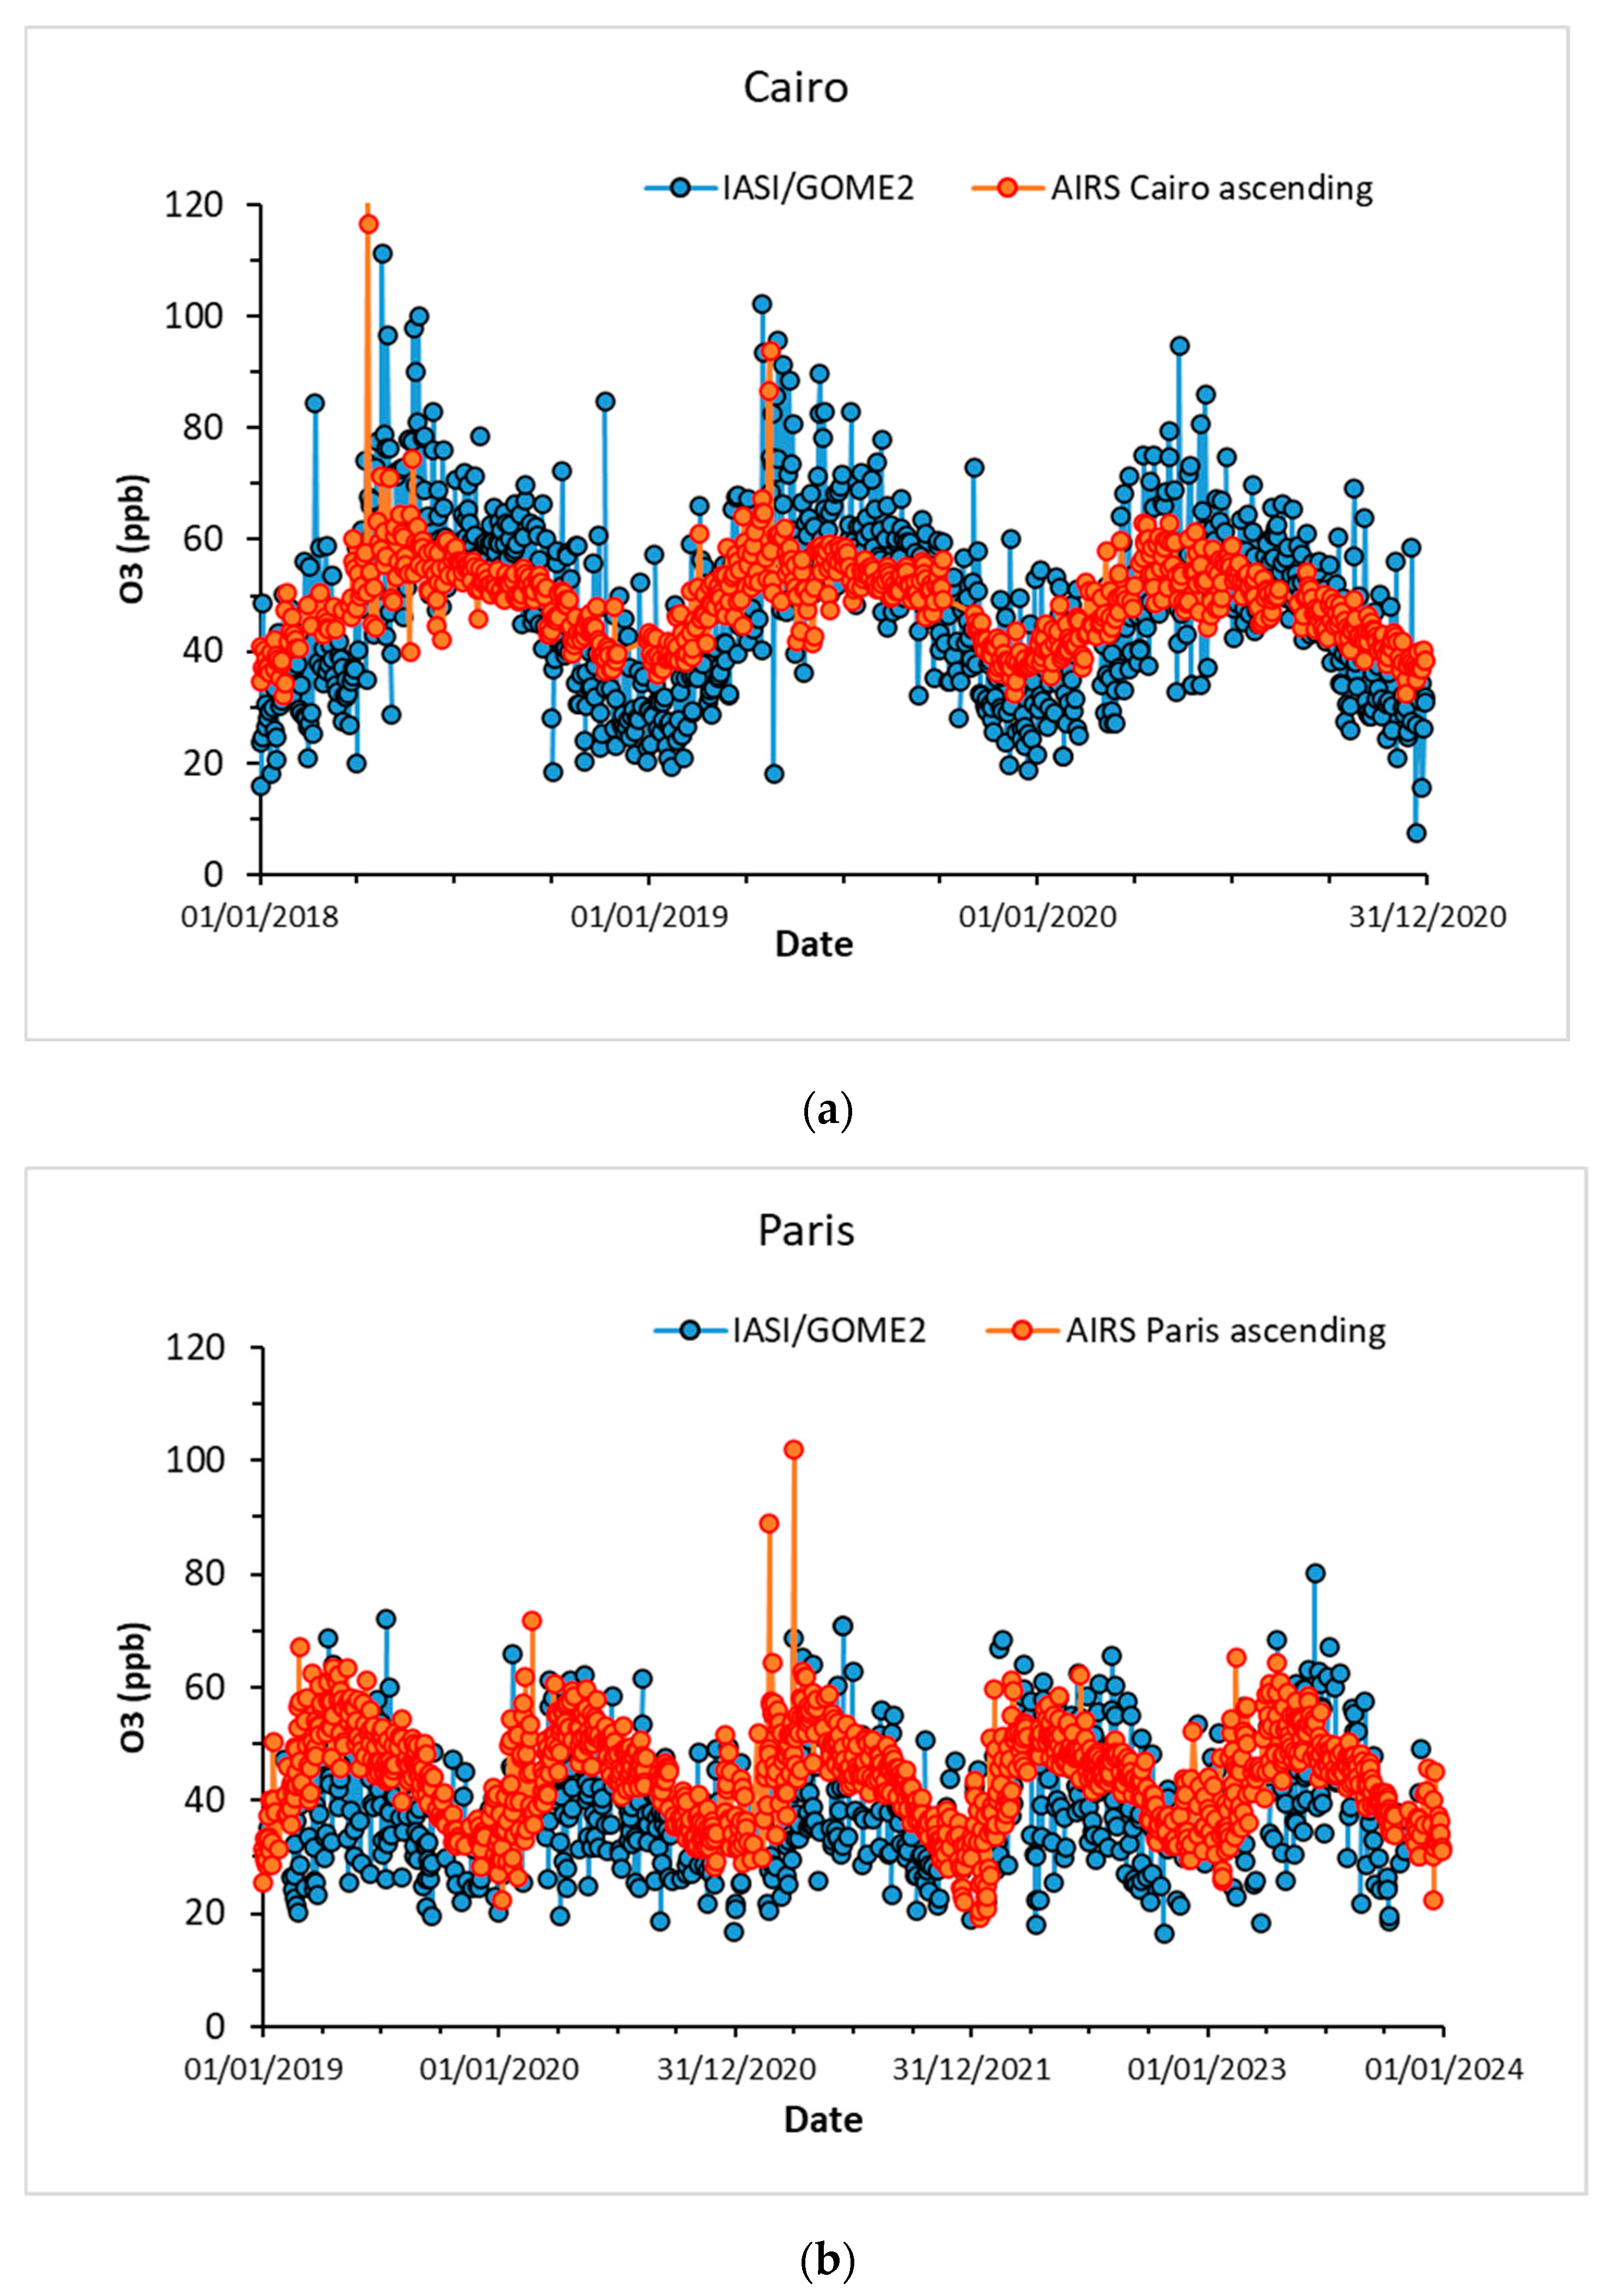
In Cairo, the amplitude of the seasonal variation in ozone retrieved by IASI+GOME2 is more pronounced than that from AIRS (Figure 7a). The spring maximum is present but there is also a secondary maximum in summer, which was not the case with AIRS. There is also more day-to-day variability in the IASI+GOME2 observations as compared to AIRS data.
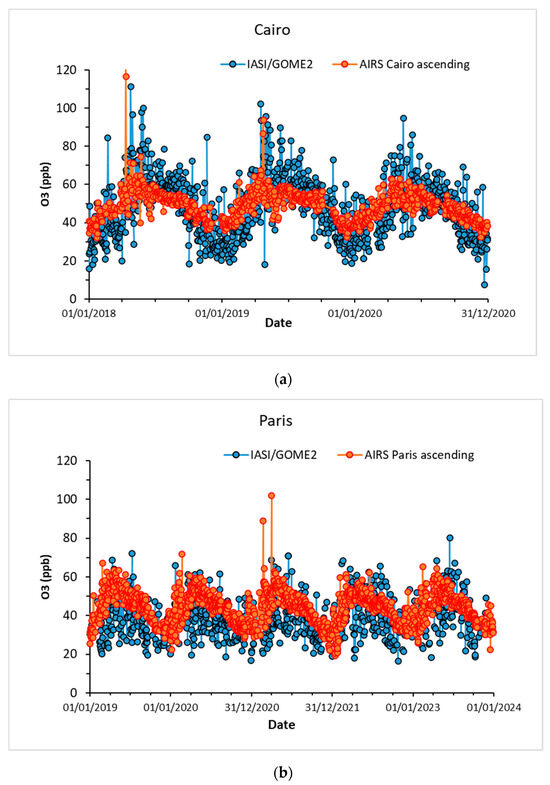
Figure 7.
Comparison of daytime observations of the ozone concentration from AIRS (at 1:30 p.m., local time) and IASI+GOME2 (at 9:30 a.m., local time) over Cairo (a) and Paris (b).
In Paris, the two soundings (Figure 7b), and particularly the IASI+GOME2 ones, appear to be more fluctuating (with probably larger relative errors) than in Cairo. Moreover, numerous unusually low concentrations (i.e., around 20 to 30 ppb) are derived by IASI+GOME2 in the spring and summer months.
3.3. Comparison with the Surface Observations
3.3.1. Correlation Between the Sounders’ Retrievals and the Surface Observations
A linear regression analysis was first performed to quantify the correlation between the daily satellite sounders retrievals and the surface observations (Cmean and C8max). The slope (a), vertical intercept (b), and R2 obtained by this method are reported for both Paris and Cairo in Table 3. In all cases, R2 is <0.35 (R < 0.59), which shows that the two sounders show moderate skills to retrieve the variability in the mean and extreme values of ozone concentration directly at surface level at a daily resolution. Moreover, the positive and large values of b (>23.9 ppb) indicate that the two sounders systematically derive larger concentrations than those at the surface. This is likely explained by a sensitivity of satellite retrievals to ozone concentrations at atmospheric levels higher than the surface. In the case of Cairo, the slope of the linear regression of the multispectral retrieval IASI+GOME2 is close to 1 (0.85), suggesting an amplitude of variability near that of the surface mean ozone concentrations. With slopes clearly lower than 1, the variability in the satellite retrievals (both AIRS and IASI+GOME2) over Paris is lower than that of the surface fluctuations.
Table 3.
Linear regression parameters (slope a, vertical intercept b, and R2) from comparing AIRS and IASI+GOME2 (IASI+G) retrievals to the surface observations (mean concentration, Cmean, and maximal 8 h sliding average, C8max) performed in Paris and Cairo. Three different temporal resolutions are considered (daily, weekly, and monthly).
The linear regression of the datasets was also analyzed in terms of weekly and monthly averages. At these scales, the variabilities of the satellite retrievals match those of surface concentrations much better, with slopes closer to 1, and larger correlation coefficients R2. This agreement is particularly marked at the monthly resolution in Cairo with IASI+GOME2, and for both Cmean (a = 1.08, R2 = 0.82) and C8max (a = 0.78, R2 = 0.77). However, with b values always above 16.9 ppb, there is still a positive bias in the satellite retrievals. Interestingly, at all temporal resolutions and in the two megacities, this bias of AIRS is always larger than for IASI+GOME2. More generally, IASI+GOME2 performs significantly better (a closer to 1, larger R2, and lower b) than AIRS in Cairo. Conversely, despite lower b values of IASI+GOME2, the other indicators (a and R2) are larger for AIRS in Paris. In this last city, it is only at the monthly resolution that the R2 of IASI+GOME2 and AIRS become similar.
3.3.2. A Proxy of Surface Concentrations by Linear Adjustment of Satellite Retrievals
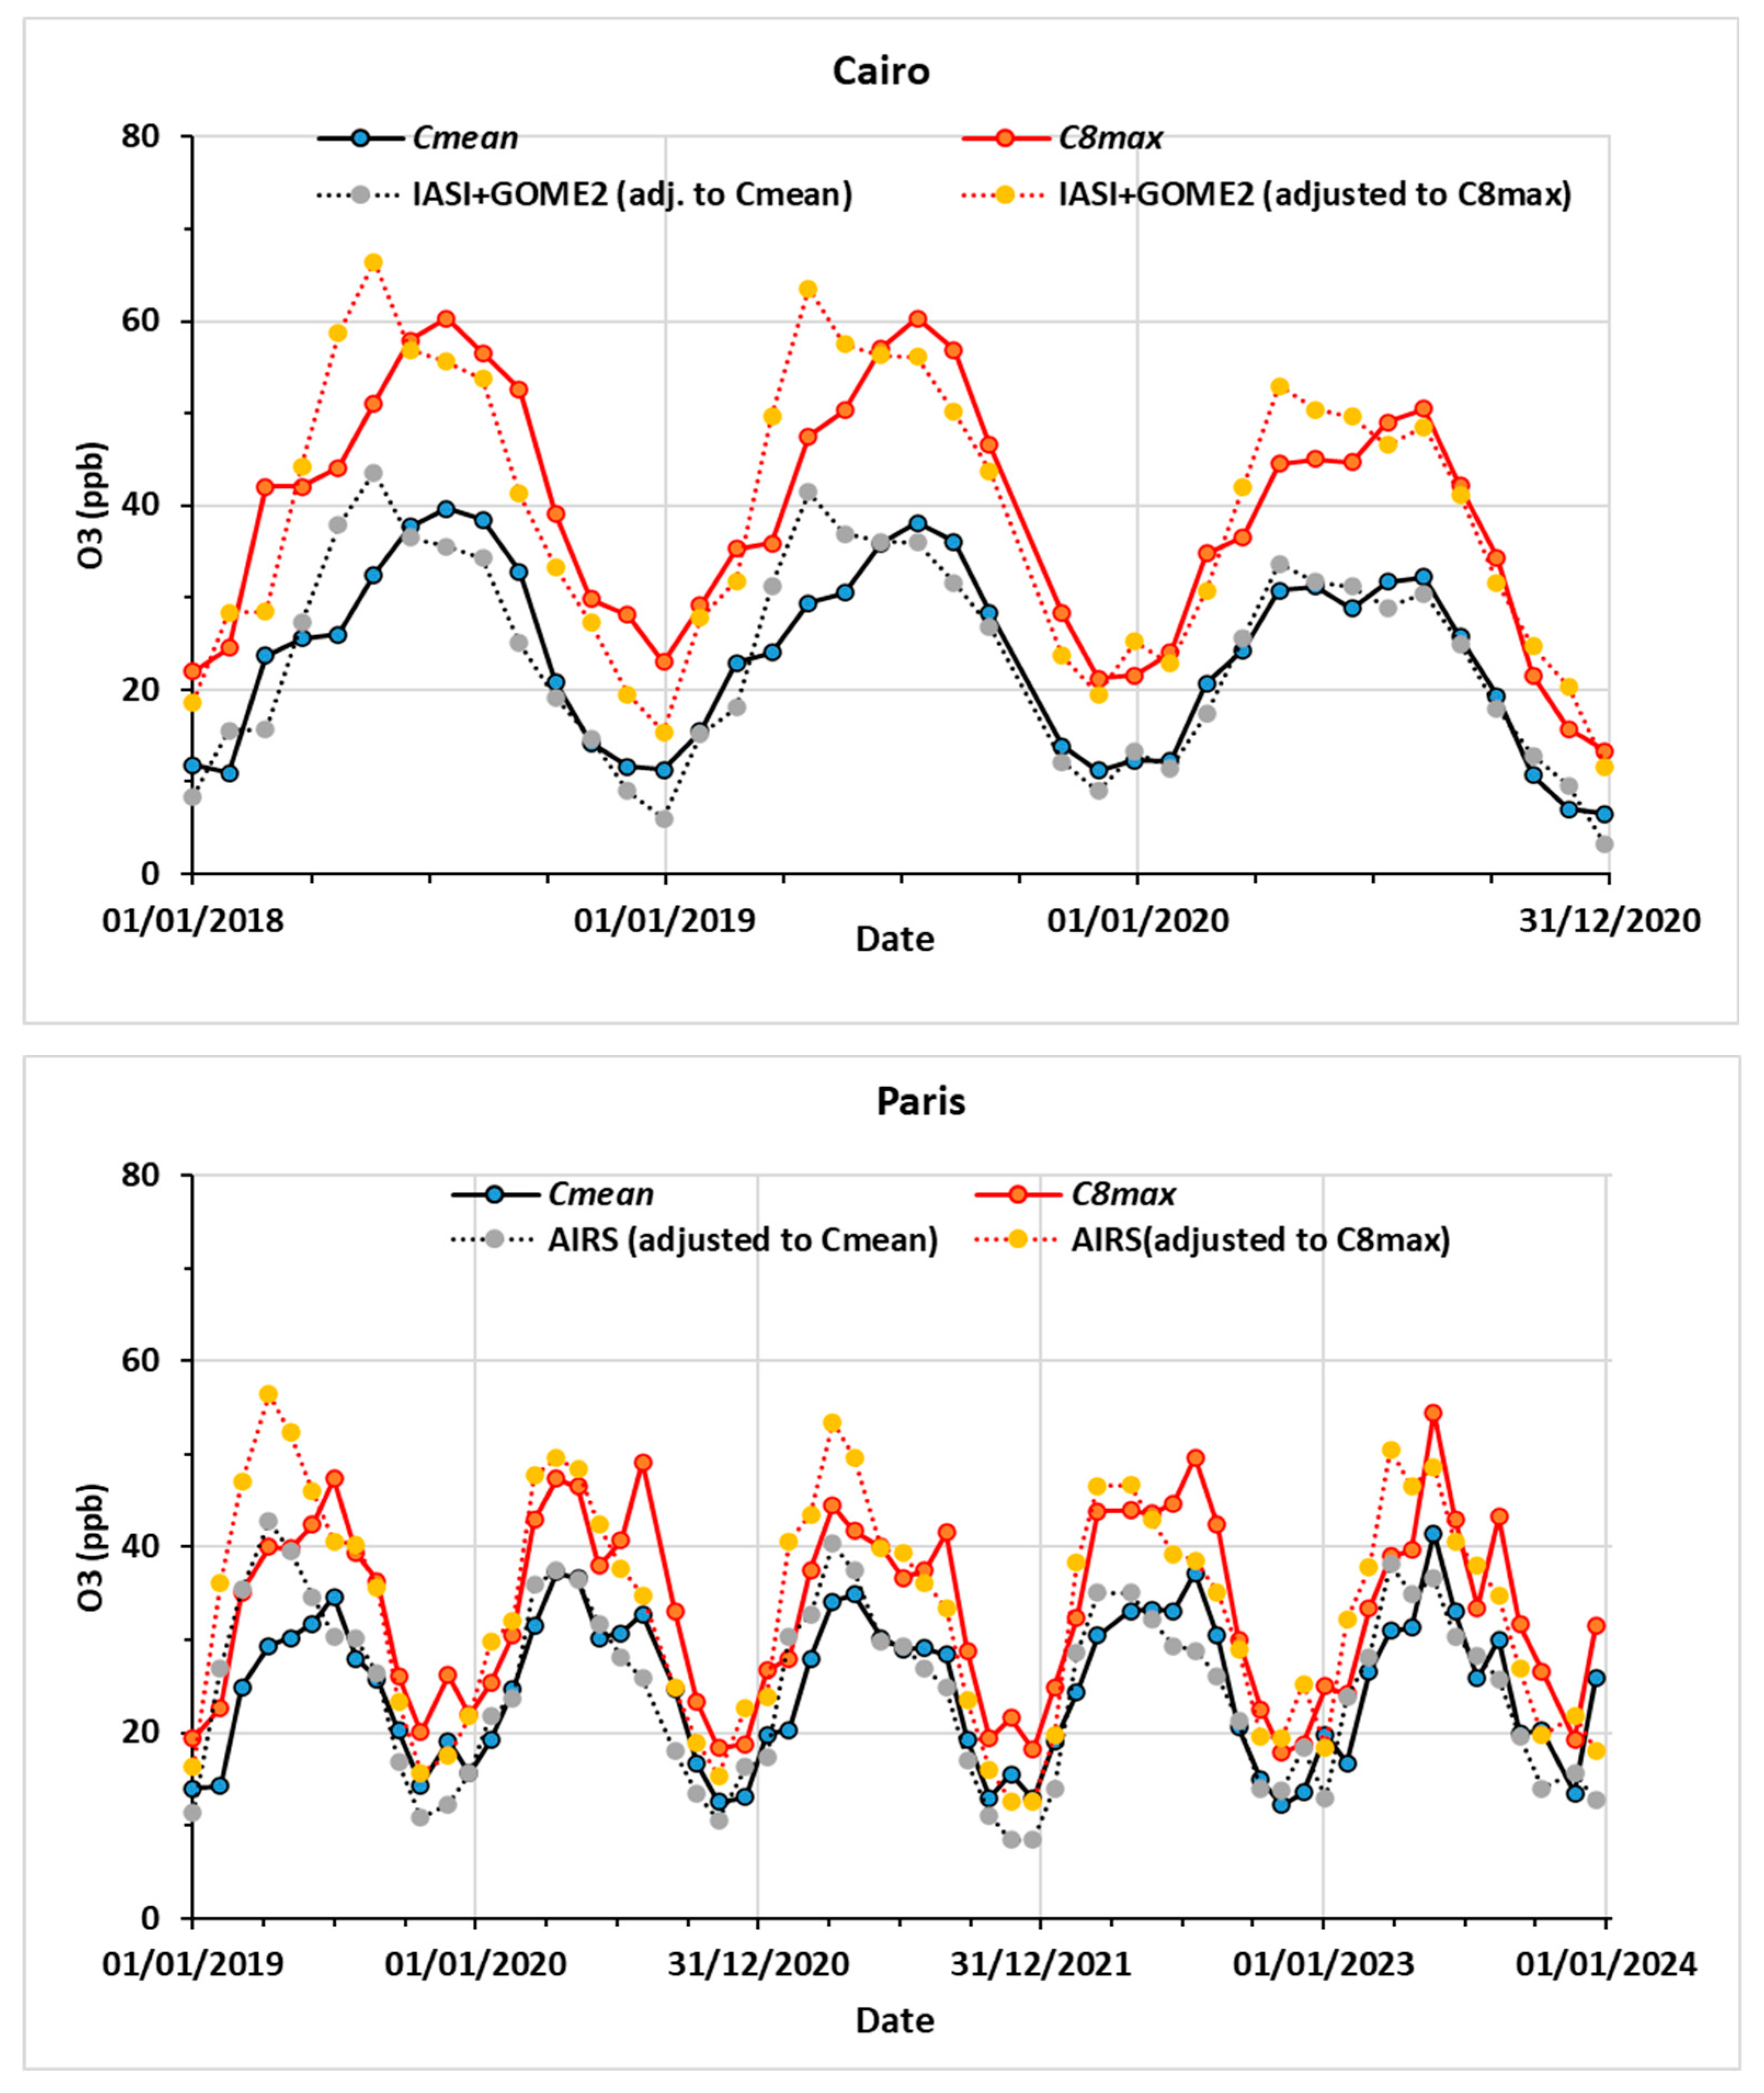
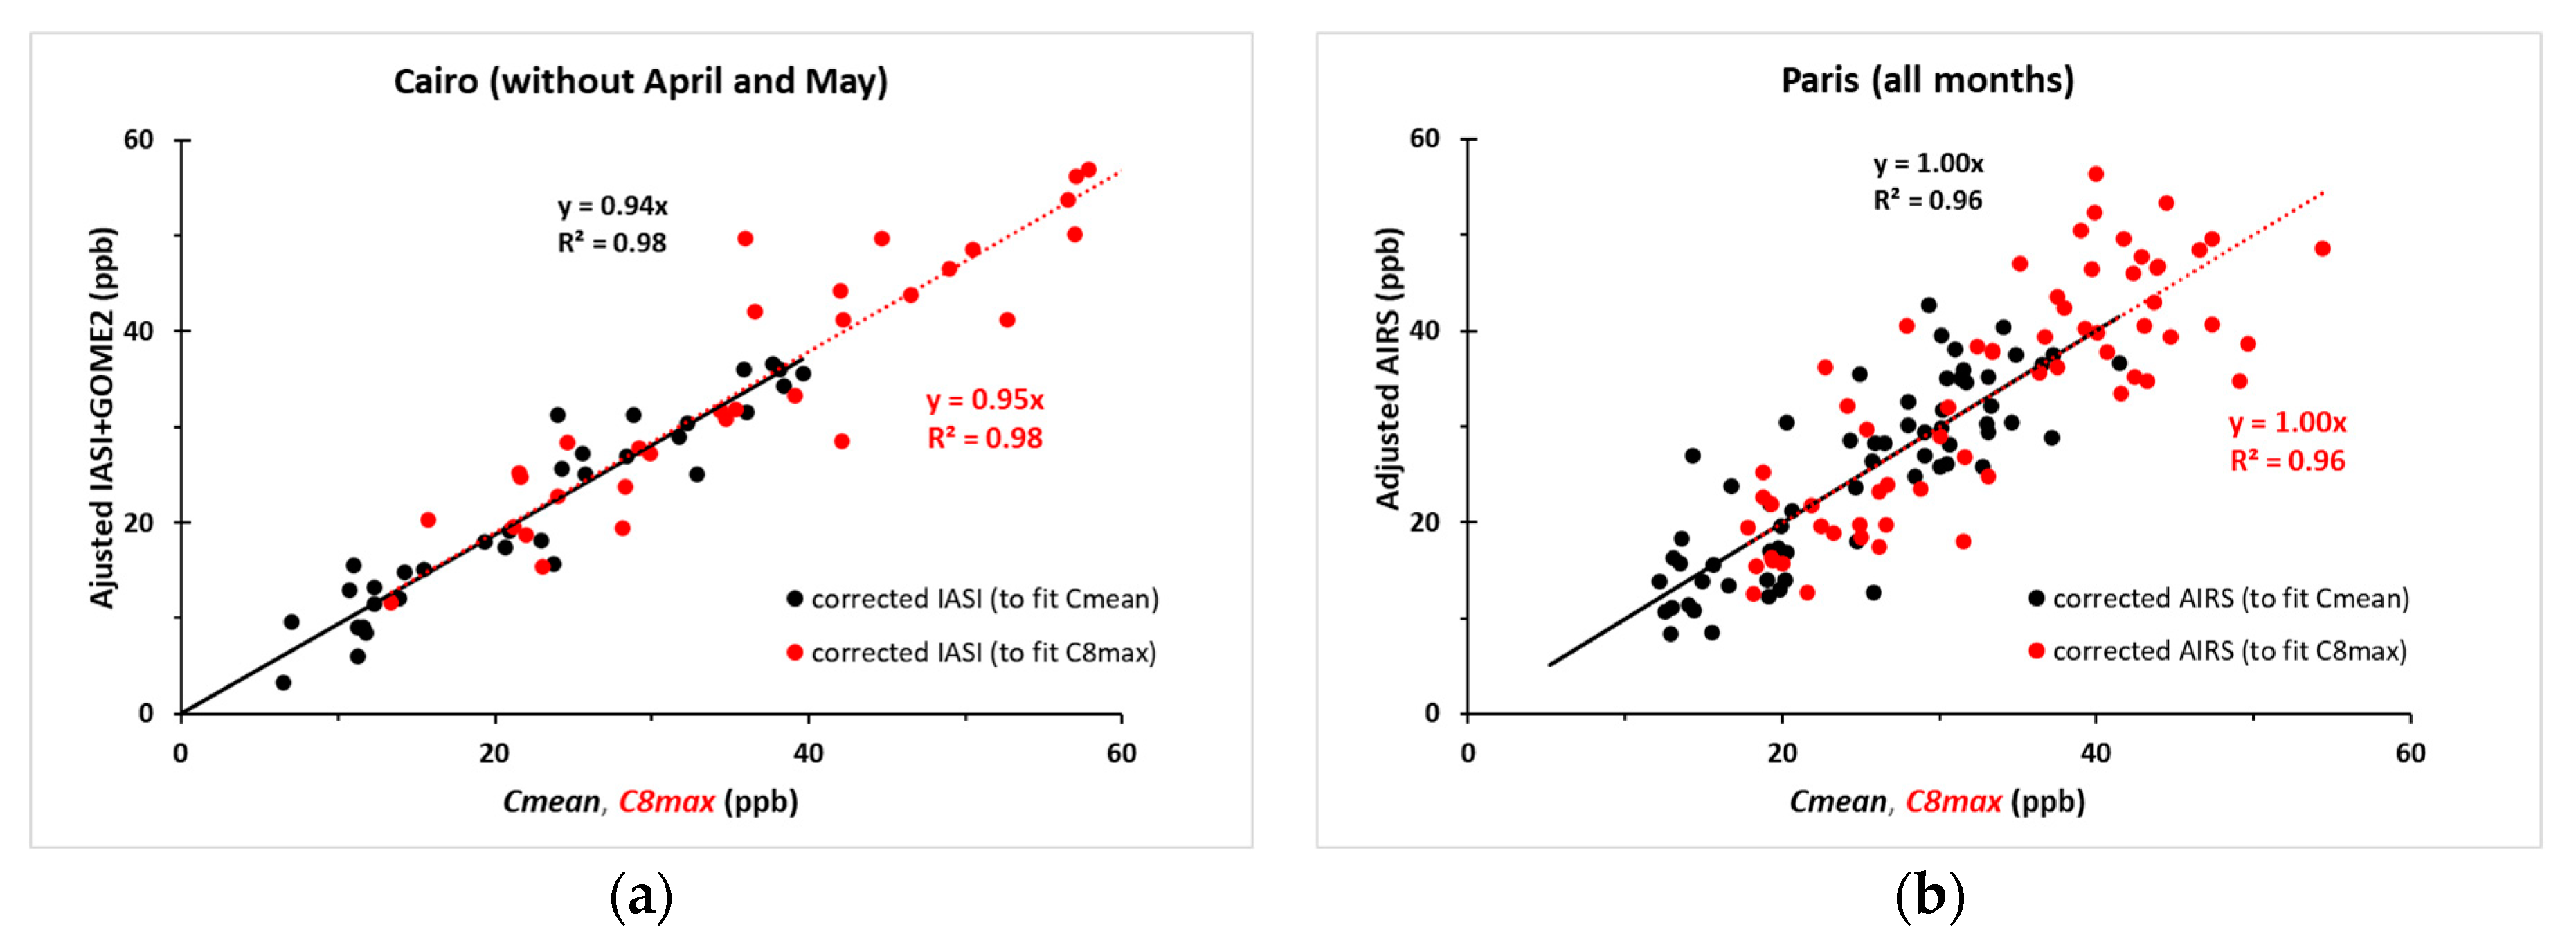
At a monthly resolution, the significantly high linear correlation of IASI+GOME2 (in Cairo) and AIRS (in Paris) products with respect to the surface observations suggests that these satellite observations may be used to depict surface ozone variability. We may also derive a proxy of ozone surface concentrations based on a linear adjustment of the satellite products. For this, we subtract the vertical intercept (b) and divide by the slope (a) to compensate for limitations in sensitivity to surface ozone dynamics. The results for both Cmean and C8max (Figure 8) show that the adjusted satellite measurements usually reproduce the magnitude and monthly variations in Cmean and C8max fairly well, except in April and May in Cairo, when they clearly overestimate the surface concentrations. When not considering these two particular months, the agreement between the IASI+GOME2 adjusted data and the observations of the surface station is very good (R2 = 0.86 and 0.90 for C8max and Cmean, respectively), as can be seen on Figure 9a. In Paris, the overestimation of the surface concentrations in April and May is not as systematic as in Cairo, and the correlation between the corrected AIRS and the surface data is not improved if these two months are discarded from the regression. For the sake of comparison, Figure 9b displays this correlation with all the months of the 2019–2023 period.

Figure 8.
Comparison of the concentrations (Cmean and C8max) measured at the surface in Cairo (top panel) and Paris (bottom panel) with the linearly adjusted retrievals of the IASI+GOME2 (Cairo) and AIRS (Paris) sounders.
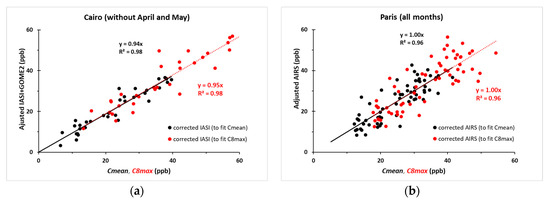
Figure 9.
Correlation between adjusted satellite retrievals and the surface observations C8max of Figure 8. Note that in Cairo, the months of April and May, which are biased by the effect of subsidence, were not included in the regression. Cairo (a) and Paris (b).
3.4. Discussion
3.4.1. Surface Observations
The analysis of the surface ozone concentrations in terms of Cmean and C8max showed that these values are larger in Cairo (Table 1) than in Paris (Table 2). For obvious geographical reasons, the shortwave solar radiation necessary to initiate photochemical reactions is less abundant in Paris than in Cairo. Local meteorological factors (cloud cover, rain, wind speed, temperature, etc.) also play a role and induce a stronger temporal variability in Paris than in Cairo. This difference in day-to-day variability can be evidenced by comparing the relative standard deviations of the daily C8max values of each month. The average of these relative standard deviations is 46 ± 20% in Paris (between 2019 and 2023), which is more than twice the values of Cairo (18 ± 5%, between 2018 and 2020).
Another important difference between Paris and Cairo is related to the sensibility of the ozone concentration to the reduction in anthropogenic activities. Our results confirm the fact already reported in the literature that the lockdown related to the COVID-19 pandemic in spring 2020 did not lead to a decrease in the ozone concentration [48,49]. The explanation proposed in the latter studies was that because the NOX emitted by motorized vehicles normally destroys ozone during the night in urban areas, the dramatic reduction in their concentration hindered nighttime ozone depletion, thus favoring its accumulation, and maintained the concentrations at their usual levels or even enhanced them. Incidentally, this lack of reduction associated with the emission of precursors suggests that the implementation of a low-emission zone (where the most polluting vehicles are not allowed access) in metropolitan Paris might not be as beneficial as expected, at least for ozone. However, the impact of the reduction in the surface concentration of other harmful pollutants of anthropogenic origin (particulate matter, NOx, etc.) would also need to be taken into account for a fair evaluation of any reduction policy.
Conversely, our results show a great impact of human activities on the surface ozone concentrations in Cairo. The fact that the reduction in NOx does not prevent the ozone concentration from decreasing, as it does in Paris, indicates that at least one other important sink must be active to compensate for the lack of nocturnal destruction. Although another specially dedicated study would be necessary to confirm this point, a potential candidate would be the air-suspended mineral dust particles. Indeed, this mineral component of the aerosol is ubiquitous in Cairo: previous studies showed that, depending on the season, it constitutes from 35 to 65% of the particulate matter smaller than 10 µm [50] and between 24 and 66% of that smaller than 1 µm [51]. Moreover, several studies (e.g., [52,53]) have shown that in the presence of desert dust, the concentration of ozone could be reduced as a result of its adsorption on the surface of mineral dust particles.
These findings indicate that promoting cleaner transportation means in the Egyptian capital would help reduce the health hazards linked not only to the exposure to ozone but also to other pollutants currently produced in great quantity by motorized traffic (NO2, anthropogenic PM or VOCs, etc.).
3.4.2. Observations of the Satellite Sounders
In urban areas, ozone precursors are emitted very close to the surface and their concentration is maximal in the planetary boundary layer (PBL). Consequently, this is also where the production of ozone during the day is expected to be the most efficient in the spring/summer/autumn months. In these months, the heating of the surface by solar radiation promotes the development of turbulent convection that tends to homogenize the concentration of trace species in the PBL. This results in the formation of the so-called ‘mixed-layer’, whose height depends on the degree of heating of the surface, and hence on the regional climate, but typically varies between a few hundreds of meters and a few km. Interestingly, the residence time of most ozone precursors is long enough (several h) to further favor the homogenization of their concentrations in metropolitan areas. The spatial variability in the meteorological parameters (insolation, temperature, humidity, etc.) driving their subsequent transformation into ozone is also limited at the scale of a megacity. As a result, as was shown for Paris, the point measurements performed at individual surface stations can be considered representative of areas whose lateral dimensions compare to the resolution of the satellite observations.
In the PBL, important ozone sinks such as deposition on the Earth’s surface, plants, removal by precipitations, or chemical reactions with other trace gazes are also active. Because of these sinks, the ozone concentration decreases dramatically when the production stops, which is to say during the night (or in winter), and the contrast with the day (or summer) is important.
The vertical resolution of the sounders’ observations in the lower troposphere is not precisely documented but the estimates indicate that their sensitivity is the largest around 2.0 to 2.5 km when multispectral methods are used (IASI+GOME2; [38]), or between 3 and 4 km when only measurements in the TIR are used for the retrievals. This means that the observations of the satellite-borne instruments are not directly sensitive to ozone concentrations at the surface level. Even in the best of cases, which is to say when the PBL is fully developed like in Cairo in spring and summer, the retrievals are related to the top part of the PBL but also include more or less thick layers of the free troposphere where the ozone concentration is usually larger and less variable than in the PBL. This explains, on the one hand, that the sounders systematically overestimate the surface concentrations, and, on the other hand, that their performance at a daily resolution is more limited (particularly over Paris). Regarding the first point, the overestimation is expected to increase with the thickness of the free tropospheric levels observed by the sounder above the PBL. In other words, the positive bias (b) should be the smallest when the vertical resolution of the retrieval method is the finest. Therefore, the fact that the b values of IASI+GOME2 are smaller than those of AIRS in both Paris and Cairo (Table 3) is consistent with a finer vertical resolution of the multispectral method close to the surface.
Regarding the temporal resolution, the correlation between surface and satellite data at a weekly scale is notably larger. Thus, despite the aforementioned shortcomings, satellite retrievals are able to depict the variability in surface ozone over the two megacities at these scales. A linear adjustment of satellite-derived concentrations may then provide a proxy of surface concentrations. At a monthly resolution, the results of IASI+GOME2 are very good in Cairo (R2 = 0.82 and 0.77 for Cmean and C8max, respectively), and they become excellent (R2 = 0.90 and 0.86, respectively) if the months of April and May are not considered in the regression. In these two months, the retrievals of the satellite sounders are influenced by the subsidence of ozone-enriched air-masses from upper levels. At the surface, the effect of subsidence is not detectable in ‘business as usual’ (BAU) years, most probably because it is masked by the relatively more important production of ozone by photochemistry (that has already started in these spring months). One exception to this rule might be spring 2020, when a clear peak of ozone concentration was observed at the surface station (Figure 1; right panel).
In Paris, there is also no visual evidence of subsidence in the ozone time series at the surface. However, the day-to-day variability in the surface mean and maximal concentrations is larger than in Cairo, most probably because of meteorological factors such as more frequent clouds and rain. More abundant cloud contamination and more limited sensitivity (due to lower surface temperatures and less insolation, which decrease radiation sensed by satellites) may partly explain larger fluctuations in satellite-retrieved values over Paris than those observed by in situ measurements. These factors may also be seen at a monthly resolution, where satellite retrievals are less correlated with surface variations over Paris as compared to over Cairo. These last effects could be more enhanced for the IASI+GOME2 retrievals than for AIRS over Paris. A larger influence of a priori concentrations for AIRS (due to a more limited sensitivity associated with the use of a single spectral band) could also stabilize the retrieval in these conditions.
4. Summary and Conclusions
In this work, five years of hourly surface measurements of ozone concentration performed in Paris and Cairo were analyzed. These two megacities were chosen because they have different climates, and they are also under the influence of diverse sources of atmospheric trace components. For instance, mineral dust produced by wind erosion in the nearby deserts is a major aerosol component in Cairo, but not in Paris. The periods considered in the analysis include years of reduced activity (2013 and 2020 in Cairo; 2020 in Paris) whose difference in behavior with the BAU years might help better predict the efficiency of policies aiming at the reduction in the impact of ozone on human health.
In the two cities, the largest surface mean (Cmean) and maximal daily (C8max) concentrations are observed in the summer months. The fact that these two concentrations are strongly correlated (R2 > 0.86) indicates that the concentration peaks are, in their vast majority, due to the production of ozone by photochemistry and not to advection from other regions. In particular, subsidence from upper atmospheric levels plays a minor role in the variability in surface concentrations.
Ozone concentrations are larger in Cairo than in Paris: in 2018/2019, 64% of the C8max values were above the 35 ppb recommendation of the WHO in Cairo compared with 42% in Paris. Conversely, because of the different meteorological conditions, the day-to-day variability in the ozone concentration is more pronounced in Paris than in Cairo.
Another notable difference between the two cities is the impact of a reduction in anthropogenic activities, and therefore of the emission of ozone precursors. In Paris, the severe lockdown of the COVID-19 period (2020) did not lead to a reduction in the ozone concentration. Conversely, in Cairo, the ozone concentration dropped dramatically during the 2013 and 2020 periods of reduced traffic. A possible explanation of this difference is the massive presence in Cairo of air-suspended mineral dust particles, on the surface of which ozone can be adsorbed. This adsorption can compensate for the lower efficiency of the nocturnal sink when the NOX emissions are reduced. Independently of this explanation, these observations show that measures favoring the reduction in traffic and/or the adoption of cleaner motorizations could reduce the health impact of ozone in Cairo but not in Paris. Note that more complete studies also taking into account the effect of other pollutants (PM, NO2…) would be necessary to fully assess the efficiency of such policies, but such extensive studies were beyond the scope of this work.
After verifying that the difference in spatial scale was not an obstacle for the comparison, the present work also assessed the possibility of exploiting satellite observations for retrieving the variations in ozone concentration measured directly at the surface, and not in the whole atmospheric column as is generally the case. In addition, the comparison was performed over unusually long durations of several years. Namely, two different methods were compared: the first one used the measurements of a single infrared sounder (AIRS), and the second one was more elaborated as it was based on the synergy of observations in the infrared (IASI) and UV (GOME-2) domains.
Although more in Paris than in Cairo, the two methods systematically depict ozone concentrations in the lower tropospheric levels larger than those measured at the surface level. This is due to the fact that the vertical resolution of the retrievals is not fine enough to see only the surface atmospheric layer, or even just the planetary boundary layer (PBL). Therefore, these satellite methods retrieve ozone concentrations of atmospheric levels including higher atmospheric levels with larger mixing ratios of ozone, and this causes the positive difference (b, in Table 3) of the satellite retrievals. In summary, this difference is expected to become smaller as the vertical resolution close to the surface becomes finer. This is consistent with the fact that, in Cairo and Paris, b is smaller for the combined method (IASI+GOME2) than for that based only on the observations in infrared (AIRS).
Because of larger fluctuations and limited sensitivity, the satellite retrievals over the Paris megacity show a limited correlation with respect to day-to-day variations in surface concentrations. At coarser temporal resolutions (weekly and monthly), variabilities of satellite retrievals are more similar to those observed at the surface.
In Cairo and at a monthly resolution, there is a high linear correlation (R2 > 0.79) between the IASI+GOME2 retrievals and the surface measurements. Implementing a linear adjustment, these multispectral satellite products are in excellent agreement (R2 > 0.90) with the surface observations in all months but April and May when the sounders are sensitive to the subsidence of air masses concentrated in ozone. At the surface, the effects of subsidence are not directly visible. This could either be due to the fact that down-welling air masses do not reach it, or rather that their impact is masked by the overwhelming springtime ozone increase associated with local photochemical production. Spring 2020 is an exception to this rule because the COVID-19 curfew had so reduced the emission of ozone precursors that the effect of subsidence became visible. Interestingly, this suggests that spring subsidence might be a significant feature of less urbanized regions of Egypt and the Middle East.
In Paris, satellite retrievals are less correlated with surface ozone variability than in Cairo. This is likely due to a lower vertical development of the PBL that does not allow its top part to be sensed by satellite sounders. However, a relatively good (R2 > 0.68) correlation still exists between the AIRS monthly retrievals and the surface measurements.
In summary, the analysis of the cases of Paris and Cairo shows that the satellite observations do not reproduce the variability in the surface ozone concentration at the daily resolution. This is particularly true in the mid-latitudes, such as the city of Paris. However, they do retrieve the weekly and monthly evolution of the surface ozone concentration. Therefore, while most satellite applications have, so far, been focused on the variability in ozone in the whole troposphere (e.g., [41,42]), we clearly illustrate here that the satellite retrievals considered in this study (IASI+GOME2 and AIRS) also constitute precious tools to depict the weekly and monthly variability in ozone concentrations in megacities and at the surface level.
Supplementary Materials
The following supporting information can be downloaded at: https://www.mdpi.com/article/10.3390/atmos16040475/s1, Figure S1: Map displaying the Airparif stations measuring surface ozone inside and around Paris; Table S1: Names, types, and distance to Paris-Les Halles (in km) of the 20 Airparif stations used in this study; Figure S2: Covariations of the daily means of the ozone concentration measured at the Airparif stations of Paris-Les Halles (PA01H) and Mantes la Jolie (MANT); Figure S3: Frequency distributions of the daily means of ozone concentration measured by Airparif at representative urban (black plots) and rural (red plots) locations of the Paris region; Figure S4: Comparison of the ozone concentrations at one urban (Neuilly) and one rural (Rurale-Nord ouest) locations with the measurements of the station of central Paris (Paris-Les Halles).
Author Contributions
Conceptualization, S.A., J.C. and M.M.A.W.; methodology, S.A. and J.C.; resources and validation, S.A., J.C., I.A.H. and A.N.M.; formal analysis and visualization, S.A., J.C. and A.N.M.; writing—original draft preparation, S.A.; writing—review and editing, J.C., I.A.H. and A.N.M.; supervision, S.A. and M.M.A.W. All authors have read and agreed to the published version of the manuscript.
Funding
This research received no external funding.
Institutional Review Board Statement
Not applicable.
Informed Consent Statement
Not applicable.
Data Availability Statement
The AIRS observations can be downloaded from the GIOVANNI portal of NASA (https://giovanni.gsfc.nasa.gov/, accessed on 15 December 2024). The IASI+GOME2 data are made available through the French national center for Atmospheric data and services (AERIS) (https://iasi.aeris-data.fr/o3_iago2/, accessed on 15 December 2024). The surface ozone concentration data in Paris are distributed through AIRPARIF’s public website (https://data-airparif-asso.opendata.arcgis.com/, accessed on 15 December 2024). The surface ozone concentration data in Cairo are not publicly available due to their ownership by the government and access to these datasets necessitates a formal request.
Acknowledgments
The authors are grateful to the French National Center for Atmospheric Data and Services (AERIS) for producing and distributing the IASI+GOME2 data, and acknowledge the support of the Centre National des Etudes Spatiales and the SURVEYPOLLUTION TOSCA project for its development. Thanks also to the GIOVANNI portal of the NASA for providing the AIRS observations, and to AIRPARIF and the Egyptian Meteorological Authority for the surface ozone concentration in Paris and Cairo, respectively.
Conflicts of Interest
The authors declare no conflicts of interest.
References
- Zhang, J.J.; Wei, Y.; Fang, Z. Ozone Pollution: A Major Health Hazard Worldwide. Front. Immunol. 2019, 10, 2518. [Google Scholar] [CrossRef] [PubMed]
- The Royal Society. Ground-Level Ozone in the 21st Century: Future Trends, Impacts and Policy Implications Science Policy; The Royal Society: London, UK, 2008. [Google Scholar]
- Agathokleous, E.; Feng, Z.; Oksanen, E.; Sicard, P.; Wang, Q.; Saitanis, C.J.; Araminiene, V.; Blande, J.D.; Hayes, F.; Calatayud, V.; et al. Ozone affects plant, insect, and soil microbial communities: A threat to terrestrial ecosystems and biodiversity. Sci. Adv. 2020, 6, eabc1176. [Google Scholar] [CrossRef]
- Myhre, G.; Samset, B.H.; Schulz, M.; Balkanski, Y.; Bauer, S.; Berntsen, T.K.; Bian, H.; Bellouin, N.; Chin, M.; Diehl, T.; et al. Radiative Forcing of the Direct Aerosol Effect from AeroCom Phase II Simulations. Atmos. Chem. Phys. 2013, 13, 1853–1877. [Google Scholar] [CrossRef]
- EPA Ground-Level Ozone Basics. Available online: https://www.epa.gov/ground-level-ozone-pollution/ground-level-ozone-basics (accessed on 8 September 2024).
- NASA Ozone. Available online: https://earthobservatory.nasa.gov/features/Ozone/ozone_2.php (accessed on 8 September 2024).
- Checa-Garcia, R.; Hegglin, M.I.; Kinnison, D.; Plummer, D.A.; Shine, K.P. Historical Tropospheric and Stratospheric Ozone Radiative Forcing Using the CMIP6 Database. Geophys. Res. Lett. 2018, 45, 3264–3273. [Google Scholar] [CrossRef]
- Seinfeld, J.H.; Pandis, S.N. Atmospheric Chemistry and Physics: From Air Pollution to Climate Change; John Wiley & Sons: Hoboken, NJ, USA, 2016. [Google Scholar]
- Kavassalis, S.C.; Murphy, J.G. Understanding Ozone-Meteorology Correlations: A Role for Dry Deposition. Geophys. Res. Lett. 2017, 44, 2922–2931. [Google Scholar] [CrossRef]
- Sun, W.; Hess, P.; Liu, C. The Impact of Meteorological Persistence on the Distribution and Extremes of Ozone. Geophys. Res. Lett. 2017, 44, 1545–1553. [Google Scholar] [CrossRef]
- Otero, N.; Sillmann, J.; Schnell, J.L.; Rust, H.W.; Butler, T. Synoptic and Meteorological Drivers of Extreme Ozone Concentrations over Europe. Environ. Res. Lett. 2016, 11, 024005. [Google Scholar] [CrossRef]
- Stevenson, D.S.; Dentener, F.J.; Schultz, M.G.; Ellingsen, K.; van Noije, T.P.C.; Wild, O.; Zeng, G.; Amann, M.; Atherton, C.S.; Bell, N.; et al. Multimodel Ensemble Simulations of Present-Day and near-Future Tropospheric Ozone. J. Geophys. Res. Atmos. 2006, 111. [Google Scholar] [CrossRef]
- CCAC Tropospheric Ozone. Available online: https://www.ccacoalition.org/short-lived-climate-pollutants/tropospheric-ozone#resources (accessed on 8 September 2024).
- Stordal, F.; Bekki, S.; Hauglustaine, D.; Millan, M.; Sausen, R.; Schuepbach, E.; Stevenson, D.; van Dorland, R.; Volz-Thomas, A. Climate impact of tropospheric ozone changes. In Air Pollution Report N°81: Ozone-Climate Interactions; Isaksen, I.S., Ed.; EU 20623, Chapter 4; European Communities; 2003; pp. 73–95. Available online: https://hal.science/hal-03327712/document (accessed on 21 March 2025).
- Garatachea, R.; Pay, M.T.; Achebak, H.; Jorba, O.; Bowdalo, D.; Guevara, M.; Petetin, H.; Ballester, J.; Pérez García-Pando, C. National and Transboundary Contributions to Surface Ozone Concentration across European Countries. Commun. Earth Environ. 2024, 5, 1–17. [Google Scholar] [CrossRef]
- Qu, Y.; Voulgarakis, A.; Wang, T.; Kasoar, M.; Wells, C.; Yuan, C.; Varma, S.; Mansfield, L. A Study of the Effect of Aerosols on Surface Ozone through Meteorology Feedbacks over China. Atmos. Chem. Phys. 2021, 21, 5705–5718. [Google Scholar] [CrossRef]
- Dulac, F.; Sauvage, S.; Hamonou, E. Atmospheric Chemistry in the Mediterranean Region Volume 1-Background Information and Pollutant Distribution; Springer International Publishing AG: Berlin/Heidelberg, Germany, 2023. [Google Scholar]
- Jaidan, N.; El Amraoui, L.; Attiè, J.L.; Ricaud, P.; Dulac, F. Future Changes in Surface Ozone over the Mediterranean Basin in the Framework of the Chemistry-Aerosol Mediterranean Experiment (ChArMEx). Atmos. Chem. Phys. 2018, 18, 9351–9373. [Google Scholar] [CrossRef]
- Cristofanelli, P.; Bonasoni, P. Background Ozone in the Southern Europe and Mediterranean Area: Influence of the Transport Processes. Environ. Pollut. 2009, 157, 1399–1406. [Google Scholar] [CrossRef]
- Gerasopoulos, E.; Kouvarakis, G.; Vrekoussis, M.; Kanakidou, M.; Mihalopoulos, N. Ozone Variability in the Marine Boundary Layer of the Eastern Mediterranean Based on 7-Year Observations. J. Geophys. Res. D Atmos. 2005, 110, 1–12. [Google Scholar] [CrossRef]
- Lelieveld, J.; Dentener, F.J. What Controls Tropospheric Ozone? J. Geophys. Res. Atmos. 2000, 105, 3531–3551. [Google Scholar] [CrossRef]
- Lelieveld, J.; Berresheim, H.; Borrmann, S.; Crutzen, P.J.; Dentener, F.J.; Fischer, H.; Feichter, J.; Flatau, P.J.; Heland, J.; Holzinger, R.; et al. Global Air Pollution Crossroads over the Mediterranean. Science 2002, 298, 794–799. [Google Scholar] [CrossRef]
- Vingarzan, R. A Review of Surface Ozone Background Levels and Trends. Atmos. Environ. 2004, 38, 3431–3442. [Google Scholar] [CrossRef]
- Monks, P.S. A Review of the Observations and Origins of the Spring Ozone Maximum. Atmos. Environ. 2000, 34, 3545–3561. [Google Scholar] [CrossRef]
- Kalabokas, P.D.; Cammas, J.P.; Thouret, V.; Volz-Thomas, A.; Boulanger, D.; Repapis, C.C. Examination of the Atmospheric Conditions Associated with High and Low Summer Ozone Levels in the Lower Troposphere over the Eastern Mediterranean. Atmos. Chem. Phys. 2013, 13, 10339–10352. [Google Scholar] [CrossRef]
- Escudero, M.; Segers, A.; Kranenburg, R.; Querol, X.; Alastuey, A.; Borge, R.; De La Paz, D.; Gangoiti, G.; Schaap, M. Analysis of Summer O3 in the Madrid Air Basin with the LOTOS-EUROS Chemical Transport Model. Atmos. Chem. Phys. 2019, 19, 14211–14232. [Google Scholar] [CrossRef]
- Kalabokas, P.; Repapis, C. A Review of Surface and Lower Troposphere Ozone Concentration Characteristics Around the Urban Area of Athens, the Aegean Sea and at the Central and Eastern Mediterranean, in Perspectives on Atmospheric Sciences; Springer: Berlin/Heidelberg, Germany, 2017; pp. 995–1000. [Google Scholar]
- Massagué, J.; Torre-Pascual, E.; Carnerero, C.; Escudero, M.; Alastuey, A.; Pandolfi, M.; Querol, X.; Gangoiti, G. Extreme Ozone Episodes in a Major Mediterranean Urban Area. Atmos. Chem. Phys. 2024, 24, 4827–4850. [Google Scholar] [CrossRef]
- Pay, M.T.; Gangoiti, G.; Guevara, M.; Napelenok, S.; Querol, X.; Jorba, O.; García-Pando, C.P. Ozone Source Apportionment during Peak Summer Events over Southwestern Europe. Atmos. Chem. Phys. 2019, 19, 5467–5494. [Google Scholar] [CrossRef] [PubMed]
- Porter, W.C.; Heald, C.L. The Mechanisms and Meteorological Drivers of the Summertime Ozone-Temperature Relationship. Atmos. Chem. Phys. 2019, 19, 13367–13381. [Google Scholar] [CrossRef]
- Saunier, A.; Ormeño, E.; Piga, D.; Armengaud, A.; Boissard, C.; Lathière, J.; Szopa, S.; Genard-Zielinski, A.C.; Fernandez, C. Isoprene Contribution to Ozone Production under Climate Change Conditions in the French Mediterranean Area. Reg. Environ. Change 2020, 20, 1–8. [Google Scholar] [CrossRef]
- Mostafa, A.N.; Zakey, A.S.; Monem, A.S.; Abdel Wahab, M.M. Analysis of the Surface Air Quality Measurements in The Greater Cairo (Egypt) Metropolitan. Glob. J. Adv. Res. 2018, 5, 207–214. [Google Scholar]
- Cuesta, J.; Costantino, L.; Beekmann, M.; Siour, G.; Menut, L.; Bessagnet, B.; Landi, T.C.; Dufour, G.; Eremenko, M. Ozone Pollution during the COVID-19 Lockdown in the Spring of 2020 over Europe, Analysed from Satellite Observations, in Situ Measurements, and Models. Atmos. Chem. Phys. 2022, 22, 4471–4489. [Google Scholar] [CrossRef]
- Sicard, P.; De Marco, A.; Agathokleous, E.; Feng, Z.; Xu, X.; Paoletti, E.; Rodriguez, J.J.D.; Calatayud, V. Amplified Ozone Pollution in Cities during the COVID-19 Lockdown. Sci. Total Environ. 2020, 735, 139542. [Google Scholar] [CrossRef] [PubMed]
- Kumari, P.; Toshniwal, D. Impact of Lockdown on Air Quality over Major Cities across the Globe during COVID-19 Pandemic. Urban. Clim. 2020, 34, 100719. [Google Scholar] [CrossRef] [PubMed]
- Liu, Y.; Wang, T.; Stavrakou, T.; Elguindi, N.; Doumbia, T.; Granier, C.; Bouarar, I.; Gaubert, B.; Brasseur, G.P. Diverse Response of Surface Ozone to COVID-19 Lockdown in China. Sci. Total Environ. 2021, 789, 147739. [Google Scholar] [CrossRef]
- Aumann, H.H.; Chahine, M.T.; Gautier, C.; Goldberg, M.D.; Kalnay, E.; McMillin, L.M.; Revercomb, H.; Rosenkranz, P.W.; Smith, W.L.; Staelin, D.H.; et al. AIRS/AMSU/HSB on the Aqua Mission: Design, Science Objectives, Data Products, and Processing Systems. IEEE Trans. Geosci. Remote Sens. 2003, 41, 253–264. [Google Scholar] [CrossRef]
- Cuesta, J.; Eremenko, M.; Liu, X.; Dufour, G.; Cai, Z.; Höpfner, M.; Von Clarmann, T.; Sellitto, P.; Foret, G.; Gaubert, B.; et al. Satellite Observation of Lowermost Tropospheric Ozone by Multispectral Synergism of IASI Thermal Infrared and GOME-2 Ultraviolet Measurements over Europe. Atmos. Chem. Phys. 2013, 13, 9675–9693. [Google Scholar] [CrossRef]
- Okamoto, S.; Cuesta, J.; Beekmann, M.; Dufour, G.; Eremenko, M.; Miyazaki, K.; Boonne, C.; Tanimoto, H.; Akimoto, H. Impact of Different Sources of Precursors on an Ozone Pollution Outbreak over Europe Analysed with IASI+GOME2 Multispectral Satellite Observations and Model Simulations. Atmos. Chem. Phys. 2023, 23, 7399–7423. [Google Scholar] [CrossRef]
- Cuesta, J.; Kanaya, Y.; Takigawa, M.; Dufour, G.; Eremenko, M.; Foret, G.; Miyazaki, K.; Beekmann, M. Transboundary Ozone Pollution across East Asia: Daily Evolution and Photochemical Production Analysed by IASI + GOME2 Multispectral Satellite Observations and Models. Atmos. Chem. Phys. 2018, 18, 9499–9525. [Google Scholar] [CrossRef]
- Gaudel, A.; Bourgeois, I.; Li, M.; Chang, K.-L.; Ziemke, J.; Sauvage, B.; Stauffer, R.M.; Thompson, A.M.; Kollonige, D.E.; Smith, N.; et al. Tropical Tropospheric Ozone Distribution and Trends from in Situ and Satellite Data. Atmos. Chem. Phys. 2024, 24, 9975–10000. [Google Scholar] [CrossRef]
- Tarasick, D.; Galbally, I.E.; Cooper, O.R.; Schultz, M.G.; Ancellet, G.; Leblanc, T.; Wallington, T.J.; Ziemke, J.; Liu, X.; Steinbacher, M.; et al. Tropospheric Ozone Assessment Report: Tropospheric Ozone from 1877 to 2016, Observed Levels, Trends and Uncertainties. Elementa 2019, 7, 39. [Google Scholar] [CrossRef]
- Elmazzahi, D.; Shawkat, Y. (Re)Defining the Greater Cairo Region. Available online: https://marsadomran.info/en/2024/04/3265/ (accessed on 22 December 2024).
- Wheida, A.; Nasser, A.; El Nazer, M.; Borbon, A.; Abo El Ata, G.A.; Abdel Wahab, M.; Alfaro, S.C. Tackling the Mortality from Long-Term Exposure to Outdoor Air Pollution in Megacities: Lessons from the Greater Cairo Case Study. Environ. Res. 2018, 160, 223–231. [Google Scholar] [CrossRef]
- Divakarla, M.G.; Barnet, C.D.; Goldberg, M.D.; McMillin, L.M.; Maddy, E.; Wolf, W.; Zhou, L.; Liu, X. Validation of Atmospheric Infrared Sounder Temperature and Water Vapor Retrievals with Matched Radiosonde Measurements and Forecasts. J. Geophys. Res. Atmos. 2006, 111. [Google Scholar] [CrossRef]
- Clerbaux, C.; Boynard, A.; Clarisse, L.; George, M.; Hadji-Lazaro, J.; Herbin, H.; Hurtmans, D.; Pommier, M.; Razavi, A.; Turquety, S.; et al. Monitoring of Atmospheric Composition Using the Thermal Infrared IASI/MetOp Sounder. Atmos. Chem. Phys. 2009, 9, 6041–6054. [Google Scholar] [CrossRef]
- Mostafa, A.N.; Zakey, A.S.; Alfaro, S.C.; Wheida, A.A.; Monem, S.A.; Abdul Wahab, M.M. Validation of RegCM-CHEM4 Model by Comparison with Surface Measurements in the Greater Cairo (Egypt) Megacity. Environ. Sci. Pollut. Res. 2019, 26, 23524–23541. [Google Scholar] [CrossRef] [PubMed]
- Petit, J.E.; Dupont, J.C.; Favez, O.; Gros, V.; Zhang, Y.; Sciare, J.; Simon, L.; Truong, F.; Bonnaire, N.; Amodeo, T.; et al. Response of Atmospheric Composition to COVID-19 Lockdown Measures during Spring in the Paris Region (France). Atmos. Chem. Phys. 2021, 21, 17167–17183. [Google Scholar] [CrossRef]
- Deroubaix, A.; Brasseur, G.; Gaubert, B.; Labuhn, I.; Menut, L.; Siour, G.; Tuccella, P. Response of Surface Ozone Concentration to Emission Reduction and Meteorology during the COVID-19 Lockdown in Europe. Meteorol. Appl. 2021, 28, e1990. [Google Scholar] [CrossRef]
- Favez, O.; Cachier, H.; Sciare, J.; Alfaro, S.C.; El-Araby, T.M.; Harhash, M.A.; Abdelwahab, M.M. Seasonality of Major Aerosol Species and Their Transformations in Cairo Megacity. Atmos. Environ. 2008, 42, 1503–1516. [Google Scholar] [CrossRef]
- Christodoulou, A.; Bezantakos, S.; Bourtsoukidis, E.; Stavroulas, I.; Pikridas, M.; Oikonomou, K.; Iakovides, M.; Hassan, S.K.; Boraiy, M.; El-Nazer, M.; et al. Submicron Aerosol Pollution in Greater Cairo (Egypt): A New Type of Urban Haze? Environ. Int. 2024, 186, 108610. [Google Scholar] [CrossRef] [PubMed]
- Dentener, F.J.; Carmichael, G.R.; Zhang, Y.; Lelieveld, J.; Crutzen, P.J. Role of Mineral Aerosol as a Reactive Surface in the Global Troposphere. J. Geophys. Res. Atmos. 1996, 101, 22869–22889. [Google Scholar] [CrossRef]
- Lasne, J.; Romanias, M.N.; Thevenet, F. Ozone Uptake by Clay Dusts under Environmental Conditions. ACS Earth Space Chem. 2018, 2, 904–914. [Google Scholar] [CrossRef]


Disclaimer/Publisher’s Note: The statements, opinions and data contained in all publications are solely those of the individual author(s) and contributor(s) and not of MDPI and/or the editor(s). MDPI and/or the editor(s) disclaim responsibility for any injury to people or property resulting from any ideas, methods, instructions or products referred to in the content. |
© 2025 by the authors. Licensee MDPI, Basel, Switzerland. This article is an open access article distributed under the terms and conditions of the Creative Commons Attribution (CC BY) license (https://creativecommons.org/licenses/by/4.0/).