1. Introduction
Typhoons are powerful meteorological phenomena, particularly in East Asia, and their effects on air quality have long been a subject of atmospheric research [
1,
2,
3]. Traditionally, it has been believed that typhoons improve air quality by dispersing pollutants through strong winds and rainfall, which wash out airborne particulate matter [
4]. However, recent studies have revealed that typhoons do not always result in improved air quality. Under certain meteorological conditions, such as atmospheric stagnation before the typhoon and subsidence following its passage, typhoons can lead to an increase in PM10 concentrations [
5]. This finding challenges the prevailing notion that typhoons universally lead to better air quality and highlights the need for a more nuanced understanding of their effects on air pollution.
This study aims to provide a comprehensive analysis of the effects of typhoons on PM10 concentrations by examining long-term data (2001–2021) from seven major South Korean cities. Specifically, this research investigates how meteorological conditions before, during, and after typhoons influence PM10 levels. The study underscores how atmospheric stagnation before typhoons can promote the accumulation of pollutants and how post-typhoon subsidence can trap pollutants in the atmosphere, leading to elevated PM10 concentrations. By challenging the general assumption that typhoons improve air quality, this paper emphasizes the complexity of the relationship between typhoons and air pollution.
Climate change and urbanization are also critical factors shaping air quality. The increasing intensity and frequency of typhoons, driven by climate change, are likely to alter the distribution and concentration of air pollutants. In urban areas with high levels of local anthropogenic pollution (e.g., traffic, industrial emissions), air quality may deteriorate during typhoon events due to the combined effects of local emissions and meteorological conditions [
6]. Therefore, it is essential to consider both global and local influences when evaluating the impact of typhoons on air quality.
Additionally, this study considers the regional variability in PM10 concentration changes induced by different typhoon tracks. The impact of typhoons on air quality varies depending on their path and the specific characteristics of the affected region. Coastal cities, for example, may experience more significant increases in PM10 concentrations due to long-range pollutant transport, while inland areas may see higher concentrations during pre-typhoon stagnation periods. Understanding how different typhoon tracks affect PM10 levels is crucial for improving the accuracy of air quality predictions during typhoon events.
Moreover, the increasing role of real-time air quality monitoring in forecasting and managing the effects of typhoons on air quality cannot be overstated. Real-time monitoring systems can provide valuable data for tracking PM10 concentration changes as typhoons progress, which can enhance prediction accuracy and inform policy decisions [
3]. By integrating real-time data into predictive air quality models, this study aims to improve our ability to manage and mitigate the effects of typhoons on air quality, particularly in regions prone to frequent typhoon events [
7].
This study, through a combination of long-term data analysis and real-time monitoring, offers new insights into the effects of typhoons on PM10 concentrations. The results will help enhance our understanding of air pollution dynamics during typhoon events and provide crucial information for improving air quality management strategies in typhoon-prone regions.
2. Data and Methods
2.1. Study Area
This study was conducted across seven major cities in South Korea: Seoul, Busan, Daegu, Daejeon, Gwangju, Ulsan, and Incheon. These cities were selected due to their significant population and varying exposure to air pollution, making them representative of urban areas affected by PM10 concentrations during typhoon events. The cities’ geographical locations, industrial activities, and proximity to coastal areas influence the air quality and thus provide a varied context for analyzing the effects of typhoons on PM10 levels. Seoul, for example, is the capital city, with the highest population density, while Busan is the largest port city and Ulsan is an industrial hub, each having different local pollution sources [
8].
2.2. Data Sources
Hourly PM10 concentration data for the period from 2001 to 2021 were obtained from the Air Korea monitoring network, managed by the Ministry of Environment of South Korea. The network includes monitoring stations located in each of the seven cities. The PM10 data were subjected to quality control using Dixon’s Q test to identify and eliminate outliers. This method was chosen due to its reliability in maintaining data integrity, ensuring that the analysis was not influenced by erroneous data points. The approach is consistent with established practices in environmental studies and helps ensure that the conclusions drawn from the data are robust and trustworthy [
8]. Meteorological data, including temperature, wind speed, wind direction, relative humidity, and boundary layer height, were provided by the Korea Meteorological Administration (KMA). These variables were observed through local monitoring stations rather than model-based estimates, allowing for a direct and accurate understanding of meteorological conditions during typhoon events [
9].
2.3. Identification of High PM10
In this study, high-PM10 events were defined as instances when the 24 h average PM10 concentration exceeded 81 μg/m
3, which is classified as “unhealthy” according to the air quality standards set by the Korean Ministry of Environment (
Table 1). This threshold was selected because concentrations above this level are linked to significant health risks, particularly for vulnerable groups such as children, the elderly, and individuals with respiratory or cardiovascular conditions. The use of this threshold is consistent with other studies linking high PM10 concentrations to adverse health effects in urban environments [
10,
11,
12].
Table 1 provides the Korean air quality standards for PM10 concentrations, which categorize the levels of air pollution from “Good” (0–30 μg/m
3) to “Very Bad” (greater than 150 μg/m
3). Events where PM10 concentrations exceeded 81 μg/m
3, falling into the “Bad” category, were classified as high-PM10 events. This threshold helps identify periods of air quality deterioration that could have adverse effects on human health. The “Bad” category (81–150 μg/m
3) is particularly relevant for sensitive groups, as these individuals are at risk of experiencing harmful effects, including respiratory discomfort, cardiovascular issues, and exacerbation of pre-existing health conditions. Previous research has shown that such levels of PM10 can significantly affect public health and should be used as a reference in studies examining air pollution impacts on urban populations [
5].
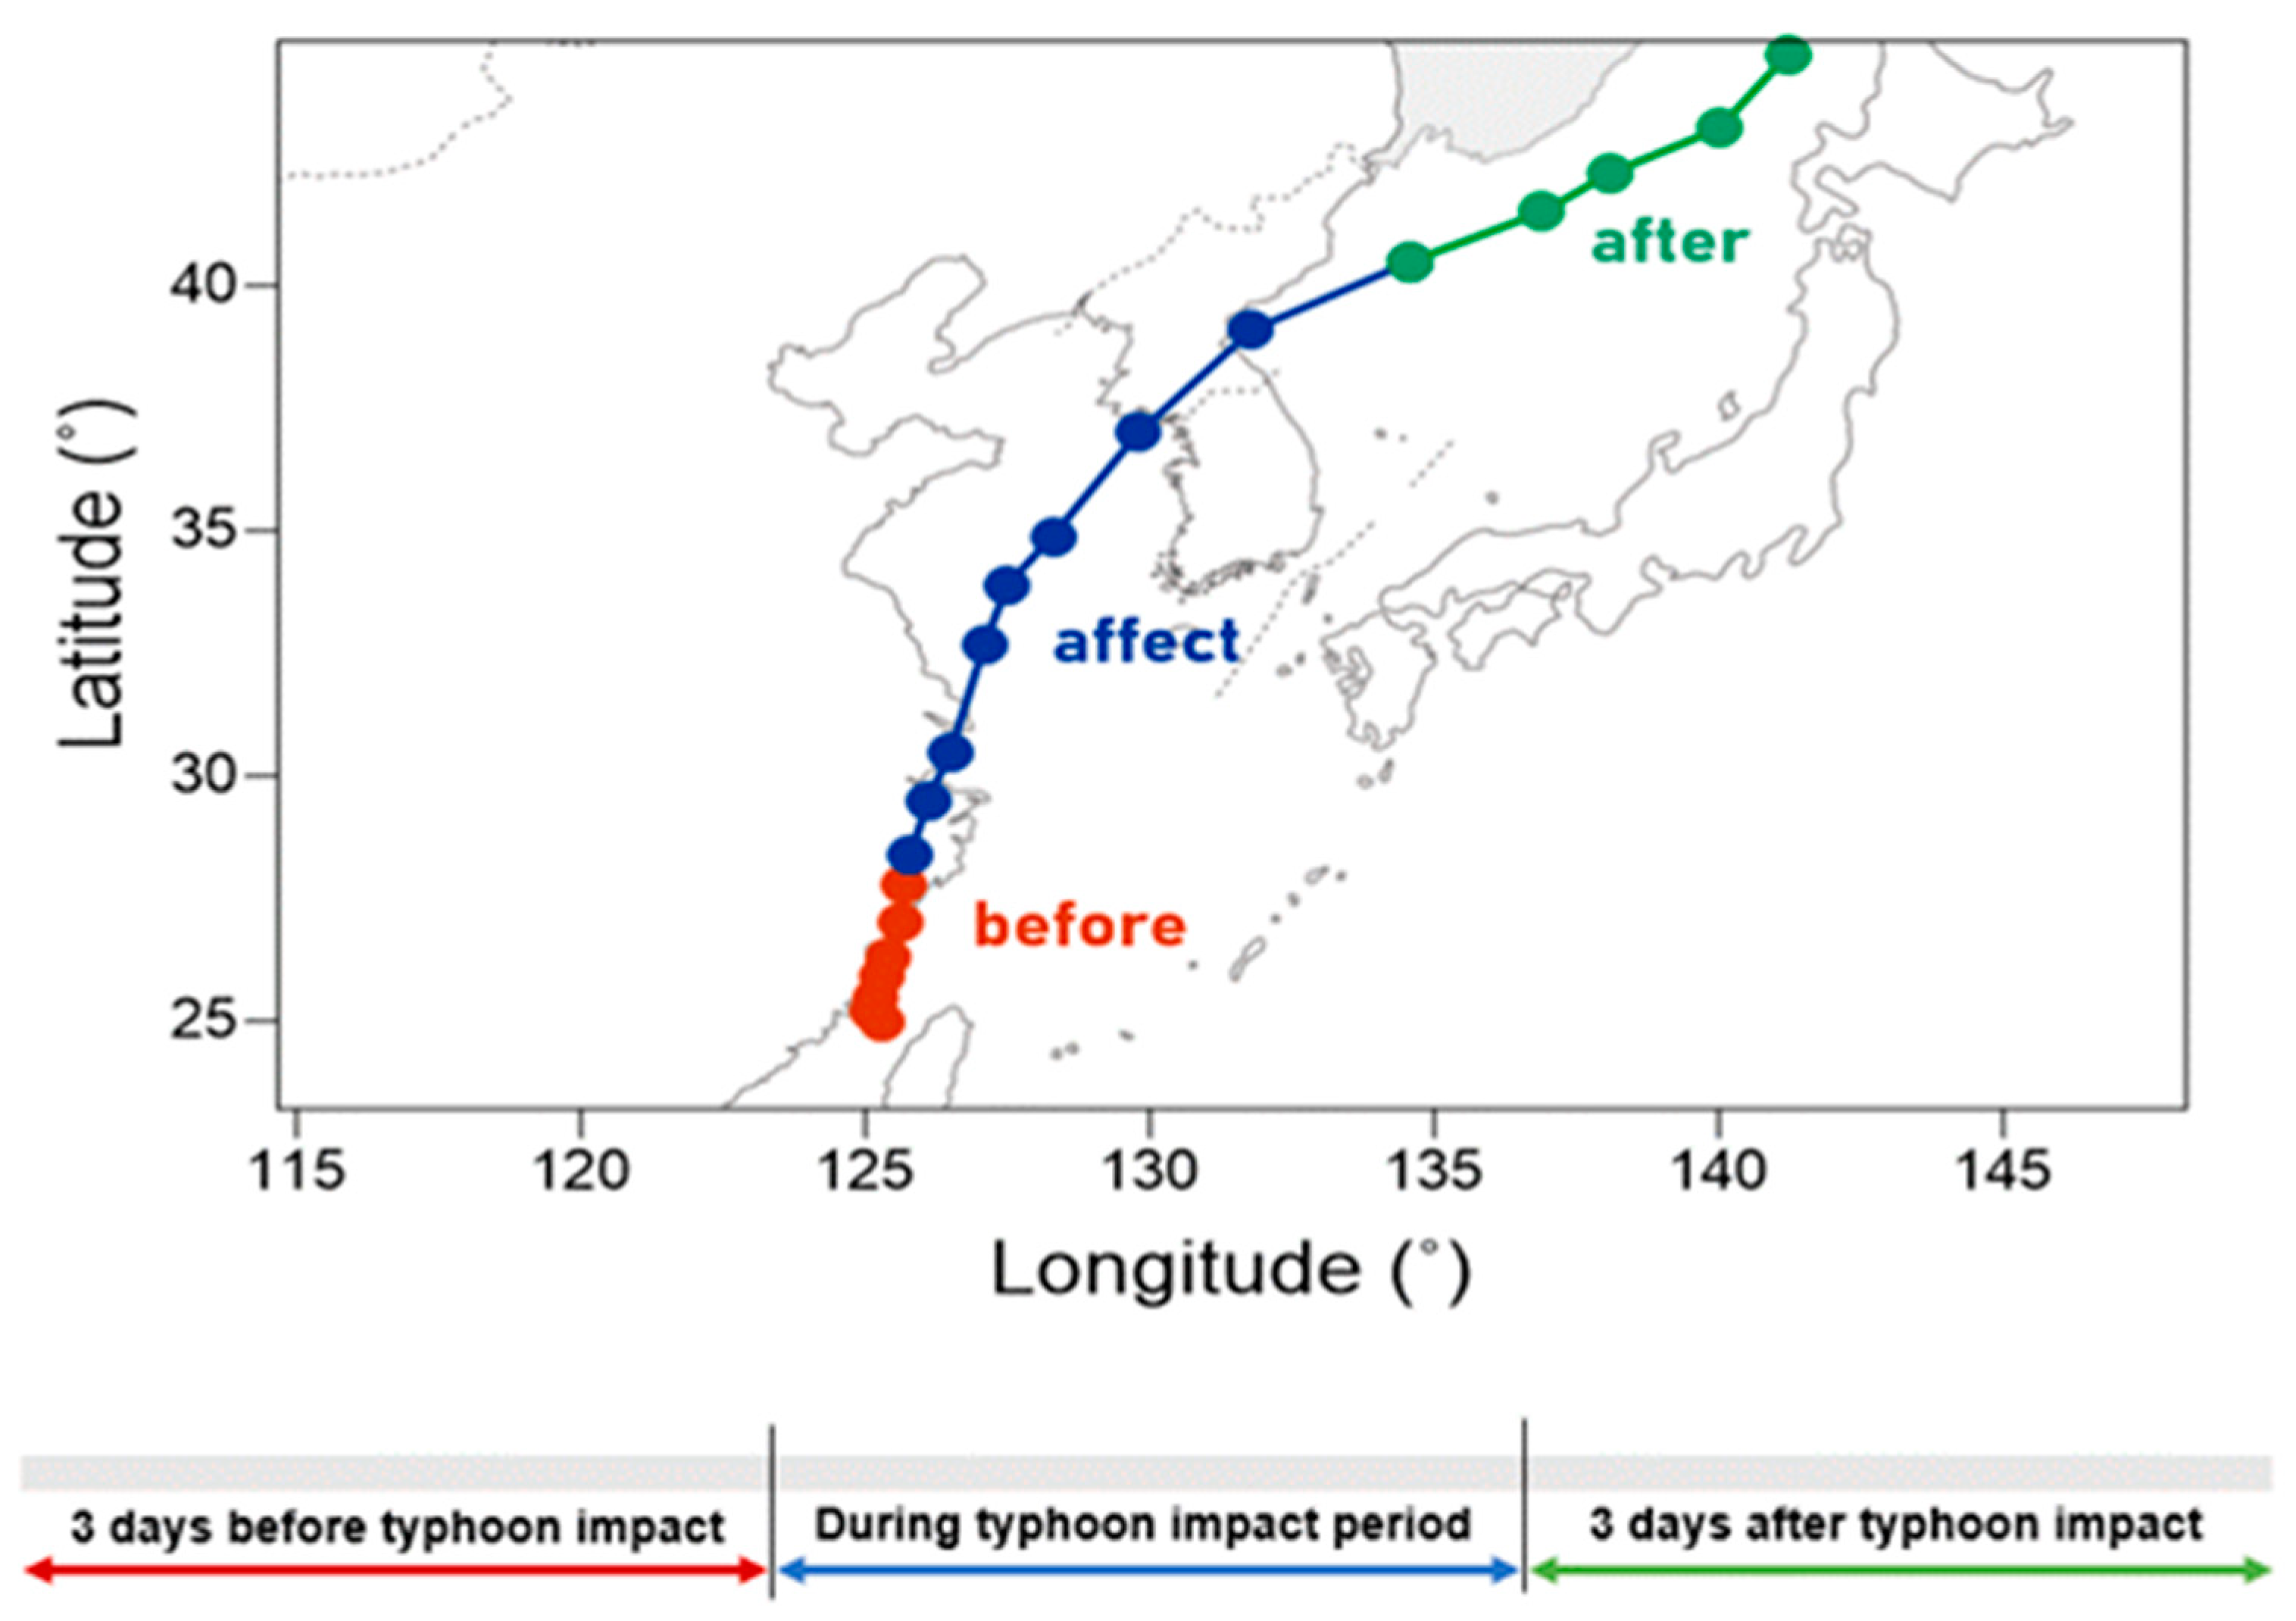
Figure 1 illustrates the classification of the typhoon impact periods into three phases: pre-impact, during impact, and post-impact. The pre-impact period refers to the three days before the typhoon’s arrival, during which PM10 concentrations were typically influenced by atmospheric stagnation, leading to the accumulation of pollutants. The during-impact period corresponds to the time when the typhoon actively affects the region, often leading to temporary improvements in air quality due to high wind speeds and precipitation that disperse and wash out pollutants. The post-impact period occurs during the three days after the typhoon’s passage, during which PM10 concentrations often increase again due to atmospheric subsidence and long-range pollutant transport. Studies have shown that the post-typhoon period often sees a resurgence in PM10 levels due to these meteorological conditions, with a significant increase in pollutant levels compared to pre-typhoon periods [
13].
The study focuses on high-PM10 events during these three phases, with particular attention to the pre- and post-typhoon periods, as they showed the most significant increases in PM10 concentrations. Based on the analysis of PM10 levels during these phases, high-PM10 events were most frequently observed in the post-impact period, where the atmospheric conditions were conducive to pollutant accumulation. Specifically,
Figure 2 compares the distribution of high-PM10 events across the pre-, during-, and post-impact periods, highlighting the increased likelihood of high-PM10 events in the post-impact phase. The findings align with previous studies that reported increased PM10 concentrations following typhoon events due to subsidence and pollutant transport.
By analyzing PM10 concentration trends over the 20-year period (2001–2021), this study classified and categorized PM10 events based on their occurrence in the pre-impact, during-impact, and post-impact periods. A higher probability of high-PM10 events was observed in certain cities, with regions such as Incheon showing the highest increase in PM10 levels post-typhoon, likely due to its geographical proximity to coastal areas and the long-range transport of pollutants. The classification of high-PM10 events across different phases of the typhoon event is critical for understanding the full impact of typhoons on air quality and helps in identifying patterns that may guide air quality management and public health response strategies.
3. Result
3.1. Overview of PM10 Concentrations During Typhoon Events
To evaluate the impact of typhoons on PM10 concentrations, we analyzed data from seven cities during three distinct phases: pre-impact, during impact, and post-impact. The results showed significant fluctuations in PM10 concentrations across these phases, which were influenced by both the typhoon’s characteristics and regional meteorological conditions. During the pre-impact period, which is the three days before the typhoon arrives, we observed a gradual increase in PM10 concentrations across most cities. This rise is primarily due to atmospheric stagnation, where weak winds and high humidity lead to the accumulation of particulate matter. The increase was most noticeable in urban areas like Seoul and Incheon, which have higher pollution levels. In contrast, inland cities like Daegu experienced a less pronounced increase in PM10 concentrations. As the typhoon reached the region, during the impact period, PM10 concentrations decreased in all cities. This reduction can be attributed to the high winds and rainfall associated with the typhoon, which disperse and wash away pollutants. The decrease was most significant in coastal cities like Busan, where strong winds helped clear the air. In inland cities, the reduction was still noticeable, but not as large as in coastal areas.
The most significant fluctuation in PM10 concentrations was observed during the post-impact period, occurring in the three days following the typhoon’s passage. This period saw a surge in PM10 levels, particularly in coastal cities like Incheon and Gwangju, which experienced significant increases due to a combination of atmospheric subsidence and long-range transport of pollutants. Subsidence traps pollutants in the atmosphere, while the transport of pollutants from nearby industrial regions exacerbates air quality deterioration. These findings emphasize the need for air quality management systems to account for both local and regional pollution sources in the aftermath of typhoon events. On the other hand, inland cities like Daegu experienced smaller increases in PM10 levels, likely due to the limited transport of pollutants from other areas.
Finally, the typhoon’s path also influenced PM10 concentrations. Typhoons passing through the southern coastal areas of South Korea, like Incheon, led to higher PM10 concentrations due to the transport of pollutants from industrial regions. In contrast, typhoons traveling further inland had less of an impact on PM10 levels, as there was less long-range pollutant transport.
3.2. Impact of Typhoons on PM10 Concentrations
3.2.1. Overall Trends in PM10 Concentrations
The data indicate a clear trend of fluctuating PM10 concentrations across different periods: pre-impact, during-impact, and post-impact. As expected, PM10 concentrations were highest during the post-impact period in most cities, showing an average increase, 15–20% compared to the pre-impact period. This increase is largely driven by atmospheric subsidence and the long-range transport of pollutants that follows the passage of the typhoon, particularly in coastal cities like Incheon and Busan. The high PM10 concentrations observed post-typhoon suggests that the effects of the typhoon on air quality can persist long after the storm has passed.
In contrast, PM10 concentrations were lower during the impact period, with an average occurrence rate of 7.4% for high-PM10 events. This is consistent with the expectation that typhoons, through high winds and precipitation, disperse and wash away pollutants, temporarily reducing PM10 concentrations.
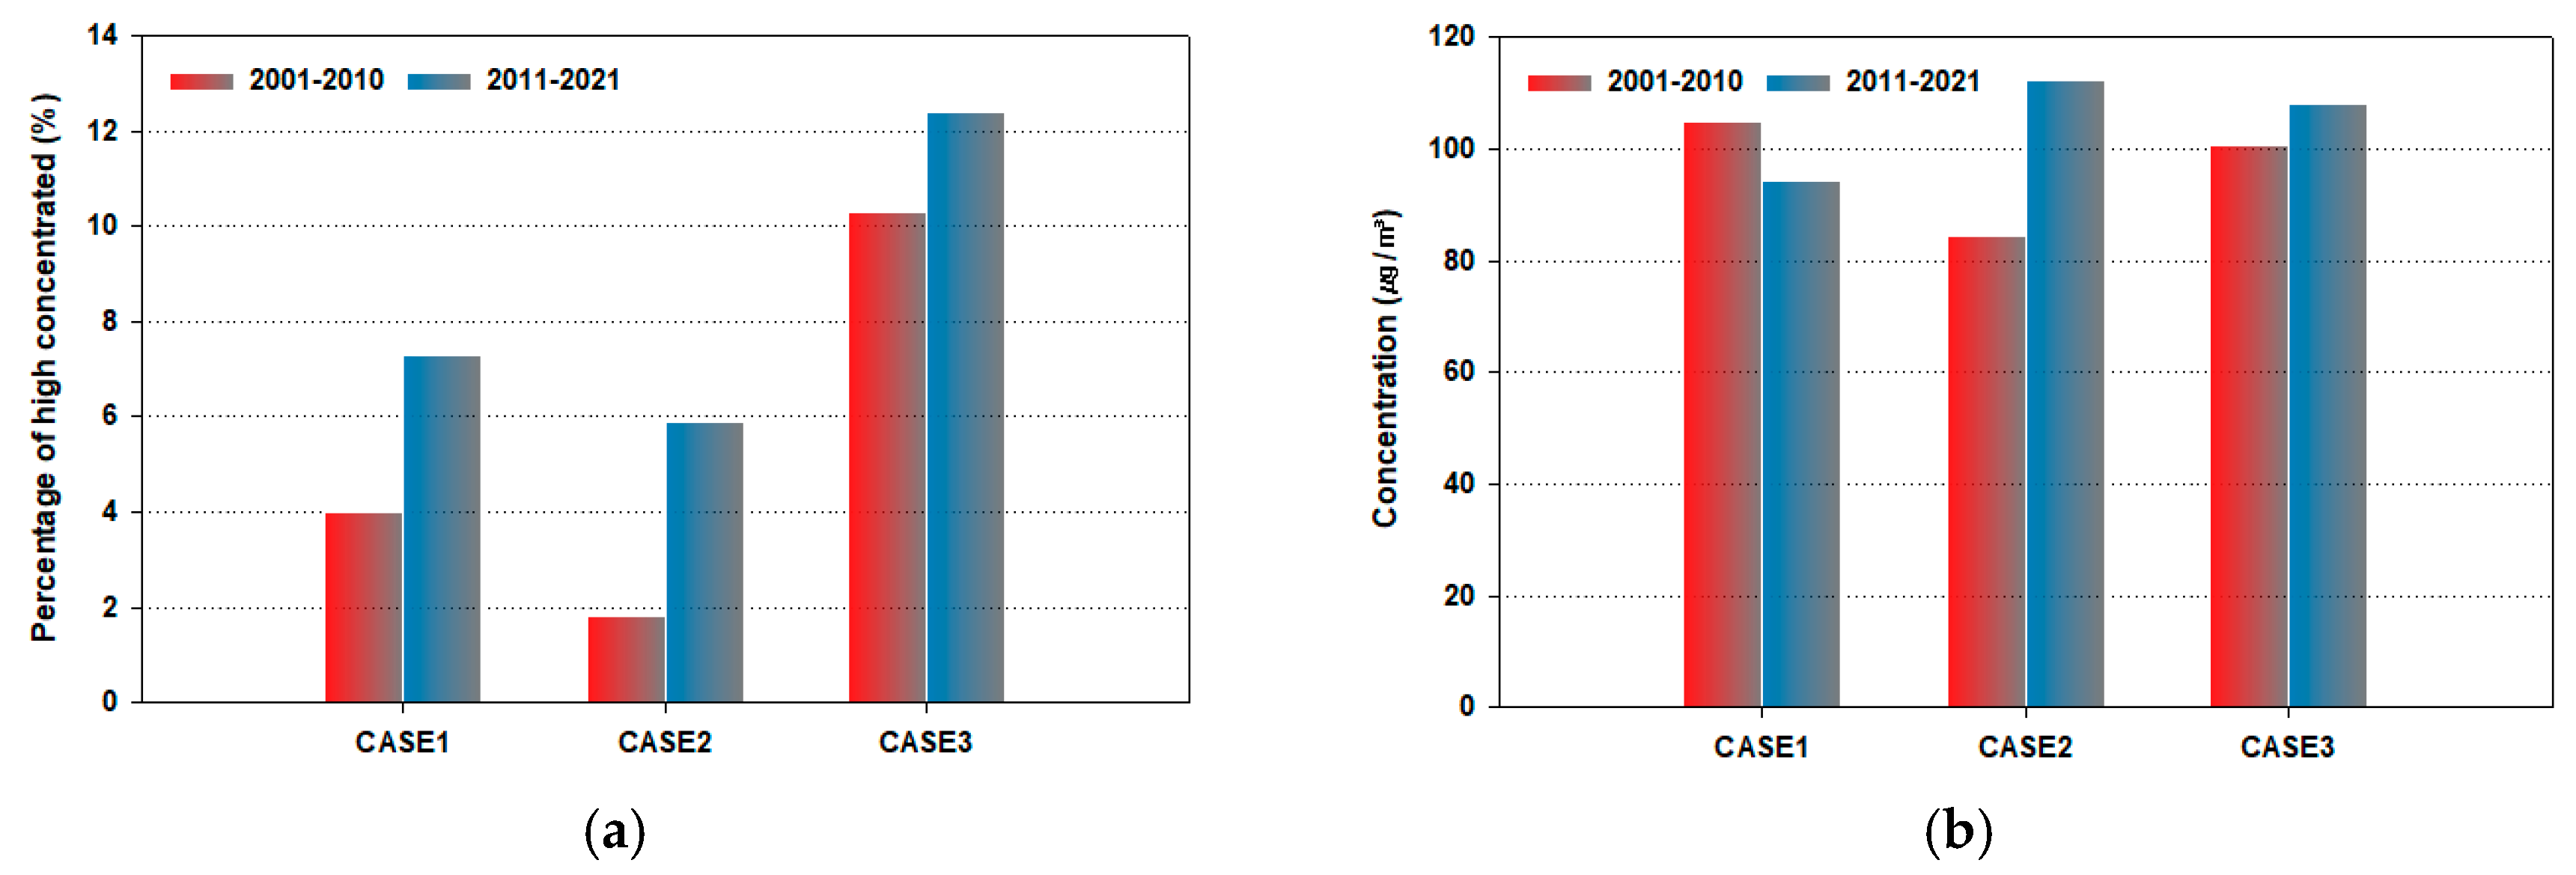
Figure 2a displays the probability of high-PM10 events for the periods of 2001–2010 and 2011–2021. The data show a clear upward trend from pre- to post-typhoon periods, especially in the latter period, which is likely linked to the increased frequency of intense typhoons in recent years.
Figure 2b compares the PM10 concentrations during both periods, highlighting the significant increase in concentrations during the post-typhoon phase, further supporting the observed upward trend in PM10 levels.
3.2.2. Probability of High-PM10 Events
Table 2 shows the probability of high-PM10 events during the pre-impact, impact, and post-impact periods. The results confirm that the probability of high-PM10 events is highest during the post-impact period for most cities, particularly Incheon, where the probability of high-PM10 events increases sharply to 84.5%. This is due to atmospheric subsidence and the transport of pollutants from neighboring industrial areas after the typhoon passes. Gwangju and Busan also exhibited high probabilities of high-PM10 events, with probabilities of 62.3% and 60.8%, respectively.
Incheon stands out with an exceptionally low probability of high-PM10 events during the pre-impact period (0.2%). This can be attributed to a combination of local meteorological conditions, including winds that prevent pollutant buildup, and geographical factors that may limit the accumulation of airborne particulate matter in the region. This highlights the importance of considering both local and regional meteorological conditions when evaluating the impact of typhoons on air quality.
3.2.3. Regional Variations in PM10 Concentration Changes
Table 3 presents the average PM10 concentrations during the pre-impact, impact, and post-impact periods. This table highlights the regional variations in PM10 concentrations. Coastal cities like Incheon and Busan experienced significant increases in PM10 levels during the post-impact period, with Incheon reaching 58.5 μg/m
3, up from 50.7 μg/m
3 during the pre-impact period. Busan saw a substantial increase as well, from 50.8 μg/m
3 pre-impact to 62.2 μg/m
3 post-impact.
The regional differences in PM10 concentration changes can be attributed to a combination of factors, including atmospheric conditions and local pollutant sources. In Incheon, which is heavily influenced by nearby industrial zones, the post-typhoon increase in PM10 levels is largely driven by pollutant transport and atmospheric stability. Similarly, Gwangju also saw a significant increase in PM10 concentrations during the post-impact period, with concentrations rising from 54.8 μg/m3 pre-impact to 52.0 μg/m3 post-impact.
In contrast, inland cities like Daegu and Daejeon showed more moderate changes in PM10 concentrations during the post-impact period. For example, Daegu’s PM10 concentration increased from 43.0 μg/m3 pre-impact to 51.6 μg/m3 post-impact, reflecting a smaller increase compared to the coastal cities. This suggests that local topography and meteorological factors in inland regions may limit the transport of pollutants from other areas, reducing the magnitude of PM10 increases after the typhoon.
3.3. Case Study: Typhoon MITAK(1918)
Typhoon MITAK, which impacted South Korea in late September 2019, provides a clear example of how pre-typhoon atmospheric conditions can lead to unexpectedly high PM10 concentrations. As the typhoon approached the Korean Peninsula, the meteorological conditions prior to its landfall played a significant role in increasing PM10 levels. During the pre-impact period, weak winds and high humidity created conditions conducive to the accumulation of pollutants in the atmosphere, particularly in urban areas like Seoul.
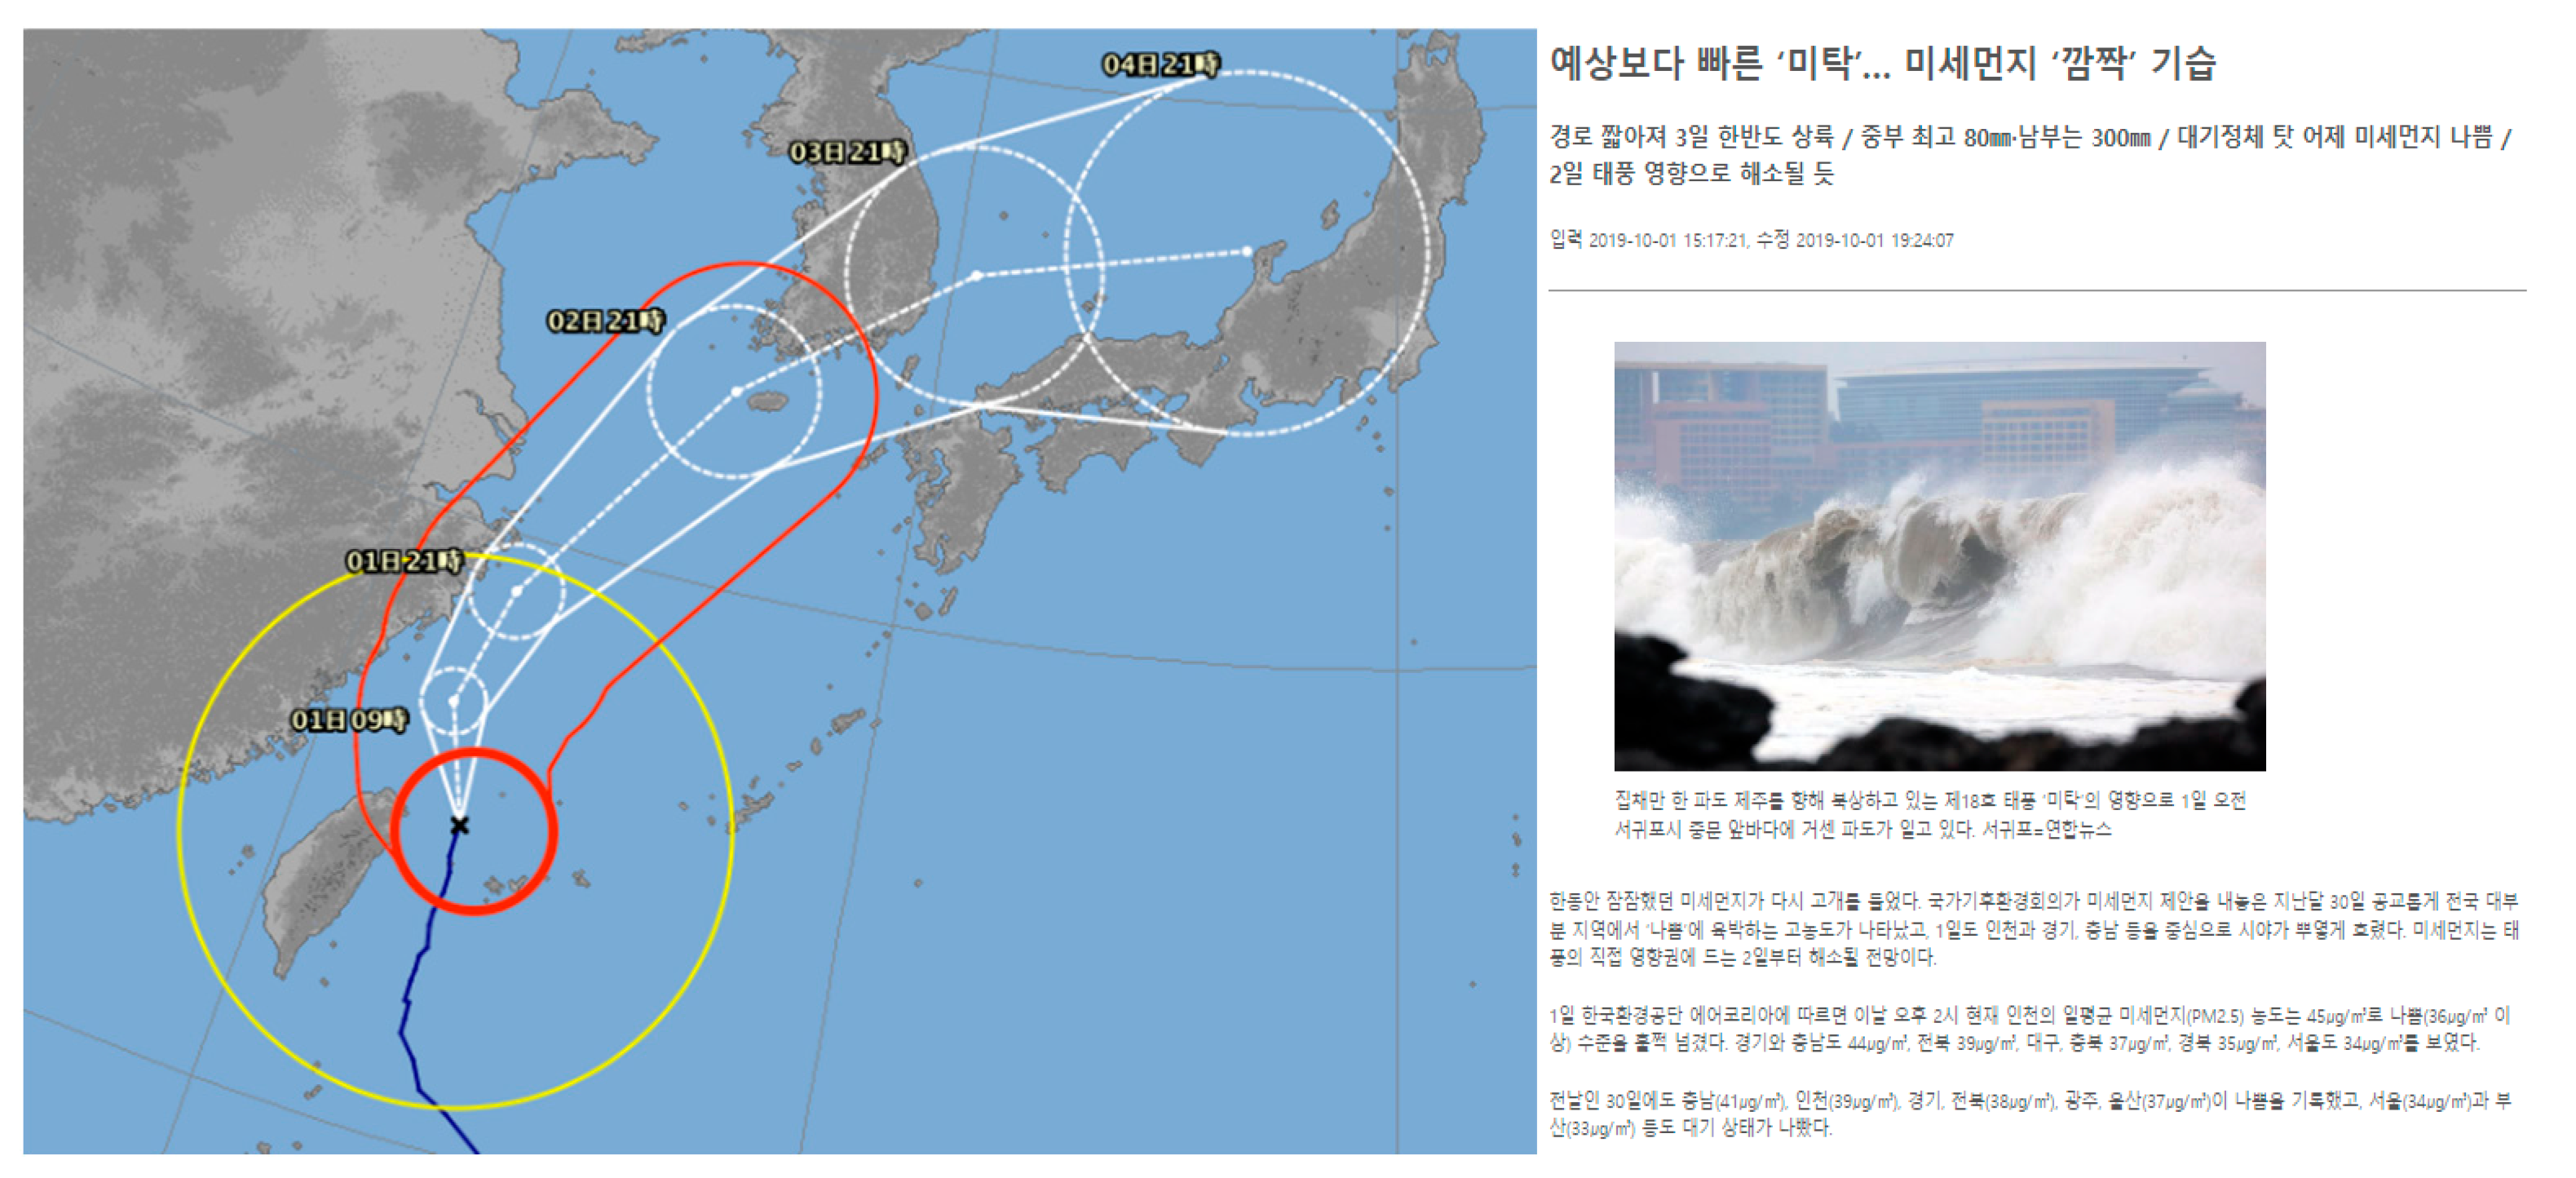
Figure 3 shows the trajectory of Typhoon MITAK along with the pre-typhoon PM10 concentrations. The figure highlights the unexpected high PM10 concentrations observed in the days leading up to the typhoon’s arrival. The typhoon made landfall on 2 October 2019, as a tropical storm, which temporarily reduced PM10 levels due to strong winds and heavy rainfall. However, following the typhoon’s passage, PM10 concentrations rose again due to atmospheric subsidence and pollutant influx from other regions.
This case study illustrates the complex interaction between typhoons and air quality, demonstrating that high PM10 concentrations can occur before the typhoon due to atmospheric stagnation and pollutant convergence. These findings emphasize the need for a nuanced understanding of how typhoons impact air quality, particularly in urban areas like Seoul, which are more susceptible to changes in atmospheric conditions.
3.3.1. Meteorological Characteristics of Typhoon MITAK
Typhoon MITAK developed from a low-pressure system near Micronesia on 24 September 2019, and gradually intensified as it moved northwestward. It became a tropical storm on September 28 and reached typhoon strength by September 29. On September 30, the typhoon reached its peak intensity as a Category 2 storm, just east of Taiwan. As MITAK approached the Korean Peninsula, it began to weaken due to increased wind shear and cooler sea surface temperatures. The typhoon made landfall in South Korea on 2 October 2019, as a tropical storm.
Prior to its arrival, the atmospheric conditions in the Seoul metropolitan area were characterized by weak winds and high relative humidity, which favored the accumulation of pollutants. These conditions, along with the influx of pollutants from neighboring regions, led to PM10 concentrations exceeding 81 μg/m3, a level classified as “unhealthy” by Korean air quality standards.
Prior to its arrival, the atmospheric conditions in the Seoul metropolitan area were marked by weak winds and high relative humidity, which favored the accumulation of pollutants. These conditions, along with the influx of pollutants from neighboring regions, contributed to PM10 concentrations exceeding 81 μg/m3, a level classified as “unhealthy” by Korean air quality standards.
3.3.2. PM10 Concentrations During Typhoon MITAK
During the pre-impact period of Typhoon MITAK, PM10 concentrations in Seoul and surrounding metropolitan areas steadily increased. This rise in PM10 levels was primarily due to atmospheric stagnation and the convergence of pollutants ahead of the storm. As the typhoon approached, its presence led to a temporary reduction in PM10 concentrations due to strong winds and heavy rainfall, which helped to disperse and wash out pollutants.
However, after MITAK made landfall, PM10 concentrations rapidly increased again. This resurgence was driven by the combined effects of atmospheric subsidence, reduced wind speeds, and the influx of pollutants from surrounding regions. The rebound in PM10 concentrations highlights the complexity of the relationship between typhoons and air quality. While the arrival of a typhoon can temporarily improve air quality during its impact period, the post-typhoon period often sees a resurgence in PM10 concentrations due to the lingering effects of subsidence and pollutant transport.
3.3.3. Spatial Distribution of PM10 Concentrations
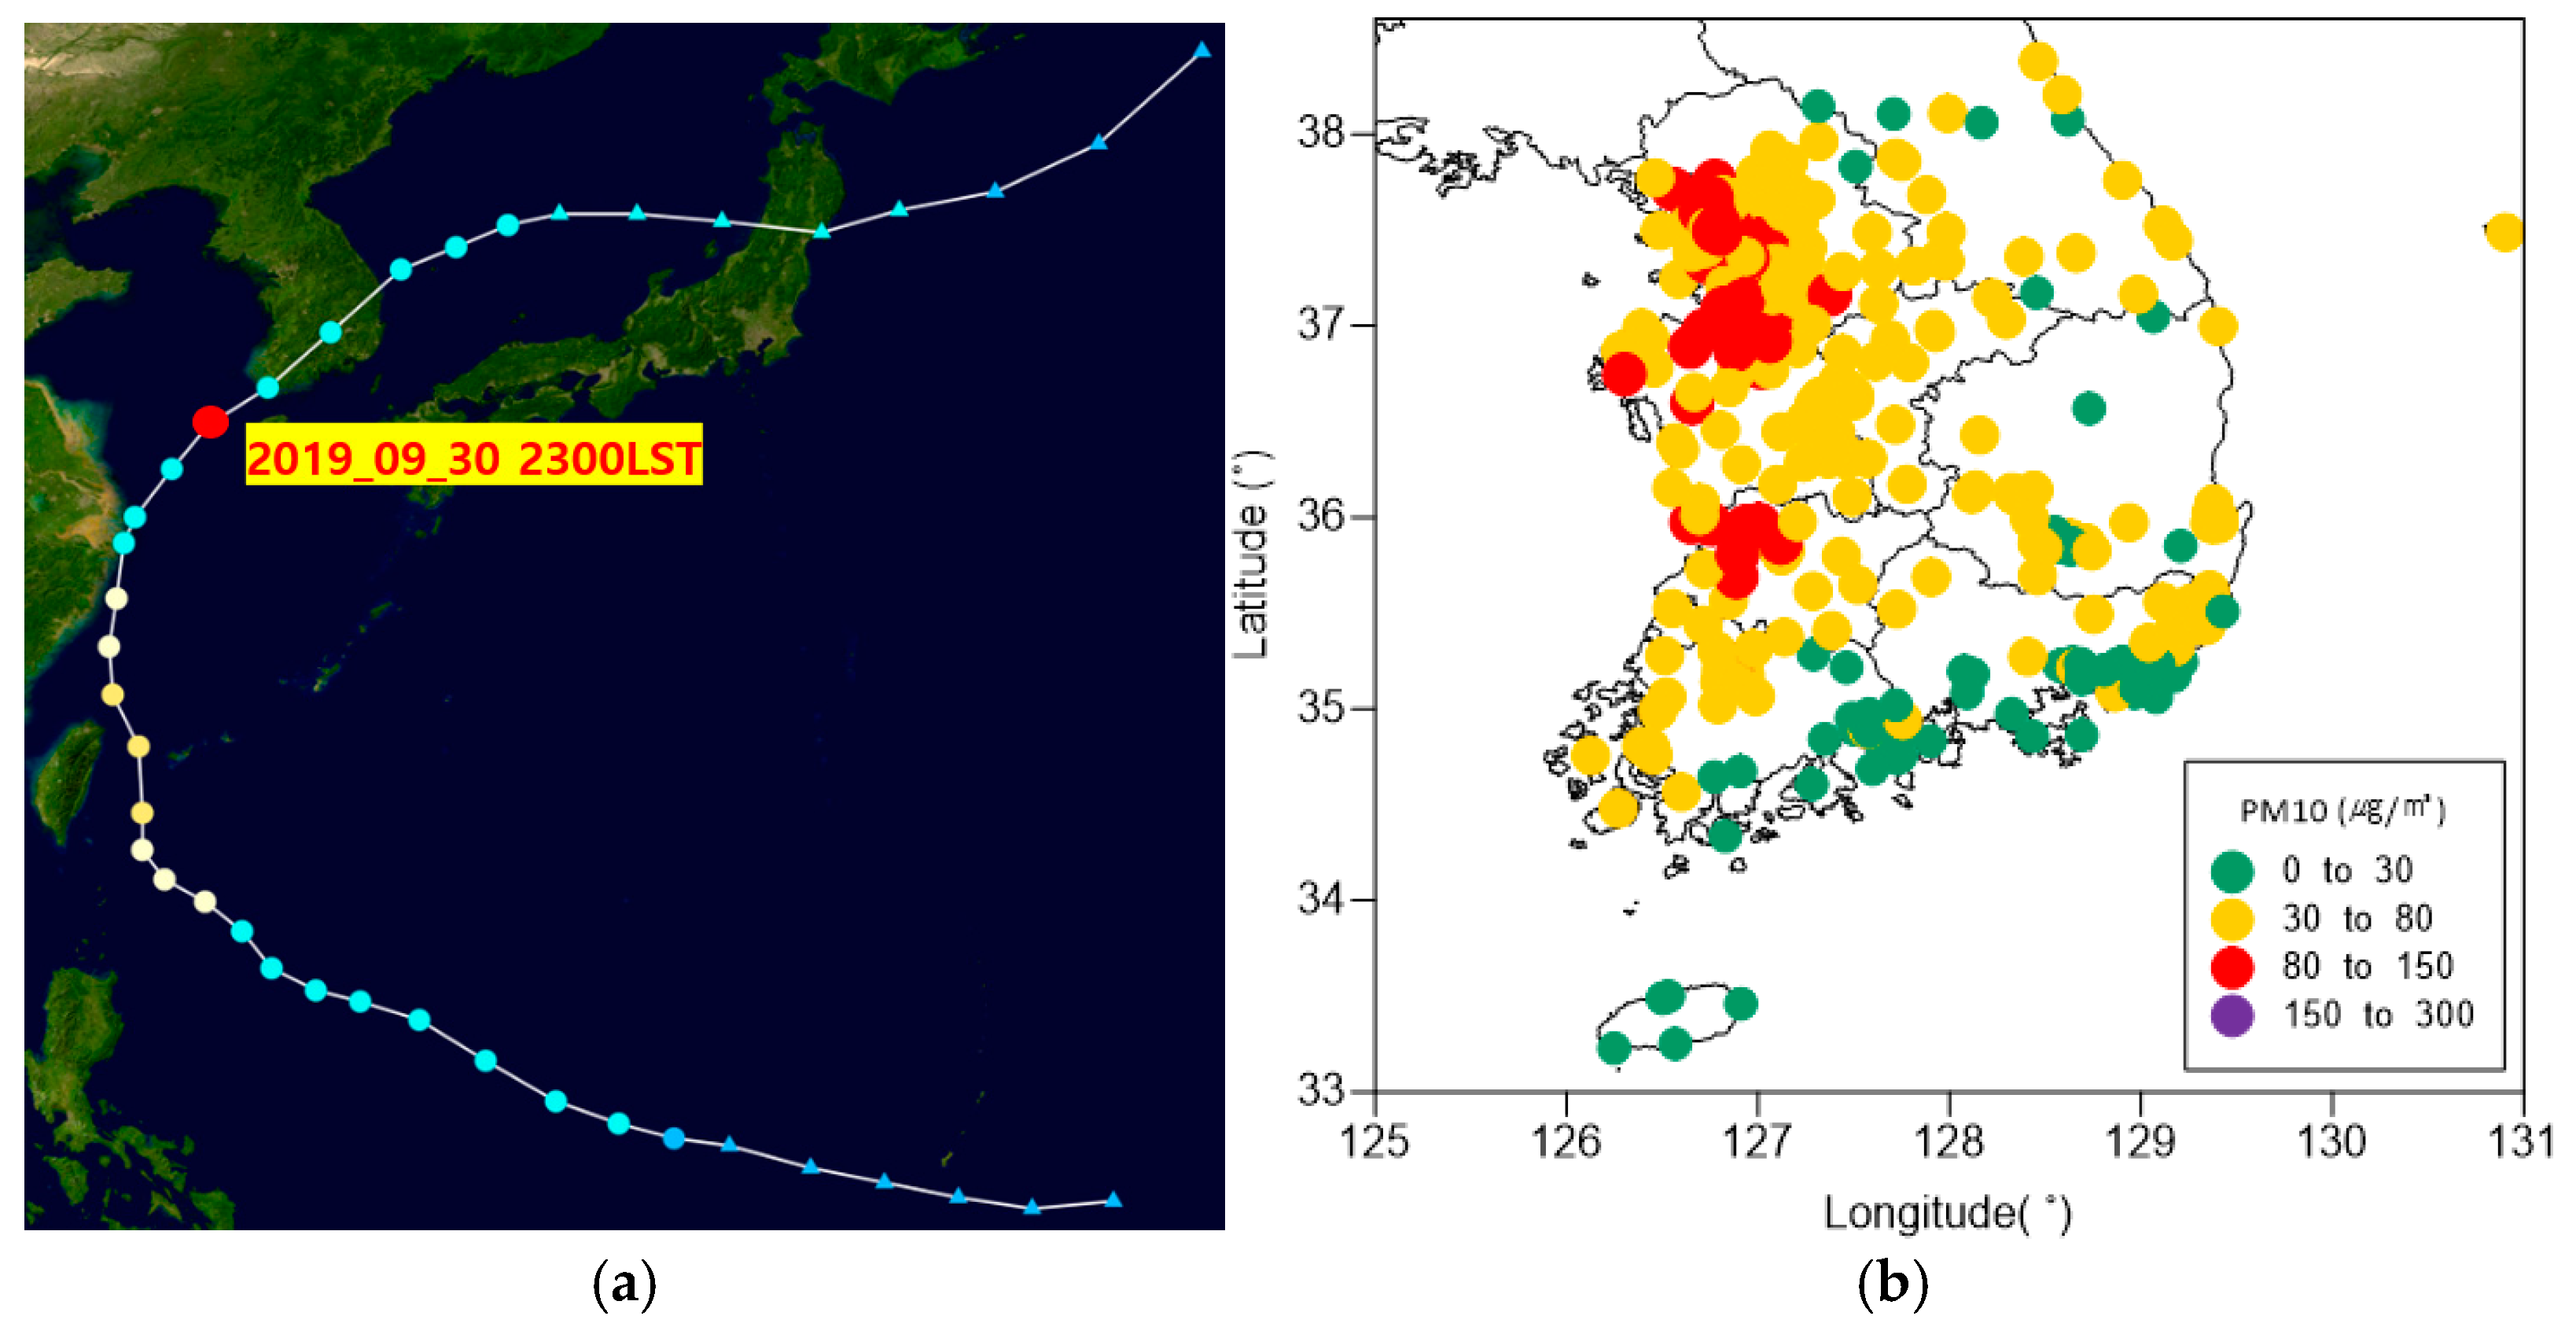
Figure 4 illustrates the trajectory of Typhoon MITAK and the spatial distribution of PM10 concentrations on September 30, 2019, at 23:00 LST. Panel (a) of the figure shows the typhoon’s trajectory, while Panel (b) displays the spatial distribution of PM10 concentrations, highlighting areas where PM10 levels exceeded the “unhealthy” threshold of 81 μg/m
3. The figure reveals that the highest levels of PM10 concentrations were concentrated in the Seoul metropolitan area and surrounding regions before the typhoon’s arrival. This supports the hypothesis that atmospheric stagnation and pollutant accumulation were significant contributors to the observed high PM10 concentrations in these regions.
The spatial distribution of PM10 concentrations during the pre-impact period demonstrates that urban areas with high industrial activity, such as Seoul, are particularly vulnerable to increased particulate pollution before a typhoon’s landfall.
3.3.4. Meteorological Conditions and PM10 in Seoul and Busan
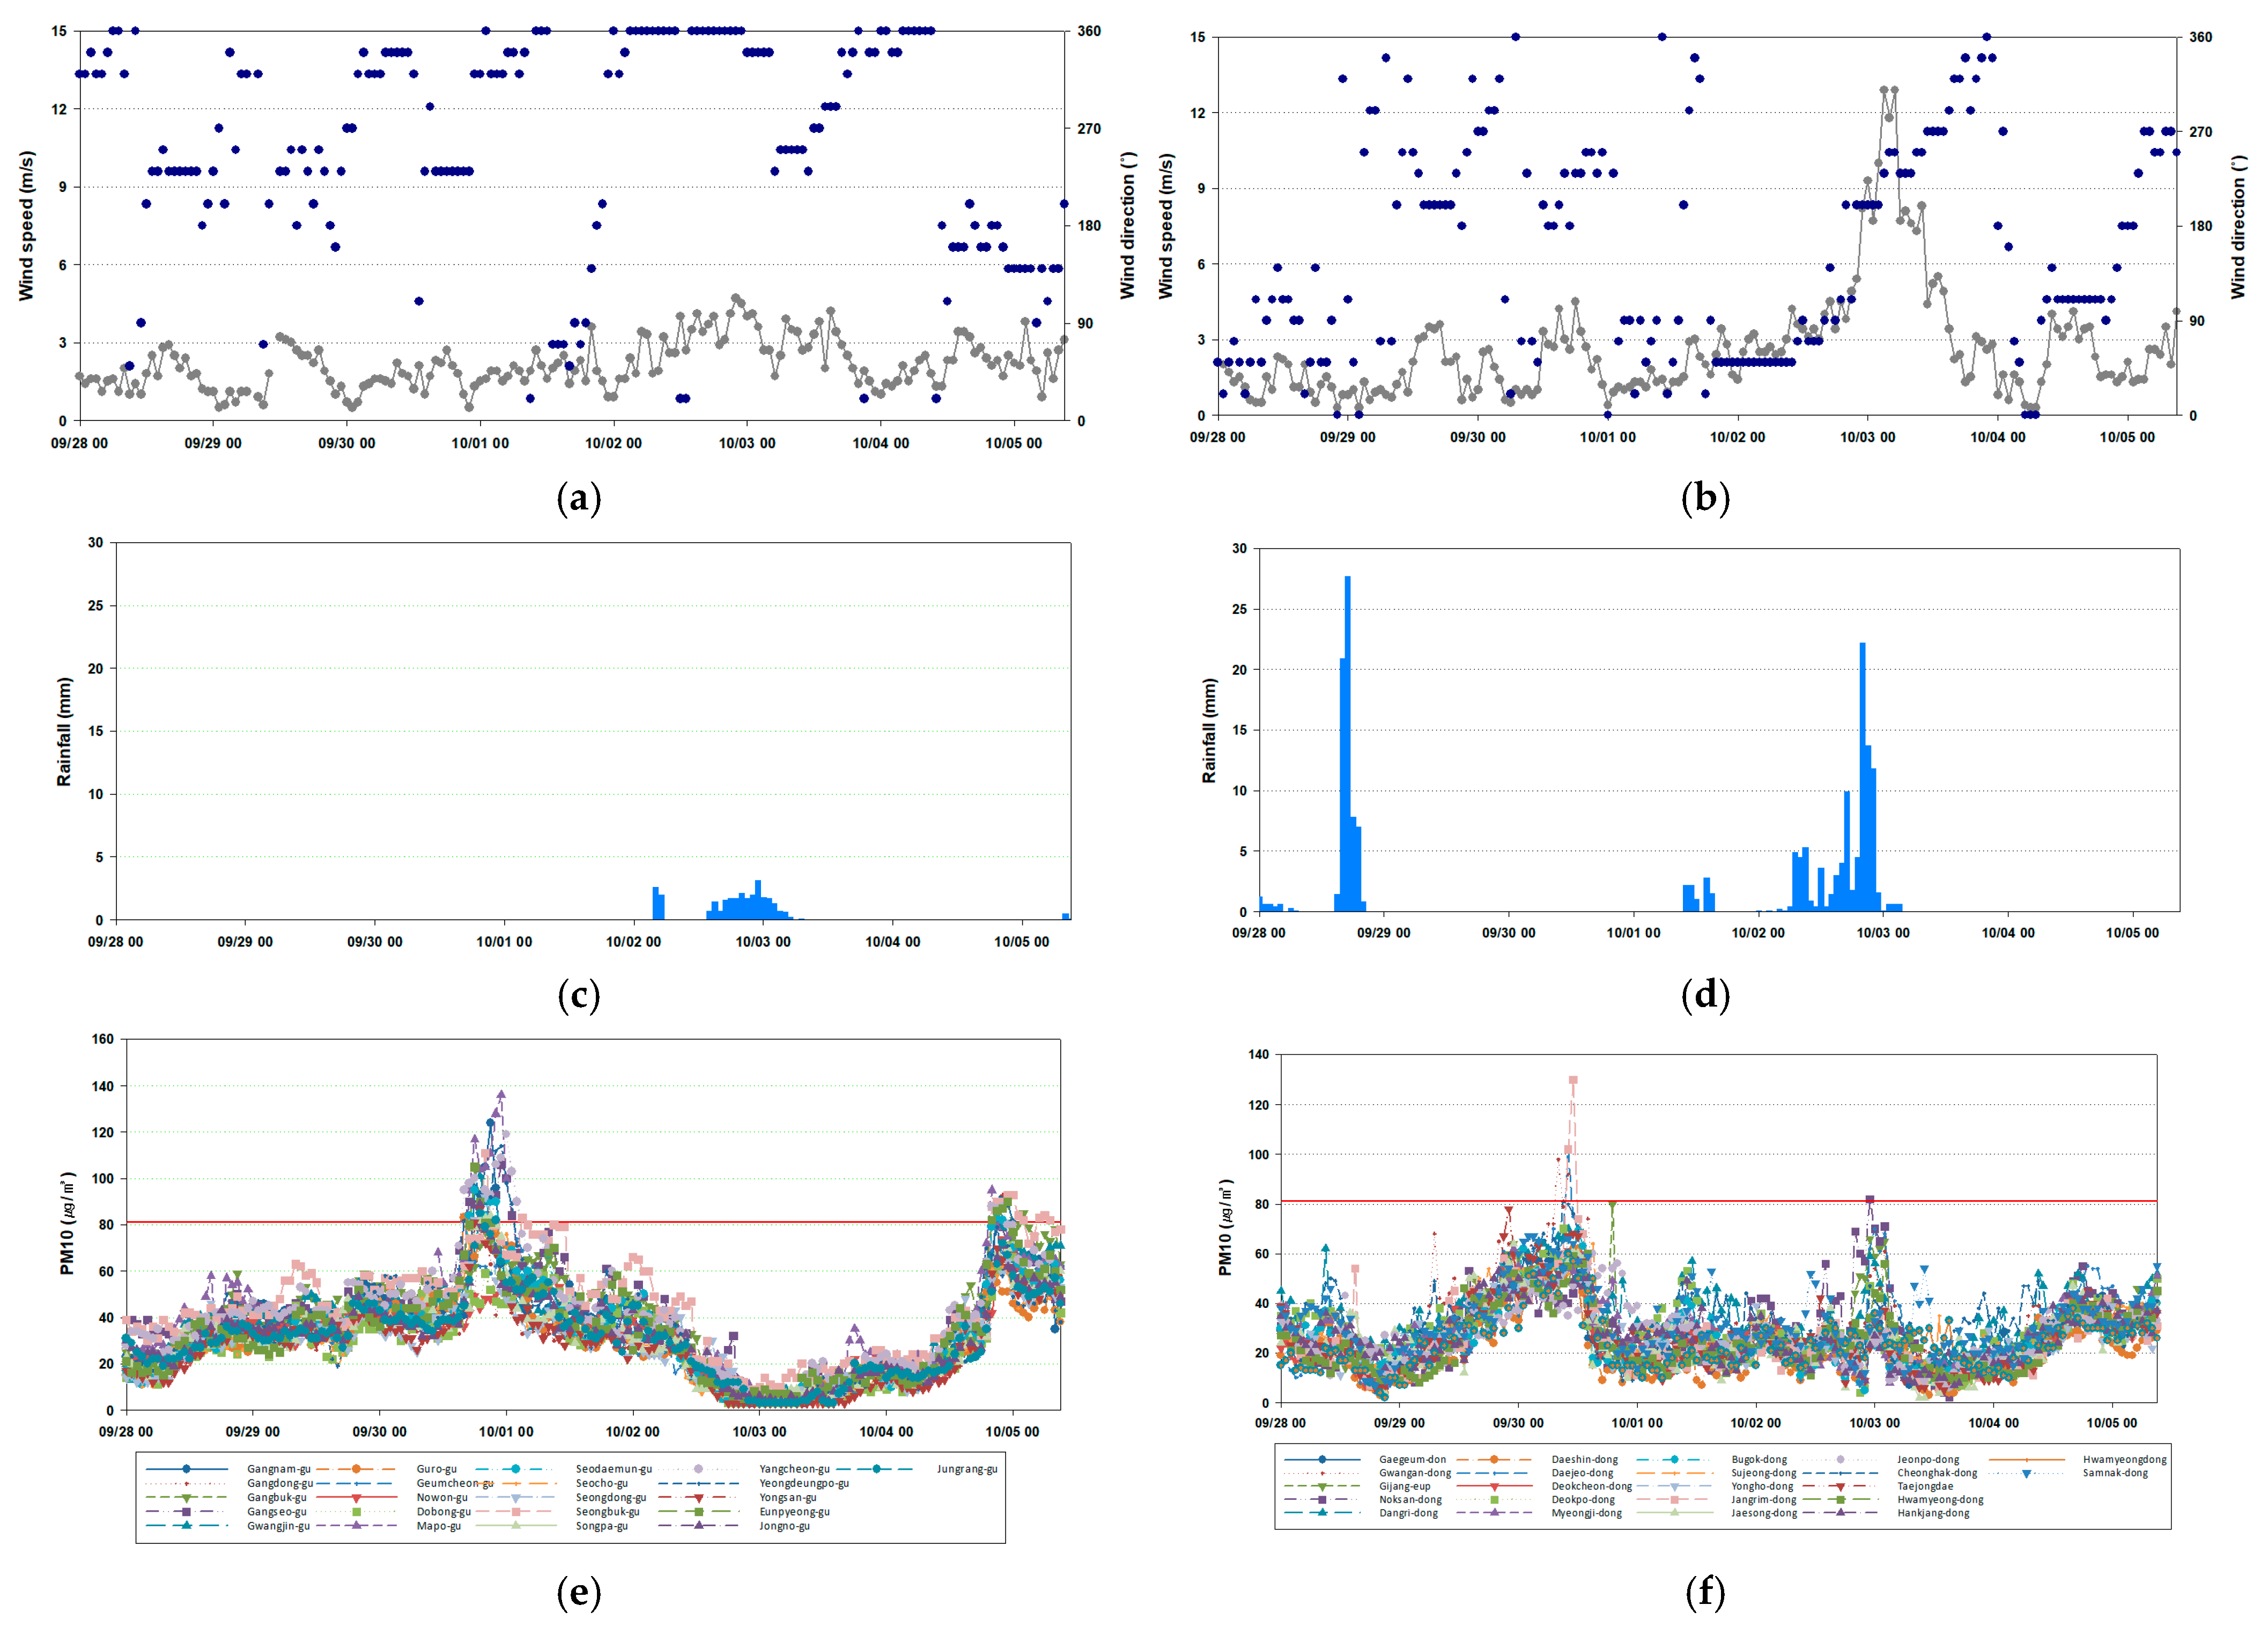
Figure 5 summarizes the meteorological conditions and PM10 concentrations in Seoul (left) and Busan (right) during Typhoon MITAK’s passage. Panel (a) and (b) show the wind patterns in Seoul and Busan, while panels (c) and (d) illustrate the rainfall patterns. Panels (e) and (f) depict the PM10 concentrations in both cities during the typhoon.
Before the typhoon’s arrival, both cities experienced stagnant atmospheric conditions characterized by weak winds, leading to a notable accumulation of PM10. Specifically, PM10 concentrations in Seoul and Busan climbed above the unhealthy threshold, signaling a deterioration in air quality. However, as MITAK approached and made landfall, heavy rainfall proceeded to temporarily wash pollutants from the atmosphere, resulting in a transient improvement in air quality. This improvement, however, was short-lived, as PM10 concentrations rebounded after the typhoon passed. The rebound highlights the complex interplay between meteorological factors and air quality dynamics in these cities.
3.4. Analysis of High PM10 Concentrations Based on Typhoon Track Types
3.4.1. Classification of Typhoon Track Types
To better understand how different typhoon tracks affect PM10 concentrations in South Korea, this study classifies typhoon tracks based on their impact on the Korean Peninsula. The classification is based on criteria proposed by [
14], and it includes seven distinct typhoon track types. These track types account for variations in the movement of typhoons and the specific meteorological conditions that influence air quality in affected regions.
The classification system differentiates between typhoons that impact South Korea directly and those that pass through neighboring regions like Japan or China. Additionally, the classification considers the southern coast’s unique characteristics, as typhoons that approach this region tend to exhibit different atmospheric behaviors compared to those affecting the northern regions.
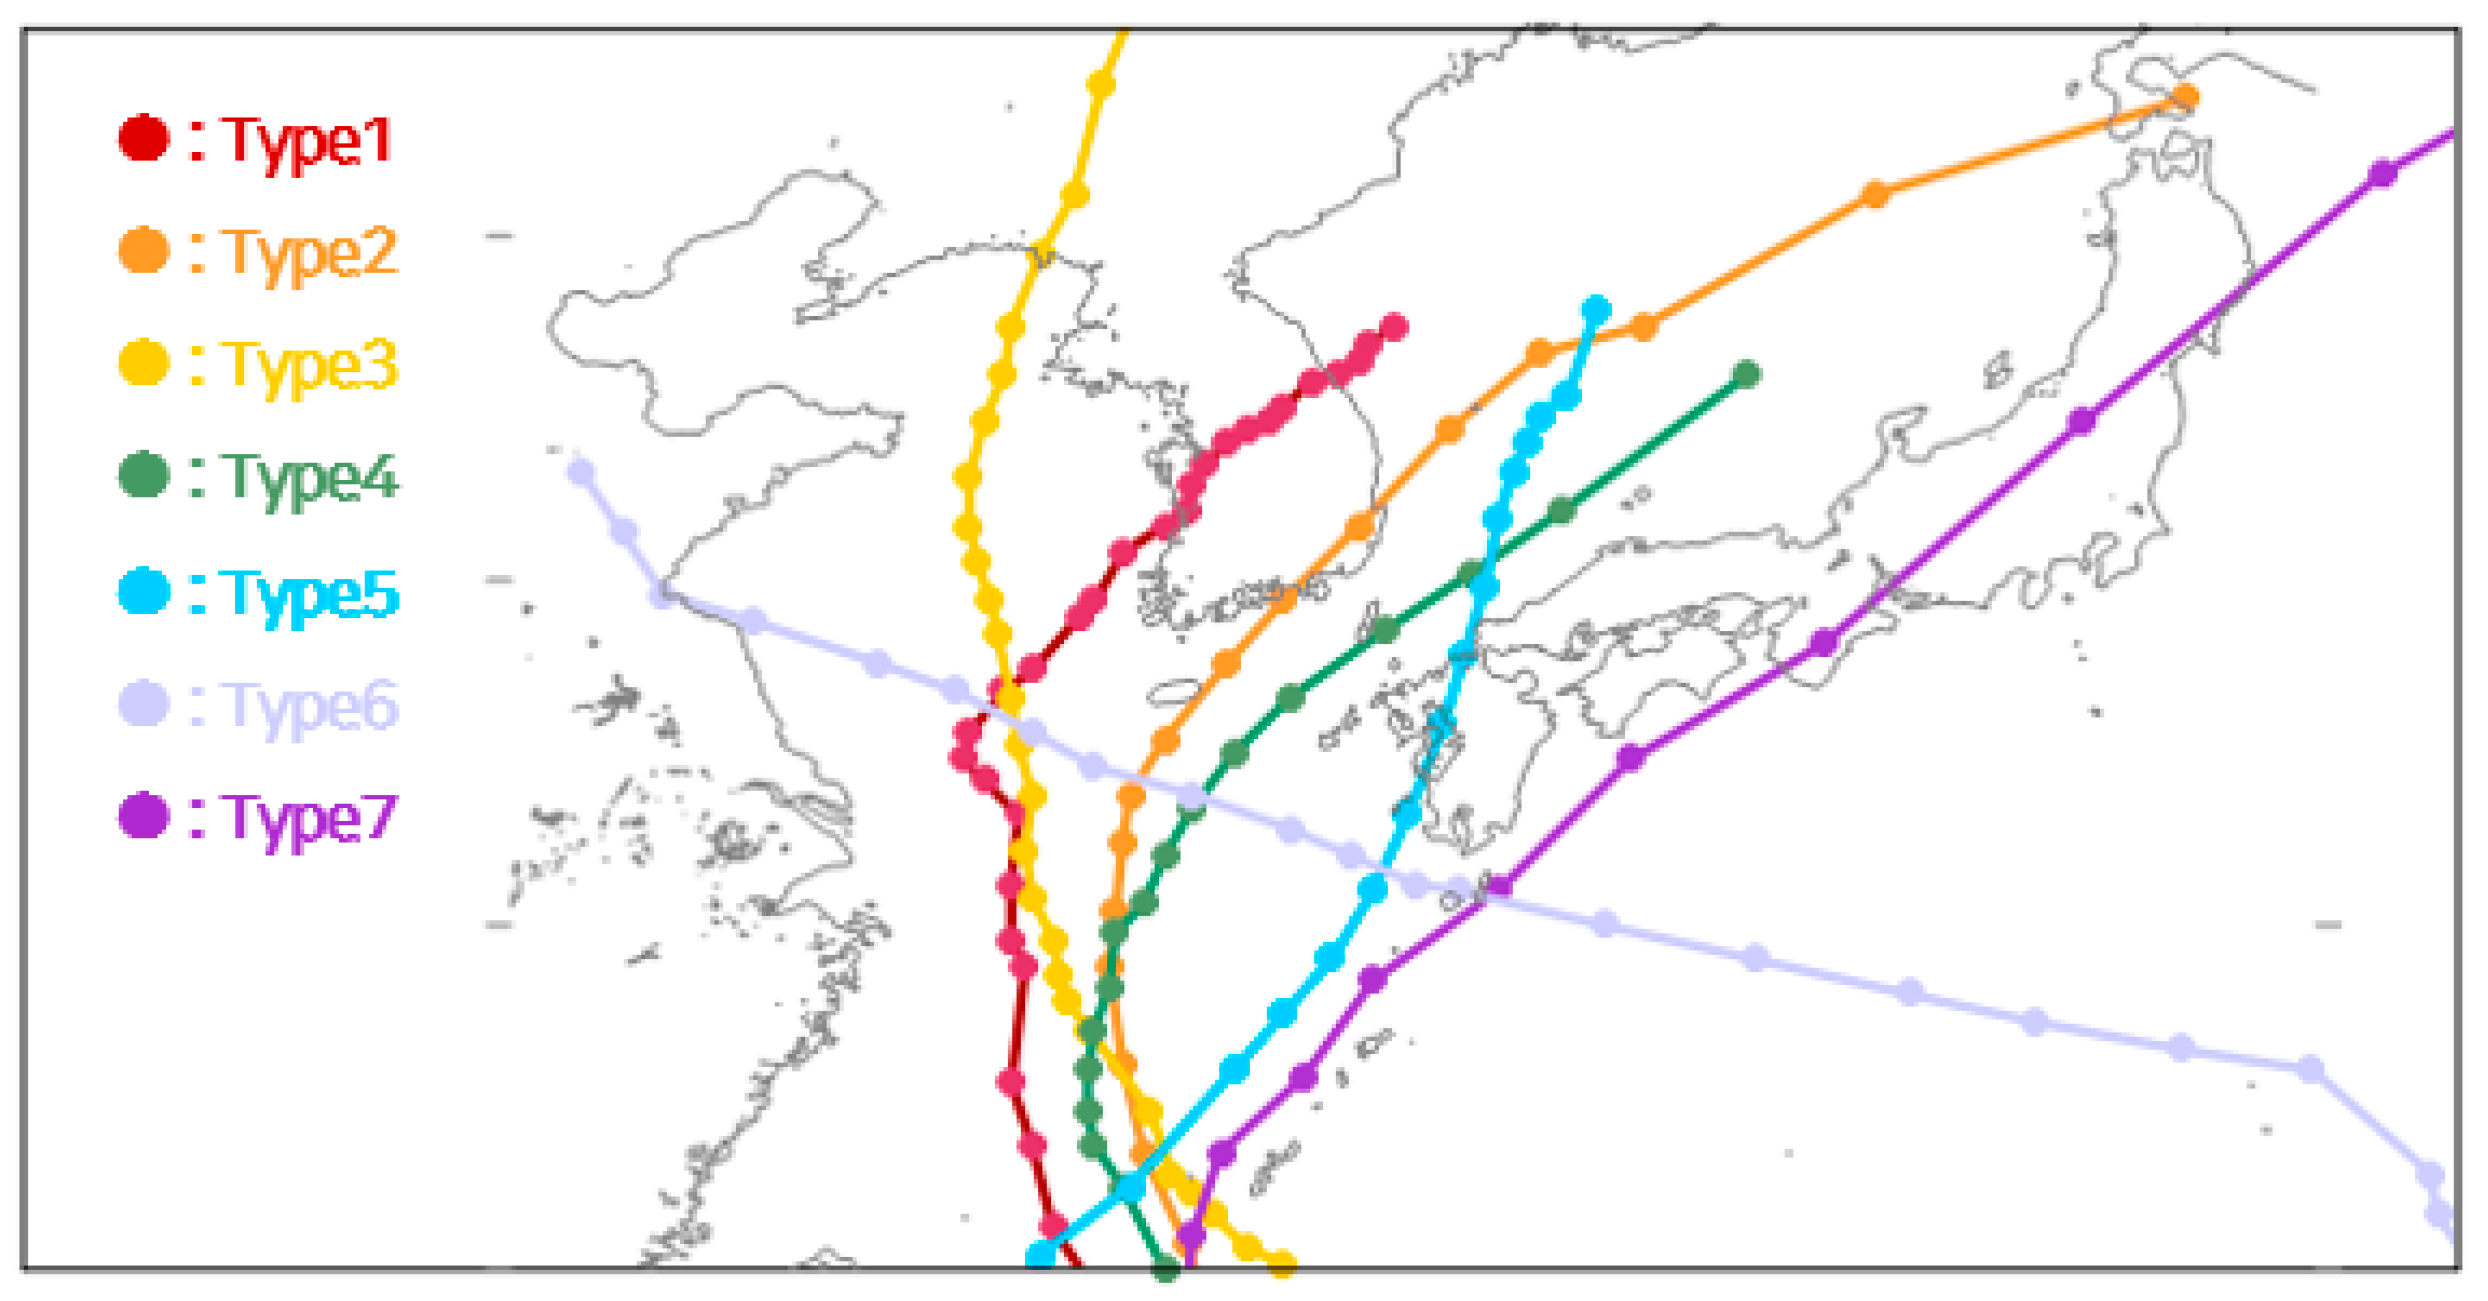
Figure 6 illustrates the seven track types defined for this study, highlighting regions where typhoons tend to impact differently depending on their path. This map clearly shows the varying trajectories of typhoons and their different impacts on the Korean Peninsula. Typhoons that follow paths closer to the western coast of South Korea tend to result in higher PM10 concentrations due to the atmospheric stagnation and pollutant accumulation they cause before landfall.
3.4.2. Probability of High-PM10 Events by Typhoon Track Type and Impact Period
The probability of high-PM10 events during the pre-impact, impact, and post-impact periods was analyzed for each typhoon track type. The analysis revealed that different track types exhibit distinct impacts on PM10 concentrations, both in terms of timing and intensity of high-PM10 events.
Table 4 shows the highest PM10 concentration during the pre-impact period for each track type. For instance, Track Type 2, which primarily affects regions along the western coast of South Korea, exhibits the highest probability of high-PM10 events, particularly in Seoul (57.5%) and Incheon (43.6%). This is due to atmospheric stagnation and pollutant accumulation before the typhoon’s arrival.
Table 5 presents the highest PM10 concentrations during the impact period. The probability of high-PM10 events during this period is generally lower, with the typhoons washing out pollutants due to high winds and heavy rainfall. However, certain regions, particularly Busan and Daegu, show higher probabilities of high PM10 concentrations during the impact period, especially when affected by Track Type 3 (e.g., Busan with 53.6%). This suggests that local topographic and meteorological factors may influence PM10 concentrations even during the active typhoon phase.
Finally,
Table 6 shows the highest PM10 concentrations during the post-impact period. Here, the highest probability of high-PM10 events is associated with Track Type 7. This is evident in cities like Busan (40.6%), Gwangju (45.8%), and Ulsan (53.0%). These cities experience significant increases in PM10 concentrations after the typhoon passes due to atmospheric subsidence and pollutant transport from other regions. Even Track Type 3 typhoons, which typically lead to lower PM10 concentrations during the impact period, show high probabilities of high-PM10 events in Seoul (62.1%) during the post-impact period.
3.4.3. Regional Characteristics of High PM10 Concentrations by Typhoon Track Type
The analysis of high-PM10 event probabilities based on typhoon track types reveals that different track types are associated with distinct patterns of high PM10 occurrence during the pre-, during-, and post-typhoon periods. The probability of high-PM10 events during each phase was calculated for each typhoon track type, emphasizing the influence of typhoon paths on air quality.
Pre-Impact Period
Typhoons following Track Type 2, which approach the western coast of South Korea, show a high probability of high-PM10 events in the pre-impact period. This is particularly noticeable in Seoul and Incheon. These regions experience atmospheric stagnation and pollutant accumulation before the typhoon’s arrival, leading to an increased likelihood of high PM10 concentrations.
Impact Period
The probability of high-PM10 events during the impact period was generally low across most track types, as strong winds and heavy rainfall during typhoon landfall lead to the dispersion and washout of pollutants. However, certain regions showed increased probabilities, especially those affected by typhoons following Track Type 3.
Track Type 3: In the case of Track Type 3, cities such as Busan and Daegu showed higher probabilities of high-PM10 events during the impact period, with Busan reaching 53.6%. This suggests that local meteorological conditions and topographic factors may influence PM10 concentrations even during the active typhoon phase.
Post-Impact Period
The highest probabilities of high-PM10 events were observed during the post-typhoon period, particularly in regions affected by Track Type 7 typhoons. After the typhoon passes, atmospheric subsidence and reduced wind speeds facilitate the accumulation of pollutants, leading to significant increases in PM10 concentrations.
Track Type 7: Typhoons following Track Type 7 were associated with the highest probabilities of high-PM10 events in cities such as Busan (40.6%), Gwangju (45.8%), and Ulsan (53.0%). These cities experienced the most significant increases in PM10 concentrations during the post-impact period due to the combined effects of atmospheric stability and pollutant transport from other regions.
Track Type 3: Even though Track Type 3 typhoons typically led to lower PM10 concentrations during the impact period, they were linked to high probabilities of high-PM10 events in Seoul (62.1%) during the post-impact period. This suggests that post-typhoon conditions can create an environment conducive to the accumulation of pollutants, even after the storm has passed.
4. Summary and Conclusions
This study presents a comprehensive analysis of the effects of typhoons on PM10 concentrations in South Korea, challenging the commonly held belief that typhoons always improve air quality by dispersing pollutants. By examining long-term data (2001–2021) from seven major cities, we found that specific meteorological conditions before and after typhoons, such as atmospheric stagnation and subsidence, can significantly increase PM10 concentrations. Our findings demonstrate that the post-typhoon period is particularly prone to high-PM10 events, with cities like Incheon, Busan, and Gwangju experiencing substantial increases in PM10 levels (84.5%, 60.8%, and 62.3%, respectively). A case study of Typhoon MITAK further supports this, showing that even before the typhoon’s landfall, atmospheric conditions contributed to PM10 concentrations exceeding the “unhealthy” threshold in Seoul.
The study also highlights the regional variability in PM10 concentration changes, influenced by different typhoon tracks and local pollution sources. Coastal cities such as Incheon and Busan are more affected by long-range pollutant transport, whereas inland cities like Daegu and Daejeon experience smaller increases in PM10 levels, likely due to limited pollutant transport. Understanding these regional differences is critical for more accurate air quality predictions and effective management strategies in typhoon-prone regions.
Furthermore, this research underscores the importance of integrating real-time air quality monitoring systems into predictive models to mitigate the adverse effects of typhoon-induced air pollution. Real-time data could provide valuable insights for forecasting PM10 concentration trends and improving public health response strategies during typhoon events. Given the increasing frequency and intensity of typhoons due to climate change, enhancing air quality management systems in affected regions will be crucial for minimizing the public health risks associated with extreme weather events.
In conclusion, this study provides essential insights into the complex dynamics of typhoon-induced air pollution. It not only challenges the prevailing assumptions about the relationship between typhoons and air quality but also offers a framework for improving air quality management in regions vulnerable to typhoon impacts. Future research should focus on refining predictive air quality models, particularly by incorporating more detailed meteorological factors and expanding the scope of analysis to include different typhoon intensities and categories. Long-term studies that explore the cumulative effects of multiple typhoons in each season will also be valuable in understanding the broader implications of typhoon-induced pollution on public health and air quality.
Author Contributions
Conceptualization, H.N. and W.-S.J.; Methodology, H.N. and W.-S.J. Writing—original draft, H.N.; Writing—review & editing, W.-S.J. All authors have read and agreed to the published version of the manuscript.
Funding
This work was supported by the National Research Foundation of Korea (NRF) grant funded by the Korean government (MSIT) (No. RS-2023-00212688).
Data Availability Statement
Data are contained within the article.
Conflicts of Interest
The authors declare no conflict of interest.
References
- Wang, L.; Zhang, X.; Zhao, X.; Sun, Y.; Liu, W. Air quality during typhoon events in East China. Atmos. Environ. 2015, 112, 23–35. [Google Scholar]
- Zhang, W.; Liu, S.; Zhou, Y.; Feng, J.; Xu, L. Typhoon-induced variations in PM10 concentrations: Observations from South China. Sci. Total Environ. 2019, 667, 566–574. [Google Scholar]
- Han, Y.J. Variations of PM10 concentration in South Korea in response to typhoon activity in the South China Sea. Ph.D. Thesis, Seoul National University Graduate School, Seoul, Republic of Korea, 2018. [Google Scholar]
- Nah, T.; Lee, S.; Yoo, J.; Choi, B. The impacts of typhoons on air quality in Korea. Environ. Res. Lett. 2020, 15, 123012. [Google Scholar]
- Kim, Y.J.; Lee, J.W.; Kim, J.Y.; Kim, S.K. Long-range transport of particulate matter in South Korea and its relationship with regional sources. Atmos. Environ. 2017, 150, 147–158. [Google Scholar]
- Brook, R.D.; Pope, C.A. Review: Particulate matter and health—A review of the literature. Environ. Health Perspect. 2010, 118, 15–23. [Google Scholar]
- Younis, M.W.; Saritha; Kallapu, B.; Hejamadi, R.M.; Jijo, J.; Ramesh, R.; Aslam, M.; Jilani, S.F. Exploring the Influence of Tropical Cyclones on Regional Air Quality Using Multimodal Deep Learning Techniques. Sensors 2024, 24, 6983. [Google Scholar] [CrossRef] [PubMed]
- Huang, J.; Zhang, L.; Lee, H.; Yang, F.; Sun, S. Investigating the influence of typhoons on PM10 concentrations in Hong Kong. Atmos. Sci. Lett. 2018, 19, 220–226. [Google Scholar]
- Lin, S.; Wang, S.; Yang, Y.; Zhang, Y.; Liang, Y. Role of typhoon-induced meteorological conditions in the elevation of PM10 levels in Guangdong. Sci. Total Environ. 2019, 648, 892–902. [Google Scholar]
- Dean, R.B.; Dixon, W.J. Simplified statistics for small samples. Technometrics 1951, 2, 127–139. [Google Scholar]
- Deligiorgi, D.; Philippopoulos, A. A method for reducing errors in air quality data collection: Multi-point average method. Environ. Technol. 2011, 32, 1559–1571. [Google Scholar]
- Korean Ministry of Environment; Air Quality Standards in South Korea. Air Quality Management Report; Korean Ministry of Environment: Sejong-si, Republic of Korea, 2021.
- Licoletta, L.; Daniele, S.; Aristide, G.; Diego, B.; Massimo, P. Real-time On-road Monitoring Network of Air Quality. Chem. Eng. 2019, 74, 241–246. [Google Scholar]
- Na, H. Development of a Regional Risk Assessment and Prediction/Diagnosis System Based on Typhoon Impact Forecasting for Pre-Disaster of Combined Weather Disasters: Typhoon-Ready System. Ph.D. Thesis, Inje University, Gimhae-si, Republic of Korea, 2023. [Google Scholar]
| Disclaimer/Publisher’s Note: The statements, opinions and data contained in all publications are solely those of the individual author(s) and contributor(s) and not of MDPI and/or the editor(s). MDPI and/or the editor(s) disclaim responsibility for any injury to people or property resulting from any ideas, methods, instructions or products referred to in the content. |
© 2025 by the authors. Licensee MDPI, Basel, Switzerland. This article is an open access article distributed under the terms and conditions of the Creative Commons Attribution (CC BY) license (https://creativecommons.org/licenses/by/4.0/).


