Article

A Multi-Year Investigation of Thunderstorm Activity at Istanbul International Airport Using Atmospheric Stability Indices

1
Turkish State Meteorological Service, Milas-Bodrum Airport Meteorology Office, 48300 Muğla, Türkiye
2
Department of Climate Science and Meteorological Engineering, İstanbul Technical University, 34467 İstanbul, Türkiye
3
Department of Computer Engineering, İstanbul Aydın University, 34295 İstanbul, Türkiye
*
Author to whom correspondence should be addressed.
Atmosphere 2025, 16(4), 470; https://doi.org/10.3390/atmos16040470
Submission received: 23 February 2025 / Revised: 12 April 2025 / Accepted: 15 April 2025 / Published: 17 April 2025
(This article belongs to the Special Issue Weather and Climate Extremes: Past, Current and Future)

Abstract

:
Thunderstorms are weather phenomena that comprise thunder and lightning. They typically result in heavy precipitation, including rain, snow, and hail. Thunderstorms have adverse effects on flight at both the ground and the upper levels of the troposphere. The characteristics of the thunderstorm of Istanbul International Airport (International Civil Aviation Organization (ICAO) code: LTFM) have been investigated because it is currently one of the busiest airports in Europe and the seventh-busiest airport in the world. Geopotential height (m), temperature (°C), dewpoint temperature (°C), relative humidity (%), mixing ratio (g kg−1), wind direction (°), and wind speed (knots) data for the ground level and upper levels of the İstanbul radiosonde station were obtained from the Turkish State Meteorological Service (TSMS) for 29 October 2018 and 1 January 2023. Surface data were regularly collected by the automatic weather stations near the runway and the upper-level data were collected by the radiosonde system located in the Kartal district of İstanbul. Thunderstorm statistics, stability indices, and meteorological variables at the upper levels were evaluated for this period. Thunderstorms were observed to be more frequent during the summer, with a total of 51 events. June had the highest number of thunderstorm events with a total of 32. This averages eight events per year. A total of 72.22% occurred during trough and cold front transitions. The K index and total totals index represented the thunderstorm events better than other stability indices. In total, 75% of the thunderstorm days were represented by these two stability indices. The results are similar to the covering of this area: the convective available potential energy (CAPE) values which are commonly used for atmospheric instability are low during thunderstorm events, and the K and total totals indices are better represented for thunderstorm events. This study investigates thunderstorm events at the LTFM, providing critical insights into aviation safety and operational efficiency. The research aims to improve flight planning, reduce weather-related disruptions, and increase safety and also serves as a reference for airports with similar climatic conditions.

1. Introduction

Thunderstorms are natural weather events that occur when warm, moist air rises rapidly, leading to the formation of clouds, thunder, and lightning. Thunderstorms cause intense precipitation, such as rain, snow, and hail. They are also characterized by sudden and significant changes in wind direction, intensity, and wind shear [1]. Although relatively rare, thunderstorms can also produce land and sea tornadoes, which are caused by cumulonimbus clouds known as “tornado cells”. According to generally accepted definitions, a cumulonimbus (CB) cell has three basic phases: the cumulus phase, the maturity phase, and the dissipation phase [2]. Storm cells may consist of a single cumulonimbus cloud or multiple cumulonimbus clouds at different stages. In the latter case, these structures are referred to as “multicellular storms”. Supercells are thunderstorm cells with a deep and upward-rotating flow. They have the potential to produce hail and tornadoes and are effective over a large area for an extended period [3].
Due to the adverse effects they create both at ground level and at the upper levels, storm cells are known to be crucial weather phenomena for aviation. Vertical wind shear (wind direction or speed change with height) and gusts are among the most common weather phenomena that cause accidents [4]. Heavy rainfall, on the other hand, adversely affects flight safety and may cause damage to aircraft and airport equipment. Storm cells, characterized by lightning and thunderstorms, can cause damage to airport equipment and vehicles, as well as negatively impacting flight safety [5]. These effects can lead to difficulties in flight planning and increased flight costs. Delays and cancellations are some aspects of these costs, and extended flight paths due to storm cells are another [6].
In [7], it would appear that, according to the scope of the National Transportation Safety Board (NTSB, Washington, DC, USA) study for the USA, 1382 accidents related to weather phenomena occurred between 2009 and 2018. These incidents were grouped into 21 different meteorological phenomena. In total, 18% of the events were caused by low ceilings, 16% by wind shear, 13% by crosswinds, 7% by heavy precipitation, and only about 6% by thunderstorms.
Ref. [8] studied the climatology of non-hurricanes that formed strong storms in the United States between 1980 and 1994. Ref. [9] conducted a climatological study of thunderstorms which covered 450 observation stations (390 of them were surface observatories manned by the Indian Meteorological Department, 50 of them were from the Indian Air Force, and the remainder were operated by neighboring countries) in India and neighboring countries. Ref. [10] analyzed thunderstorms in the state of North Dakota using ground observations and radar data from 2002 to 2006. Ref. [11] developed a methodology for strong thunderstorm climatology based on radar data. Ref. [12] conducted a climatological study of thunderstorms in eastern and northeastern India using data from 26 observation stations of the Indian Meteorological Department and 8 of the Indian Air Force for the period 1981–2008. Ref. [13] created a large database on strong thunderstorms in Australia between 2003 and 2010 by using the Bureau of Meteorology (BoM) national severe thunderstorm records and significant weather summaries and conducted a climatological study with this database. They used pseudo-proximity soundings model simulations to create this database. Ref. [14] analyzed the storms observed in the Marmara region between 2000 and 2010 using hourly data to understand the storm characteristics in the region. Ref. [15] analyzed the severe thunderstorms observed between 1979 and 2011 and investigated their relationship with El-Nino. Ref. [16] studied the impact of urbanization on storms in Atlanta, Georgia. Ref. [17] analyzed the climatology of storms using satellite lightning tracking sensor data. Ref. [18] investigated the relationship between El-Nino, Tropical Atlantic conditions, and storms in Brazil. Ref. [19] investigated the severe thunderstorm that occurred around Ankara Esenboğa Airport on 15 July 2013. Ref. [20] analyzed the thunderstorms observed at İstanbul Atatürk International Airport between 2008 and 2013 using surface observations and upper-level atmosphere observations. Ref. [21] studied the effects of a Mediterranean cyclone by the observation data of İstanbul Atatürk International Airport. Ref. [22] conducted a study of severe thunderstorms observed over Europe from 1979 to 2017. Ref. [23] conducted a study on Mediterranean thunderstorms using a large dataset created by using the ZEUS long-range lightning detection system, operated by the National Observatory of Athens covering the period 2005–2014. Ref. [24] conducted a climatological study on thunderstorm climatology in Australia using reanalyzed data for 1979–2016 by using two lightning datasets: GPATS (Greenville, SC, USA) which has coverage throughout Australia, as well as the World Wide Lightning Location Network (WWLLN, Seattle, WA, USA) which has global coverage. Ref. [25] investigated the different datasets (e.g., manual records, satellite and radar data) and different methodologies used in thunderstorm climatology. Ref. [26] conducted a detailed analysis of thunderstorms observed at airports in the Marmara region during the period 2001–2015 to understand the characteristics of the thunderstorms in the airports of the Marmara Region. Ref. [27] investigated thunderstorm climatology using 5 years of lightning tracking system data.
Atmospheric stability indices are widely used by researchers for thunderstorm analysis. Ref. [28] used 20 different stability indices including the convective available potential energy (CAPE), K index, vertical total, total totals index to determine the thunderstorms characteristics of Germany by using SYNOP and radiosonde observations. Ref. [29] conducted a study to understand the thunderstorm characteristics and best predictors for thunderstorm events by using 32 different stability indices. Ref. [30] used stability indices covering CAPE and shear to introduce a baseline climatology for supercell and tornado forecast in the United States. Ref. [31] investigated the stability indices and parameters for forecasting severe storms.
İstanbul is the largest city in Türkiye. It is also the economic, cultural and historic center of the country. The population of İstanbul is over 15 million. Istanbul International Airport (International Civil Aviation Organization (ICAO) code: LTFM) is currently one of the busiest airports in Europe and the seventh-busiest airport in the world. The terminal buildings have an indoor area of 1.3 million square meters and can serve a total of 200 million passengers per year. Flight operations at LTFM were launched on 29 October 2018.
The main contribution of this study is the comprehensive analysis of thunderstorm events using atmospheric stability indices and upper-level meteorological data at LTFM, one of the busiest airports in the world. Secondly, to provide actionable insights for improving the prediction of thunderstorm events at LTFM, enhancing aviation safety, and reducing operational disruptions due to weather conditions. This study addresses the dynamics of region-specific thunderstorm events, filling a significant gap in the literature and providing a valuable reference for airports with similar climatic conditions. The study provides significant contributions for more efficient flight operations and better risk management in aviation.
The innovative aspects of this study go beyond being the first research to analyze thunderstorm events in the LTFM and are based on several important results: The most important of the results is the determination of the most effective indices for the prediction of thunderstorm events in this region. Secondly, the study analyzes the main trigger mechanisms of thunderstorm events in detail. Thirdly, it presents an approach for the prediction of thunderstorm events specific to the region. It provides critical information to increase aviation safety and improve operational efficiency by addressing the unique climatic and geographical conditions of the LTFM. These innovative findings will contribute significantly to the field of meteorology and aviation, helping to develop practical tools for thunderstorm event prediction and risk management.

2. Data and Methodology
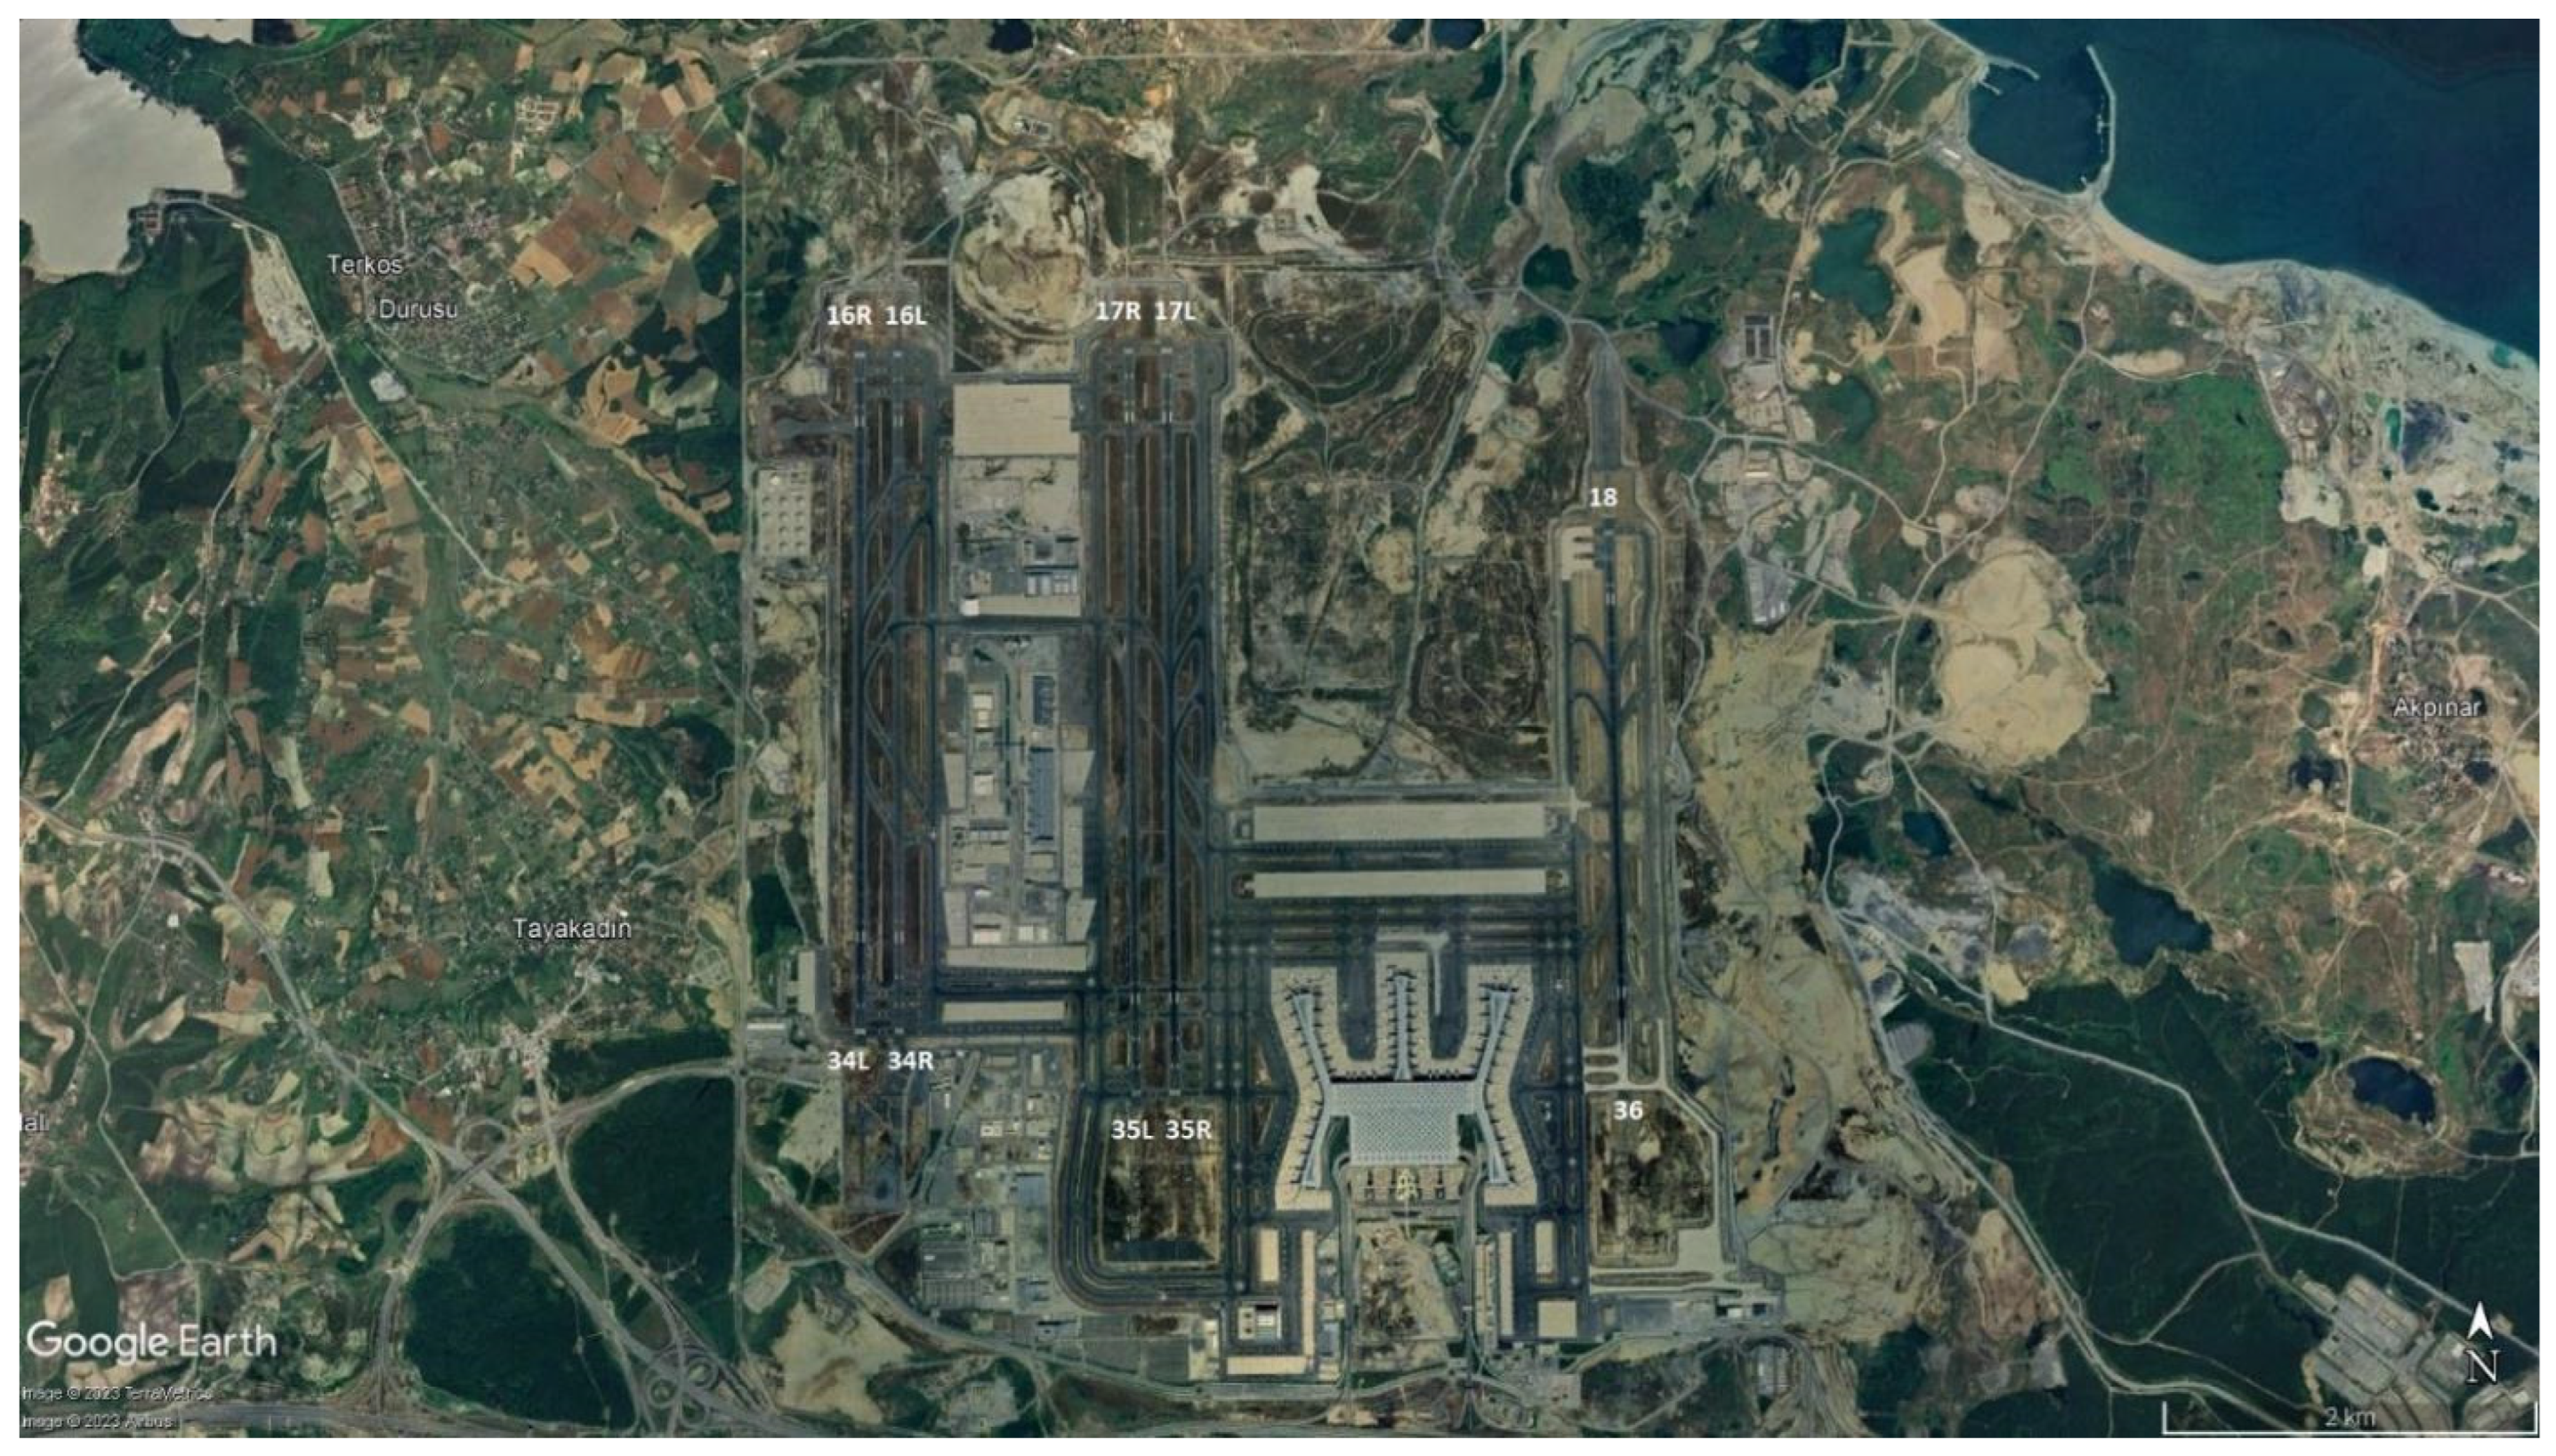
2.1. Study Area

The Marmara region is strategically located in northwestern Türkiye, connecting the Asian Continent and the European Continent with three suspension bridges and a tube passage built over the Bosphorus Strait. The region is characterized by its geographical diversity and climate transitions [32]. As the largest city in the region and the country, Istanbul plays a central role in economic, cultural, and demographic terms. The Bosphorus Strait constitutes an important waterway between the Black Sea and Marmara Sea. The climate of the region is mostly under the influence of the Mediterranean and Black Sea climates [33].
LTFM is situated on the Black Sea coast, approximately 30 km northwest of the city of İstanbul (Figure 1). Its coordinates are 41°16.52′ N/28°45.12′ E with an altitude of 99 m. LTFM is identified by the International Air Transport Association (IATA) indicator IST. The airport has five runways with directions 18-36, 17L-35R, 17R-35L, 16L-34R, and 16R-34L (Figure 2). The length of these runways range from 3060 m to 4500 m, with widths that range between 45 m and 60 m. Istanbul International Airport, which commenced operation on 29 October 2018, has rapidly become a critical hub in the global aviation sector. This feat can be attributed to its strategic geographical location, state-of-the-art infrastructure, and capacity to handle increasing passenger and cargo traffic. Located at a strategic point between Europe, Asia, and the Middle East, Istanbul International Airport serves as a bridge between continents, offering shorter flight routes for long-haul airlines and enhanced operational efficiency. The airport’s location helps airlines to optimize fuel consumption and reduce flight times, particularly on routes connecting Europe and Asia, resulting in significant cost savings and contributing to environmental sustainability. Designed to accommodate the rapidly growing global air traffic, Istanbul International Airport initially had a capacity of 90 million passengers. It is progressing toward becoming one of the world’s largest airports with planned expansions targeting an annual capacity of 200 million passengers. The airport features world-class infrastructure, including six independent runways, an advanced air traffic management system, and a terminal area of 1.4 million square meters which enables improved operational efficiency and a reduction in delays. Advanced technological infrastructure such as biometric security, AI-supported logistics, and automated baggage handling systems place Istanbul International Airport at the forefront of smart aviation. The role of Istanbul International Airport goes beyond passenger services. It also makes significant contributions to air cargo logistics, a crucial element of global supply chains. With an annual cargo handling capacity of 5.5 million tons, the airport supports international trade routes between Europe, Asia, and Africa. This enhances its importance in the logistics sector, particularly for transporting e-commerce goods and perishable products [34,35,36,37].
The İstanbul Meteorological Regional Directorate Station, which provides radiosonde data, is located in the Kartal District on the Anatolian side of İstanbul. The station’s coordinates are 40°54.42′ N/29°09.24′ E, and its altitude is 17 m.

2.2. Data

The study data were obtained in raw form from the archives of the Turkish State Meteorological Service (TSMS). To identify the days and hours of thunderstorms at the LTFM, data were obtained from the aviation routine weather report (METAR) and the aviation special weather report (SPECI) observations made at this station, as well as the station’s event records. METAR observations are made at this station every half hour for 24 h. SPECI observations are made based on specific criteria, regardless of the time of day. The data started from 29 October 2018, which was when the LTFM began operations, and ended on 1 January 2023. While selecting the records, thunderstorm records with only thunder were evaluated. A thunderstorm day is defined as “the day with a TS (thunderstorm or its combinations like TSRA (moderate thunderstorm with rain), +TSSN (heavy thunderstorm with snow)) event observed in METAR at least once”. This approach evaluated all thunderstorm events that occurred at the station and in its immediate vicinity.
The analyzed data from the upper atmosphere were compiled from radiosonde observations conducted by the İstanbul Meteorological Regional Directorate and the data obtained from the archives of the Turkish State Meteorological Service. Radiosonde observations were conducted twice daily at 00:00 UTC and 12:00 UTC. To select the dates and times of the received data, a new dataset was created based on the available records from LTFM. A total of 143 radiosonde observations were added to the dataset from the beginning to the end of the thunderstorm records. The observations included basic atmospheric parameters at three standard atmospheric levels: 850 hPa, 700 hPa, and 500 hPa. The geopotential height (m), temperature (°C), dewpoint temperature (°C), relative humidity (%), mixing ratio (g kg−1), wind direction (°), and wind speed (knots) for these levels are used in this study.

2.3. Methodology

The atmospheric stability indices selected for the study are as follows: Showalter index (SI) [38], lifted index (LI) [39], SWEAT index [40], K index [41], vertical totals index [40], cross totals index [40], total totals index [40], convective available potential energy (CAPE) index [41]. These indices are widely used by researchers to calculate atmospheric instability [9,42,43]. To calculate the SI, a parcel is lifted dry adiabatically from 850 hPa to its Lifting Condensation Level (LCL), then moist adiabatically to 500 hPa. The temperature of a parcel lifted from 850 to 500 hPa depends strongly on the 850 hPa dewpoint depression. The parcel’s temperature is then compared to the environmental temperature at 500 hPa [40]. The lifted index (LI) is defined by lifting the parcel adiabatically from the midpoint of the surface layer to 500 hPa. At 500 hPa, the temperature of the parcel (Tp), which is considered the updraft temperature within a developing cloud, is compared to the temperature of the environment. The Showalter index calculates the potential instability of the 850 to 500 hPa layer by measuring the buoyancy of an air parcel lifted to that level at 500 hPa. The K index is used to forecast the potential for thunderstorms by combining the temperature difference between 850 and 500 hPa, the dewpoint at 850 hPa, and the dewpoint depression at 700 hPa. This index increases with decreasing static stability between 850 and 500 hPa, increasing moisture at 850 hPa, and increasing relative humidity at 700 hPa. High values are an indication of instability of the atmosphere [39]. The vertical totals (VT), cross totals (CT), and total totals (TT) indices were developed to define a preliminary area for identifying potential severe weather development. These indices are calculated based on the temperature difference between 850 and 500 hPa (VT), the difference between the 850 hPa dewpoint and 500 hPa temperature (CT), and the arithmetic combination of VT and CT (TT) [43,44]. The CAPE is the amount of buoyant energy available to accelerate a parcel vertically. It is calculated as the positive area on a sounding between the parcel’s assumed ascent along a moist adiabat and the environmental temperature curve from the level of free convection (LFC) to the equilibrium level (EL). Strong convection requires a greater CAPE and updraft acceleration as the temperature difference between the warmer parcel and cooler environment increases. It describes the instability of the atmosphere and provides an approximation of updraft strength within a thunderstorm. A higher value of CAPE means the atmosphere is more unstable and would therefore produce a stronger updraft.
The formulae used in the calculation of these index values are given in Table 1.
For thunderstorms to occur, (a) the atmosphere must be unstable, (b) the atmosphere must have enough water vapor, (c) they must be triggered by lifting mechanisms, and (d) they must have vertical wind shear [45]. For lifting mechanisms, mechanisms such as convection, orographic lift, convergence, and frontal lift are needed. The effect of these mechanisms varies according to the geographical region. In this study, meteorological effects that are effective in thunderstorm formation were investigated. Among these mechanisms are the cold front (“Cold Front: A zone separating two air masses, of which the cooler, denser mass is advancing and replacing the warmer”) [44]; trough (“Trough: An elongated area of relatively low atmospheric pressure, usually not associated with a closed circulation, and thus used to distinguish from a closed low. The opposite of ridge“) [45]; and Col weather (”Col weather is normally settled, but is dependent on changing pressure. In autumn and winter, cols produce poor visibility and fog, whilst in summer thunderstorms are common”) [45], with particular emphasis on the effects of meteorological systems such as Sea Effect Snow (SES). To investigate the conditions under which thunderstorms events occur, we used ground synoptic maps prepared by the Deutscher Wetterdienst (DWD Analysis Archive) and the Metoffice (UKMET Analysis Archive) provided by the [46] webpage.
All thunderstorm events, upper atmosphere parameters, and calculated instability indices were also statistically analyzed. The distribution of thunderstorm events by months, seasons, and years is shown in the figures. Histograms of upper atmosphere parameters and instability indices were prepared and their distributions were analyzed. Appropriate instability indices were also analyzed in terms of their consistency. If the calculated values of the stability indices for the days with thunderstorms are compatible with the index values, it is called a consistent day. Otherwise, it is described as an inconsistent day. All figures except locations maps are illustrated via the ggplot2 R package [47]. All calculations are performed via R programming [48,49].

3. Results

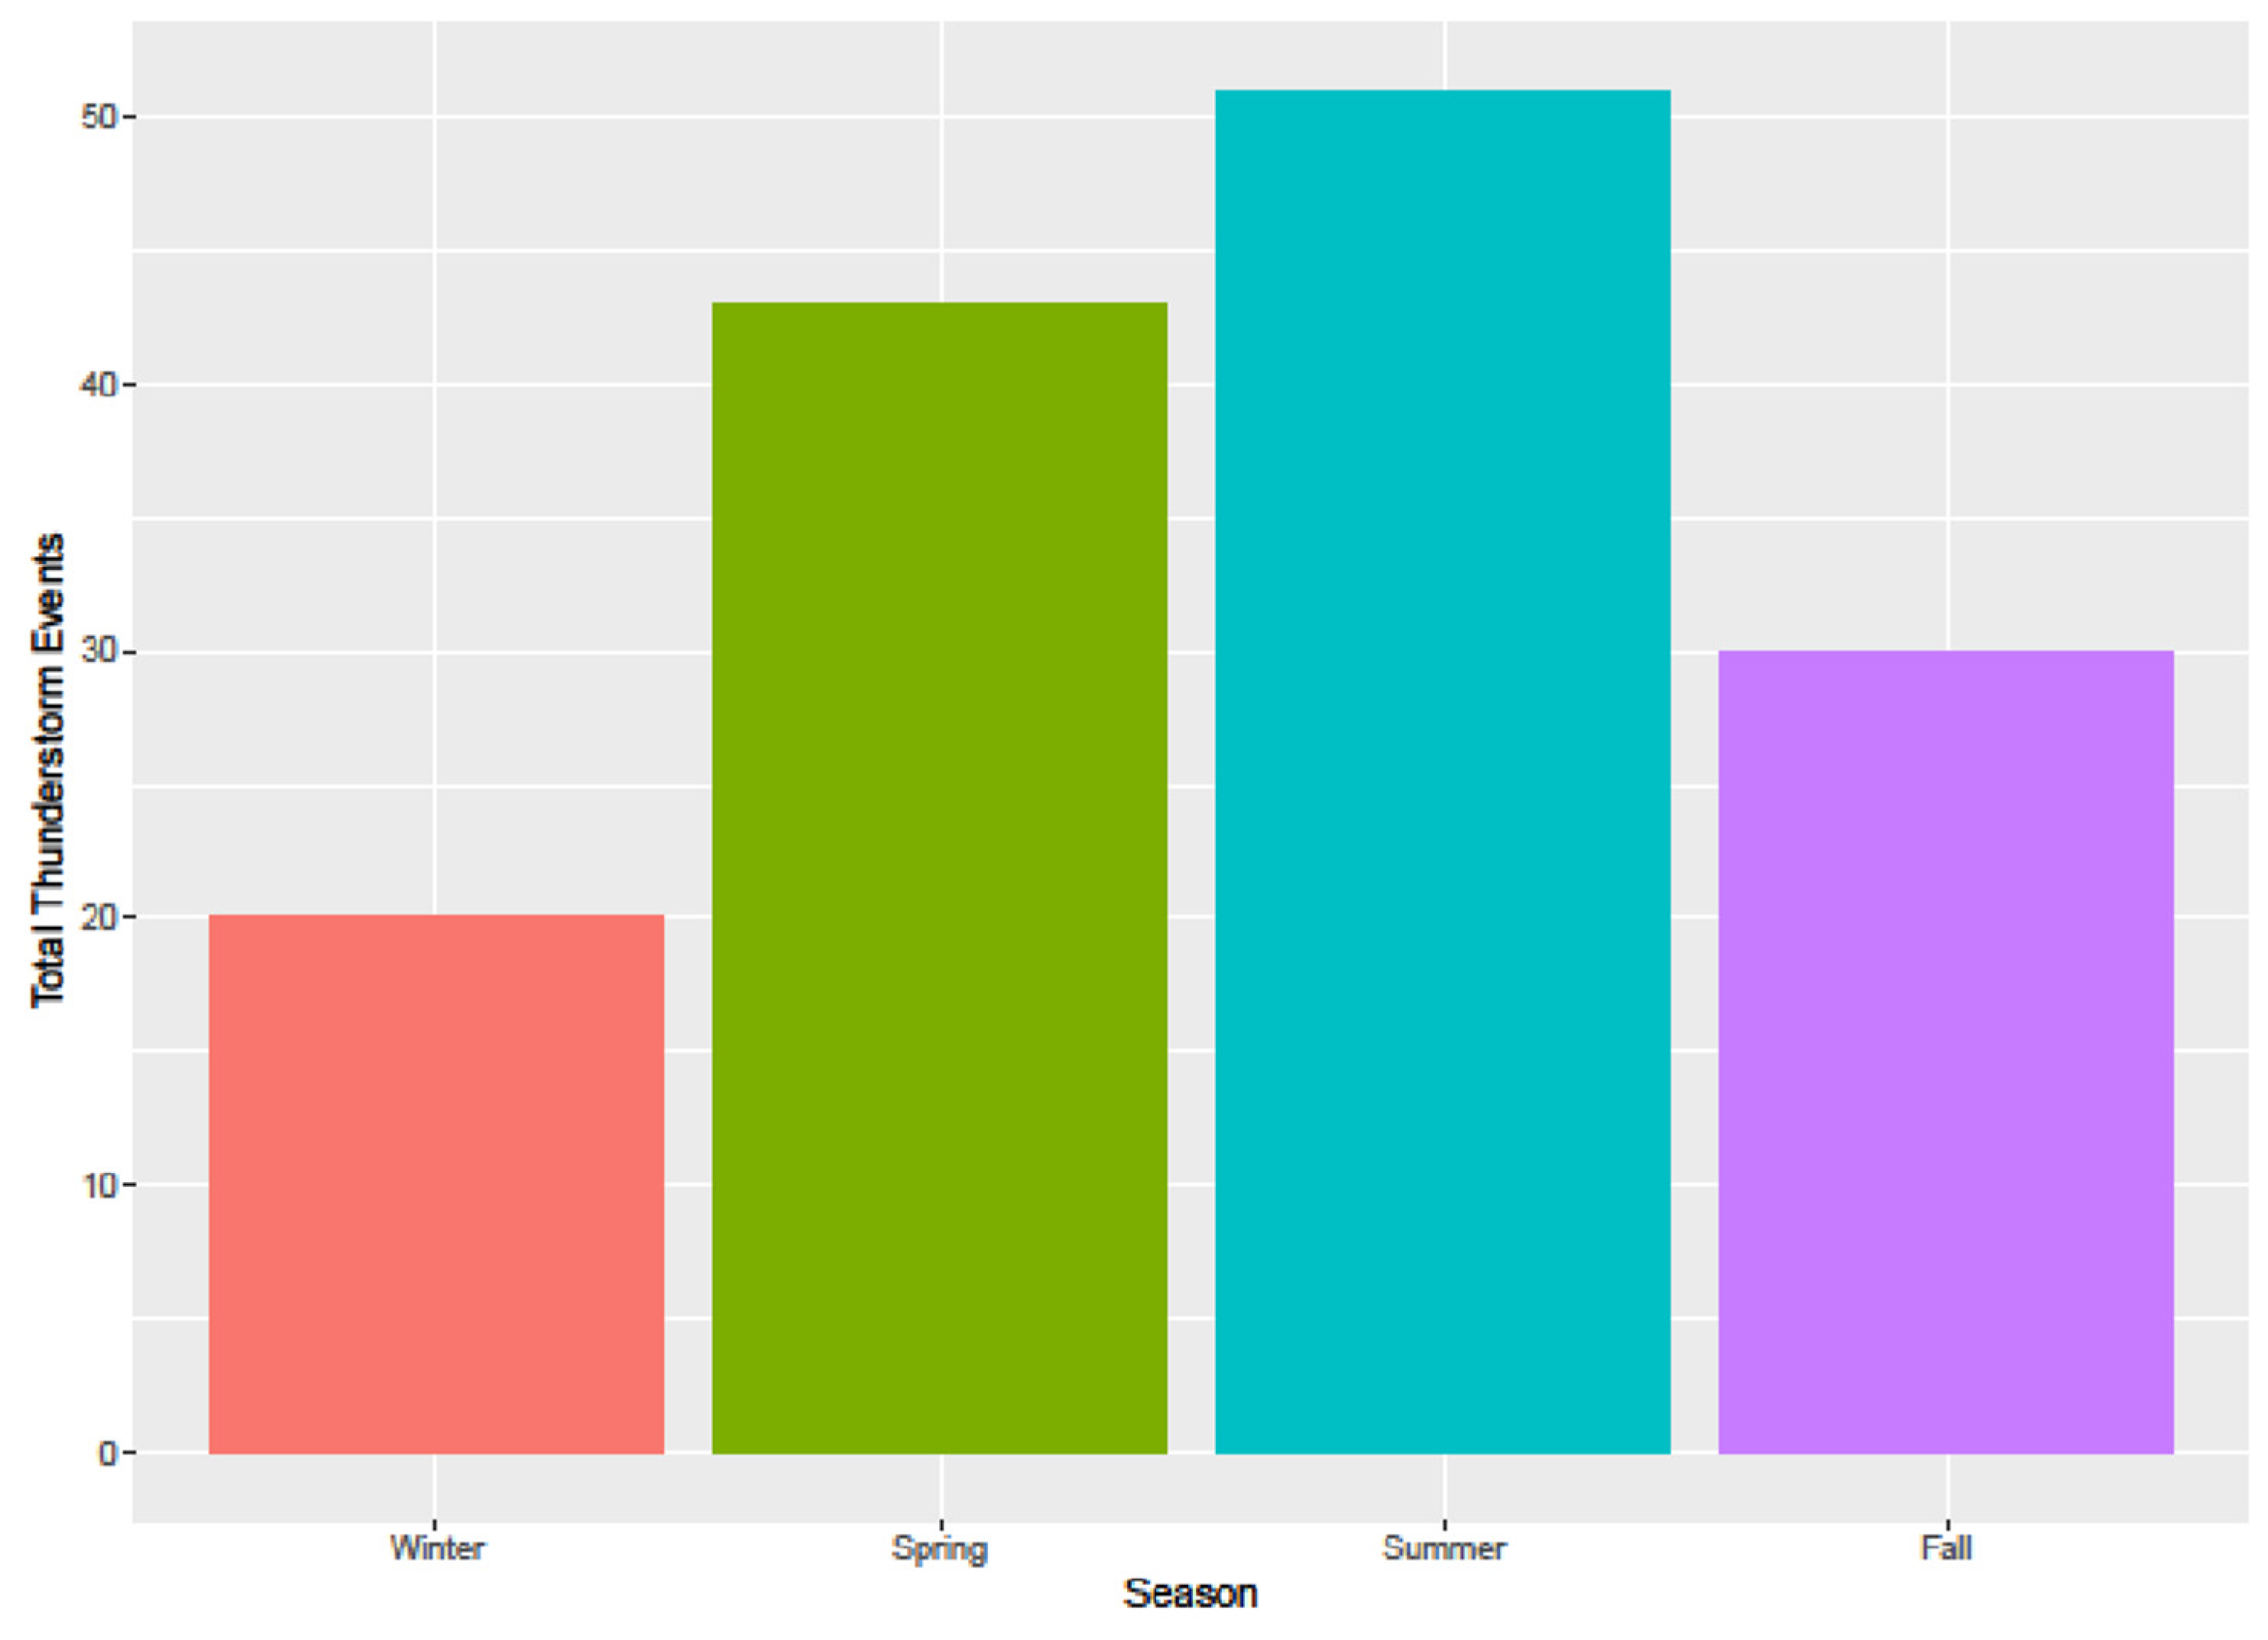
3.1. Thunderstorm Statistics

The annual number of thunderstorms is seen in Figure 3. The total number of thunderstorms peaked in 2022 with 45 events. In 2019, 2020, and 2021, there were 36, 29, and 34 thunderstorms, respectively.
Figure 4 shows the total number of thunderstorms that occurred seasonally over a period of 4 years. In the study, the seasons were assessed on the basis of months, with the following definitions: winter (December, January, and February), spring (March, April, and May), summer (June, July, and August), and autumn (September, October, and November). Thunderstorms are more frequent during the summer, with a total of 51 events, 12.7 thunderstorms per season. In spring, a total of 43 thunderstorms were observed, corresponding to 11 thunderstorms per season. Autumn is the third season with the highest number of thunderstorms, with 30 observed, corresponding to 7.5 thunderstorms per autumn season. Winter has fewer thunderstorms, with a total of 20 thunderstorms and an average of 5 per season.
Figure 5 displays the distribution of thunderstorm days by month. June has the highest number of thunderstorm events with a total of 32, averaging 8 events per month. May and March follow with 19 (averaging 5) and 15 (averaging 4) thunderstorm events, respectively. Upon analysis of the monthly thunderstorm numbers, it becomes evident that June plays a significant role in the summer season. It is observed that the highest number of thunderstorms occurs in spring and in June. Thunderstorms are less frequent between November and February, with only 6 to 8 occurrences per month, equivalent to 1.5–2 events per month.
Monthly thunderstorm numbers can be seen in Table 2.

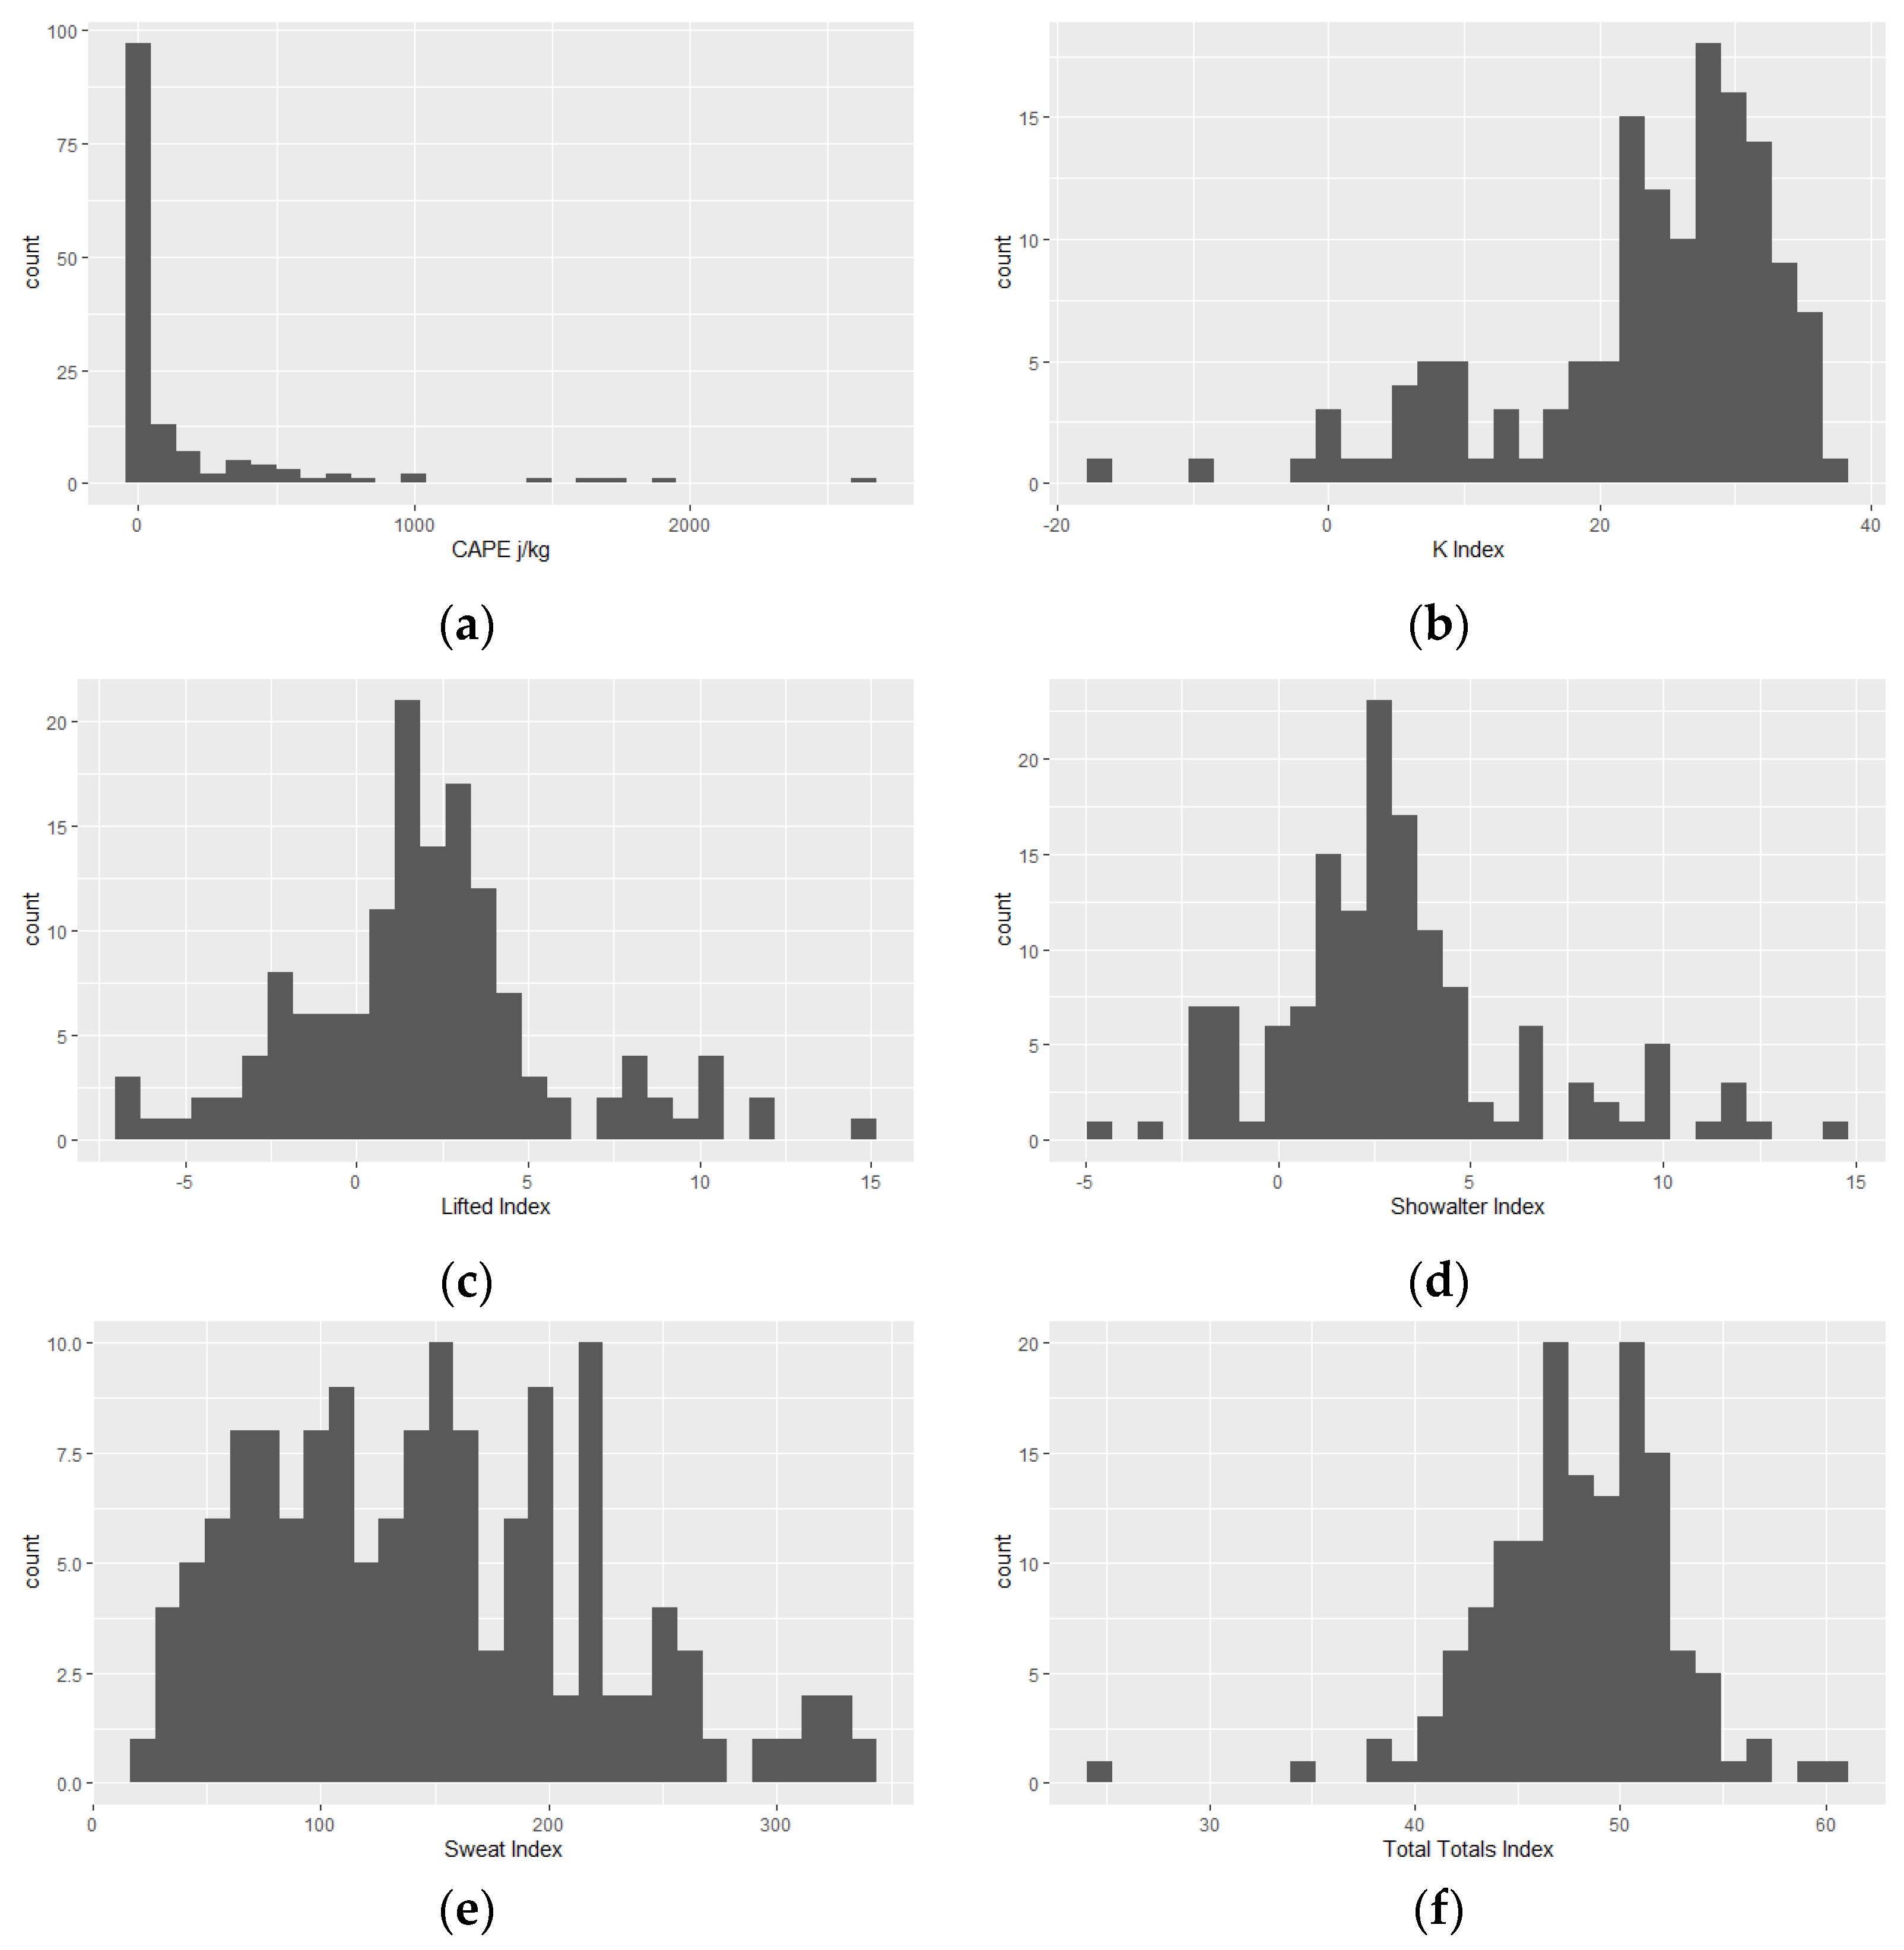
3.2. Upper Atmosphere Variables

The histogram of 850 hPa geopotential height indicates that the distribution is mainly between 1420 m and 1500 m (Figure 6a). Similarly, the histogram of the 850 hPa temperature shows a concentration between +2 °C and +15 °C, with a smaller group concentrated between −5 °C and −13 °C (Figure 6b).
The 700 hPa geopotential height histogram shows a wide range of values, with the highest concentration between 3050 m and 3080 m (Figure 6c). The 700 hPa temperatures range from −2 °C to −7 °C and from 0 °C to 7 °C (Figure 6d).
The 500 hPa histograms show that the geopotential height values range from 5500 m to 5800 m (Figure 6e). Temperature values are concentrated between −10 °C and −25 °C (Figure 6f).

3.3. Thunder Storm Stability Indices

Out of 142 thunderstorm events, the CAPE values were less than 100 J/kg in 105 of them, indicating that about 74% of thunderstorms occur with a very low CAPE (Figure 7a). The graph suggests that higher CAPE values are not necessary for thunderstorms in this region. On the other hand, the K index plot (Figure 7b) shows a different distribution than the CAPE values. On the other hand, 25% of the values fall between 30 and 40, 75% are below 30, and there are no values above 40.
Figure 7c shows a concentration between 0 and 5 in the lifted index histogram plot. There are 37 negative values, 25 values between 0 and −3, 8 values between −3 and −6, and 4 values between −6 and −9. These values indicate that 74% of the lifted index values suggest a stable atmosphere or weak convection. Similarly, the Showalter index histogram plot indicates that most values are between 0 and 5, with only 21 negative values indicating convection (Figure 7d).
The SWEAT index values indicate a moderately unstable atmosphere in only 15% of cases (Figure 7e). The majority of values are below 300, with only six values above 300 and none above 400, indicating severe thunderstorm potential in only 4% of cases. The total totals index shows a more pronounced result than the other indices, with a large proportion of values centered close to 50 (Figure 7f). Approximately 79% of the values are above 45, indicating a high likelihood of thunderstorms. A total of 46 values fall between 50 and 55, suggesting that the thunderstorms are likely to be severe. Finally, five values fall between 55 and 60, indicating that severe thunderstorms are highly probable.
Total totals index and K index satisfies the thunderstorm conditions of about 75% of all thunderstorm events, while CAPE does not satisfy the conditions of 74% of all the thunderstorm events as seen in Figure 7. As the other indices did not give appropriate results, the total totals and K indices values were analyzed in detail.

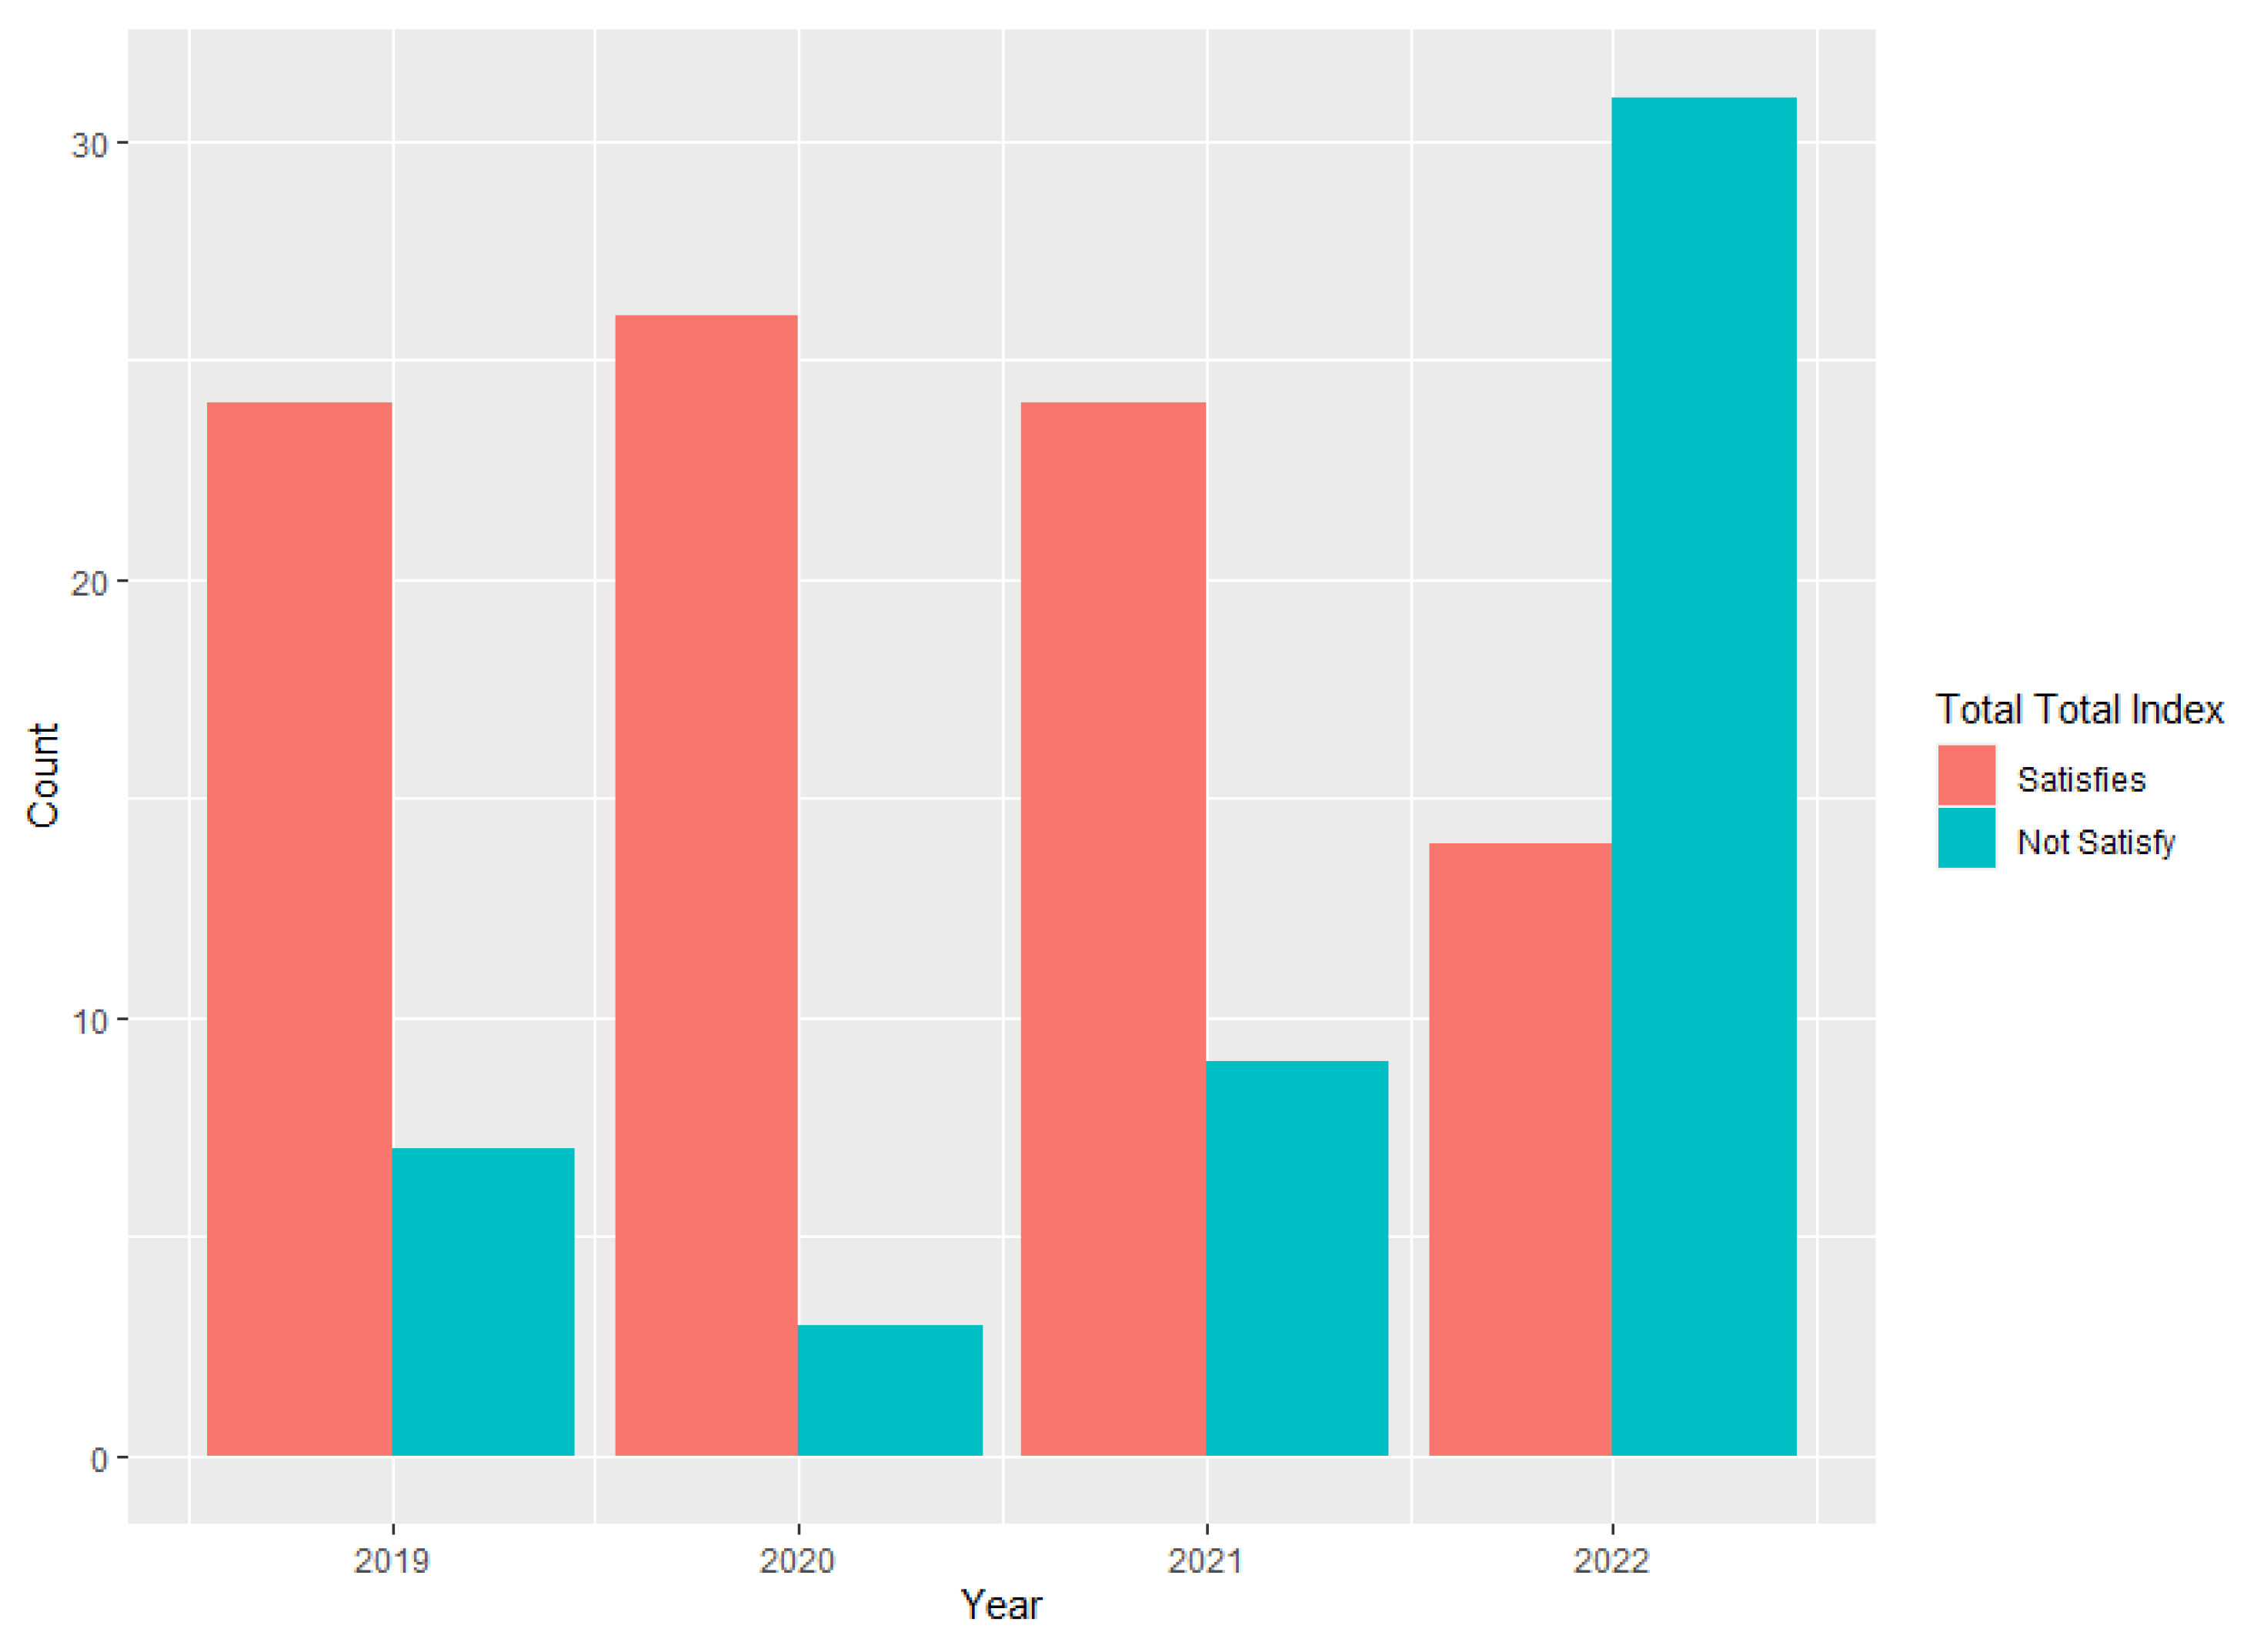
3.3.1. Total Totals Index

The instability index values calculated in thunderstorm events were analyzed and the performances of the atmospheric stability indices were evaluated.
The total totals index values were consistent in 24 cases in 2019, 26 cases in 2020, 24 cases in 2021, and 14 cases in 2022. Inconsistent values were observed in 7 cases in 2019, 3 cases in 2020, 9 cases in 2021, and 31 cases in 2022. Inconsistent values were observed in 7 cases in 2019, 3 cases in 2020, 9 cases in 2021, and 31 cases in 2022 (Figure 8).

3.3.2. K Index

Upon analysis of the K index values, it is evident that they were consistent in nine events in 2019, six events in 2020, and six events in 2021. However, there was no consistency in the events of 2022. The number of events where K index values were inconsistent was 22 in 2019, 23 in 2020, 27 in 2021, and 45 in 2022 (Figure 9).

3.4. Stability Indices for Non-TS Situations

3.4.1. Total Totals Index

Looking at the values of the total totals index on days without thunderstorms, we see that in 2019 they were consistent in 400 events and inconsistent in 239 events. In 2020, they were consistent in 507 events and inconsistent in 190 events; in 2021, they were consistent in 443 events and inconsistent in 222 events; and finally in 2022, they were consistent in 598 events and inconsistent in 72 events (Figure 10).

3.4.2. K Index

Looking at the K index values for non-storm events, it can be seen that they were consistent for 613 events for 2019, 676 events for 2020, 634 events for 2021, and 669 events for 2022, whereas they were not consistent for 26 events for 2019, 21 events for 2020, 28 events for 2021, and 1 event for 2022 (Figure 11).

3.5. Effective Stability Indices During Extreme Cases

We choose three extreme cases to understand the behavior of the total totals and K indices.
Case 1: June 2022 (Period of Most Intense Thunderstorm Events)
-
The total totals index (TT) showed a significant increase and exceeded 55, indicating a high probability of severe thunderstorm events. This coincides with the peak of storm activity in June with 32 events.
-
The K index also showed an increasing trend and exceeded 35 on the days of the most severe thunderstorm events.
Case 2: August 2021 (Period of Sea-Effect Thunderstorm Event)
-
The total totals index (TT) remained stable above 50 throughout the thunderstorm event, reflecting how the sea influence affected this situation.
-
The K index gradually increased and reached 38 on the day of the strongest storm.
Case 3: March 2020 (Early Spring Thunderstorm Event Period)
-
Total totals index (TT) showed a sharp increase above 50, coinciding with a sudden increase in thunderstorm event activity.
-
K index also showed a notable increase, exceeding 30 on the days when thunderstorm events occurred.

4. Discussion

In this study, a total of 144 thunderstorm events were analyzed in the period between 29 October 2018 and 31 December 2022, the start of operations at Istanbul Airport. Of the 144 thunderstorm events, 34.72% occurred at trough transition, 30.56% at cold front transition, 11.81% at cold weather, 6.94% at trough transition after cold front, 6.94% at sea effect snow, 4.86% due to low pressure and warming, and 4.17% were unidentified. A total of 72.22% occurred during trough and cold front transitions. In total, 90% of the events related to sea-effect snowfall occurred in 2022, which contributed to the high number of thunderstorm events.
Ref. [20] analyzed a total of 127 thunderstorm events in 5 years at Atatürk Airport, Istanbul. During this period, the highest number of thunderstorm events occurred in the autumn season with 43 thunderstorm events. In our study, the highest number of events occurred in the summer (51) and spring (43) seasons. A lower number of thunderstorm events occurred in the autumn season (30). The result is significantly different when the period of occurrence is considered. In the same study, the instability indices CAPE and CIN were evaluated. CAPE values were below 1000, which is a limit value for moderate instability in 117 events. And, the average CAPE was found to be 199.34. It is similar to the results of our study. Out of 142 thunderstorm events, the CAPE values were less than 100 J/kg in 105 of them, indicating that about 74% of thunderstorms occur with a very low CAPE.
Ref. [22] analyzed the thunderstorm days in Europe between 1979 and 2017. Their results are similar to our results: annual peak thunderstorm activity is in July and August. They used multiple datasets beyond surface observations. Ref. [50] studied the tornado environments and the spatial distribution of severe thunderstorms by using global reanalysis data. They found that southern Europe has the greatest frequency of favorable conditions for significantly severe thunderstorms.
Ref. [26] analyzed the thunderstorm events that occurred at 11 airports in the Marmara region during the period spanning between 2001 and 2015. In this study, summer was identified as the season with the highest number of thunderstorms, followed by autumn. This situation is partly similar to our study. Summer is the season with the highest number of days with thunderstorms, while spring is the second busiest season in the Istanbul Airport study. Also, in [26], the CAPE value was found to be around zero in more than half of the events. This situation is very similar to our study.
We found that the K index and total totals index are the stability indices that can be used for thunderstorm days as in [34]. They conducted the study to evaluate the stability indices for thunderstorm forecasting in Belgrade and Serbia. And they concluded that the best rank sum score had the lifted, K, Showalter, and total totals indices.
The differences between our study and similar regional studies can be explained by the different periods of the studies. However, the fact that the values of CAPE give inconsistent results as a common point in all studies, is an indication that the values of CAPE are not a useful parameter for thunderstorm prediction in this region. Strong vertical wind shear can promote the formation of thunderstorm events even in low CAPE environments. By maintaining updrafts, wind shear can allow thunderstorm events to develop and last for a long time despite their low energy [51]. Ref. [52] used the European Severe Weather Database (ESWD) for the years of 2009–2015 regarding central and western European countries and also stated that high vertical shear (0–3 km) and marginal CAPE conditions are common in the study area of western and central Europe.

5. Conclusions

This study analyzes the thunderstorm events in the LTFM using a multi-year dataset from 2019 to 2022, and evaluates the performance of various stability indices by investigating the reliability of stability indices. The findings will contribute to improving aviation safety and operational efficiency by providing valuable insights in thunderstorm event prediction and risk management.
The innovative aspects of this study go beyond being the first research to analyze thunderstorm events in the LTFM, and are based on several important results:
Firstly, it identifies the K index and total totals index as the most effective indices in predicting thunderstorm events in this region, questioning the traditional reliance on CAPE. The findings show that 74% of thunderstorm events occur with very low CAPE values (less than 100 J/kg), suggesting that CAPE has limited application in this region.
Secondly, it analyzes the trigger mechanism of thunderstorm events in detail. The study shows that 72.22% of the storms occur during troughs and cold fronts and the most active period is the summer season.
Thirdly, it provides an approach for the prediction of thunderstorm events specific to the region. By addressing the unique climatic and geographical conditions of the LTFM, it provides critical information to increase aviation safety and improve operational efficiency.
These innovative findings will contribute significantly to the field of meteorology and aviation, helping to develop practical tools for the prediction and risk management of thunderstorm events.

Author Contributions

Conceptualization, O.K. and B.E.; methodology, O.K., B.E., E.T.Ö. and Z.A.; software, O.K. and B.E.; validation, B.E., E.T.Ö. and Z.A.; formal analysis, O.K. and B.E.; investigation, E.T.Ö. and Z.A.; resources, O.K., B.E., E.T.Ö. and Z.A.; data curation, O.K. and B.E.; writing—original draft preparation, O.K., B.E., E.T.Ö. and Z.A.; writing—review and editing, O.K., B.E., E.T.Ö. and Z.A.; visualization, O.K. and B.E.; supervision, B.E., E.T.Ö. and Z.A.; project administration, Z.A.; funding acquisition, Z.A. All authors have read and agreed to the published version of the manuscript.

Funding

This research was funded by NATO SPS Multi-Year Project named Cube4EnvSec: “Big Earth Datacube Analytics for Transnational Security and Environment Protection” grant number G5970. And The APC was partly funded by this project.

Institutional Review Board Statement

Not applicable.

Informed Consent Statement

Not applicable.

Data Availability Statement

Dataset available on request from the authors.

Acknowledgments

The authors thank the Turkish State Meteorological Service for the data used in this study. Some analyses in this study are part of the Master of Science Thesis of Oğuzhan Kolay. The authors also thank the editor and anonymous referees for their helpful comments that improved the quality of the manuscript.

Conflicts of Interest

The authors declare no conflict of interest.

References

  1. National Weather Service. Thunderstorm Hazards. National Weather Service, 2019. Available online: https://www.weather.gov/jetstream/thunderstorms (accessed on 1 June 2023).
  2. Ahrens, C.D. Meteorology Today: An Introduction to Weather, Climate, and the Environment; Cengage Learning: Boston, MA, USA, 2019. [Google Scholar]
  3. NOAA. Supercells and Severe Storms. National Weather Service, 2020. Available online: https://www.weather.gov/jetstream/supercells (accessed on 1 June 2023).
  4. National Transportation Safety Board (NTSB). Weather-Related Aviation Accidents. NTSB, 2019. Available online: https://www.ntsb.gov (accessed on 1 June 2023).
  5. International Civil Aviation Organization. Thunderstorms and Lightning Safety. ICAO, 2020. Available online: https://www.icao.int (accessed on 1 June 2023).
  6. National Weather Service. Aviation and Weather Hazards. National Weather Service, 2021. Available online: https://www.weather.gov (accessed on 1 June 2023).
  7. Long, T. Analysis of Weather-Related Accident and Incident Data Associated with Section 14 CFR Part 91 Operations. Coll. Aviat. Rev. Int. 2022, 40. Available online: https://ojs.library.okstate.edu/osu/index.php/CARI/article/view/8442 (accessed on 1 June 2023). [CrossRef]
  8. Doswell, C.A.; Brooks, H.E.; Kay, M.P. Climatological Estimates of Daily Local Nontornadic Severe Thunderstorm Probability for the United States. Weather. Forecast. 2005, 20, 577–595. [Google Scholar] [CrossRef]
  9. Tyagi, A. Thunderstorm climatology over Indian region. Mausam 2007, 58, 189–212. [Google Scholar] [CrossRef]
  10. Mohee, F.; Miller, C. Climatology of Thunderstorms for North Dakota, 2002–2006. J. Appl. Meteorol. Clim. 2010, 49, 1881–1890. [Google Scholar] [CrossRef]
  11. Brimelow, J.C.; Reuter, G.W.; Bellon, A.; Hudak, D. A radar-based methodology for preparing a severe thunderstorm climatology in central Alberta. Atmos. Ocean. 2004, 42, 13–22. [Google Scholar] [CrossRef]
  12. Singh, C.; Mohapatra, M.; Bandyopadhyay, B.; Tyagi, A. Thunderstorm climatology over northeast and adjoining east India. Mausam 2011, 62, 163–170. [Google Scholar] [CrossRef]
  13. Allen, J.; Karoly, D.; Mills, G. A severe thunderstorm climatology for Australia and associated thunderstorm environments. Aust. Meteorol. Oceanogr. J. 2011, 61, 143–158. [Google Scholar] [CrossRef]
  14. Deniz, A.; Özdemir, E.T.; Sezen, I.; Coşkun, M. Investigations of storms in the region of Marmara in Turkey. Theor. Appl. Clim. 2013, 112, 61–71. [Google Scholar] [CrossRef]
  15. Allen, J.T.; Karoly, D.J. A climatology of Australian severe thunderstorm environments 1979-2011: Inter-annual variability and ENSO influence. Int. J. Clim. 2013, 34, 81–97. [Google Scholar] [CrossRef]
  16. Haberlie, A.M.; Ashley, W.S.; Pingel, T.J. The effect of urbanisation on the climatology of thunderstorm initiation. Q. J. R. Meteorol. Soc. 2015, 141, 663–675. [Google Scholar] [CrossRef]
  17. Cecil, D.J.; Buechler, D.E.; Blakeslee, R.J. TRMM-LIS Climatology of Thunderstorm Occurrence and Conditional Lightning Flash Rates. J. Clim. 2015, 28, 6536–6547. [Google Scholar] [CrossRef]
  18. Pinto, O. Thunderstorm climatology of Brazil: ENSO and Tropical Atlantic connections. Int. J. Climatol. 2014, 35, 871–878. [Google Scholar] [CrossRef]
  19. Özdemir, E.T.; Deniz, A. Severe thunderstorm over Esenboğa International Airport in Turkey on 15 July 2013. Weather 2016, 71, 157–161. [Google Scholar] [CrossRef]
  20. Ozdemir, E.T.; Deniz, A.; Sezen, I.; Aslan, Z.; Yavuz, V. Investigation of Thunderstorms over Ataturk International Airport (LTBA), Istanbul. Mausam 2017, 68, 175–180. [Google Scholar] [CrossRef]
  21. Sirdas, S.A.; Özdemir, E.T.; Sezen, I.; Efe, B.; Kumar, V. Devastating extreme Mediterranean cyclone’s impacts in Turkey. Nat. Hazards 2017, 87, 255–286. [Google Scholar] [CrossRef]
  22. Taszarek, M.; Allen, J.; Púčik, T.; Groenemeijer, P.; Czernecki, B.; Kolendowicz, L.; Lagouvardos, K.; Kotroni, V.; Schulz, W. A Climatology of Thunderstorms across Europe from a Synthesis of Multiple Data Sources. J. Clim. 2019, 32, 1813–1837. [Google Scholar] [CrossRef]
  23. Galanaki, E.; Lagouvardos, K.; Kotroni, V.; Flaounas, E.; Argiriou, A. Thunderstorm climatology in the Mediterranean using cloud-to-ground lightning observations. Atmos. Res. 2018, 207, 136–144. [Google Scholar] [CrossRef]
  24. Dowdy, A.J. Climatology of thunderstorms, convective rainfall and dry lightning environments in Australia. Clim. Dyn. 2020, 54, 3041–3052. [Google Scholar] [CrossRef]
  25. Hayward, L.; Whitworth, M.; Pepin, N.; Dorling, S. A comprehensive review of datasets and methodologies employed to produce thunderstorm climatologies. Nat. Hazards Earth Syst. Sci. 2020, 20, 2463–2482. [Google Scholar] [CrossRef]
  26. Yavuz, V.; Deniz, A.; Özdemir, E.T.; Karan, H.; Temiz, C. Long-term thunderstorm analysis at airports in the Marmara Region: Types and favourable atmospheric conditions. Int. J. Glob. Warm. 2022, 28, 81–95. [Google Scholar] [CrossRef]
  27. DiGangi, E.A.; Stock, M.; Lapierre, J. Thunder Hours: How Old Methods Offer New Insights into Thunderstorm Climatology. Bull. Amer. Meteor. Soc. 2022, 103, E548–E569. [Google Scholar] [CrossRef]
  28. Kunz, M. The skill of convective parameters and indices to predict isolated and severe thunderstorms. Nat. Hazards Earth Syst. Sci. 2007, 7, 327–342. [Google Scholar] [CrossRef]
  29. Haklander, A.J.; Van Delden, A. Thunderstorm predictors and their forecast skill for the Netherlands. Atmos. Res. 2003, 67, 273–299. [Google Scholar] [CrossRef]
  30. Rasmussen, E.N.; Blanchard, D.O. A Baseline Climatology of Sounding-Derived Supercell and Tornado Forecast Parameters. Wea. Forecast. 1998, 13, 1148–1164. [Google Scholar] [CrossRef]
  31. Doswell, C.A.; Schultz, D.M. On the use of indices and parameters in forecasting severe storms. Electron. J. Sev. Storms Meteor. 2006, 1, 1–22. [Google Scholar] [CrossRef]
  32. İBB (İstanbul Büyükşehir Belediyesi). 2024. Available online: https://ibb.istanbul/ (accessed on 14 December 2024).
  33. Tayanc, M. An assessment of spatial and temporal variation of sulfur dioxide levels over Istanbul, Turkey. Environ. Pollut. 2000, 107, 61–69. [Google Scholar] [CrossRef]
  34. DHMİ (Devlet Hava Meydanları İşletmesi). 2024. Available online: https://www.dhmi.gov.tr/sayfalar/havalimani/istanbul/GenelBilgiler.aspx (accessed on 12 December 2024).
  35. Istanbul Airport. 2024. Available online: https://www.istairport.com/kurumsal/hakkimizda/ (accessed on 12 December 2024).
  36. IST (Istanbul International Airport). 2024. Available online: https://istanbul-international-airport.com/ (accessed on 12 December 2024).
  37. SHGM (Sivil Havacılık Genel Müdürlüğü). 2024. Available online: https://web.shgm.gov.tr/ (accessed on 12 December 2024).
  38. Vujović, D.; Paskota, M.; Todorović, N.; Vučković, V. Evaluation of the stability indices for the thunderstorm forecasting in the region of Belgrade, Serbia. Atmos. Res. 2015, 161–162, 143–152. [Google Scholar] [CrossRef]
  39. Viceto, C.; Marta-Almeida, M.; Rocha, A. Future climate change of stability indices for the Iberian Peninsula. Int. J. Climatol. 2017, 37, 4390–4408. [Google Scholar] [CrossRef]
  40. Showalter, A.K. A stability index for forecasting thunderstorms. Bull. Am. Meteorol. Soc. 1953, 34, 250–252. [Google Scholar] [CrossRef]
  41. Peppler, R.A.; Lamb, P.J. Tropospheric static stability and central North American growing season rainfall. Mon. Weather. Rev. 1989, 117, 1156–1180. [Google Scholar] [CrossRef]
  42. Miler, R.C. Notes on Analysis and Severe Storm Forecasting Procedures of the Air Force Global Weather Central; Air Weather Service: Asheville, NC, USA, 1972.
  43. Ackerman, S.A.; Knox, J. Meteorology: Understanding the Atmosphere; Jones & Bartlett Publishers: Burlington, MA, USA, 2011; pp. 339–379. [Google Scholar]
  44. NSW Glossary (National Weather Service Glossary). National Weather Service Glossary. 2024. Available online: https://forecast.weather.gov/glossary.php? (accessed on 15 December 2024).
  45. ATPL Ground Training Series. Meteorology; CAE Oxford Aviation Academy (UK) Limited: Kidlington, UK, 2014; p. 46. [Google Scholar]
  46. Wetter3. 2024. Available online: https://www.wetter3.de/ (accessed on 15 December 2024).
  47. Wickham, H. ggplot2: Elegant Graphics for Data Analysis; Springer: New York, NY, USA, 2016. [Google Scholar]
  48. R Core Team. R: A Language and Environment for Statistical Computing; R Foundation for Statistical Computing: Vienna, Austria, 2023; Available online: https://www.R-project.org/ (accessed on 20 November 2024).
  49. Wickham, H.; Francois, R.; Henry, L.; Muller, K.; Vaughan, D. dplyr: A Grammar of Data Manipulation. 2023. R package version 1.1.2. Available online: https://CRAN.R-project.org/package=dplyr (accessed on 20 November 2024).
  50. Brooks, H.E.; Lee, J.W.; Craven, J.P. The spatial distribution of severe thunderstorm and tornado environments from global reanalysis data. Atmos. Res. 2003, 67, 73–94. [Google Scholar] [CrossRef]
  51. Weisman, M.L.; Klemp, J.B. The dependence of numerically simulated convective storms on vertical wind shear and buoyancy. Mon. Weather. Rev. 1982, 110, 504–520. [Google Scholar] [CrossRef]
  52. Taszarek, M.; Brooks, H.E.; Czernecki, B. Sounding derived parameters associated with convective hazards in Europe. Mon. Weather. Rev. 2017, 145, 1511–1528. [Google Scholar] [CrossRef]
Figure 1. Istanbul International Airport and the location of Istanbul in the Marmara region (innermost red rectangle); location of the Marmara region in Türkiye (inner bigger rectangle).
Atmosphere 16 00470 g001
Figure 2. Positions of the runways at Istanbul Airport, 18-36, 17L-35R, 17R-35L, 16L-34R, and 16R-34L (from left to the right).
Atmosphere 16 00470 g002
Figure 3. Total number of thunderstorm events by years during study period.
Atmosphere 16 00470 g003
Figure 4. Total number of thunderstorm events by seasons during study period.
Atmosphere 16 00470 g004
Figure 5. Total number of thunderstorm events by months during study period.
Atmosphere 16 00470 g005
Figure 6. Histograms of the upper atmosphere parameters, (a) 850 mb height, (b) 850 mb temperature, (c) 700 mb height, (d) 700 mb temperature, (e) 500 mb height and (f) 500 mb temperature.
Atmosphere 16 00470 g006
Figure 7. Histogram of the atmospheric stability indices: (a) CAPE, (b) K index, (c) lifted index, (d) Showalter index, (e) SWEAT index, and (f) total totals index.
Atmosphere 16 00470 g007
Figure 8. Total totals index numbers for the days with TS conditions by year.
Atmosphere 16 00470 g008
Figure 9. K index number for the days with TS conditions by year.
Atmosphere 16 00470 g009
Figure 10. Total totals index numbers for the days with non-TS conditions by year.
Atmosphere 16 00470 g010
Figure 11. K index number for the days with non-TS conditions by year.
Atmosphere 16 00470 g011
Table 1. Calculation of atmospheric stability indices.
Index NameCalculationCritique Values
S I   ( S h o w a l t e r   I n d e x )   T 500 T p 500 0 to −3: Moderately unstable; −3 to −6: Very unstable; SI < −6: Extremely unstable
L I   ( L i f t e d   I n d e x ) T 500 T p 500 −3 to −6: Moderately unstable; −6 to −9: Very unstable; SI < −9: Extremely unstable
S W E A T   S e v e r e   W e a t h e r   T h r e a t   I n d e x     12   T d 850 + 20 ( T T 49 ) + 2 f 850 + f 500 + 125 ( s + 0.2 ) SWEAT over 300: Potential for severe thunderstorms; SWEAT over 400: Potential for tornadoes.
K   K   I n d e x   ( T 850 T 500 ) + T d 850 ( T 700 T d 850 ) K over 30: Better potential for thunderstorms with heavy rain. K = 40: Best potential for thunderstorms with very heavy rain.
V T   V e r t i c a l   T o t a l s   T 850 T 500
C T   C r o s s   T o t a l s   T d 850 T 500
T T   T o t a l   T o t a l s   I n d e x   T 850 + T d 850 ( 2   T 500 ) TT = 45 to 50: Thunderstorms possible; TT = 50 to 55: Thunderstorms more likely, possibly severe. TT = 55 to 60: Severe thunderstorms most likely.
C A P E C o n v e c t i v e   A v a i l a b l e   P o t e n t i a l   E n e r g y   L N B L F C R d T v p T v e   d   l n ( P ) CAPE = 1000 to 2500: Moderately unstable; CAPE = 2500 to 3500: Very unstable. CAPE above 3500–4000: Extremely unstable.
T 500 : temp of environment at 500 hpa; T p 500 : temp of parcel at 500 mb lifted dry adiabatically from 850 mb; T p 500 : temp. of parcel at 500 mb lifted dry adiabatically from surface; T d 850 : dewpoint temp at 850 mb; TT: total totals; f 850 : wind speed in knots at 850 mb; f 500 : wind speed in knots at 500 mb; s: the sine of the angle between the 500 and 850 mb wind directions (the shear term); T 850 : temp of environment at 850 hpa; T 700 : temp of environment at 700 hpa, LFC: level of free convection; LNB: level of neutral buoyancy; Rd: gas constant of dry air, 287.053 JK−1 kg−1; T v p   : virtual temp of the parcel; T v e : virtual temp of the environment.
Table 2. Monthly total of thunderstorm days for study period.
2019202020212022
January--26
February-213
March 1-410
April3114
May8632
June71294
July5-22
August41-5
September1146
October 1621
November3-32
December3-3-
Disclaimer/Publisher’s Note: The statements, opinions and data contained in all publications are solely those of the individual author(s) and contributor(s) and not of MDPI and/or the editor(s). MDPI and/or the editor(s) disclaim responsibility for any injury to people or property resulting from any ideas, methods, instructions or products referred to in the content.

