
Investigation into the Best Available Moisture Pretreatment Approach for the Measurement of Trichloroethylene and Nitrous Oxide Emitted from Semiconductor Industries


Abstract
1. Introduction
2. Materials and Methods
2.1. Experimental Apparatus
2.2. Experimental Materials
2.3. Experimental Procedure
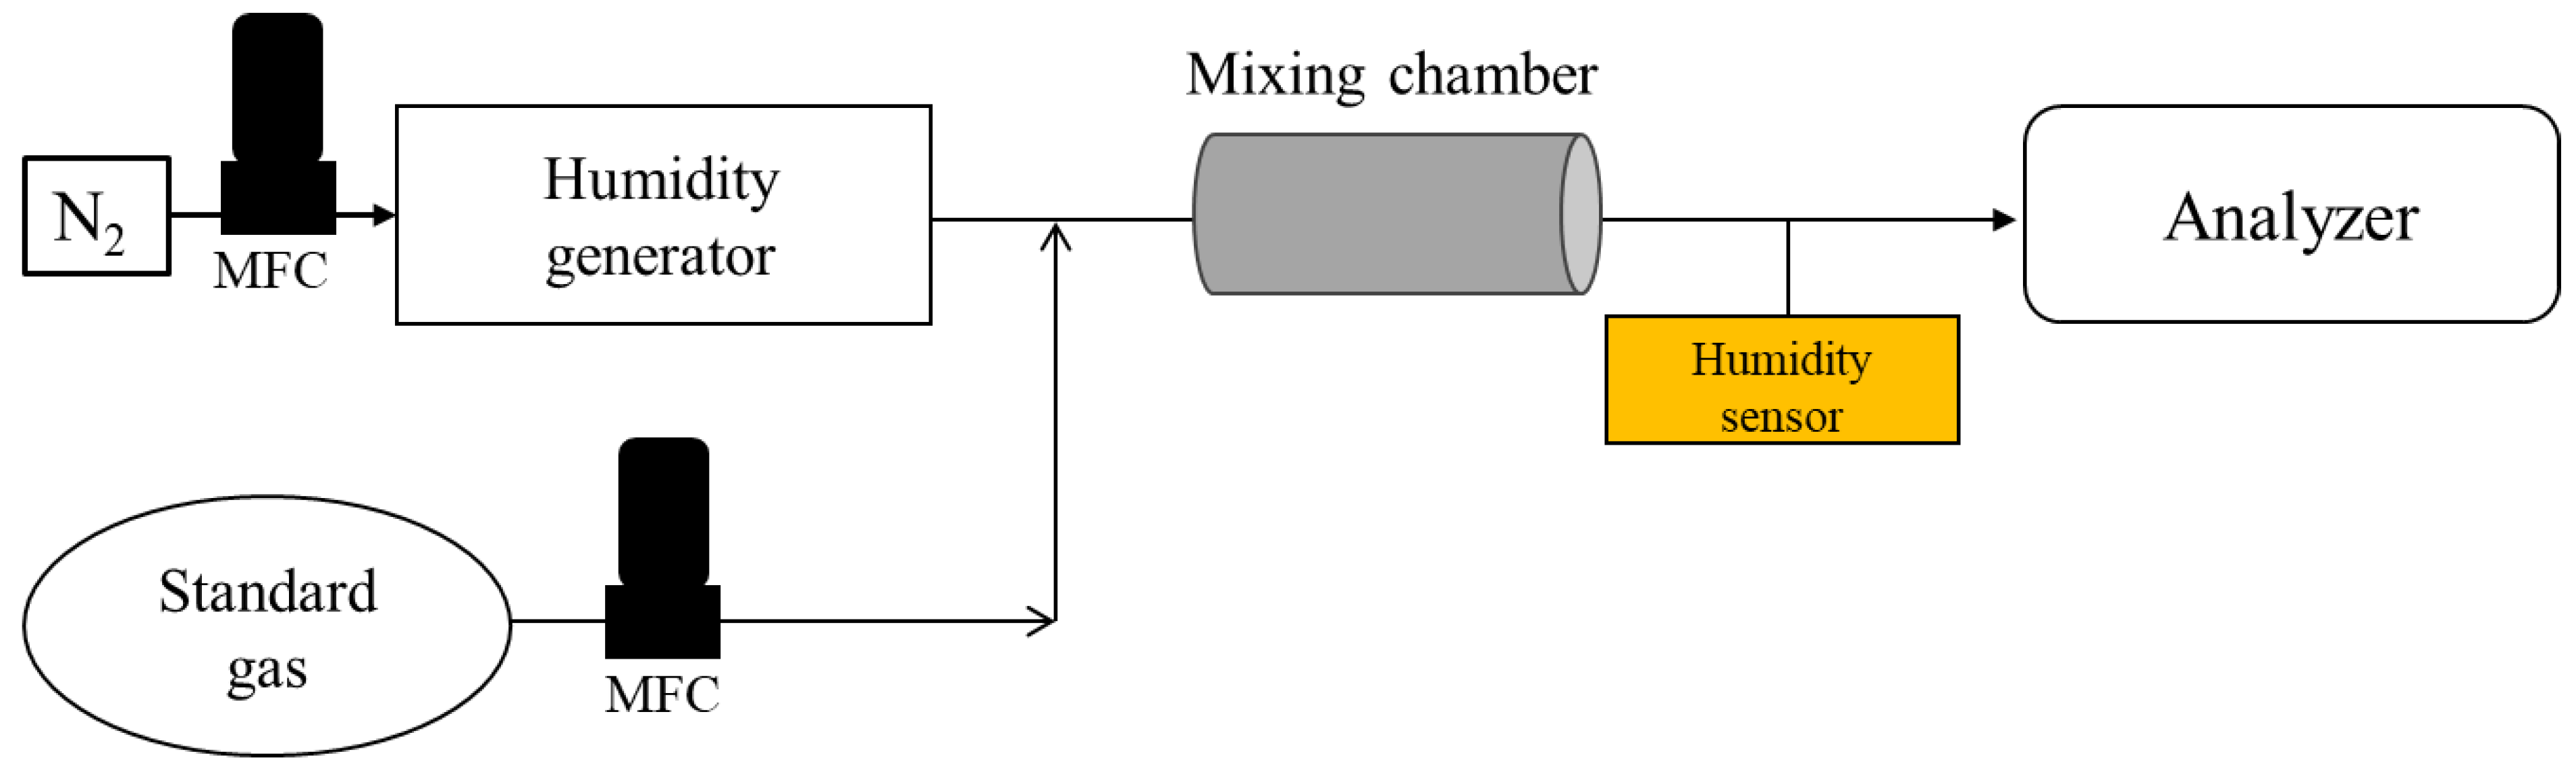
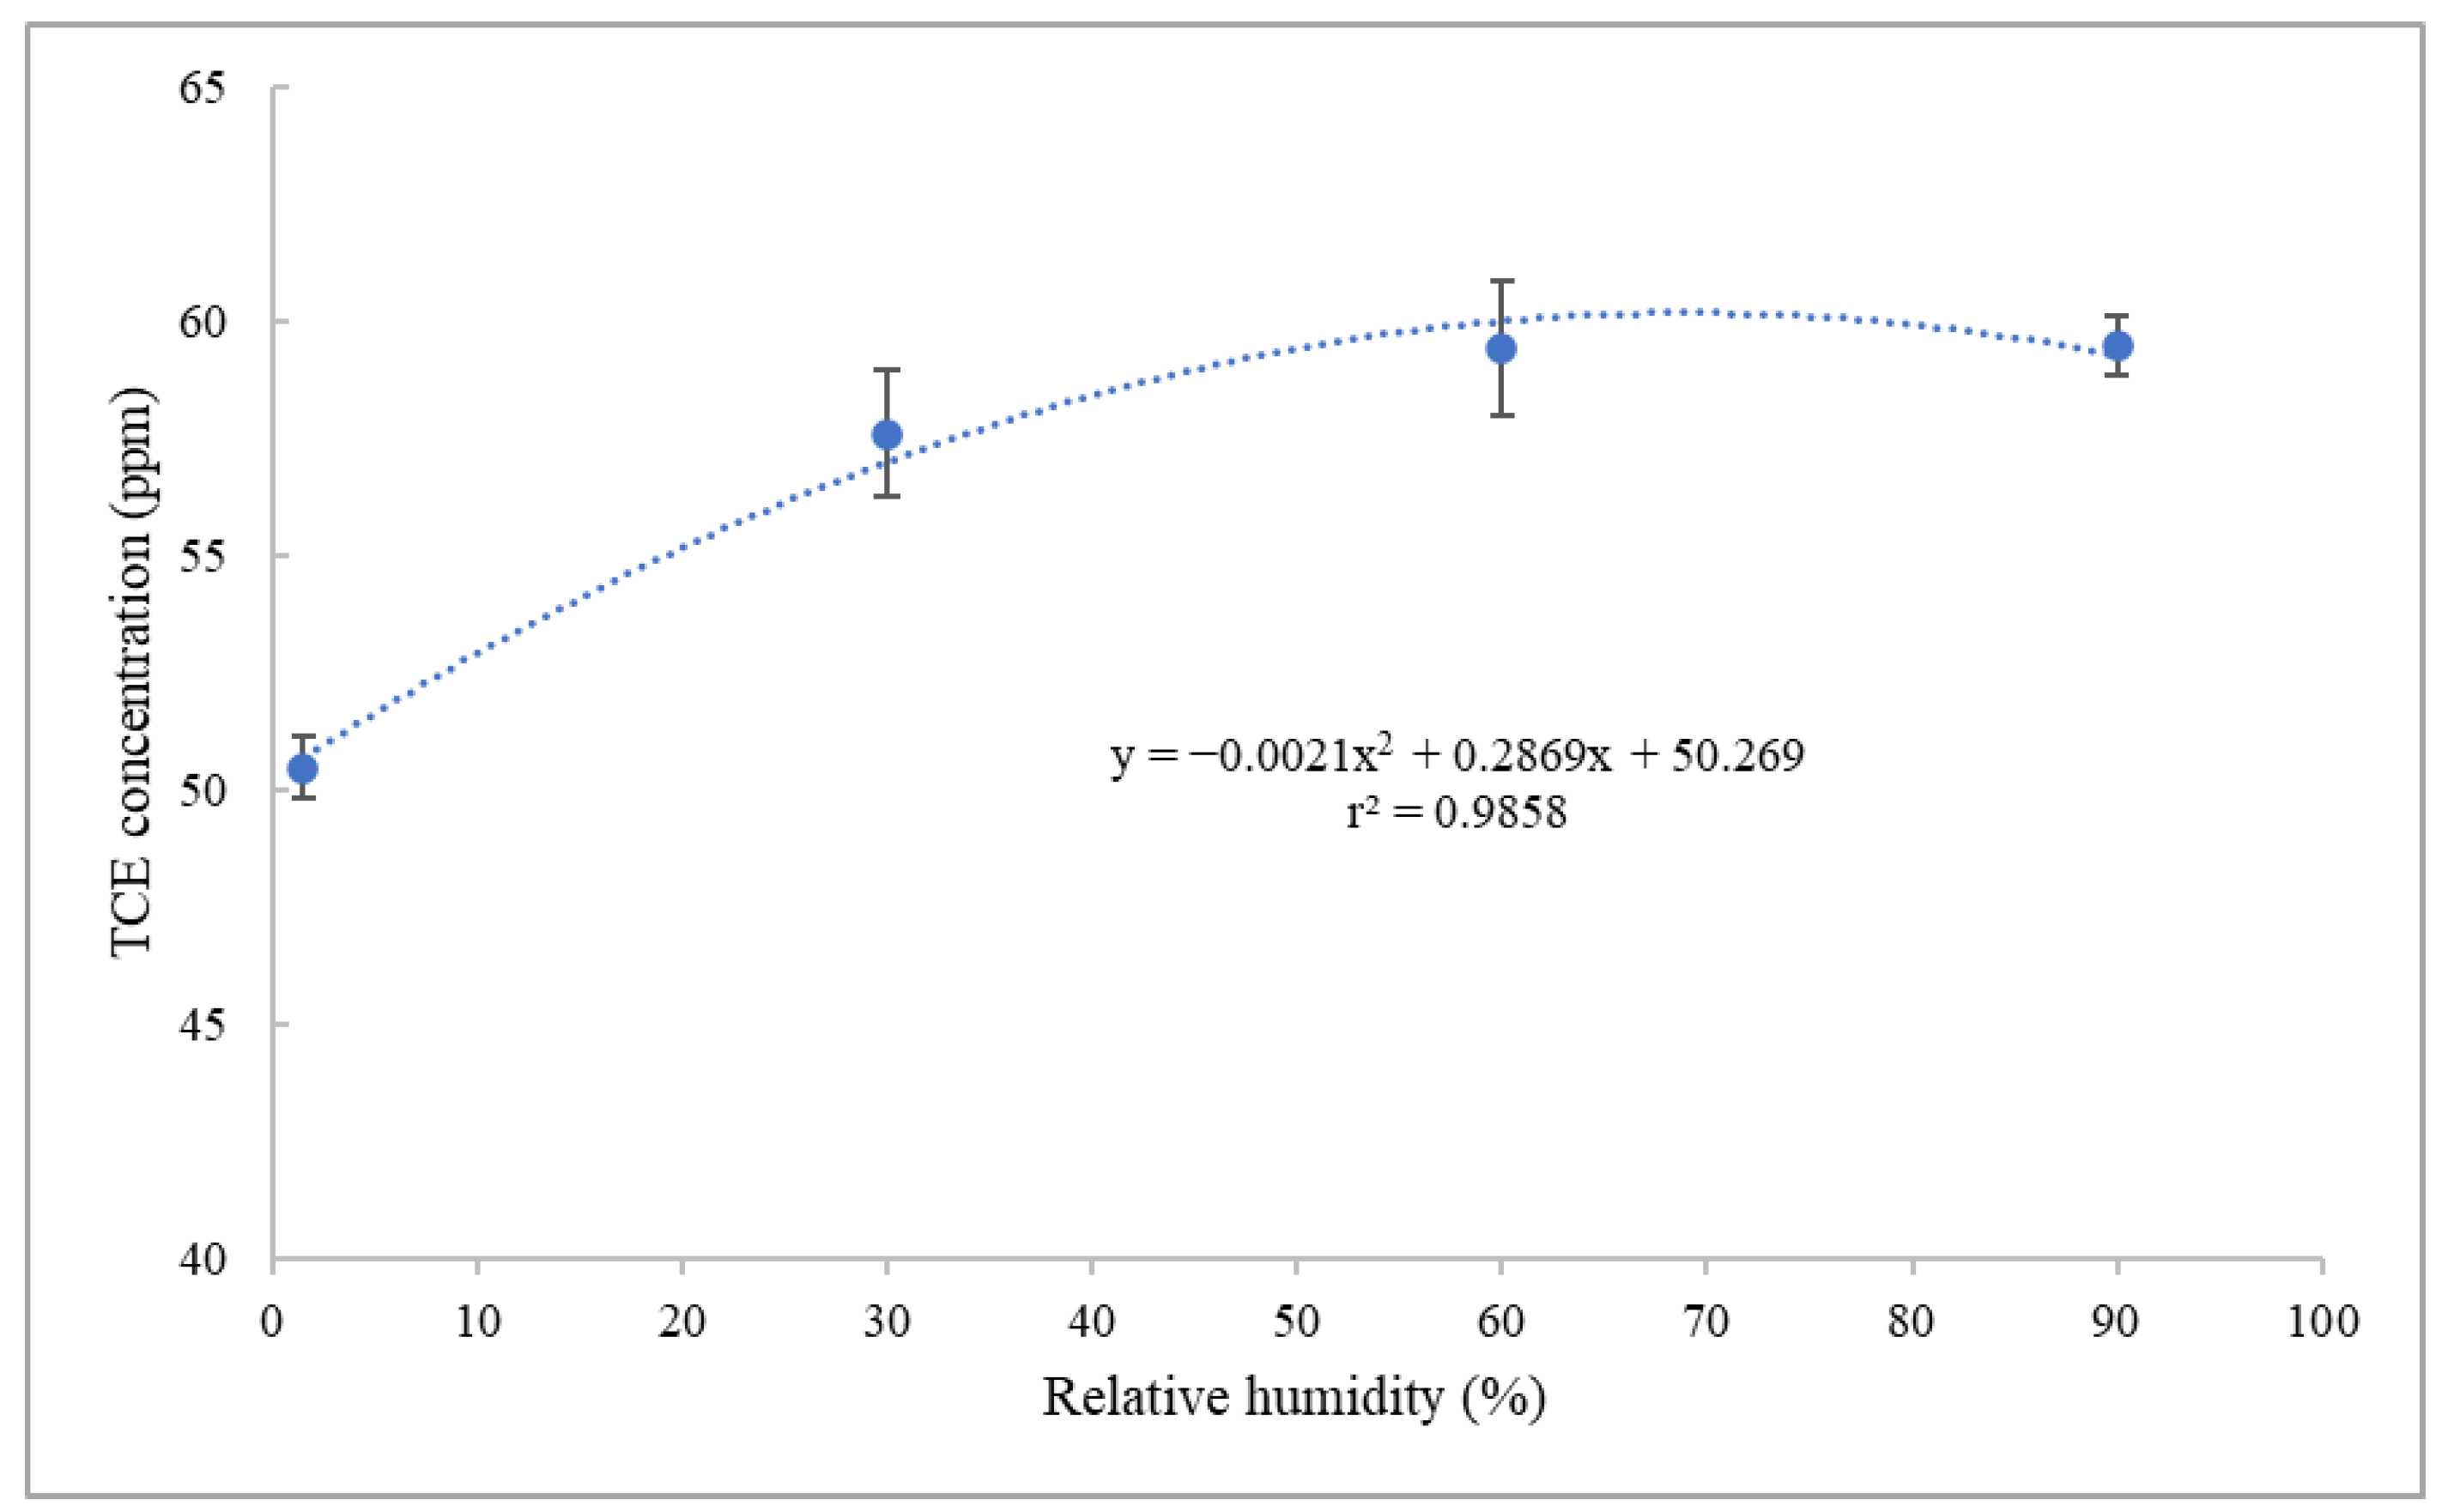
2.3.1. Investigation into the Humidity Effect on the Analytical Results of TCE and N2O
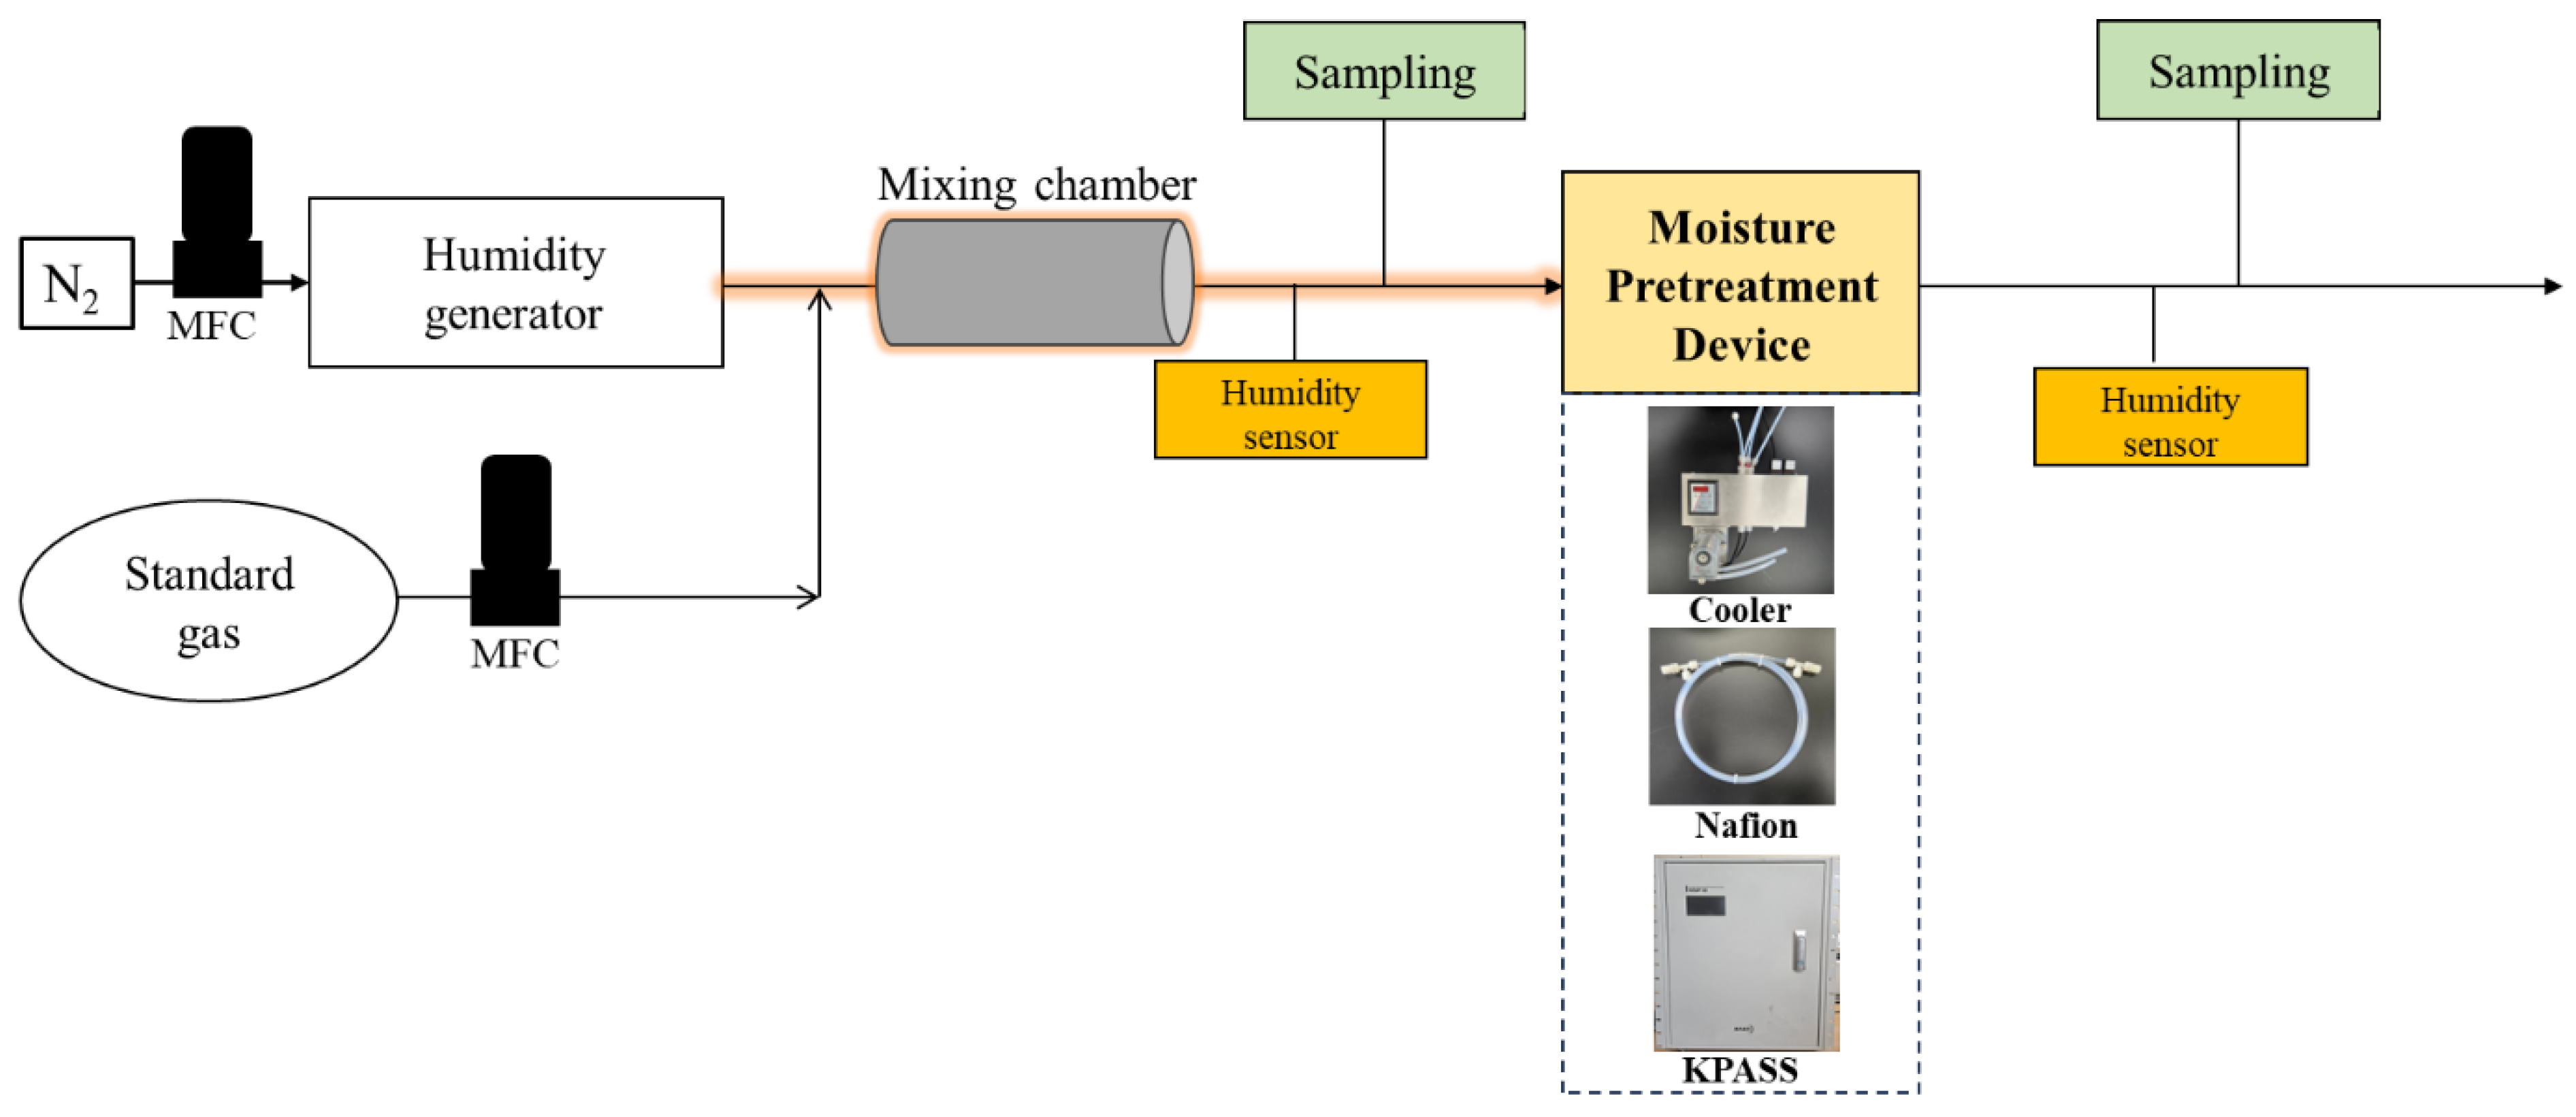
2.3.2. Investigation into the Performance of Moisture Pretreatment Devices at Normal Loading Capacities
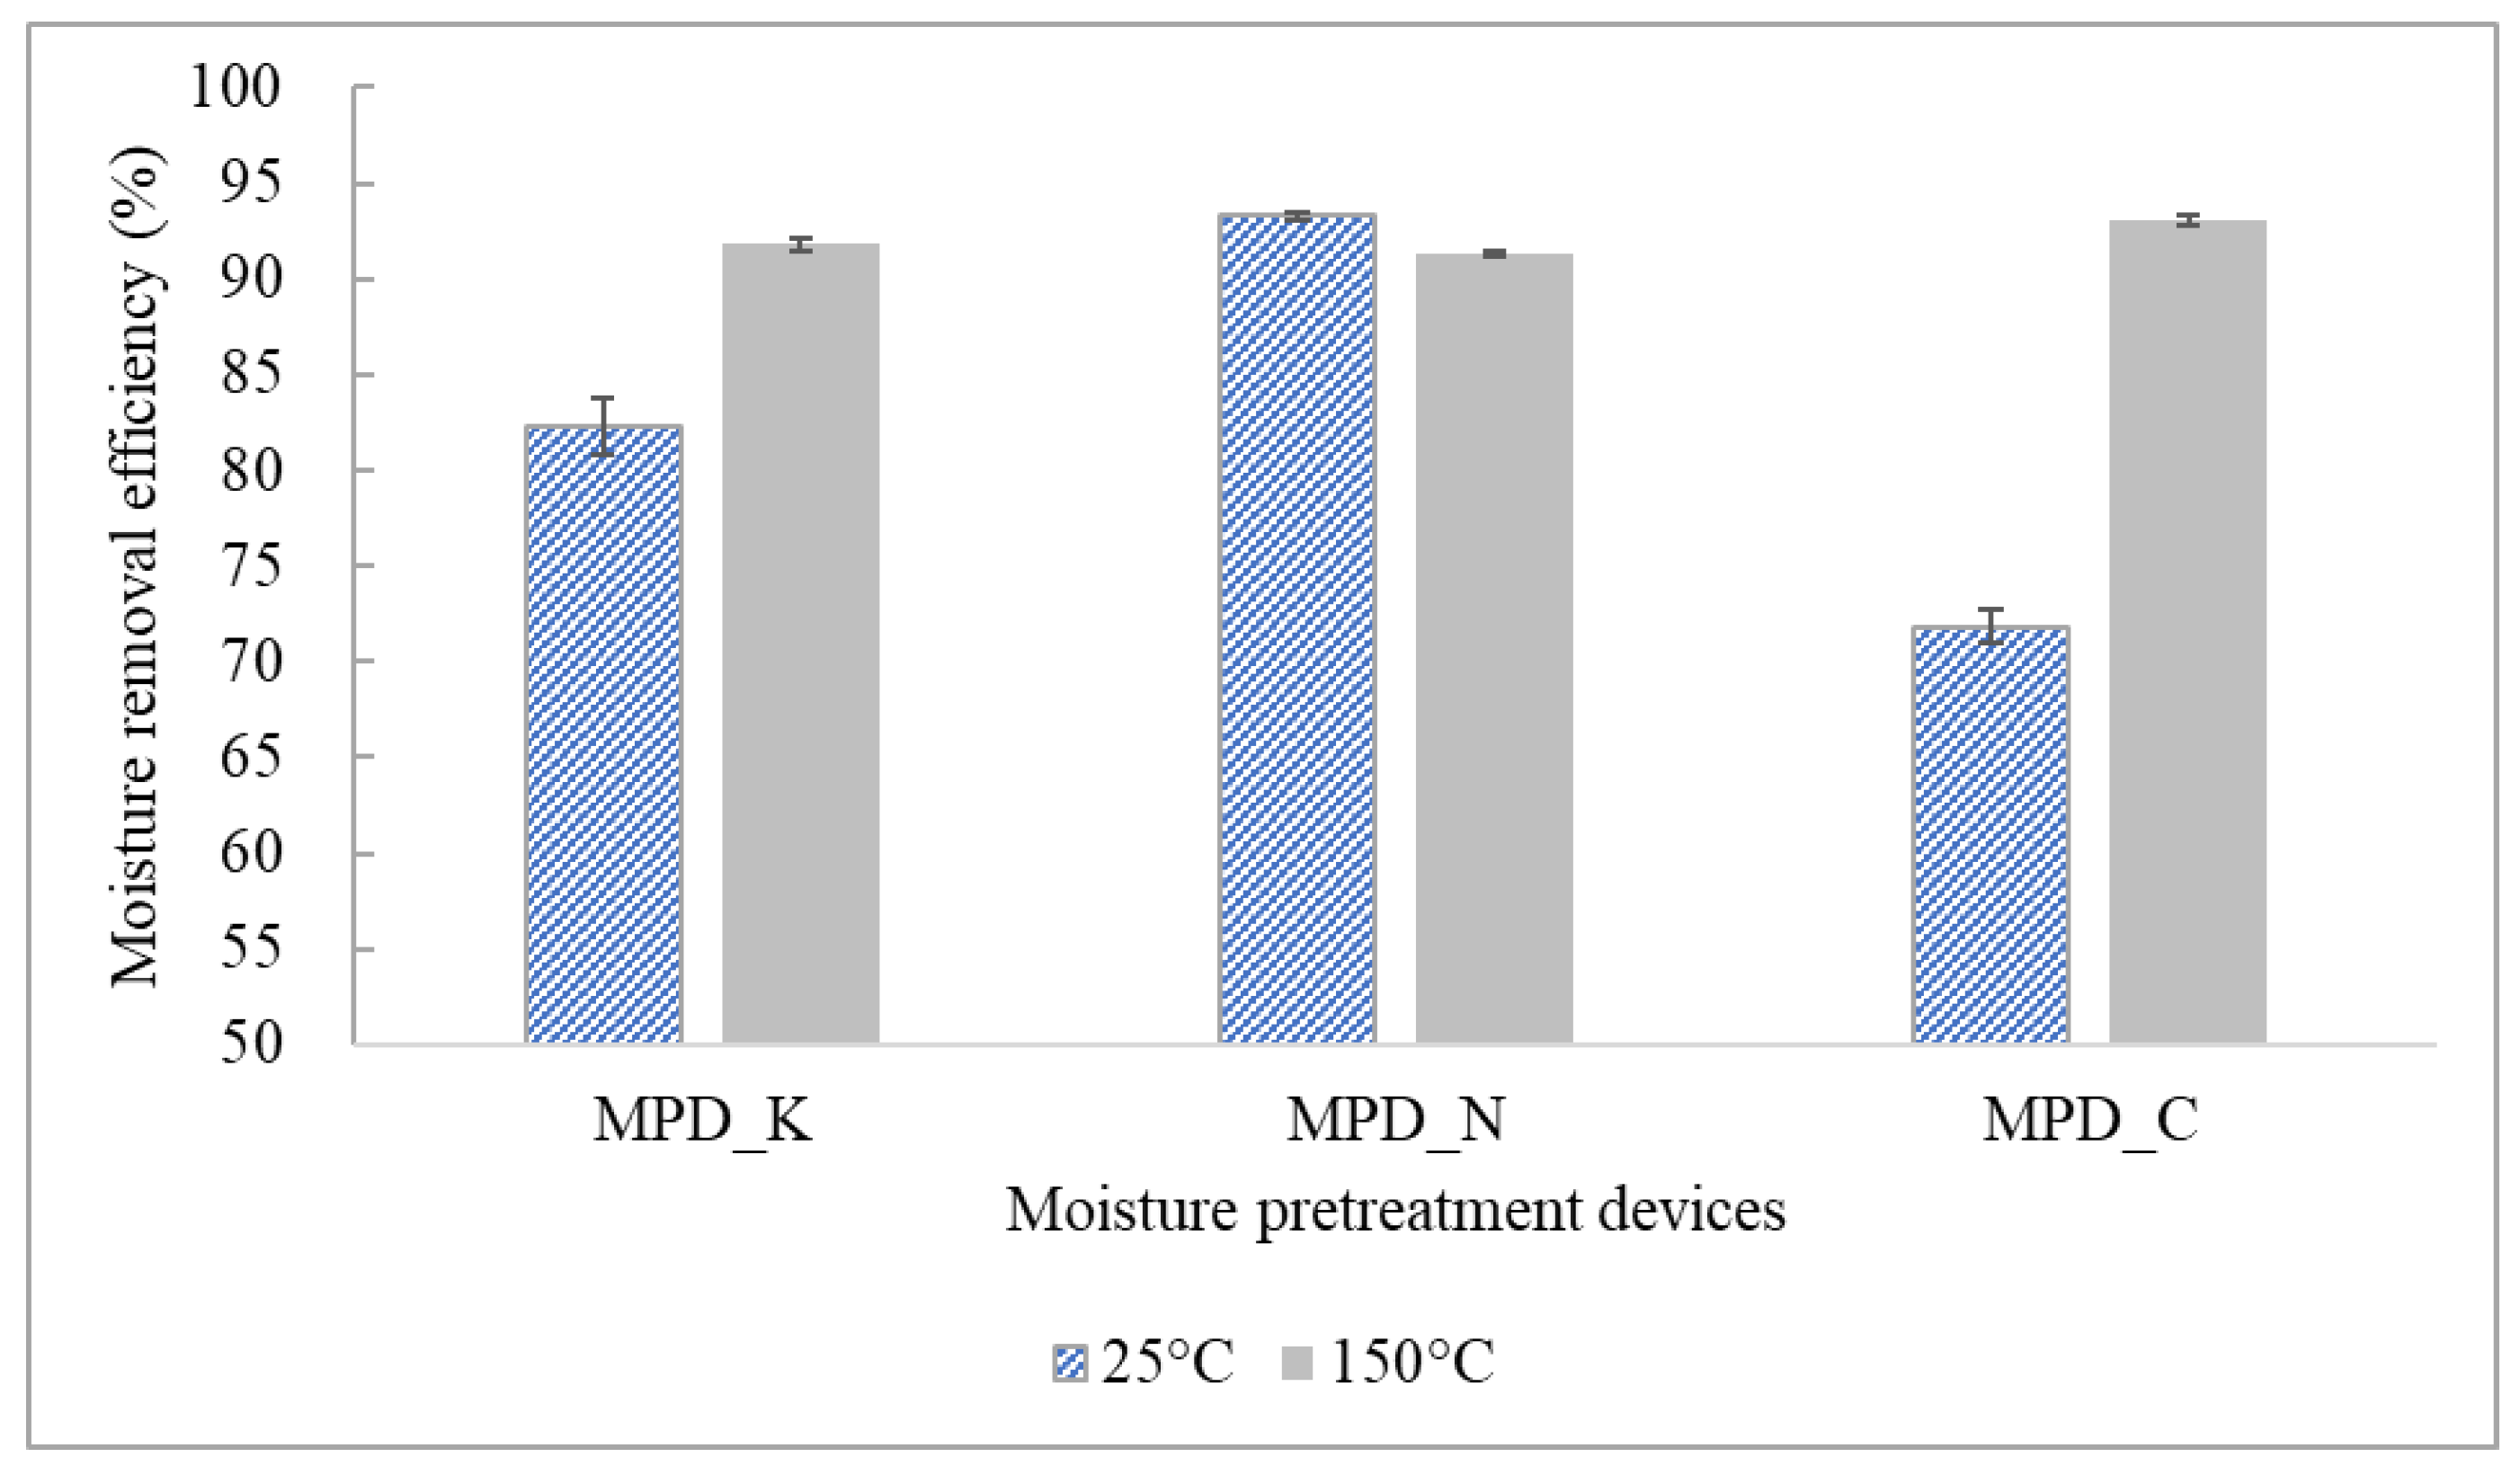
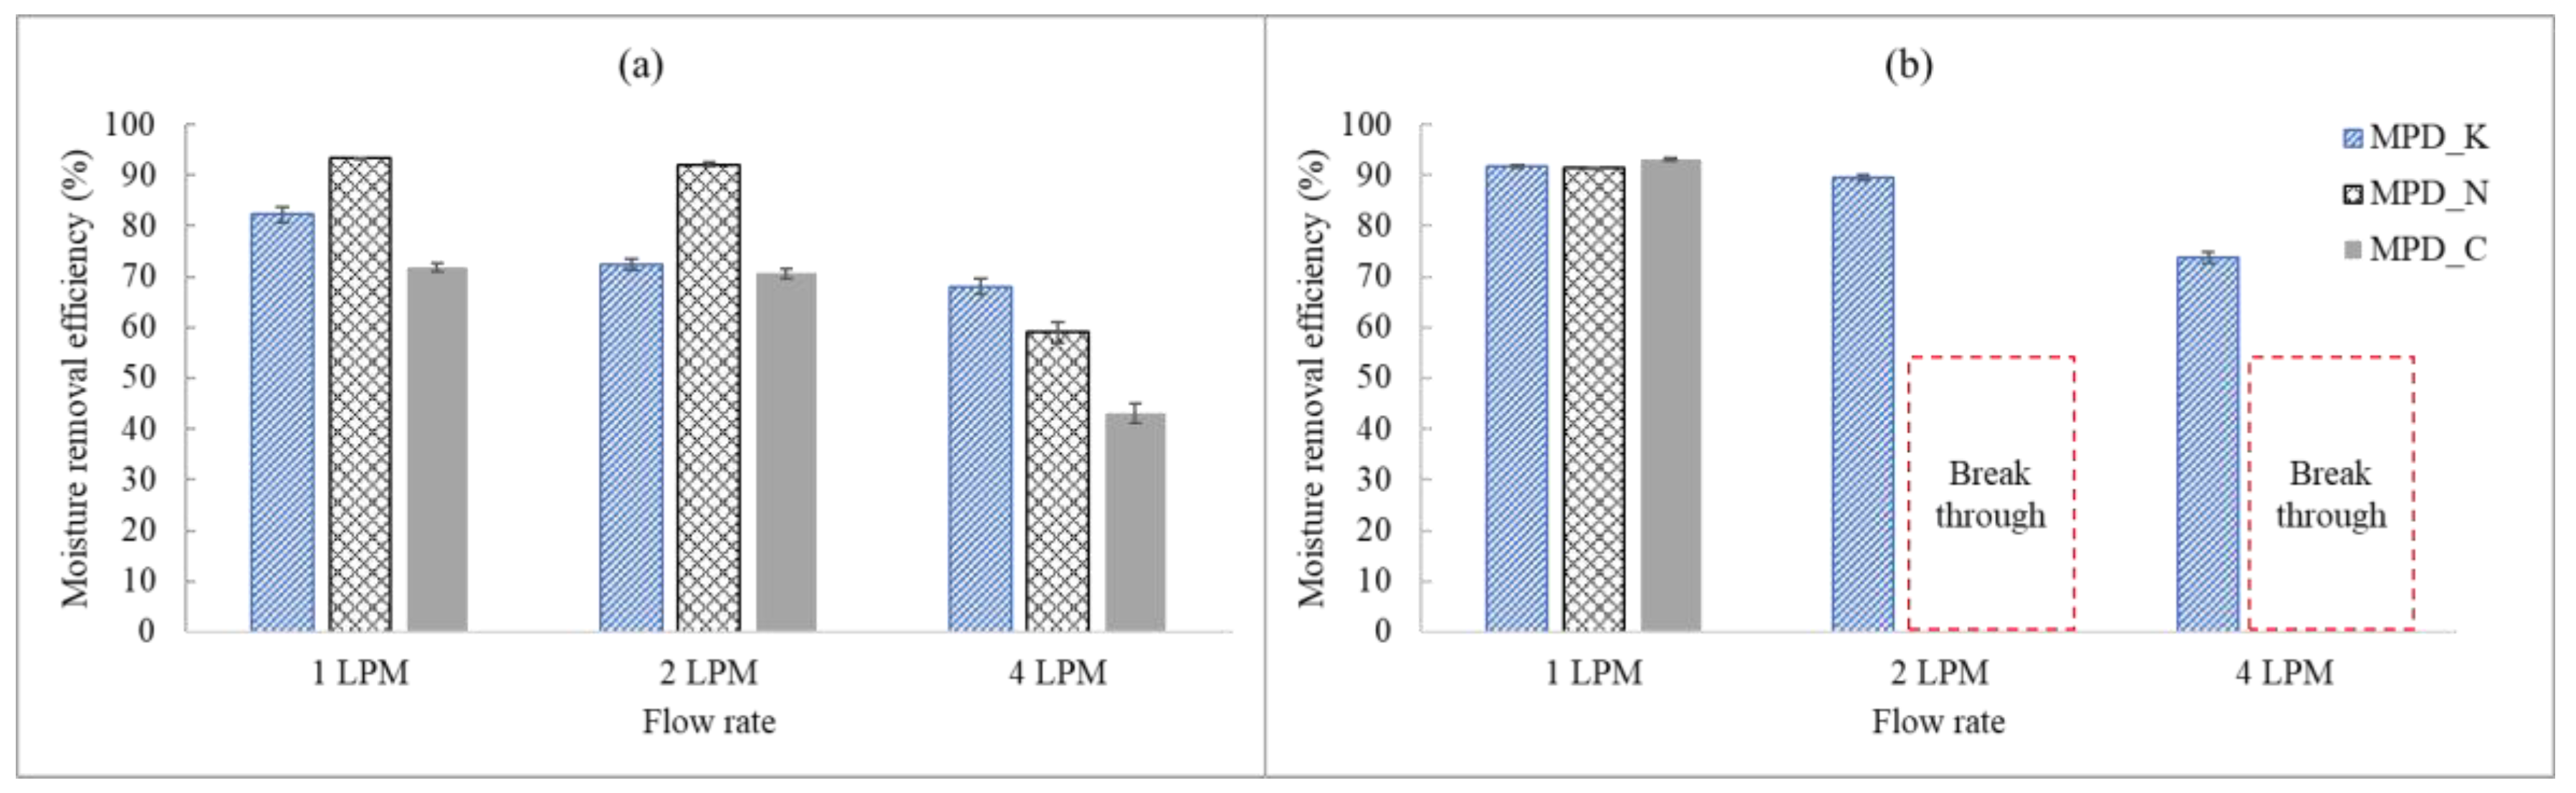
Comparison of the Moisture Removal Efficiency with Respect to Various Moisture Pretreatment Devices at Normal Loading Capacities
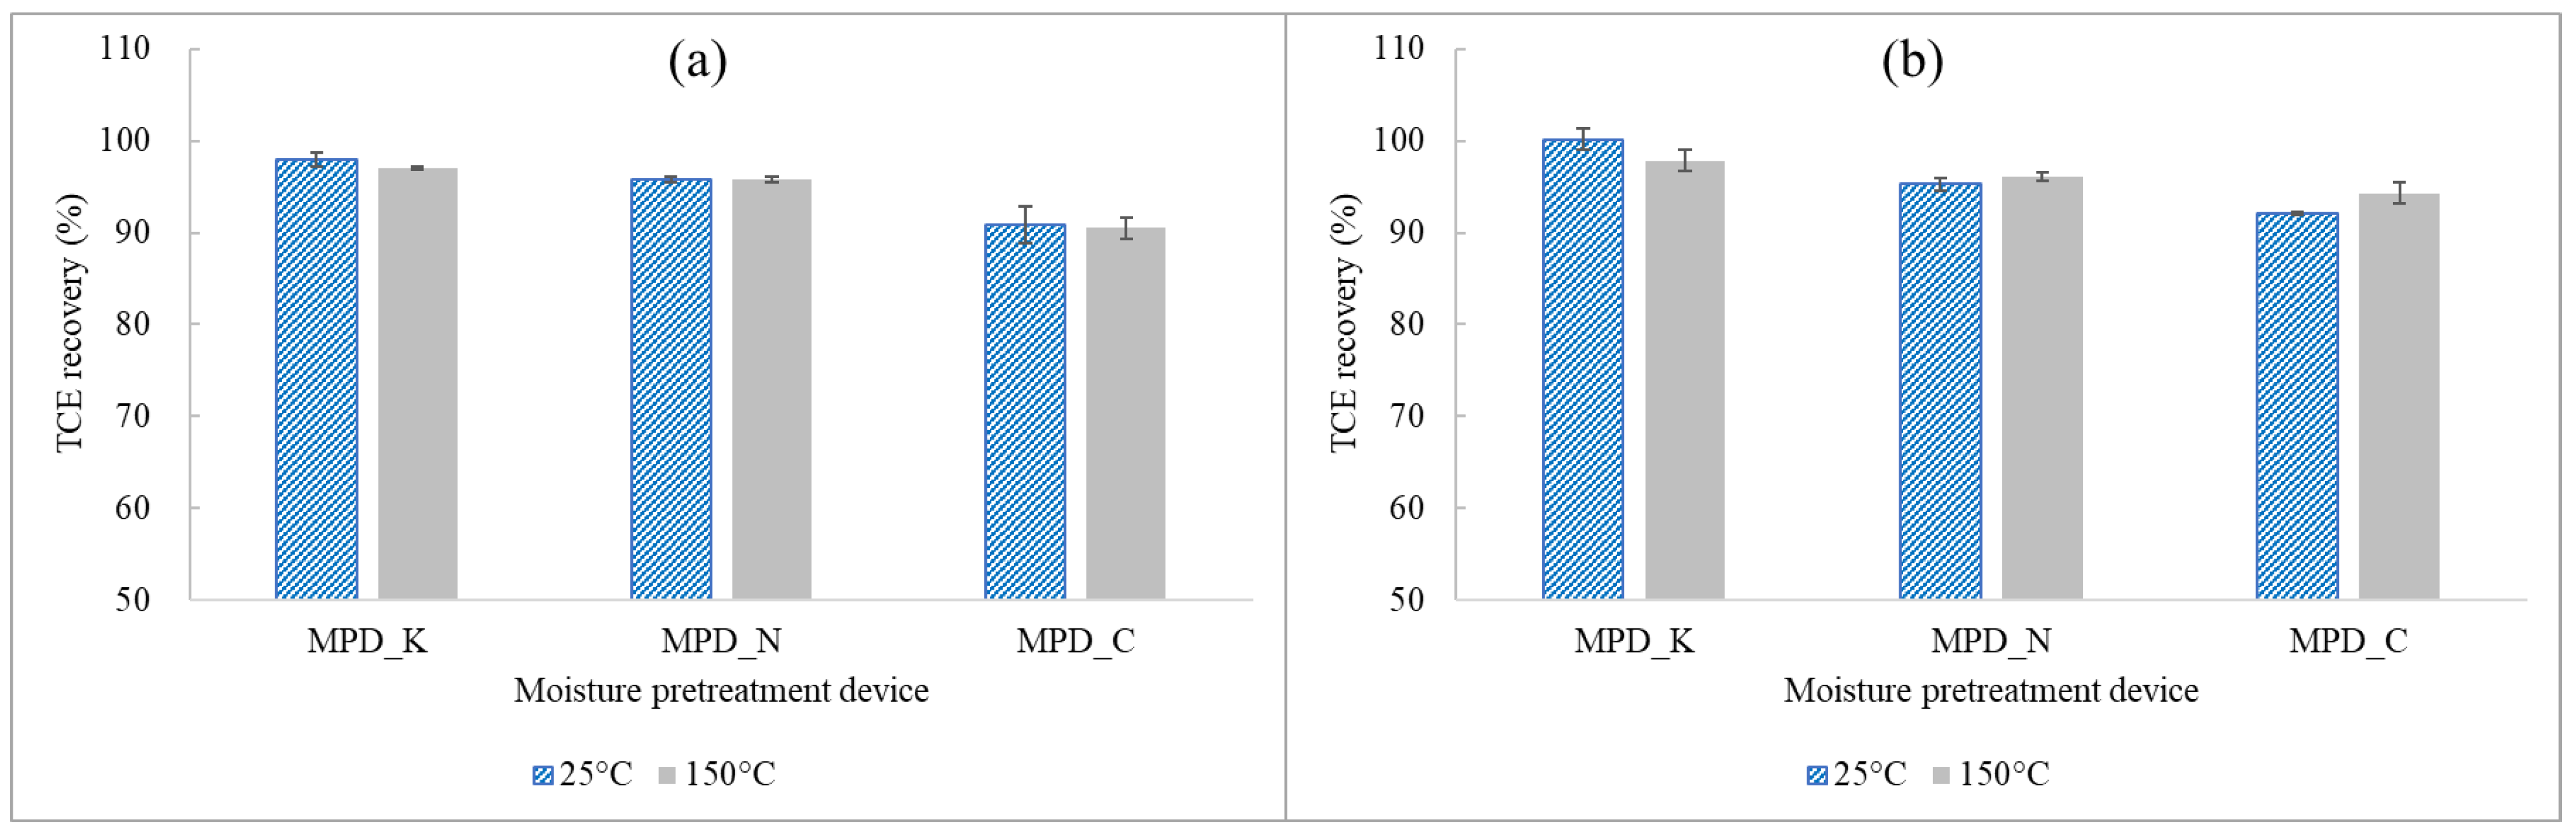
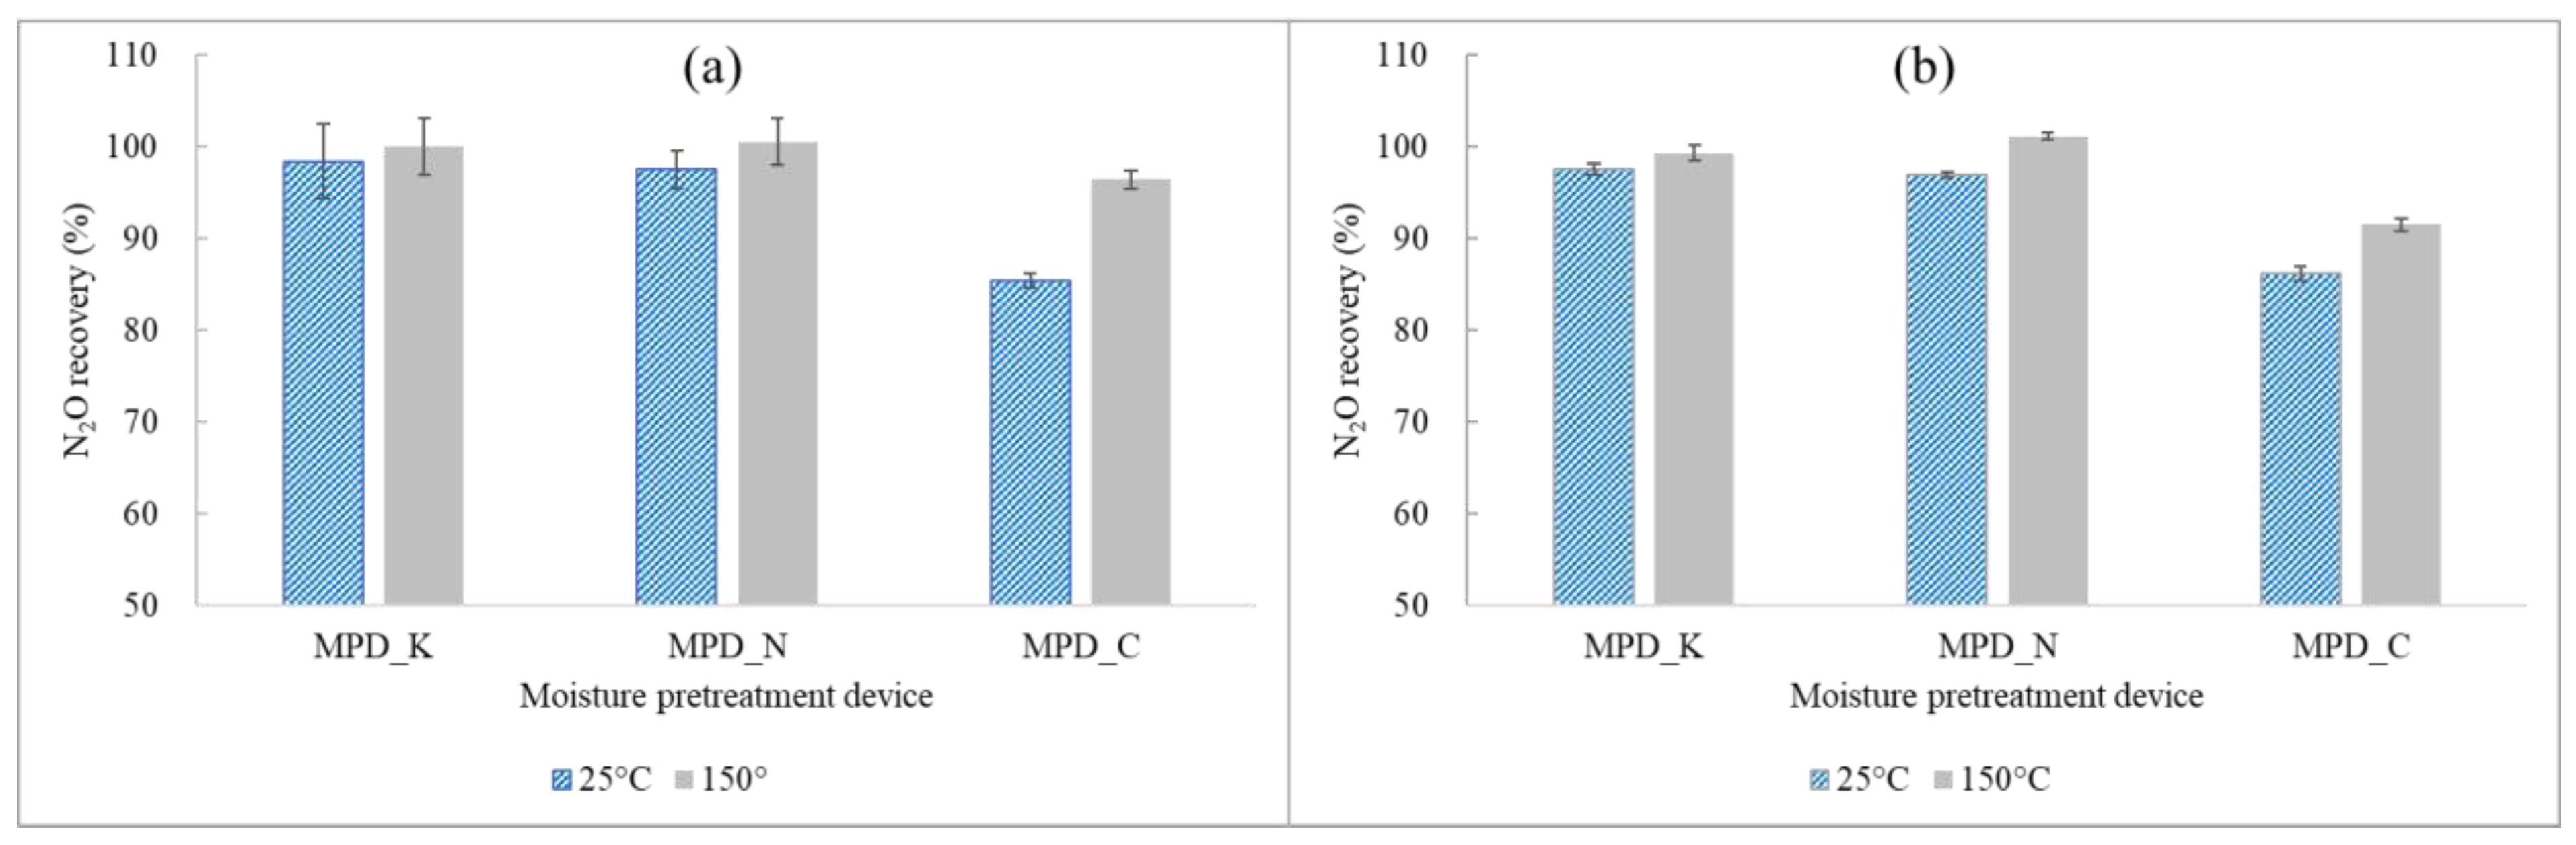
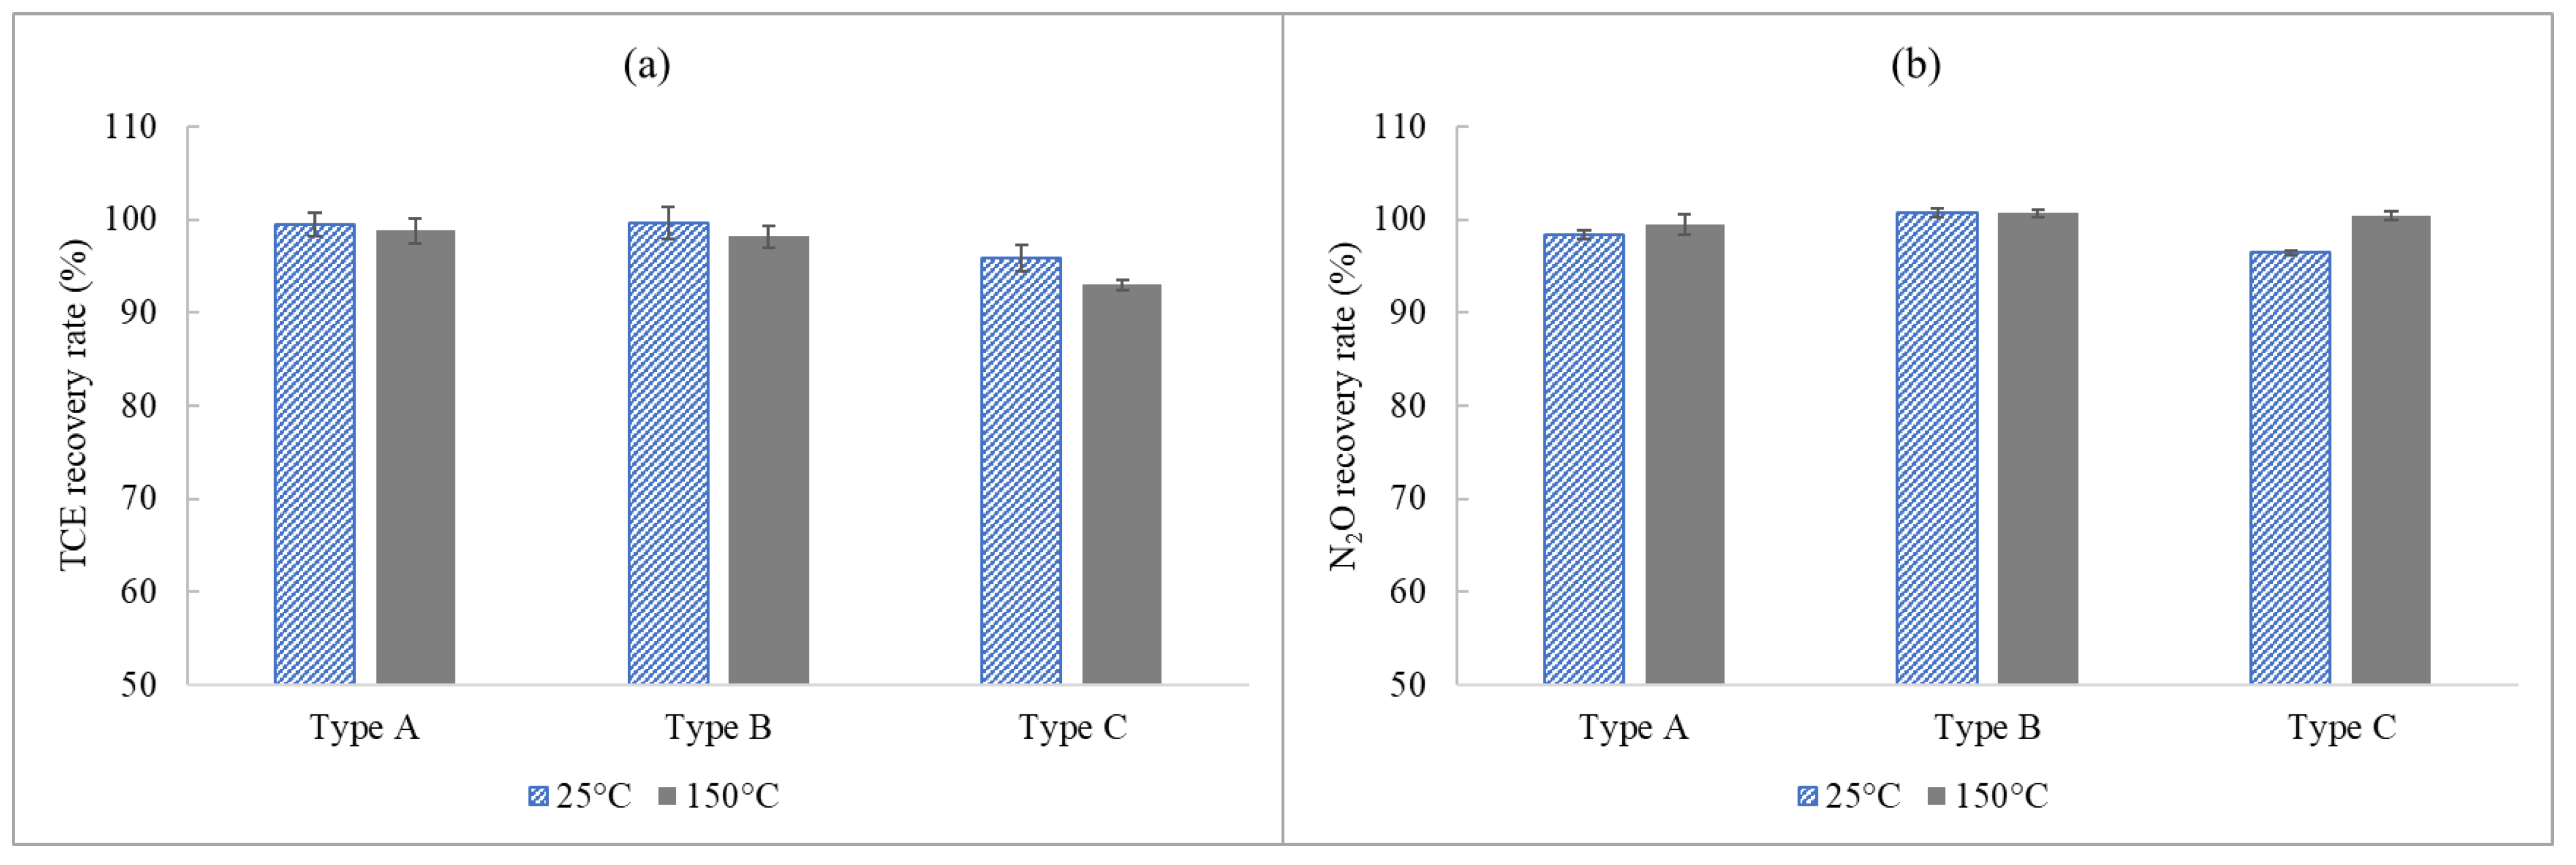
Investigation into TCE and N2O Recovery Rates with Respect to Different Moisture Pretreatment Devices at Normal Loading Capacity
2.3.3. Investigation into the Performance of Moisture Pretreatment Devices at High Loading Capacities
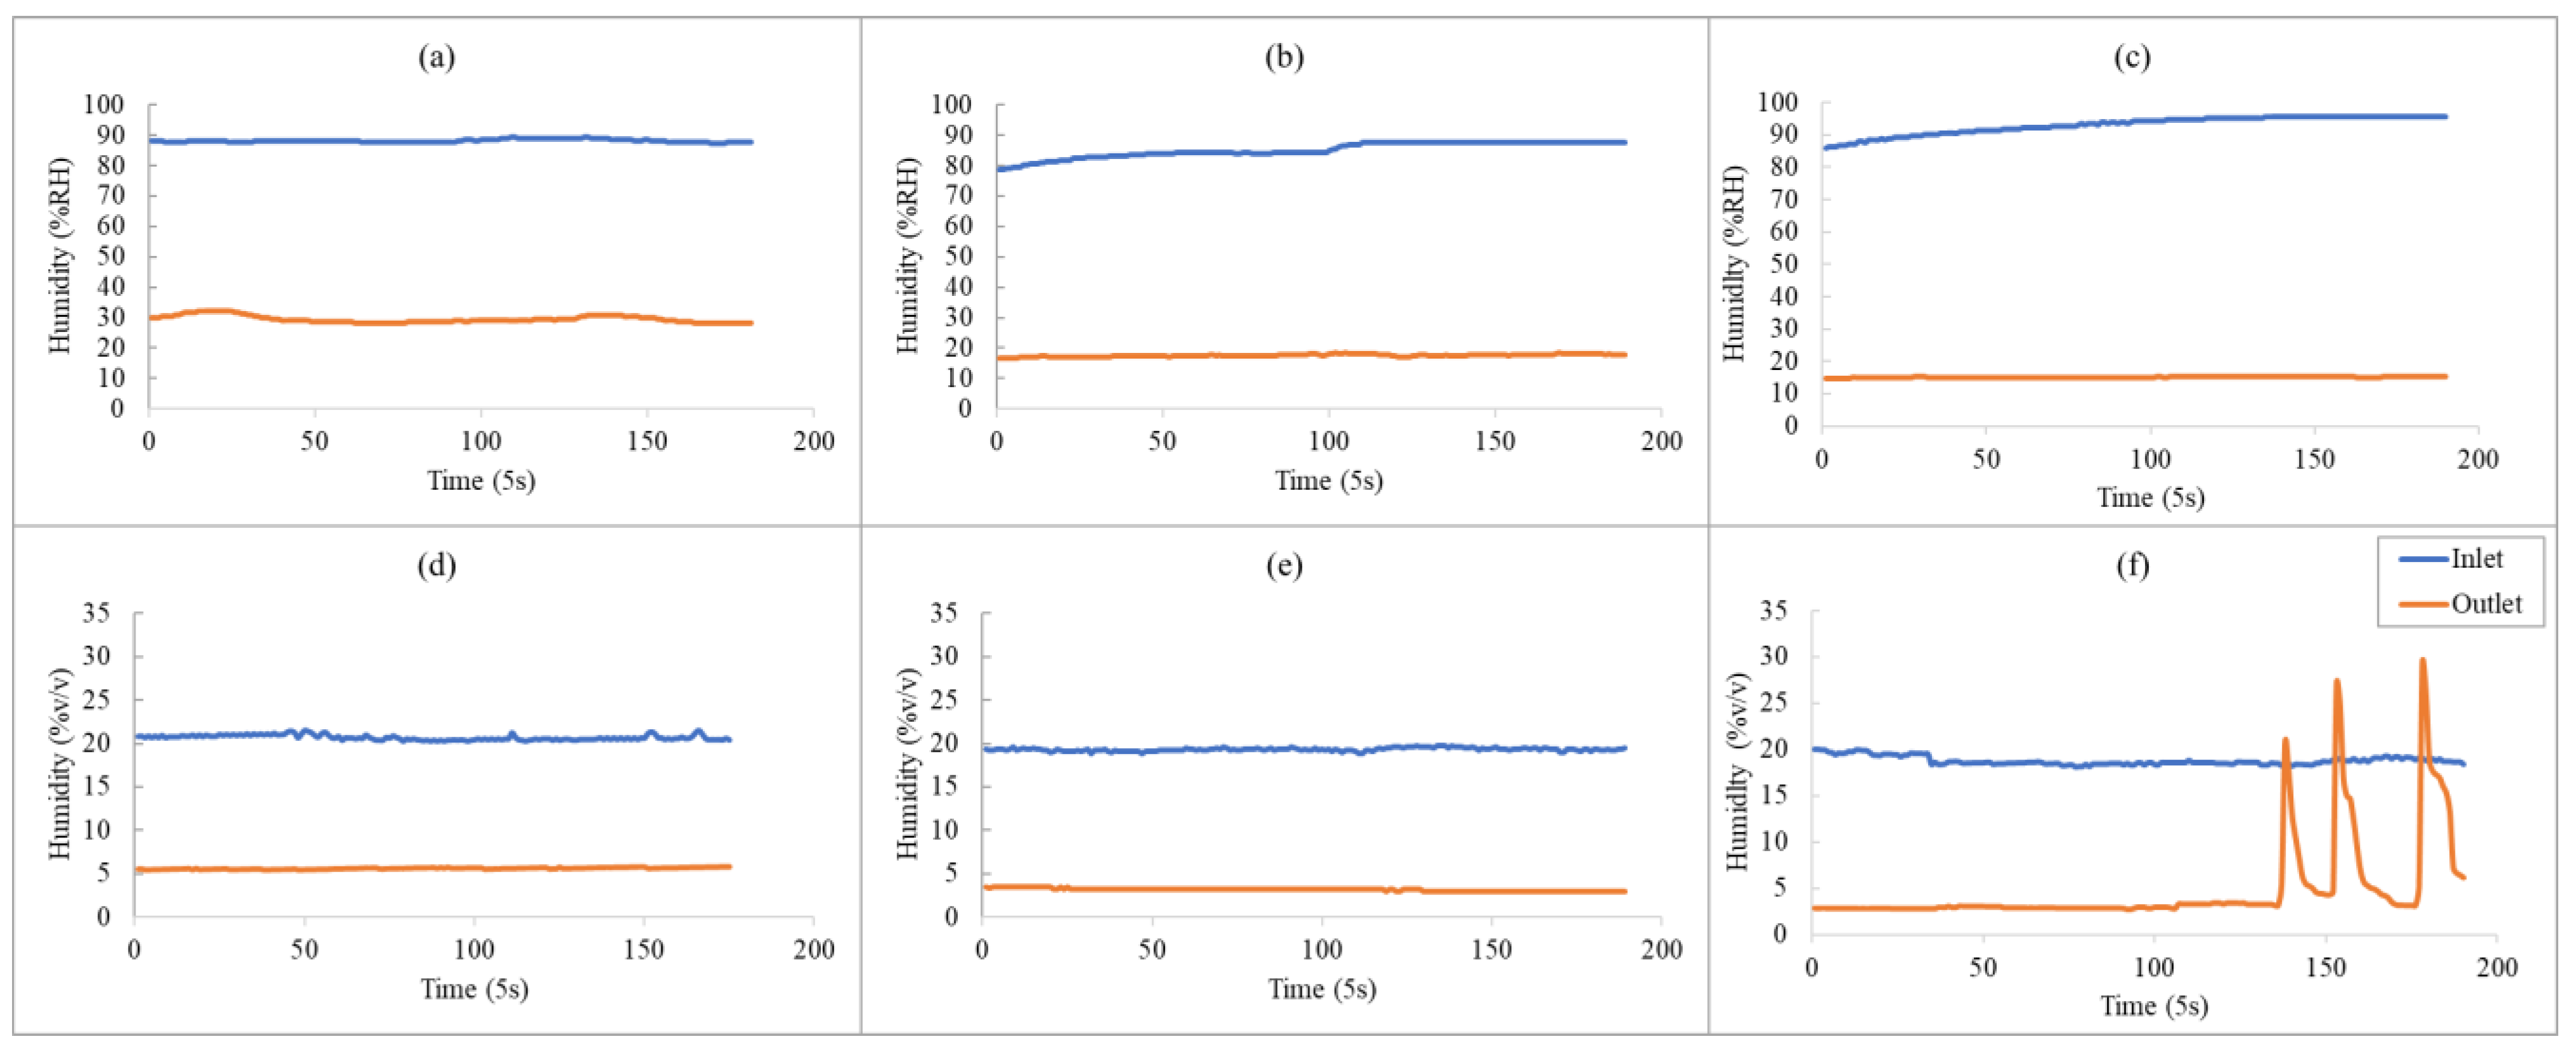
Investigation into the Moisture Removal Efficiency of Various Moisture Pretreatment Devices at High Loading Capacities
Improvement in the Performance of Moisture Pretreatment Devices
3. Results and Discussion
3.1. Effect of Humidity on the Analytical Results of TCE and N2O
3.2. Comparison of the Performance of MPDs with Respect to Normal Loading Capacities
3.2.1. Comparison of the Moisture Removal Efficiency of Different MPDs at Normal Loading Capacities
3.2.2. Effect of Moisture Pretreatment Devices on the Recovery of TCE and N2O at Normal Loading Capacities
3.3. Comparison of the Performance of MPDs with Respect to High Loading Capacities
3.3.1. Comparison of the Moisture Removal Efficiency of Different MPDs with Respect to High Loading Capacities
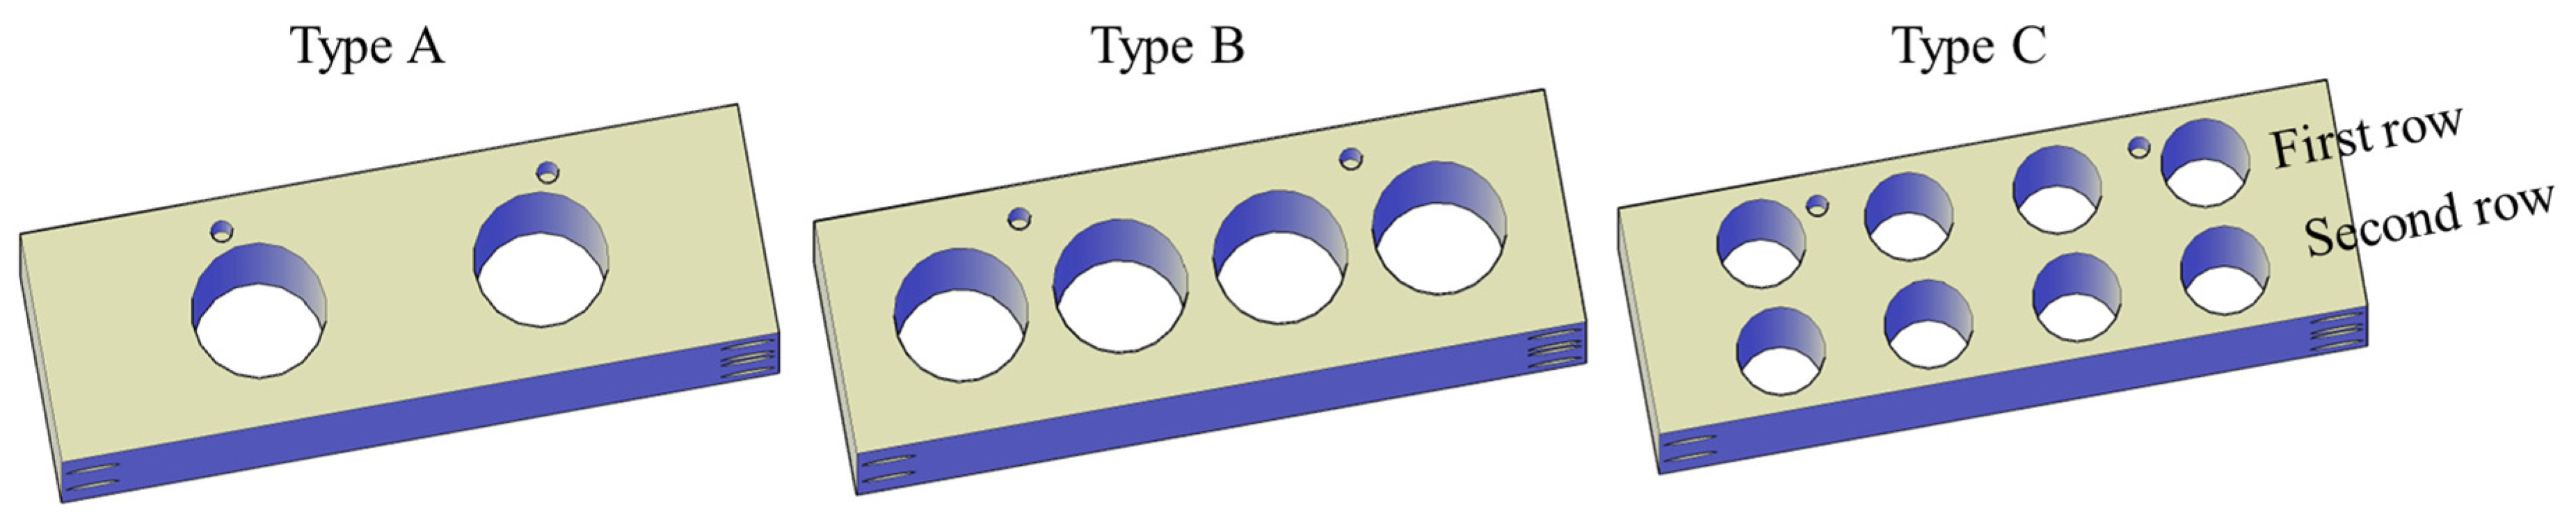
3.3.2. Optimal Cold Trap Design for MPD_K to Effectively Operate at High Loading Capacities
Theoretical Assessment of Various Cold Trap Designs
Performance of the Modified MPD_K with Respect to Various Cold Trap Designs at High Loading Capacities
4. Conclusions
Author Contributions
Funding
Institutional Review Board Statement
Informed Consent Statement
Data Availability Statement
Acknowledgments
Conflicts of Interest
References
- US EPA Basic Information About Air Emissions Monitoring. Available online: https://www.epa.gov/air-emissions-monitoring-knowledge-base/basic-information-about-air-emissions-monitoring (accessed on 8 April 2025).
- WHO. Monitoring Air Pollution Levels Is Key to Adopting and Implementing WHO’s Global Air Quality Guidelines; WHO: Geneva, Switzerland, 2023. [Google Scholar]
- Eom, Y.-S.; Hong, J.-H.; Lee, S.-J.; Lee, E.-J.; Cha, J.-S.; Lee, D.-G.; Bang, S.-A. Emission Factors of Air Toxics from Semiconductor Manufacturing in Korea. J. Air Waste Manag. Assoc. 2006, 56, 1518–1524. [Google Scholar] [CrossRef] [PubMed]
- Hess, J.-S.; Semenova, A. Semiconductor Emission Explorer: Tracking Greenhouse Gas Emissions from Chip Production (2015-2023), Interface. 2025. Available online: https://www.interface-eu.org/publications/semiconductor-emission-explorer (accessed on 8 April 2025).
- Change, C. Intergovernmental Panel on Climate Change (IPCC). In Climate Change 2021-The Physical Science Basis; Cambridge University Press: Cambridge, UK, 2023; ISBN 9781009157896. [Google Scholar]
- Srivastava, D.; Vu, T.V.; Tong, S.; Shi, Z.; Harrison, R.M. Formation of Secondary Organic Aerosols from Anthropogenic Precursors in Laboratory Studies. NPJ Clim. Atmos. Sci. 2022, 5, 22. [Google Scholar] [CrossRef]
- Ma, R.; Li, K.; Guo, Y.; Zhang, B.; Zhao, X.; Linder, S.; Guan, C.; Chen, G.; Gan, Y.; Meng, J. Mitigation Potential of Global Ammonia Emissions and Related Health Impacts in the Trade Network. Nat. Commun. 2021, 12, 6308. [Google Scholar] [CrossRef]
- Chen, Y.; Yao, B.; An, M.; Ding, A.; Liu, S.; Li, X.; Li, Y.; O’Doherty, S.; Krummel, P.B.; Yang, H.; et al. Emissions of Perfluorinated Greenhouse Gases in Southeastern China Derived From High-Frequency In Situ Observations. Geophys. Res. Lett. 2025, 52, e2024GL111393. [Google Scholar] [CrossRef]
- Sadovnikov, S.A.; Yakovlev, S.V.; Kravtsova, N.S.; Romanovskii, O.A.; Tuzhilkin, D.A. Dual-Channel Infrared OPO Lidar Optical System for Remote Sensing of Greenhouse Gases in the Atmosphere: Design and Characteristics. Sens. Int. 2025, 6, 100307. [Google Scholar] [CrossRef]
- Wawrzyniak, J. Quantitative Determination of Volatile Compounds in a Mixture Using a Single Thermally Modulated Metal Oxide Semiconductor Gas Sensor and Convolutional Neural Networks. Microchem. J. 2025, 211, 113083. [Google Scholar] [CrossRef]
- Nguyen, M.T.N.; Lee, J.S. Development of a Chemical Sensor Device for Monitoring Hazardous Gases Generated in the Semiconductor Manufacturing Process. Chemosensors 2024, 12, 233. [Google Scholar] [CrossRef]
- Lee, B.-J.; Yun, S.-Y.; Jeong, I.-K.; Hwang, Y.; Park, J.-H.; Kim, J. Improving the Measurement of Characteristic Parameters for the Determination of GHG Emissions in the Semiconductor and Display Industries in Korea. Appl. Sci. 2023, 13, 8834. [Google Scholar] [CrossRef]
- Dinh, T.-V.; Kim, J.-C. Moisture Removal Techniques for a Continuous Emission Monitoring System: A Review. Atmosphere 2021, 12, 61. [Google Scholar] [CrossRef]
- Kim, D.-J.; Dinh, T.-V.; Lee, J.-Y.; Son, D.-J.; Kim, J.-C. Effect of Nafion Dryer and Cooler on Ambient Air Pollutant (O3, SO2, CO) Measurement. Asian J. Atmos. Environ. 2020, 14, 28–34. [Google Scholar] [CrossRef]
- Dinh, T.-V.; Choi, I.-Y.; Son, Y.-S.; Kim, J.-C. A Review on Non-Dispersive Infrared Gas Sensors: Improvement of Sensor Detection Limit and Interference Correction. Sens. Actuators B Chem. 2016, 231, 529–538. [Google Scholar] [CrossRef]
- Dinh, T.V.; Ahn, J.W.; Choi, I.Y.; Song, K.Y.; Chung, C.H.; Kim, J.C. Limitations of Gas Filter Correlation: A Case Study on Carbon Monoxide Non-Dispersive Infrared Analyzer. Sens. Actuators B Chem. 2017, 243, 684–689. [Google Scholar] [CrossRef]
- Kim, D.-J.; Dinh, T.-V.; Lee, J.-Y.; Choi, I.-Y.; Son, D.-J.; Kim, I.-Y.; Sunwoo, Y.; Kim, J.-C. Effects of Water Removal Devices on Ambient Inorganic Air Pollutant Measurements. Int. J. Environ. Res. Public Health 2019, 16, 3446. [Google Scholar] [CrossRef] [PubMed]
- Gil, H.-N.; Dinh, T.-V.; Lee, J.-H.; Park, B.-G.; Choi, I.-Y.; Lee, S.-W.; Kim, I.-Y.; Kim, J.-C. Effects of Humidity Pretreatment Devices on the Loss of HCl Gas Emitted from Industrial Stacks. Atmosphere 2021, 13, 33. [Google Scholar] [CrossRef]
- Lee, J.-Y.; Dinh, T.-V.; Kim, D.-J.; Choi, I.-Y.; Ahn, J.-W.; Park, S.-Y.; Jung, Y.-J.; Kim, J.-C. Effect of Conventional Water Pretreatment Devices on Polar Compound Analysis. Asian J. Atmos. Environ. 2019, 13, 249–258. [Google Scholar] [CrossRef]
- Dinh, T.-V.; Kim, D.-J.; Lee, J.-Y.; Park, B.-G.; Choi, I.-Y.; Kim, I.-Y.; Kim, J.-C. Development of a Humidity Pretreatment Method for the Measurement of Ozone in Ambient Air. J. Hazard. Mater. 2022, 426, 128108. [Google Scholar] [CrossRef]
- Lee, J.-Y.; Dinh, T.-V.; Kim, D.-J.; Choi, I.-Y.; Ahn, J.-W.; Park, S.-Y.; Jung, Y.-J.; Kim, J.-C. Comparison of Water Pretreatment Devices for the Measurement of Polar Odorous Compounds. Appl. Sci. 2019, 9, 4045. [Google Scholar] [CrossRef]
- Lee, S.-W.; Dinh, T.-V.; Park, S.-Y.; Choi, I.-Y.; Kim, I.-Y.; Park, B.-G.; Baek, D.-H.; Park, J.-H.; Seo, Y.-B.; Kim, J.-C. Development of a Moisture Pretreatment Device for the Accurate Quantitation of Water-Soluble Volatile Organic Compounds in Air. Chemosensors 2023, 11, 188. [Google Scholar] [CrossRef]
- Lee, E.-H.; Kim, T.-W.; Byun, S.; Seo, D.-W.; Hwang, H.-J.; Baek, J.; Kim, H.; Ryi, S.-K. A Study on γ-Al2O3 Catalyst for N2O Decomposition. Clean Technol. 2023, 29, 126–134. [Google Scholar]
- Jahnke, J.A. Continuous Emission Monitoring, 2nd ed.; John Wiley & Sons, Inc.: Toronto, ON, Canada, 2000; ISBN 0-471-29227-3. [Google Scholar]
- Wilson, K.L. Water Vapor Interference in the UV Absorption Measurement of Atmospheric Ozone; University of Colorado: Boulder, CO, USA, 2005. [Google Scholar]
- Son, Y.-S.; Lee, G.; Kim, J.-C.; Han, J.-S. Development of a Pretreatment System for the Analysis of Atmospheric Reduced Sulfur Compounds. Anal. Chem. 2013, 85, 10134–10141. [Google Scholar] [CrossRef]
- Haberhauer-Troyer, C.; Rosenberg, E.; Grasserbauer, M. Investigation of Membrane Dryers and Evaluation of a New Ozone Scrubbing Material for the Sampling of Organosulphur Compounds in Air. J. Chromatogr. A 1999, 852, 589–595. [Google Scholar] [CrossRef] [PubMed]
- Siemens ULTRAMAT 23—Advanced Analytics Made Into A Commodity. Available online: https://www.siemens.com/global/en/products/automation/process-analytics/extraktive-continuous-process-gas-analytics/ultramat-23.html (accessed on 4 April 2025).
- envea E-Series Nitrogen Oxides Analyzer NO, NOX & NO2. Available online: https://envea.global/product/ac32e-2/ (accessed on 4 April 2025).
- Thermo Fisher Scientific Solutions LLC NDIR Model 60 Multi-Gas Analyzer. Available online: https://www.thermofisher.com/order/catalog/product/10142556?SID=srch-srp-10142556 (accessed on 4 April 2025).
- HORIBA Group Nitrogen Oxides Monitor. Available online: https://www.horiba.com/int/process-and-environmental/products/detail/action/show/Product/apna-380-nitrogen-oxides-monitor-6229/ (accessed on 4 April 2025).
- Fire Testing Technology Limited FTIR. An Advanced FTIR for Toxic Gas Analysis; Fire Testing Technology: Sussex, UK, 2020. [Google Scholar]
- International SEMATECH Manufacturing Initiative. Comparison of Fourier Transform Infrared (FTIR) and Quadrupole Mass Spectroscopy (QMS) Methods for Determining POU Abatement System Effluent Flow; International SEMATECH Manufacturing Initiative Technology Transfer: Austin, TX, USA, 2011. [Google Scholar]
- Japan Electronics and Information Technology Industries Association. JEITA Guideline for F-GHG Characterization and Management; JEITA: Tokyo, Japan, 2011. [Google Scholar]
- NIST Chemistry WebBook Ethane, Hexafluoro-. Available online: https://webbook.nist.gov/cgi/cbook.cgi?Formula=C2F6&NoIon=on&Units=SI (accessed on 5 April 2025).
- NIST Chemistry WebBook Fluoroform. Available online: https://webbook.nist.gov/cgi/cbook.cgi?ID=C75467&Units=SI (accessed on 5 April 2025).
- NIST Chemistry WebBook Nitrogen Trifluoride. Available online: https://webbook.nist.gov/cgi/cbook.cgi?Name=NF3&Units=SI (accessed on 5 April 2025).
- NIST Chemistry WebBook Nitrous Oxide. Available online: https://webbook.nist.gov/cgi/cbook.cgi?ID=C10024972&Mask=10 (accessed on 5 April 2025).
- NIST Chemistry WebBook Tetrafluoromethane. Available online: https://webbook.nist.gov/cgi/cbook.cgi?Formula=CF4&NoIon=on&Units=SI (accessed on 5 April 2025).
- WHO. Environmental Health Criteria 50 Trichloroethylene; WHO: Geneva, Switzerland, 1985. [Google Scholar]
- Rapson, T.D.; Dacres, H. Analytical Techniques for Measuring Nitrous Oxide. TrAC Trends Anal. Chem. 2014, 54, 65–74. [Google Scholar] [CrossRef]
- Bi, Z.; Shi, Y.; Wang, Z.; Han, X.; Wang, M. Effect of Humidity on Atmospheric VOCs Measurement. IOP Conf. Ser. Earth Environ. Sci. 2021, 621, 012139. [Google Scholar] [CrossRef]
- Hartonen, K.; Helin, A.; Parshintsev, J.; Riekkola, M.-L. Problems Caused by Moisture in Gas Chromatographic Analysis of Headspace SPME Samples of Short-Chain Amines. Chromatographia 2019, 82, 307–316. [Google Scholar] [CrossRef]
- Zhang, X.; He, A.; Guo, R.; Zhao, Y.; Yang, L.; Morita, S.; Xu, Y.; Noda, I.; Ozaki, Y. A New Approach to Removing Interference of Moisture from FTIR Spectrum. Spectrochim. Acta Part A Mol. Biomol. Spectrosc. 2022, 265, 120373. [Google Scholar] [CrossRef]
- Park, B.-G.; Dinh, T.-V.; Lee, S.-W.; Choi, I.-Y.; Cho, B.-C.; Baek, D.-H.; Kim, J.-C.; Kim, J.-C. Investigation of Long-Term Performance of a Proposed Cost-Effective HCl Non-Dispersive Infrared Analyzer at Real Stationary Sources. Chemosensors 2024, 12, 262. [Google Scholar] [CrossRef]
- Dinh, T.-V.; Park, B.-G.; Lee, S.-W.; Choi, I.-Y.; Baek, D.-H.; Kim, J.-C. Long-Term Evaluation of Mid-Cost Optical Particle Counters for PM2.5 Monitoring in an Underground Subway Station: Insights from a 15-Month Study. Chemosensors 2025, 13, 25. [Google Scholar] [CrossRef]
- Kang, Y.; Aye, L.; Ngo, T.D.; Zhou, J. Performance Evaluation of Low-Cost Air Quality Sensors: A Review. Sci. Total Environ. 2022, 818, 151769. [Google Scholar] [CrossRef]
- Giordano, M.R.; Malings, C.; Pandis, S.N.; Presto, A.A.; McNeill, V.F.; Westervelt, D.M.; Beekmann, M.; Subramanian, R. From Low-Cost Sensors to High-Quality Data: A Summary of Challenges and Best Practices for Effectively Calibrating Low-Cost Particulate Matter Mass Sensors. J. Aerosol Sci. 2021, 158, 105833. [Google Scholar] [CrossRef]
- Nguyen, D.H.; Ahn, H.S. A Comprehensive Review on Micro/Nanoscale Surface Modification Techniques for Heat Transfer Enhancement in Heat Exchanger. Int. J. Heat Mass Transf. 2021, 178, 121601. [Google Scholar] [CrossRef]
- Zhang, X.; Tian, W.; Li, J.; Han, Z.; Wu, X. Effects of Coolant Temperature on Particulate Deposition and Cooling Efficiency of EGR Coolers. J. Mech. Sci. Technol. 2021, 35, 3231–3237. [Google Scholar] [CrossRef]
- Suarez-Romero, J.G.; Rodriguez-Valdelamar, J.L. Fourier Theory in Temperature Measurements; Kahan, M.A., Ed.; Optical Engineering + Applications: San Diego, CA, USA, 2009; p. 74270C. [Google Scholar]
- Rohlfs, W.; Lienhard V, J.H. Entrance Length Effects on Graetz Number Scaling in Laminar Duct Flows with Periodic Obstructions: Transport Number Correlations for Spacer-Filled Membrane Channel Flows. Int. J. Heat Mass Transf. 2016, 97, 842–852. [Google Scholar] [CrossRef]
- Romero-Trigueros, C.; Doval Miñarro, M.; González Ferradás, E. Influence of Environmental Humidity on Measurements of Benzene in Ambient Air by Transportable GC-PID. Atmos. Meas. Tech. 2017, 10, 4013–4022. [Google Scholar] [CrossRef]
- US Agency for Toxic Substances and Disease Registry. Toxicological Profile for Trichloroethylene; ATSDR: Atlanta, GA, USA, 2020.
- US National Library of Medicine Nitrous Oxide. Available online: https://pubchem.ncbi.nlm.nih.gov/compound/Nitrous-Oxide (accessed on 14 February 2025).
- Paidar, M.; Mališ, J.; Bouzek, K.; Žitka, J. Behavior of Nafion Membrane at Elevated Temperature and Pressure. Desalination Water Treat. 2010, 14, 106–111. [Google Scholar] [CrossRef]


| No. | Compound | Emission (ton/year) | Lifetime | Environmental Effect |
|---|---|---|---|---|
| 1 | TVOC | >6000 | Few hours to months | Ozone precursor, secondary organic aerosol precursor |
| 2 | Trichloroethylene (TCE) | >18 | Few days | Ozone precursor, secondary organic aerosol precursor |
| 3 | Ketones | >40 | Few days | Ozone precursor, secondary organic aerosol precursor |
| 4 | Toluene | >200 | Few hours to months | Ozone precursor, secondary organic aerosol precursor |
| 5 | Fluorinated compounds | >1000 | >200 years | GWP-100 * = 135~17,400 |
| 6 | N2O | >3000 | >100 years | GWP-100 = 273 |
| 7 | NH3 | >250 | Few hours | Fine particle precursor |
| 8 | HCl | >2000 | Hours | Acid source, secondary organic aerosol formation |
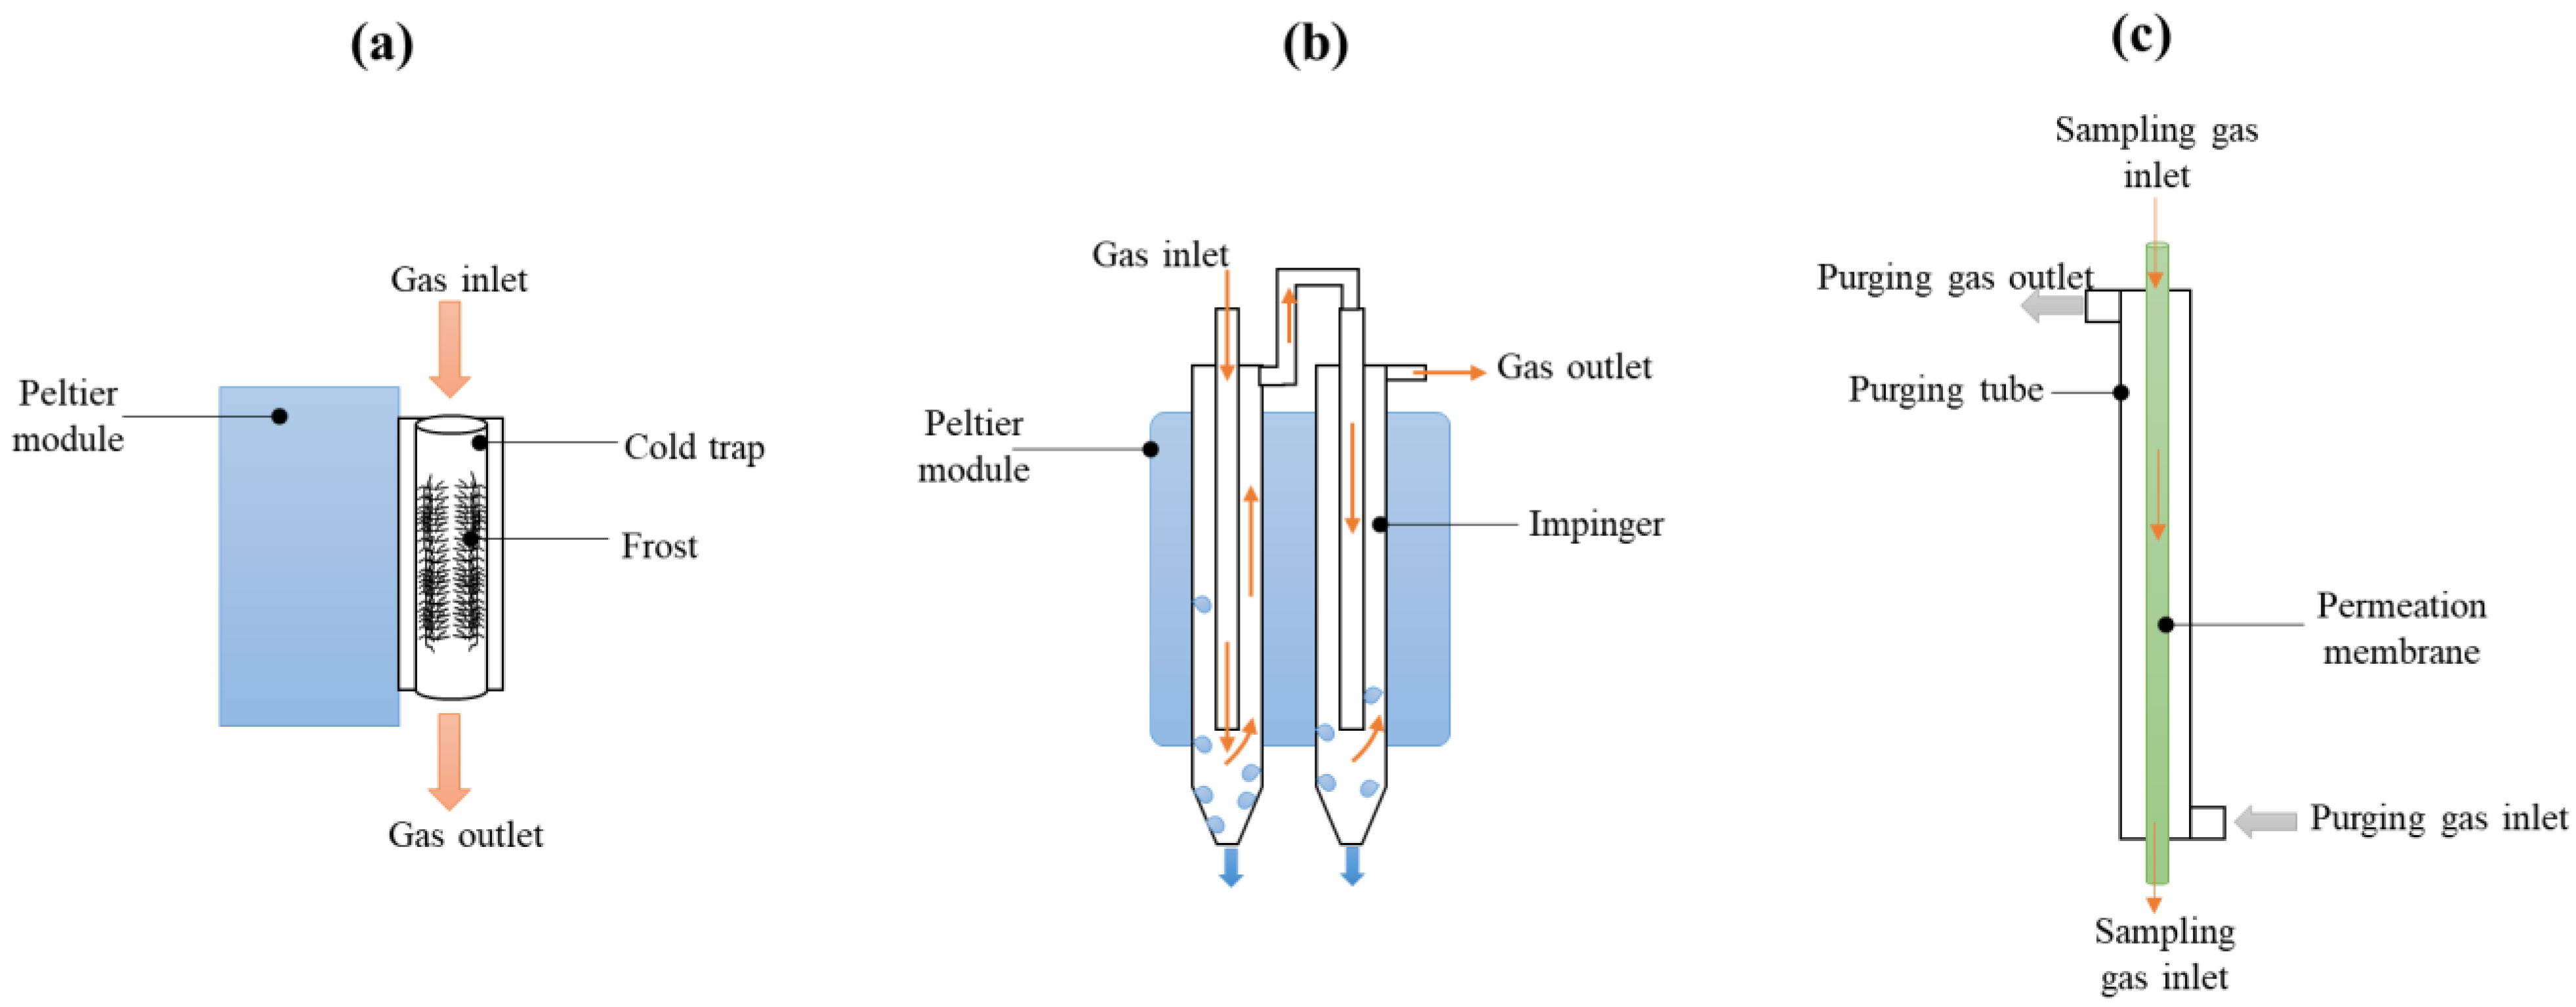
| No. | Device | Code | Moisture Removal Mechanism | Basic Setup | Flow Rate (L/min) |
|---|---|---|---|---|---|
| 1 | Cooler | MPD_C | Liquid condensation | Condensation temperature: 2 °C | 1~2 |
| 2 | NafionTM dryer | MPD_N | Membrane permeation | Dry air/sample ratio: 4/1 | 1~2 |
| 3 | KPASS | MPD_K | Frost filter | Supercooling | 1~5 |
| Parameter | Unit | Value |
|---|---|---|
| Initial oven temperature (holding time) | °C (min) | 80 (2) |
| Temperature ramp rate | °C min−1 | 25 |
| Final oven temperature (holding time) | °C (min) | 120 (0.5) |
| Detector temperature | °C | 280 |
| Column flow rate | (mL/min) | 1.5 |
| Split ratio | - | 20 |
| No. | Country | Exposure Limit (ppm) |
|---|---|---|
| 1 | USA | 100 |
| 2 | UK | 100 |
| 3 | Japan | 50 |
| 4 | Republic of Korea | 50 |
| No. | Target Analyte | Condition | Average Moisture Removal Efficiency (%) | ||
|---|---|---|---|---|---|
| KPASS | Nafion | Cooler | |||
| 1 | VOCs [21] | 25 °C, 90%RH | 90 | - | 60 |
| 2 | VOCs [19] | 25 °C, 90%RH | - | 96 | 67 |
| 3 | O3, SO2, and CO [17] | 25 °C, 80%RH | 93 | - | 59 |
| 4 | O3 and SO2 [20] | 25 °C, 30~80%RH | 87~95 | 85~90 | |
| 5 | VOCs [22] | 25 °C, 90%RH | 89 | 71 | 95 |
| 6 | TCE and N2O (this study) | 25 °C, 90%RH | 82 | 93 | 72 |
| 7 | TCE and N2O (this study) | 150 °C, 20%v/v | 92 | 91 | 92 |
| Condition | N2O | TCE | ||||
|---|---|---|---|---|---|---|
| RMSE (ppm) | MNE (%) | MNB (%) | RMSE (ppm) | MNE (%) | MNB (%) | |
| With MPD at 25 °C | 131 | 1.3 | −1.3 | 0.46 | 0.79 | 0.15 |
| With MPD at 150 °C | 238 | 2.3 | 2.3 | 1.13 | 1.95 | −1.95 |
| Direct wet sample at 90%RH | 1889 | 22.2 | 22.2 | 9.47 | 18.9 | 18.9 |
| Type | ID (cm) | Pipe Count | Total Volume (cm3) | Residence Time (s) | Surface Area (cm2) | Heat Flux (W/m2) | Graetz Number | ||
|---|---|---|---|---|---|---|---|---|---|
| 25 °C | 150 °C | 25 °C | 150 °C | ||||||
| A | 1.905 | 2 | 45.6 | 0.68 | 95.76 | 541,714 | 1,557,232 | 247.59 | 167.30 |
| B | 1.905 | 4 | 91.21 | 1.37 | 191.5 | 541,714 | 1,557,232 | 123.79 | 83.65 |
| C | 1.27 | 8 | 81.07 | 1.22 | 255.4 | First row: 1,036,066 Second row: 366,831 | First row: 2,978,689 Second row: 1,055,889 | 61.90 | 41.82 |
| No. | Compound | Condition | Flow Rate (L/min) | Average Recovery Rate (%) | ||
|---|---|---|---|---|---|---|
| KPASS | Nafion | Cooler | ||||
| 1 | Methyl ethyl ketone [19,21] | 25 °C, 80%RH, 100 ppb | 0.2 | 103 | 7.5 | 100 |
| 2 | Isobutyl alcohol [19,21] | 25 °C, 80%RH, 100 ppb | 0.2 | 96.6 | 21.4 | 91.7 |
| 3 | Methyl isobutyl ketone [19,21] | 25 °C, 80%RH, 100 ppb | 0.2 | 99.5 | 1.47 | 94.4 |
| 4 | Butyl acetate [19,21] | 25 °C, 80%RH, 100 ppb | 0.2 | 97.9 | 1.5 | 90.8 |
| 5 | Styrene [19,21] | 25 °C, 80%RH, 100 ppb | 0.2 | 99.2 | 82.8 | 88.6 |
| 6 | Benzene [22] | 25 °C, 90%RH, 200 ppb | 0.5 | 97 | 98 | 97 |
| 7 | Toluene [22] | 25 °C, 90%RH, 200 ppb | 0.5 | 97 | 88 | 97 |
| 8 | Ethylbenzene [22] | 25 °C, 90%RH, 200 ppb | 0.5 | 97 | 97 | 97 |
| 9 | p-xylene [22] | 25 °C, 90%RH, 200 ppb | 0.5 | 98 | 97 | 96 |
| 10 | Ozone [20] | 25 °C, 80%RH, 100 ppb | 1 | 97 | 94 | - |
| 11 | SO2 [17] | 25 °C, 80%RH, 150 ppb | 1 | 100 | - | 93 |
| 12 | CO [17] | 25 °C, 80%RH, 25 ppm | 1 | 98 | - | 93.6 |
| 13 | TCE (this study) | 25 °C, 90%RH, 0.5 ppm | 1 | 98 | 96 | 91 |
| 14 | TCE (this study) | 25 °C, 90%RH, 50 ppm | 1 | 100 | 95 | 92 |
| 15 | TCE (this study) | 150 °C, 20%v/v, 0.5 ppm | 1 | 97 | 96 | 90 |
| 16 | TCE (this study) | 150 °C, 20%v/v, 50 ppm | 1 | 98 | 96 | 94 |
| 17 | N2O (this study) | 25 °C, 90%RH, 100 ppm | 1 | 98 | 98 | 85 |
| 18 | N2O (this study) | 25 °C, 90%RH, 10,000 ppm | 1 | 98 | 97 | 86 |
| 19 | N2O (this study) | 150 °C, 20%v/v, 100 ppm | 1 | 100 | 100 | 96 |
| 20 | N2O (this study) | 150 °C, 20%v/v, 10,000 ppm | 1 | 99 | 100 | 92 |
| 21 | TCE (this study) | 25 °C, 90%RH, 50 ppm | 4 | 99.7 | - | - |
| 22 | TCE (this study) | 150 °C, 20%v/v, 50 ppm | 4 | 98.2 | - | - |
| 23 | N2O (this study) | 25 °C, 90%RH, 10,000 ppm | 4 | 100.7 | - | - |
| 24 | N2O (this study) | 150 °C, 20%v/v, 10,000 ppm | 4 | 100.6 | - | - |
Disclaimer/Publisher’s Note: The statements, opinions and data contained in all publications are solely those of the individual author(s) and contributor(s) and not of MDPI and/or the editor(s). MDPI and/or the editor(s) disclaim responsibility for any injury to people or property resulting from any ideas, methods, instructions or products referred to in the content. |
© 2025 by the authors. Licensee MDPI, Basel, Switzerland. This article is an open access article distributed under the terms and conditions of the Creative Commons Attribution (CC BY) license (https://creativecommons.org/licenses/by/4.0/).
Share and Cite
Baek, D.-H.; Park, B.-G.; Lee, S.-W.; Dinh, T.-V.; Kim, J.-C. Investigation into the Best Available Moisture Pretreatment Approach for the Measurement of Trichloroethylene and Nitrous Oxide Emitted from Semiconductor Industries. Atmosphere 2025, 16, 468. https://doi.org/10.3390/atmos16040468
Baek D-H, Park B-G, Lee S-W, Dinh T-V, Kim J-C. Investigation into the Best Available Moisture Pretreatment Approach for the Measurement of Trichloroethylene and Nitrous Oxide Emitted from Semiconductor Industries. Atmosphere. 2025; 16(4):468. https://doi.org/10.3390/atmos16040468
Chicago/Turabian StyleBaek, Da-Hyun, Byeong-Gyu Park, Sang-Woo Lee, Trieu-Vuong Dinh, and Jo-Chun Kim. 2025. "Investigation into the Best Available Moisture Pretreatment Approach for the Measurement of Trichloroethylene and Nitrous Oxide Emitted from Semiconductor Industries" Atmosphere 16, no. 4: 468. https://doi.org/10.3390/atmos16040468
APA StyleBaek, D.-H., Park, B.-G., Lee, S.-W., Dinh, T.-V., & Kim, J.-C. (2025). Investigation into the Best Available Moisture Pretreatment Approach for the Measurement of Trichloroethylene and Nitrous Oxide Emitted from Semiconductor Industries. Atmosphere, 16(4), 468. https://doi.org/10.3390/atmos16040468