Abstract
Visibility is a fundamental meteorological parameter critical for surface transportation, aviation, maritime navigation, and weather process investigation. Scattering visibility meters are extensively utilised for their simple design and rapid response; however, their measurement principle is inherently limited, as they only quantify the scattering coefficient without assessing the absorption coefficient, potentially causing measurement errors. The World Meteorological Organisation (WMO) posits that the atmospheric absorption coefficient is usually relatively small and can be neglected, justifying the approximation of the extinction coefficient by the scattering coefficient. However, as black carbon is the predominant light-absorbing component in the atmosphere, an increase in its mass concentration markedly alters the atmospheric absorption coefficient, considerably impacting the accuracy of scattering-based visibility meters. Based on Mie scattering theory and incorporating both field observations and laboratory data, we systematically examined the effects of black carbon and its interactions with other aerosol components on the measurement errors of scattering visibility meters. Our findings revealed that the impact of black carbon on measurement errors is substantial, and under certain conditions, particularly pronounced. This influence is not only dependent on the mass concentration of black carbon but also closely associated with aerosol size distribution, mixing state, and the characteristics of other scattering aerosols. Due to the spatiotemporal variability of these factors, the impact of black carbon on visibility errors is uncertain. Therefore, during the calibration of scattering-based visibility meters, the effects of black carbon and its associated factors must be considered to enhance measurement accuracy. We propose calibration recommendations for scattering-based visibility meters aimed at reducing measurement errors and improving the accuracy of visibility assessments.
1. Introduction
Visibility is a fundamental atmospheric parameter playing a pivotal role in assessing atmospheric transparency [1]. It holds significant implications across various domains, including ground transportation, aviation, and maritime operations [2], as well as meteorological and environmental research [3,4]. Scattering-based visibility meters are among the most widely employed instruments, valued for their straightforward design, quick response times, and user-friendly operation [5,6,7]. However, the underlying measurement principle constrains scattering-based visibility meters to quantify only the scattering coefficient of atmospheric particulates, rendering them incapable of measuring the absorption coefficient, which may consequently lead to errors in visibility estimation.
Accordingly, the World Meteorological Organisation (WMO) [8,9], in its Guide to Meteorological Instruments and Observation Methods, contends that under typical conditions the atmospheric absorption coefficient is sufficiently minor to be deemed negligible, thereby permitting the scattering coefficient to serve as a proxy for the extinction coefficient. Nonetheless, the guide neither quantifies the magnitude of the resultant error component nor offers any targeted calibration recommendations to rectify this shortcoming.
Black carbon (BC) is the dominant light-absorbing constituent in the atmosphere [10,11], and any increase in its emissions inevitably results in a corresponding enhancement of the atmospheric absorption coefficient. Theoretically, when the absorption coefficient constitutes a substantial proportion of the total extinction coefficient, the measurement error of scattering-based visibility meters increases markedly [12,13]. Consequently, it is imperative to conduct an in-depth investigation into the extent of the impact of black carbon on the measurement errors associated with scattering-based visibility meters.
The influence of black carbon on the absorption coefficient is primarily reflected in two aspects. First, the significant variation in its mass concentration. In 2017, the average mass concentration of BC across 49 monitoring sites in China ranged from 0.12 to 12.31 μg∙m−3, exhibiting clear seasonal variations—with concentrations in spring being 40% and 80% lower than in summer and winter, respectively [14]. In urban regions with severe air pollution, BC concentrations show significant seasonal and event-driven variability. For instance, during four haze episodes in Beijing in January 2013, Sun et al. [15] observed black carbon mass concentrations of 11.2, 16.0, 19.7, and 9.9 μg∙m−3, which were approximately 10 times higher than those recorded during periods of cleaner air. Similar findings have been reported by Hu et al. [16], who measured black carbon concentrations in Beijing at 0.9 ± 0.8 μg∙m−3 and 10.0 ± 4.1 μg∙m−3 during clean and polluted periods, respectively. Marinoni et al. [17] measured black carbon concentrations in the southern Himalayas at an elevation of 5079 m, observing values of less than 0.6 μg∙m−3 before the monsoon and below 0.1 μg∙m−3 during the monsoon season—significantly lower than those in urban and rural areas. These observations indicate the considerable regional variability in black carbon mass concentrations, as well as the pronounced temporal and spatial fluctuations in its distribution.
Second, the influence of black carbon on the absorption coefficient is also reflected in the large variability of its mass absorption coefficient (MAC). The MAC of black carbon varies between 5 and 58.2 m2∙g−1 depending on the source [18,19,20,21]. For instance, Bond and Bergstrom [18] reported that the MAC of fresh black carbon emitted from most fossil fuel combustion sources ranges between 5 and 13 m2∙g−1. Saliba et al. [19] repeatedly measured the MAC of fresh black carbon particles from stove sources at a wavelength of 550 nm, with values of 8.5 m2∙g−1, 7.2 m2∙g−1, and 7.4 m2∙g−1, consistent with those of the measurements of Bond and Bergstrom [18], who reported a median value of 7.5 ± 1.2 m2∙g−1 for fresh smoke. In Brazil, Martins et al. [20] measured the MAC of black carbon particles produced from various biomass-burning sources in cloud–smoke–radiation experiments, with values ranging from 5.2 to 58.2 m2∙g−1.
The mass concentration and MAC of black carbon exhibit considerable variation across different regions and seasons, resulting in significant fluctuations in its absorption coefficient within the atmospheric environment. This inherent variability introduces substantial uncertainty in assessing the impact of black carbon on visibility errors. The influence of black carbon on visibility errors is not only determined by the magnitude of its absorption coefficient, but also by the proportion of the absorption coefficient of black carbon within the total extinction coefficient. Research showed that the contribution of the absorption coefficient of black carbon to the total extinction coefficient is influenced by variations in the concentration and physicochemical properties of other atmospheric aerosols [22,23,24]. Specifically, other aerosol components in the atmosphere, such as sulphates, nitrates, and organic aerosols, contribute to the total extinction coefficient predominantly through scattering. Variations in the concentration and physicochemical properties of these aerosols alter the relative contribution of the absorption coefficient of black carbon to the total extinction coefficient, thereby affecting the accuracy of visibility measurements. Therefore, when assessing the impact of black carbon on visibility errors, it is imperative to account for the scattering contributions of other aerosol components.
Simultaneously, the concentration and composition of aerosol components in the atmospheric environment show significant variability, which can result in an enhanced contribution of the absorption coefficient of black carbon to the total extinction, thus reducing the accuracy of visibility measurements. The complexity and uncertainty associated with these factors present considerable challenges in evaluating the impact of black carbon on visibility errors.
Here, we utilised Mie scattering theory, combined with field and laboratory measurements of aerosol physicochemical properties, mass concentration, and optical characteristics, to investigate the absorption coefficient contribution (ACC) from various particle sizes, size distributions, black carbon mass fractions, and mixing states, as well as their effects on visibility relative error (Er). Our study underscores the necessity of accounting for the influence of black carbon during the calibration of scattering-based visibility meters.
2. Materials and Methods
2.1. Calculation for Er in Visibility Meters
The absorption coefficient is an optical property describing the ability of different aerosol particles to absorb solar radiation. The impact of the aerosol absorption coefficient on the relative error (Er) can be calculated using Equation (1):
In Equation (1), V represents visibility, with the subscripts real and meas referring to the true and measured visibility values, respectively. ACC represents the contribution of the absorption coefficient to the extinction, while bext is the total extinction coefficient of the atmosphere, which specifically accounts for the aerosol extinction within the atmospheric environment. ε is the contrast sensitivity threshold, which is defined as the minimum brightness contrast required to distinguish an object from its background.
We focused solely on the contribution of aerosol particles to the extinction coefficient, assuming that black carbon is the only light-absorbing substance. Under this assumption, the ACC is calculated using either Equation (2) or (3). Equations (2) and (3) are applied for ACC calculation in the external mixing model and the core–shell model, respectively.
In Equations (2) and (3), MAC and MEC represent the mass absorption coefficient and mass extinction coefficient (MEC), respectively. The subscripts BC, Other, and Shell denote the optical properties of black carbon, other aerosol components, and the black carbon core when encapsulated by a shell, respectively. MASSBC represents the mass concentration fraction of black carbon. Table 1 outlines the calculation methods for the MAC and MEC under different scenarios. The optical efficiency factors for single homogeneous spherical and core–shell particles are computed using the Mie scattering package developed by Christian Mätzler [25] and the MatScat package developed by Schäfer (the program is available for download at https://www.mathworks.com/matlabcentral/fileexchange/36831-matscat 17 April 2025). For the calculations, the wavelength λ is set to 550 nm, and the refractive indices of black carbon and scattering aerosol particles were 1.95 − 0.79i and 1.53, respectively.

Table 1.
Calculation formulas for key optical parameters.
- D represents the particle diameter, with the calculation range from 0.01 to 10 μm and a step size of 0.001 μm.
- Qext and Qabs are the extinction efficiency factor and absorption efficiency factor, respectively. ρ is the density, with values for black carbon and scattering aerosol particles set at 1.8 g∙cm−3 and 1.2 g∙cm−3, respectively.
- n(D) is the aerosol size distribution function, representing the number of aerosol particles per unit volume within an infinitesimally small size interval from D to D + ΔD.
2.2. Data Sources
We utilised observational data and computational results from relevant studies, with the data sources categorised into two parts:
- Field Observation Data: The data are derived from the “Vertical Distribution, Physicochemical Coupling, and Meteorological Effects of Fine Particulate Matter and Ozone in the Yangtze River Delta” project, conducted from 4 August to 22 September 2016, at the Nanjing University Gulou Station (32.05° N, 118.78° E). During this period, black carbon mass concentration, PM2.5 particle mass concentration, and atmospheric scattering coefficients were measured every 5 min. The station is located on the rooftop of an 80 m tall teaching building at the Gulou campus of Nanjing University, with an elevation of 20 m. Situated in an urban area, the primary pollution sources around the station are vehicle emissions and residential activities.
- Non-absorptive Aerosols in Typical Regions (Figure 1, Figure 2 and Figure 3): The particle size distribution data were obtained from Hussein et al. [24] and Guo [3], which provided tri-modal fits and normalised number spectra for aerosols in urban, marine, rural, and remote land regions. These data were then used to calculate the mass scattering coefficient (MSC).
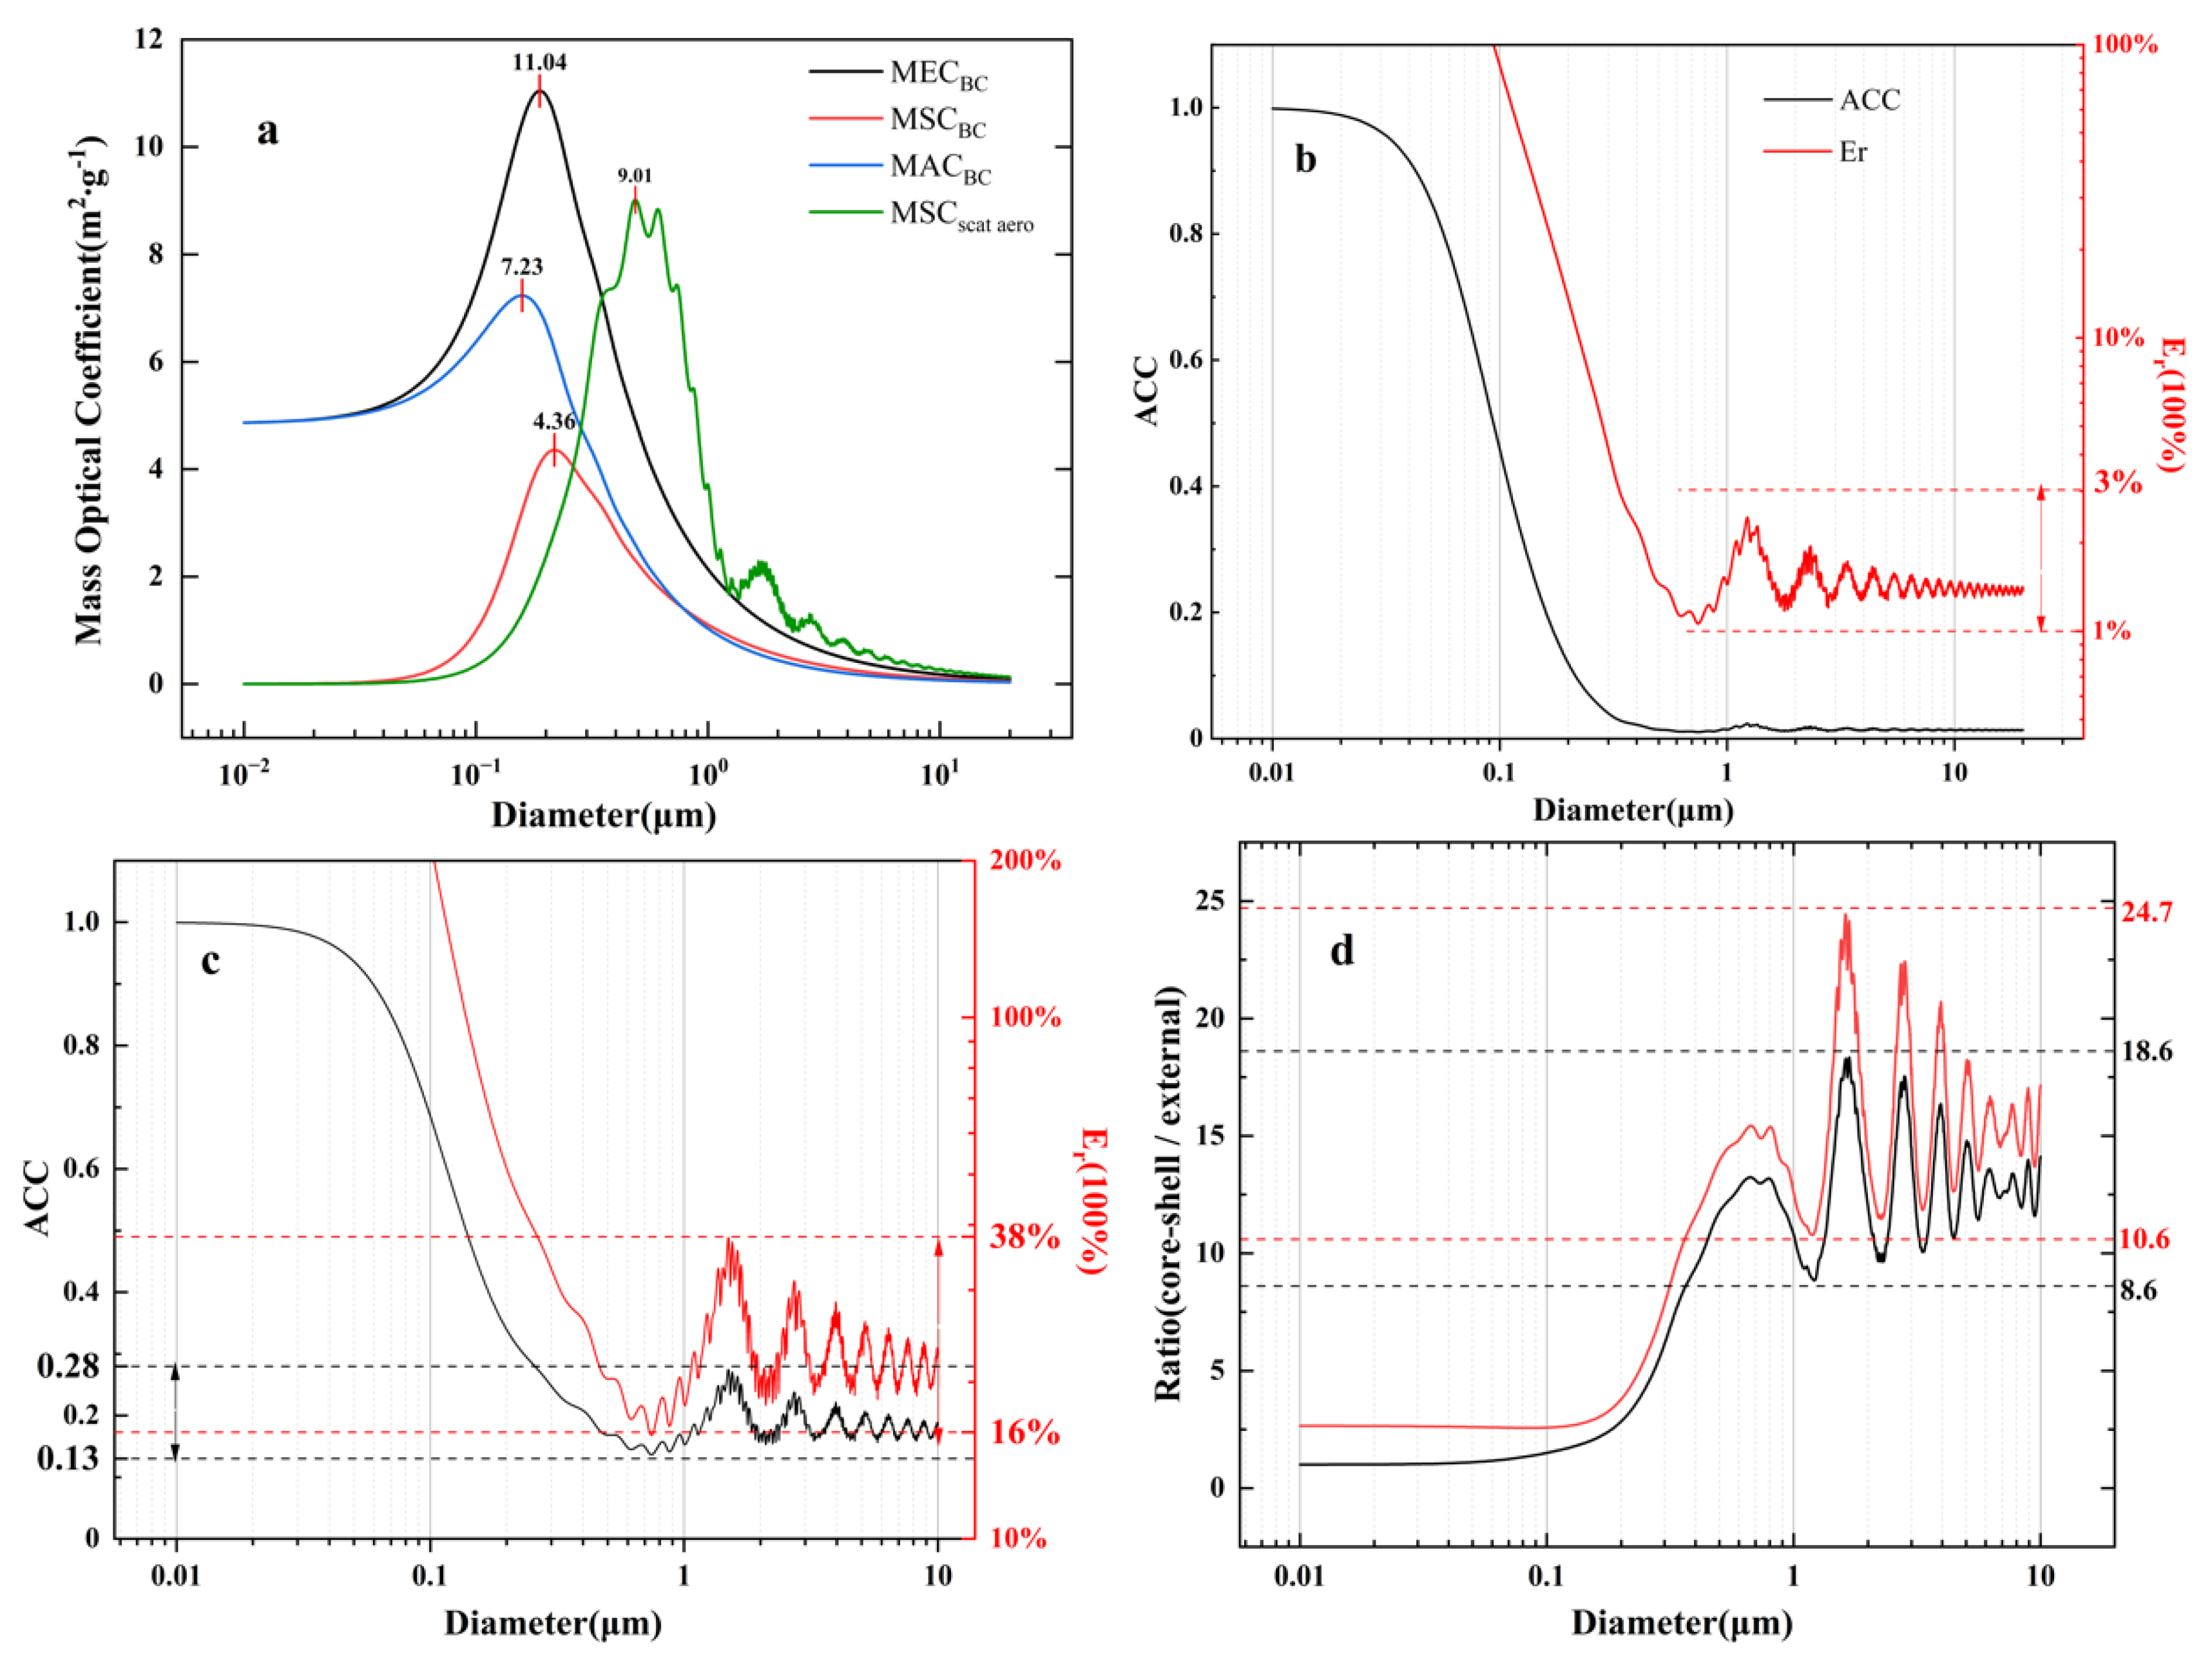
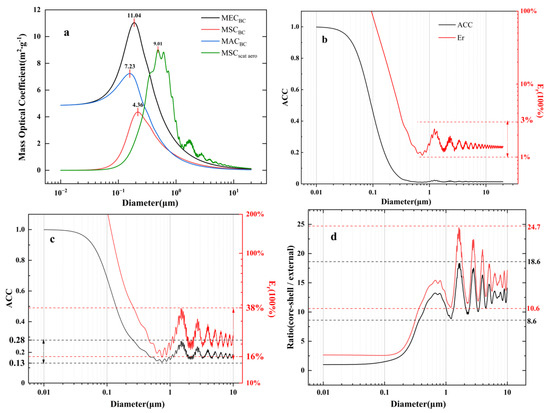 Figure 1. Influence of black carbon on visibility measurement error in monodisperse aerosol system. (a) Variation in MAC, MSC, and MEC for black carbon and MSC for non-absorptive aerosols as a function of particle size. (b) Effect of particle size on ACC and Er (5% BC mass concentration) in the external mixing model. (c) Effect of particle size on ACC and Er (5% BC mass concentration) in the core−shell model. (d) Comparative analysis of ACC and Er between the external mixing and core−shell models.
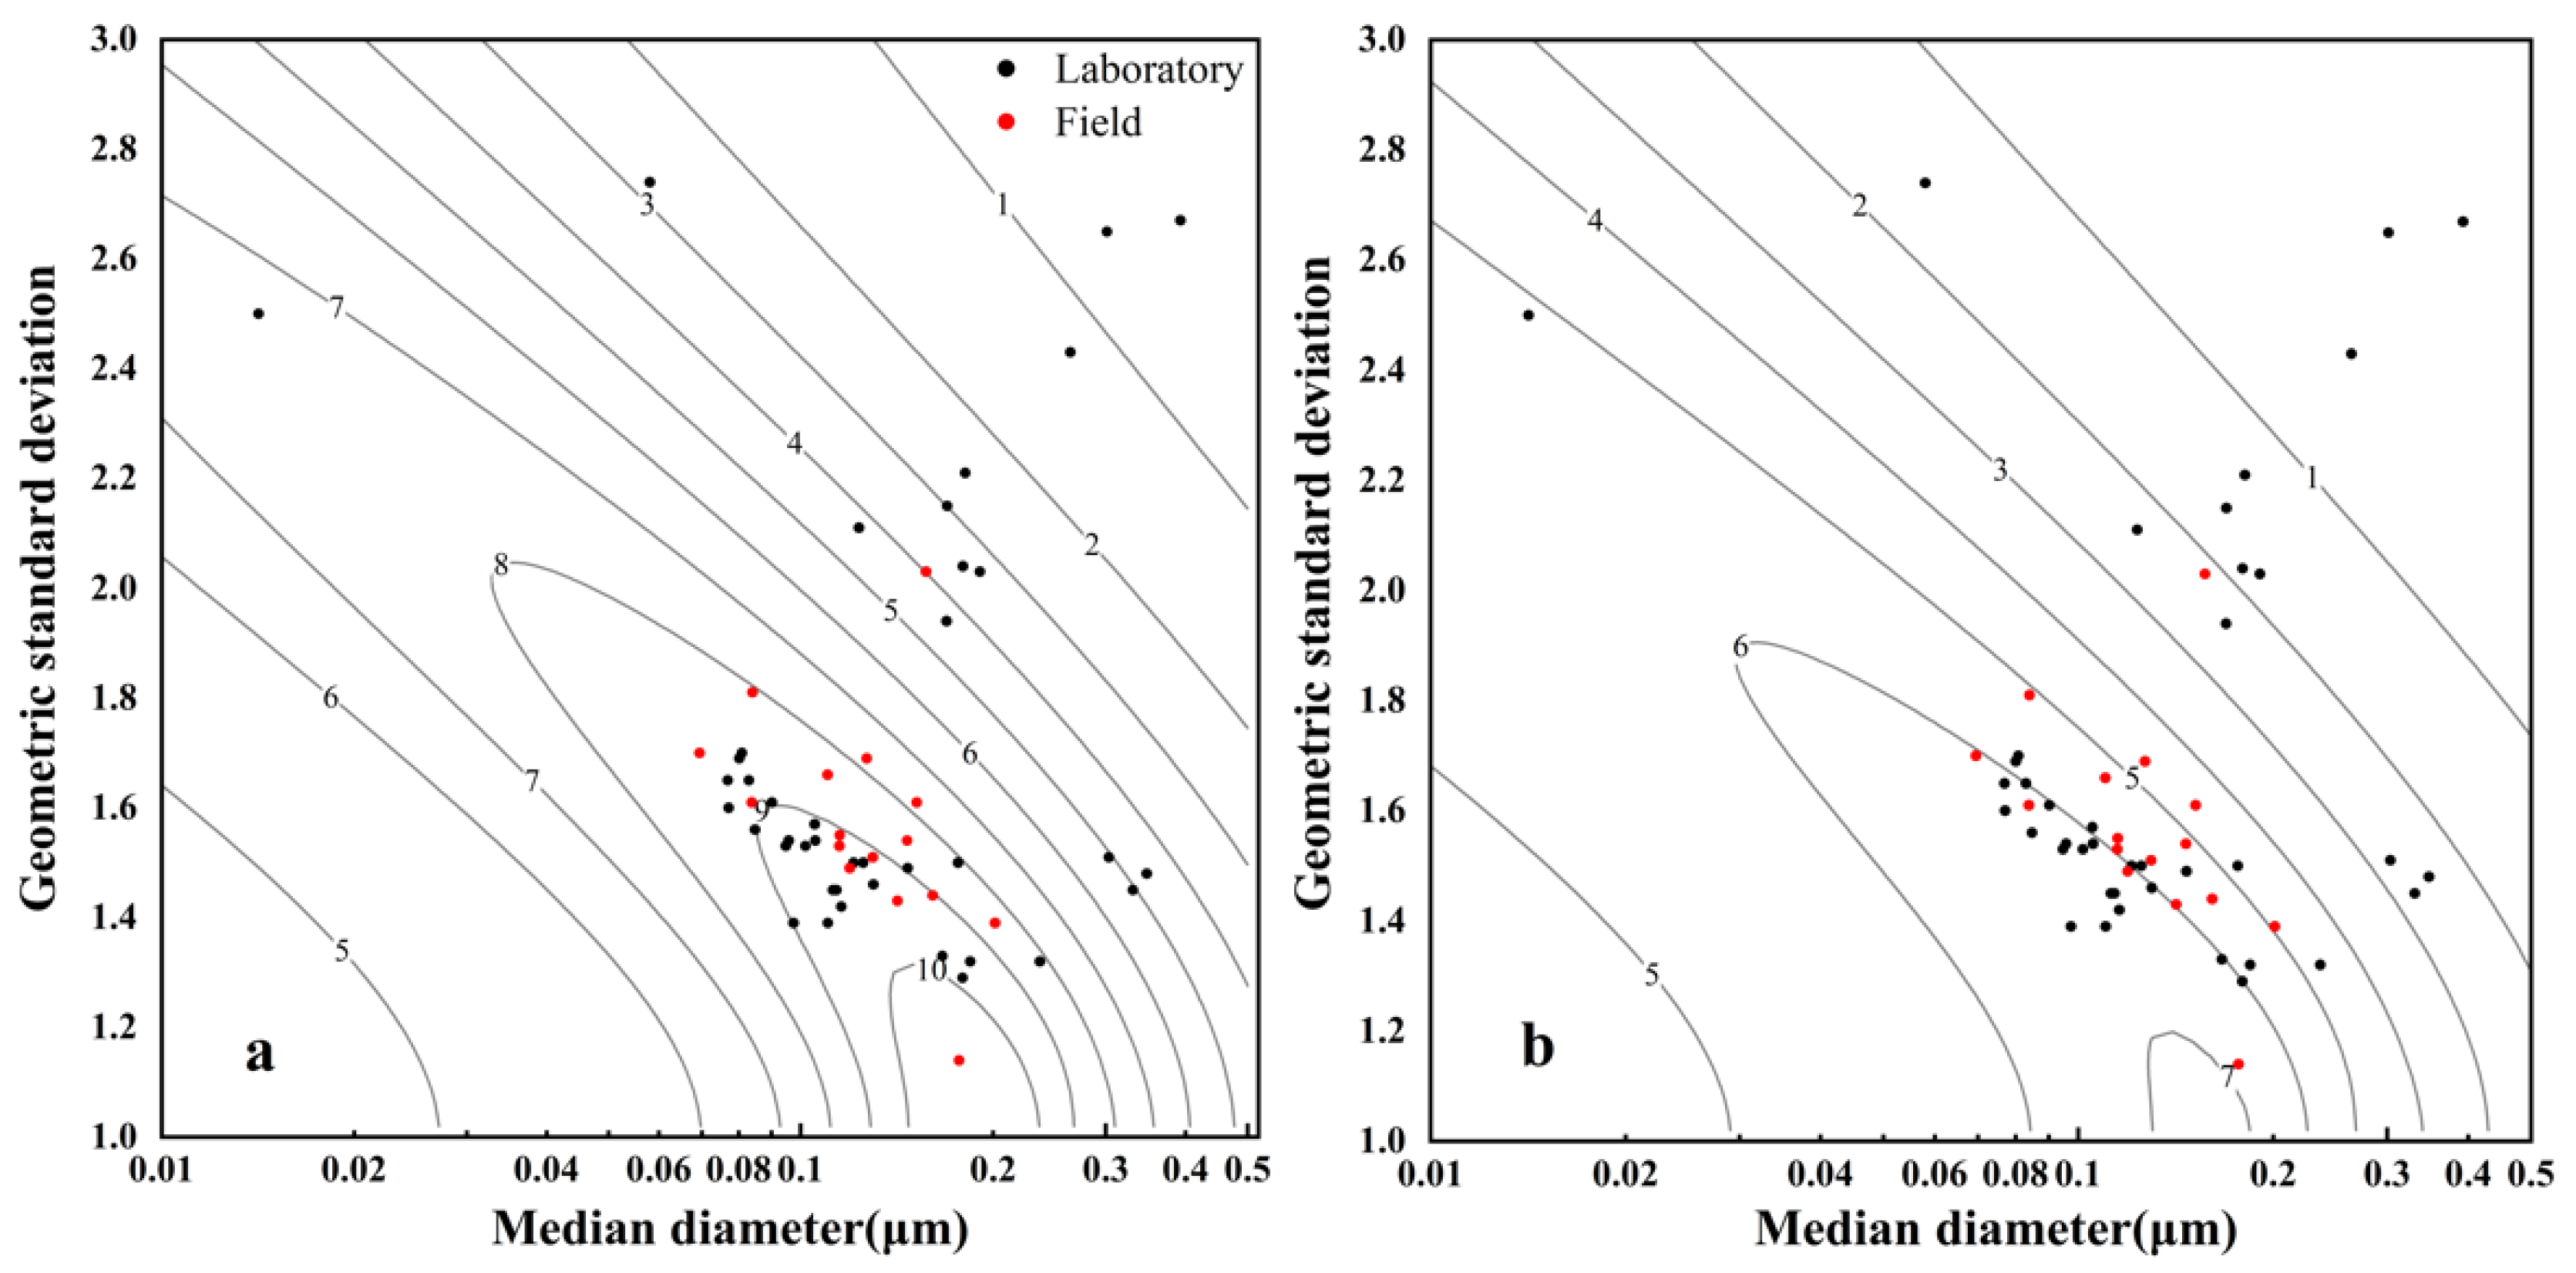
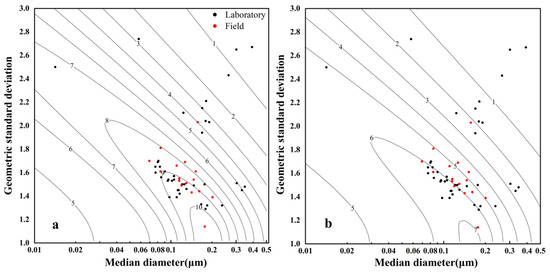 Figure 2. Differences in optical properties of black carbon across varying particle size distributions. (a) MEC; (b) MAC. Black dots indicate laboratory measurements, while red dots correspond to field observations.
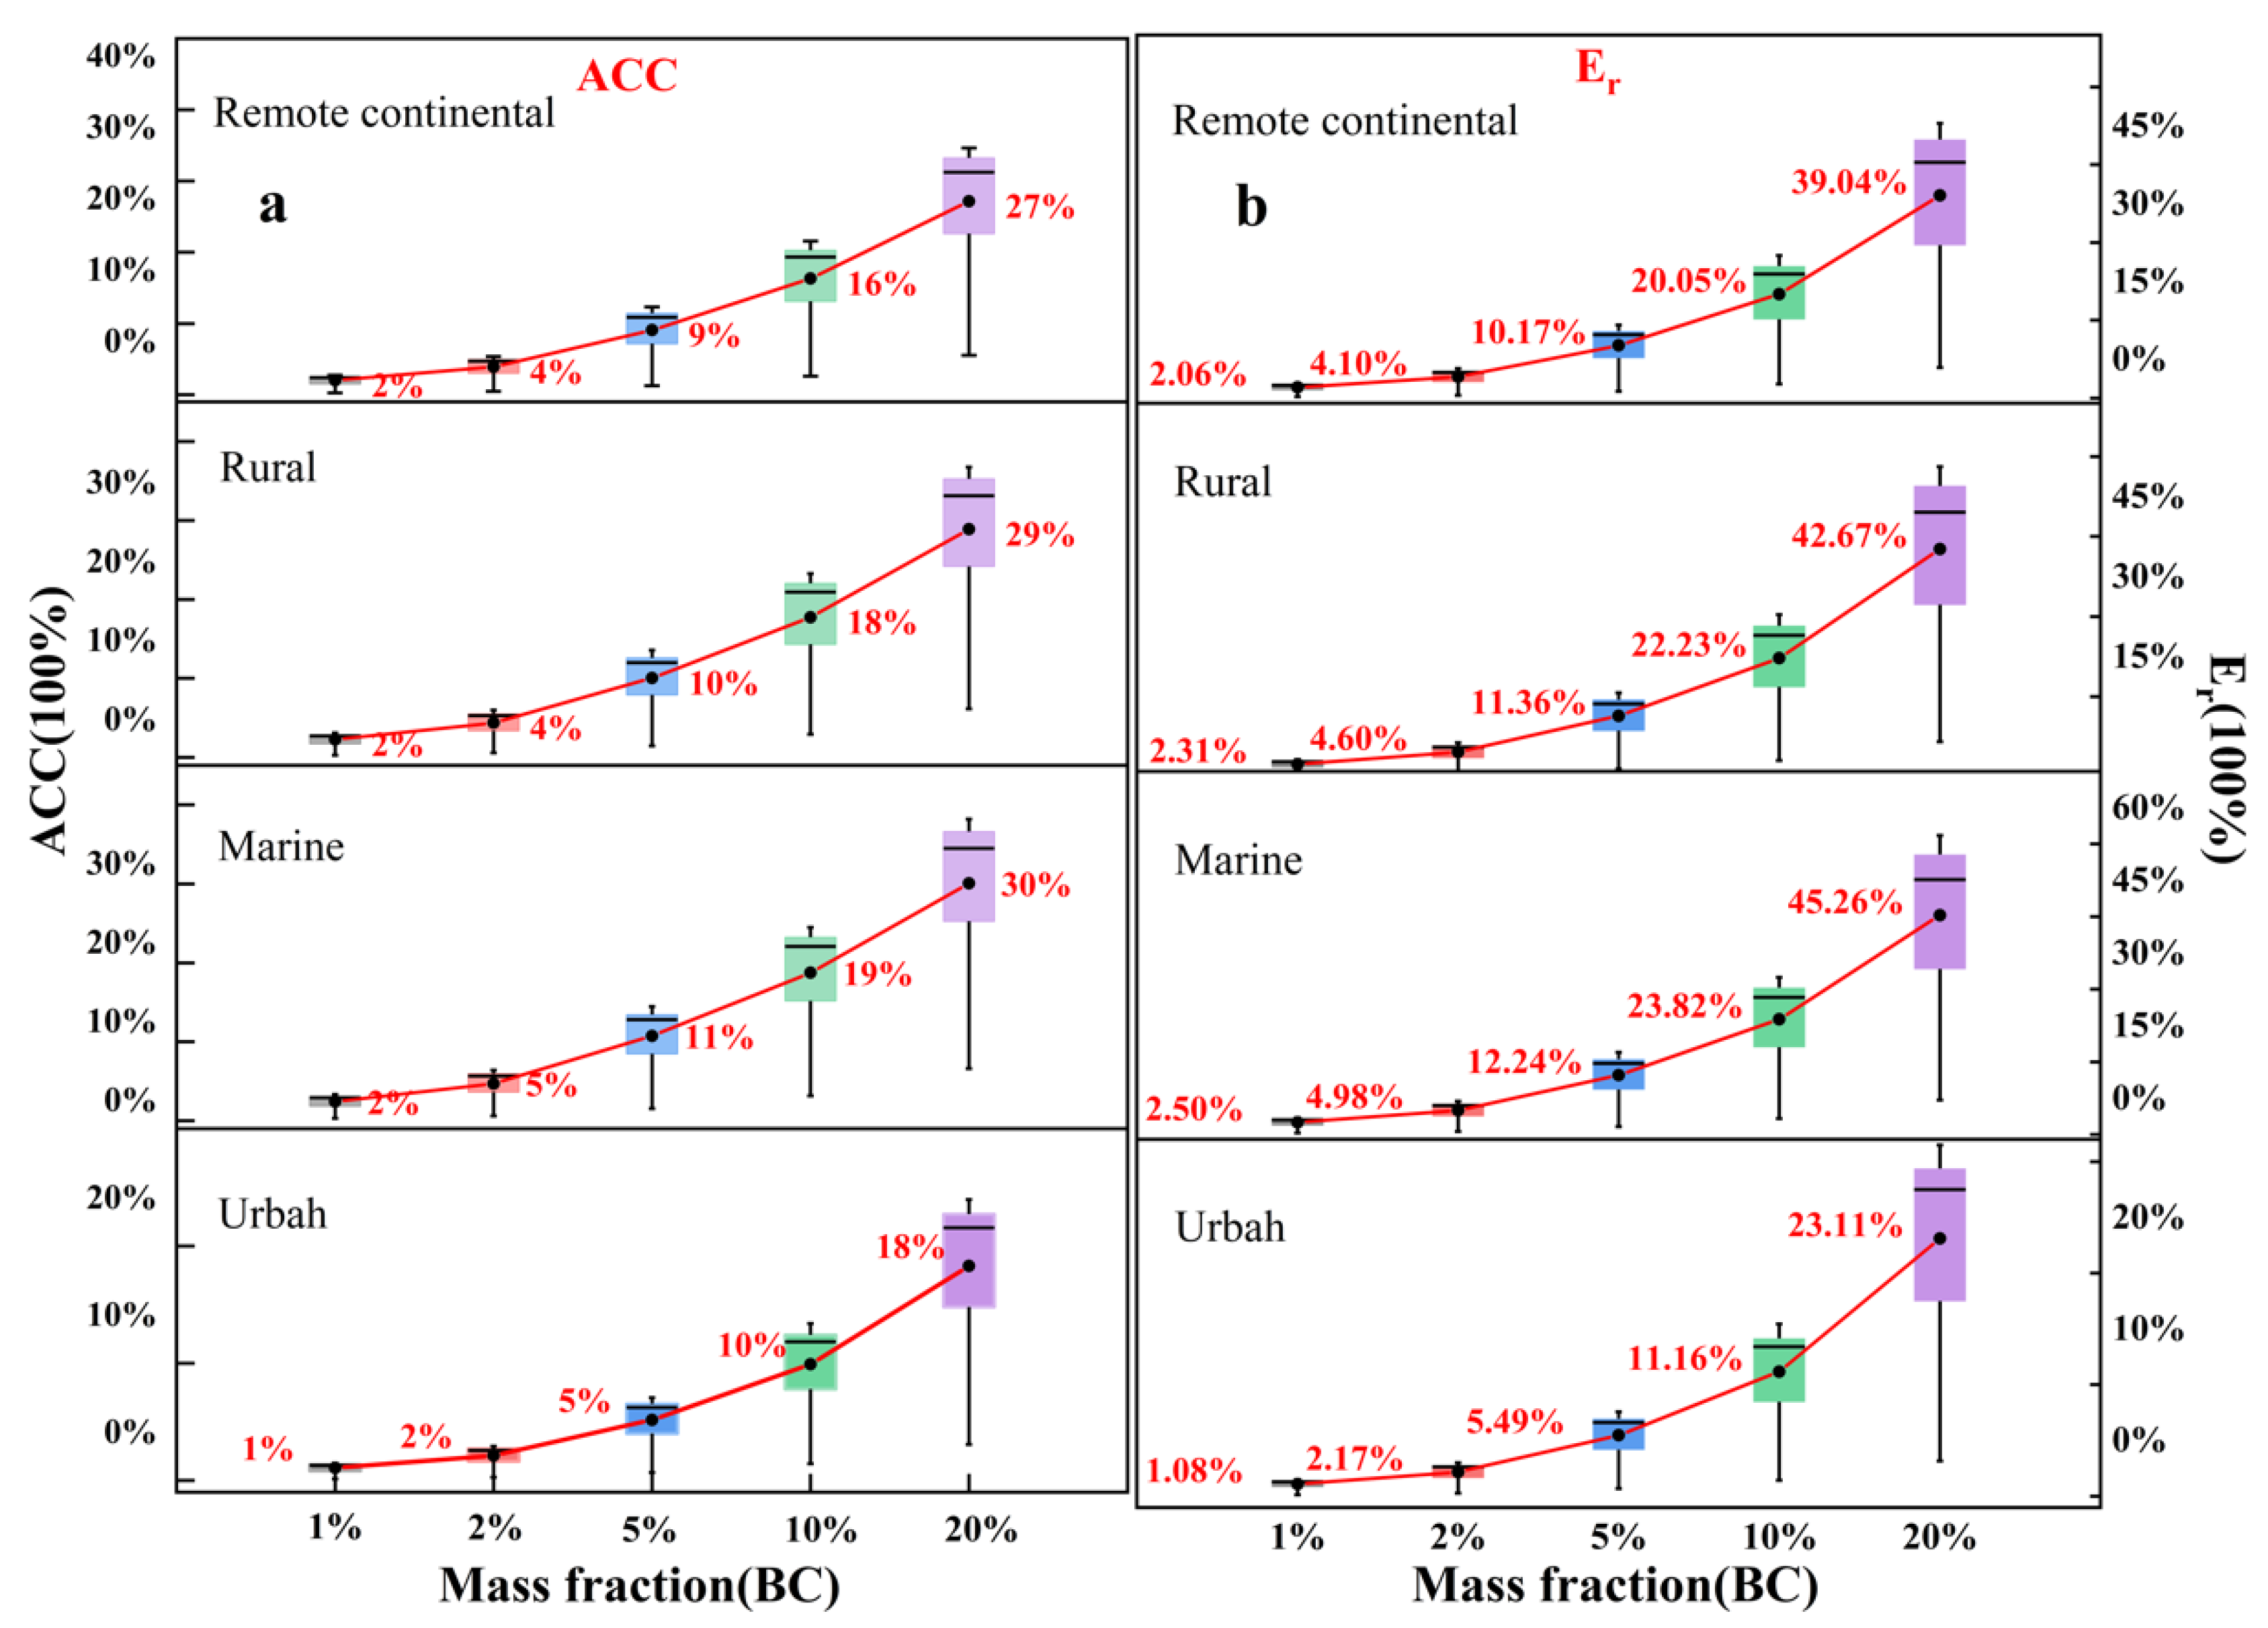
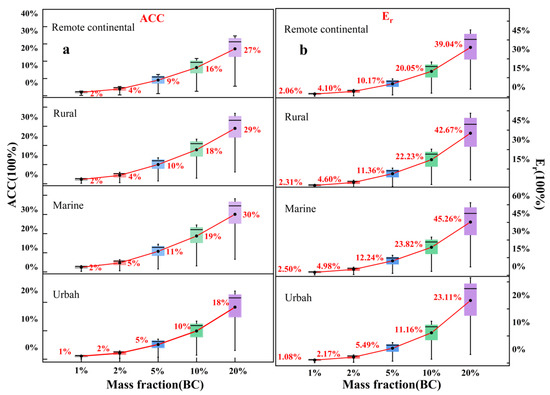 Figure 3. Distribution of ACC and Er in typical regions at varying mass fractions of black carbon. (a) ACC; (b) Er.
3. Results and Discussion
3.1. Impact of Black Carbon on Er in Scattering-Based Visibility Meters Under Monodisperse Conditions
Under monodisperse conditions, the influence of black carbon on the Er in scattering-based visibility meters is primarily manifested in two aspects: particle size and mixing state. This section will analyse the optical properties of monodisperse black carbon under different particle sizes and mixing states, and explore the specific mechanisms of its impact on Er.
First, particle size significantly affects both the optical properties of black carbon and Er. Figure 1a shows the variations in the MAC, MSC, and MEC for monodisperse black carbon at different particle sizes. The results indicate that the MAC of small-sized black carbon is much higher than that of the MSC, suggesting that absorption dominates. For larger black carbon particles, the MSC increases, and the absorption effect weakens relative to scattering. This size dependence is the primary factor responsible for the varying effects of black carbon on visibility error across different particle sizes. Figure 1b further reveals the impact of black carbon on the ACC and Er as a function of particle size, when the mass concentration of black carbon in the external mixing model is 5%. For small particle sizes, the contribution of black carbon to absorption is close to 100%, resulting in an Er exceeding 100%. As particle size increases, the impact on both ACC and Er gradually decreases. In the larger particle size range (700–10,000 nm), the absorption contribution gradually decreases and stabilises, with the Er fluctuating between 1 and 3%. As the particle size increases, the fluctuations initially oscillate but progressively stabilise, with the values remaining lower compared with those in the smaller particle size range. This indicates that particle size is a key factor influencing the Er caused by black carbon.
Second, the mixing state also has a significant effect on the optical properties of black carbon and Er. Figure 1c illustrates the variation in the ACC and Er with particle size for black carbon in the core–shell model, when the mass concentration is 5%. A comparison with Figure 1b reveals that the trends with particle size are similar. However, due to the prism effect, which enhances the absorption capability of black carbon, the Er caused by black carbon in the core–shell model is generally higher than that in the external mixing model at the same particle size, with a particularly significant difference at the larger particle sizes. Figure 1d presents the comparison between the two models.
A comprehensive analysis of Figure 1b–d reveals that particle size and mixing state are key factors influencing the Er caused by black carbon. Smaller particle sizes of black carbon, due to their higher absorption coefficients, result in a larger Er, while the mixing state (external mixing and core–shell models) further modulates this error. Although the core–shell model shows significantly higher errors at larger particle sizes compared with those of the external mixing model, particle size remains the dominant factor affecting visibility error. Considering that aerosol particles in the atmosphere do not exist in a monodisperse state, it is essential to further analyse the impact of particle size distribution on the relative error in visibility (Er).
3.2. Impact of Particle Size Distribution on Er in Scattering-Based Visibility Meters
Due to the significant spatiotemporal variability in the particle size distributions of black carbon and aerosols, it is essential to select appropriate data for assessing their impact on Er. To comprehensively assess the impact of the particle size distribution of black carbon on Er, we integrate both actual observational and laboratory research data for calculation [26,27,28,29,30,31,32,33,34,35,36,37,38,39,40,41,42,43]. Figure 2 presents the values of MEC and MAC for black carbon under different particle size distributions. Based on the normalised particle size spectrum functions from Hussein et al. [44] and Guo et al. [3], the MEC values for background aerosols in different regions were calculated using the log-normal distribution formulas from Table 1: 4.43 m2∙g−1, 1.9 m2∙g−1, 2.06 m2∙g−1, and 2.32 m2∙g−1 for urban areas, marine regions, rural areas, and remote land regions, respectively, reflecting the characteristics of background aerosols in different regions. These historical data provide the foundation for subsequent analysis.
Figure 3 illustrates the impact of black carbon with different mass fractions on the ACC and Er in four typical regions with different particle size distributions.
First, as the mass fraction of black carbon increases, both the ACC and Er increase significantly, demonstrating that a higher black carbon concentration directly amplifies the measurement errors in scattering-based visibility meters. Second, for the same mass fraction, black carbon with varying particle size distributions results in prominent differences in both the ACC and Er. For instance, at the urban station, when the black carbon mass fraction reaches 10%, the resulting Er fluctuates between a maximum of 14.18% and a minimum of 8.4%. Further analysis shows that, even at the same mass fraction, regional differences in aerosol particle size distributions result in variations in both the ACC and Er. For example, in urban areas, when the black carbon mass fraction is 5%, the Er ranges around 5.49%, whereas in marine regions, the median value of Er at the same mass fraction reaches 12.24%. This indicates that the background aerosol conditions in different regions significantly affect the ACC and Er caused by black carbon.
The results in Figure 3 indicate that the particle size distribution and mass fraction of black carbon significantly impact both the ACC and Er. Additionally, the background aerosol conditions in different regions further influence these relationships. This can lead to significant influences on the measurement accuracy of scattering-based visibility meters due to the increased ACC of black carbon under specific conditions, underscoring the importance of assessing this effect in real-world observational studies.
3.3. Case Analysis of the Impact of Black Carbon on Er at Gulou Station During the Fall Season
To further elucidate the impact of black carbon on visibility error, we utilised observational data from the Nanjing Gulou Station, collected during the periods from 16 August to 13 September 2016 and from 24 November to 24 December, as a case study. The station is situated in an urban environment, with vehicular emissions and residential activities serving as the dominant sources of pollution. The observational data were obtained as part of the “Vertical Distribution, Physicochemical Coupling, and Meteorological Effects of Fine Particulate Matter and Ozone in the Yangtze River Delta” project, which involved the continuous measurement of black carbon mass concentration, PM2.5 mass concentration, and atmospheric scattering coefficients, with a temporal resolution of 5 min. These data provide essential insights for evaluating the ACC and Er of black carbon in a real-world atmospheric environment.
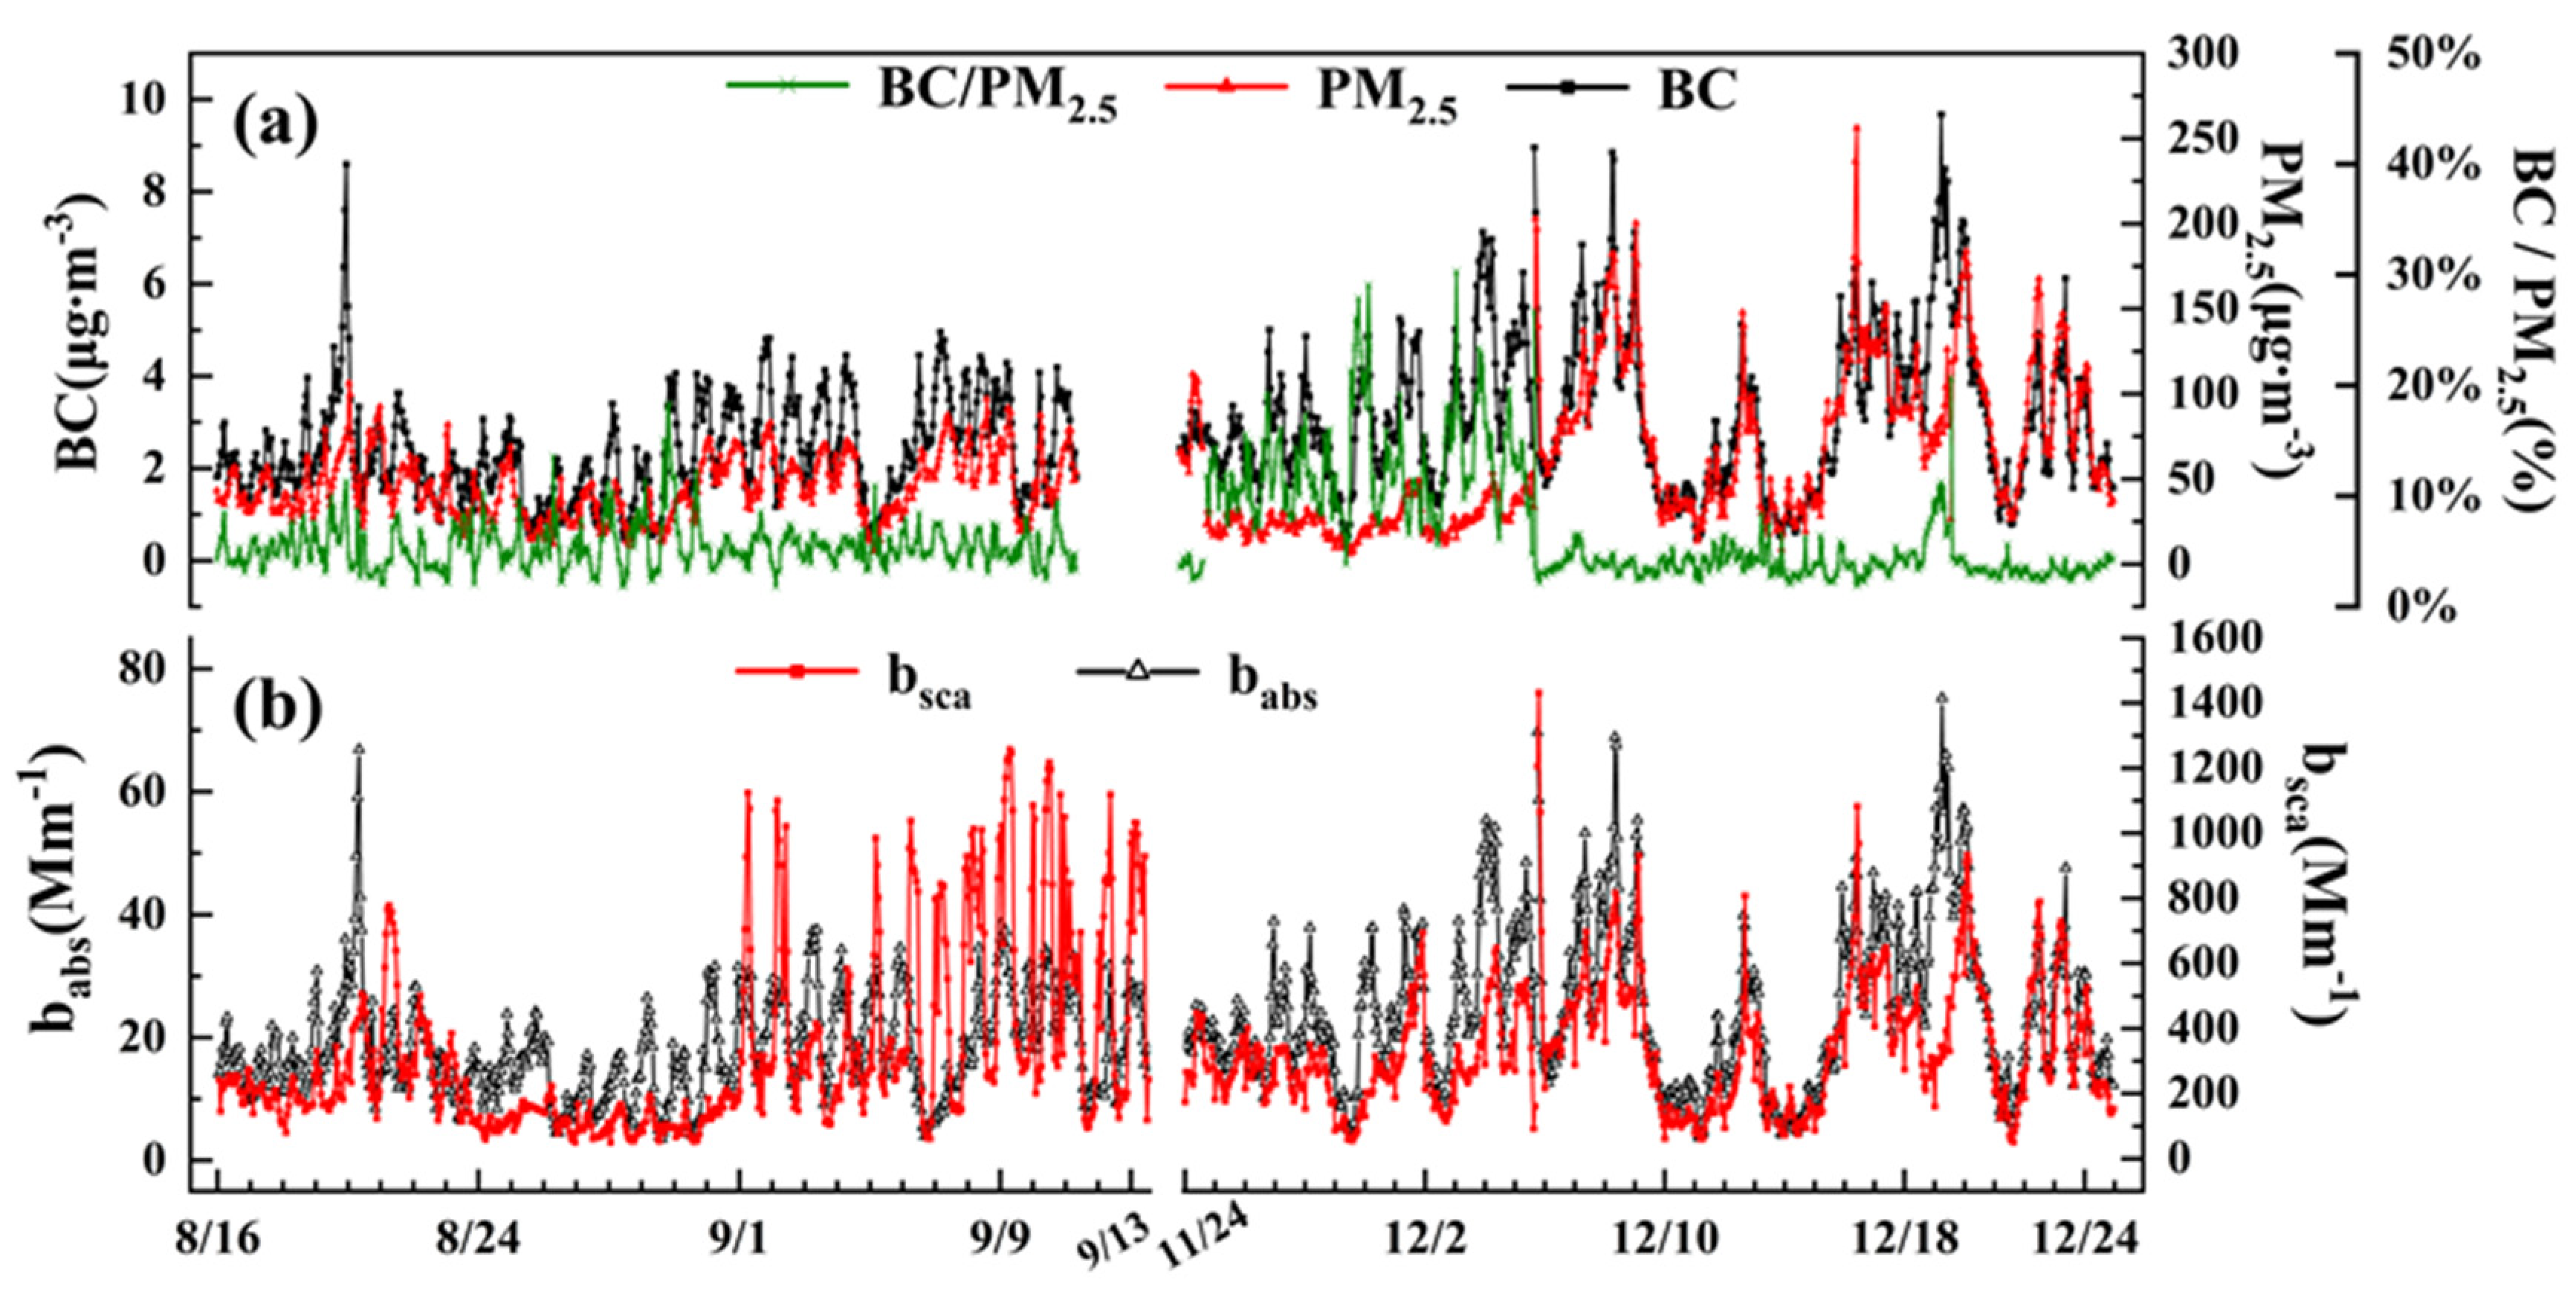
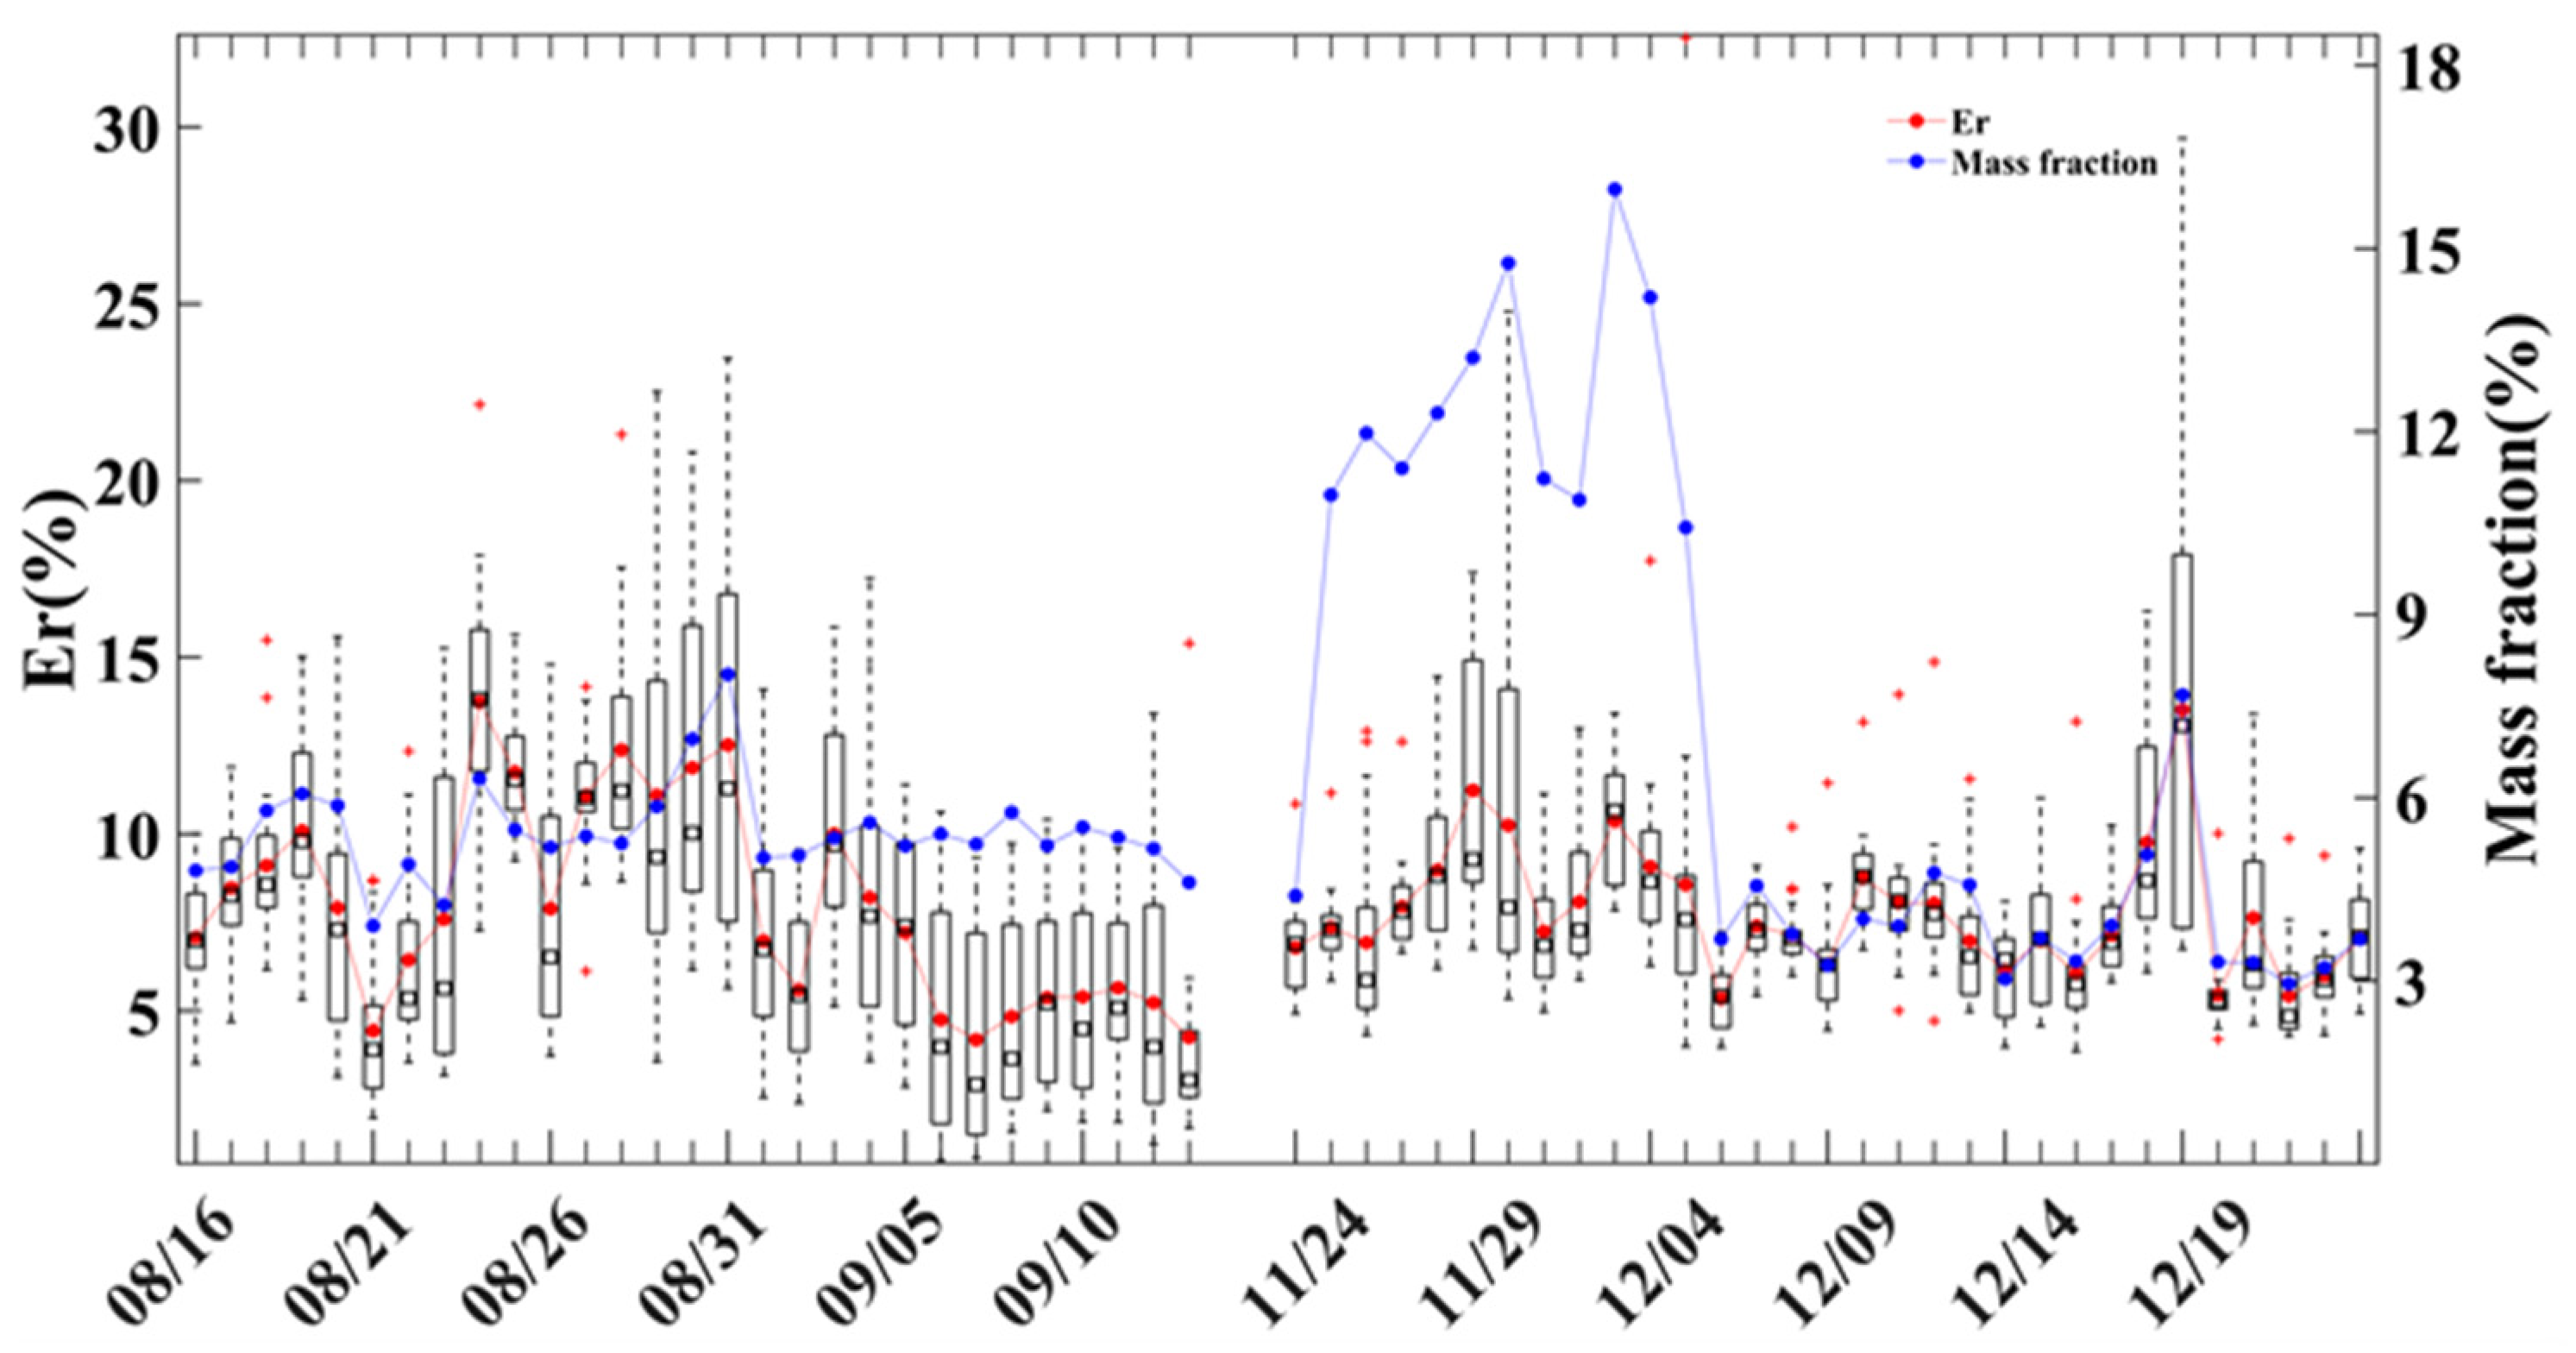
Figure 4a illustrates the temporal evolution of BC, PM2.5, and the mass fraction of black carbon within PM2.5 during the observation period. It is evident that the relative contribution of black carbon to PM2.5 varies with time. During the summer campaign, the average mass fraction of black carbon in PM2.5 was 5.4%, with a range spanning from 1.7 to 18.4%; conversely, in winter, the corresponding average was 7.5%, with observed values fluctuating between 1.8 and 30.3%. Figure 4b depicts the temporal variations in the atmospheric absorption and scattering coefficients over the same period. During summer, the mean absorption and scattering coefficients were 18.15 Mm−1 and 321.85 Mm−1, respectively, with maximum values of 66.85 Mm−1 and 1258.48 Mm−1, and minimum values of 3.59 Mm−1 and 50.15 Mm−1. In winter, the corresponding mean absorption and scattering coefficients were 24.65 Mm−1 and 339.76 Mm−1, respectively, with maximum values of 75.24 Mm−1 and 1432.47 Mm−1, and minimum values of 3.76 Mm−1 and 50.84 Mm−1. The findings regarding the mass concentration, mass fraction, and aerosol optical properties of black carbon during the summer observations are consistent with those reported by Ma and Shen et al. in Nanjing [45,46], whereas the winter results closely correspond with those of the findings from other studies [47,48,49]. Based on the data in Figure 4 and employing Equation (1), the temporal profiles of the black carbon absorption coefficient contribution (ACC) and the relative visibility error (Er) were computed, with the outcomes depicted in Figure 5.
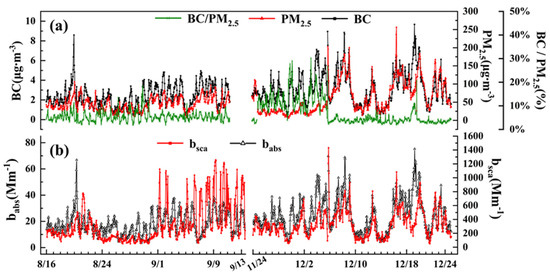
Figure 4.
Overview of aerosol conditions during the observation period. (a) Mass concentration level of aerosols and mass fraction in PM2.5 of BC. (b) Absorption and scattering coefficients in environmental aerosol.
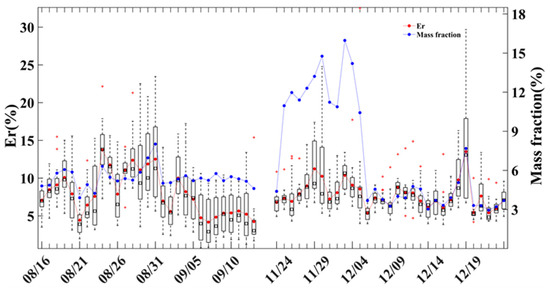
Figure 5.
Time series of Er and mass fraction of BC at Gulou Station.
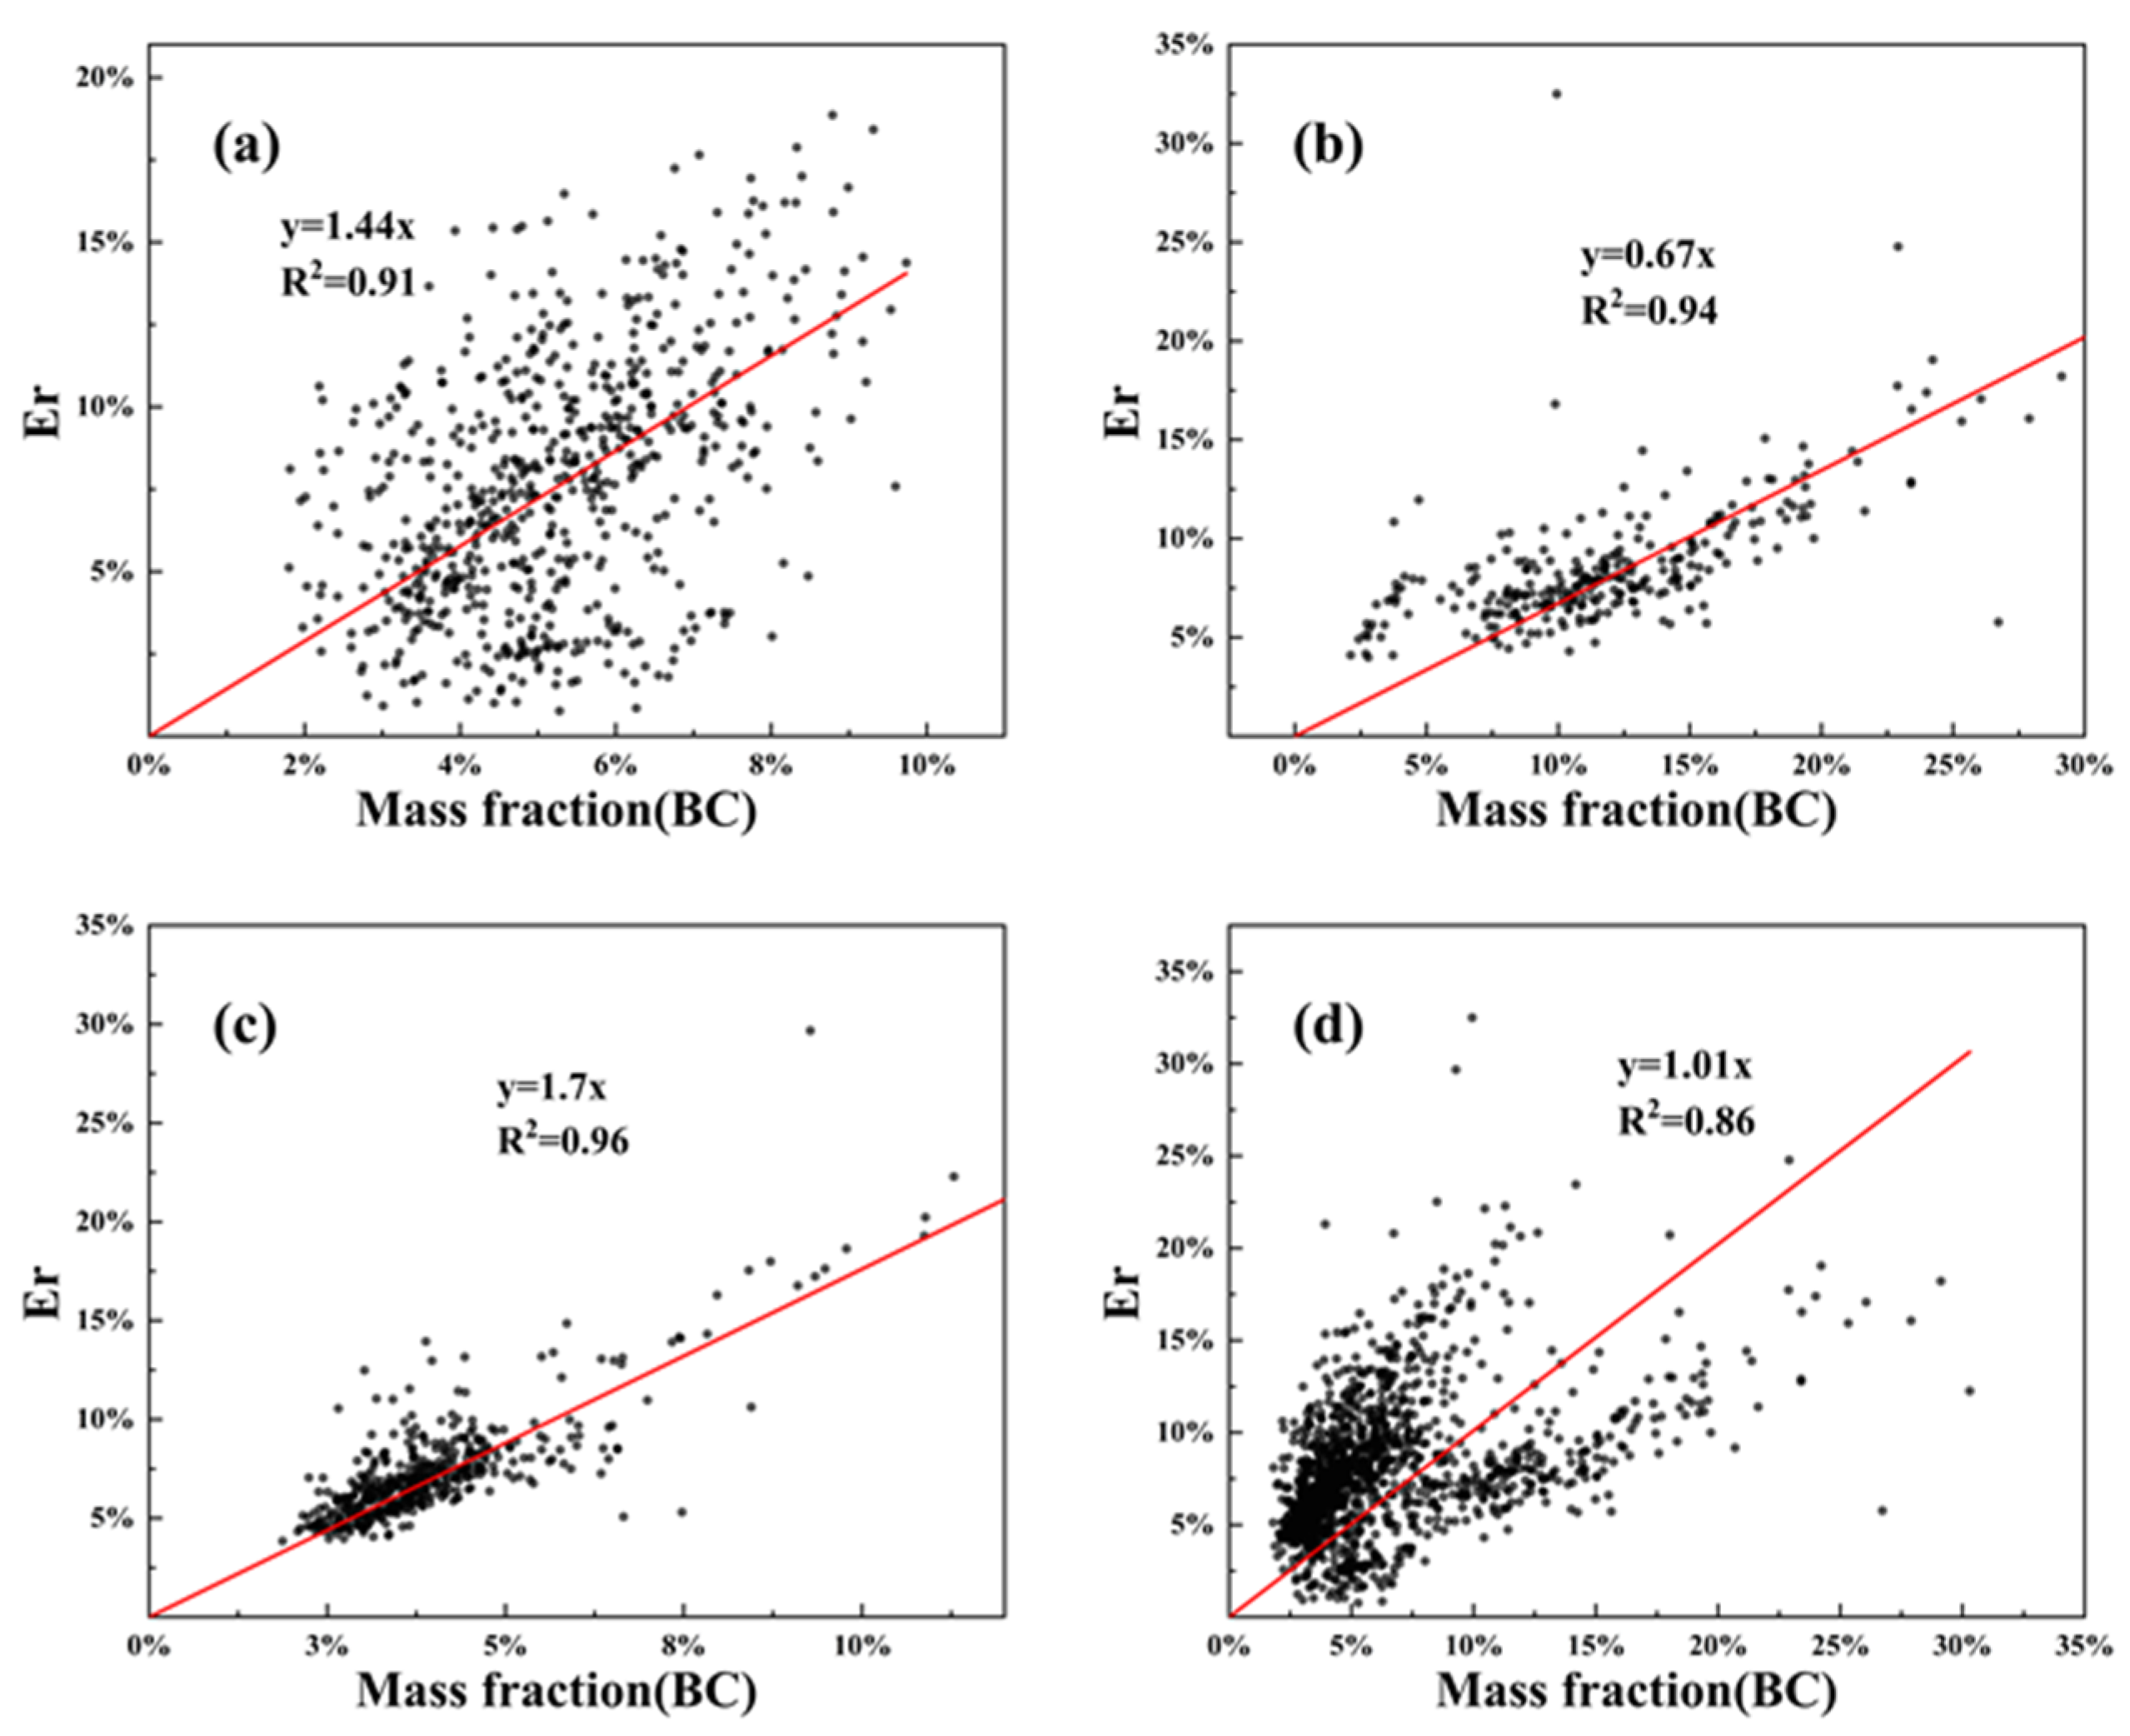
Figure 5 delineates the daily mean values of the mass fraction of black carbon along with the range of relative visibility error corresponding to each date during the observation period. The average relative error during this period is comparable with that reported in observational studies from cities such as Lin’an and Pantanal [50,51]. It is evident from Figure 5 that a significant correlation exists between the relative visibility error and the mass fraction of black carbon. However, this correlation exhibits marked variability across different time intervals. For instance, during the periods from 16 August to 13 September, from 24 November to 5 December, and from 6 December to 24 December, distinctly different correlation patterns are observed. To further elucidate these differences, correlation analyses between the mass fraction of black carbon and the relative visibility error were conducted separately for each of these three periods as well as for the entire observation campaign, with the results presented in Figure 6.
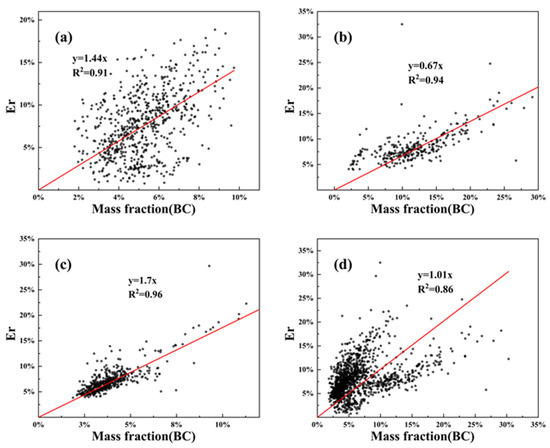
Figure 6.
Correlation between the mass fraction of black carbon and the visibility measurement error. (a) Correlation for the period from 16 August to 13 September; (b) correlation for the period from 24 November to 5 December; (c) correlation for the period from 6 to 24 December; (d) correlation for the entire observation period.
Figure 6 indicates that a significant correlation exists between the mass fraction of black carbon and the relative visibility error, although the characteristics of this relationship differ across various time intervals. Specifically, the R2 values for the three distinct periods all exceed 0.9, whereas the R2 for the entire observation period is above 0.8. Furthermore, even at equivalent mass fraction levels of black carbon, the corresponding visibility error differs across distinct time segments. For instance, the slope of the regression line relating relative visibility error to the mass fraction of black carbon was 1.44, 0.67, and 1.70 during 16 August–13 September, 24 November–5 December, and 6–24 December, respectively, with an overall slope of 1.01 for the entire observation period. These variations in slope underscore that the relationship between relative visibility error and the mass fraction of black carbon is continuously evolving, a phenomenon driven by the inherent spatiotemporal variability of the physicochemical properties of both black carbon and aerosol particles.
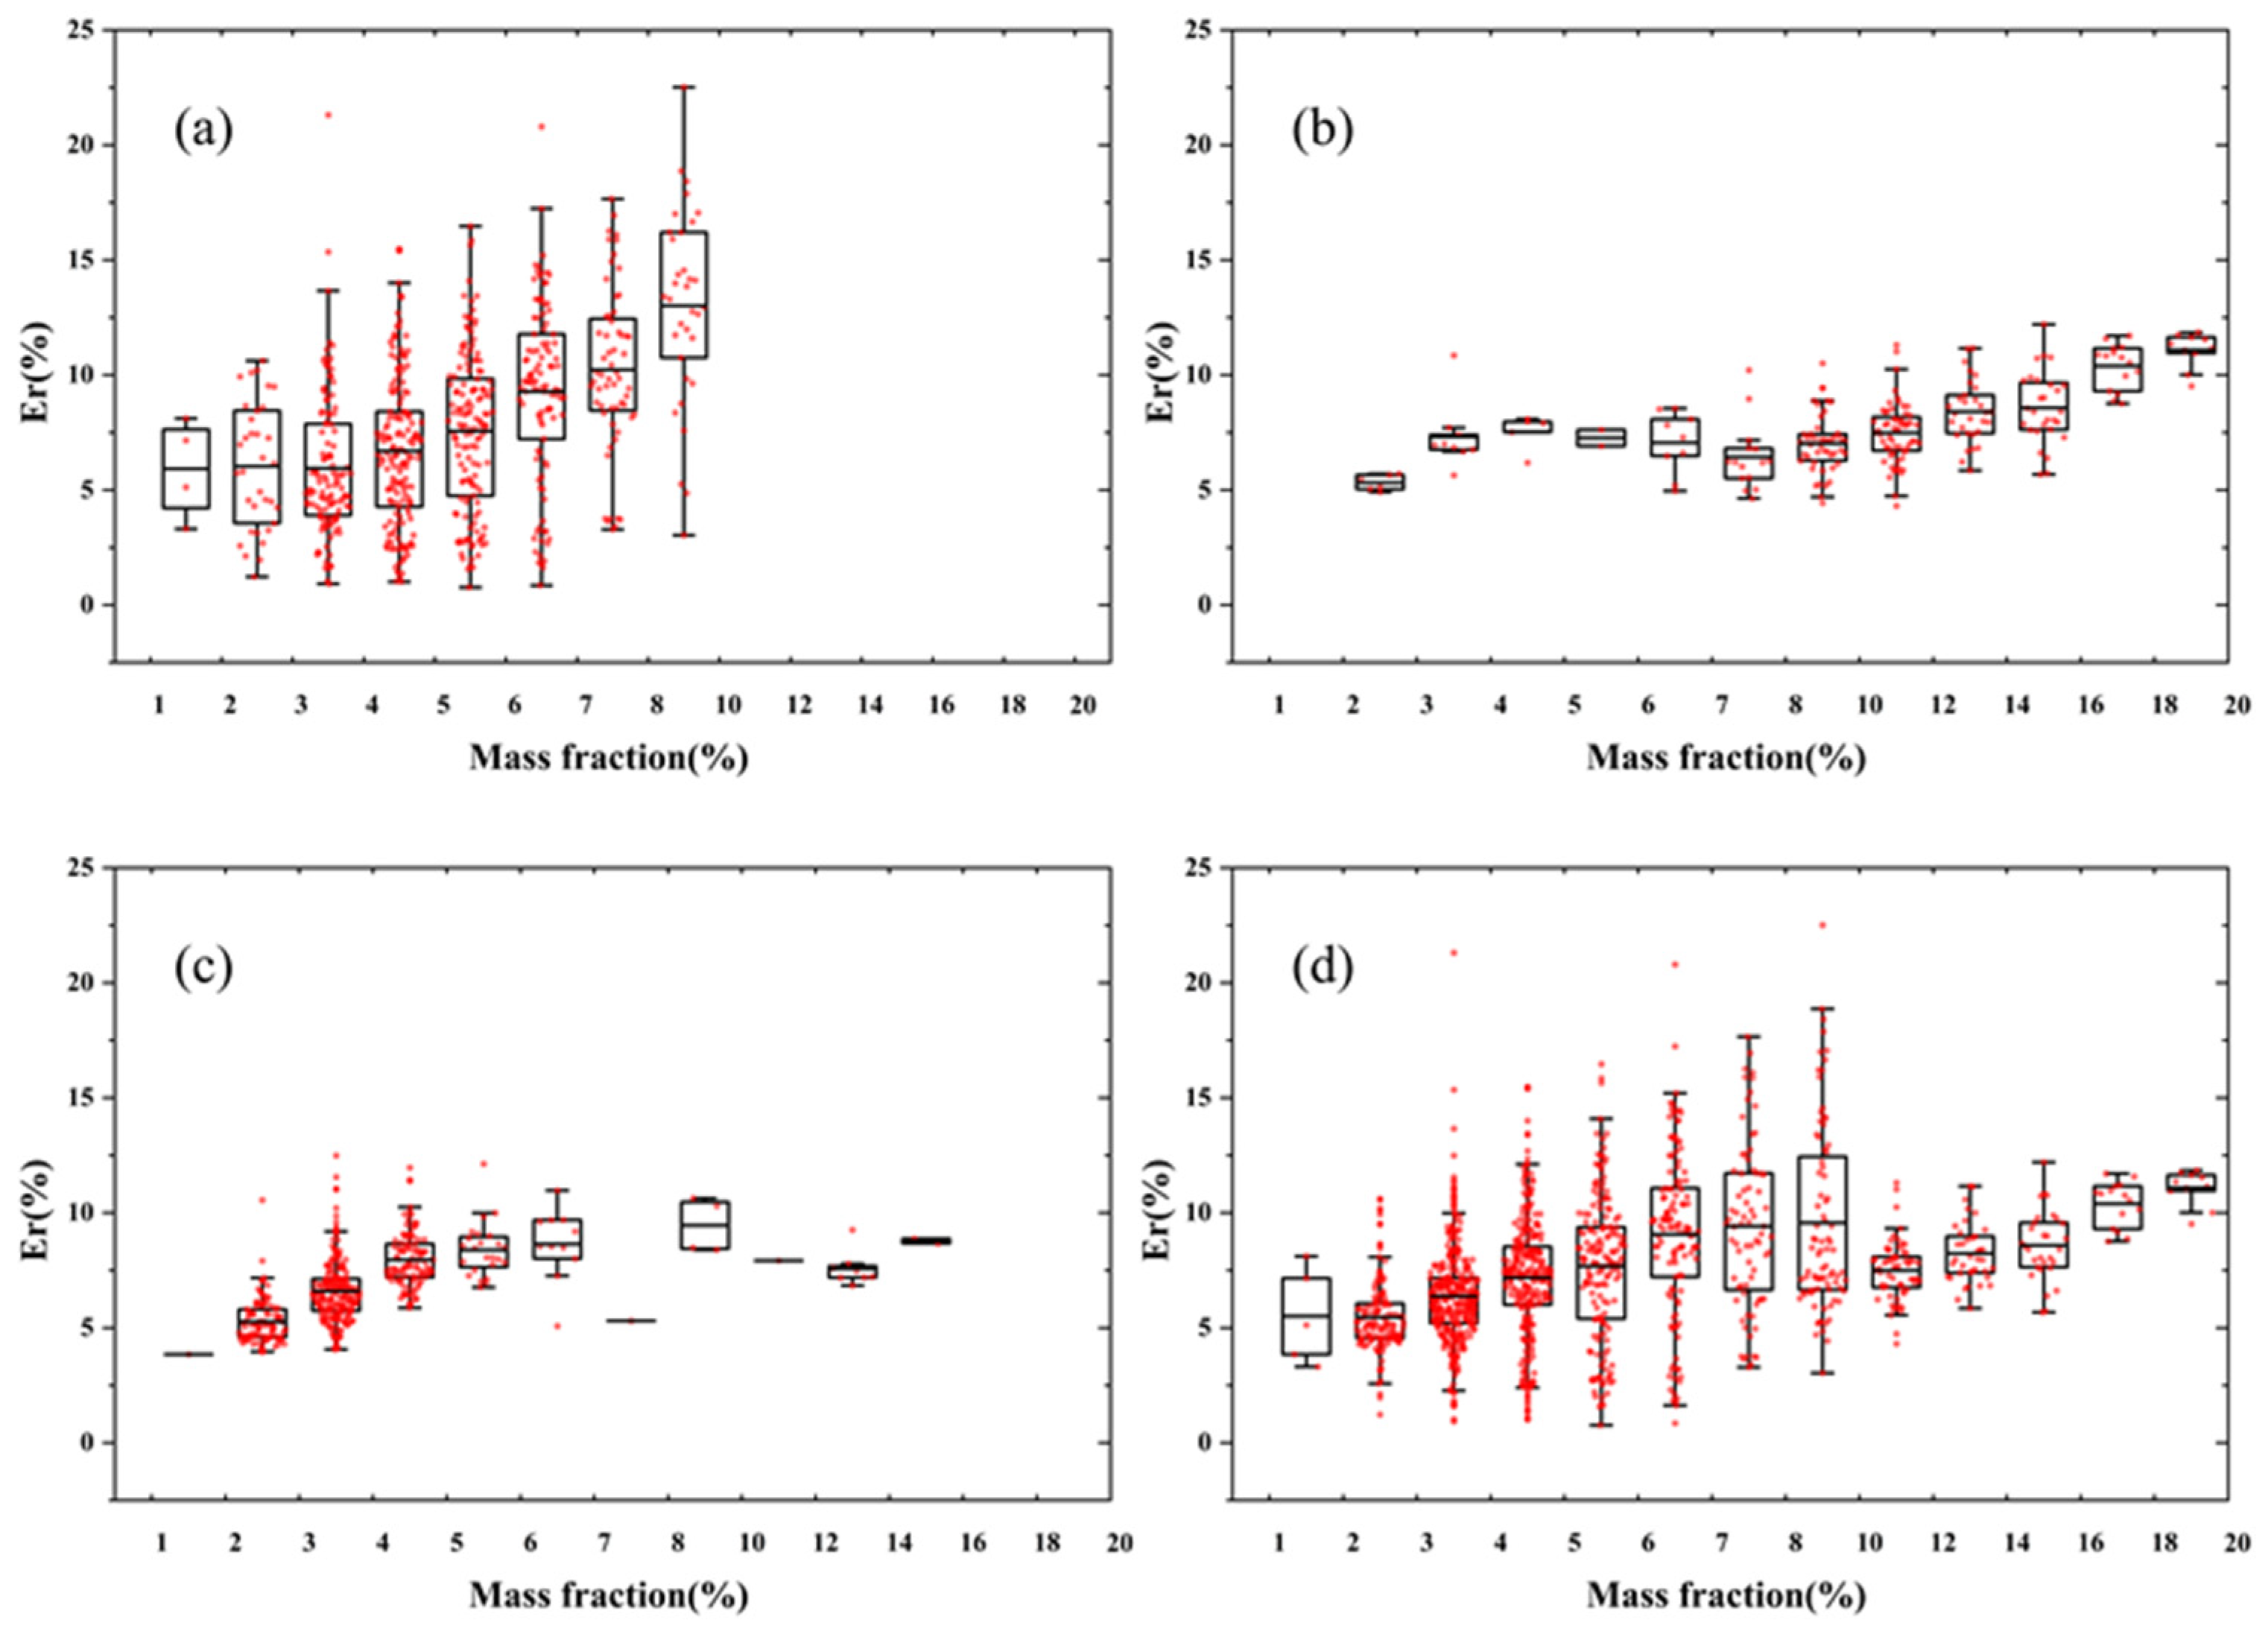
Figure 7 further investigates the relationship between the mass fraction of black carbon and the relative visibility error, using boxplots to depict the distribution of visibility error across different ranges of the mass fraction of black carbon. The findings reveal marked differences in the distribution of the mass fraction of black carbon across different time intervals: from 16 August to 13 September, 24 November to 5 December, and 6 to 24 December, the mass fraction is predominantly between 3% and 7%, from 8% to 16%, and between 2% and 5%, respectively. These results indicate that the mass fraction of black carbon exhibits considerable variability in the atmosphere.
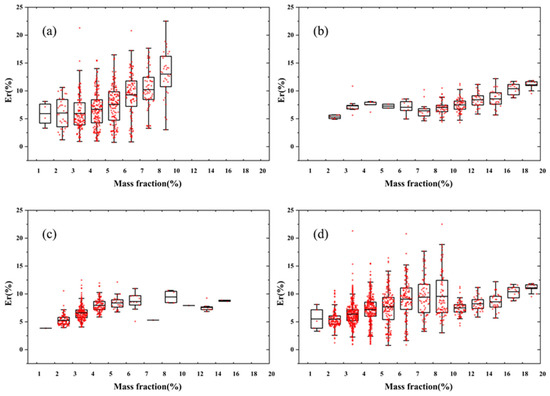
Figure 7.
Distribution of relative visibility error for various mass fractions of black carbon: (a) 16 August–13 September, (b) 24 November–5 December, (c) 6–24 December, (d) entire observation period.
Figure 7 demonstrates that although a significant correlation between the mass fraction of black carbon and the visibility error exists, the range of visibility error remains substantial even at identical mass fraction levels. For example, within the 1–2% mass fraction interval, the average visibility error is 5.92%, with a median of 6.14%, a 25th percentile of 4.21%, and a 75th percentile of 7.63%; in the 6–7% interval, the average visibility error increases to 9.07%, with a median of 9.36%, a 25th percentile of 7.23%, and a 75th percentile of 11.07%. These data indicate that even at equivalent levels of the mass fraction of black carbon, considerable variability in visibility error exists. Furthermore, even at lower mass fractions, the relative visibility error can sometimes be non-negligible.
Analysis of the Nanjing observational data indicates that the mass fraction of black carbon exhibits significant variations over time and across different environments, emphasizing its spatiotemporal variability. A significant correlation exists between the mass fraction of black carbon and the visibility error; however, this relationship varies over time, indicating that it is not constant. Furthermore, even at equivalent mass fraction levels, the range of visibility error is considerable, suggesting that even at lower mass fractions, the visibility error can sometimes be substantial. Consequently, when calibrating visibility meters, accounting for the impact of black carbon on visibility error is essential.
4. Conclusions
This study, through both theoretical analysis and empirical observational data, explored the impact of black carbon on Er in scattering-based visibility meters. The findings demonstrate that black carbon, as a prominent absorptive aerosol in the atmosphere, significantly influences Er, driven by its mass concentration, particle size distribution, mixing state, and interactions with other aerosol components.
- The impact of black carbon on Er is significant and exhibits considerable variability. Both observational data and theoretical analysis show that the large variations in mass concentration and MAC of black carbon result in marked differences in the contribution of its ACC to the total extinction coefficient, thereby influencing the measurement error in visibility.
- The relationship between black carbon mass fraction and Er is intricate. While an increase in black carbon mass fraction typically leads to an elevated rise in Er, cases exist where a lower black carbon mass fraction may also lead to a higher value of Er. This indicates that the relationship between the mass fraction of black carbon and Er is not a simple linear one, but is significantly influenced by aerosol physicochemical parameters such as particle size distribution and mixing state.
- Calibration recommendations for scattering-based visibility meters. Considering the impact of black carbon on the measurement error of instruments, the calibration procedure should be divided into two stages. First, the visibility measurement performance of the instrument should be calibrated to ensure its fundamental accuracy. Second, a calibration specifically accounting for the influence of black carbon should be implemented. Specifically, if real-time data on the mass fraction of black carbon are unavailable, a fixed calibration coefficient based on historical observations may be used; if real-time mass fraction data can be obtained, it is assumed to be proportional to the absorption coefficient contribution (ACC) and Equation (1) is applied for calibration; if ACC data are available directly, Equation (1) should be applied without modification.
Author Contributions
Z.Z. conceived and designed the experiments, provided data support, contributed to the analysis of the results, and wrote the paper; H.G. integrated the data and performed the simulations; Z.Y. processed and analysed the data and generated the figures; J.W. participated in discussions and assisted in data analysis. All authors have read and agreed to the published version of the manuscript.
Funding
This research has been supported by the National Basic Research Program of China (grant no. 2016YFA0602003) and the National Key Research and Development Program of China, Chinese Polar Environment Comprehensive Investigation and Assessment Programs (grant no. 2019YFC0214604).
Institutional Review Board Statement
Not applicable.
Informed Consent Statement
Not applicable.
Data Availability Statement
Aerosol simulation and computation data are available upon request from the corresponding author, and concentration and optical property observation data are available at the China Air Pollution Data Center (https://www.capdatabase.cn, CAPDC, 2025).
Acknowledgments
This work was supported by the National Key Research and Development Program of China (grant no. 2016YFA0602003) and the National Key Research and Development Program of China (no. 2019YFC0214604). We would like to thank the project team and staff of the Vertical Distribution of Fine Particles and Ozone, Physicochemical Coupling, and Weather Effects in the Yangtze River Delta for their efforts in measuring and sharing the observational data.
Conflicts of Interest
The authors declare no conflicts of interest.
Abbreviations
The following abbreviations are used in this manuscript:
| MAC | mass absorption coefficient |
| MEC | mass extinction coefficient |
| MSC | mass scattering coefficient |
| Er | relative error |
References
- Cheng, X.; Yang, B.; Liu, G.; Olofsson, T.; Li, H. A variational approach to atmospheric visibility estimation in the weather of fog and haze. Sustain. Cities Soc. 2018, 39, 215–224. [Google Scholar] [CrossRef]
- Barrales-Guadarrama, R.; Mocholí-Salcedo, A.; Rodríguez-Rodríguez, M.E.; Barrales-Guadarrama, V.R.; Vázquez-Cerón, E.R. A new forward-scatter visibility sensor based on a universal frequency-to-digital converter. Instrum. Sci. Technol. 2013, 41, 445–462. [Google Scholar] [CrossRef]
- Guo, H.; Zhang, Z.; Jiang, L.; An, J.; Zhu, B.; Kang, H.; Wang, J. Ångström exponent errors prevent accurate visibility measurement. Atmos. Meas. Tech. 2021, 14, 2441–2450. [Google Scholar] [CrossRef]
- Zhang, Z.; Guo, H.; Kang, H.; Wang, J.; An, J.; Yu, X.; Lv, J.; Zhu, B. A new method for calculating average visibility from the relationship between extinction coefficient and visibility. Atmos. Meas. Tech. 2022, 15, 7259–7264. [Google Scholar] [CrossRef]
- Zhuang, Z.; Li, J.; Chan, P.W.; Tai, H. Substitutability research for forward-scatter meters in indoor low-visibility environments. Meteorol. Appl. 2022, 29, e2050. [Google Scholar] [CrossRef]
- Shen, Z.; Cao, J.; Zhang, L.; Zhang, Q.; Huang, R.-J.; Liu, S.; Zhao, Z.; Zhu, C.; Lei, Y.; Xu, H.; et al. Retrieving historical ambient PM2.5 concentrations using existing visibility measurements in Xi’an, Northwest China. Atmos. Environ. 2016, 126, 15–20. [Google Scholar] [CrossRef]
- Jeong, J.I.; Seo, J.; Park, R.J. Compromised improvement of poor visibility due to PM chemical composition changes in South Korea. Remote Sens. 2022, 14, 5310. [Google Scholar] [CrossRef]
- World Meteorological Organization. Guide to Instruments and Methods of Observation Volume I—Measurement of Meteorological Variables, 2023 ed.; World Meteorological Organization: Geneva, Switzerland, 2023; p. 574. ISBN 978-92-63-10008-5. [Google Scholar]
- World Meteorological Organization. Guide to Instruments and Methods of Observation, 7th ed.; World Meteorological Organization: Geneva, Switzerland, 2008; Chapter 9; pp. I.9-1–I.9-15. ISBN 978-92-63-10008-5. [Google Scholar]
- Li, J.; Carlson, B.E.; Yung, Y.L.; Lv, D.; Hansen, J.; Penner, J.E.; Liao, H.; Ramaswamy, V.; Kahn, R.A.; Zhang, P.; et al. Scattering and absorbing aerosols in the climate system. Nat. Rev. Earth Environ. 2022, 3, 363–379. [Google Scholar] [CrossRef]
- Liu, D.; He, C.; Schwarz, J.P.; Wang, X. Lifecycle of light-absorbing carbonaceous aerosols in the atmosphere. NPJ Clim. Atmos. Sci. 2020, 3, 40. [Google Scholar] [CrossRef]
- Tang, F.; Ma, S.; Yang, L.; Du, C.; Tang, Y. A new visibility measurement system based on a black target and a comparative trial with visibility instruments. Atmos. Environ. 2016, 143, 229–236. [Google Scholar] [CrossRef]
- Wei, C.; Zeqiang, B.; Jinhua, C.; Xiaolei, H.; Dandan, J. A method for calibrating forward scatter meters indoors. Metrologia 2020, 57, 065030. [Google Scholar] [CrossRef]
- Cao, N.; Chen, L.; Liu, Y.; Wang, J.; Yang, S.; Su, D.; Mi, K.; Gao, S.; Zhang, H. Spatiotemporal distribution, light absorption characteristics, and source apportionments of black and brown carbon in China. Sci. Total Environ. 2024, 919, 170796. [Google Scholar] [CrossRef] [PubMed]
- Sun, Y.; Jiang, Q.; Wang, Z.; Fu, P.; Li, J.; Yang, T.; Yin, Y. Investigation of the sources and evolution processes of severe haze pollution in Beijing in January 2013. JGR Atmos. 2014, 119, 4380–4398. [Google Scholar] [CrossRef]
- Hu, W.; Hu, M.; Hu, W.; Jimenez, J.L.; Yuan, B.; Chen, W.; Wang, M.; Wu, Y.; Chen, C.; Wang, Z.; et al. Chemical composition, sources, and aging process of submicron aerosols in Beijing: Contrast between summer and winter. JGR Atmos. 2016, 121, 1955–1977. [Google Scholar] [CrossRef]
- Marinoni, A.; Cristofanelli, P.; Laj, P.; Duchi, R.; Calzolari, F.; Decesari, S.; Sellegri, K.; Vuillermoz, E.; Verza, G.P.; Villani, P.; et al. Aerosol mass and black carbon concentrations, a two year record at NCO-P (5079 m, Southern Himalayas). Atmos. Chem. Phys. 2010, 10, 8551–8562. [Google Scholar] [CrossRef]
- Bond, T.C.; Bergstrom, R.W. Light absorption by carbonaceous particles: An investigative review. Aerosol Sci. Technol. 2006, 40, 27–67. [Google Scholar] [CrossRef]
- Saliba, G.; Subramanian, R.; Saleh, R.; Ahern, A.T.; Lipsky, E.M.; Tasoglou, A.; Sullivan, R.C.; Bhandari, J.; Mazzoleni, C.; Robinson, A.L. Optical properties of black carbon in cookstove emissions coated with secondary organic aerosols: Measurements and modeling. Aerosol Sci. Technol. 2016, 50, 1264–1276. [Google Scholar] [CrossRef]
- Martins, J.V.; Artaxo, P.; Liousse, C.; Reid, J.S.; Hobbs, P.V.; Kaufman, Y.J. Effects of black carbon content, particle size, and mixing on light absorption by aerosols from biomass burning in Brazil. J. Geophys. Res. 1998, 103, 32041–32050. [Google Scholar] [CrossRef]
- Wu, B.; Wu, Z.; Yao, Z.; Shen, X.; Cao, X. Refined mass absorption cross-section of black carbon from typical non-road mobile machinery in China based on real-world measurements. Sci. Total Environ. 2024, 908, 168579. [Google Scholar] [CrossRef]
- Tao, J.; Zhang, L.; Cao, J.; Zhang, R. A review of current knowledge concerning PM2.5 chemical composition, aerosol optical properties and their relationships across China. Atmos. Chem. Phys. 2017, 17, 9485–9518. [Google Scholar] [CrossRef]
- Cao, J.; Wang, Q.; Chow, J.C.; Watson, J.G.; Tie, X.; Shen, Z.; Wang, P.; An, Z. Impacts of aerosol compositions on visibility impairment in Xi’an, China. Atmos. Environ. 2012, 59, 559–566. [Google Scholar] [CrossRef]
- Wang, H.; Shi, G.; Tian, M.; Zhang, L.; Chen, Y.; Yang, F.; Cao, X. Aerosol optical properties and chemical composition apportionment in Sichuan Basin, China. Sci. Total Environ. 2017, 577, 245–257. [Google Scholar] [CrossRef] [PubMed]
- Matzler, C. MATLAB Functions for Mie Scattering and Absorption; University of Bern, Institute of Applied Physics: Bern, Switzerland, 2002. [Google Scholar]
- McClure, C.D.; Lim, C.Y.; Hagan, D.H.; Kroll, J.H.; Cappa, C.D. Biomass-burning-derived particles from a wide variety of fuels—Part 1: Properties of primary particles. Atmos. Chem. Phys. 2020, 20, 1531–1547. [Google Scholar] [CrossRef]
- Corbin, J.C.; Pieber, S.M.; Czech, H.; Zanatta, M.; Jakobi, G.; Massabò, D.; Orasche, J.; El Haddad, I.; Mensah, A.A.; Stengel, B.; et al. Brown and black carbon emitted by a marine engine operated on heavy fuel oil and distillate fuels: Optical properties, size distributions, and emission factors. JGR Atmos. 2018, 123, 6175–6195. [Google Scholar] [CrossRef]
- Yu, C.; Liu, D.; Broda, K.; Joshi, R.; Olfert, J.; Sun, Y.; Fu, P.; Coe, H.; Allan, J.D. Characterising mass-resolved mixing state of black carbon in Beijing using a morphology-independent measurement method. Atmos. Chem. Phys. 2020, 20, 3645–3661. [Google Scholar] [CrossRef]
- Stabile, L.; Fuoco, F.C.; Buonanno, G. Characteristics of particles and black carbon emitted by combustion of incenses, candles and anti-mosquito products. Build. Environ. 2012, 56, 184–191. [Google Scholar] [CrossRef]
- Zanatta, M.; Laj, P.; Gysel, M.; Baltensperger, U.; Vratolis, S.; Eleftheriadis, K.; Kondo, Y.; Dubuisson, P.; Winiarek, V.; Kazadzis, S.; et al. Effects of mixing state on optical and radiative properties of black carbon in the European arctic. Atmos. Chem. Phys. 2018, 18, 14037–14057. [Google Scholar] [CrossRef]
- Pan, X.; Kanaya, Y.; Taketani, F.; Miyakawa, T.; Inomata, S.; Komazaki, Y.; Tanimoto, H.; Wang, Z.; Uno, I.; Wang, Z. Emission characteristics of refractory black carbon aerosols from fresh biomass burning: A perspective from laboratory experiments. Atmos. Chem. Phys. 2017, 17, 13001–13016. [Google Scholar] [CrossRef]
- Holder, A.L.; Gullett, B.K.; Urbanski, S.P.; Elleman, R.; O’Neill, S.; Tabor, D.; Mitchell, W.; Baker, K.R. Emissions from prescribed burning of agricultural fields in the pacific northwest. Atmos. Environ. 2017, 166, 22–33. [Google Scholar] [CrossRef]
- Han, Y.; Chen, Y.; Ahmad, S.; Feng, Y.; Zhang, F.; Song, W.; Cao, F.; Zhang, Y.; Yang, X.; Li, J.; et al. High time- and size-resolved measurements of PM and chemical composition from coal combustion: Implications for the EC formation process. Environ. Sci. Technol. 2018, 52, 6676–6685. [Google Scholar] [CrossRef]
- Zhang, Y.X.; Zhang, Q.; Cheng, Y.F.; Su, H.; Kecorius, S.; Wang, Z.B.; Wu, Z.J.; Hu, M.; Zhu, T.; Wiedensohler, A.; et al. Measuring morphology and density of internally mixed black carbon with SP2 and VTDMA: New insight to absorption enhancement of black carbon in the atmosphere. Atmos. Meas. Tech. 2015, 8, 12025–12050. [Google Scholar] [CrossRef]
- Liu, H.; Pan, X.; Liu, D.; Liu, X.; Chen, X.; Tian, Y.; Sun, Y.; Fu, P.; Wang, Z. Mixing characteristics of refractory black carbon aerosols at an urban site in Beijing. Atmos. Chem. Phys. 2020, 20, 5771–5785. [Google Scholar] [CrossRef]
- China, S.; Mazzoleni, C.; Gorkowski, K.; Aiken, A.C.; Dubey, M.K. Morphology and mixing state of individual freshly emitted wildfire carbonaceous particles. Nat. Commun. 2013, 4, 2122. [Google Scholar] [CrossRef]
- Holder, A.L.; Hagler, G.S.W.; Aurell, J.; Hays, M.D.; Gullett, B.K. Particulate matter and black carbon optical properties and emission factors from prescribed fires in the Southeastern United States. JGR Atmos. 2016, 121, 3465–3483. [Google Scholar] [CrossRef]
- Bond, T.C.; Covert, D.S.; Kramlich, J.C.; Larson, T.V.; Charlson, R.J. Primary particle emissions from residential coal burning: Optical properties and size distributions. J. Geophys. Res. 2002, 107, ICC 9-1–ICC 9-14. [Google Scholar] [CrossRef]
- Kompalli, S.K.; Suresh Babu, S.N.; Satheesh, S.K.; Krishna Moorthy, K.; Das, T.; Boopathy, R.; Liu, D.; Darbyshire, E.; Allan, J.D.; Brooks, J.; et al. Seasonal contrast in size distributions and mixing state of black carbon and its association with PM1.0 chemical composition from the eastern coast of India. Atmos. Chem. Phys. 2020, 20, 3965–3985. [Google Scholar] [CrossRef]
- Laborde, M.; Schnaiter, M.; Linke, C.; Saathoff, H.; Naumann, K.-H.; Möhler, O.; Berlenz, S.; Wagner, U.; Taylor, J.W.; Liu, D.; et al. Single particle soot photometer intercomparison at the AIDA chamber. Atmos. Meas. Tech. 2012, 5, 3077–3097. [Google Scholar] [CrossRef]
- Gong, X.; Zhang, C.; Chen, H.; Nizkorodov, S.A.; Chen, J.; Yang, X. Size distribution and mixing state of black carbon particles during a heavy air pollution episode in shanghai. Atmos. Chem. Phys. 2016, 16, 5399–5411. [Google Scholar] [CrossRef]
- Liu, D.; Allan, J.D.; Young, D.E.; Coe, H.; Beddows, D.; Fleming, Z.L.; Flynn, M.J.; Gallagher, M.W.; Harrison, R.M.; Lee, J.; et al. Size distribution, mixing state and source apportionment of black carbon aerosol in London during wintertime. Atmos. Chem. Phys. 2014, 14, 10061–10084. [Google Scholar] [CrossRef]
- Zhao, D.; Huang, M.; Tian, P.; He, H.; Lowe, D.; Zhou, W.; Sheng, J.; Wang, F.; Bi, K.; Kong, S.; et al. Vertical characteristics of black carbon physical properties over Beijing region in warm and cold seasons. Atmos. Environ. 2019, 213, 296–310. [Google Scholar] [CrossRef]
- Hussein, T.; Puustinen, A.; Aalto, P.P.; Mäkelä, J.M.; Hämeri, K.; Kulmala, M. Urban aerosol number size distributions. Atmos. Chem. Phys. 2004, 4, 391–411. [Google Scholar] [CrossRef]
- Ma, Y.; Huang, C.; Jabbour, H.; Zheng, Z.; Wang, Y.; Jiang, Y.; Zhu, W.; Ge, X.; Collier, S.; Zheng, J. Mixing State and Light Absorption Enhancement of Black Carbon Aerosols in Summertime Nanjing, China. Atmos. Environ. 2020, 222, 117141. [Google Scholar] [CrossRef]
- Shen, G.; Xue, M.; Yuan, S.; Zhang, J.; Zhao, Q.; Li, B.; Wu, H.; Ding, A. Chemical Compositions and Reconstructed Light Extinction Coefficients of Particulate Matter in a Mega-City in the Western Yangtze River Delta, China. Atmos. Environ. 2014, 83, 14–20. [Google Scholar] [CrossRef]
- Xiao, S.; Yu, X.; Zhu, B.; Kumar, K.R.; Li, M.; Li, L. Characterization and Source Apportionment of Black Carbon Aerosol in the Nanjing Jiangbei New Area Based on Two Years of Measurements from Aethalometer. J. Aerosol Sci. 2020, 139, 105461. [Google Scholar] [CrossRef]
- Shen, Y.; Virkkula, A.; Ding, A.; Wang, J.; Chi, X.; Nie, W.; Qi, X.; Huang, X.; Liu, Q.; Zheng, L.; et al. Aerosol Optical Properties at SORPES in Nanjing, East China. Atmos. Chem. Phys. 2018, 18, 5265–5292. [Google Scholar] [CrossRef]
- Zhuang, B.; Wang, T.; Liu, J.; Li, S.; Xie, M.; Han, Y.; Chen, P.; Hu, Q.; Yang, X.; Fu, C.; et al. The Surface Aerosol Optical Properties in the Urban Area of Nanjing, West Yangtze River Delta, China. Atmos. Chem. Phys. 2017, 17, 1143–1160. [Google Scholar] [CrossRef]
- Palácios, R.; Romera, K.; Rizzo, L.; Cirino, G.; Adams, D.; Imbiriba, B.; Nassarden, D.; Rothmund, L.; Siqueira, A.; Basso, J.; et al. Optical Properties and Spectral Dependence of Aerosol Light Absorption over the Brazilian Pantanal. Atmos. Pollut. Res. 2022, 13, 101413. [Google Scholar] [CrossRef]
- Xu, J.; Bergin, M.H.; Yu, X.; Liu, G.; Zhao, J.; Carrico, C.M.; Baumann, K. Measurement of Aerosol Chemical, Physical and Radiative Properties in the Yangtze Delta Region of China. Atmos. Environ. 2002, 36, 161–173. [Google Scholar] [CrossRef]
Disclaimer/Publisher’s Note: The statements, opinions and data contained in all publications are solely those of the individual author(s) and contributor(s) and not of MDPI and/or the editor(s). MDPI and/or the editor(s) disclaim responsibility for any injury to people or property resulting from any ideas, methods, instructions or products referred to in the content. |
© 2025 by the authors. Licensee MDPI, Basel, Switzerland. This article is an open access article distributed under the terms and conditions of the Creative Commons Attribution (CC BY) license (https://creativecommons.org/licenses/by/4.0/).

