Abstract
Atmospheric fine particles (PM2.5) pose significant health risks by penetrating deep into the lungs and causing respiratory and cardiovascular issues. In Saudi Arabia, high PM2.5 levels are driven by its geographic location and extreme climate. Therefore, analysis of PM2.5 spatiotemporal variability is crucial for understanding its causes, impacts, and effective management. This study analyzed MERRA-2 reanalysis PM2.5 data for 23 years (2001–2023). MERRA-2 data were validated with in situ observations in terms of several statistical metrics, including RMSE, FAC2, MAE, and Correlation Coefficient. The results revealed a significant spatial variation in PM2.5 levels, with higher concentrations observed in the eastern and southeastern regions and lower concentrations observed in the western and northwestern regions, a trend confirmed by ground-level observations. Employing the robust Theil–Sen technique, temporal trends in PM2.5 concentrations indicated an overall decreasing trend over the study period. At most sites, PM2.5 levels increased until 2010 and then started decreasing, probably due to government interventions for reducing emissions, combating desertification, and enhancing tree plantations. Non-linear modeling provided a more accurate representation of complex trends compared to simple linear models. The findings underscore the need for continued national and regional efforts to mitigate PM2.5 pollution by addressing its emission sources.
1. Introduction
Particulate matter (PM) is a complex mixture of tiny solid particles and liquid droplets suspended in the air. Among the various categories of particulate matter, PM2.5 (referred to as fine particulate matter) are particles with an aerodynamic diameter of 2.5 μm or smaller. The generation of PM2.5 in the atmosphere is a complex process influenced by multiple factors, including urbanization, industrialization, and meteorological conditions. Furthermore, the composition of PM2.5 can vary widely depending on the sources of emissions, including both natural and anthropogenic activities. Common sources include vehicle emissions, industrial discharges, residential heating, agricultural activities, and natural events such as sandstorms, wildfires, and volcanic eruptions [1,2,3,4,5,6].
The impacts of PM2.5 on human health and the environment are multifaceted and profound. Firstly, PM2.5 contributes to air pollution, which has been linked to severe health issues, including respiratory diseases, cardiovascular problems, and even premature mortality [7,8,9,10,11]. PM2.5 is particularly concerning due to its ability to penetrate deep into the respiratory system, reaching the alveoli and potentially entering the bloodstream, which can lead to a range of adverse health effects [12,13,14]. Epidemiological studies have shown that long-term exposure to PM2.5 is associated with increased risks of lung cancer, heart disease, and respiratory infections [6,9,15]. The World Health Organization has estimated that air pollution, particularly from PM2.5, accounts for a significant percentage of global mortality and morbidity [11]. PM2.5 can also affect the environment, contributing to climate change and ecosystem degradation. These particles can influence cloud formation and precipitation patterns, thus affecting weather systems and contributing to climate variability [5,16]. Additionally, PM2.5 can deposit onto soil and water bodies, leading to the contamination of ecosystems and potentially harming wildlife and plant life [17]. The presence of heavy metals and toxic compounds within PM2.5 can further exacerbate these environmental impacts, posing risks to biodiversity and ecosystem stability [18,19].
Saudi Arabia has semi-arid to arid climate conditions where PM2.5 generation depends on a variety of natural and anthropogenic factors. For instance, the arid climate and geographical features of the region make it susceptible to frequent dust storms, which can elevate PM2.5 concentrations dramatically during certain seasons [20,21]. Rapid urbanization and economic growth have exacerbated air pollution levels, particularly in urban centers where industrialization is concentrated. In addition, the increasing number of vehicles significantly contributes to the rise in PM2.5 concentrations [21,22,23,24,25,26,27]. Furthermore, the reliance on fossil fuels for energy production and industrial processes has been identified as a critical factor in the deterioration of air quality in the region [28]. Thus, the generation of PM2.5 with the combination of anthropogenic and natural sources results in a complex air quality scenario that poses significant health and environmental risks in this region.
Among the various challenges in air quality management, the lack of spatially resolved data remains a significant obstacle. The Modern-Era Retrospective Analysis for Research and Applications, Version 2 (MERRA-2) dataset provides long-term, high-resolution atmospheric composition data, making it a valuable tool for air quality assessments, particularly in regions with sparse ground-based monitoring networks [29,30]. MERRA-2 integrates various satellite observations and model outputs to generate high-resolution data on aerosols, including PM2.5 concentrations, which can be critical for understanding spatial and temporal variations in air quality [31,32]. This capability is especially important in arid regions, where dust storms can significantly influence PM2.5 levels and where traditional monitoring may be limited due to logistical challenges [33]. Moreover, satellite data can enhance the understanding of the sources and transport mechanisms of PM2.5 in Saudi Arabia. For instance, studies utilizing satellite-derived aerosol optical depth (AOD) have shown strong correlations with ground-based PM2.5 measurements, allowing researchers to infer the impact of dust storms and other aerosol sources on air quality [31,33]. The integration of satellite data with ground observations enables a more robust assessment of PM2.5 dynamics, facilitating the identification of seasonal patterns and the influence of meteorological conditions on particulate matter concentrations [32,33].
The present study comprehensively assesses PM2.5 dynamics across Saudi Arabia by employing both satellite-derived reanalysis data and ground-based air quality monitoring station data. In this study, we analyzed MERRA-2 PM2.5 data from 2001 to 2023 to examine long-term temporal trends and spatial variabilities to identify potential influencing factors. Ground-based observations from air quality monitoring stations were integrated to compare with MERRA-2 estimates and enhance the reliability of the findings. The objectives of this research are as follows: (i) Map the spatial variability of PM2.5 across Saudi Arabia to identify high-exposure regions, (ii) Examine long-term temporal trends in PM2.5 levels over the past couple of decades to understand the impacts of policy interventions, (iii) Investigate the non-linearity of the temporal trend, (iv) Validate MERRA-2 data against in situ observations of PM2.5, computing several statistical metrics such as factor of two (FAC2), root mean squared error (RMSE), and correlation coefficients, and (v) Identify potential factors influencing PM2.5 variability, including meteorological conditions, dust events, and human activities, which are responsible for the spatiotemporal variabilities.
The strengths of the study include utilizing more than 20 years of data, integrating MERRA-2 reanalysis and in situ observations, employing a robust technique for long-term trend analysis, and computing several statistical metrics for comparing in situ and MERRA-2 data. The findings will contribute to a deeper understanding of air quality dynamics in the region, offering valuable insights for policymakers, environmental researchers, and public health officials to develop effective air pollution mitigation strategies.
2. Methodology
In this paper, PM2.5 data are utilized from two sources: MERRA-2 reanalysis data, and ground-level air quality monitoring observations, which are described as follows.
2.1. MERRA-2 Data
The MERRA-2 (Modern-Era Retrospective Analysis for Research and Applications, Version 2) dataset was developed by NASA’s Global Modeling and Assimilation Office (GMAO). The MERRA-2 data provides a comprehensive and high-resolution resource for atmospheric research, including PM2.5 concentration analysis. The data are considered an innovative tool for air quality analysis, particularly due to its spatial coverage and the capability of differentiation between aerosol specifications [34]. MERRA-2 employs the Goddard Earth Observing System Model, Version 5 (GEOS-5), which assimilates aerosol optical depth (AOD) data from multiple platforms, including MODIS and AERONET, to enhance the accuracy of its aerosol reanalysis [29,30]. This assimilation process allows MERRA-2 to effectively capture the vertical structure of aerosols and their impact on surface PM2.5 levels [29]. The dataset has been evaluated against ground-based observations, demonstrating generally a good correlation, although some discrepancies remain, particularly in regions with heavy pollution [35,36]. Therefore, in this study, MERRA-2 data are utilized to obtain PM2.5 concentrations in Saudi Arabia from 2001 to 2023. The data were accessed from NASA’s GES DISC (Goddard Earth Sciences Data and Information Services Center) via the website https://disc.gsfc.nasa.gov (accessed on 13 January 2025). The M2T1NXAER, an hourly time-averaged 2-dimensional data collection in MERRA-2, was downloaded, which provided daily PM2.5 concentrations (µg/m3) at a spatial resolution of 0.5° × 0.625° (longitude × latitude) at the global scale. Further, the downloaded data were extracted and processed to obtain PM2.5 values over Saudi Arabia. The yearly mean PM2.5 values were calculated by aggregating daily data. The spatial distribution of PM2.5 across different years was analyzed, and possible causes of observed trends were discussed.
Theil–Sen trend technique, which is part of the ‘openair’ package [37] in the R programming language [38], was used to quantify temporal trends per year in different cities. This technique is a robust non-parametric technique and is not affected by the non-normal data distribution of air quality. In addition to quantifying the annual trend, the Theil–Sen function evaluates the statistical significance of the trend and determines the corresponding significance levels.
2.2. PM2.5 Observation Data
The National Center for Environmental Compliance (NCEC) operates a large network of air quality monitoring in the Kingdom of Saudi Arabia. The number of air quality monitoring stations has increased over time, having the greatest number of stations in 2023, which was 109 stations (Figure 1). The monitoring stations provide hourly data on several pollutants (e.g., PM10, PM2.5, NO, NO2, CO, O3, SO2). In this study, PM2.5 concentrations from monitoring stations are compared with those from the MERRA-2 dataset for spatial analysis. However, large portions of the country remain uncovered by the air quality monitoring network, and the available data represent point measurements. In contrast, MERRA-2 provides gridded data, offering continuous spatial coverage and a more comprehensive representation of PM2.5 distribution.
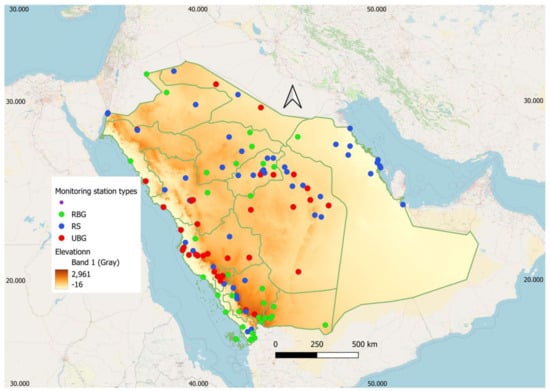
Figure 1.
Topography (elevation in m) map with air quality monitoring network (in 2023) operated by the National Center for Environmental Compliance (NCEC) in Saudi Arabia. Environmental types of the monitoring stations are also visualized, where RBG = Rural Background, RS = Roadside, and UBG = Urban background monitoring stations.
2.3. Methodology of the Validation of MERRA-2 Data
For comparing in situ observations with MERRA-2 data, PM2.5 concentrations were analyzed for multiple cities in 2023. MERRA-2 reanalysis data are provided on a structured grid with a spatial resolution of approximately 0.5° × 0.625°, meaning observation stations may not align exactly with the grid points. To derive MERRA-2 values at the precise locations of observation stations, we applied kriging interpolation, which provided a statistically optimized interpolation by considering both the distance and spatial arrangement of neighboring grid points. The interpolation was applied to MERRA-2 gridded data, and the interpolated values were extracted at station locations using the Extract tool in a GIS software. This is one of the commonly adopted methodologies for such analysis, particularly over the regions where ground measurements are scanty. By applying this, we found a smooth and spatially consistent representation of reanalysis data at observation sites, improving the accuracy of station-based comparisons. Point data for several cities were obtained from the MERRA-2 and compared with the in situ observations. Several statistical metrics were calculated for this purpose, including factor of two (FAC2), root mean squared error (RMSE), correlation coefficient (r), mean bias (MB), mean absolute error (MAE), normalized mean bias (NMB), normalized mean gross error (NMGE), and Index of agreement (IOA). The validation was conducted exclusively for the year 2023 due to the limited availability of ground-level observational data in the Kingdom of Saudi Arabia (KSA). Specifically, comprehensive and quality-controlled ground-level measurements necessary for robust validation were only accessible for 2023. Given these limitations, 2023 was selected as the validation year to ensure the reliability and accuracy of the evaluation, based on the best available and complete dataset.
3. Results and Discussion
3.1. Spatial Variability of PM2.5
The spatial distribution of annual PM2.5 concentrations (µg/m3) over Saudi Arabia for 10 years (2013–2022), based on MERRA-2 data, is shown in Figure 2. Other years (2001–2012), which are not shown here for brevity, had similar spatial patterns. Figure 3 shows the comparison between observed and MERRA-2 data for 2023. High PM2.5 concentrations were observed in the Eastern Region. The eastern part of Saudi Arabia, including the Eastern Province and the coastal areas along the Arabian Gulf, showed the highest PM2.5 concentrations, with values reaching around 68 µg/m3. The central region also exhibited moderate levels. Low PM2.5 concentrations were observed in the northwest and southwest of the country. The northwest, including areas along the Red Sea coast, and the southwest mountainous regions exhibited the lowest PM2.5 levels, with values dropping to 20 µg/m3 or lower. The western regions, including Makkah and Madinah, showed moderate values. There was a gradient from lower PM2.5 concentrations in the northwest to higher concentrations in the east-southeast, indicating a transition in PM2.5 levels.
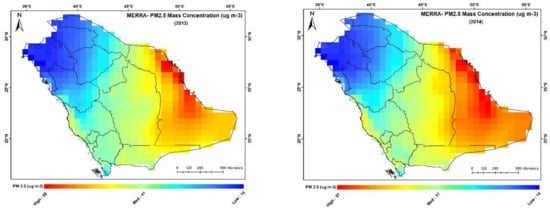
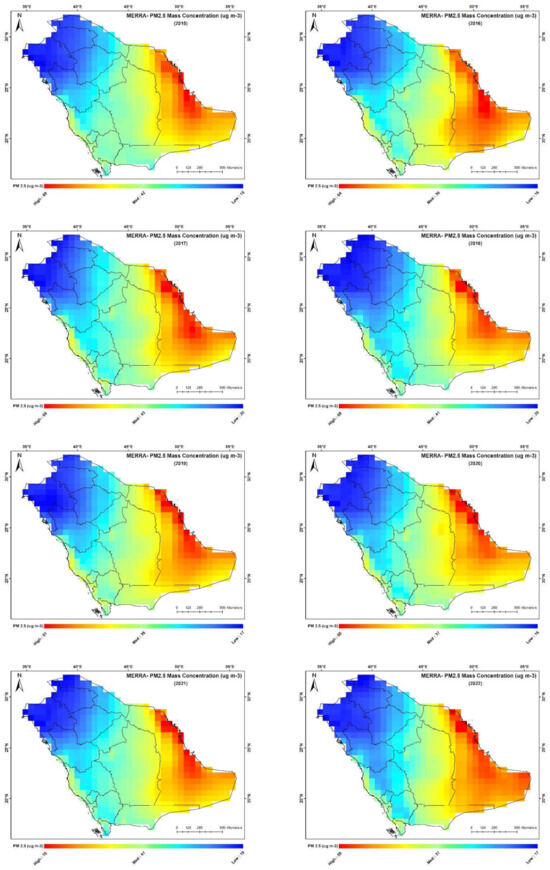
Figure 2.
MERRA-2 reanalysis-based bias-corrected annual PM2.5 concentration (µg m−3) from 2013 to 2022. The spatial resolution of the data is 0.5° (latitude) × 0.625° (longitude). The color scale indicates different concentration levels, with blue representing lower concentrations and red indicating higher concentrations.
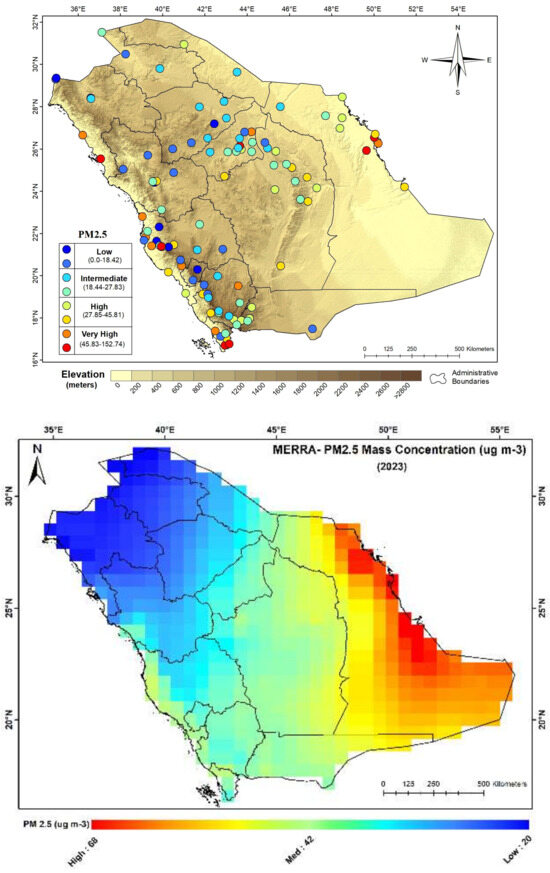
Figure 3.
Comparing PM2.5 concentrations (µg/m3) from the ground-level air quality monitoring network (upper panel) and MERRA-2 reanalysis (lower panel) for 2023. In the upper panel, ‘low’ shows values up to the first quartile (18.42 µg/m3), ‘intermediate’ shows values between the first quartile and median (27.82 µg/m3), ‘high’ shows values between the median and third quartile (45.81 µg/m3), and ‘very high’ shows values between the third quartile and maximum (152.74 µg/m3). The year 2023 has most of the air quality monitoring stations, which makes sense to be considered for comparison. The upper panel also shows the altitude (elevation in meters) of different regions in Saudi Arabia.
Potential causes of these spatial variations include the following: (a) Industrial and urban emissions: the eastern regions, particularly near Dammam, Jubail, and other industrial zones, have a high density of refineries, petrochemical industries, and urban emissions, which significantly contribute to higher PM2.5 levels. (b) Desert dust influence: The eastern and central parts of Saudi Arabia are more exposed to frequent dust storms, particularly during the summer months, which elevate PM2.5 levels. The Rub’ al Khali (Empty Quarter) desert, located in the southeast, is a major dust source for dust storms. (c) Meteorological factors: Wind patterns transport dust from the desert regions towards the east and central areas. (d) Topography and air circulation: The elevation differences also impact how pollutants accumulate or disperse in a region. Higher altitude is generally linked with efficient dispersion of locally emitted pollutants and vice versa. (e) Marine influence: The Arabian Gulf region has relatively high humidity, which can contribute to the formation of secondary aerosols, increasing PM2.5 concentrations.
Figure 3 presents a comparative analysis of PM2.5 concentrations derived from two different sources: ground-based air quality monitoring stations (Figure 3, upper panel) and the MERRA-2 reanalysis dataset (Figure 3, lower panel) across Saudi Arabia. Additionally, the upper panel of the figure illustrates the altitude of monitoring stations in different regions, providing an important geographical context for the observed air pollution patterns.
The spatial distribution of PM2.5 levels in both datasets revealed a clear trend: higher concentrations in the eastern regions and a progressive decline in the western parts of the country. While local-level variations existed in some cities due to specific environmental and anthropogenic factors, the general agreement between ground-based measurements and MERRA-2 data suggested that both sources effectively captured the overall pollution distribution. Notably, industrialized and urbanized areas, particularly in the eastern provinces, exhibited the highest PM2.5 levels, whereas the lowest concentrations were observed in higher-altitude regions in the west and northwest (Figure 3, lower panel).
A notable finding from this comparison is the inverse relationship between PM2.5 concentrations and altitude. The eastern regions, which have the lowest elevation, consistently reported the highest PM2.5 levels, while the elevated areas in the west and northwest experienced significantly lower pollution levels. This pattern suggested that altitude played a key role in shaping air quality, likely due to factors such as airflow dynamics, dispersion patterns, and meteorological influences. However, altitude alone was not the sole determinant of PM2.5 concentrations. Other factors, particularly industrialization, urbanization, meteorological parameters, and localized emission sources, contributed significantly to variations in pollution levels.
To quantify the association between altitude and PM2.5 concentrations, data from 20 cities were utilized. Table 1 presents a summary of key geographical and air quality attributes for selected cities, including city names, their average PM2.5 concentrations (µg/m3), latitude, longitude, and elevation. The locations of these cities are shown in Figure 4. Detailed data for all years and all sites are provided in the appendix. The PM2.5 concentrations were averaged over a 23-year period (2001–2023) for each city, providing a long-term perspective on air pollution trends across different locations. To examine the relationship between city elevation and PM2.5 concentrations, Pearson’s correlation coefficient was computed. The analysis yielded a correlation coefficient of −0.27, suggesting a weak inverse relationship between the two variables. The negative sign of the correlation confirmed that, in general, PM2.5 concentrations tended to decrease as elevation increased. The p-value (0.2449) is greater than 0.05, meaning the correlation is not statistically significant at the 5% significance level. However, despite this inverse trend, the correlation strength was relatively low. This weak correlation can likely be attributed to confounding factors, including local meteorological conditions, emission sources, and urbanization patterns. Factors such as wind speed, temperature inversions, and proximity to pollution sources (e.g., industrial zones, traffic congestion, and biomass burning) played crucial roles in shaping PM2.5 distributions, potentially weakening the direct influence of elevation alone. Therefore, while the results indicated a general decline in PM2.5 concentrations with increasing elevation, a more comprehensive analysis incorporating meteorological parameters and emission inventories would be necessary to fully understand the mechanisms driving air pollution variations across different elevations.

Table 1.
City names, PM2.5 concentrations (µg/m3) averaged for 23 years (2001–2023) from MERRA-2, and their elevations (m).
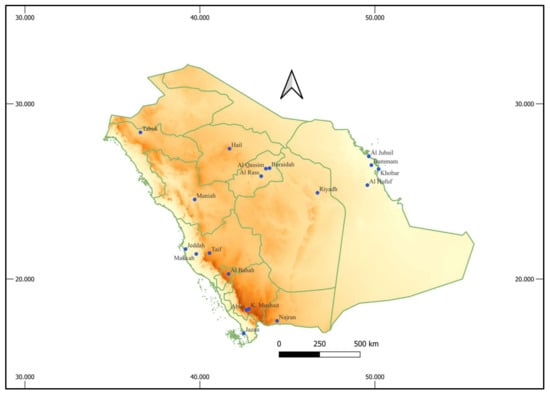
Figure 4.
Showing the names of cities in Saudi Arabia for which temporal analysis was carried out.
3.2. Historical Temporal Trend
In Figure 5 and Table 2, the trends in PM2.5 concentrations are shown by slopes, either negative or positive, where negative slopes indicate decreasing trends and positive slopes indicate increasing trends in PM2.5 concentrations (Figure 5 and Figure 6). These cities were selected merely as illustrative examples. The cities marked with ‘+’, “*”, “**”, and “***” indicate a statistically significant increasing or decreasing trend in PM2.5 levels at 90%, 95%, 99%, and 99.99% confidence levels, respectively. In contrast, cities with no ‘+’ or ‘*’ symbol indicate a non-significant trend. The cities of Dhahran (−0.690), Hufuf (−0.801), Jeddah (−0.352), Jubail (−0.716), Khobar (−0.313), and Najran (−0.750) have seen substantial improvements in air quality over the years. Abha (+0.167), Hail (+0.017), Makkah (+0.081), Madinah (+0.059), Qassim (+0.061), and Tabuk (+0.021) have experienced a positive trend, i.e., PM2.5 levels have increased in these cities over time. These regions might have experienced worsening air pollution, but the trends were not statistically significant. Several cities showed no clear long-term increasing or decreasing trend in PM2.5 levels as the slope values were zero or close to zero; for example, Buraidah (−0.007) and Taif (−0.006). These cities have non-significant negative trends in PM2.5 concentrations. The spatial distribution of slopes is depicted in Figure 6.
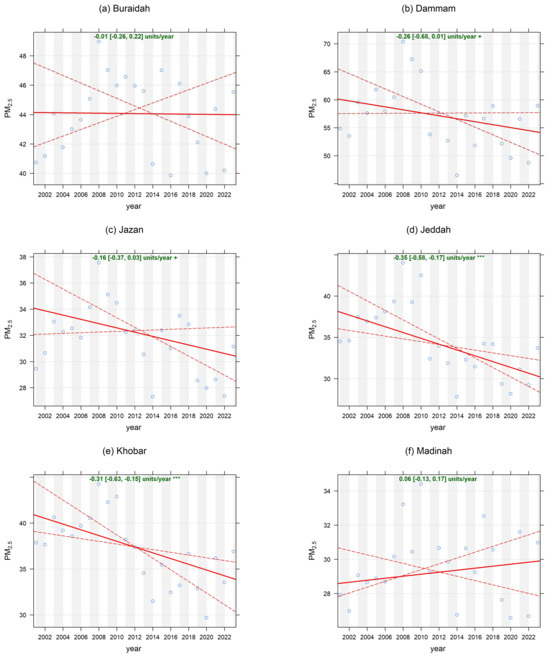
Figure 5.
Long-term temporal trend (µgm−3/year) in PM2.5 concentrations (2001–2023). Where p-star *** (p-value < 0.001) indicates significance at the 99.9% confidence level and a blank (p-value ≥ 0.1) indicates non-significance (less than the 90% confidence level). Note that the solid red line represents the trend in PM2.5 concentrations over time, and the dashed red lines indicate the confidence intervals or uncertainties around the trend line.
Table 2.
City-wise PM2.5 concentrations (µg/m3) and long-term trends (2001 to 2023) per year.
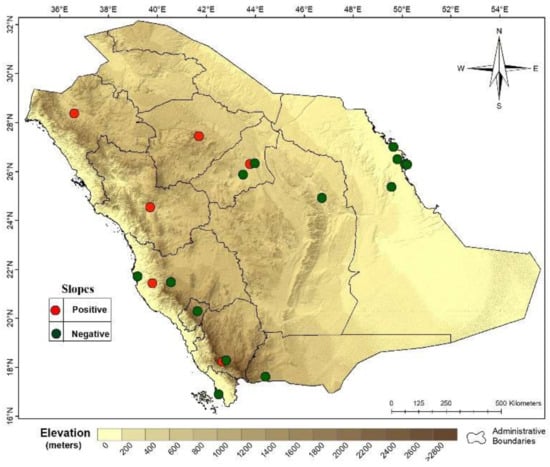
Figure 6.
Spatial distribution of trend slopes (µgm−3 year−1) based on reanalysis data (2001–2023) at the selected cities.
Considering the regional pattern, eastern cities experienced some of the highest PM2.5 levels; however, they showed significant downward trends in many areas. This indicated possible improvements due to stricter environmental regulations. The western city, Jeddah, showed a significant downward trend, whereas Makkah and Madinah had slightly increasing trends. The cities of Makkah and Madinah, being pilgrimage centers, may experience seasonal variations in air quality due to large population influxes from within Saudi Arabia and abroad. Among the southern cities, Jazan had the highest PM2.5 levels, but its downward trend was not significant. Najran, on the other hand, showed a strong, significant decrease in PM2.5 levels (−0.750). In northern and central cities, Riyadh had a high PM2.5 level (47.58 µg/m3) but had no significant trend. Qassim, Tabuk, and Hail showed slightly increasing trends but were not statistically significant.
In Figure 5, a linear trend was fitted to the data to estimate the annual rate of increase or decrease in PM2.5 concentrations. However, the observed trends were non-linear, and the linear models failed to capture the underlying variations in the data. In Figure 7, a non-linear smoothing technique (Generalized Additive Model) has been applied to better represent the long-term trends. The fitted smooth curves for six cities (selected randomly): Abha, Baha, Hail, Makkah, Hufuf, and Dhahran, demonstrated that PM2.5 concentrations did not follow a simple linear increase or decrease and instead exhibited distinct fluctuations over time. Three characteristic trend patterns emerged:
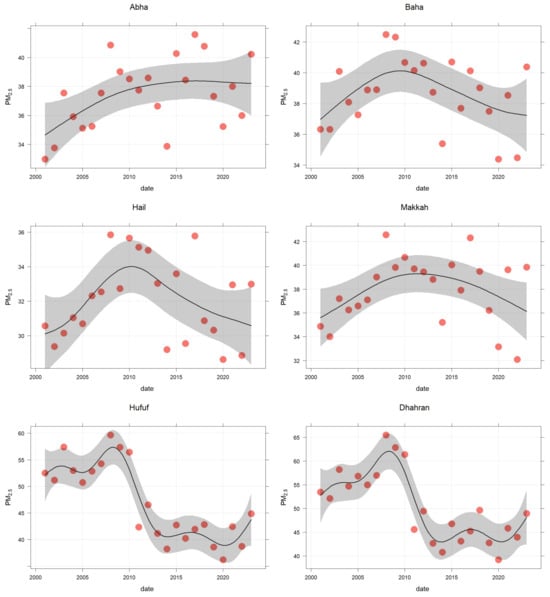
Figure 7.
Non-linear smoothing model fitted for Abha, Baha, Hail, Makkah, Hufuf, and Dhahran, illustrating long-term PM2.5 trends from 2001 to 2023. The non-linear smoothing technique is the Generalized Additive Model (GAM). The red dots show annual PM2.5 concentrations, and the blck solid line shows the smooth curve.
- Increasing trend: Abha was the only city that exhibited a statistically significant increase in PM2.5 levels (at the 90% confidence level). The concentration rose linearly until 2010; afterward, the trend stabilized, suggesting a plateau effect.
- Stable or non-significant trend: Many sites, including Hail and Makkah, followed a pattern of initial increase in PM2.5 concentrations until around 2010, followed by a gradual decline, leading to a more stable long-term trend. This suggested that emissions or atmospheric conditions influencing PM2.5 levels may have changed after 2010, contributing to a slowing or reversal of earlier trends.
- Significant reduction: Some sites, such as Dhahran and Hufuf, experienced a sharp and statistically significant decline in PM2.5 levels after 2010. However, PM2.5 levels slightly increased after 2020, indicating potential changes in emission sources, meteorological factors, or regulatory impacts.
These findings confirmed that long-term trends in PM2.5 concentrations were highly site-dependent and influenced by various environmental, meteorological, and anthropogenic factors. Non-linear modeling provided a more accurate representation of these complex trends compared to simple linear models (Figure 5).
3.3. Annual Cycle of PM2.5 and Correlation with Meteorological Parameters
PM2.5 levels in KSA show a clear seasonal trend, with higher concentrations in summer and lower levels in winter (Figure 8). The lowest concentrations were observed in January, February, November, and December, and the highest in June and July, followed by March. A similar seasonal trend was also demonstrated by Munir et al. [39], who stated that generally, both PM10 and PM2.5 concentrations showed higher levels in summer and during daytime and lower levels during winter and night times, which probably highlighted the role of high temperature in increasing the levels of particle pollution in Saudi Arabia. High temperatures can cause greater turbulence, atmospheric instability, and enhanced vertical and horizontal movement of particles. Correlation coefficients of PM2.5 with several meteorological parameters are shown in Table 3. Wind speed had a positive correlation (r = +0.53) with PM2.5 because high wind speed can stir up dust and resuspend fine particles, contributing to elevated PM2.5 levels, particularly in arid desert regions like Saudi Arabia. Atmospheric air pressure was negatively correlated, and temperature was positively correlated with PM2.5. Furthermore, both relative humidity and rainfall were negatively correlated with PM2.5 (Table 3). Higher humidity promotes the removal of PM2.5 through condensation and wet deposition (e.g., fog and mist), leading to cleaner air. Rainfall helps wash out airborne particles, contributing to lower PM2.5 levels during wetter months. Rainfall demonstrates a weak correlation with PM2.5, probably because Saudi Arabia experiences limited rainfall around the year.
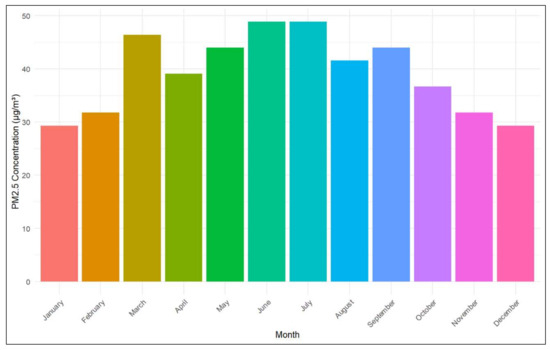
Figure 8.
Seasonal variation of monthly average PM2.5 concentration in KSA (monthly average 2001–2023).
Table 3.
Correlation between PM2.5 and meteorological parameters.
3.4. Results of the Validation of MERRA-2 Data
Table 4 shows several metrics to compare MERRA-2 with in situ observations. The fraction of data within a factor of 2 (FAC2) was 0.99, meaning 99% of the modeled values were within a factor of two of the observed values. The Mean Bias (MB) value of 9.74 µg/m3 meant that MERRA-2 slightly overestimated PM2.5 on average. Generally, a near-zero bias is ideal. Mean Absolute Error (MAE) of 10.20 µg/m3, indicated the average absolute error between MERRA-2 and observed values. Normalized Mean Bias (NMB) of 0.39 meant that MERRA-2’s overall bias was very small compared to observed values. The Normalized Mean Gross Error (NMGE) value was 0.45 and the Root Mean Square Error (RMSE) was 11.32 µg/m3, measuring the overall error magnitude. The Index of Agreement (IOA) was 0.07, which measured the MERRA-2 ability to predict variations, suggesting low agreement between the two datasets. Generally, a value closer to 1 indicates better agreement. Overall, error values were low as indicated by these metrics (Table 4), indicating a good association between the two datasets. The correlation coefficient was also low (0.54), showing a good association between MERRA-2 and observed PM2.5 concentrations. A p-value of 0.000005 meant that the correlation was statistically highly significant. Error metrics provided here considered the difference between the two datasets, while correlation coefficients considered their trends and patterns, ignoring the difference. This was therefore vital to compute all these metrics.
Table 4.
Comparison of MERRA-2 and observational data for PM2.5 concentrations in 2023 in terms of statistical metrics.
Although the correlation coefficient of 0.54 is significant, some of the error metrics are higher, which indicates that MERRA-2 has some potential error compared to the in situ observations, which are due to the following: (a) MERRA-2 reanalysis provides data at a coarse spatial resolution, which may not capture the fine-scale variations in urban and roadside pollution observed at ground-level monitoring stations. (b) MERRA-2 data relies on satellite-derived estimates of PM2.5 and global emission inventories, which may not fully account for local PM2.5 sources, such as traffic emissions, industrial activities, and dust resuspension in urban environments. (c) The reanalysis dataset may not accurately resolve local meteorological conditions (e.g., wind speed, temperature, and humidity) that significantly influence PM2.5 concentrations, especially in complex urban terrains. (e) MERRA-2 estimates tend to underestimate peak pollution episodes, particularly during dust storms, stagnant atmospheric conditions in urban areas, or localized emissions, leading to discrepancies in PM2.5 estimates. Sayeed et al. [40] reported that PM2.5 concentrations derived from MERRA-2 data can have potential biases in specific regions and seasons due to multiple factors, including missing aerosol components (like nitrates), the coarse resolution of the model, lack of accurate vertical profiles, and emission uncertainties in the model. Despite these challenges, MERRA-2 remains a widely used dataset for air quality assessments, particularly in regions with sparse monitoring networks. Our findings highlight these limitations while demonstrating the potential applicability of MERRA-2 data in air quality analysis.
A scatter plot (upper panel) and a residual plot (lower panel) between observed and MERRA-2 PM2.5 concentrations are shown in Figure 9. The residual values show the differences between observed PM2.5 values and MERRA-2 estimates. The red dashed line at zero represents perfect agreement, and points deviating from it indicate differences between the two datasets (Figure 9). The residual plot showed that the difference between observed PM2.5 and MERRA-2 estimates was negative at lower PM2.5 concentrations and turned positive at high PM2.5 concentrations. This showed that MERRA-2 overestimated lower values and underestimated higher values of PM2.5.
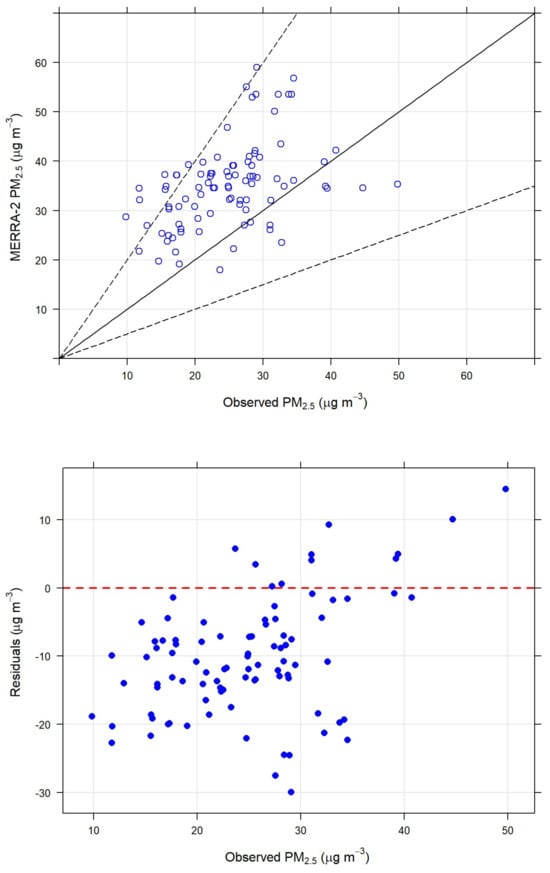
Figure 9.
Scatter plot of observed vs. MERRA-2 (upper panel), and residual plots of observed PM2.5 concentrations (µg/m3) vs. residuals (residuals = observed—MERRA-2) (lower panel). The red dashed line (lower-panel) shows the zero line. The dashed black lines (upper-panel) show the within factor of two (FAC2) region. The middle (solid black) line is 1:1, the above (dashed black) is 0.5:1 line and below (dashed black) is 2:1 line.
He et al. [41] made a comparison of daily mean PM2.5 concentrations derived from MERRA-2 and 476 ground stations over the Yangtze River Basin (YRB) in China. They calculated various statistical metrics to make a comparison between MERRA-2 and ground-level PM2.5 concentrations in different regions. The values of statistical metrics varied in different regions; however, overall their RMSE values were higher as compared to the current study. They reported higher R values, except at Sichuan Basin (SB), where the R value was 0.31. Jin et al. [42] performed a validation of MERRA-2-derived PM2.5 concentrations at the Global level and reported lower values of R (0.23) and higher values of RMSE (53.02) and MAE (12.06). Navinya et al. [43] compared ground-level and MERRA-2-derived PM2.5 concentrations, which showed much higher error in terms of RSME and MAE but better correlation (Table 5). This literature review highlights that the relationship between MERRA-2 and ground-level PM2.5 demonstrates spatial variability and varies at different time resolutions.
Table 5.
Comparison of different studies in terms of statistical metrics for validating MERRA-2 PM2.5 concentrations.
4. Conclusions
This study analyzed the spatial and temporal variability of PM2.5 concentrations in Saudi Arabia using both MERRA-2 reanalysis and ground-level observation data. Results indicated that PM2.5 concentrations were generally higher in the eastern and southeastern regions (Empty Quarter), while the central region exhibited moderate levels. In contrast, lower PM2.5 concentrations were observed in the northwestern and southwestern parts of the country. A spatial analysis of PM2.5 based on ground-level observations further confirmed this pattern, aligning well with MERRA-2 reanalysis data. The observed southeast-to-northwest gradient in PM2.5 concentrations highlighted the importance of integrating both ground-based and satellite/reanalysis data to obtain a more comprehensive understanding of air pollution dynamics in the region.
While altitude played a role in regional PM2.5 variations, human activities, particularly industrial emissions, and urbanization, remained the dominant contributors to elevated PM2.5 levels. Lowland urban centers in eastern Saudi Arabia (Dhahran, Hufuf, Jubail, and Khobar) showed a statistically significant decline in PM2.5 levels over the study period, suggesting that recent air quality control measures had been effective in these areas. However, in western and southern cities (Jazan, Makkah, Madinah, and Riyadh), PM2.5 concentrations remained relatively high, with no clear decreasing trend, highlighting the need for stronger pollution control measures.
Out of 20 monitoring sites, 14 exhibited decreasing trends in PM2.5 levels from 2001 to 2023, signaling long-term improvements in air quality. Analysis showed that the long-term trend in PM2.5 concentrations followed a non-linear trend; however, the trend was highly site-dependent and influenced by various environmental, meteorological, and anthropogenic factors. Non-linear modeling provided a more accurate representation of these complex trends compared to simple linear models.
Nevertheless, sustained efforts are required to ensure continued progress in reducing air pollution across the country. Saudi Arabia has already implemented several initiatives to address air pollution, including tightening industrial emission standards, expanding renewable energy projects (such as NEOM and the Saudi Green Initiative), and enhancing environmental monitoring systems. To further improve air quality, the following additional measures are recommended:
- (1)
- Strengthening Industrial Regulations: Continue enforcing strict emission control regulations on power plants, refineries, and industrial facilities, especially in high-pollution regions like Riyadh, Jazan, and Makkah. Promoting the adoption of cleaner production technologies and encouraging industrial transition to low-emission energy sources.
- (2)
- Expanding Green and Renewable Energy Initiatives: Accelerating the shift toward solar and wind energy projects to reduce reliance on fossil fuels, thereby lowering PM2.5 emissions from power generation. Encouraging the use of electric vehicles (EVs) and enhancing public transportation infrastructure to minimize traffic-related emissions.
- (3)
- Enhancing Dust and Sandstorm Mitigation Strategies: Investing in vegetation and afforestation programs, particularly in arid regions, to help reduce the resuspension of dust particles. Implementing urban planning strategies that minimize dust exposure, such as improved road infrastructure and dust suppression techniques.
- (4)
- Strengthening Air Quality Monitoring and Public Awareness: Expanding the air quality monitoring network to cover more cities, and rural and remote areas, ensuring real-time data availability for policymakers and researchers. Promoting public awareness campaigns about the health risks of PM2.5 exposure and encouraging community involvement in air quality improvement efforts.
- (5)
- Developing a Sand and Dust Storm (SDS) Pre-Warning System: Such a system is essential to protect public health, transportation, and infrastructure. The Core Components of the SDS Pre-Warning System are as follows: (a) Data Collection and Monitoring; (b) Forecasting and Early Warning; and (c) Communication and Public Awareness.
Future work includes quantifying emission sources of particulate matter and developing emission inventories for all emission sources.
This study provides a comprehensive analysis of spatial and temporal trends in PM2.5 concentrations across Saudi Arabia using MERRA-2 reanalysis data and in situ observations. The study also employs advanced visualization and analysis techniques using both linear and non-linear approaches. However, there are some potential weaknesses that could be improved in future studies. (a) Emission sources: While the study highlights that human activities, such as industrial emissions and urbanization, are key contributors to elevated PM2.5 levels in Saudi Arabia, there is no analysis of specific emission sources (e.g., transportation, industry, dust storms) due to data availability constraints. The study does not provide an emission inventory map of the emission sources. Future studies could develop detailed emission inventories for different sectors (e.g., industrial and road transport) to better understand the contributions of each source to PM2.5 levels across the country. (b) The impact of policy interventions: In this study, we did not quantify the impact of various policy interventions that have been implemented in Saudi Arabia over the study period. While the study mentions that certain air quality control measures have been effective in certain areas, it does not provide a direct assessment or measurement of how these interventions specifically influenced PM2.5 concentrations over time. This could limit the ability to evaluate the effectiveness of past policies and shape future interventions. In future studies, we aim to employ statistical techniques to directly quantify the impact of policy interventions on PM2.5 levels, using before-and-after comparisons, regression models, machine learning, or control group analysis. Along with the environmental data, integrating economic and health data will offer a more holistic view of the policies’ success and guide future decision-making. (c) Limited focus on urban areas: The study mentions urbanization but does not go into detail about the impact of specific cities (other than general observations about Dhahran, Hufuf, Jubail, and Khobar) or the effects of urban sprawl, traffic, and industrial activity on PM2.5 concentrations in major metropolitan areas like Riyadh, Jazan, and Makkah. A more detailed examination of urban-specific factors influencing PM2.5, such as traffic emissions, construction activities, and local industrial pollution, could provide a deeper understanding of air quality challenges in urban areas. Specific studies on major cities should be conducted for detailed analysis.
Author Contributions
This article has been written by several authors, each contributing in different ways. Conceptualization, S.M., M.H.S., T.M.A.H. and A.O.Z.; methodology, S.M. and M.H.S.; software, S.M. and M.H.S.; validation, S.M.; formal analysis, S.M., M.H.S. and N.E.A.-Z.; investigation, S.M., T.M.A.H., M.H.S.; resources, S.M., A.O.Z. and T.M.A.H.; data curation, S.M. and M.H.S.; writing—original draft preparation, S.M. and M.H.S.; writing—review and editing, S.M., M.H.S., T.M.A.H., A.O.Z., M.N.I., A.A.K., A.A.B., M.I., N.E.A.-Z. and S.Z.A.-B.; visualization, S.M. and M.H.S.; supervision, T.M.A.H., A.O.Z.; project administration, S.Z.A.-B., M.I., N.E.A.-Z.; funding acquisition, none. All authors have read and agreed to the published version of the manuscript.
Funding
This research received no external funding.
Institutional Review Board Statement
Not applicable.
Informed Consent Statement
All authors have provided informed consent for the publication of this paper in this journal.
Data Availability Statement
MERRA-2 data is freely downloadable from: NASA’s GES DISC (Goddard Earth Sciences Data and Information Services Center) via the website https://disc.gsfc.nasa.gov. Authors have no permission to share in-situ Air Quality data.
Conflicts of Interest
The authors declare no conflict of interest.
References
- Aguilera, R.; Corringham, T.; Gershunov, A.; Benmarhnia, T. Wildfire Smoke Impacts Respiratory Health More Than Fine Particles from Other Sources: Observational Evidence from Southern California. Nat. Commun. 2021, 12, 21708. [Google Scholar] [CrossRef] [PubMed]
- Duarte, R.; Duarte, A. Urban Atmospheric Aerosols: Sources, Analysis, and Effects. Atmosphere 2020, 11, 1221. [Google Scholar] [CrossRef]
- Han, L.; Zhou, W.; Li, W.; Li, L. Impact of Urbanization Level on Urban Air Quality: A Case of Fine Particles (PM2.5) in Chinese Cities. Environ. Pollut. 2014, 194, 163–170. [Google Scholar] [CrossRef]
- Wellenius, G. Ambient Air Pollution and the Risk of Acute Ischemic Stroke. Arch. Intern. Med. 2012, 172, 229–234. [Google Scholar] [CrossRef]
- Yang, M.; Wang, Y.; Liu, Q.; Ding, A.; Li, Y. The Influence of Sandstorms and Long-Range Transport on Polycyclic Aromatic Hydrocarbons (PAHs) in PM2.5 in the High-Altitude Atmosphere of Southern China. Atmosphere 2015, 6, 1633–1651. [Google Scholar] [CrossRef]
- Yoshida, Y. Oxidative Stress Induced by Air Pollution. Antioxidants 2024, 13, 1393. [Google Scholar] [CrossRef]
- Langrish, J.; Li, X.; Wang, S.; Lee, M.; Barnes, G.; Miller, M.; Jiang, L. Reducing Personal Exposure to Particulate Air Pollution Improves Cardiovascular Health in Patients with Coronary Heart Disease. Environ. Health Perspect. 2012, 120, 367–372. [Google Scholar] [CrossRef]
- Lelieveld, J.; Evans, J.S.; Fnais, M.; Giannadaki, D.; Pozzer, A. The Contribution of Outdoor Air Pollution Sources to Premature Mortality on a Global Scale. Nature 2015, 525, 367–371. [Google Scholar] [CrossRef]
- Liu, Q.; Xu, C.; Ji, G.; Liu, H.; Wentao, S.; Zhang, C.; Zhao, P. Effect of Exposure to Ambient PM2.5 Pollution on the Risk of Respiratory Tract Diseases: A Meta-Analysis of Cohort Studies. J. Biomed. Res. 2017, 31, 130–142. [Google Scholar]
- Pope, C.A.; Dockery, D.W. Health Effects of Fine Particulate Air Pollution: Lines That Connect. J. Air Waste Manag. Assoc. 2006, 56, 709–742. [Google Scholar] [CrossRef]
- Southerland, V.; Bräuer, M.; Mohegh, A.; Hammer, M.; Donkelaar, A.; Martin, R.; Anenberg, S. Global Urban Temporal Trends in Fine Particulate Matter (PM2.5) and Attributable Health Burdens: Estimates from Global Datasets. Lancet Planet. Health 2022, 6, e139–e146. [Google Scholar] [CrossRef] [PubMed]
- Li, Y.; Pang, W.; Sun, C.; Zhou, Q.; Lin, Z.; Chang, Y.; Duan, X. Smartphone-Enabled Aerosol Particle Analysis Device. IEEE Access 2019, 7, 101117–101124. [Google Scholar] [CrossRef]
- Pun, V.; Kazemiparkouhi, F.; Manjourides, J.; Suh, H. Long-Term PM2.5 Exposure and Respiratory, Cancer, and Cardiovascular Mortality in Older US Adults. Am. J. Epidemiol. 2017, 186, 961–969. [Google Scholar] [CrossRef] [PubMed]
- Yuan, Z.; Yi, H.; Zhao, C.; Li, Y. Relationship Between Concentration of Fine Particulate Matter and Plasma VWF Level in Healthy Young Adults. Adv. Mater. Res. 2014, 886, 345–348. [Google Scholar] [CrossRef]
- Ostro, B.; Hu, J.; Goldberg, D.; Reynolds, P.; Hertz, A.; Bernstein, L.; Kleeman, M. Associations of Mortality with Long-Term Exposures to Fine and Ultrafine Particles, Species and Sources: Results from the California Teachers Study Cohort. Environ. Health Perspect. 2015, 123, 549–556. [Google Scholar] [CrossRef]
- Suradi, H.; Khan, M.; Sairi, N.; Rahim, H.; Yusoff, S.; Fujii, Y.; Latif, M. Influence of North-Easterly Monsoon on Carbonaceous Particles and Polycyclic Aromatic Hydrocarbons in PM2.5 in the City of Kuala Lumpur, Malaysia. Preprints 2021, 202101, 0362. [Google Scholar]
- Wang, R.; Zhao, H.; Wang, X.; Li, J. Air Microfluidic Chip Design for Atmospheric Particulate Matter Detection. Proc. SPIE 2023, 12, 2681799. [Google Scholar]
- Lin, Z.; Niu, Y.; Jiang, Y.; Chen, B.; Li, P.; Mi, T.; Kan, H. Protective Effects of Dietary Fish-Oil Supplementation on Skin Inflammatory and Oxidative Stress Biomarkers Induced by Fine Particulate Air Pollution: A Pilot Randomized, Double-Blind, Placebo-Controlled Trial. Br. J. Dermatol. 2020, 184, 261–269. [Google Scholar] [CrossRef]
- Wieczorek, J.; Baran, A.; Pawlik, E.; Mądro, I.; Gąsienica, A.; Wojtaszek, I.; Antonkiewicz, J. Assessment of the Health Risk Associated with Exposure to Heavy Metals Present in Particulate Matter Deposition in the Małopolska Province. Geol. Geophys. Environ. 2021, 47, 95–107. [Google Scholar] [CrossRef]
- Goudie, A.S. Desert Dust and Human Health Disorders. Environ. Int. 2014, 63, 101–113. [Google Scholar] [CrossRef]
- Isaifan, R. Air Pollution Burden of Disease Over Highly Populated States in the Middle East. Front. Public Health 2023, 10, 1002707. [Google Scholar] [CrossRef] [PubMed]
- Almulhim, A.; Abubakar, I. Understanding Public Environmental Awareness and Attitudes Toward Circular Economy Transition in Saudi Arabia. Sustainability 2021, 13, 10157. [Google Scholar] [CrossRef]
- Banaga, A.O.; Riyadh, I.M.; Alghamdi, M.A.; Khoder, M.I.; Shamy, M.; Costa, M. Assessment of Air Quality in Makkah, Saudi Arabia: Particulate Matter Pollution and Source Identification. Environ. Pollut. 2020, 258, 113698. [Google Scholar]
- Elminir, H.K. Dependence of Urban Air Pollutants on Meteorology. Sci. Total Environ. 2005, 350, 225–237. [Google Scholar] [CrossRef]
- Munir, S.; Habeebullah, T.M. Vehicular Emissions on Main Roads in Makkah, Saudi Arabia—A Dispersion Modelling Study. Arab. J. Geosci. 2018, 11, 531. [Google Scholar] [CrossRef]
- Munir, S.; Luo, Z.; Dixon, T.; Manla, G.; Francis, D.; Chen, H.; Liu, Y. The impact of smart traffic interventions on roadside air quality employing machine learning approaches. Transp. Res. Part D Transp. Environ. 2022, 110, 103408. [Google Scholar] [CrossRef]
- Munir, S.; Gabr, S.; Habeebullah, T.M.; Janajrah, M.A. Spatiotemporal Analysis of Fine Particulate Matter (PM2.5) in Saudi Arabia Using Remote Sensing Data. Egypt. J. Remote Sens. Space Sci. 2016, 19, 195–205. [Google Scholar] [CrossRef][Green Version]
- Mahmood, H.; Alkhateeb, T.; Al-Qahtani, M.; Allam, Z.; Ahmad, N.; Furqan, M. Energy Consumption, Economic Growth and Pollution in Saudi Arabia. Manag. Sci. Lett. 2020, 10, 979–984. [Google Scholar] [CrossRef]
- Buchard, V.; Randles, C.A.; da Silva, A.M.; Darmenov, A.; Colarco, P.R.; Govindaraju, R.; Pierce, R.B. The MERRA-2 Aerosol Reanalysis, 1980 Onward. Part II: Evaluation and Case Studies. J. Clim. 2017, 30, 6851–6872. [Google Scholar] [CrossRef]
- Randles, C.A.; da Silva, A.M.; Buchard, V.; Colarco, P.R.; Darmenov, A.; Govindaraju, R.; Pierce, R.B. The MERRA-2 Aerosol Reanalysis, 1980 Onward. Part I: System Description and Data Assimilation Evaluation. J. Clim. 2017, 30, 6823–6850. [Google Scholar] [CrossRef]
- Ali, M.; Nichol, J.; Bilal, M.; Qiu, Z.; Mazhar, U.; Wahiduzzaman, M.; Islam, M. Classification of Aerosols Over Saudi Arabia from 2004–2016. Atmos. Environ. 2020, 241, 117785. [Google Scholar] [CrossRef]
- Yu, Y.; Notaro, M.; Liu, Z.; Wang, F.; Alkolibi, F.; Fadda, E.; Bakhrjy, F. Climatic Controls on the Interannual to Decadal Variability in Saudi Arabian Dust Activity: Toward the Development of a Seasonal Dust Prediction Model. J. Geophys. Res. Atmos. 2015, 120, 1739–1758. [Google Scholar] [CrossRef]
- Yu, Y.; Notaro, M.; Liu, Z.; Kalashnikova, O.; Alkolibi, F.; Fadda, E.; Bakhrjy, F. Assessing Temporal and Spatial Variations in Atmospheric Dust Over Saudi Arabia Through Satellite, Radiometric, and Station Data. J. Geophys. Res. Atmos. 2013, 118, 23. [Google Scholar] [CrossRef]
- Rizza, U.; Mancinelli, E.; Morichetti, M.; Passerini, G.; Virgili, S. Aerosol Optical Depth of the Main Aerosol Species Over Italian Cities Based on the NASA/MERRA-2 Model Reanalysis. Atmosphere 2019, 10, 709. [Google Scholar] [CrossRef]
- Masoud, A. Spatio-Temporal Patterns and Trends of the Air Pollution Integrating MERRA-2 and In Situ Air Quality Data Over Egypt (2013–2021). Air Qual. Atmos. Health 2023, 16, 1543–1570. [Google Scholar] [CrossRef]
- Ou, Y.; Li, Z.; Chen, C.; Zhang, Y.; Li, K.; Shi, Z.; Luo, J. Evaluation of MERRA-2 Aerosol Optical and Component Properties Over China Using SONET and PARASOL/GRASP Data. Remote Sens. 2022, 14, 821. [Google Scholar] [CrossRef]
- Carslaw, D.C.; Ropkins, K. Openair—An R Package for Air Quality Data Analysis. Environ. Model Softw. 2012, 27, 52–61. [Google Scholar] [CrossRef]
- R Core Team. R: A Language and Environment for Statistical Computing; R Foundation for Statistical Computing: Vienna, Austria, 2024. [Google Scholar]
- Munir, S.; Habeebullah, T.M.; Mohammed, A.M.F.; Morsy, E.A.; Rehan, M.; Ali, K. Analysing PM2.5 and its Association with PM10 and Meteorology in the Arid Climate of Makkah, Saudi Arabia. Aerosol Air Qual. Res. 2017, 17, 453–464. [Google Scholar] [CrossRef]
- Sayeed, A.; Lin, P.; Gupta, P.; Tran, N.N.M.; Buchard, V.; Christopher, S. Hourly and Daily PM2.5 Estimations Using MERRA-2: A Machine Learning Approach. Earth Space Sci. 2022, 9, e2022EA002375. [Google Scholar] [CrossRef]
- He, L.; Lin, A.; Chen, X.; Zhou, H.; Zhou, Z.; He, P. Assessment of MERRA-2 Surface PM2.5 over the Yangtze River Basin: Ground-Based Verification, Spatiotemporal Distribution and Meteorological Dependence. Remote Sens. 2019, 11, 460. [Google Scholar] [CrossRef]
- Jin, C.; Wang, Y.; Li, T.; Yuan, Q. Global Validation and Hybrid Calibration of CAMS and MERRA-2 PM2.5 Reanalysis Products Based on OpenAQ Platform. Atmos. Environ. 2022, 274, 118972. [Google Scholar] [CrossRef]
- Navinya, C.D.; Vinoj, V.; Pandey, S.K. Evaluation of PM2.5 Surface Concentrations Simulated by NASA’s MERRA Version 2 Aerosol Reanalysis over India and Its Relation to the Air Quality Index. Aerosol Air Qual. Res. 2020, 20, 1329–1339. [Google Scholar] [CrossRef]
Disclaimer/Publisher’s Note: The statements, opinions and data contained in all publications are solely those of the individual author(s) and contributor(s) and not of MDPI and/or the editor(s). MDPI and/or the editor(s) disclaim responsibility for any injury to people or property resulting from any ideas, methods, instructions or products referred to in the content. |
© 2025 by the authors. Licensee MDPI, Basel, Switzerland. This article is an open access article distributed under the terms and conditions of the Creative Commons Attribution (CC BY) license (https://creativecommons.org/licenses/by/4.0/).