Abstract
Calibration is crucial in quantitative analysis, ensuring the traceability of standards for an accurate comparison of results. In mercury determinations, a gas calibrator unit containing liquid mercury is used for calibration by injecting headspace volumes via syringe. The Dumarey equation has been used for over 35 years to calculate mercury headspace concentration, aligning closely with saturated vapor pressure equations. However, the 2006 Huber equation yields different values, creating discrepancies. This paper compares calibrations using the Dumarey equations against NIST 3133 certified reference material, with detection by a cold vapor atomic fluorescence spectrophotometer (CV-AFS). The gas standard was injected directly, while HgII in NIST 3133 was reduced to Hg0 and captured on gold traps. Across 10–24 °C, the Hg0 concentration was determined, with uncertainties ranging from 2.9% to 8.4% for a coverage factor of two. No significant differences were found between calibrations using NIST 3133 and the Dumarey equation. These findings provide crucial insights into the traceability and accuracy of mercury calibration methods, ensuring the reliability of measurements used for environmental monitoring and regulatory compliance.
1. Introduction
With the signing of the UNEP Minamata Convention in 2013 and its ratification in 2017, the world’s governments have accepted that mercury (Hg) is a toxic metal of global relevance; scientific needs will therefore need to shift towards the best implementation practices of the Convention [1]. The Convention requests that each Party implement activities to reduce emissions and releases of mercury to the environment and report on the measures taken and the effectiveness of these measures.
Robust, defensible, and traceable measurements of mercury are essential to underpin global efforts to reduce the concentration of mercury in the environment, meet the legislative obligations, and protect human health [2,3]. Metrological infrastructure is required to measure key mercury species in all relevant environmental compartments, thereby traceably and defensibly meeting current legislative obligations and discharging Europe’s global obligation.
Mercury is reactive, difficult to store and handle, and extremely difficult to measure as it easily evaporates from the solution or adsorbs on the sample containers even before the analysis is being carried out [4]. Mercury generators for the calibration of gaseous elemental mercury (Hg0) [5] and/or gaseous HgII [6,7] calibrators are used in the field. Currently, traceable methods and gas phase calibration standards for elemental mercury are based upon a measured headspace concentration from a saturated calibration vessel [8,9,10] or by the use of mercury vapor pressure equations to calculate the headspace concentration [11]. Depending on the used temperature, these approaches can differ considerably from each other [12,13].
For elemental mercury determinations, there are two main ways through which a traceable calibration can be achieved. The first uses HgII Certified Reference Materials (CRMs) (e.g., Standard Reference Material SRM NIST 3133 or SRM NIST 3177). The oxidized mercury in these liquid standards is reduced to elemental mercury which is then analyzed and can be used for calibration purposes. In this case, the measurements are traceable to international standards. The second option is to use mercury-saturated air. For the calibration using this option, a calibrator vessel for generating mercury-saturated air is required. Through equilibrium, the air inside the vessel will be saturated with mercury, the concentration being dependent on temperature. The mercury-saturated air inside can be removed through a pierceable septum, using a syringe.
One equation which describes the concentration of mercury-saturated air at different temperatures is the empirical Dumarey equation:
where γHg is the mercury mass concentration at the saturation point (ng mL−1), and T is the temperature of air (K), while A, B, and D are constants which are equal to −8.134459741, 3240.871534 K, and 3,216,522.61 K ng mL−1. The equation was developed from experimental data comparing the mercury concentration in a calibration vessel (a bell jar) between 288 and 298 K with liquid standard solutions [14]. A least-squares regression method of the measurement results has been used to elaborate the equation, which has been tested for Hg masses up to 50 ng, and was later used for different temperature ranges of the calibration vessel, showing that the equation is not limited to the initial experimental parameters [9]. The equation was adopted by the research community, standardization committees [15,16], and instrument vendors [17,18].
Later, the Huber equation was introduced as the most accurate vapor pressure expression for elemental Hg, offering the lowest uncertainty dataset [11]. A significant 7% difference exists between the calculated mercury concentrations using each equation at 20 °C [19]. This prompted the question of which equation is more suitable for use. The observed discrepancy between the theoretical concentrations of the two equations is expected, considering that one provides the measured Hg concentration at atmospheric pressure (Dumarey), while the other relies on saturated vapor pressure within high vacuum conditions (Huber). The conversion of saturated vapor pressure to a concentration assumes an ideal gas law. It is important to note that errors in comparing the two equations can arise due to the misclassification of the Dumarey equation as a vapor pressure equation. This misclassification could potentially lead to incorrect conclusions and methodologies when comparing it to the Huber equation. Recently, a significant advancement has been made in the field. A primary mercury gas standard was established using diffusion cells [9], refining previous efforts [20]. This research pinpointed a bias between the primary gas standard and the bell-jar output. The measurements were conducted at 16 and 18 °C within the gas calibrator unit, which employs the Dumarey equation for calculating mercury vapor concentration. In a parallel effort, Quétel et al. (2016) identified an underestimation issue linked to the Dumarey equation [12]. Their investigation covered the temperature range of 15–30 °C, revealing a substantial up to 12% difference between experimental and theoretical data at higher temperatures. However, their study was limited by a relatively small dataset and with no mention of the correction coefficient of the expansion of calibration gas due to differences between the temperature of the calibration unit and the ambient air [21,22].
In this study, we set out to assess the suitability of bell-jar headspace gas standards for calibration across two distinct concentration ranges. These ranges were specifically chosen to align with elemental mercury levels in the ambient air and riverine water samples. Our analysis involves comparing data obtained using the Huber and Dumarey equations against results from NIST 3133. This comparison is carried out alongside corresponding expanded measurement uncertainty budgets, allowing us to determine statistical differences and potential biases. The goal was to ascertain whether there were significant differences between these two calibration approaches. Additionally, we placed a strong emphasis on demonstrating the traceability of the gas standard to the International System of Units (SI), and we provided comprehensive expanded measurement uncertainty budgets for all calibration methods employed.
2. Materials and Methods
2.1. Calibration Methods
2.1.1. NIST 3133 Calibration
The mercury standard solution, SRM NIST 3133 (National Institute of Science and Technology, Gaithersburg, MD, USA), lot No. 160921 which has a concentration of 10.004 mg g−1 ± 0.040 mg g−1 HgII was used as the primary standard. The working standards have been diluted from the initial NIST 3133 ampule, with a similar matrix (10% v/v HNO3 in Milli-Q water—type 1 purified water with an electrical resistivity of 18.2 MΩ cm). All working standards were made and calculated gravimetrically in a temperature-controlled laboratory in order to avoid any error that might be brought up by density issues such as when diluting the standards and calculating the final concentration solely by volume.
To analyze the NIST 3133, appropriate masses of the working standards were pipetted in glass impingers containing 50 mL of Milli-Q water and 2 mL of a SnCl2 reducing solution (10% w/v tin(II) chloride (SnCl2·2H2O max. 0.000001% Hg, Merck, Darmstadt, Germany) in 10% v/v hydrochloric acid (HCl, Suprapur, Merck, Darmstadt, Germany)). The SnCl2 solution was added to reduce Hg2+(aq) from the NIST 3133 standard to Hg0(g). The solution is then purged with 50 mL min−1 of nitrogen gas for 4 min to capture purged Hg0 on gold traps.
The gold traps were made of quartz tubes which contained gold-coated silica particles constrained in place by quartz wool. Soda lime (Merck, Darmstadt, Germany) traps have been placed between the impingers and the gold traps, as humidity and acid gases can affect the amalgamation. After the Hg0 has been purged and captured on a gold trap (Figure 1A), the gold trap was placed in the double amalgamation system (Figure 1C) and measured using cold vapor atomic fluorescence spectrometry (CV-AFS), similar to previous work in the literature [23,24].
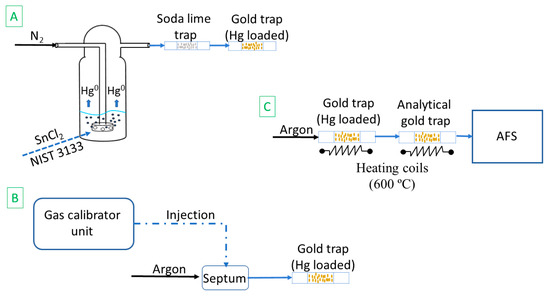
Figure 1.
Experimental set-up: (A) trap loading using NIST 3133; (B) trap loading using a gas calibrator unit; and the (C) double amalgamation and AFS detection.
The CV-AFS detector (Tekran® Mercury Detector 2500, Tekran, ON, Canada) has an in-built argon flowmeter which was set to 50 mL min−1. In order to desorb the Hg0 from the gold, the trap was heated for 30 s to approximately 600 °C using induction with Kanthal D alloy wires (Kanthal, Hallstahammar, Sweden, 0.9 mm, electrical resistance 2.135 Ω m−1). The released Hg0 was carried by the argon flow to the analytical gold trap, which is heated for 30 s in the same way as the first gold trap. The desorbed mercury was transferred to the detector. The same procedure was used to analyze blanks, without adding NIST 3133.
2.1.2. Gas Standard Calibration
Hg0 in the gas standard was determined also using double amalgamation CV-AFS. Known volumes of air were removed from the gas calibrator unit with a temperature control system (Tekran® 2505 Mercury Vapor Primary Calibration Unit, Tekran, ON, Canada) using a syringe (Hamilton gas tight syringe 50 µL, point style 2, 51 mm removable needle) and injected through a septum (Thermogreen™ LB-2, Supelco, St. Louis, MO, USA, 6 mm (1/4″)) which was placed in the argon flow upstream of the first gold trap in order for the Hg to be captured on it (Figure 1C). The heating sequence and detection is the same as in Section 2.1.1. A temperature syringe correction [21,22] was applied using the following equation:
where, as follows:
is the ratio between the actual mass concentration of mercury and the expected mass concentration of mercury in the syringe under these circumstances (nondimensional);
is the temperature of the vapor inside the bell jar (in Kelvin);
is the temperature of the equipment and room air used to sample vapor from the bell jar (in Kelvin).
2.2. Sample Analysis
2.2.1. Water Sample Analysis
To ascertain the impact of various calibration methods, we chose to conduct mercury determinations on riverine water samples. These water samples were obtained from six distinct points along the Idrijca and Soča rivers in Slovenia. Our analysis encompassed the measurement of dissolved gaseous mercury (DGM), representing the gaseous elemental mercury dissolved in water, as well as reactive mercury (RM), which signifies the fraction of mercury easily reducible by tin(II) chloride. The methodologies employed for these measurements have been extensively detailed elsewhere [25].
2.2.2. Ambient Air Sample Analysis
For ambient air analysis, a gold trap attached to an air pump (OLM30B Sampler, Ohio Lumex Co., Solon, OH, USA) with an in-built flow controller was placed outside. The flow controller was set to sample 20 L of air with a flowrate of 0.5 L min−1. A soda lime trap was placed before the gold trap to retain moisture. After the air was sampled, the gold trap was placed in the double amalgamation system and analyzed as described above.
2.3. Uncertainty Budget
According to the ISO-GUM (International Organization for Standardization—Guide to the Expression of Uncertainty in Measurement) approach [26], a complete mathematical model equation is required to properly assess the measurement uncertainty. The used mathematical model (Equation (3)) shows all the main uncertainty components. This model was developed for the determination of the Hg mass in the gas standard, using NIST 3133 as the calibration standard for the AFS. Based on the following model, the complete fishbone diagram was constructed (Figure 2) as follows:
where, as follows:
mHg(std) is the mass of Hg in the standard that has been analyzed;
A′(S) is the signal of the sample (gas standard) after the blank subtraction;
A′(std) is the signal of the standard (NIST 3133) after blank subtraction.
This model was used to determine the mass of Hg0 in the gas standard at different temperature values, using NIST 3133 as the reference material. All uncertainty components were quantified as relative standard uncertainties, and the relative combined standard uncertainty was calculated using Equation (4):
Each uncertainty component takes into account more uncertainty sources which can be seen in Figure 2 where, as follows:
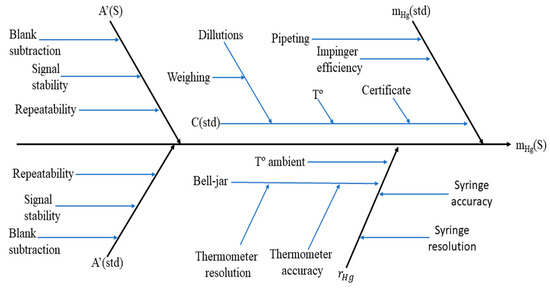
Figure 2.
A fishbone diagram of the amount of Hg determination in the gas standard based on NIST 3133 calibration. m(std) is the mass of the NIST 3133 SRM introduced in the impinger; C(std) is the concentration of the NIST 3133 SRM introduced in the impinger; T° is the temperature read when calculating the expansion coefficient; and T° ambient is the temperature of the room.
All uncertainty components were calculated as type A uncertainty (determined from the statistical analysis of repeated measurements), except for the weight of the NIST 3133 standard while preparing the working standards, the syringe resolution, and the accuracy and temperature, which were calculated as type B uncertainties (estimated from non-statistical sources, such as manufacturer specifications, calibration certificates, previous measurement experience, or theoretical assumptions). The expanded combined relative standard uncertainty was calculated by multiplying the relative combined standard uncertainty by a coverage factor of two. The contribution index (%ui) of individual uncertainty components, which shows how much of each uncertainty component contributes to the combined uncertainty, was calculated as follows:
where n is the number of uncertainty components used to calculate the relative combined standard uncertainty.
3. Results and Discussion
3.1. Comparison Between the Gas Standard and NIST 3133 SRM
In order to directly compare the gas standard with liquid CRM, the NIST 3133 SRM, the analytical procedure described in Section 2.2.2 was applied. Masses of NIST 3133 and volumes of the gas standard that contain the same theoretical mass of Hg0 have been compared. The masses of NIST 3133 and volumes of gas standard are shown in Table S1 and graphically presented in Figure 3, along with the correlation of the two standards.
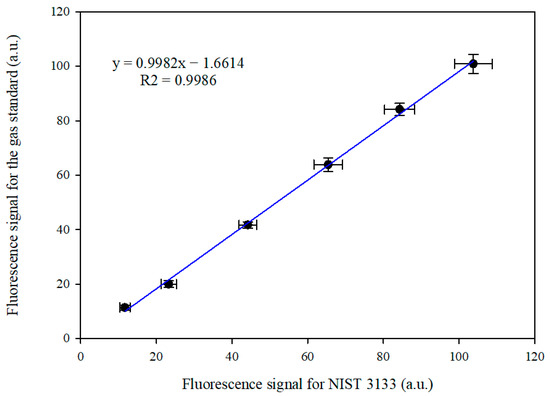
Figure 3.
The correlation between the signals obtained from the two calibration standards with Hg0 masses between 27.8 and 277.6 pg at 10 °C.
A two-tailed paired t-test has been performed on the two series, and the obtained p value of 0.933 at the significance level of α = 0.05 indicated that the two data series were not statistically different. The equal variance test (Brown–Forsythe) also gives 93.6%, which shows that the variance was similar across all samples. The analyzed Hg mass fractions were between 27.76 and 277.6 pg at the temperature of 10 °C of the gas bell-jar standard. At this temperature, according to the Dumarey equation, the concentration of mercury-saturated air is 5.552 pg mL−1, while the Huber equation would yield a concentration of 5.988 pg mL−1. Using the same volumes for the gas standard as the ones in Figure 3, but calculating the Hg mass using the Huber equation, the slope and intercept for the correlation with the NIST 3133 dataset would be 1.04 and −1.73, respectively.
The error bars presented in Figure 3 are the combined uncertainties at a coverage factor of two for each standard. For NIST 3133 fluorescence signals, the components A′(std) and m(std) were used, while for the gas standard, components A′(S) and V(S) were used. As this is the comparison of signals on the same instrument, the calibration cannot be taken into account because the two methods are interchangeably calibrated with each other. There is little difference between the uncertainties for each standard, the major component being the repeatability in each case. The uncertainties associated with NIST 3133 are usually higher, due to the contribution brought by bubbler blank subtraction. When analyzing the gas standard, minimal to no blank is present as long as the traps in the procedure are adequately heated before utilization. This effectively reduces the uncertainty associated with blank subtraction.
Since the concentration of Hg0 from the gas bell-jar standard is dependent on the temperature of the cell inside the calibration unit, the gas calibrator unit has also been tested in the temperature range 10 to 24 °C against the NIST 3133, as shown in Figure 4. The injected gas standards volumes were calculated according to the Dumarey equation and fixed to hold precisely 250 pg of Hg0, which matched our target concentration. The results were calculated relative to the NIST 3133 SRM; therefore, we used a single point calibration at 250 pg obtained by the reduction of NIST 3133.
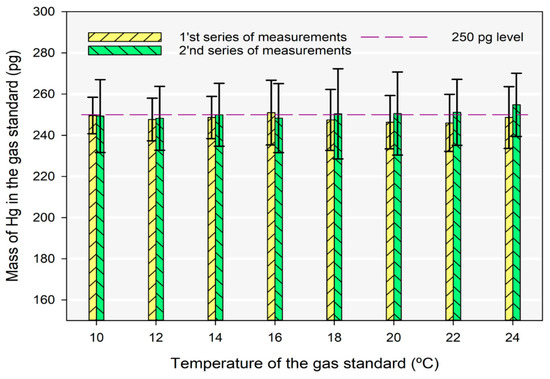
Figure 4.
The determination of Hg0 in the gas standard in the temperature range from 10 to 24 °C of the calibration unit.
The analysis for each temperature point was done twice on different days to account for sample reproducibility. The error bars in Figure 4 represent the combined uncertainty for a coverage factor of two. All the sources that contribute to the combined uncertainty are represented in Table S2 of the Supplementary Materials. The combined uncertainties across temperature points and days varied between 2.9 and 8.4%. This variation is due to the repeatability of both the gas standard and NIST 3133 measurements, which were the biggest contributions to the combined uncertainty. The observed variation lacks a systematic pattern, thus making it challenging to attribute it to either of the standards. This conclusion was drawn from the absence of a systematic difference in repeatability between the two standards.
Even when the combined uncertainty is the lowest, the results are comparable at the 250 pg mass calculated using the Dumarey equation. The results show that the gas calibrator units, which use the Dumarey equation, can be used for calibration purposes even at low Hg levels. The relative contribution index to the measurement uncertainty is shown in Figure 5. The uncertainties assigned to the volume of the sample are more pronounced at higher temperatures due to the lower volumes required to inject 250 pg of Hg0.
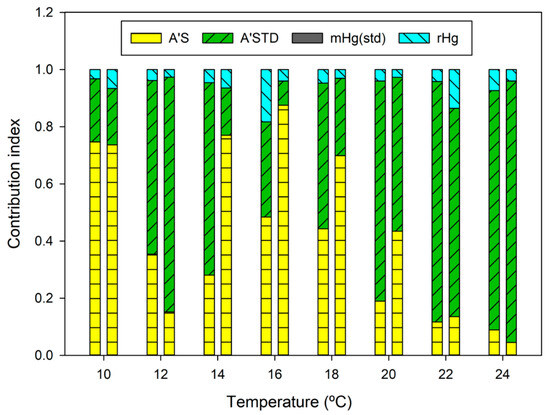
Figure 5.
The relative contribution index for the determination of Hg in the gas standard.
3.2. DGM and RM Analysis from Idrijca River
To comprehensively evaluate the performance of the two calibration methods for real sample analyzes, dissolved gaseous mercury (DGM) and reactive mercury (RM) concentrations in river samples were quantified using these two methods. These water samples were collected from six sampling locations along the Idrijca and Soča rivers in western Slovenia. The region is renowned for its variable concentration levels, a characteristic attributed to a recognized source of pollution—mercury-contaminated legacy sites.
Our sampling strategy was informed by prior measurements [27], ensuring a spectrum of concentration levels spanning from low to relatively high. This approach enabled a more comprehensive and representative comparison of results across a broad concentration range. Specifically, Station 2 was chosen due to its proximity to a former smelting plant known for elevated Hg concentrations. In contrast, Station 1 is situated upstream from the plant, while Stations 3 and 4 are progressively downstream. Stations 5 and 6 are located along the Soča river, about 50 km downstream from the point where the Idrijca river merges with Soča. As anticipated, concentrations decreased in line with the downstream progression of the sampling locations. The analysis procedure adhered to the guidelines provided in Section 2.3, with the corresponding results presented in Table 1 and Table 2. The model equation for the estimation of uncertainty of measurement results are presented in the Supplementary Materials through Equations (S2) and (S3).

Table 1.
The calculated concentrations and corresponding measurement uncertainties for DGM from the Idrijca river samples.
Table 2.
The calculated concentrations and corresponding measurement uncertainties for RM from the Idrijca river samples.
As presented in Table 1 and Table 2, the results obtained using both calibration standards are comparable. The combined standard uncertainty is slightly higher when using NIST 3133 calibration, primarily due to higher blanks. In the case of all samples, the difference between the results is less than 1% when comparing the calibration standards. In the case of using the Huber equation to calculate the Hg concentration in the gas standard at 10 °C, the results would be 7.9% lower than when calculating the concentration with the Dumarey equation. This would be a significant difference between the Dumarey equation and the Huber since the relative combined uncertainty for the measurements were between 5.1 and 7.2% for a coverage factor of two. The contribution index is also presented in the Supplementary Materials for identifying the contribution of each uncertainty source through Figure S1, which shows that the main contributing factor for the differences between the uncertainties of each calibration method is the repeatability of the standard.
3.3. Ambient Air Analysis
For air analysis, 20 L of laboratory air was sampled and captured on gold traps, and then placed in the position of “Gold trap (Hg loaded)” from Figure 1C. As the laboratory is continuously ventilated, the Hg0 concentrations resemble the ones found in ambient air. Three series of measurements were performed in which air was sampled on two gold traps in parallel. The results are shown in Figure 6. Within each series, concentrations are not different from each other, as they are within the uncertainty range. The relative combined uncertainty varied from 3% to 8.7%. The model equation for the estimation of uncertainty of measurement results are presented in the Supplementary Materials through Equations (S4) and (S5).
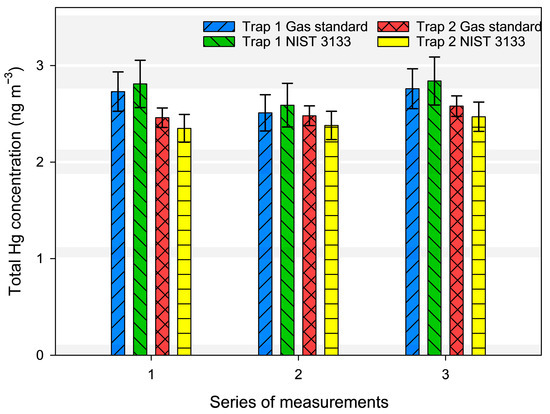
Figure 6.
The concentration of Hg0 in laboratory air, calculated using both NIST 3133 and the gas standard.
The difference between the results calculated with the NIST 3133 SRM and the Dumarey-based gas standard was 2.95% for gold trap 1 and 4.2% for gold trap 2, which are within the combined expanded uncertainty range. Trap 1 also showed a lower repeatability for the standards which is the reason why the uncertainty of the measurement results is also higher. Therefore, it is important to calibrate each trap individually as they might not be packed the same ways and thus have different behaviors during calibration, sampling, and analysis. The breakthrough on the gold traps was not included in our uncertainty budget, so we were not able to quantify the possible losses and their influence on the measurements uncertainty and correspondingly to the comparability of the results between the two traps. As the uncertainty values for both types of calibration are similar on the same trap, the difference of the results between the traps may be attributed to a systematic error occurring from sampling. Even though the traps were sampling at the same conditions, each may have a different behavior due to their packing process, which has been shown to induce errors [28].
4. Conclusions
A comprehensive comparison between the gas standard, utilizing the mercury vapor concentrations calculated using the Dumarey equation, and the NIST 3133 SRM was conducted to ensure metrological traceability. The findings suggest that any discrepancies between the gas standard and NIST 3133 can be attributed solely to random effects, indicating the absence of systematic bias. A notable advantage of the gas standard lies in its capacity to minimize the uncertainty stemming from blank measurements. This is particularly significant at low concentrations, where blank contributions to the overall measurement uncertainty can be substantial. The variations reported in the recent literature concerning the accuracy of the Dumarey equation in calculating Hg concentrations in saturated air may stem from multiple factors. A prominent contributor is likely to be experimental errors linked to the correction of the concentration due to air expansion during injection (Equation (2)), which was not mentioned in the previous references that questioned the validity of the Dumarey equation. Through a series of experiments encompassing the determination of the Hg mass in both the gas standard and the subsequent comparison of results derived from NIST 3133 SRM and the gas standard—across water and air samples—consistently yielded differences between the two calibration standards remained under 4.2%, well within the uncertainty of measurement results. By demonstrating the metrological robustness of mercury calibration techniques, this study supports improved environmental monitoring and compliance with international standards, ultimately contributing to more effective mercury pollution mitigation strategies.
Supplementary Materials
The following supporting information can be downloaded at: https://www.mdpi.com/article/10.3390/atmos16040421/s1, Figure S1: The contribution index for the determination of DGM and RM at station 2, by using both NIST 3133 and gas standard; m(std) is used when quantifying the uncertainty due to NIST 3133 mass, while V(std) is used when quantifying the uncertainty due to the volume of the gas standard.; Table S1: Masses and volumes used for the correlation experiment between NIST 3133 (20 °C), pipetted from the 1.044 ng g−1 standard, and the gas standard (10 °C).; Table S2: The main components of uncertainty, contributors to uncertainty, and the types of uncertainty for the determination of Hg in the gas standard.
Author Contributions
Conceptualization, T.D.A., W.T.C. and M.H.; methodology, T.D.A., W.T.C., M.H.; validation, T.D.A. and I.Ž.; formal analysis, T.D.A. and J.K.; investigation, T.D.A. and J.K.; resources, M.H.; data curation, T.D.A., I.Ž., W.T.C. and M.A.D.; writing—original draft preparation, T.D.A. and I.Ž.; writing—review and editing, T.D.A., W.T.C., M.A.D., I.Ž. and M.H.; visualization, T.D.A. and I.Ž.; supervision, W.T.C., I.Ž. and M.H.; project administration, M.H. funding acquisition, M.H. All authors have read and agreed to the published version of the manuscript.
Funding
The authors acknowledge the financial support from the European Commission (GMOS-Train project grant agreement ID: 860497) through the Marie Skłodowska-Curie Initial Training Network and the Slovenian Research Agency (ARRS) through program P1-0143. Project 19NRM03 SI-Hg has received funding from the EMPIR programme co-financed by the Participating States and from the European Union’s Horizon 2020 research and innovation programme. The authors thank to the Metrology Institute of the Republic of Slovenia (MIRS) under contract No. C2182-25-000016 (6401-1/2024/41) for activities and obligations performed as a Designate Institute.
Institutional Review Board Statement
Not applicable.
Informed Consent Statement
Not applicable.
Data Availability Statement
The dataset used in this paper is available upon reasonable request.
Conflicts of Interest
Warren T. Corns and Matthew A. Dexter are employees of P S Analytical. The paper reflects the views of the scientists and not the company.
References
- United Nations Environment Programme (UNEP). The Emissions Gap Report 2013. [Online] UNEP. Available online: https://www.unep.org/resources/emissions-gap-report-2013 (accessed on 28 March 2024).
- Ciani, F.; Rimondi, V.; Costagliola, P. Atmospheric mercury pollution: The current methodological framework outlined by environmental legislation. Air Qual. Atmos. Health 2021, 14, 1633–1645. [Google Scholar] [CrossRef]
- Gustin, M.S.; Evers, D.C.; Bank, M.S.; Hammerschmidt, C.R.; Pierce, A.; Basu, N.; Blum, J.; Bustamante, P.; Chen, C.; Driscoll, C.T.; et al. Importance of Integration and Implementation of Emerging and Future Mercury Research into the Minamata Convention. Environ. Sci. Technol. 2016, 50, 2767–2770. [Google Scholar] [CrossRef] [PubMed]
- Cresswell, T.; Brown, S.; Wong, H.; Apte, S. Assessing the impacts of scale residues from offshore oil and gas decommissioning on marine organisms. APPEA J. 2021, 61, 379. [Google Scholar] [CrossRef]
- Long, S.E.; Norris, J.E.; Carney, J.; Ryan, J.V.; Mitchell, G.D.; Dorko, W.D. Traceability of the output concentration of mercury vapor generators. Atmos. Pollut. Res. 2020, 11, 639–645. [Google Scholar] [CrossRef]
- Gačnik, J.; Živković, I.; Guevara, S.R.; Jaćimović, R.; Kotnik, J.; Horvat, M. Validating an Evaporative Calibrator for Gaseous Oxidized Mercury. Sensors 2021, 21, 2501. [Google Scholar] [CrossRef]
- Sari, S.; Timo, R.; Jussi, H.; Panu, H. Dynamic calibration method for reactive gases. Meas. Sci. Technol. 2020, 31, 034001. [Google Scholar] [CrossRef]
- Brown, A.S.; Brown, R.J.C.; Corns, W.T.; Stockwell, P.B. Establishing SI traceability for measurements of mercury vapour. Analyst 2008, 133, 946. [Google Scholar] [CrossRef]
- de Krom, I.; Bavius, W.; Ziel, R.; Efremov, E.; van Meer, D.; van Otterloo, P.; van Andel, I.; van Osselen, D.; Heemskerk, M.; van der Veen, A.M.; et al. Primary mercury gas standard for the calibration of mercury measurements. Measurement 2021, 169, 108351. [Google Scholar] [CrossRef]
- Dumarey, R.; Brown, R.J.C.; Corns, W.T.; Brown, A.S.; Stockwell, P.B. Elemental mercury vapour in air: The origins and validation of the “Dumarey equation” describing the mass concentration at saturation. Accredit. Qual. Assur. 2010, 15, 409–414. [Google Scholar] [CrossRef]
- Huber, M.L.; Laesecke, A.; Friend, D.G. Correlation for the Vapor Pressure of Mercury. Ind. Eng. Chem. Res. 2006, 45, 7351–7361. [Google Scholar] [CrossRef]
- Quétel, C.R.; Zampella, M.; Brown, R.J.C. Temperature dependence of Hg vapour mass concentration at saturation in air: New SI traceable results between 15 and 30 °C. TrAC Trends Anal. Chem. 2016, 85, 81–88. [Google Scholar] [CrossRef]
- Srivastava, A.; Hodges, J.T. Development of a High-Resolution Laser Absorption Spectroscopy Method with Application to the Determination of Absolute Concentration of Gaseous Elemental Mercury in Air. Anal. Chem. 2018, 90, 6781–6788. [Google Scholar] [CrossRef] [PubMed]
- Dumarey, R.; Heindryckx, R.; Dams, R.; Hoste, J. Determination of volatile mercury compounds in air with the coleman mercury analyzer system. Anal. Chim. Acta 1979, 107, 159–167. [Google Scholar] [CrossRef]
- ISO 14044:2003; Environmental Management—Life Cycle Assessment—Requirements and Guidelines. International Organization for Standardization: Geneva, Switzerland, 2003.
- ASTM C1202-03; Standard Test Method for Water Permeability of Concrete. ASTM International: West Conshohocken, PA, USA, 2003.
- O’Concubhair, R.; O’Sullivan, D.; Sodeau, J.R. Dark Oxidation of Dissolved Gaseous Mercury in Polar Ice Mimics. Environ. Sci. Technol. 2012, 46, 4829–4836. [Google Scholar] [CrossRef]
- Timonen, H.; Ambrose, J.L.; Jaffe, D.A. Oxidation of elemental Hg in anthropogenic and marine airmasses. Atmos. Chem. Phys. 2013, 13, 2827–2836. [Google Scholar] [CrossRef]
- Quétel, C.R.; Zampella, M.; Brown, R.J.C.; Ent, H.; Horvat, M.; Paredes, E.; Tunc, M. International System of Units Traceable Results of Hg Mass Concentration at Saturation in Air from a Newly Developed Measurement Procedure. Anal. Chem. 2014, 86, 7819–7827. [Google Scholar] [CrossRef]
- Ent, H.; van Andel, I.; Heemskerk, M.; van Otterloo, P.; Bavius, W.; Baldan, A.; Horvat, M.; Brown, R.J.C.; Quétel, C.R. A gravimetric approach to providing SI traceability for concentration measurement results of mercury vapor at ambient air levels. Meas. Sci. Technol. 2014, 25, 115801. [Google Scholar] [CrossRef]
- Andersson, M.E.; Gårdfeldt, K.; Wängberg, I.; Strömberg, D. Determination of Henry’s law constant for elemental mercury. Chemosphere 2008, 73, 587–592. [Google Scholar] [CrossRef]
- Brown, R.J.C.; Brown, A.S. Accurate calibration of mercury vapour measurements. Analyst 2008, 133, 1611. [Google Scholar] [CrossRef]
- Bloom, N.S.; Crecelius, E.A. Determination of mercury in seawater at sub-nanogram per liter levels. Mar. Chem. 1983, 14, 49–59. [Google Scholar] [CrossRef]
- Fitzgerald, W.F.; Gill, G.A. Subnanogram determination of mercury by two-stage gold amalgamation and gas phase detection applied to atmospheric analysis. Anal. Chem. 1979, 51, 1714–1720. [Google Scholar] [CrossRef]
- Gill, G.A.; Fitzgerald, W.F. Picomolar mercury measurements in seawater and other materials using stannous chloride reduction and two-stage gold amalgamation with gas phase detection. Mar. Chem. 1987, 20, 227–243. [Google Scholar] [CrossRef]
- JCGM 200:2012; JCGM. International Vocabulary of Metrology—Basic and General Concepts and Associated Terms (VIM). 3rd ed. Joint Committee for Guides in Metrology: Sèvres, France, 2012.
- Horvat, M.; Jereb, V.; Fajon, V.; Logar, M.; Kotnik, J.; Faganeli, J.; Hines, M.E.; Bonzongo, J.C. Mercury distribution in water, sediment and soil in the Idrijca and SoĉAhca river systems. Geochem. Explor. Environ. Anal. 2002, 2, 287–296. [Google Scholar] [CrossRef]
- Kim, K.H.; Szulejko, J.E.; Jo, H.J.; Kim, Y.H. Investigation of breakthrough behavior of volatile organic compounds on Tenax TA using a gas chromatography–mass spectrometry system. Anal. Bioanal. Chem. 2014, 406, 4031–4039. [Google Scholar]
Disclaimer/Publisher’s Note: The statements, opinions and data contained in all publications are solely those of the individual author(s) and contributor(s) and not of MDPI and/or the editor(s). MDPI and/or the editor(s) disclaim responsibility for any injury to people or property resulting from any ideas, methods, instructions or products referred to in the content. |
© 2025 by the authors. Licensee MDPI, Basel, Switzerland. This article is an open access article distributed under the terms and conditions of the Creative Commons Attribution (CC BY) license (https://creativecommons.org/licenses/by/4.0/).