Article

Fine-Scale Identification of Agricultural Flooding Disaster Areas Based on Sentinel-1/2: A Case Study of Shengzhou, Zhejiang Province, China

1
College of Intelligent Manufacturing, Anhui Science and Technology University, Chuzhou 233100, China
2
School of Ecology and Applied Meteorology, Nanjing University of Information Science and Technology, Nanjing 210044, China
3
Nantong Research Institute, Nanjing University of Information Science and Technology, Nantong 226001, China
4
Nanjing Research Institute of Hydrology and Water Conservation Automation, Ministry of Water Resources, Nanjing 210012, China
5
Zhejiang Meteorological Observatory, Hangzhou 330108, China
6
Shaoxing Meteorological Bureau, Shaoxing 312000, China
*
Author to whom correspondence should be addressed.
Atmosphere 2025, 16(4), 420; https://doi.org/10.3390/atmos16040420
Submission received: 10 March 2025 / Revised: 29 March 2025 / Accepted: 2 April 2025 / Published: 4 April 2025
(This article belongs to the Section Meteorology)

Abstract

:
Flood disasters are one of the major natural hazards threatening agricultural production. To reduce agricultural disaster losses, accurately identifying agricultural flood-affected areas is crucial. Taking Shengzhou City as a case study, we proposed a refined method for identifying agricultural flood-affected areas by integrating microwave and optical remote sensing data with deep learning techniques, GIS, and the pixel-based direct differencing method. Complementary advantages of microwave and optical remote sensing data can effectively solve the problem of difficulty in accurately detecting floods due to thick clouds before and after flood disasters. Deep learning technology can effectively identify farmland areas, and the pixel direct difference method can accurately analyze agricultural flood disasters. Analyzing three typical rainfall events along with the topographical and geomorphological characteristics of Shengzhou City, the results indicate that agricultural flood disaster areas exhibit significant spatial heterogeneity. The primary influencing factors include rainfall intensity, topography, and drainage infrastructure. The northern, eastern, and southwestern regions of Shengzhou City, particularly the peripheral areas adjacent to mountainous and hilly terrains, contain most of the flood-affected farmland. These areas, characterized by low-lying topography, are highly susceptible to flood disasters. Therefore, optimizing the drainage systems of farmland in low-lying areas near mountainous and hilly regions of Shengzhou City is essential to enhance flood resilience.

1. Introduction

Flood disasters are among the most severe natural hazards worldwide and one of China’s most frequent, widespread, and devastating natural disasters [1,2]. Flood disasters threaten approximately two-thirds of China’s land area, more than half of its population, and two-thirds of its industrial and agricultural output [3]. In China, flood disasters rank as the second most significant agrometeorological disaster after drought [4], causing disruptions in crop growth, soil erosion, damage to agricultural infrastructure, degradation of soil structure, and ecological deterioration, posing a severe threat to the country’s food security [5]. Therefore, in-depth research on agricultural flood disasters is crucial for enhancing disaster prevention and mitigation capabilities, optimizing land use planning, and formulating scientifically sound water resource management strategies.
Researchers have widely explored flood disaster research as a key issue in disaster prevention and mitigation. Currently, related studies primarily rely on remote sensing data, meteorological and hydrological data, and statistical data, employing various analytical methods such as mathematical statistics, geographic information system (GIS)-based spatial analysis, analytic hierarchy process (AHP), trend analysis, indicator systems, and modeling approaches [6,7,8,9,10,11,12,13,14,15]. The main research areas focus on disaster monitoring, risk assessment, impact analysis, and response strategies. For example, remote sensing monitoring technology based on Sentinel-1 Synthetic Aperture Radar (SAR) can accurately identify flood inundated areas under extreme weather conditions, enhancing disaster response efficiency [16]. The Bayesian network combined with GIS enables probabilistic reasoning to capture interactions among risk factors, generating spatially explicit risk assessment results that provide scientific support for urban planning and flood management [17]. Multi-source data analysis, which integrates social, economic, and environmental influences, can facilitate the development of more effective disaster prevention and mitigation strategies [18,19]. With the increasing complexity and uncertainty of flood disasters, future research should further enhance interdisciplinary integration by incorporating remote sensing, big data, artificial intelligence, and climate prediction models to develop more accurate and efficient early warning and management systems. By continuously optimizing monitoring techniques and disaster prevention strategies, we can improve the capacity to respond to flood disasters, minimize disaster losses, and promote sustainable development [20,21].
Evidently, in flood disaster research, integrating remote sensing data with GIS and machine learning methods has become a crucial research approach, with satellite remote sensing data playing a particularly essential role. Microwave remote sensing satellites possess strong penetration capabilities, enabling them to penetrate cloud cover and operate independently of weather conditions. They are highly effective in identifying water bodies before and after flood disasters. However, they exhibit limitations in distinguishing surface types, resulting in suboptimal recognition performance in agricultural areas. In contrast, optical remote sensing satellites enable detailed land cover classification. Nevertheless, they cannot penetrate cloud cover, and since extensive cloud coverage often accompanies rainfall events, obtaining high-quality optical remote sensing images during or immediately after rainfall is challenging. This limitation significantly hinders the ability to effectively monitor and distinguish farmland and water bodies before and after flood disasters [22]. Since microwave and optical remote sensing data are highly complementary, relying solely on a single type of satellite remote sensing data is insufficient for fine-scale identification of agricultural flood-affected areas. Therefore, integrating microwave and optical remote sensing data is essential for enhancing flood disaster monitoring and improving the accuracy of agricultural flood area identification [23,24].
In this study, we segment Sentinel-2 remote sensing imagery into multiple 10 × 10 pixel grids and employ a land cover classification model to categorize each grid. If a grid is classified as farmland, we record the geographic coordinates of its four vertices. Based on these coordinates, the precise location of the farmland grid in Sentinel-1 remote sensing imagery is determined. We then conduct a pixel-by-pixel comparative analysis to examine changes in the same farmland grid before and after flood disasters in Sentinel-1 imagery, identifying whether the grid belongs to a flood-affected area. By integrating optical and microwave remote sensing data, this approach leverages the advantages of both data types to refine remote sensing image interpretation and conduct pixel-level comparative analysis. This method provides valuable insights into multi-source remote sensing data fusion for agricultural flood disaster risk assessment.

2. Study Area and Data

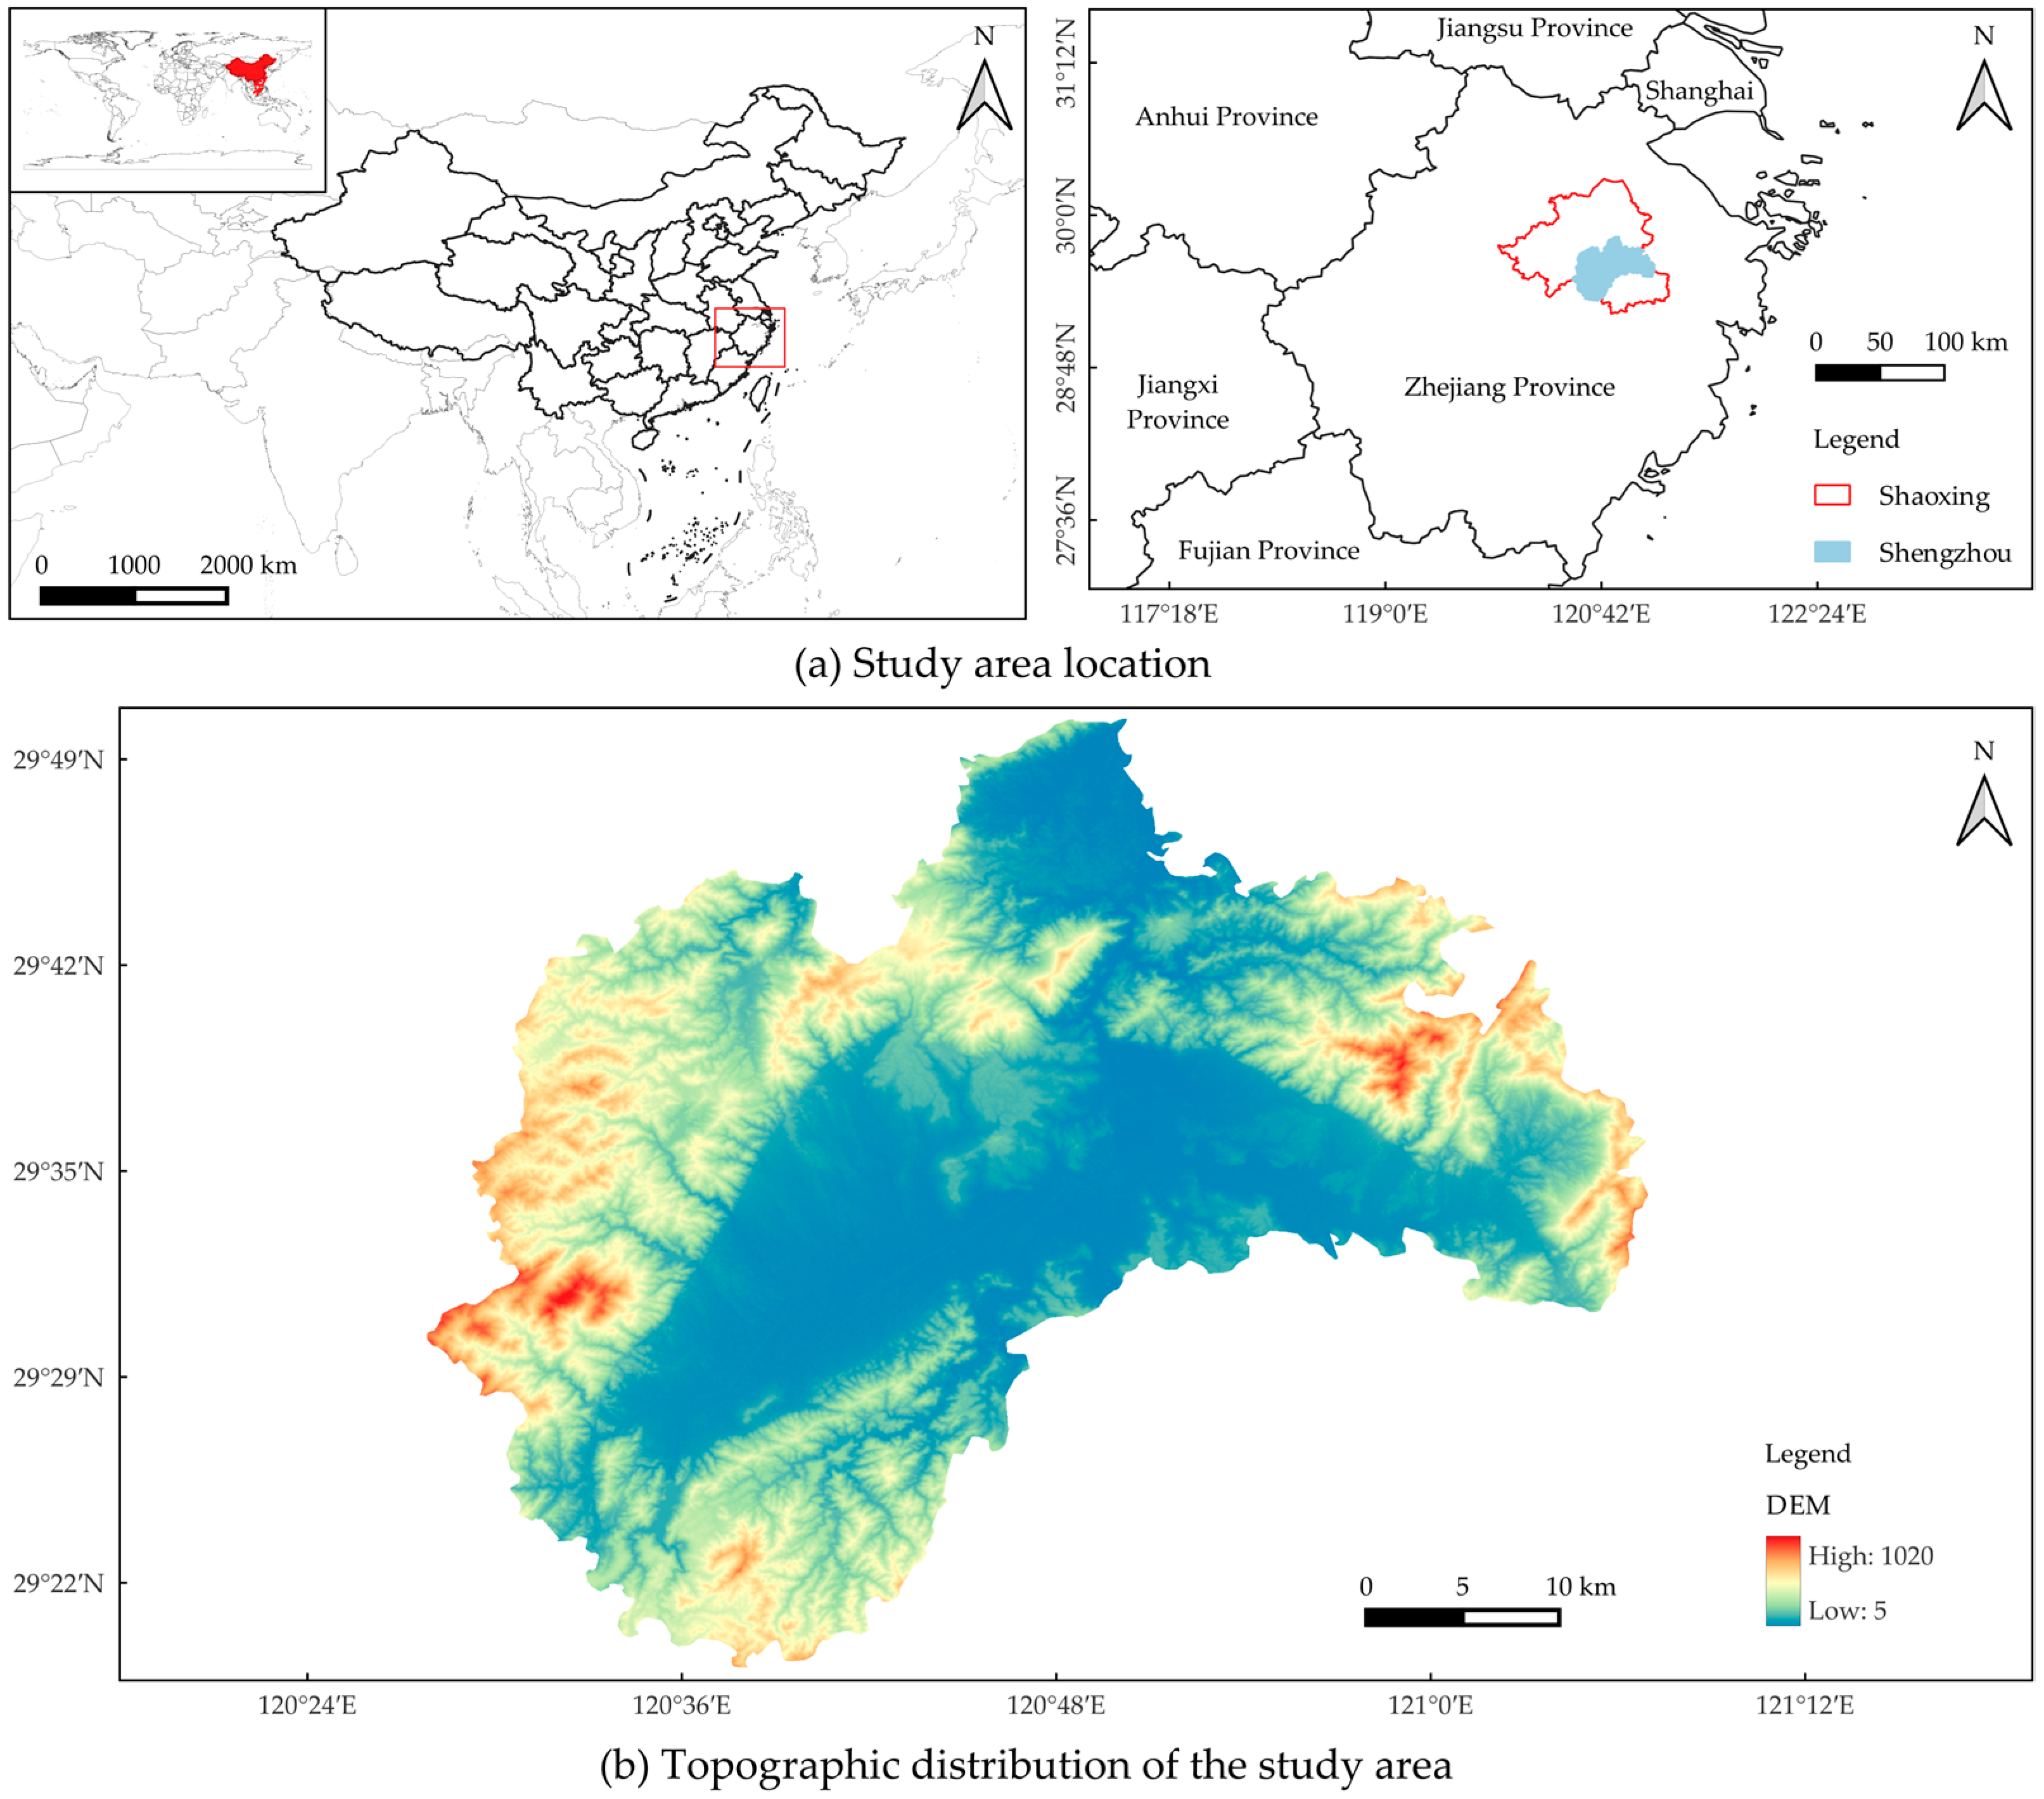
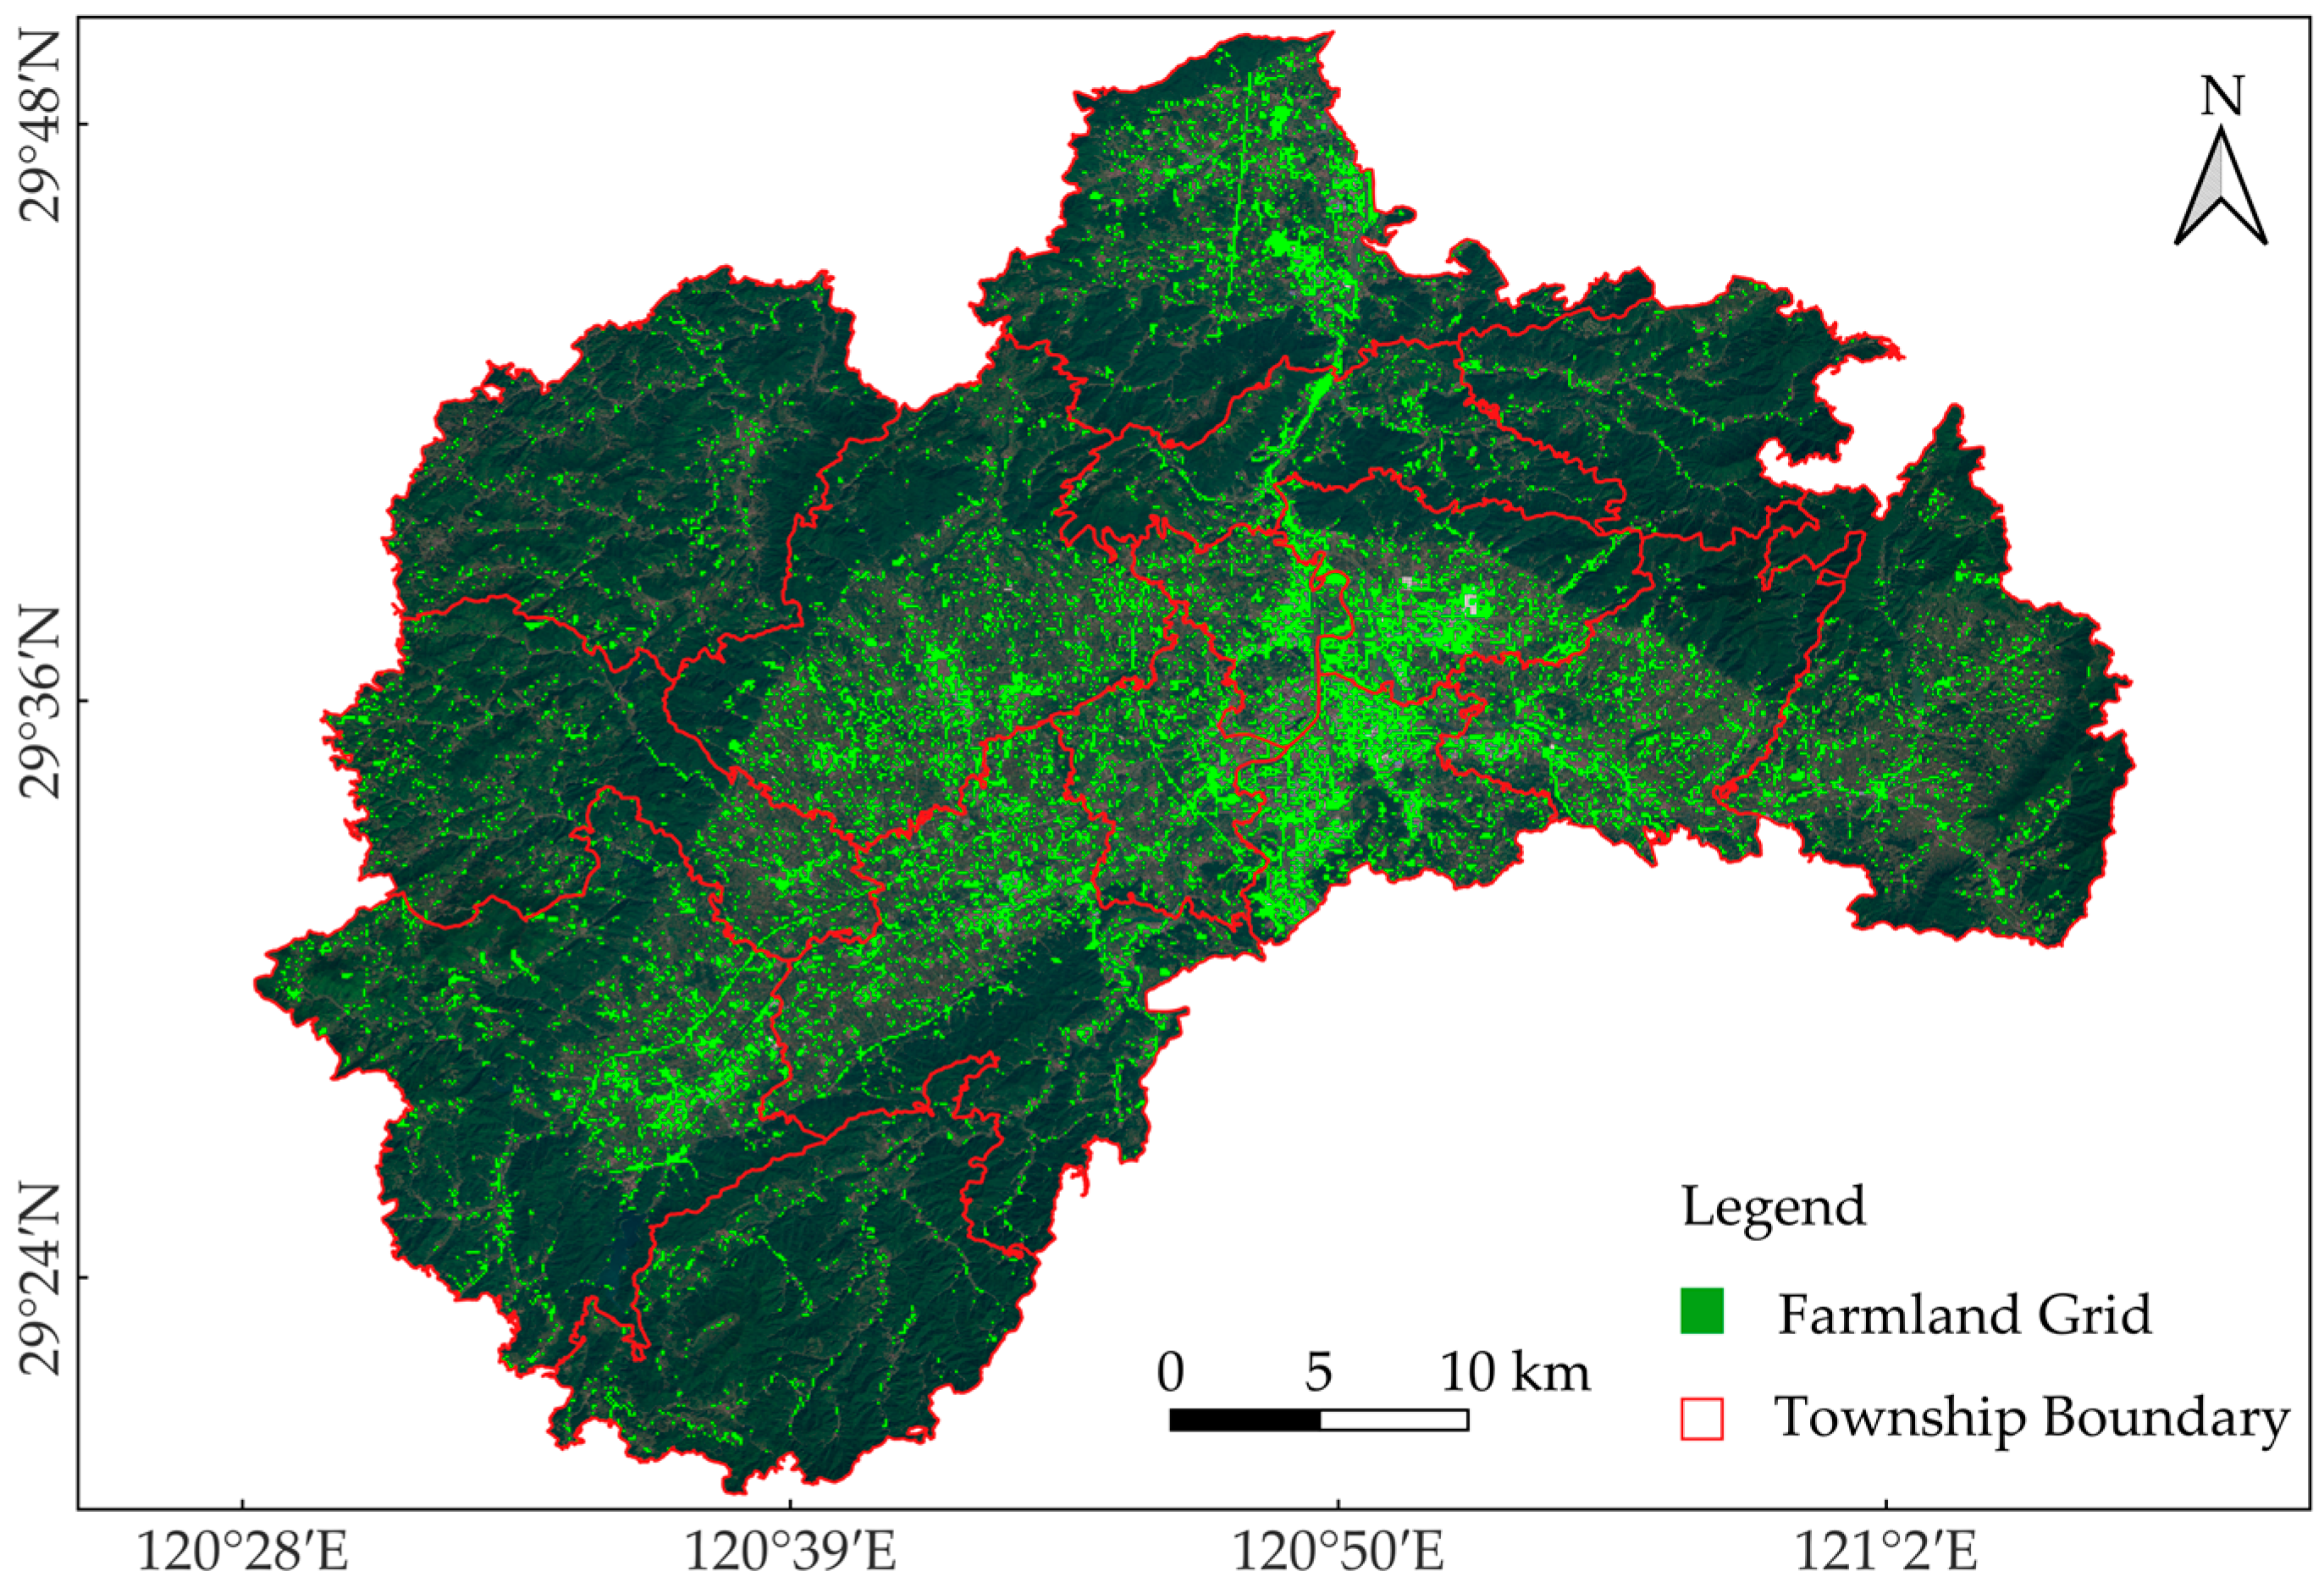
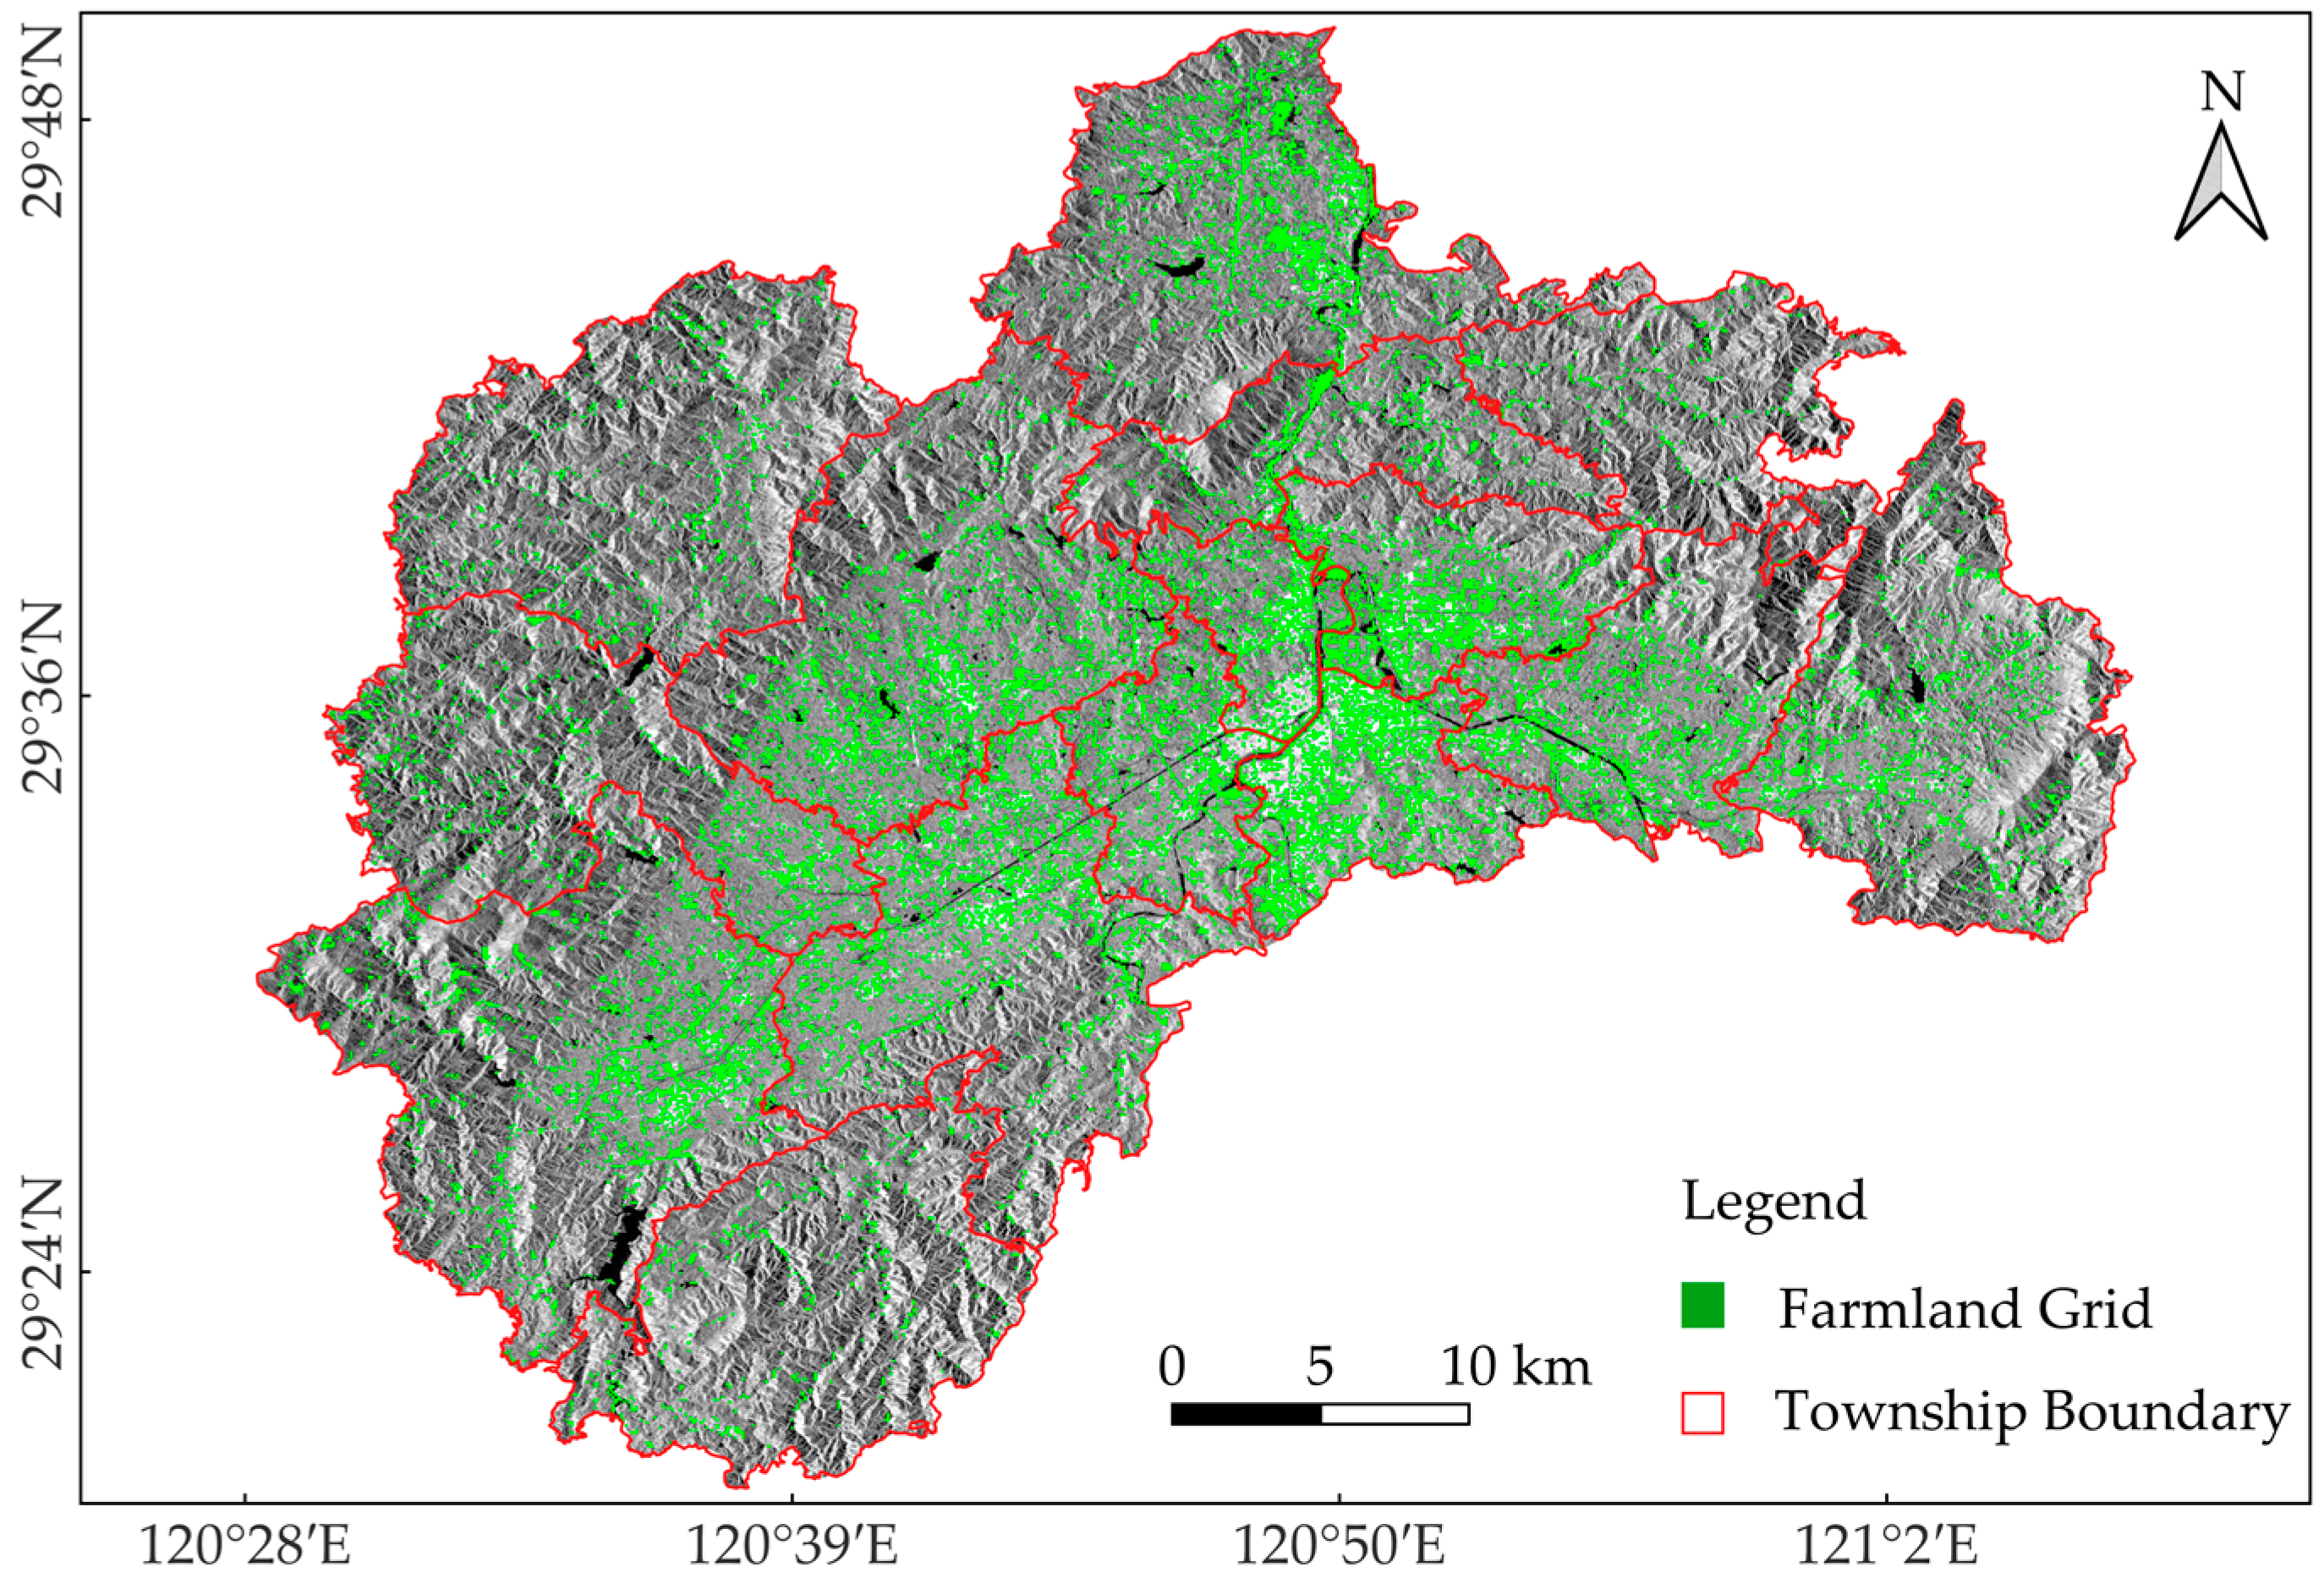
2.1. Overview of the Study Area

The study area is Shengzhou City, Shaoxing, Zhejiang Province, China (120°27′–121°06′ E, 29°19′–29°49′ N). It borders Fenghua District and Yuyao City of Ningbo to the east, Dongyang City of Jinhua and Xinchang County of Shaoxing to the south, Zhuji City of Shaoxing to the west, and Shangyu District and Keqiao District of Shaoxing to the north. As shown in Figure 1, Shengzhou City is located in the southeastern coastal region of China and belongs to the subtropical monsoon climate zone [25]. The southeastern monsoon brings abundant moisture during summer, leading to heavy rainfall. The topography is predominantly hilly and mountainous, making low-lying areas prone to flooding during extreme rainfall, while mountainous regions are susceptible to flash floods and landslides. The southeastern coastal region of China is among the areas frequently affected by typhoons. During summer and autumn, typhoons from the Northwest Pacific Ocean and the South China Sea often make landfall along the southeastern coast, bringing intense rainfall. This results in severe rainstorms in Shengzhou City, leading to a sharp increase in precipitation within a short period, potentially triggering flood disasters. These extreme weather events threaten agriculture, infrastructure, and residents’ livelihoods in Shengzhou City [26,27,28].

2.2. Data Sources

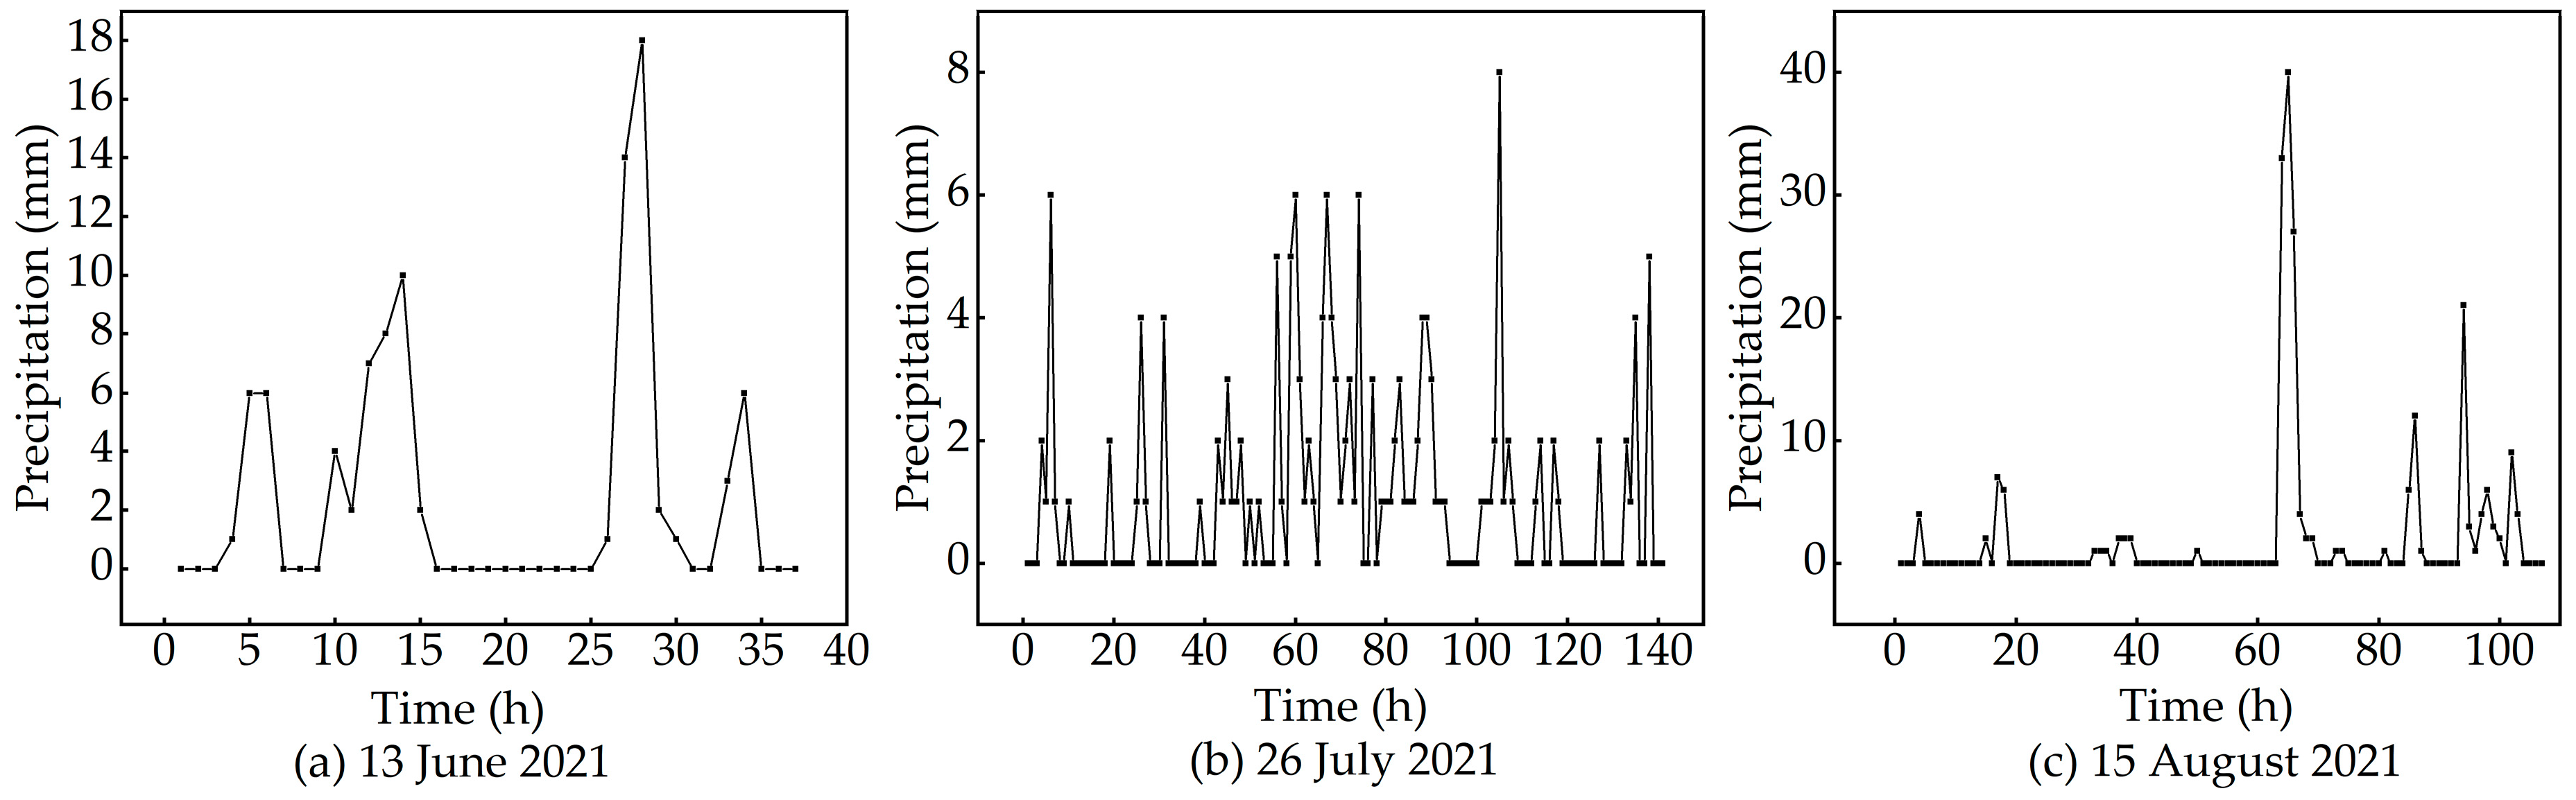
2.2.1. Rainfall and Disaster Data

In this study, we utilized hourly precipitation data from the three typical flood events that occurred in Shengzhou City on 13 June, 26 July, and 15 August 2021. The disaster data consists of the farmland-affected area in each township during these three flood events.

2.2.2. Remote Sensing Data

In this study, we used remote sensing data from the Sentinel-1 and Sentinel-2 satellites provided by the European Space Agency (ESA). The Sentinel-1 satellite series carries a C-band Synthetic Aperture Radar (SAR), which can penetrate cloud cover and rainfall, enabling all-weather and all-day surface observation. The series includes Sentinel-1A and Sentinel-1B, providing radar images in single polarization (HH, VV, HV, VH) and dual polarization (HH&HV, VV&VH) modes. Sentinel-1 supports four data acquisition modes: Stripmap Mode (SM), Interferometric Wide Swath Mode (IW), Extra Wide Swath Mode (EW), and Wave Mode (WM). The Sentinel-2 satellite series carries a Multispectral Instrument (MSI), capable of capturing 13 spectral bands ranging from visible to shortwave infrared, offering high-resolution images at 10 m, 20 m, and 60 m. The series includes Sentinel-2A and Sentinel-2B, which provide a global revisit time of 5 days, enabling frequent monitoring of surface changes [29,30,31].
In this study, we utilized the interferometric wide-swath mode Ground Range Detection (GRD) product data from the Sentinel-1 satellite series and the Level-1C (L1C) product data from the Sentinel-2 satellite series. Selection of Sentinel-1 image data before and after flood disasters, specifically for the following dates: 11 June and 23 June 2021; 23 July and 29 July 2021; 10 August and 22 August 2021. We applied orbit correction, thermal noise removal, radiometric calibration, speckle filtering, terrain correction, and logarithmic transformation (decibel scaling) to the Sentinel-1 data to extract VV-polarized images, which we then clipped to obtain the imagery for Shengzhou City. Sentinel-2 imagery was obtained from the Copernicus Data Space Ecosystem and consisted of cloud-free, true-color composite images of Shengzhou City, which had undergone preprocessing.
We used the EuroSAT remote sensing image dataset to train the land cover classification model. This dataset consists of multispectral images acquired by the Sentinel-2 satellite series and includes over 27,000 images of different land cover types, each containing 2000 to 3000 remote sensing images.

2.2.3. Vector and Digital Elevation Data
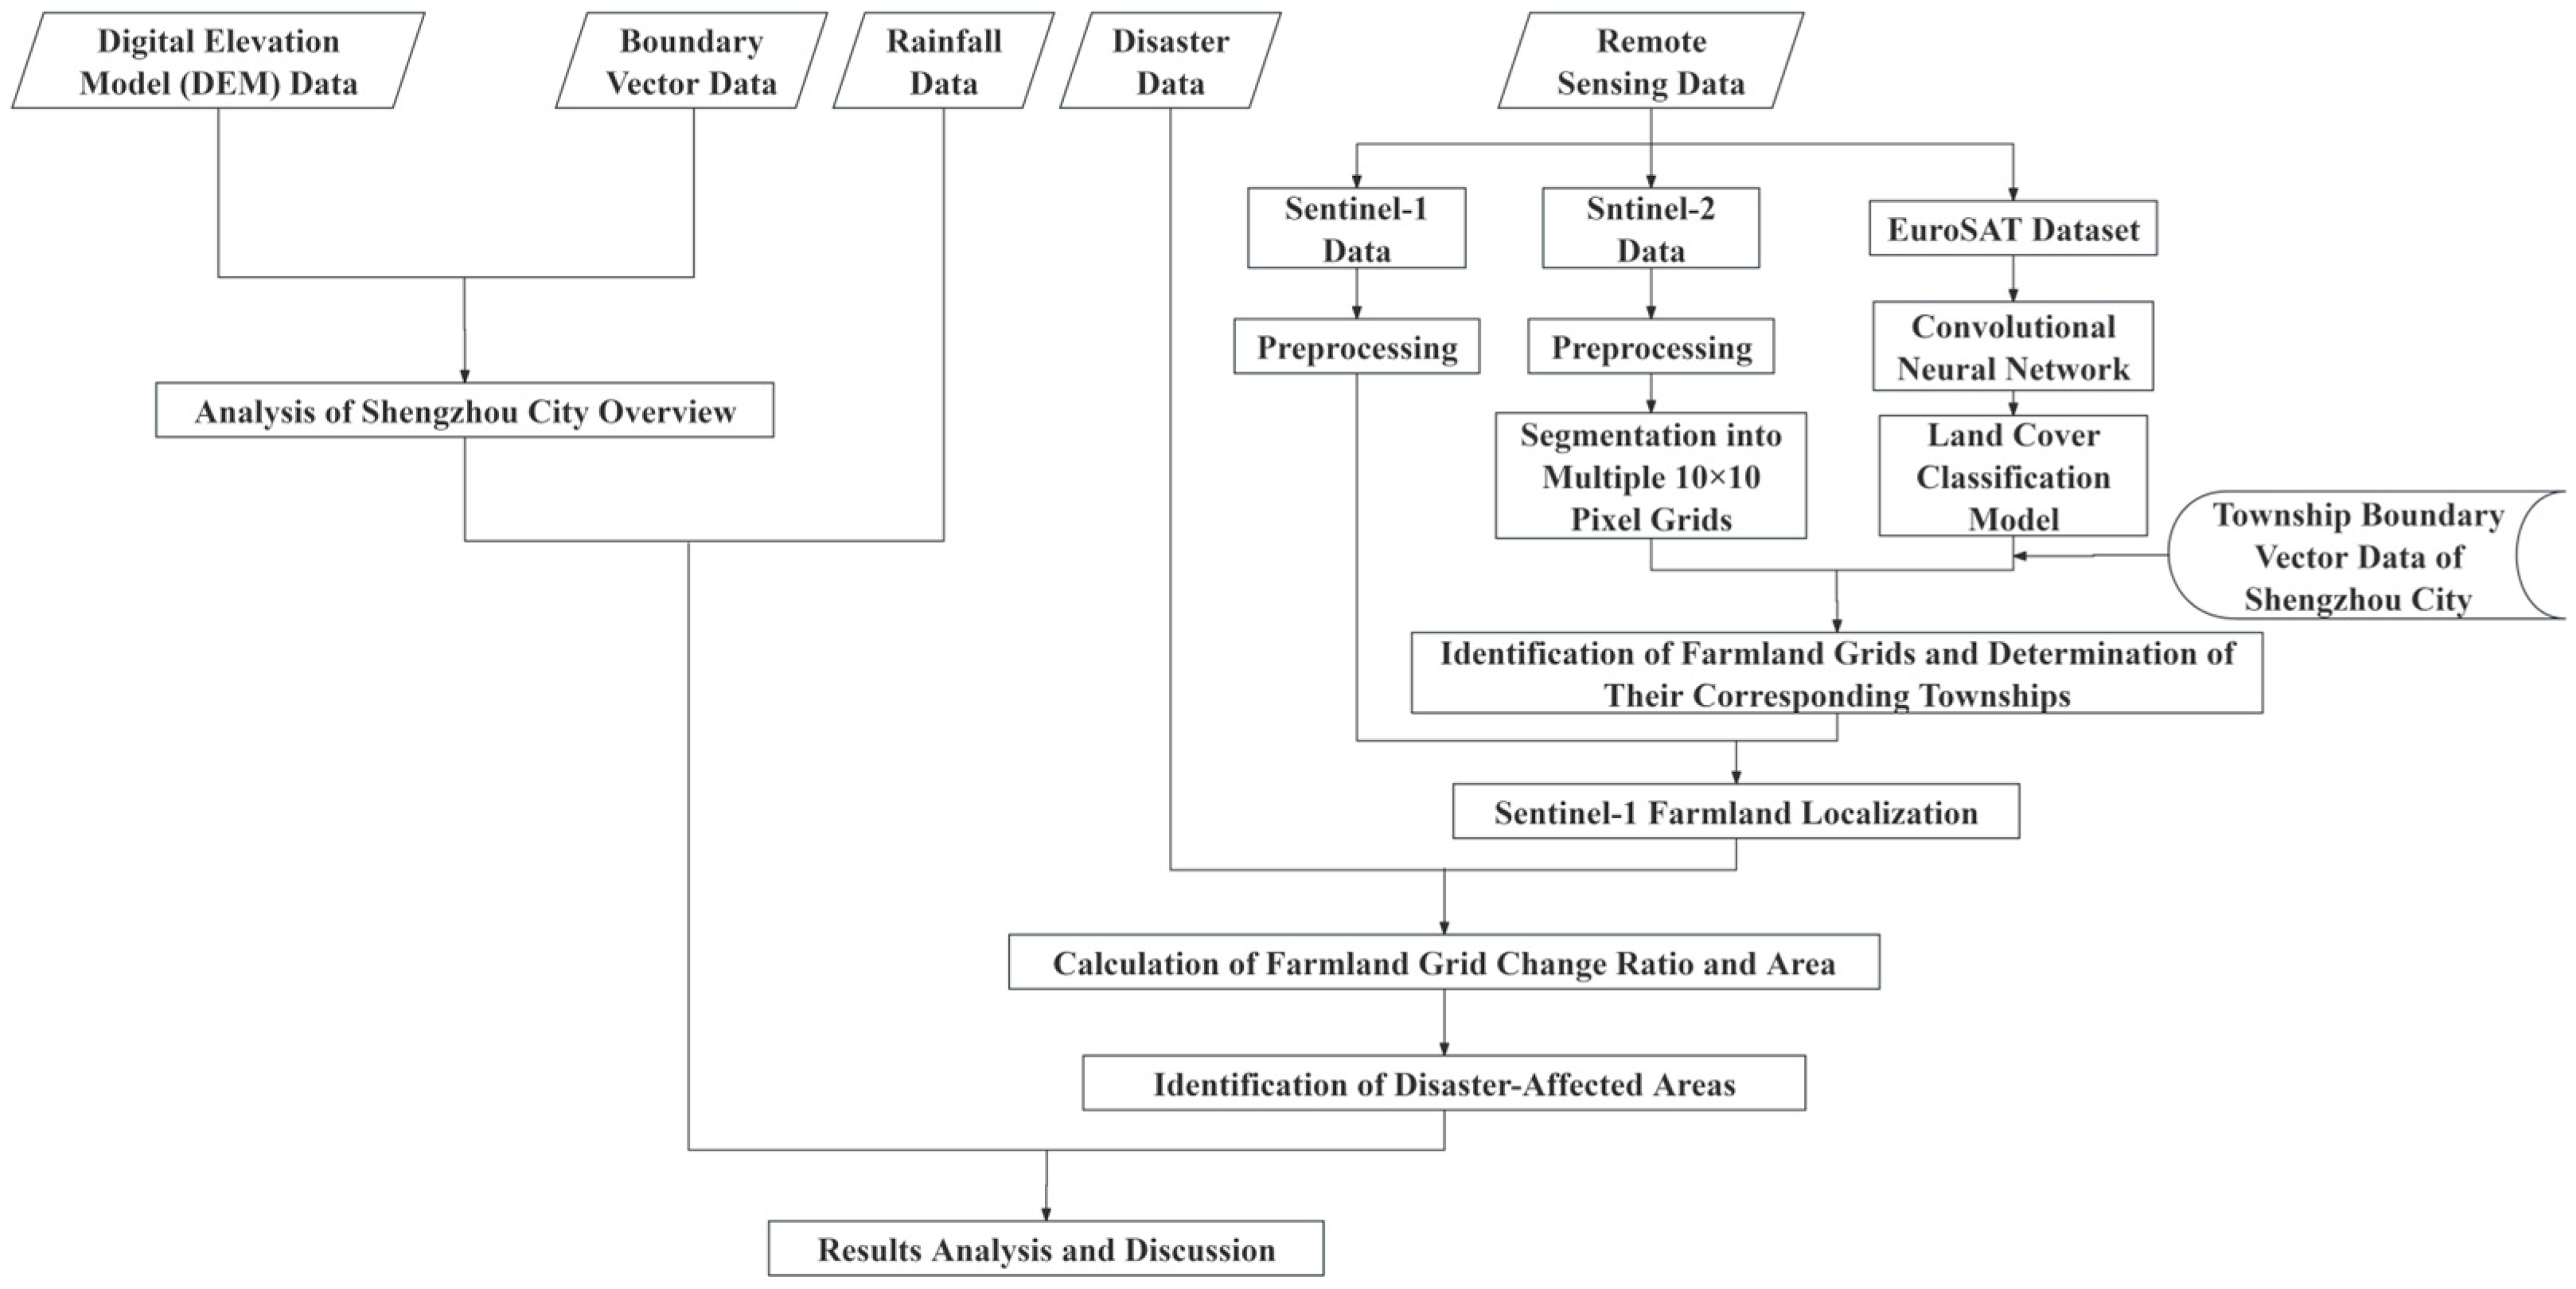
In this study, the vector data we used include boundary vector data for neighboring provinces and cities of Zhejiang Province, Zhejiang Province, Shaoxing City, Shengzhou City, and various townships within Shengzhou City. The elevation data consist of the Digital Elevation Model (DEM) data of Shengzhou City. The resolution of the DEM data is 30 × 30 m, which is obtained from the Geospatial Data Cloud of the Chinese Academy of Sciences.

3. Research Methods

3.1. Construction of the Land Cover Classification Model

In recent years, researchers have widely applied Convolutional Neural Networks in image classification due to their powerful feature learning capabilities [32,33]. In this study, we constructed a land cover classification model based on the VGG network architecture, utilizing the EuroSAT remote sensing image dataset. The model framework comprises six convolutional layers, one global average pooling layer, and two fully connected layers.

3.1.1. Data Preprocessing

Various random transformations (scaling, rotation, translation, and horizontal flipping) were applied to images in the EuroSAT dataset to generate new samples, enhancing the model’s generalization ability and reducing overfitting. Additionally, batch-wise dynamic generation of processed images and their corresponding labels was employed to provide a continuous data stream for model training, improving training efficiency and performance.

3.1.2. Convolutional Layer

The convolutional layer is responsible for extracting features from the input image. It scans the image using multiple convolutional kernels and applies the nonlinear activation function ReLU (Rectified Linear Unit) to generate feature maps [34]. This structure enables the model to gradually learn from simple, low-level features (such as edges and corners) to more complex, high-level features (such as shapes and textures). The ReLU activation function is defined as R e L U x = m a x 0 , x . The first and second convolutional layers contain 64 convolutional kernels of size 3 × 3 in each layer. The third and fourth convolutional layers contain 128 convolutional kernels of size 3 × 3 in each layer. The fifth and sixth convolutional layers contain 256 convolutional kernels of size 3 × 3 in each layer. The formula for the first convolutional layer is as follows:
h i , j , k 1 = R e L U m = 0 M 1 n = 0 N 1 x i + m , j + n ω m , n , k 1 + b k 1
where h i , j , k 1 represents the output at position (i, j) of the k-th convolutional kernel in the first layer; x represents the input image data; ω m , n , k 1 represents the weights of the k-th convolutional kernel in the first layer at position (m, n); b k 1 represents the bias of the k-th convolutional kernel in the first layer; M and N represent the height and width of the convolutional kernel.
The formulas for the second to sixth convolutional layers are as follows:
h i , j , k z = R e L U m = 0 M 1 n = 0 N 1 h i + m , j + n , k z 1 ω m , n , k z + b k z

3.1.3. Global Average Pooling Layer

The global average pooling layer takes the average value of each feature map as the output, thereby reducing the feature dimensionality, which helps to decrease model complexity and mitigate the risk of overfitting. The formula for the global average pooling layer is as follows:
G A P k = 1 H × W i = 0 H 1 j = 0 W 1 h i , j , k
where G A P k represents the global average pooling output for the k-th feature map; H and W represent the height and width of the feature map; h i , j , k represents the value at position (i, j) in the k-th feature map.

3.1.4. Fully Connected Layer

The fully connected layer is responsible for mapping the extracted features to land cover classification labels. Learning the complex nonlinear relationships between input features and target labels maps the features extracted by the convolutional layers and the global average pooling layer to specific classification labels, ultimately achieving image classification. The first fully connected layer consists of 1024 neurons, with each neuron connected to the output of the global average pooling layer. It utilizes the ReLU activation function and is followed by a Dropout layer to prevent overfitting. The Dropout layer prevents overfitting by randomly dropping 50% of the neurons during training. This regularization technique reduces the model’s dependency on the training data, improving its generalization ability. The formula for the first fully connected layer is as follows:
y i = R e L U W i G A P + b i
where y i represents the output of the i-th neuron; W i represents the weight vector of the i-th neuron; GAP represents the output vector of the global average pooling layer; b i represents the bias term for the i-th neuron.
The second fully connected layer is also the output layer. The number of neurons in the output layer equals the number of land cover classification categories. The Softmax activation function is applied in the output layer to convert the outputs into a probability distribution, enabling multi-class classification. The formula for the output layer is as follows:
y ^ i = e x p W i y + b i j e x p W j y + b j
where y ^ i represents the predicted probability for class i; W i represents the weight vector of the i-th neuron in the output layer; y represents the output vector from the Dropout layer; b i represents the bias term of the i-th neuron in the output layer; exp(z) represents the exponential function, which returns the exponentiation of the input z as the output; j e x p W j y + b j represents the sum of exponentiated values across all classes, used to normalize the probabilities.

3.1.5. Model Compilation

The compilation process integrates the model configuration (network architecture and parameters) with the training details (optimizer, loss function, and evaluation metrics), allowing the model to train and be evaluated effectively.
In this study, we compiled the model using the Adam (Adaptive Moment Estimation) optimizer, the categorical cross-entropy loss function, and accuracy as the evaluation metric [35,36]. The Adam optimizer efficiently updates parameters, improving the convergence speed and stability of the model. The categorical cross-entropy loss function is well-suited for multi-class classification problems, effectively guiding parameter adjustments during training. Accuracy is the evaluation metric, providing an intuitive measure of the model’s classification performance.
The optimizer determines how the model’s weights are updated based on the gradient of the loss function. The Adam optimizer combines the advantages of Momentum and RMSProp (Root Mean Square Propagation) by computing both the first-moment and second-moment estimates to adaptively assign individual learning rates to different parameters. The formulas are as follows:
m t = β 1 m t 1 + 1 β 1 g t
v t = β 2 v t 1 + 1 β 2 g t 2
m ^ t = m t 1 β 1 t
v ^ t = v t 1 β 2 t
θ t + 1 = θ t α m ^ t v ^ t + ε
where m t represents the first-moment estimate (momentum term) at the current time step, which is the exponentially weighted moving average of past gradients; v t represents the second-moment estimate (root mean square term) at the current time step, which is the exponentially weighted moving average of past squared gradients; g t represents the gradient at the current time step. β t represents the decay rate for the first-moment estimate, typically set to 0.9; β 2 represents the decay rate for the second-moment estimate, typically set to 0.999; m ^ t represents the bias-corrected first-moment estimate; v ^ t represents the bias-corrected second-moment estimate; θ t represents the current parameter values; α represents the global learning rate, which determines the step size for updating weights during each optimization step; ε is a small constant to prevent division by zero, typically set to 10 8 .
In this study, we set the global learning rate in the Adam optimizer to 0.0001 as the base step size. During training, the actual learning rate for each parameter was adaptively adjusted based on its momentum and root mean square gradient estimate, enabling adaptive learning rates.
The categorical cross-entropy loss function can measure the difference between the predicted probability distribution and the true distribution, quantifying the error by computing the cross-entropy between the true labels and the predicted probabilities. The formulas are as follows:
L = i = 1 N y i l o g y ^ i
where L represents the loss value; N represents the number of samples; y i represents the true label; if class i is the correct class, then y i = 1 , otherwise y i = 0 ; y ^ i represents the predicted probability, meaning the model’s predicted probability that the input belongs to class i.
Accuracy, as an evaluation metric, represents the proportion of correctly predicted samples to the total number of samples. It performs well on datasets with balanced class distributions and is suitable for the EuroSAT dataset.

3.2. Farmland Identification and Localization

We divided the Sentinel-2 remote sensing imagery of Shengzhou City into multiple 10 × 10 pixel grids. The land cover classification model traversed and processed each grid to identify farmland grids. Based on the township boundary vector file of Shengzhou City, the township information corresponding to each farmland grid was determined. The detailed township division map of Shengzhou City is shown in Figure 2.
We used spatial transformation information from the imagery to calculate the geographic coordinates of the four vertices of each farmland grid, determining its exact geographic location. An affine transformation matrix was applied to convert image pixel coordinates into geographic coordinates. The formulas are as follows:
x y = a b c d e f x y 1
where x , y represents the geographic coordinates; (x, y) represents the pixel coordinates; a, b, c, d, e, f are the affine transformation parameters.
The geographic coordinates of the four vertices of the farmland grid were used to determine its exact location in Sentinel-1 remote sensing imagery.

3.3. Refined Identification of Disaster-Affected Areas

Sentinel-1 remote sensing imagery (Sentinel-1 GRD, IW mode, VV polarization) of Shengzhou City was adopted from 11 June and 23 June 2021; 23 July and 29 July 2021; and 10 August and 22 August 2021, corresponding to the three flood disasters that occurred in Shengzhou City on 13 June, 26 July and 15 August 2021, respectively.
The pixel-wise direct difference comparison was used to calculate the differences between farmland grids before and after the flood disaster. A pixel-by-pixel comparison was conducted to compute the pixel differences within the same farmland grid before and after the flood disaster impact, obtaining the change ratio of the farmland grid and determining its change in area. The formulas are as follows:
s = S × p
where s represents the change in farmland grid area; S represents the original farmland grid area; p represents the change ratio of the farmland grid before and after the flood disaster event.
When the change ratio exceeds 50%, the farmland grid is identified as a disaster-affected area. The change area of farmland grids with a change ratio greater than 50% is considered the affected area of the grid.
The technical framework of this study is shown in Figure 3.

4. Results and Analysis

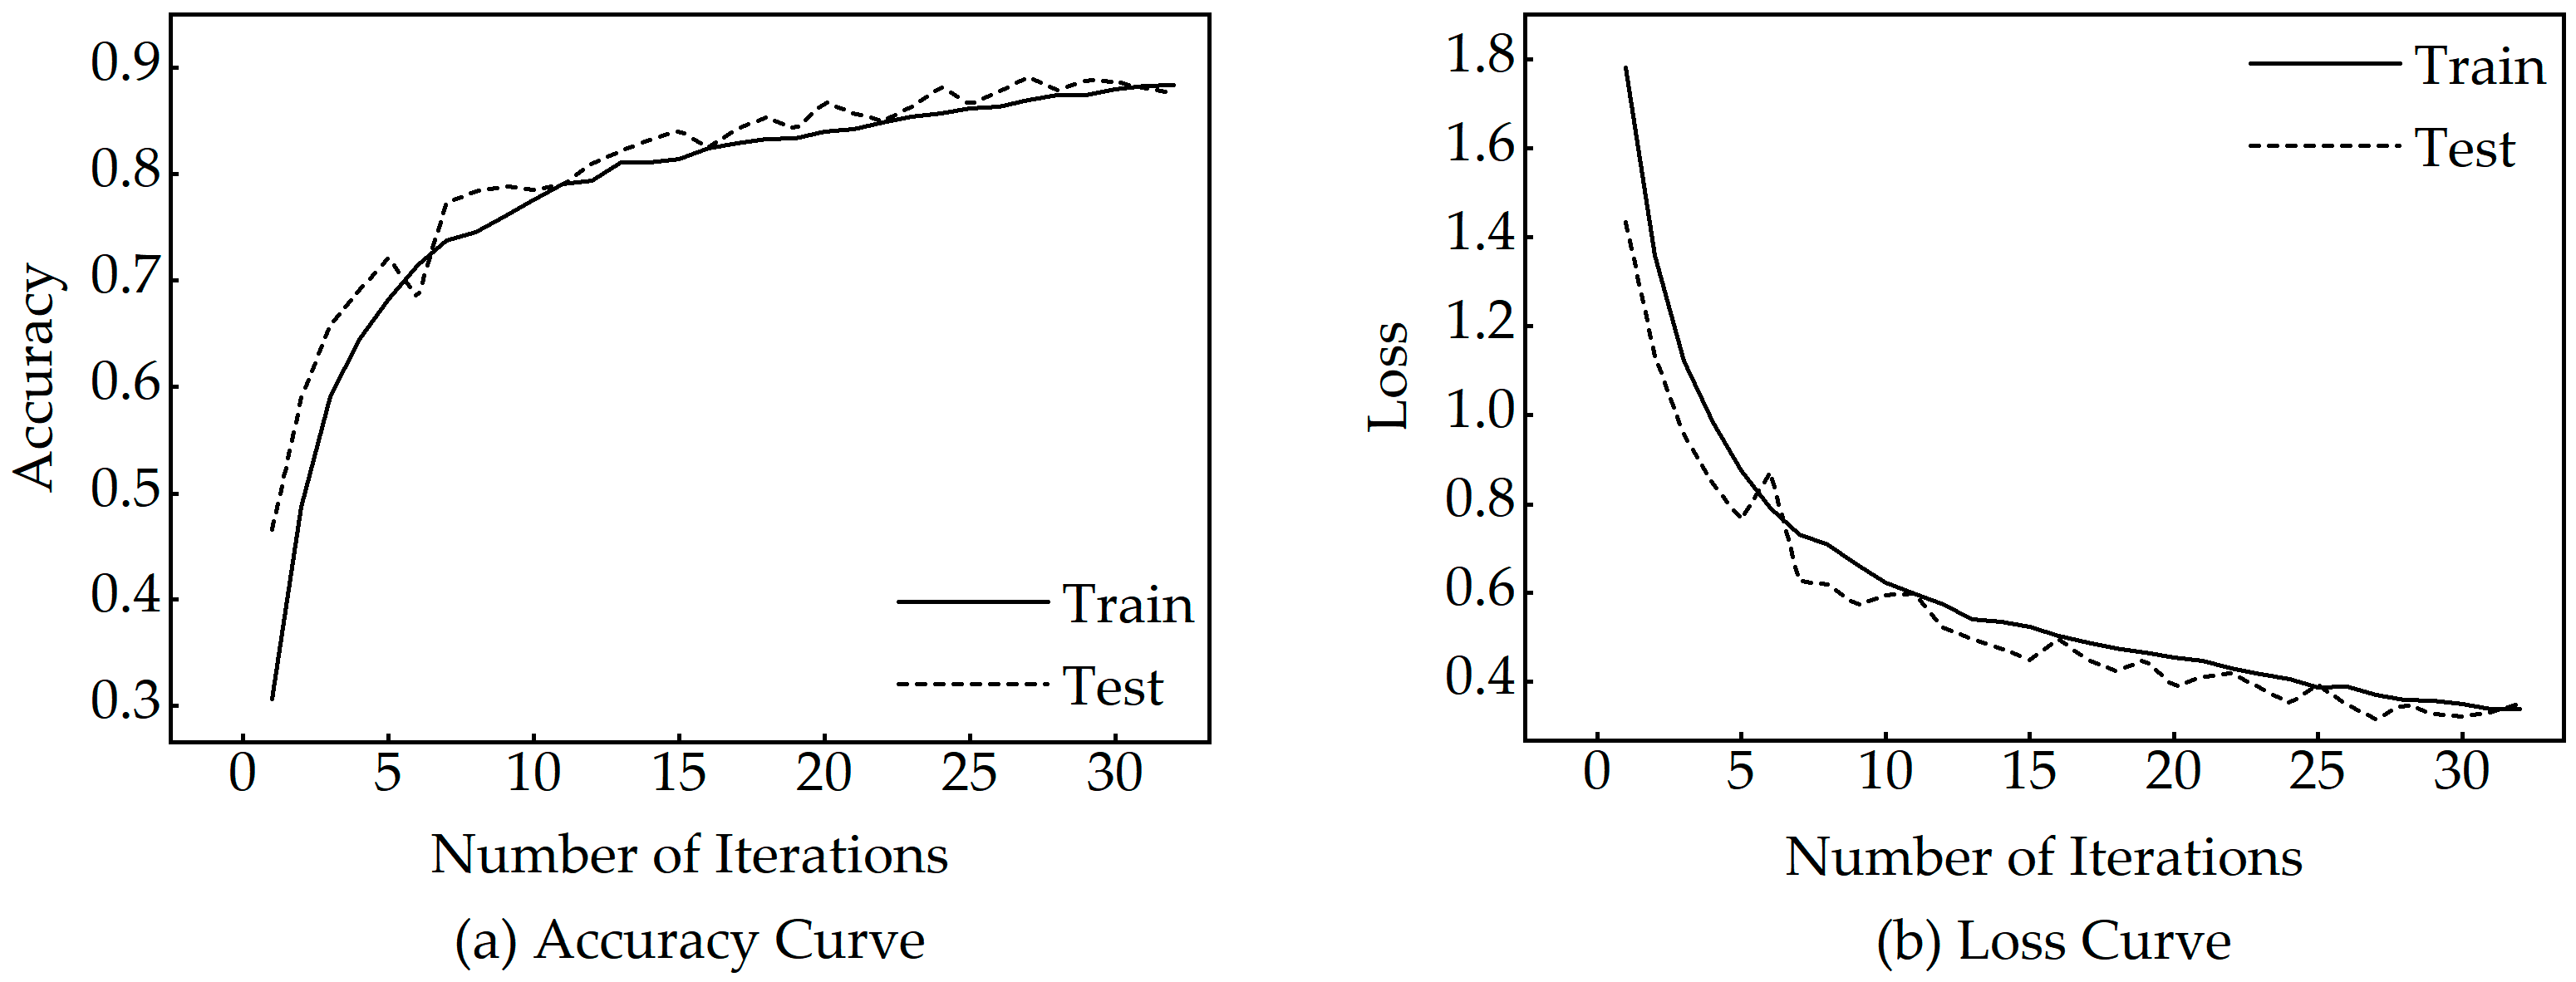
4.1. Analysis of the Results from Training the Land Cover Classification Model

We used early stopping and model checkpoints to prevent overfitting and save the optimal model, enhancing its generalization ability and overall performance. During training, we monitored the loss on the test set to decide whether to stop training early. The training was stopped early if the test set loss did not improve within a fixed number of epochs (patience parameter). When training was halted, the model was restored to the state with the lowest test set loss, ensuring optimal performance.
In this model training, the patience parameter was set to 5. During the 28th to 32nd training epochs, the loss on the training set did not improve. As a result, the final model was restored to the weight state from the 27th epoch and saved.
The loss and accuracy curves during model training are shown in Figure 4. It can be observed that the training and test accuracy continuously improve while the loss gradually decreases, indicating that the model gradually converges during the training process. The small difference between training and test accuracy and the minor gap in loss values suggests that the model does not exhibit significant overfitting. Although the test accuracy and loss curves fluctuate, the overall trend remains stable, demonstrating good generalization ability. The final model achieves approximately 90% accuracy on the training and test sets, indicating strong performance in the land cover classification task. The decrease in training and test loss indicates that the model effectively reduces prediction errors during the learning process, demonstrating its high performance.

4.2. Analysis of Farmland Identification and Localization Results

We used the land cover classification model to identify farmland grid areas from Sentinel-2 remote sensing imagery of Shengzhou City and assigned each farmland grid to its respective township’s administrative region, as shown in Figure 5. The results show that farmland in Shengzhou City is primarily concentrated in the central region, within the urban area and surrounding townships. It is located in flat terrain areas within various townships, such as the southern part of Chongren Town, the southeastern part of Shihuang Town, the eastern part of Changle Town, and the northern part of Ganlin Town, making it suitable for agricultural operations.
Using the geographic coordinates of the four vertices of each farmland grid, we determined their exact locations in Sentinel-1 remote sensing imagery, as shown in Figure 6. The results indicate that the positioning of farmland grids in Sentinel-1 imagery is highly accurate.

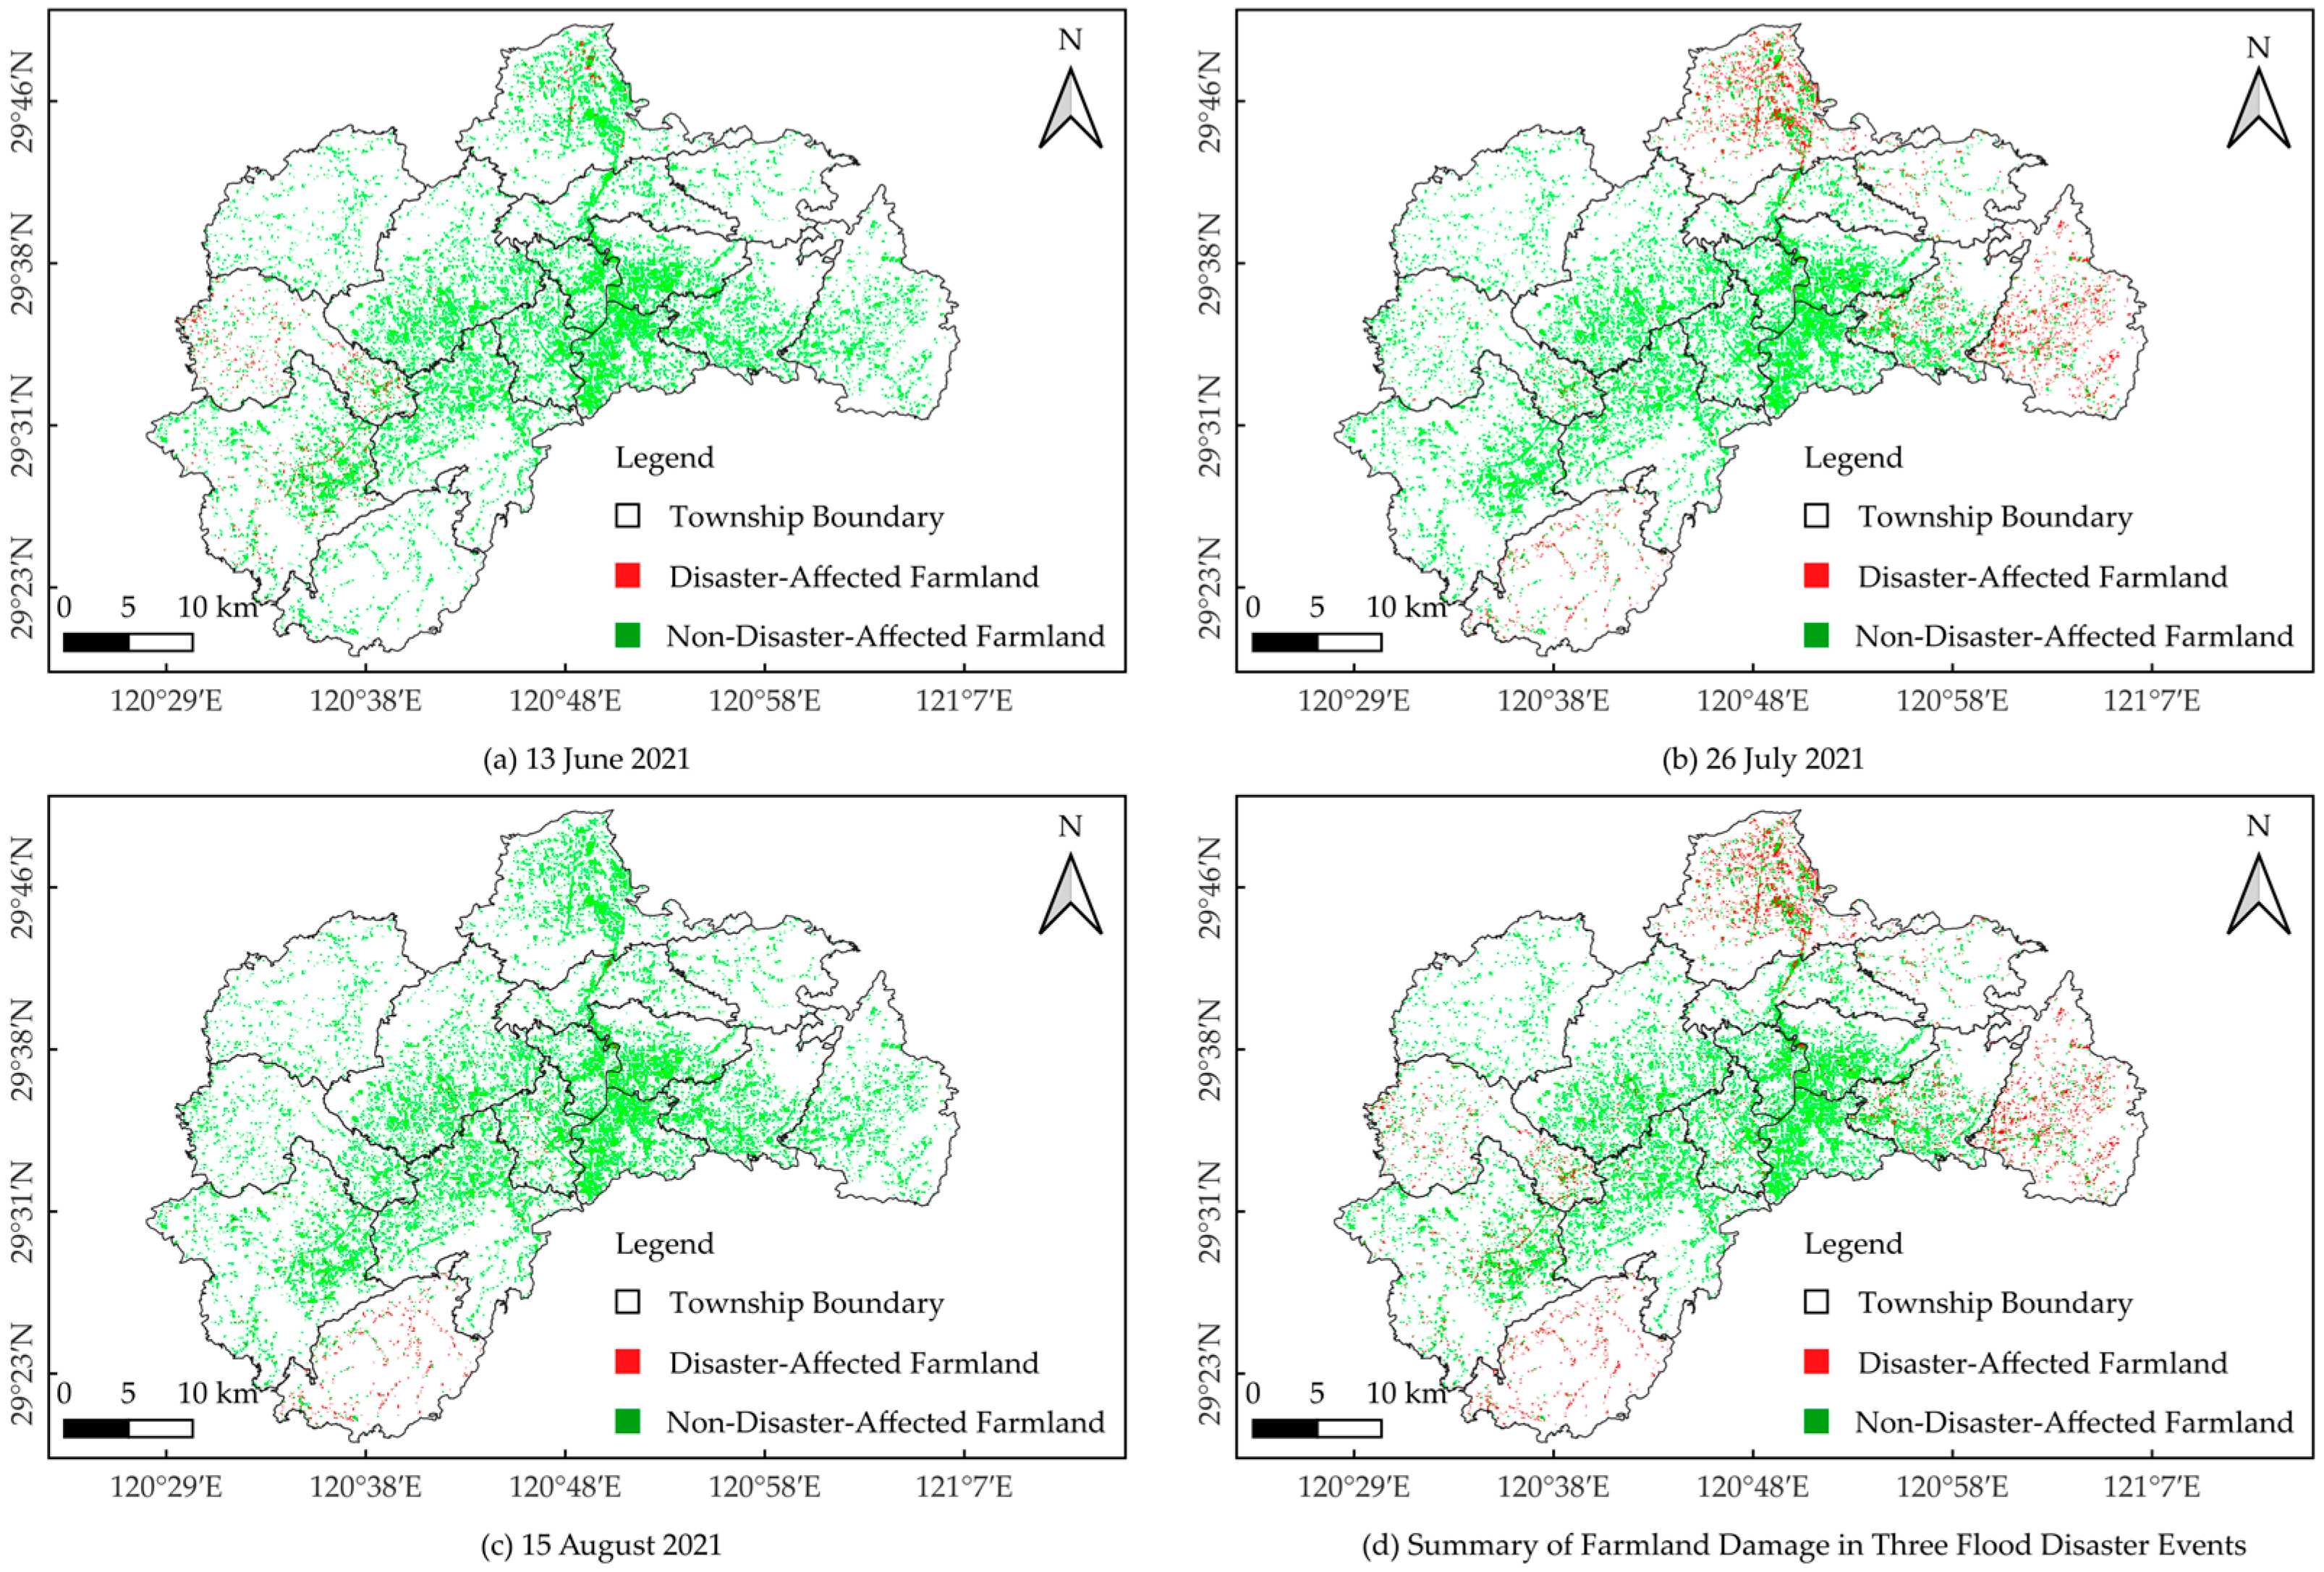
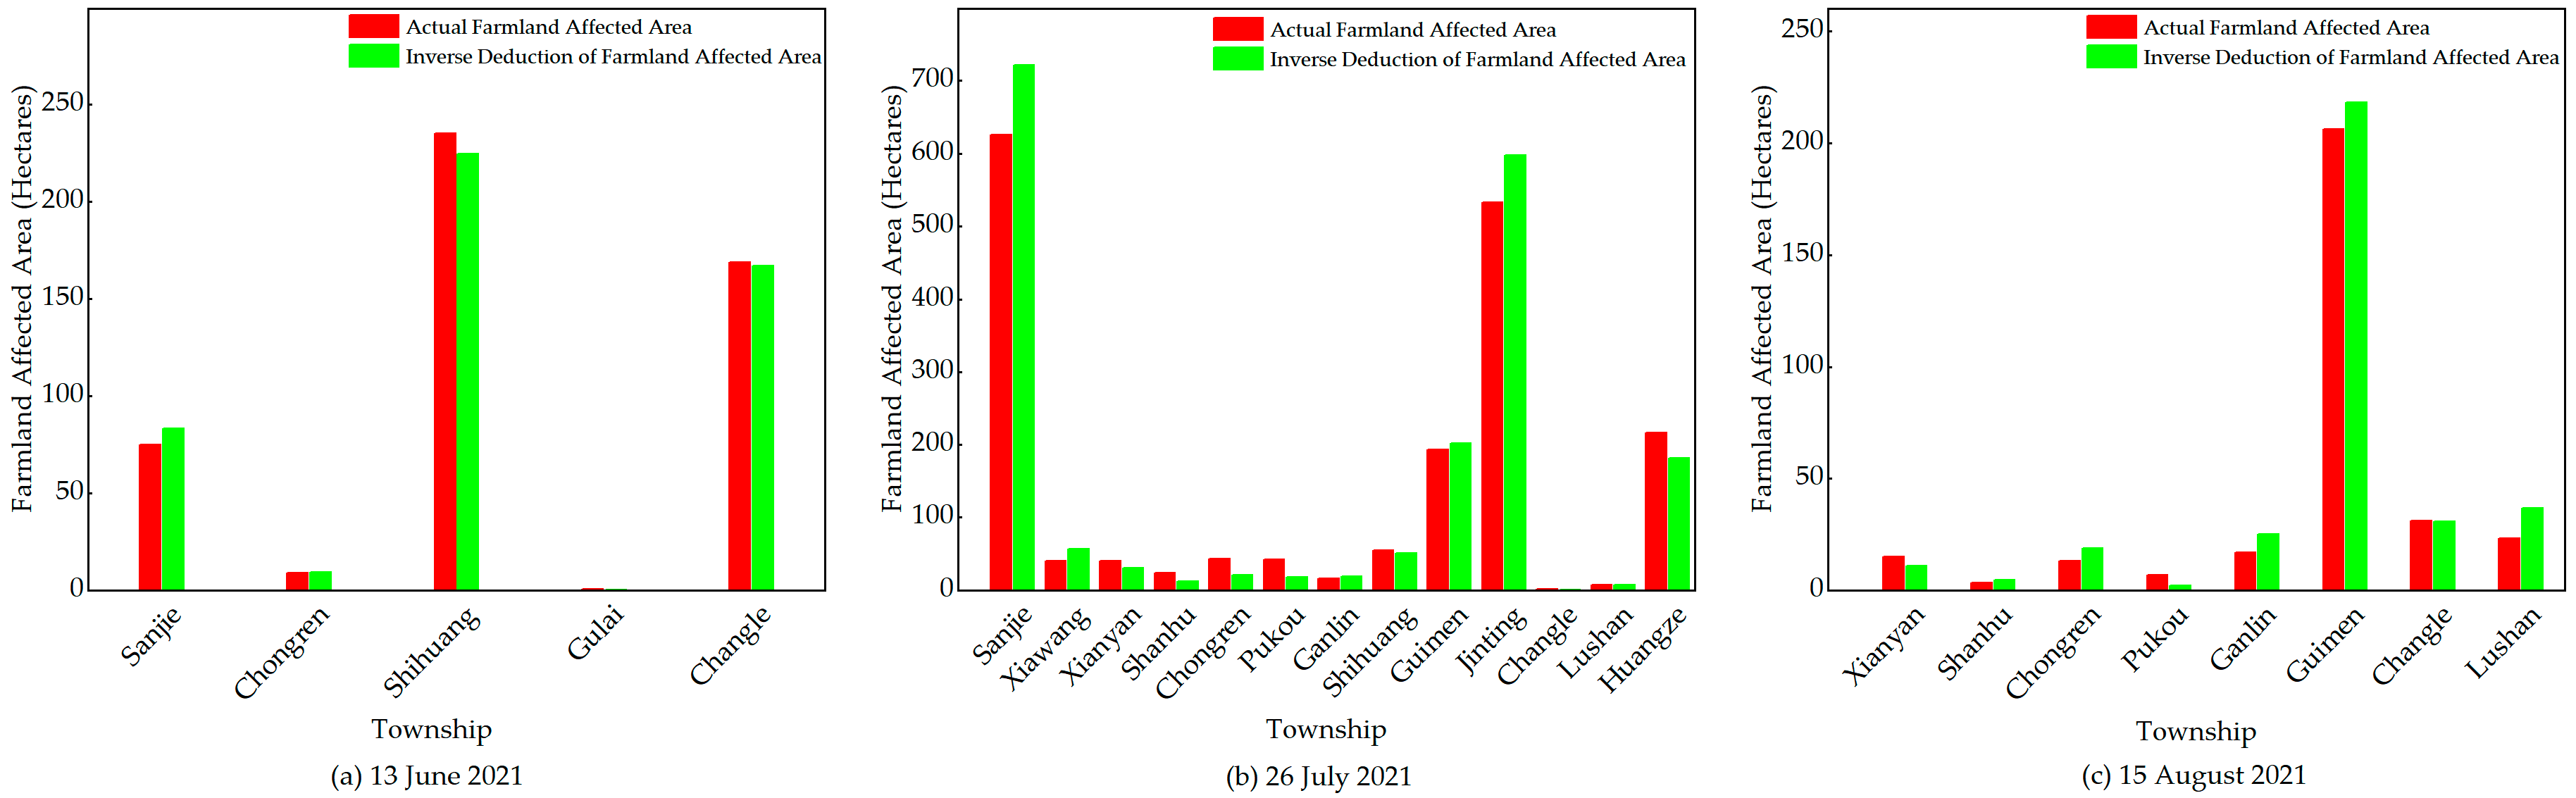
4.3. Analysis of Refined Identification Results of Disaster-Affected Areas

The three flood disasters resulted in different affected farmland areas within the same township, indicating significant differences in the characteristics of the three rainfall events. Hourly rainfall data for the three rainfall events are shown in Figure 7.
The rainfall that caused the flood disaster on 13 June 2021 exhibited an uneven distribution, with precipitation concentrated in two distinct periods. Both phases reached the heavy rain level, with a noticeable break in precipitation between them. Significant fluctuations in rainfall intensity mainly characterized this event.
The rainfall leading to the flood disaster on 26 July 2021 lasted for a whole week and extended duration. Although the intensity of the hourly rainfall was not high, the 12-hour cumulative rainfall reached the heavy rain level. This event was dominated by frequent light and moderate rain, with relatively weak overall intensity.
The rainfall responsible for the flood disaster on 15 August 2021 showed a distinct intermittent pattern rather than continuous precipitation. The event featured short-duration heavy rainfall occurring intermittently, accompanied by multiple periods of light rain. The total duration spanned five days, with the first two days mainly consisting of intermittent light rain and the last three days featuring sudden, short-term heavy rainfall.
We calculated the pixel change ratio of the same farmland grids in Sentinel-1 remote sensing imagery before and after the flood disaster to identify disaster-affected areas, as shown in Figure 8. A number of farmland grids classified as disaster-affected in each township and their proportion relative to the total farmland grids within the administrative region are presented in Table 1. Results indicate that rainfall events with unevenly distributed precipitation, significant fluctuations in intensity, and short durations posed a greater threat to farmland in Shihuang Town and Changle Town, with disaster-affected areas mainly located in low-lying regions of these townships. Sanjie Town’s distribution of affected farmland appeared scattered and irregular, suggesting a possible connection to the local drainage system. Prolonged rainfall events, primarily light and moderate rain, with frequent but weak precipitation, posed the greatest threat to farmland in Shengzhou City. The flood disaster on July 26 resulted in a total affected farmland area of 1839.44 hectares citywide. Sanjie Town had the largest affected farmland area, with more than half of its farmland impacted. The widespread and evenly distributed damage further indicates deficiencies in its drainage system. Farmland in Jinting Town and Guimen Township was also severely affected, with more than half of their farmland impacted. In Huangze Town, the affected farmland was mainly concentrated in the central and western regions. Sudden short-term heavy rainfall had the greatest impact on Guimen Township, with approximately 70% of its farmland affected, indicating severe damage. In comparison, the extent of farmland damage in other townships was relatively mild.
We performed a reverse deduction to identify farmland-affected areas in each township, as shown in Figure 9. In all three flood disasters, the reverse deduction results for farmland-affected areas in each township closely matched the actual disaster data, demonstrating the accuracy of the results.
Agricultural flood disaster areas in Shengzhou City exhibit a distinct spatially uneven distribution, primarily influenced by topography and drainage infrastructure. The disaster-affected areas are mainly concentrated in the northern, eastern, and southwestern peripheral regions of Shengzhou City. Most farmland in these areas is adjacent to mountains and hills, with low-lying terrain and poor drainage, leading to flooding. Safe areas are primarily distributed in the urban area of Shengzhou City and its surrounding townships, where the terrain is relatively flat and distant from mountains and hills, indicating that the drainage infrastructure in the city center and its surrounding areas is well-developed. Shengzhou City should strengthen the construction and maintenance of water conservancy facilities in disaster-prone areas, enhance its capacity to respond to agricultural flood disasters, and improve drainage systems in low-lying farmland near mountainous and hilly regions and in peripheral townships.

5. Conclusions

By integrating microwave and optical remote sensing data, we employed deep learning methods, GIS, and the pixel direct difference method to successfully identify agricultural flood disaster areas in Shengzhou City. Incorporating rainfall data and analyzing the topography of Shengzhou City, the main conclusions are as follows:
  • Deep fusion of microwave and optical remote sensing data can accurately identify flood disaster areas.
  • The reverse calculation results of the disaster-affected farmland area in each township by this method are consistent with the actual disaster data.
  • Agricultural flood disaster areas in Shengzhou City exhibit a distinct spatially uneven distribution.
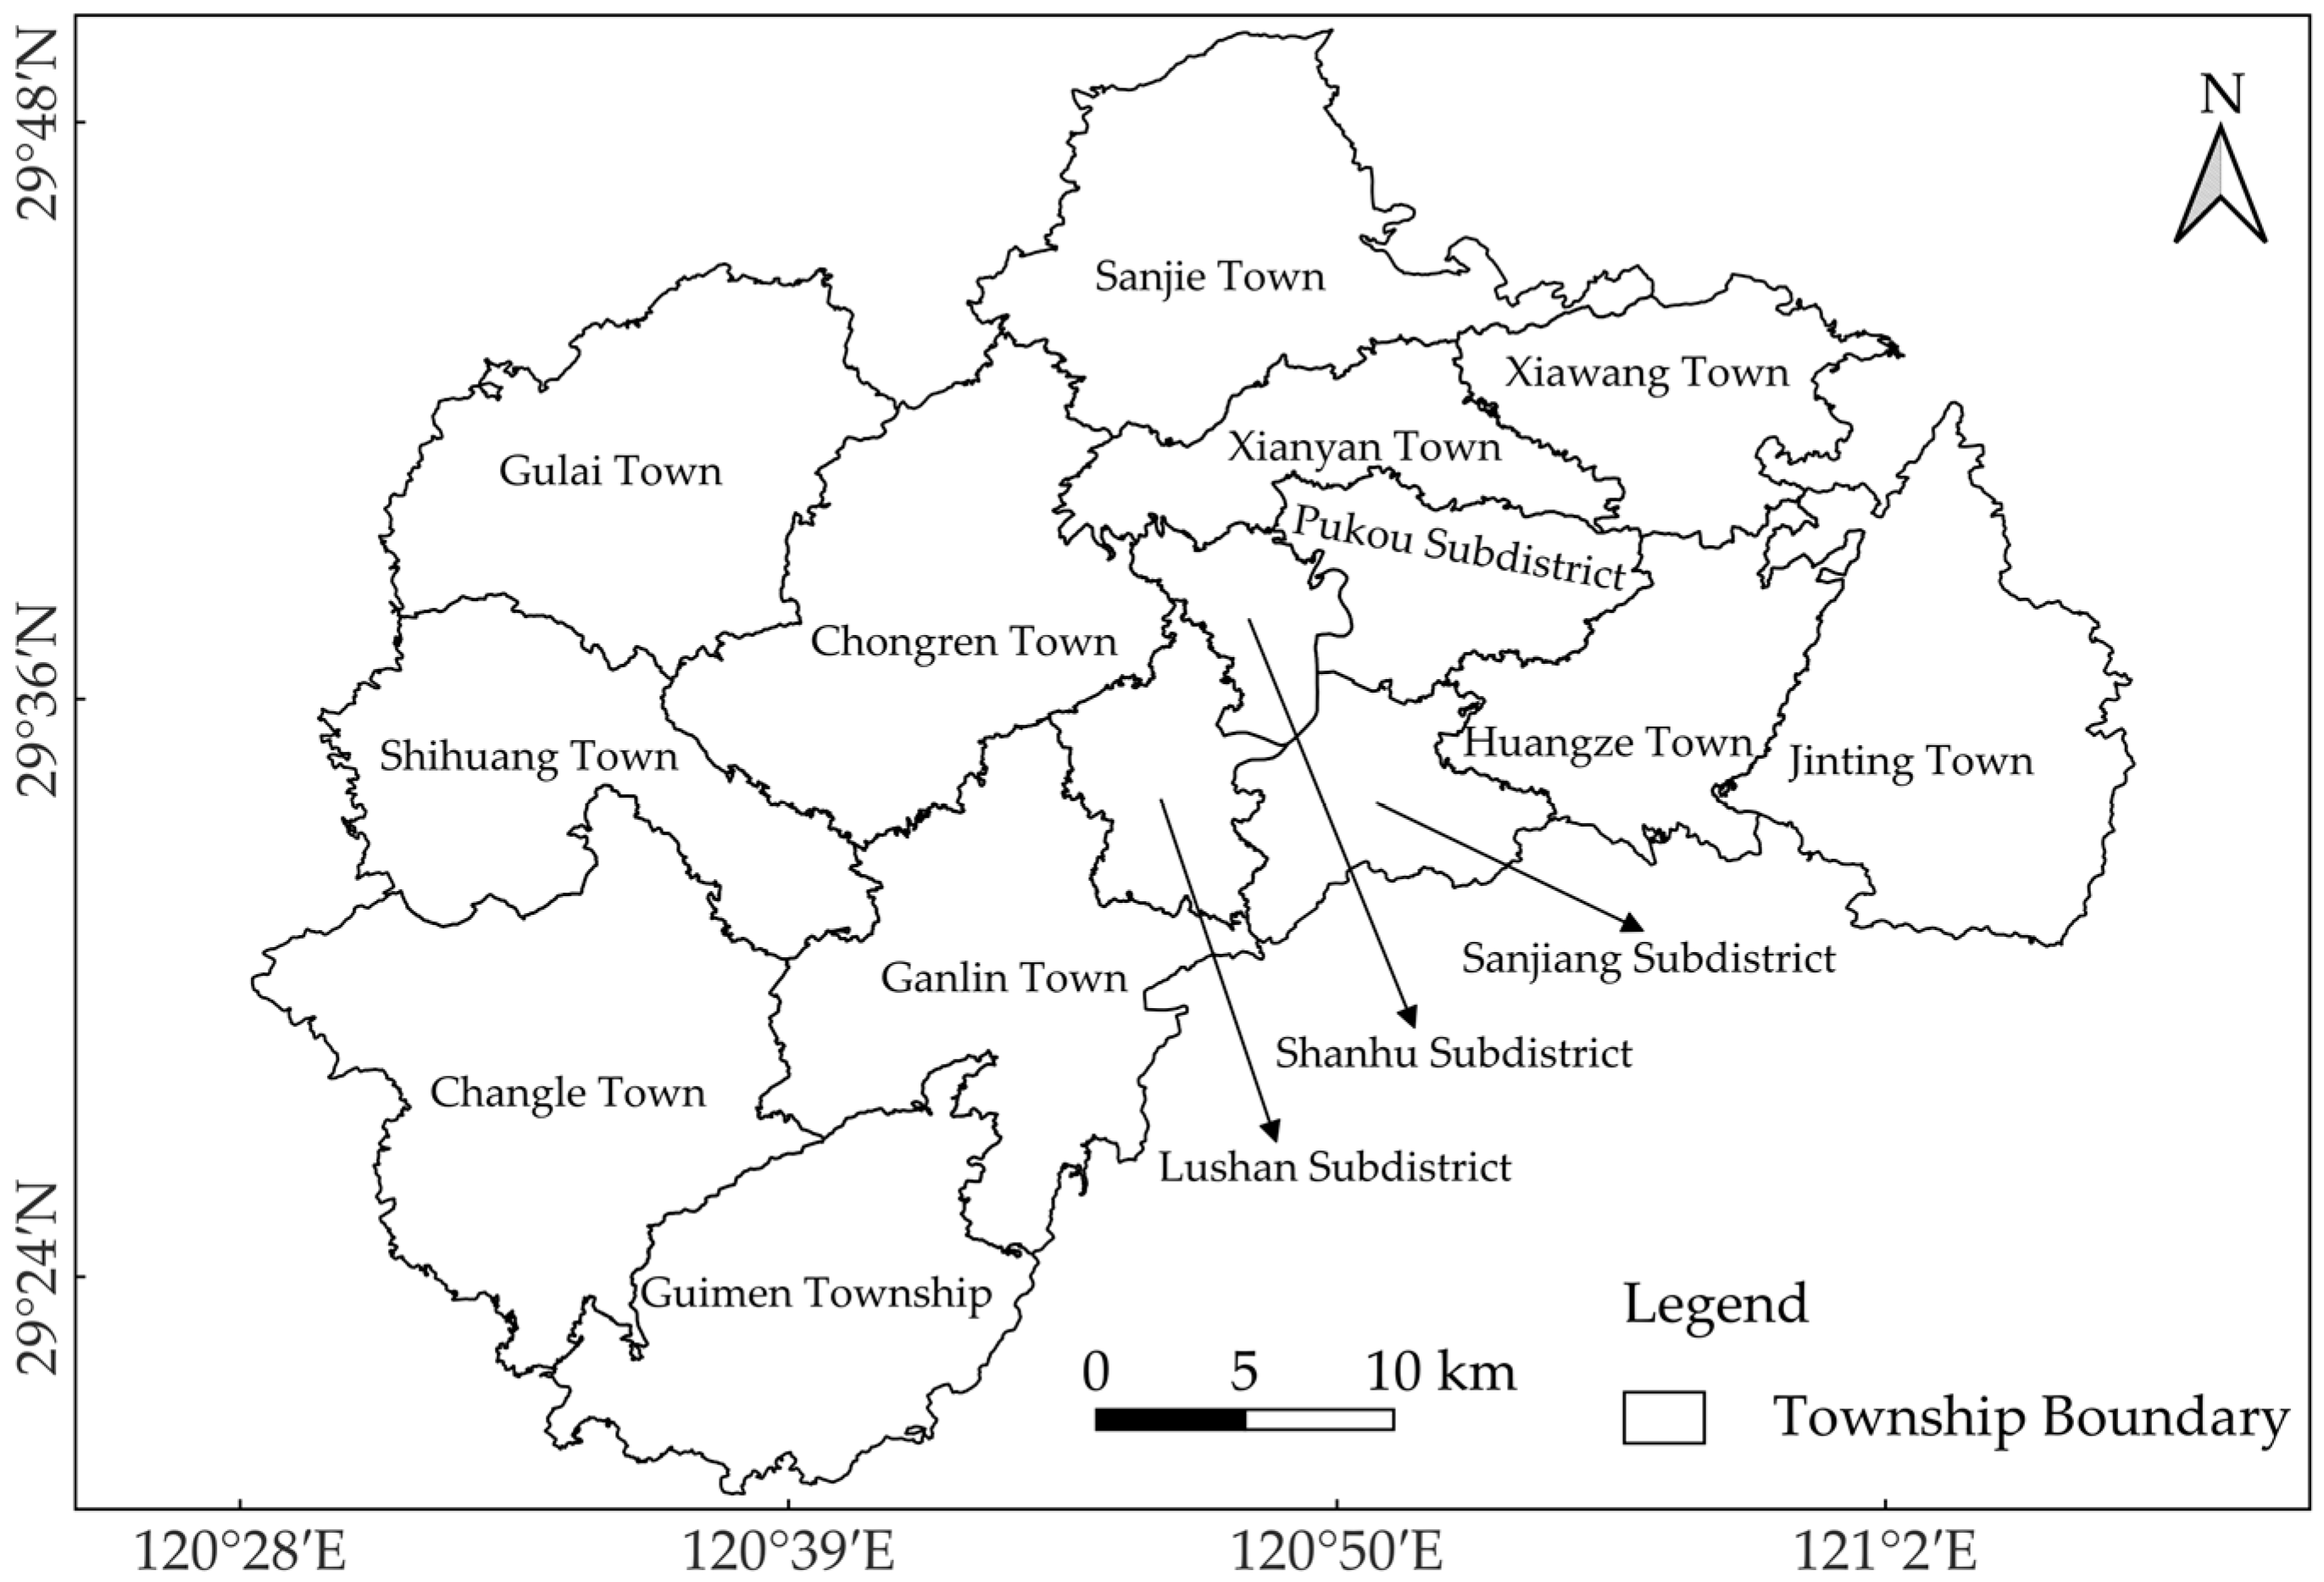
  • The disaster-affected areas are mainly distributed in Sanjie Town, the central and southwestern parts of Huangze Town, Jinting Town, the southeastern part of Shihuang Town, Changle Town, and Guimen Township. These areas are located in the northern, eastern, and southwestern regions of Shengzhou City, situated at the city’s periphery.
  • The topography of Shengzhou City is predominantly mountainous and hilly. Farmland located near mountains and hills and in low-lying areas is more susceptible to flood disasters.
Integrating microwave and optical remote sensing data can effectively identify disaster-affected farmland areas. Refined identification of disaster areas provides a scientific basis for agricultural disaster prevention, mitigation efforts, and agricultural insurance, thereby reducing agricultural damage and economic losses. However, it is difficult to obtain effective satellite remote sensing images for this method. Therefore, future work can combine multisource platform data from drones and ground stations and conduct field surveys to enhance the resolution of remote sensing images and further improve the accuracy of disaster identification.

Author Contributions

Conceptualization, J.L., J.G., H.C., X.S., X.Z. and Y.Q.; methodology, J.L., J.G., H.C., X.S., X.Z. and Y.Q.; software, J.L. and J.G.; validation, J.L., J.G. and X.Z.; formal analysis, J.L. and J.G.; investigation, J.L. and X.Z.; resources, J.L., H.C. and X.S.; data curation, J.L., H.C. and X.S.; writing—original draft preparation, J.L., J.G. and X.Z.; writing—review and editing, J.L., J.G., X.Z. and Y.Q.; visualization, J.L., J.G. and X.Z.; supervision, J.G. and X.Z.; project administration, X.Z.; funding acquisition, X.Z. All authors have read and agreed to the published version of the manuscript.

Funding

This research was funded by [Jiangsu Province Industry-University-Research Cooperation Project: Research and Development of Weather Forecasting Business Service Platform] grant number [BY20230008] and the APC was funded by [Jiangsu Province Industry-University-Research Cooperation Project: Research and Development of Weather Forecasting Business Service Platform].

Institutional Review Board Statement

Not applicable.

Informed Consent Statement

Not applicable.

Data Availability Statement

The data supporting the findings of this study are available from the first author [Jiayun Li] on reasonable request.

Conflicts of Interest

The authors declare no conflict of interest.

References

  1. Li, H.; Wang, K.Q.; Miao, Q. Risk Zoning of Flood and Waterlogging in Weifang. Nanjing Univ. Inf. Sci. Technol. Nat. Sci. 2013, 5, 508–514. (In Chinese) [Google Scholar] [CrossRef]
  2. Quan, T.; Zhang, C.G.; Feng, Y.; Li, H.J.; Guo, Y.; Shen, Y.J. Impact of the “23·7” Extreme Heavy Precipitation on Maize Yield in the Hebei Plain. Chin. J. Eco-Agric. 2024, 32, 1023–1032. (In Chinese) [Google Scholar]
  3. Li, Z.H.; Wang, J.W.; Hu, Y.F.; Zhu, W.; Fu, X.; Zhang, S.C.; Yu, C.; Wang, L.; Zhang, C.; Du, J.T.; et al. Rapid Assessment of Traffic Inefficiency Under Flood Scenarios Over Wide Regions. Geomat. Inf. Sci. Wuhan Univ. 2023, 48, 1039–1049+990. (In Chinese) [Google Scholar] [CrossRef]
  4. Huo, Z.G.; Fan, Y.X.; Yang, J.Y.; Shang, Y. Review on Agricultural Flood Disaster in China. J. Appl. Meteorol. Sci. 2017, 28, 641–653. (In Chinese) [Google Scholar]
  5. Ma, J.L.; Kong, W.S.; Zhu, T.H. Characteristics, Impacts of Agricultural Disaster, and Mechanism of Disaster Prevention, Mitigation and Response—From the Perspective of Literature Review. J. China Agric. Univ. Soc. Sci. 2020, 37, 122–129. (In Chinese) [Google Scholar] [CrossRef]
  6. Wen, L.; Miao, X.Y.; Wang, T.; Wang, J.Q.; Yang, J.H.; Liu, R.H.; Ma, M. A Novel Multi-Scenario Mitigation Model for Rainstorm Flood Disasters. Int. J. Disaster Risk Reduct. 2025, 119, 105321. [Google Scholar] [CrossRef]
  7. Salih, A.; Hassablla, A. Flash Flood Risk Assessment in the Asir Region, Southwestern Saudi Arabia, Using a Physically-Based Distributed Hydrological Model and GPM IMERG Satellite Rainfall Data. Atmosphere 2024, 15, 624. [Google Scholar] [CrossRef]
  8. Farooq, U.; Taha Bakheit Taha, A.; Tian, F.; Yuan, X.; Ajmal, M.; Ullah, I.; Ahmad, M. Flood Modelling and Risk Analysis of Cinan Feizuo Flood Protection Area, Huaihe River Basin. Atmosphere 2023, 14, 678. [Google Scholar] [CrossRef]
  9. Wang, X.J.; Xia, J.Q.; Dong, B.L. Spatiotemporal Variation of Flood Disaster Losses and Future Assessment in the Middle and Lower Region of the Yangtze River. Int. J. Disaster Risk Reduct. 2025, 116, 105122. [Google Scholar] [CrossRef]
  10. Wang, X.M.; Chen, W.X.; Yin, J.; Wang, L.Z.; Guo, H.X. Risk Assessment of Flood Disasters in the Poyang Lake Area. Int. J. Disaster Risk Reduct. 2024, 100, 104208. [Google Scholar] [CrossRef]
  11. Gao, C.; Zhang, B.Y.; Shao, S.B.; Hao, M.Q.; Zhang, Y.Q.; Xu, Y.; Kuang, Y.; Dong, L.; Wang, Z. Risk Assessment and Zoning of Flood Disaster in Wuchengxiyu Region, China. Urban Clim. 2023, 49, 101562. [Google Scholar] [CrossRef]
  12. Zheng, X.Z.; Duan, C.F.; Chen, Y.; Li, R.; Wu, Z.X. Disaster Loss Calculation Method of Urban Flood Bimodal Data Fusion Based on Remote Sensing and Text. J. Hydrol. Reg. Stud. 2023, 47, 101410. [Google Scholar] [CrossRef]
  13. Ma, S.Q.; Lyu, S.R.; Zhang, Y.D. Weighted Clustering-Based Risk Assessment on Urban Rainstorm and Flood Disaster. Urban Clim. 2021, 39, 100974. [Google Scholar] [CrossRef]
  14. Shu, X.Y.; Ye, C.L.; Xu, Z.X.; Liao, R.T.; Zhang, S.L. A Multiscale Physically-Based Approach to Urban Flood Risk Assessment Using ABM and Multi-Source Remote Sensing Data. Int. J. Disaster Risk Reduct. 2025, 119, 105332. [Google Scholar] [CrossRef]
  15. Tayyab, M.; Hussain, M.; Zhang, J.Q.; Ullah, S.; Tong, Z.J.; Rahman, Z.U.; Al-Aizari, A.R.; Al-Shaibah, B. Leveraging GIS-Based AHP, Remote Sensing, and Machine Learning for Susceptibility Assessment of Different Flood Types in Peshawar, Pakistan. J. Environ. Manag. 2024, 371, 123094. [Google Scholar] [CrossRef]
  16. Xu, Y.; Zhang, X.C.; Wang, X.G.; Zhang, Y. Flood Disaster Monitoring Based on Sentinel-1 Data: A Case Study of Sihu Basin and Huaibei Plain, China. Water Sci. Eng. 2021, 14, 87–96. [Google Scholar] [CrossRef]
  17. Lu, Y.W.; Zhai, G.F.; Zhou, S.T. An Integrated Bayesian Networks and Geographic Information System (BNs-GIS) Approach for Flood Disaster Risk Assessment: A Case Study of Yinchuan, China. Ecol. Indic. 2024, 166, 112322. [Google Scholar] [CrossRef]
  18. Guo, Q.C.; Jiao, S.; Yang, Y.C.; Yu, Y.; Pan, Y.Q. Assessment of Urban Flood Disaster Responses and Causal Analysis at Different Temporal Scales Based on Social Media Data and Machine Learning Algorithms. Int. J. Disaster Risk Reduct. 2025, 117, 105170. [Google Scholar] [CrossRef]
  19. Parodi, E.; Kahhat, R.; Vázquez-Rowe, I. Multi-Dimensional Damage Assessment (MDDA): A Case Study of El Niño Flood Disasters in Peru. Clim. Risk Manag. 2021, 33, 100329. [Google Scholar] [CrossRef]
  20. Sundaresan, A.A.; Solomon, A.A. Post-Disaster Flooded Region Segmentation Using DeepLabv3+ and Unmanned Aerial System Imagery. Nat. Hazards Res. 2024; in press. [Google Scholar] [CrossRef]
  21. Keum, H.J.; Han, K.Y.; Kim, H.I. Real-Time Flood Disaster Prediction System by Applying Machine Learning Technique. KSCE J. Civ. Eng. 2020, 24, 2835–2848. [Google Scholar] [CrossRef]
  22. Zheng, Y.; Chen, S.B.; Chen, Y.B.; Li, A.Z. Ground Object Classification Based on Sentinel-1A Radar Data and Sentinel-2A Multispectral Data. World Geol. 2021, 40, 438–444. (In Chinese) [Google Scholar]
  23. Adrah, E.; Wong, J.P.; Yin, H. Integrating GEDI, Sentinel-2, and Sentinel-1 Imagery for Tree Crops Mapping. Remote Sens. Environ. 2025, 319, 114644. [Google Scholar] [CrossRef]
  24. Cardona-Mesa, A.A.; Vásquez-Salazar, R.D.; Gómez, L.; Travieso-González, C.M.; Garavito-González, A.F.; Vásquez-Cano, E.; Díaz-Paz, J.P. Dataset of Sentinel-1 SAR and Sentinel-2 RGB-NDVI Imagery. Data Brief 2024, 57, 111160. [Google Scholar] [CrossRef]
  25. Li, H.; Bian, X.W. Vulnerability Analysis and Risk Zoning of Regional Lightning Disaster in Zhejiang Province. J. Nanjing Univ. Inf. Sci. Technol. Nat. Sci. 2014, 6, 336–341. (In Chinese) [Google Scholar] [CrossRef]
  26. Peng, C.X.; Duan, Y.H.; Feng, J.N. Analysis of Fine Structure of Precipitation in Outer Rainbands of Super Typhoon Lekima in 2019. Period. Ocean. Univ. China 2025, 55, 1–12. (In Chinese) [Google Scholar] [CrossRef]
  27. Qian, Z.L.; Shen, Z.W.; Zuo, J. Analysis of Extreme Precipitation in Zhejiang Province Caused by Typhoon “Muifa”. Mar. Forecast. 2024, 41, 104–116. (In Chinese) [Google Scholar]
  28. Shen, X.L.; Li, F. Analysis of Extreme Precipitation in Zhejiang Caused by Typhoon “In-Fa”. Mar. Forecast. 2022, 39, 37–47. (In Chinese) [Google Scholar]
  29. Mu, Y.L.; Chen, S.B.; Cao, Y.J.; Zhu, B.X.; Li, A.Z.; Cui, L.; Dai, R.; Zeng, Q.H. Tracking the Impact of Typhoons on Maize Growth and Recovery Using Sentinel-1 and Sentinel-2 Data: A Case Study of Northeast China. Agric. For. Meteorol. 2024, 359, 110266. [Google Scholar] [CrossRef]
  30. Yin, Z.X.; Wu, P.H.; Li, X.Y.; Hao, Z.; Ma, X.S.; Fan, R.R.; Liu, C.; Ling, F. Super-Resolution Water Body Mapping with a Feature Collaborative CNN Model by Fusing Sentinel-1 and Sentinel-2 Images. Int. J. Appl. Earth Obs. Geoinf. 2024, 134, 104176. [Google Scholar] [CrossRef]
  31. Pratama, B.A.S.; Danoedoro, P.; Arjasakusuma, S. Exploring Optimal Integration Schemes for Sentinel-1 SAR and Sentinel-2 Multispectral Data in Land Cover Mapping Across Different Atmospheric Conditions. Remote Sens. Appl. Soc. Environ. 2024, 34, 101185. [Google Scholar] [CrossRef]
  32. Guo, Z.H.; Cai, D.D.; Jin, Z.Y.; Xu, T.Y.; Yu, F.H. Research on Unmanned Aerial Vehicle (UAV) Rice Field Weed Sensing Image Segmentation Method Based on CNN-Transformer. Comput. Electron. Agric. 2025, 229, 109719. [Google Scholar] [CrossRef]
  33. Padhi, J.; Mishra, K.; Ratha, A.K.; Behera, S.K.; Sethy, P.K.; Nanthaamornphong, A. Enhancing Paddy Leaf Disease Diagnosis—A Hybrid CNN Model Using Simulated Thermal Imaging. Smart Agric. Technol. 2025, 10, 100814. [Google Scholar] [CrossRef]
  34. Paymode, A.S.; Malode, V.B. Transfer Learning for Multi-Crop Leaf Disease Image Classification Using Convolutional Neural Network VGG. Artif. Intell. Agric. 2022, 6, 23–33. [Google Scholar] [CrossRef]
  35. Wang, C.Y.; Zhao, J.L.; Ji, X.F.; Li, J.H.; Wang, C.Y. Tobacco Cabinet State Recognition Model Based on Improved VGG Network. Comput. Eng. Des. 2023, 44, 1796–1803. (In Chinese) [Google Scholar] [CrossRef]
  36. Li, S.A.; Xie, Q.; Ma, Y.C.; Liu, Y.J. An Image Semantic Segmentation Method Based on Path Aggregation Atrous Convolutional Network. Comput. Eng. Sci. 2021, 43, 712–720. (In Chinese) [Google Scholar]
Figure 1. Location and topographic distribution of the study area.
Atmosphere 16 00420 g001
Figure 2. Detailed township division map of Shengzhou City.
Atmosphere 16 00420 g002
Figure 3. Technical framework diagram.
Atmosphere 16 00420 g003
Figure 4. Accuracy and loss curves of model training.
Atmosphere 16 00420 g004
Figure 5. Distribution of farmland grids in various townships of Shengzhou City (Sentinel-2).
Atmosphere 16 00420 g005
Figure 6. Distribution of farmland grids in various townships of Shengzhou City (Sentinel-1).
Atmosphere 16 00420 g006
Figure 7. Hourly rainfall data for three rainfall events in Shengzhou City.
Atmosphere 16 00420 g007
Figure 8. Refined distribution of disaster-affected and non-affected farmland grids in Shengzhou City.
Atmosphere 16 00420 g008
Figure 9. Actual and reverse-deduced farmland affected area for each township in Shengzhou City across three flood disasters.
Atmosphere 16 00420 g009
Table 1. Number of farmland grids identified as disaster-affected and their proportion relative to the total farmland grids within the administrative region of each township in Shengzhou City.
Township13 June 202126 July 202115 August 2021Summary of the Three Flood Disasters
QuantityProportionQuantityProportionQuantityProportionQuantityProportion
Sanjie1446.70%124657.98%00129260.12%
Jinting0098969.65%0098969.59%
Guimen0033759.33%37766.37%48284.86%
Shihuang40936.95%948.49%0047242.64%
Changle30012.67%10.04%582.45%35414.95%
Huangze0033020.85%0033020.85%
Xiawang0010334.11%0010334.11%
Chongren180.70%411.60%361.41%933.64%
Lushan00151.24%695.71%846.95%
Ganlin00371.52%471.93%833.40%
Xianyan00588.24%202.84%7410.51%
Pukou00352.02%40.23%382.19%
Shanhu00222.20%90.90%292.91%
Gulai10.15%000010.15%
Sanjiang00000000
Disclaimer/Publisher’s Note: The statements, opinions and data contained in all publications are solely those of the individual author(s) and contributor(s) and not of MDPI and/or the editor(s). MDPI and/or the editor(s) disclaim responsibility for any injury to people or property resulting from any ideas, methods, instructions or products referred to in the content.

