Article

Modelling of Nanoparticle Number Emissions from Road Transport—An Urban Scale Emission Inventory

1
National Center for Meteorology, Jeddah 21431, Saudi Arabia
2
Institute for Transport Studies, Faculty of Environment, University of Leeds, Leeds LS2 9JT, UK
3
Environmental Advisory, Transport Strategy, Leeds City Council, Leeds LS1 1UR, UK
*
Author to whom correspondence should be addressed.
Atmosphere 2025, 16(4), 417; https://doi.org/10.3390/atmos16040417
Submission received: 25 February 2025 / Revised: 24 March 2025 / Accepted: 31 March 2025 / Published: 3 April 2025
(This article belongs to the Special Issue Modeling and Monitoring of Air Quality: From Data to Predictions)

Abstract

:
Atmospheric nanoparticles, due to their tiny size up to 100 nanometres in diameter, have negligible mass and are better characterised by their particle number concentration. Atmospheric nanoparticle numbers are not regulated due to insufficient data availability, which emphasises the importance of this research. In this paper, nanoparticle number emissions are estimated using nanoparticle number emission factors (NPNEF) and road traffic characteristics. Traffic flow and fleet composition were estimated using the Leeds Transport Model, which showed that the road traffic in Leeds consisted of 41% petrol cars, 43% diesel cars, 9% LGV, 2% HGV, and 4.5% buses and coaches. Two approaches were used for emission estimation: (a) a detailed model, which required detailed information on traffic flow and fleet composition and NPNEFs of various vehicle types; and (b) a simple model, which used total traffic flow and a single NPNEF of mixed fleet. The estimations of both models demonstrated a strong correlation with each other using the values of R, RMSE, FAC2, and MB, which were 1, 2.77 × 10¹⁷, 0.95, and −1.92 × 10¹⁷, respectively. Eastern and southern parts of the city experienced higher levels of emissions. Future work will include fine-tuning the road traffic emission inventory and quantifying other emission sources.

1. Introduction

Atmospheric nanoparticles (NPs), also known as ultrafine particles (UFPs), are tiny particles up to 100 nm in diameter (<100 nm). Due to smaller size, their mass is negligible, and therefore, NPs are characterised by their number concentrations or number counts, measured in units of particles per cubic centimetre (p/cm3). Nanoparticle number emissions are expressed as the nanoparticle number emitted per km (p/km) or per second (p/sec) or per unit fuel consumed (p/litre). It is important to mention that atmospheric NPs are more dangerous to human health than the fine and course particles due to several reasons [1,2,3]: (a) NPs are suspended in the atmosphere for longer time and can travel larger distance. (b) NPs are smaller in size and, therefore, can enter the circulatory and lymphatic system and can pass through the blood–brain barriers. (c) NPs act as a precursor to coarser particles through their aggregation during the atmospheric ageing process, and (d) NPs have higher surface area, which is more related to the health effects than the particle mass. The human body’s inflammatory response to particles has a strong correlation with particle surface area, rather than with particle mass [4,5]. The large surface area of NPs is linked with the high concentrations of reactive chemicals at deposition sites, causing oxidative stress to body cells [6]. Additionally, an increased surface area could also act as a carrier for other pollutants, which could negatively affect cells [7]. Therefore, it has been suggested that a particle surface area could be an appropriate metric for the health effect of UFPs [8].
Health effects are also related to NP composition. NPs are mainly composed of organic compounds, elemental carbon, trace metal oxides, sulphate ions, and nitrate ions [9,10]. Most of the mass of NPs is typically composed of carbonaceous materials with small contributions of inorganic ions, thus confirming combustion as their dominant source [11]. The chemical composition of NPs demonstrates spatiotemporal variability due to variations in local sources and their proportional contribution. Kuhn et al. [12] reported that in Los Angeles, CA, USA, NPs were predominantly composed of organic compounds and ammonium and sulphate salts, contributing 45–55% and 35–40%, respectively. Sardar et al. [13] analysed the composition of NPs and found that the contribution of organic compounds ranged from 32 to 69%, elemental carbon from 1 to 34%, sulphate from 0 to 24%, and nitrate from 0 to 4% in Los Angeles. According to Pakkanen et al. [14], trace elements (Ca, Na, Fe, K, and Zn) in NPs were in higher proportions than heavy metals (Ni, V, Cu, and Pb) in Helsinki. Ermolin et al. [15] analysed the concentration of several toxic elements (Ni, Zn, Cd, Ag, Sn, Se, Te, Hg, Tl, Pb, and Bi) in NPs and found that their concentration was higher in volcanic ash than in any other sample. They analysed samples collected in Kamchatka, Far East Russia, and Andes and Chile. Exposure to NPs induces several end health points (diseases), including asthma, lung cancer, COPD (chronic obstructive pulmonary disease), diabetes, colon cancer, Alzheimer’s disease, Parkinson’s disease, ischemic stroke, heart arrhythmia, myocardial ischemia, coronary heart diseases, cerebral epilepsy, DNA damage, infertility, carcinogenicity, oxidative stress, and inflammation [1,2,16,17].
Road transport is a major source of particle pollution in the urban environment [18]. The NP emission contribution of road transport varied spatially and ranged from 32% in Greece to 97% in Luxemburg [19]. In some other European countries (Spain, France, Germany, the UK, Italy, and Poland), road transport contributed about 72% of the total PM emissions [19]. Road traffic contributes significantly to atmospheric nanoparticle number concentrations and, hence, alters the particle number size distribution in the urban atmosphere [20]. Road transport, in addition to particles, emits large quantities of several gaseous pollutants, e.g., CO, NOx, SO2, and VOCs. Pollutant emissions from vehicles are related to the vehicle type (such as light and heavy-duty vehicles), vehicle age, operating and maintenance conditions, exhaust treatment, type and quality of fuel, quality of tyre and brake materials, type of engine lubricants used, and driving behaviour [21]. Pollutant emissions have significantly decreased from 1990 to 2017, demonstrating a reduction of 87% in CO, 66% in SO2, 40% in NOx, 44% in PM2.5, and 35% in PM10 across Europe [22]. Nanoparticle number emissions from road transport can be divided into exhaust emissions and non-exhaust emissions. Exhaust emissions are emitted through the exhaust when the vehicle engine is running, whereas non-exhaust emissions are not emitted by the vehicle exhaust and are rather released into the air by brake wear, tyre wear, and road wear. The proportion of particle emissions from non-exhaust emissions is predicted to increase in the future due to the significant reduction in exhaust emissions, and by 2030, non-exhaust emissions will constitute about 90% of all particle emissions from road traffic in the UK [21]; however, the proportion of exhaust emissions to non-exhaust emissions varies spatially among various cities and countries. Although uncertainty remains with respect to the amount of particles emitted from non-exhaust emissions under real-world driving conditions, non-exhaust emissions are likely to increase in the future due to the growing number of electric vehicles.
Monitoring techniques, source apportionment, and emission inventory of different emission sources of fine particles (PM2.5) and coarse particles (PM10) are more mature and well defined, whereas the use of these tools for nanoparticle number is generally a continuation from PM2.5 and PM10 [23]. Such techniques consist of emission inventories [24], receptor modelling [25], and dispersion modelling [26]. Dispersion modelling is generally carried out after the emission sources are quantified using the first two techniques. The main purpose of these three approaches is related to different aspects of air quality research, such as air pollutant characteristics, sources, processes, effects, and control [27]. Various techniques have been developed and used to collect high-resolution temporal data of nanoparticle number concentrations in urban areas; however, high-resolution spatial data are still lacking due to the limited number of monitoring stations in the UK and elsewhere [28]. Here, several emission inventories are provided as references, which are developed in different countries around the world, covering a range of air pollutants [27]: (1) Multi-resolution Emission Inventory for China: Region—China; pollutants covered—SO2, NOx, CO, NMVOC, NH3, PM10, PM2.5, BC, OC, and CO2. (2) Intercontinental Chemical Transport Experiment Phase B (INTEX-B): Region—Mexico City and Asian countries; pollutants covered—O3 and precursors, aerosols and precursors, and greenhouse gases (GHGs). (3) Regional Emission Inventory in Asia (REAS): Region—Asia; pollutants covered—SO2, NOx, CO, NMVOC, PM10, PM2.5, BC, OC, NH3, and CO2. (4) Clean Air Policy Support System (CAPSS): Region—Korea; pollutants covered—CO, NOx, SOx, total suspended particle (TSP), PM10, PM2.5, VOC, NH3, and black carbon (BC). (5) Representative Concentration Pathway (RCP): Region—Global; pollutant covered—black carbon (BC), organic carbon (OC), CH4, sulfur, NOx, VOC, CO, and NH3. (6) Greenhouse Gas and Air Pollution Interactions and Synergies (GAINS): Region—Europe, China, and India; pollutant covered—SO2, NOx, PM2.5, PM10, NH3, VOC, and CO2. Furthermore, there are some examples of the nanoparticle number emission inventory, e.g., Kukkonen et al. [29], who developed an emission inventory for five major cities across Europe, namely, Helsinki (Finland), Oslo (Norway), London (UK), Rotterdam (the Netherlands), and Athens (Greece). Kuenen et al. [30] developed a regional emission inventory, which estimated emissions over the whole of Europe. In their emissions inventory, they not only included the main air pollutants (CH4, CO, NH3, NMVOC, NOx, SO2, PM10, and PM2.5) but also NPs. It is important to mention that particle concentrations in the atmosphere are affected not only by emissions sources but also by meteorology and interaction with other pollutants (e.g., ozone) [31].
Even though NPs are more dangerous to public health, atmospheric NPs are still not regulated due to insufficient data availability. Compared to PM2.5 and PM10, much fewer studies have considered NPs. This is probably due to two main reasons: (a) The data availability problem—hourly concentrations of gaseous pollutants (e.g., NO2, NO, CO, and O3) and mass concentrations of PM10 and PM2.5 are available abundantly in the UK and elsewhere; in contrast, the NP data are very limited. (b) According to the UK Air Quality Standards Regulations 2010, NO2, O3, PM10, and PM2.5 are among the regulated outdoor air pollutants, and their monitoring and routine reporting are mandatory, whereas NPs are not regulated and their monitoring is not mandatory. Due to these constraints, it has been challenging to develop dispersion models for nanoparticle number concentrations and assess the impact of various policies for reducing nanoparticle number concentrations in urban areas. The purpose of the paper is to quantify the emissions of nanoparticle numbers from road transport in Leeds and analyse their spatial variability. To achieve the purpose, two approaches have been used: a simple model and a detailed model and their performance has been compared. The main strong points, which highlight the importance of this study, are:
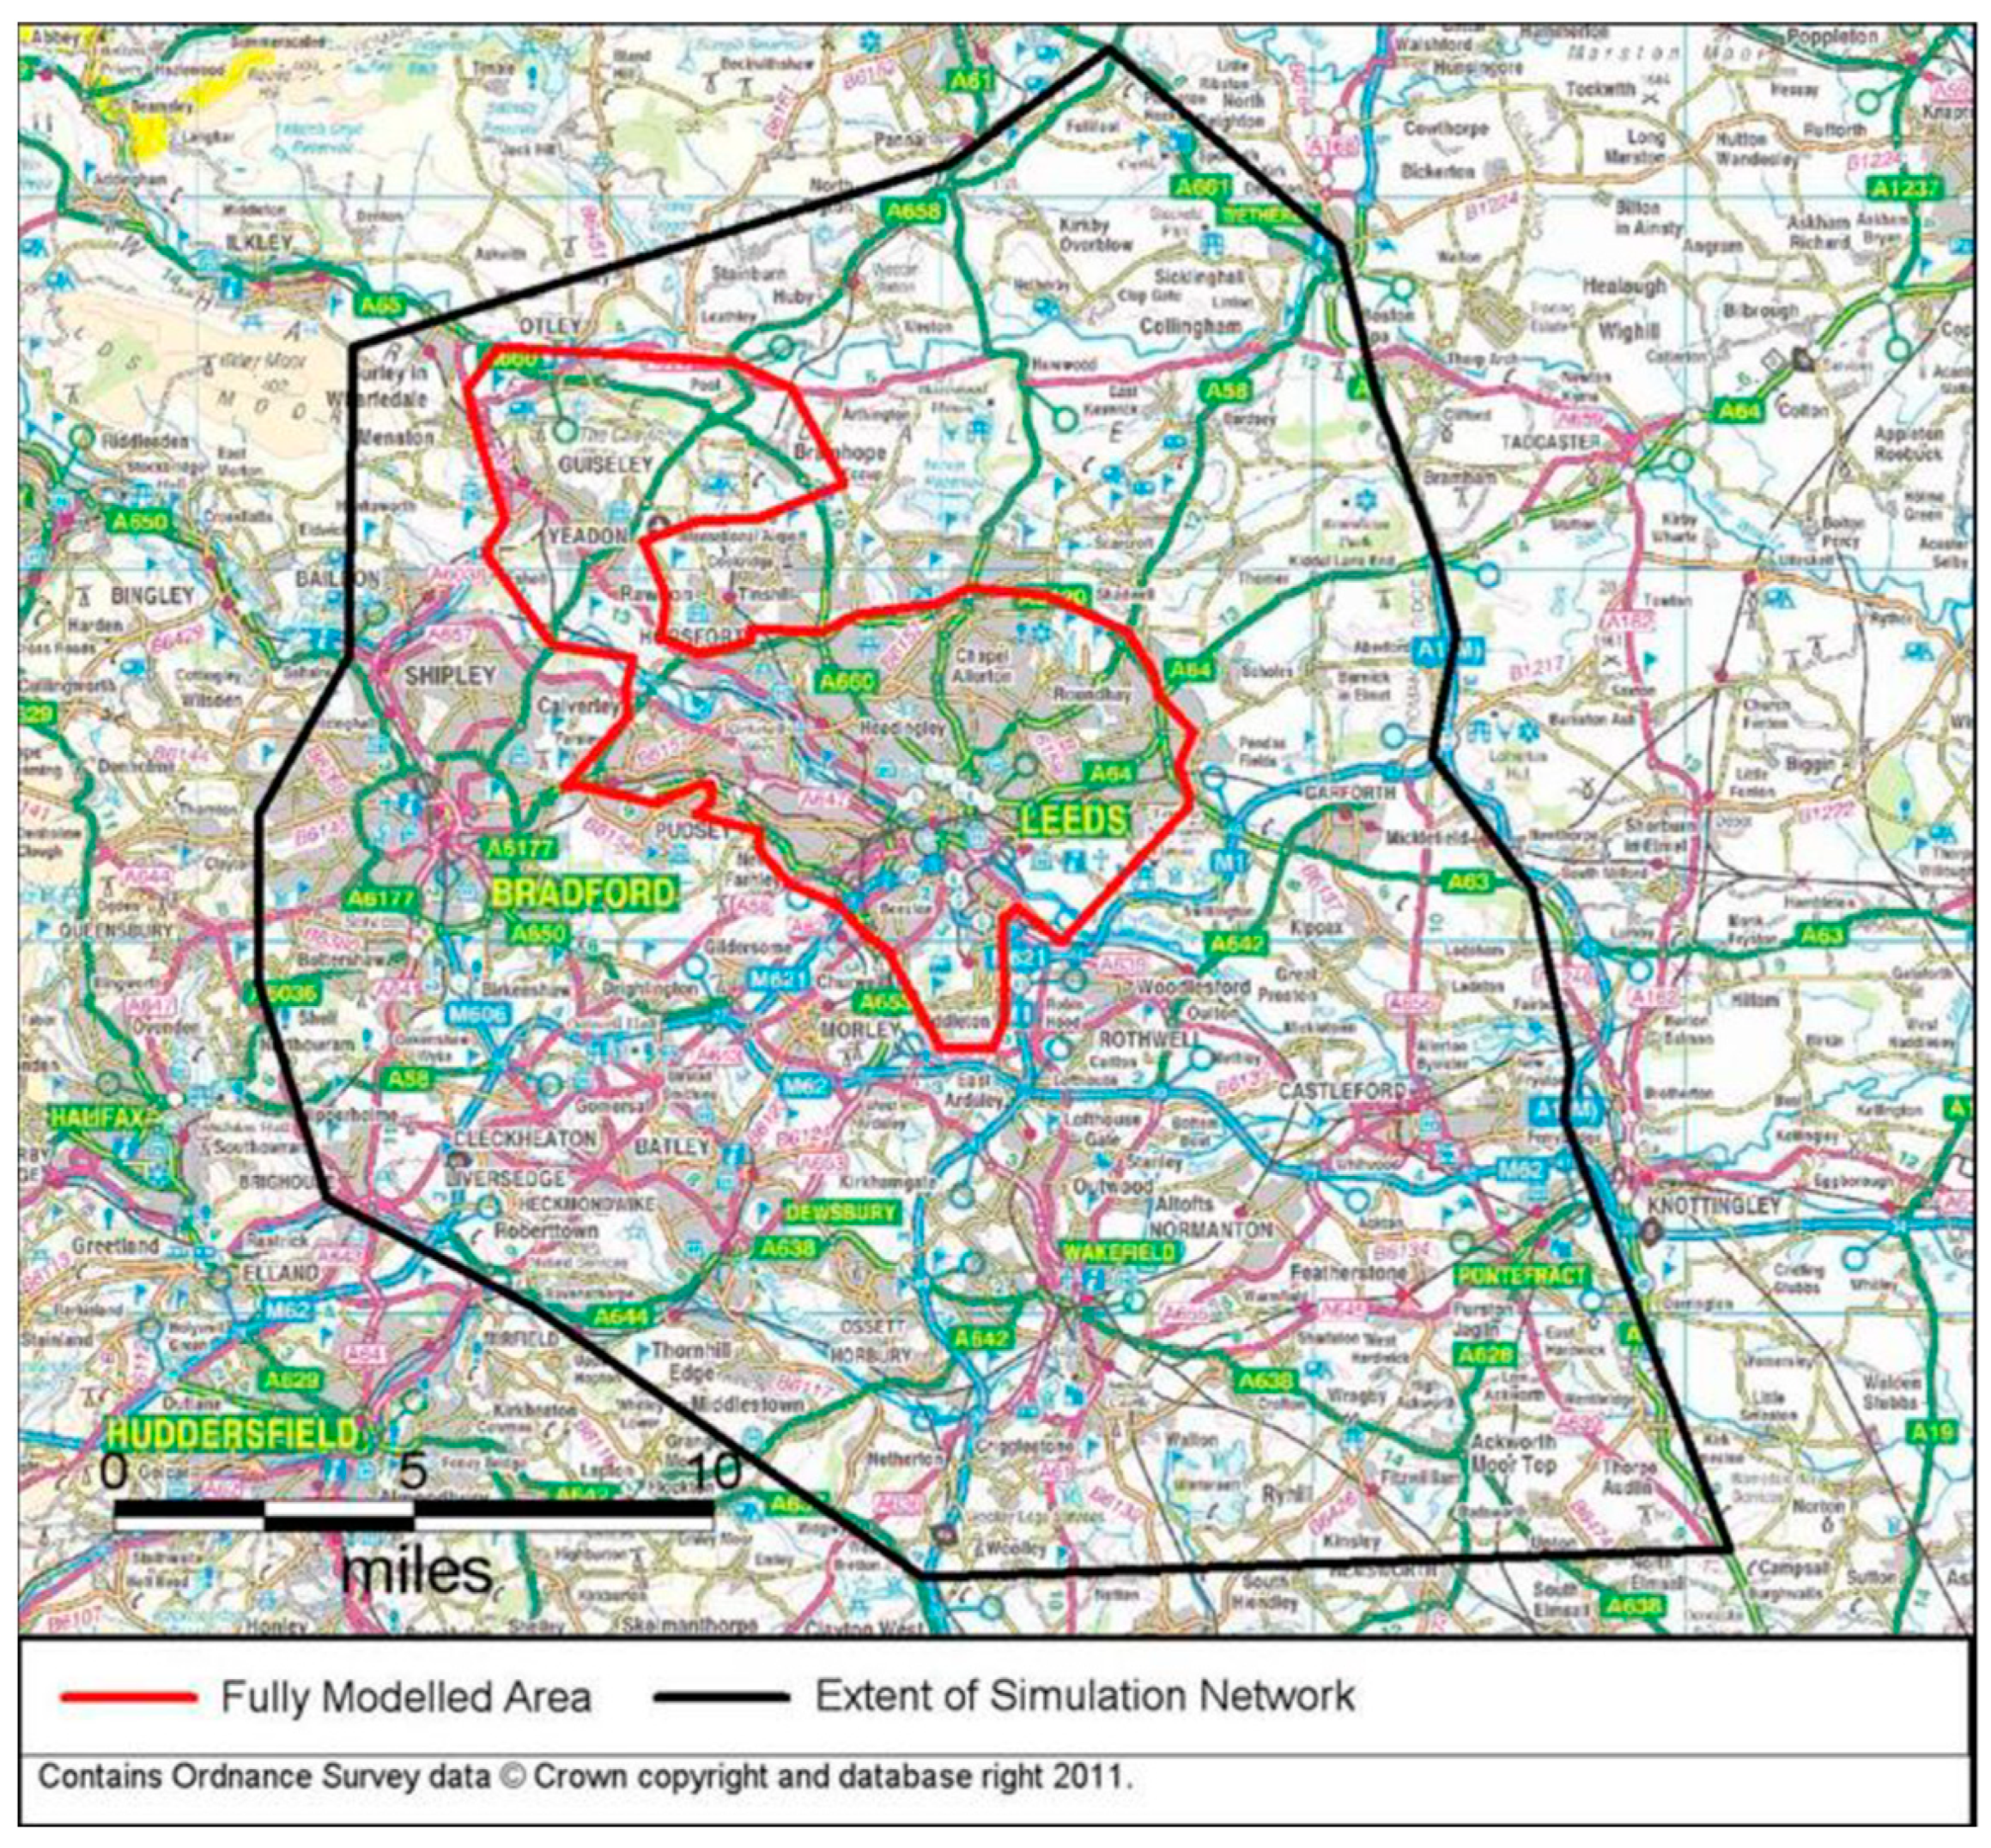
  • This study uses detailed traffic flow and composition data. Data on road traffic flow and composition were estimated for both urban roads and motorways employing Leeds Transport Model.
  • Emissions of NPs from both exhaust and non-exhaust emissions are estimated in this study. For this purpose, a detailed literature review was conducted to collect nanoparticle number emission factors (NPNEF) for exhaust emissions. NPNEF for non-exhaust emissions were calculated from mass-based EFs using previously established models.
  • Two approaches were employed for the nanoparticle number emission estimation, which were referred to as ‘a detailed model’ and ‘a simple model’ (described in Section 2).
  • Estimated emissions of the two models were compared using several statistical metrics, such as R, R2, RMSE, FAC2, and NMB.
  • The road transport emission inventory developed for the estimation of nanoparticle number emissions and emission maps produced in this paper can be used for air quality management, assessing the impact of policy interventions, and for developing a dispersion model for the estimation of nanoparticle number concentrations in urban areas. However, no previous nanoparticle number emission inventory existed and there were no nanoparticle number monitoring stations in Leeds, which was a challenge for validating the models’ outputs.

2. Materials and Methods

In this paper, nanoparticle number emissions from road transport are characterised in the City of Leeds, UK. In the Section 2, we first analysed road traffic flow and fleet composition, followed by the description of NPNEF for both exhaust and non-exhaust emissions. Finally, the methodology for nanoparticle number emission calculations on different road links in Leeds is described.

2.1. Traffic Data

Traffic data used in this study were estimated by employing a computer transport model, referred to as the Leeds Transport Model, which is described in detail in the Leeds Clean Air Zone Report 2020 [32]. In the past, the Leeds Transport Model has been used to help support business cases for major transport schemes and to assess the impact of the site allocation plan. The highway network element of the Leeds Transport Model used the Saturn modelling suite. The model covered the whole of Leeds District, together with neighbouring local authorities and national roads and rail links. Figure 1 shows the coverage of the Saturn simulation network, which extends to the Leeds District boundary or beyond. The ‘fully modelled area’ encircled by a red line in the figure relates to the area where the bulk of model calibration has been carried out, whereas the full extent of the road network is encircled by a black line.
The road traffic flow level is reported as annual average daily traffic (AADT), which is the average amount of traffic on an average day (including weekends and holidays). The daily flows were further broken down into four time periods: morning peak (a.m.) 07:00–10:00 h; interpeak (IP) 10:00–16:00 h; evening peak (p.m.) 16:00–19:00 h; and off-peak (OP) 19:00—24:00 and 00:00–07:00 h. An aggregation of several central urban automatic number plate recognition (ANPR) datasets was used to generate an average Leeds fleet composition. Road traffic in Leeds, on average, consisted of 41% petrol cars, 43% diesel cars, 9% LGV, 2% HGV (1.5% rigid and 0.5% artic), and 4.5% coaches [32]. According to the UK National Atmospheric Emissions Inventory in 2020 [33], the UK average fleet composition was different from the one observed in Leeds, as shown in Table 1, demonstrating the variability of fleet composition spatially from city to city and showing the importance of local data collection.

2.2. Nanoparticle Number Emission Factors

Emission factors relate the amount of pollutants emitted to traffic flow and composition. Emission factors are generally expressed as the amount of emitted pollutants divided by a unit activity (weight, volume, distance, or duration of the activity emitting the pollutants). NPNEF are expressed as the number of nanoparticles emitted per unit activity. For road transport, here, NPNEFs are expressed as the number of nanoparticles emitted per km travelled by a vehicle. Nanoparticle number emissions are the product of NPNEF, number of vehicles, and distance travelled, as shown in Equation (1).
NPNE = NPNEF × Ni × Di
where NPNE is nanoparticle number emission, NPNEF is nanoparticle number emission factors, Ni is the number of vehicles in each vehicle category, and Di is the distance travelled by each vehicle in each category.
Vehicle’s EFs depend on many parameters, such as vehicle characteristics, emission control technology, fuel specifications, and ambient and operating conditions (e.g., cold-start, cruising, acceleration, etc.). Vehicle-specific nanoparticle number emissions are typically measured using (a) NP measurements in the laboratory, such as chassis and engine dynamometer; (b) roadside remote-sensing; (c) vehicle chasing experiments; (d) road tunnel studies; and (e) onboard measurements with portable emission measurement systems (PEMS) [34,35]. Franco et al. [35] have provided a detailed review of various emission measurement techniques both in the laboratory and in real driving conditions.
NPNEFs for the exhaust emissions of different traffic categories, as well as for mixed fleets, were collected from the literature (provided in Section 3.1). In this paper, NPNEF for the mixed fleet was used from [36]. The following steps were taken by Wang et al. [36] to estimate NPNEF for mixed fleet road traffic under real-world conditions:
  • Measure nanoparticle number concentrations (NPNC) at roadsides using differential mobility particle sizers (DMPS). The average NPNC was 27,100 particles/cm3.
  • Measure NPNC at the background site (average NPNC at the background site was 5311 particles/cm3).
  • Subtract background NPNC (5311) from the roadside NPNC (27,100) to calculate the contribution of road traffic, referred to as ∆C.
  • Monitor traffic flow (AADT).
  • Estimate dilution rate.
  • Convert nanoparticle number concentrations to NPNEF using measured traffic volume and dilution rate [36]:
    PNEFi = [∆Ci(t) × D(t)]/N (total)
    where, in Equation (2), delta C (particles/cm3) is the concentration increment of species i, D(t) (m2/s) is the dilution rate, and N is the number of vehicles passing by per unit time. The dilution rate was estimated using the Danish Operational Street Pollution Model (WinOSPM) [36] where wind speed, wind direction, and traffic-generated turbulence were considered. However, Wang et al. [36] did not explicitly report the dilution rate values used in their calculations. Instead, their focus was on deriving emission factors for NOx, particle number, and particle mass based on modelled dilution.
NPNEFs for non-exhaust emissions were calculated from mass-based EFs of NPs. The following equation was used to calculate NPNEF (particles/km) from mass-based EF in units of (g/km) for non-exhaust emissions [37]:
Nij = mij/ρivi
where, in Equation (3), N is NPNEF for non-exhaust emissions, m is EF in terms of mass (generally expressed as PM0.1) for non-exhaust emissions of NP, and rho (ρ) is the density of non-exhaust emissions of NP with a value of 0.0016 kg/cm3 for tyre wear and road wear and 0.001 kg/cm3 for brake wear [38,39,40,41,42,43]. V is the volume of a single NP assuming that each particle is spherical. The volume was calculated using the formula 4/3 πr3 where r is the average radius of the particle and was assumed to be 0.025 µm for NPs. Mass-based EF for NPs was collected from the national atmospheric emission inventory (NAEI), UK [44], given in Table 2. NPNEFs for exhaust emissions were added to non-exhaust emissions to estimate the final NPNEF for different vehicle categories and mixed fleets, which are provided in Section 3.1.

2.3. Nanoparticle Number Emission Estimation and Mapping

In this paper, nanoparticle number emissions were estimated using two approaches: (1) detailed model, which used the flow of various traffic categories and NPNEFs for each category of vehicle types, e.g., cars, buses, LDVs, and HDVs; (2) simple model, which used combined traffic flow of all vehicle categories and NPNEF for the mixed fleet. The simple model is particularly useful for situations when detailed traffic flow, fleet composition, and EF for each vehicle type are not available. In the detailed model, the total nanoparticle number emissions per link were calculated by multiplying the traffic flow of each category type by their NPNEF and distance and then summing them up (Equation (4)).
[ NPNE ] ij = i = 1 i = n ( X i j × N P N E F i j × D i )
where NPNE is the number of nanoparticles emitted by a traffic category i on road link j with distance D. Xij s the road traffic flow of traffic category i on road link j, and NPNEFij is the emission factor for transport category i on road j (urban or motorway). Note that the model is run separately for each link. To present the above formula in a simple way for a single link, it would look like (Equation (5)):
[NPNE] = {((Petrol_Car × NPNEF) + (Diesel_Car × NPNEF) + (HGV × NPNEF) + (LGV × NPNEF) + (Bus × NPNEF)) × D}
In the simple model, nanoparticle number emissions (NPNE) per link were calculated by multiplying the total traffic flow (the sum of all traffic categories for each link) by the NPNEF of the mixed fleet for both motorways (1.78 × 10¹⁴) and urban roads (2.15 × 10¹⁴) [36], as in Equation (6).
NPNE = Traffic_flow × EF_mixed_fleet × D
After the nanoparticle number emission calculation using the above equations, emission maps were developed by importing the emissions to a Geographical Information System. Emissions of both methods were compared to quantify the difference.
Although there was a strong correlation between the outputs of the two models, the simple model underestimated the nanoparticle number emissions compared to the detailed model. The outputs of the two models are compared using several statistical metrics: correlation coefficient (r), coefficient of determination (R2), root-mean-squared error (RMSE), factor of tow (FAC2), and normalised mean bias (NMB). RMSE is a good measure of the error between two datasets, which calculates how close or far the compared values are from each other. NMB estimates the average over or underprediction of the simple model, compared to the detailed model. NMB value between +0.02 and −0.02 shows acceptable performance of the simple model. The correlation coefficient (r) shows the strength of the linear relationship between the two variables (here, the estimation of the simple and detailed models). ‘r’ should have a value as close to one (±1) as possible; however, generally, a value ranging from ±0.5 to ±0.99 indicates reasonably good performance of the simple model. R-squared is simply the squared value of the correlation coefficient and its value ranges from 0 to 1. FAC2 is the fraction of the simple model estimation within a factor of 2 of the detailed model [45]. In addition to these metrics, previously, several other metrics have been used for model evaluation, including the mean absolute error (MAE) and mean absolute percentage error (MAPE) (e.g., [31,46]).

3. Results and Discussion

Section 3 is made of two subsections: Section 3.1 describes and compares the results of the simple and detailed models. In this section, the NPNEFs for different vehicle categories are also presented and briefly discussed; however, a detailed discussion of the NPNEF is provided in Section 3.2. Section 3.2 reviews the relevant literature on NPNEFs, which provides further insights into understanding this work and other relevant work carried out previously.

3.1. Calculation and Mapping of Nanoparticle Number Emissions

In this paper, NPNEFs are used for both exhaust and non-exhaust emissions of road traffic. NPNEFs for exhaust emissions were collected from already published literature (references are provided in Table 3), whereas for non-exhaust emissions, NPNEFs were calculated from mass-based NPEFs [44]). The final NPNEFs (particles/km/vehicle), which are the sum of the exhaust and non-exhaust EFs for different traffic categories for both urban roads and motorways, provided in Table 3, were used to calculate nanoparticle number emissions for each road link. Table 3 presents NPNEFs for both urban roads and motorways. It is interesting to see that NPNEFs are higher for urban roads than for motorways. Generally, urban roads experience higher congestion and face more stop-and-start traffic situations due to more traffic lights and junctions, whereas traffic flow on motorways is generally smoother, experiencing comparatively less congestion. It is reported that particle emissions were higher on urban roads than on rural roads and motorways, a result of frequent braking in urban areas, which increased the amount of brake wear emissions [47,48,49]. Probably due to these reasons, EFs are higher for urban roads. Furthermore, NPNEFs are higher for diesel vehicles than for petrol vehicles, which is expected. According to the Office of National Statistics [50], although vehicle miles have increased on the roads by 29%, the total fuel use for road transport has remained relatively stable between 1990 and 2017 in the UK because of the improvement in the fuel use efficiency of new vehicles. Furthermore, petrol use in the UK has decreased by 52% from 27 Mtoe (million tonnes of oil equivalent) in 1990 to 13 Mtoe in 2017, whereas the use of diesel has increased by 145% from 11 Mtoe in 1990 to 27 Mtoe in 2017 [50]. The temporal trend showed that petrol use was higher than diesel use; however, in 2005, diesel use exceeded petrol use [50]. The switch between petrol and diesel use has made atmospheric particles the pollutants of concern in urban areas.
According to the outputs of the LTM, diesel cars were 43% of the total flow in Leeds, whereas petrol cars were 41%, LGVs were 9%, HGVs were 2%, and buses and coaches were 4.5%. Nanoparticle number emissions were calculated for each road linked in Leeds and mapped using ArcGIS 10.6. Emissions were calculated for annual average daily traffic (AADT), which was the total volume of vehicle traffic on a road for a year divided by 365 days. Figure 2 shows nanoparticle number emissions (particle numbers per km per AADT) in Leeds for road transport calculated from different traffic categories using the detailed model. Diesel cars not only had relatively higher NPNEFs but also had the highest percentage of traffic flow in Leeds, which resulted in the highest amount of nanoparticle number emissions. The highest number of NPs per AADT was emitted by diesel vehicles (2.26 × 10²¹ particles), whereas the lowest was emitted by petrol LGVs (1.99 × 10¹⁹ particles). The total number of particles for the various vehicle categories and both simple and detailed models are provided in Table 4. These values are the sum of nanoparticles emitted on all links in Leeds. Among the vehicle categories, diesel emitted the highest number of nanoparticles, followed by HGVs and petrol cars.
Figure 3 shows the outcome of the simple model, which used NPNEF of the mixed fleet (2.15 × 10¹⁴ for urban roads and 1.78 × 10¹⁴ for motorways) (Table 3) and AADT on each road link. Both models presented a similar pattern of nanoparticle number emissions in Leeds. The highest concentrations shown by the red colour are in the southern and eastern parts of the city, which are linked to the motorway traffic, such as M1, M62 and M621, and other busy roads. The detailed model shows slightly higher levels of nanoparticle number emissions (maximum 4.73 × 10¹⁸ particles/link/AADT) than the simple model (maximum 3.51 × 10¹⁸ particles/link/AADT). The sum of nanoparticles emitted for all links was also higher for the detailed model than for the simple model (Table 4). The outputs of the simple and detailed models are compared in Figure 4, which presents a similar pattern in the outputs of both models. However, the resultant nanoparticle number emissions are higher for the detailed model than for the simple model. In addition to the line plot, a scatter plot was produced for the simple model vs. the detailed model. The scatter plot shows that the line is not 45 degrees. All the points fall below the line of 45 degrees, which shows that the number of particles is less for the simple model. However, all points make a straight line indicating a strong correlation between the two models. For further analysis, several statistical metrics were calculated to quantify the association between the simple and the detailed model: (i) FAC2 (Factor of 2) is a measure of how well the simple model outputs compare to the detailed model outputs. A value closer to 1 is ideal, as it indicates that the outputs of both models are close to each other within a factor of 2. A value of 0.95 suggests that, on average, the simple model outputs are within about 95% of the detailed model outputs. (ii) MB (mean bias) measures the average difference between the two model outputs. A negative value indicates that the simple model is underpredicting on average. Here, −1.92 × 10¹⁷ suggests a slight negative bias in the simple model’s predictions, meaning the simple model tends to slightly underestimate the emissions in comparison to the detailed model. (iii) MAE (mean absolute error) is the average of the absolute differences between the simple and detailed model estimations. It provides a measure of the magnitude of errors without considering their direction (ove- or under prediction). A value of 1.92 × 10¹⁷ suggests that, on average, the errors (whether positive or negative) are about 1.92 × 10¹⁷ in magnitude. (iv) RMSE (root-mean-square error) is one of the most commonly used measures of the difference between the two datasets. It provides a sense of how much error exists in the simple model predictions compared to the detailed model prediction. A value of 2.77 × 10¹⁷ is relatively low, suggesting that the two models’ predictions are fairly close to each other. (v) r is the correlation coefficient between the simple and detailed model estimations. A value of 0.998 indicates a very strong positive correlation between the two models’ estimation, indicating that they are closely related and move in the same direction. A p-value of 0 indicates very strong evidence that the correlation between the two models’ outputs is significant.

3.2. Discussion on Nanoparticle Number Emissions

This was the first research project of its kind in Leeds, which described road transport-related emission sources and NPNEFs; therefore, due to the lack of previous data, it was not possible to make a comparison with previous studies. Previously, several studies had been carried out in other cities, which analysed nanoparticle emissions from different sources, including road traffic [29,56]. Kukkonen et al. [29] modelled particle number concentrations in five major cities across Europe, namely, Helsinki (Finland), Oslo (Norway), London (UK), Rotterdam (Netherlands), and Athens (Greece). They compiled emission inventories and ran dispersion models for the five cities. They found that the concentrations of particle numbers in the selected cities were dominated by the emissions originating from local vehicular traffic. They reported that megacities such as London and Athens experienced higher particle number concentrations than Helsinki and Oslo. In the current study, we estimated the amount of nanoparticle number emissions in Leeds using previously established NPNEF for road transport and found that nanoparticle number emissions were dominated by diesel vehicles. The findings of the current study were in agreement with Harrison et al. [56] who reported that diesel engine emissions were by far the largest source of NPs and presented a threat to public health in urban areas.
Recently, Kuenen et al. [30] developed a regional emission inventory, which estimated emissions over the whole of Europe. In their emissions inventory, they included not only the main air pollutants (CH4, CO, NH3, NMVOC, NOx, SO2, PM10, and PM2.5), but also NPs. The results were, however, not comparable to the current study due to the different nature of the two studies. Kuenen et al. [30] developed a regional emission inventory, whereas the current study quantified nanoparticle number emissions only for an urban area. Vouitsis et al. [55] carried out a detailed review of NPNEF for road vehicles and came up with gap-filling methods for those vehicles or fuel types for which EFs were not available. Vouitsis et al. [55] presented exhaust particulate emission factors for light and heavy-duty vehicles for different driving conditions (urban, rural and highway). The authors of [55] estimated EF for both the total particle number (TPN) and solid particle number (SPN). The TPN included both solid and semi-volatile particles. Semi-volatile particles may be removed by gradual oxidation to lighter species and/or evaporation [57]. TPN emissions may be several times higher than SPN, especially at high vehicle load operation because of the sulphur-driven nucleation. The NPNEFs proposed by Vouitsis et al. [55] after the gap-filling estimation are provided in Table 5. Given the limited number of measurements of Euro 6 cars as well as the identical emission limits with Euro 5 cars and the compliance of the latter with limits, the final Euro 6 EFs proposed were assumed equal to the Euro 5 ones. For details on the gap-filling methodology and the original source of the NPNEF, readers are referred to Vouitsis et al. [55] and the references therein. Vouitsis et al. [55] only estimated EF for nanoparticles but did not quantify emissions for a given area (e.g., a city or a country); therefore, although their results are useful for this study, they were not comparable directly.
Giechaskiel et al. [34] analysed SPN emission factors both on the chassis dynamometer in the laboratory and on the road using PEMS. According to their analysis, cold-start and strong accelerations substantially increased SPN emissions. Two heavy-duty vehicles were tested for their emissions. Among them Euro V truck on the road showed emissions of around 2 × 10¹³ p/km and the Euro VI truck showed emissions of around 6 × 10¹⁰ p/km. The light-duty vehicles equipped with the diesel particle filter showed emissions of 8 × 10¹¹ p/km. The port-fuelled injection (PFI) car had SPN emissions a little higher than 1 × 10¹² p/km. The on-road gasoline direct injection (GDI) emissions for cars ranged from 8 × 10¹¹ to 8 × 10¹² p/km (Table 6). This shows how exhaust emissions change with vehicle engine size and type. Newer engines (e.g., Euro VI) have significantly fewer emissions compared to older engines. Therefore, replacing older vehicles or retrofitting them can cause a reduction in particle emissions. Huang et al. [51] carried out on-road emission measurements of both gasoline- and diesel-fuelled vehicles using a PEMS in Shanghai, China. The driving-based EFs of gaseous pollutants and particle mass and number were obtained on various road types. The particle number emission factors for diesel buses, diesel cars, and gasoline cars were 7.06 × 10¹⁴, 6.08 × 10¹⁴, and 1.57 × 10¹⁴ p/km, respectively. The size distribution of the particles emitted from the diesel vehicles were mainly concentrated in the accumulation mode, while those emitted from the gasoline car were mainly distributed in the nucleation mode. Huang et al. [51] reported that the particle number emission rates of petrol cars increased with increasing VSP (vehicle-specific power) and speed. From idling to the highest speed and VSP of a petrol car, the particle number emission increased by 3 orders of magnitude. They concluded that aggressive driving and heavy loads were the main reasons for high emissions. Therefore, it is important to note that driving behaviour and road types can affect particle emissions from both exhaust and non-exhaust sources, which are not accounted for in this study. Table 6 provides a summary of the NPNEFs for various vehicle categories. In addition, Jones and Harrison [58], Kumar et al. [59], and Gidhagen et al. [60] have provided a useful collection of EFs for particle numbers. Wang et al. [61] provided NPNEF in different units, including particles/mile, particles/kg, and particles/bhp-hr (brake horsepower-hour). Lahde and Giechaskiel [62] analysed how solid NPN emissions of size > 4 nm, >10 nm, and >23 nm from bi-fuel vehicles (CNG + Gasoline or LPG + gasoline) and mono-fuel vehicles (CNG) varied with ambient temperature in laboratory at 23 °C and sub-zero temperature (−7 °C). In this study, emissions from CNG and LPG vehicles were not considered, assuming their numbers were not significant in Leeds. Furthermore, how emissions vary with ambient temperature was not accounted for, which, probably, introduces a degree of uncertainty in the outcomes of the models.
There are three main types of potential uncertainties in this study: (a) uncertainties in the estimation of traffic flow and fleet composition using the Leeds Transport Model (LTM), (b) uncertainties in the emission factors of nanoparticles, and (c) other uncertainties. The uncertainty of nanoparticle emission factors is considered a major part of the overall uncertainties in all transport emission models. These uncertainties originate from the variability of the underlying sample data, i.e., the variability in the emission level of each individual vehicle that has been included in the sample of vehicles used to derive the emission factors. The sample vehicle may not be a true representative of the population and may introduce a degree of uncertainty. In addition, the nanoparticle EFs used in this study were not calculated in Leeds, they were calculated in different urban areas of the UK, EU, or other countries around the world. Also, these EFs were calculated during different environmental conditions and different seasons of the year, which might have introduced a degree of uncertainty. The transport model used for traffic flow estimation, such as LTM, has its own built-in uncertainties, which are based on the assumptions and correction factors of the model. Furthermore, such models use different types of external data (such as population, jobs, and land use) to predict the number of trips. These parameters have their inherited uncertainties, which would add to the uncertainties of the model. Furthermore, various intervention policies on road networks, vehicle speed, and those related to clean air and net zero may affect traffic flow and, hence, may introduce a degree of uncertainty in the model. In this study, we adopted a simple traffic classification framework and did not consider alternative fuel-type vehicles, including electric, CNG, and LPG vehicles, assuming their number at present was not significant, which is a potential weakness of the study. Such simplification of the vehicle categories might have a considerable effect on the amount of nanoparticle emissions estimated in this study. Therefore, the results reported here need to be viewed considering these uncertainties.

4. Conclusions

Atmospheric NPs, though more dangerous to public health, are relatively less studied pollutants compared to PM2.5 and PM10. The reason is that PM10 and PM2.5 along with some gaseous pollutants are regulated and local authorities are required by the law to monitor and model their concentrations. In contrast, NPs are not regulated and are not monitored and modelled by the local authorities. More recently, researchers have started focusing on atmospheric NPs by measuring their levels, developing emission inventories in different EU cities, and investigating their health impacts. In this paper, the main aim was to compile a nanoparticle number emission inventory for road transport in Leeds, UK, using a methodology, which would be transferrable to other urban areas. A literature review was conducted to collect previously published NPNEFs for various traffic categories. Gaps filling was carried out for those emission sources for which NPNEF did not exist, especially for non-exhaust emission sources. Existing NPNEFs varied among different studies due to spatial and temporal variability and variations in the characteristics of the emission sources and measuring techniques. Traffic flow and fleet composition were estimated using the Leeds Transport Model. The amount of nanoparticle number emissions on each road link was calculated using traffic flow and NPNEF. Diesel and petrol vehicles were the dominant sources of nanoparticle numbers in Leeds. Spatially, the eastern and southern parts of the city, which experienced high traffic volumes and were linked with M1, M62, and M621 motorways, showed higher levels of nanoparticle number emissions. It was not possible to validate the results as previous data did not exist for comparison in Leeds. Two models were developed, referred to as the ‘detail model’ and the ‘simple model’. The former used detailed traffic composition and EF data, whereas the latter used total traffic flow and a single EF for the mixed traffic flow. The simple model slightly underestimated nanoparticle number emissions compared to the detailed model. However, the emissions from both models demonstrated a strong correlation with each other, demonstrated by the values of various statistical metrics, i.e., R, R-squared, RMSE, FAC2, and NMB. The simple model provides a simple and easy-to-run alternative for circumstances where detailed data are not available. This paper highlights the importance of atmospheric NPs and presents a framework for nanoparticle number emission modelling. Future work will include developing a detailed dispersion model for modelling NP concentrations in urban areas; however, dispersion models could be data-hungry and time-consuming; therefore, an alternative approach will be explored for such analysis based on machine learning approaches. The road traffic emission inventory will be further fine-tuned and other emission sources included in the future.

Author Contributions

This article has been written by several authors, each contributing in different ways. Conceptualization, S.M. and H.C.; methodology, S.M.; software, S.M. and R.C.; validation, S.M. and H.C.; formal analysis, S.M.; investigation, S.M.; resources, S.M. and R.C.; data curation, S.M.; writing—original draft preparation, S.M.; writing—review and editing, S.M., H.C. and R.C.; visualization, S.M.; supervision, H.C.; project administration, S.M. and H.C.; funding acquisition, H.C. All authors have read and agreed to the published version of the manuscript.

Funding

This research was jointly funded by the EU-funded projects nPETS (No. 954377) and MODALES (No. 815189).

Institutional Review Board Statement

Not applicable.

Informed Consent Statement

Not applicable.

Data Availability Statement

Traffic data are available in ref. [21]: Leeds Clean Air Zone (LCAZ), Modelling Report 2020, Leeds City Council, 2020. Available online: https://datamillnorth.org/dataset/leeds-clean-air-zone---compliance-modelling-2021 (accessed on 2 March 2025).

Acknowledgments

Thanks to Leeds City Council for providing Traffic Model Data. Opinions expressed and arguments employed herein do not necessarily reflect the official views of the European Commission, Leeds City Council and other funding bodies.

Conflicts of Interest

The authors declare no conflicts of interest.

References

  1. Buzea, C.; Pacheco, I.I.; Robbie, K. Nanomaterials and nanoparticles: Sources and toxicity. Biointerphases 2007, 2, MR17–MR71. [Google Scholar] [CrossRef] [PubMed]
  2. Sonwani, S.; Madaan, S.; Arora, J.; Suryanarayan, S.; Rangra, D.; Mongia, N.; Vats, T.; Saxena, P. Inhalation Exposure to Atmospheric Nanoparticles and Its Associated Impacts on Human Health: A Review. Front. Sustain. Cities 2021, 3, 690444. [Google Scholar] [CrossRef]
  3. Vouitsis, I.; Portugal, J.; Kontses, A.; Karlsson, H.L.; Faria, M.; Elihn, K.; Juárez-Facio, A.T.; Amato, F.; Piña, B.; Samaras, Z. Transport-related airborne nanoparticles: Sources, different aerosol modes, and their toxicity. Atmos. Environ. 2023, 301, 119698. [Google Scholar] [CrossRef]
  4. Oberdorster, G.; Sharp, Z.; Atudorei, V.; Elder, A.; Gelein, R.; Kreyling, W. Translocation of inhaled ultrafine particles to the brain. Inhal. Toxicol. 2004, 16, 437–445. [Google Scholar] [CrossRef]
  5. Sager, T.; Castranova, V. Surface area of particle administered versus mass in determining the pulmonary toxicity of ultrafine and fine carbon black: Comparison to ultrafine titanium dioxide. Part. Fibre Toxicol. 2009, 6, 15. [Google Scholar] [CrossRef]
  6. Donaldson, K.; Li, X.Y.; MacNee, W. Ultrafine (nanometre) particle mediated lung injury. J. Aerosol Sci. 1998, 29, 553–560. [Google Scholar] [CrossRef]
  7. Okuda, T. Measurement of the specific surface area and particle size distribution of atmospheric aerosol reference materials. Atmos. Environ. 2013, 75, 1–5. [Google Scholar] [CrossRef]
  8. Giechaskiel, B.; Alföldy, B.; Drossinos, Y. A metric for health effects studies of diesel exhaust particles. J. Aersol Sci. 2009, 40, 639–651. [Google Scholar]
  9. Lu, S.; Hao, X.; Liu, D.; Wang, Q.Q.; Zhang, W.; Liu, P.; Zhang, R.; Yu, S.; Pan, R.; Wu, M.; et al. Mineralogical characterization of ambient fine/ultrafine particles emitted from Xuanwei C1 coal combustion. Atmos. Res. 2016, 169, 17–23. [Google Scholar] [CrossRef]
  10. Lu, S.; Zhang, R.; Yao, Z.; Yi, F.; Ren, J.; Wu, M.; Feng, M.; Wang, Q. Size distribution of chemical elements and their source apportionment in ambient coarse, fine, and ultrafine particles in Shanghai urban summer atmosphere. J. Environ. Sci. 2012, 24, 882–890. [Google Scholar] [CrossRef]
  11. Health Effects Institute. Understanding the Health Effects of Ambient Ultrafine Particles; HEI Perspectives 3; Health Effects Institute: Boston, MA, USA, 2013; Available online: https://www.healtheffects.org/publication/understanding-health-effects-ambient-ultrafine-particles (accessed on 11 August 2023).
  12. Kuhn, T.; Biswas, S.; Sioutas, C. Diurnal and seasonal characteristics of particle volatility and chemical composition in the vicinity of a light-duty vehicle freeway. Atmos. Environ. 2005, 39, 7154–7166. [Google Scholar]
  13. Sardar, S.B.; Fine, P.M.; Mayo, P.R.; and Sioutas, C. Size-fractionated measurements of ambient ultrafine particle chemical composition in Los Angeles using the NanoMOUDI. Environ. Sci. Technol. 2005, 39, 932–944. [Google Scholar] [CrossRef] [PubMed]
  14. Pakkanen, T.A.; Kerminen, V.M.; Korhonen, C.H.; Hillamo, R.E.; Aarnio, P.; Koskentalo, T. Urban and rural ultrafine (PM0.1) particles in the Helsinki area. Atmos. Environ. 2001, 35, 4593–4607. [Google Scholar] [CrossRef]
  15. Ermolin, M.S.; Fedotov, P.S.; Malik, N.A.; Karandashev, V.K. Nanoparticles of volcanic ash as a carrier for toxic elements on the global scale. Chemosphere 2018, 200, 16–22. [Google Scholar] [CrossRef]
  16. Stone, V.; Miller, M.R.; Clift, M.J.D.; Elder, A.; Mills, N.L.; Møller, P.; Schins, R.P.F.; Vogel, U.; Kreyling, W.G.; Alstrup-Jensen, K.; et al. Nanomaterials Versus Ambient Ultrafine Particles: An Opportunity to Exchange Toxicology Knowledge. Environ. Health Perspect. 2017, 125, 106002. [Google Scholar]
  17. Miller, M.R.; Shaw, C.A.; Langrish, J.P. From particles to patients: Oxidative stress and the cardiovascular effects of air pollution. Future Cardiol. 2012, 8, 577–602. [Google Scholar]
  18. Ronkko, T.; Kuuluvainen, H.; Karjalainen, P. Traffic is a major source of atmospheric nanocluster aerosol. Proc. Natl. Acad. Sci. USA 2017, 114, 7549–7554. [Google Scholar] [CrossRef]
  19. Belkacem, I.; Helali, A.; Khardi, S.; Chrouda, A.; Slimi, K. Road traffic nanoparticle characteristics: Sustainable environment and mobility. Geosci. Front. 2022, 13, 101196. [Google Scholar]
  20. Harrison, R.R.; Beddows, D.C.S.; Alam, M.S. Interpretation of particle number size distributions measured across an urban area during the FASTER campaign. Atmos. Chem. Phys. 2019, 19, 39–55. [Google Scholar]
  21. Air Quality Expert Group (AQEG). Non-Exhaust Emissions from Road Traffic. Prepared for: Department for Environment, Food and Rural Affairs; Scottish Government; Welsh Government; and Department of the Environment in Northern Ireland. 2019. Available online: https://uk-air.defra.gov.uk/assets/documents/reports/cat09/1907101151_20190709_Non_Exhaust_Emissions_typeset_Final.pdf (accessed on 10 September 2023).
  22. European Environmental Agency (EEA). Emissions of Air Pollutants from Transport. Available online: https://www.eea.europa.eu/data-and-maps/indicators/transport-emissions-of-air-pollutants-8/transport-emissions-of-air-pollutants-8 (accessed on 12 May 2023).
  23. Fujitani, Y.; Takahashi, K.; Saitoh, K.; Fushimi, A.; Hasegawa, S.; Kondo, Y.; Tanabe, K.; Takami, A.; Kobayashi, S. Contribution of industrial and traffic emissions to ultrafine, fine, coarse particles in the vicinity of industrial areas in Japan. Environ. Adv. 2021, 5, 100101. [Google Scholar]
  24. Samae, H.; Tekasakul, S.; Tekasakul, P.; Furuuchi, M. Emission factors of ultrafine particulate matter (PM < 0.1 μm) and particle-bound polycyclic aromatic hydrocarbons from biomass combustion for source apportionment. Chemosphere 2021, 262, 127846. [Google Scholar] [PubMed]
  25. Pey, J.; Querol, X.; Alastuey, A.; Rodríguez, S.; Putaud, J.P.; Van Dingenen, R. Source apportionment of urban fine and ultra-fine particle number concentration in a Western Mediterranean city. Atmos. Environ. 2009, 43, 4407–4415. [Google Scholar] [CrossRef]
  26. Nie, D.; Qiu, Z.; Wang, X.; Liu, Z. Characterizing the source apportionment of black carbon and ultrafine particles near urban roads in Xi’an, China. Environ. Res. 2022, 215, 114209. [Google Scholar] [CrossRef] [PubMed]
  27. Li, Q.Q.; Guo, Y.T.; Yang, J.Y.; Liang, C.S. Review on main sources and impacts of urban ultrafine particles: Traffic emissions, nucleation, and climate modulation. Atmos. Environ. X 2023, 19, 100221. [Google Scholar] [CrossRef]
  28. Munir, S.; Chen, H.; Crowther, R. The effect of COVID-19 lockdown on atmospheric total particle numbers, nanoparticle numbers and mass concentrations in the UK. Atmos. Pollut. Res. 2022, 13, 101548. [Google Scholar] [CrossRef]
  29. Kukkonen, J.; Karl, M.; Keuken, M.P.; Denier van der Gon, H.A.C.; Denby, B.R.; Singh, V.; Douros, J.; Manders, A.; Samaras, Z.; Moussiopoulos, N.; et al. Modelling the dispersion of particle numbers in five European cities. Geosci. Model Dev. 2016, 9, 451–478. [Google Scholar] [CrossRef]
  30. RI-URBANS. Research Infrastructures Services Reinforcing Air Quality Monitoring Capacities in European Urban & Industrial AreaS (GA n. 101036245) by NOA. Available online: https://riurbans.eu/wp-content/uploads/2022/07/RI-URBANS_D17_D3.2.pdf (accessed on 2 March 2025).
  31. Dai, H.; Huang, G.; Wang, J.; Zeng, H. VAR-tree model based spatio-temporal characterization and of O3 concentration in China. Ecotoxicol. Environ. Saf. 2023, 257, 114960. [Google Scholar] [CrossRef]
  32. Leeds Clean Air Zone (LCAZ). Modelling Report 2020. Leeds City Council. 2020. Available online: https://datamillnorth.org/dataset/leeds-clean-air-zone---compliance-modelling-2021 (accessed on 13 December 2022).
  33. National Atmospheric Emissions Inventory (NAEI), UK. Vehicle Fleet Composition Projections (Base 2019r). 2020. Available online: https://naei.energysecurity.gov.uk/sites/default/files/2024-05/rtp_fleet_projection_NAEI_2017_Base2019r_v1_1.xlsx (accessed on 2 March 2025).
  34. Giechaskiel, B.; Riccobono, F.; Vlachos, T.; Mendoza-Villafuerte, P.; Suarez-Bertoa, R.; Fontaras, G.; Bonnel, P.; Weiss, M. Vehicle Emission Factors of Solid Nanoparticles in the Laboratory and on the Road Using Portable Emission Measurement Systems (PEMS). Front. Environ. Sci. 2015, 3, 82. [Google Scholar] [CrossRef]
  35. Franco, V.; Kousoulidou, M.; Muntean, M.; Ntziachristos, L.; Hausberger, S.; Dilara, P. Road vehicle emission factors development: A review. Atmos. Environ. 2013, 70, 84–97. [Google Scholar] [CrossRef]
  36. Wang, F.; Ketzel, M.; Ellermann, T.; Wahlin, P.; Jensen, S.S.; Fang, D.; Massling, A. Particle number, particle mass and NOx emission factors at a highway and an urban street in Copenhagen. Atmos. Chem. Phys. 2010, 10, 2745–2764. [Google Scholar] [CrossRef]
  37. nanoComposix. Nanoparticle Volume, Mass and Concentration. 2014. Available online: https://nanocomposix.com/pages/nanoparticle-volume-mass-and-concentration (accessed on 9 July 2023).
  38. Klockner, P.; Seiwert, B.; Eisentraut, P.; Braun, U.; Reemtsma, T.; Wagner, S. Characterization of tire and road wear particles from road runoff indicates highly dynamic particle properties. Water Res. 2020, 185, 116262. [Google Scholar] [CrossRef] [PubMed]
  39. Klockner, P.; Seiwert, B.; Weyrauch, S.; Escher, B.I.; Reemtsma, T.; Wagner, S. Comprehensive characterization of tire and road wear particles in highway tunnel road dust by use of size and density fractionation. Chemosphere 2021, 279, 130530. [Google Scholar] [PubMed]
  40. Mamakos, A.; Arndt, M.; Hesse, D.; Augsburg, K. Physical characterization of brake-wear particles in a PM10 dilution tunnel. Atmosphere 2019, 10, 639. [Google Scholar] [CrossRef]
  41. Philippe, F.; Morgeneyer, M.; Xiang, M.; Manokaran, M.; Berthelot, B.; Chen, Y.M.; Charles, P.; Guingand, F.; Bressot, C. Representativeness of airborne brake wear emission for the automotive industry: A review. Proc. Inst. Mech. Eng. D-J. Automob. Eng. 2021, 235, 2651–2666. [Google Scholar] [CrossRef]
  42. Wagner, S.; Klöckner, P.; Reemtsma, T. Aging of tire and road wear particles in terrestrial and freshwater environments—A review on processes, testing, analysis and impact. Chemosphere 2022, 288, 132467. [Google Scholar] [CrossRef]
  43. Woo, S.H.; Kim, Y.; Lee, S.; Choi, Y.; Lee, S. Characteristics of brake wear particle (BWP) emissions under various test driving cycles. Wear 2021, 480, 203936. [Google Scholar]
  44. National Atmospheric Emissions Inventory (NAEI), UK. Emission Factors Detailed by Source and Fuel. Available online: https://naei.beis.gov.uk/data/ef-all (accessed on 14 December 2022).
  45. Munir, S.; Mayfield, M.; Coca, D.; Jubb, S.A.; Osammor, O. Analysing the performance of low-cost air quality sensors, their drivers, relative benefits and calibration in cities-a case study in Sheffield. Environ. Monit. Assess. 2019, 191, 94. [Google Scholar]
  46. Zeng, H.; Shao, B.; Dai, H.; Yan, Y.; Tian, N. Prediction of fluctuation loads based on GARCH family-CatBoost-CNNLSTM. Energy 2023, 263(Part E), 126125. [Google Scholar]
  47. Beddows, D.C.; Harrison, R.M. PM10 and PM2.5 emission factors for non-exhaust particles from road vehicles: Dependence upon vehicle mass and implications for battery electric vehicles. Atmos. Environ. 2021, 244, 117886. [Google Scholar]
  48. Hicks, W.; Beevers, S.; Tremper, A.H.; Stewart, G.; Priestman, M.; Kelly, F.J.; Lanoisell’e, M.; Lowry, D.; Green, D.C. Quantification of non-exhaust particulate matter traffic emissions and the impact of COVID-19 lockdown at London Marylebone road. Atmosphere 2021, 12, 190. [Google Scholar] [CrossRef]
  49. Liu, Y.; Chen, H.; Gao, J.; Li, Y.; Dave, K.; Chen, J.; Federici, M.; Perricone, G. Comparative analysis of non-exhaust airborne particles from electric and internal combustion engine vehicles. J. Hazard. Mater. 2021, 420, 126626. [Google Scholar] [PubMed]
  50. Office of the National Statics (ONS) Report—Road Transport and Air Emissions: Contribution of Road Transport to Greenhouse Gas and Air Pollutant Emissions–Further Analysis of the UK Environmental Accounts Data. 2019. Available online: https://www.ons.gov.uk/economy/environmentalaccounts/articles/roadtransportandairemissions/2019-09-16 (accessed on 2 August 2023).
  51. Huang, C.; Lou, D.; Hu, Z.; Feng, Q.; Chen, Y.; Chen, C.; Tan, P.; Yao, D. A PEMS study of the emissions of gaseous pollutants and ultrafine particles from gasoline- and diesel-fueled vehicles. Atmos. Environ. 2013, 77, 703–710. [Google Scholar]
  52. Krecl, P.; Targino, A.C.; Landi, T.P.; Ketzel, M. Determination of black carbon, PM2.5, particle number and NOx emission factors from roadside measurements and their implications for emission inventory development. Atmos. Environ. 2018, 186, 229–240. [Google Scholar]
  53. Fujitani, Y.; Takahashi, K.; Fushimi, A.; Hasegawa, S.; Kondo, Y.; Tanabe, K.; Kobayashi, S. Particle number emission factors from diesel trucks at a traffic intersection: Long-term trend and relation to particle mass-based emission regulation. Atmos. Environ X 2020, 5, 100055. [Google Scholar]
  54. Kumar, P.; Fennell, P.; Hayhurst, A.; Britter, R.E. Street versus roof top level concentrations of fine particles in a Cambridge street canyon. Bound. Layer Meteorol. 2009, 131, 3–18. [Google Scholar] [CrossRef]
  55. Vouitsis, I.; Ntziachristos, L.; Samaras, C.; Samaras, Z. Particulate mass and number emission factors for road vehicles based on literature data and relevant gap filling methods. Atmos. Environ. 2017, 168, 75–89. [Google Scholar]
  56. Harrison, R.M.; MacKenzie, A.R.; Xu, H.; Alam, M.S.; Nikolova, I.; Zhong, J.; Singh, A.; Zeraati-Rezaei, S.; Stark, C.; Beddows, D.C.S.; et al. Diesel exhaust nanoparticles and their behaviour in the atmosphere. Proc. R. Soc. A 2018, 474, 20180492. [Google Scholar] [CrossRef]
  57. Frohn, L.M.; Ketzel, M.; Christensen, J.H.; Brandt, J.; Im, U.; Massling, A.; Andersen, C.; Plejdrup, M.S.; Nielsen, O.-K.; van der Gon, H.D. Modelling ultrafine particle number concentrations at address resolution in Denmark from 1979-2018—Part 1: Regional and urban scale modelling and evaluation. Atmos. Environ. 2021, 264, 118631. [Google Scholar]
  58. Jones, A.M.; Harrison, R.M. Estimation of the emission factors of particle number and mass fractions from traffic at a site where mean vehicle speeds vary over short distances. Atmos. Environ. 2006, 40, 7125–7137. [Google Scholar] [CrossRef]
  59. Kumar, P.; Ketzel, M.; Vardoulakis, S.; Pirjola, L.; Britter, R. Dynamics and dispersion modelling of nanoparticles from road traffic in the urban atmospheric environment—A review. J. Aerosol Sci. 2011, 42, 580–603. [Google Scholar] [CrossRef]
  60. Gidhagen, L.; Johansson, C.; Langner, J.; Foltescu, V.L. Urban scale modeling of particle number concentration in Stockholm. Atmos. Environ. 2005, 39, 1711–1725. [Google Scholar] [CrossRef]
  61. Wang, T.; Quiros, D.C.; Thiruvengadam, A.; Pradhan, S.; Hu, S.; Huai, T.; Lee, E.S.; Zhu, Y. Total Particle Number Emissions from Modern Diesel, Natural Gas, and Hybrid Heavy-Duty Vehicles During On-Road Operation. Environ. Sci. Technol. 2017, 51, 6990–6998. [Google Scholar] [PubMed]
  62. Lahde, T.; Giechaskiel, B. Particle Number Emissions of Gasoline, Compressed Natural Gas (CNG) and Liquefied Petroleum Gas (LPG) Fueled Vehicles at Different Ambient Temperatures. Atmosphere 2021, 12, 893. [Google Scholar] [CrossRef]
  63. Ntziachristos, L.; Mamakos, A.; Samaras, Z.; Mathis, U.; Mohr, M.; Thompson, N.; Stradling, R.; Forti, L.; de Serves, C. Overview of the European “Particulates” Project on the Characterization of Exhaust Particulate Emissions from Road Vehicles: Results for Light-duty Vehicles. SAE Trans. 2004, 113, 1354–1373. [Google Scholar]
  64. Ntziachristos, L.; Samaras, Z. Combination of aerosol instrument data into reduced variables to study the consistency of vehicle exhaust particle measurements. Atmos. Environ. 2006, 40, 6032–6042. [Google Scholar]
  65. Vouitsis, E.; Ntziachristos, L.; Pistikopoulos, P.; Samaras, Z.; Chrysikou, L.; Samara, C.; Papadimitriou, C.; Samaras, P.; Sakellaropoulos, G. An investigation on the physical, chemical and ecotoxicological characteristics of particulate matter emitted from light-duty vehicles. Environ. Pollut. 2009, 157, 2320–2327. [Google Scholar]
  66. Mamakos, A.; Martini, G.; Manfredi, U. Assessment of the legislated particle number measurement procedure for a Euro 5 and a Euro 6 compliant diesel passenger cars under regulated and unregulated conditions. J. Aerosol Sci. 2013, 55, 31–47. [Google Scholar]
  67. Carbone, R.; Ranchet, N.; Rickeard, D.J.; Rowntree, C.J.; Stradling, R.J.; Zemroch, P.J.; Hall, D.E.; Thompson, N.D. Fuel Effects on the Characteristics of Particle Emissions from Advanced Engines and Vehicles; CONCAWE Report No. 1/05. 2005. Available online: https://groupware.sinanet.isprambiente.it/expert_panel/library/report/rpt051-2005-00240-01-epd/download/en/1/CONCAWE_Rpt051-2005-00240-01-E.pdf (accessed on 2 March 2025).
  68. Mohr, M.; Lehmann, U.; Margaria, G. ACEA Programme on the Emissions of Fine Particulates from Passenger Cars (2). Part 1. Particle Characterization of a Wide Range of Engine Technologies. SAE Trans. 2003, 112, 1579–1589. [Google Scholar]
  69. Mamakos, A.; Dardiotis, C.; Martini, G. Assessment of Particle Number Limits for Petrol Vehicles. JRC Scientific Report, EUR 25592 EN-2012. 2012. Available online: https://publications.jrc.ec.europa.eu/repository/bitstream/JRC76849/lbna25592enn.pdf (accessed on 2 March 2025).
  70. May, J.; Bosteels, D.; Favre, C. Particulate Emissions from Euro 3 to Euro 6 Light-Duty Vehicles Equipped with a Range of Emissions Control Technologies; AECC: Brussels, Belgium, 2011; Available online: https://www.aecc.eu/wp-content/uploads/2020/08/131127-AECC-IMechE-presentation-Emissions-from-Euro-3-to-Euro-6.pdf (accessed on 13 July 2023).
  71. Fontaras, G.; Karavalakis, G.; Kousoulidou, M.; Tzamkiozis, T.; Ntziachristos, L.; Bakeas, E.; Stournas, S.; Samaras, Z. Effects of biodiesel on passenger car fuel consumption, regulated and non-regulated pollutant emissions over legislated and real-world driving cycles. Fuel 2009, 88, 1608–1617. [Google Scholar]
  72. Fontaras, G.; Kousoulidou, M.; Karavalakis, G.; Tzamkiozis, T.; Pistikopoulos, P.; Ntziachristos, L.; Bakeas, E.; Stournas, S.; Samaras, Z. Effects of low concentration biodiesel blend application on modern passenger cars. Part 1: Feedstock impact on regulated pollutants, fuel consumption and particle emissions. Environ. Pollut. 2010, 158, 1451–1460. [Google Scholar]
  73. Macor, A.; Avella, F.; Faedo, D. Effects of 30% v/v biodiesel/diesel fuel blend on regulated and unregulated pollutant emissions from diesel engines. Appl. Energy 2011, 88, 4989–5001. [Google Scholar] [CrossRef]
  74. Schreiber, A.; Forss, M.; Mohr, M.; Dimopoulos, P. Particle Characterisation of Modern CNG, Gasoline and Diesel Passenger Cars. SAE Technol. Pap. 2007. [Google Scholar] [CrossRef]
  75. Lee, J.W.; Do, H.S.; Kweon, S.I.; Park, K.K.; Hong, J.H. Effect of various LPG supply systems on exhaust particle emissions in spark-ignited combustion engine. Int. J. Automot. Technol. 2010, 11, 793–800. [Google Scholar] [CrossRef]
  76. Kim, H.; Lee, J. Quantitative analysis of vehicle particle emission by using calibrated CPC system. J. Mech. Sci. Technol. 2011, 25, 2959–2967. [Google Scholar]
  77. De Serves, C. Emissions from Flexible Fuel Vehicles with Different Ethanol Blends. REPORT No AVL MTC 5509. 2005. Available online: http://korridor.se/aryan/acadiane/e85/Etanolrapport.pdf (accessed on 2 March 2025).
Figure 1. The map showing road network covered by the Leeds Transport Model [32].
Atmosphere 16 00417 g001
Figure 2. Nanoparticle number emissions (number particles/km) from road transport in Leeds using the detailed model for the year 2020.
Atmosphere 16 00417 g002
Figure 3. Nanoparticle number emissions (number of particles/km) from road transport in Leeds using the simple model for the year 2020.
Atmosphere 16 00417 g003
Figure 4. Comparing the outcomes of the simple vs. detailed model, showing a strong association between the estimations of the two models: the upper panel shows a line plot of both simple and detailed models, and the lower panel shows a scatter plot between the simple and detailed models’ outputs. In the upper panel x-axis, “Index” is simply a sequence of numbers (showing the counts of data points).
Atmosphere 16 00417 g004
Table 1. The UK national fleet composition for road traffic in 2020 [33].
Traffic CategoryMotorwayRuralUrban
Electric car0.4%0.5%0.5%
Petrol car33.7%42.2%47.5%
Diesel car38.9%35.3%33.1%
Electric LGV0.0%0.0%0.0%
Petrol LGV0.2%0.2%0.2%
Diesel LGV14.9%15.9%15.4%
Rigid HGV3.1%2.3%0.9%
Artic HGV8.0%2.4%0.4%
Table 2. Nanoparticle emission factors (NPEF) expressed in the unit of mass (g/km) for different vehicle types [44].
Vehicle TypeEF for PM0.1 (g/km)
Car—petrol3.26 × 10−7
Car—diesel2.04 × 10−6
Car—brake wear9.37 × 10−4
Car—tyre wear9.37 × 10−4
Car—road abrasion6.12 × 10−4
LGVs—petrol1.60 × 10−7
LGVs—diesel1.61 × 10−6
LGVs—brake wear1.46 × 10−3
LGVs—tyre wear1.09 × 10−3
LGVs—road abrasion6.12 × 10−4
Buses and coaches—diesel1.22 × 10−6
Buses and coaches—brake wear4.29 × 10−3
Buses and coaches—tyre wear1.69 × 10−3
Buses and coaches—road abrasion3.10 × 10−3
HGV articulated—diesel5.06 × 10−7
HGV articulated—brake wear4.08 × 10−3
HGV articulated tyre wear3.71 × 10−3
HGV articulated—road abrasion3.10 × 10−3
HGV—rigid diesel9.67 × 10−7
HGV—rigid brake wear4.08 × 10−3
HGV—rigid tyre wear1.64 × 10−3
HGV—rigid road abrasion3.10 × 10−3
Table 3. Nanoparticle number emission factors (NPNEFs) (particle/km) for different vehicle types on urban roads and motorways (EE = exhaust emissions, NEE = non-exhaust emissions).
Veh. CategoryRoad TypeExhaustBrake WearTyre WearRoad WearEE and NEE
Petrol carUrban8.00 × 1012 a8.95 × 1038.95 × 1035.84 × 1038.00 × 1012
Diesel carUrban6.08 × 1014 b8.95 × 1038.95 × 1035.84 × 1036.08 × 1014
LGV petrolUrban5.00 × 1012 a,c1.39 × 1041.041045.84 × 1035.00 × 1012
LGV dieselUrban4.86 × 1013 a,c1.39 × 1041.04 × 1045.84 × 1034.86 × 1013
CoachUrban7.06 × 1014 b4.09 × 1041.61 × 1042.96 × 1047.06 × 1014
HGV articUrban3.45 × 1014 d3.89 × 1043.54 × 1042.96 × 1043.45 × 1014
HGV rigidUrban3.45 × 1014 d3.89 × 1041.56 × 1042.96 × 1043.45 × 1014
Mixed fleetUrban2.15 × 1014 e2.35 × 1041.51 × 1041.60 × 1042.15 × 1014
Petrol carMotorway1.64 × 10121.86 × 1034.39 × 1035.84 × 1031.64 × 1012
Diesel carMotorway4.380 × 10141.86 × 1034.39 × 1035.84 × 1034.380 × 1014
LGV petrolMotorway3.60 × 1013 g4.17 × 1037.33 × 1035.84 × 1033.60 × 1013
LGV dieselMotorway2.20 × 10144.17 × 1037.33 × 1035.84 × 1032.20 × 1014
CoachMotorway3.60 × 1013 g1.26 × 1041.86 × 1042.96 × 1043.60 × 1013
HGV articMotorway7.02 × 1013 g1.85 × 1042.79 × 1042.96 × 1047.02 × 1013
HGV rigidMotorway3.60 × 1013 g1.85 × 1041.24 × 104 2.96 × 1043.60 × 1013
Mixed fleetMotorway1.78 × 1014 e,f8.81 × 1031.18 × 1041.60 × 1041.78 × 1014
a [34]; b [51]; c [52]; d [53]; e [36]; f [54], g [55].
Table 4. NPN emissions for all links in Leeds per AADT for different vehicle categories and both detailed and simple models.
Vehicle CategoryNPN Emissions (AADT)
Petrol cars1.09 × 1020
Diesel cars8.81 × 1021
LGV8.63 × 1019
HGV1.76 × 1020
Artic HGV6.86 × 1019
Coaches3.37 × 1020
Detailed model9.58 × 1021
Simple model5.79 × 1021
Table 5. The total particle number (TPN) and solid particle number (SPN) emission factors expressed as 1011 p/km, as proposed by Vouitsis et al. [55]. CNG = compressed natural gas, LPG = liquefied petroleum gas, DPF = diesel particulate filters, E10 and E50 = 10% and 50% ethanol, and B10 and B50 = 10% and 50% biodiesel.
TPNCars 1.4–2.0 L
Vehicle TypeUrban RdRural Rd Highways
Gasol. PFI Euro 415.312.216.4
Gasol. DI Euro 41631481183
Diesel Euro 4128010801750
B10 Euro 4610524848
B20 Euro 4487418703
B100 Euro 4468402651
E10 Euro 45.85.15.4
E75 Euro 43.22.83.0
CNG Euro 41.83.9410
LPG Euro 43.83.23.5
Gasol. PFI Euro 5 and 69.27.39.8
Gasol. DI Euro 5 and 612.110.987.5
Diesel Euro 5 and 64.11.616.4
B10 Euro 5 and 62.00.87.9
B20 Euro 5 and 61.60.66.6
B100 Euro 5 and 61.50.66.1
E10 Euro 5 and 63.53.13.2
E75 Euro 5 and 61.91.71.8
CNG Euro 5 and 61.12.3245
LPG Euro 5 and 62.31.92.1
SPNCars 1.4 0 2.0 L
Gasol. PFI Euro 49.07.98.4
Gasol. DI Euro 49576606
Diesel Euro 4748552900
B10 Euro 4357269469
B20 Euro 4282213387
B100 Euro 4271213358
E10 Euro 41.01.03.0
E75 Euro 40.51.01.0
CNG Euro 41.73.913.6
LPG Euro 43.02.62.8
Gasol. PFI Euro 5and63.63.11.3
Gasol. DI Euro 5and620117.5
Diesel Euro 5 and 62.20.92.3
B10 Euro 5 and 61.20.44.3
B20 Euro 5 and 60.90.33.6
B100 Euro 5 and 60.90.33.6
E10 Euro 5 and 60.40.40.5
E75 Euro 5 and 60.20.40.4
CNG Euro 5 and 6 0.71.52.1
LPG Euro 5 and 60.50.41.0
TPNHeavy-Duty Vehicles
Rigid < 7.5 t
Euro I4594391710,066
Euro II319027206990
Euro III319027206990
Euro IV6736821880
Euro V6736821880
Euro VI0.70.71.9
Rigid 7.5–14 t
Euro I9749718614,832
Euro II6770499010,300
Euro III6770499010,300
Euro IV143012502770
Euro V143012502770
Euro VI1.41.22.8
Rigid and Articulated > 14 t
Euro I15,26411,10219,584
Euro II10,600771013,600
Euro III10,600771013,600
Euro IV224019303670
Euro V224019303670
Euro VI2.21.93.7
SPNHeavy-Duty Vehicles
Rigid < 7.5 t
Euro I317015281913
Euro II221010601340
Euro III221010601340
Euro IV467266360
Euro V467266360
Euro VI0.50.30.4
Rigid 7.5–14 t
Euro I672728032818
Euro II470019501970
Euro III470019501970
Euro IV992489530
Euro V992489530
Euro VI1.00.50.5
Rigid and articulated > 14 t
Euro I10,53243303720
Euro II735030102610
Euro III735030102610
Euro IV1550755702
Euro V1550755702
Euro VI1.60.80.7
Table 6. NPNEF for various vehicle engine technologies using different fuel types collected from the literature review. CNG = compressed natural gas, LPG = liquefied petroleum gas, DPF = diesel particulate filters, E10 = 10% ethanol, B10 = 10% biodiesel, HDV = heavy-duty vehicle, LDV light-duty vehicle, PFI = port fuel injection, GDI = gasoline direct injection, TWC = three-way catalyst.
Vehicle TypeFuel TypeEmission Factors
(p/km)
Reference
HDV, Euro VDiesel with DPF2 × 1013[34]
HDV, Euro VIDiesel with DPF6 × 1010
LDVDiesel with DPF8 × 1011
Car PFIGasoline with TWC1 × 1012
Car GDIGasoline with TWC8 × 1011–8 × 10¹²
BusesDiesel7.06 × 1014[51]
CarDiesel6.08 × 1014
CarPetrol1.57 × 1014
HDVDiesel1.1–4.9 × 10¹⁴[53]
HDVDiesel0.5–7.4 × 10¹⁴
HDVDiesel1.00 × 1016
HDVDiesel with DPF1.4 × 1013
Mixed vehicle fleet1.5%HDV5.9 × 1014–3.3 × 10¹⁴[52]
LDVGasoline1.93 × 1014
LDVGasoline4.29 × 1013
LDVGasoline 3.52 × 10¹³
LDVGasoline1.00 × 1013
LDVDiesel 5.91 × 10¹⁴
LDVDiesel1.53 × 1014
LDVDiesel3.33 × 1014
LDVDiesel9.64 × 1013
Car Euro 2Diesel4.380 × 1014[63]
Car Euro 3Diesel2.747 × 1014[64]
Car Euro 4Diesel2.327 × 1014[65]
Euro3 + DPFDiesel3.5 × 1011[63]
Euro4 + DPFDiesel2.2 × 1012[65]
Euro 5Diesel1.7 × 1011[66]
Euro3, DIGasoline2.97 × 1013[63]
PFI Euro 1Gasoline1.88 × 1013[67]
PFI Euro 3Gasoline2.5 × 1011[68]
PFI Euro 4Gasoline1.64 × 1012[65]
PFI Euro 5Gasoline5.7 × 1011[69]
DI Euro 3Gasoline7.8 × 1012[70]
DI Euro 4Gasoline5.9 × 1012
DI Euro 5Gasoline3.7 × 1011
Car Euro 2Biodiesel1.3 × 1014[71]
Car Euro 2 B50Biodiesel1.95 × 1014
Car Euro 2 B100Biodiesel4.45 × 1014
Car Euro 3Biodiesel1.20 × 1014[72]
Car Euro 3 B10Biodiesel9.58 × 1013
Car Euro 3Biodiesel3.32 × 1013[73]
Car Euro 3Biodiesel2.75 × 1013
Car Euro 2Biodiesel1.64 × 1014[71]
Car Euro 2 B50Biodiesel1.82 × 1014
Car Euro 2 B100Biodiesel1.76 × 1014
Car Euro 3Biodiesel1.60 × 1014[72]
Car Euro 3 B10Biodiesel1.32 × 1014
Car Euro 3Biodiesel2.52 × 1013[73]
Car Euro 3Biodiesel2.21 × 1013
Car Euro 4CNG1.8 × 1011[74]
Car Euro 4CNG4.10 × 1013
Car EU5LPG2.00 × 1010[75]
Car EU4LPG7.00 × 1010[76]
Car EU4 + E10Bioethanol6.00 × 1010[77]
Car EU4 + E10Bioethanol1.8 × 1011
Car EU4 + E > 10Bioethanol5.10 × 1010
Car EU4 + E > 10Bioethanol1.00 × 1011
Disclaimer/Publisher’s Note: The statements, opinions and data contained in all publications are solely those of the individual author(s) and contributor(s) and not of MDPI and/or the editor(s). MDPI and/or the editor(s) disclaim responsibility for any injury to people or property resulting from any ideas, methods, instructions or products referred to in the content.

