1. Introduction
Poland’s climate is characterized by a distinct variability of weather conditions throughout the year, resulting in at least four seasons [
1]. Spring is the period when plants begin to grow again after winter dormancy, and the timing of the start of vegetation, referred to as the growing-season onset (GSO), which depends mainly on thermal and pluvial conditions [
2]. In areas with distinct seasonality of precipitation and relatively stable thermal conditions, precipitation data are often used to determine the GSO [
3]. In mid-latitudes, day length and air temperature play a key role, which means that methods for determining the GSO vary depending on local climatic conditions [
4]. The choice of the optimal method is not obvious, as it depends on the interaction of different environmental factors and the specific characteristics of each plant species [
5]. Usually used methods are based on air temperature analysis because, in addition to definite day lengths, temperature is one of the indispensable factors in the environment required to reach a certain stage of plant development, and the temperature requirements vary not only between species, but also between forms of the same plant [
6]. In regions with a low density of weather stations, satellite remote sensing data are used to determine the length of the growing season. A time series of vegetation indices derived from optical sensors onboard satellites, provide information about the green-up and senescence of vegetation during the year [
7,
8,
9]. The growing season can also be determined by plant phenology, which analyses the dates of bud swelling and final leaf drop. A complication in the phenological methods can be the different responses of various plants to a warming climate [
10]. Rigby and Porporato [
11] surmise that the climatic change probably will not result in a simple translation of mean daily temperature and that vegetation development as a dynamical phenomenon will be sensitive to other statistical characteristics of daily temperature besides the mean.
The GSO in Poland appears earlier and earlier as a consequence of the climate warming [
12]. Warm seasons are prolonged, and the thermal winter period is shortened and characterized by milder weather [
13]. At the onset of the growing season, precipitation, sunlight, and air and soil temperature play a key role in plant development. A premature increase in temperature can trigger plant growth, leading to an increased risk of damage in the event of late frosts [
14,
15]. Frost refers to freeze events occurring in spring and autumn, defined as days when the minimum air temperature is below 0 °C while the maximum or mean daily temperature remains above 0 °C. Frost is also defined as a decrease in air temperature below the freezing point of water during the growing season of plants. The literature distinguishes between radiative, advection, and mixed frosts [
16,
17]. Frosts can cause physiological drought in plants, which may lead to reduced crop yields and, in extreme cases, crop dieback [
18]. During physiological droughts, plants are unable to absorb water even though water may be freely available. At the onset of the growing season, the frost tolerance of plants decreases rapidly. Late frosts are particularly dangerous, causing damage to flower buds, flowers, and fruit buds [
19,
20].
The occurrence of spring frosts depends not only on elevation and topography, but also on atmospheric circulation [
16,
21]. Atmospheric circulation has a significant influence on the determination of thermal conditions favorable for plant development in the early growing season. The area of Poland is under the influence of dynamic circulation conditions, resulting in frequent changes in the direction of advection and, consequently, strong fluctuations in temperature [
22]. Spring is the season when rapid weather changes occur most often. The most common cause of spring frosts in Poland is the advection of Arctic, polar continental and polar maritime cold air masses [
17]. The inflow of Arctic air masses is most frequent in April and May, which favors the occurrence of frosts [
23,
24]. The persistence of anticyclonic systems for an extended period also favors frosts, as it leads to stagnant air and intense cooling in the lower layer of the troposphere, which promotes the development of radiation frosts [
17].
Spring frosts on a regional scale in southeast Poland have been the subject of previous studies, which have mainly focused on analyzing their frequency and impact on agriculture [
19,
21,
25,
26,
27]. The abovementioned studies indicate that frost is a significant risk for crops, especially fruit crops, and that its frequency shows significant seasonal and multi-year variability. These studies have paid attention to local factors such as the topography and microclimate but lacked detailed analyses of atmospheric circulation conditions to determine the synoptic mechanisms that favor the occurrence of frost. In addition, research has also examined changes in the frost-free period in the Lublin region [
27] and temperature variations during specific cold events, such as the “cold gardeners” period [
25], which are particularly relevant to the occurrence of late spring frosts.
This study focuses on the analysis of the circulation determinants of spring frosts, their changes over time (seasonally and multi-year), and their impact on frost intensity. The study also analyzed multi-year changes in growing-season-onset dates and frost frequency. By investigating these factors, the study aims to provide a better understanding of the atmospheric mechanisms determining the occurrence of frosts and their variations in the context of a warming climate. This research offers new insights that can support the prediction of agricultural risks and the development of adaptation strategies to minimize crop losses.
2. Materials and Methods
For the analysis of spring frosts, data from five weather stations (Kozienice, Staszów, Puławy, Lublin–Radawiec, Sandomierz) located in southeastern Poland were used (
Figure 1;
Table 1). These data include the daily mean air temperature at 200 cm and the daily minimum temperature at 5 and 200 cm above ground level (a.g.l.). Frosts occurring at 5 cm a.g.l. are referred to as ground-level frosts, while those recorded at 200 cm a.g.l. are classified as air frosts. The decision to analyze frosts at two heights stems from the need to consider the impact of frost on low plants and fruit trees in orchards, of which there are many in the study area. Air temperature data were taken from the IMWM-NRI (Institute of Meteorology and Water Management, National Research Institute) database.
To analyze spring frosts, it was necessary to determine the dates of the GSO in the years 1981–2023. The GSO was determined according to the method of Huculak and Makowiec [
28]. In this method, the GSO was determined based on the date of the beginning of sequences of days in which the deviations of the daily mean air temperature at 200 cm a.g.l. from the daily mean of 5 °C were positive. This method was compared with a similar method developed by Guminski [
29,
30] based on subjective thermal thresholds [
31]. Both methods provided similar GSO dates. According to Węgrzyn [
32], the thermal thresholds used meet the thermal requirements of most crops to initiate vegetation. Examples of methodological solutions for thermal season determination in Poland can be found in the study [
30]. An important objective of the study was to evaluate the threat of frost to agricultural crops. Therefore, days with frost were analyzed from the onset of the growing season. A spring frost day in the study was defined as any day since the onset of the growing season when the daily minimum temperature was below 0 °C.
The Mann–Kendall test was used to assess the statistical significance of the trend in spring frost frequency (significance level of α = 0.05). The differences between the distributions of the GSO dates for each station were tested with the Kruskal–Wallis test.
Circulation conditions accompanying the occurrence of spring frosts were analyzed based on the backward trajectory cluster (BTC) analysis and empirical orthogonal functions (EOFs) used for the determination of a distribution patterns of geopotential height at an 850 hPa level (Z850). Z850 was taken from the ERA5 database [
33] for 06:00 UTC. The HYSPLIT model [
34] was applied to indicate backward trajectories during spring frosts and they were clustered. The backward trajectories were initialized at the point at 51.15°N and 21.75°E (red point in
Figure 1) at 06:00 UTC, starting from an isobaric surface of 850 hPa and running for a total of 240 h. The top of the model was set to 10,000 m a.g.l. Backward trajectories were generated using data from the NCEP/NCAR Reanalysis Project [
35]. To cope with the large number of trajectories, the dominant direction of air mass inflow during frosts was determined using cluster analysis. After testing different numbers of backward trajectory clusters, four clusters were selected for different periods.
3. Results
3.1. The Variability of the Growing-Season Onset
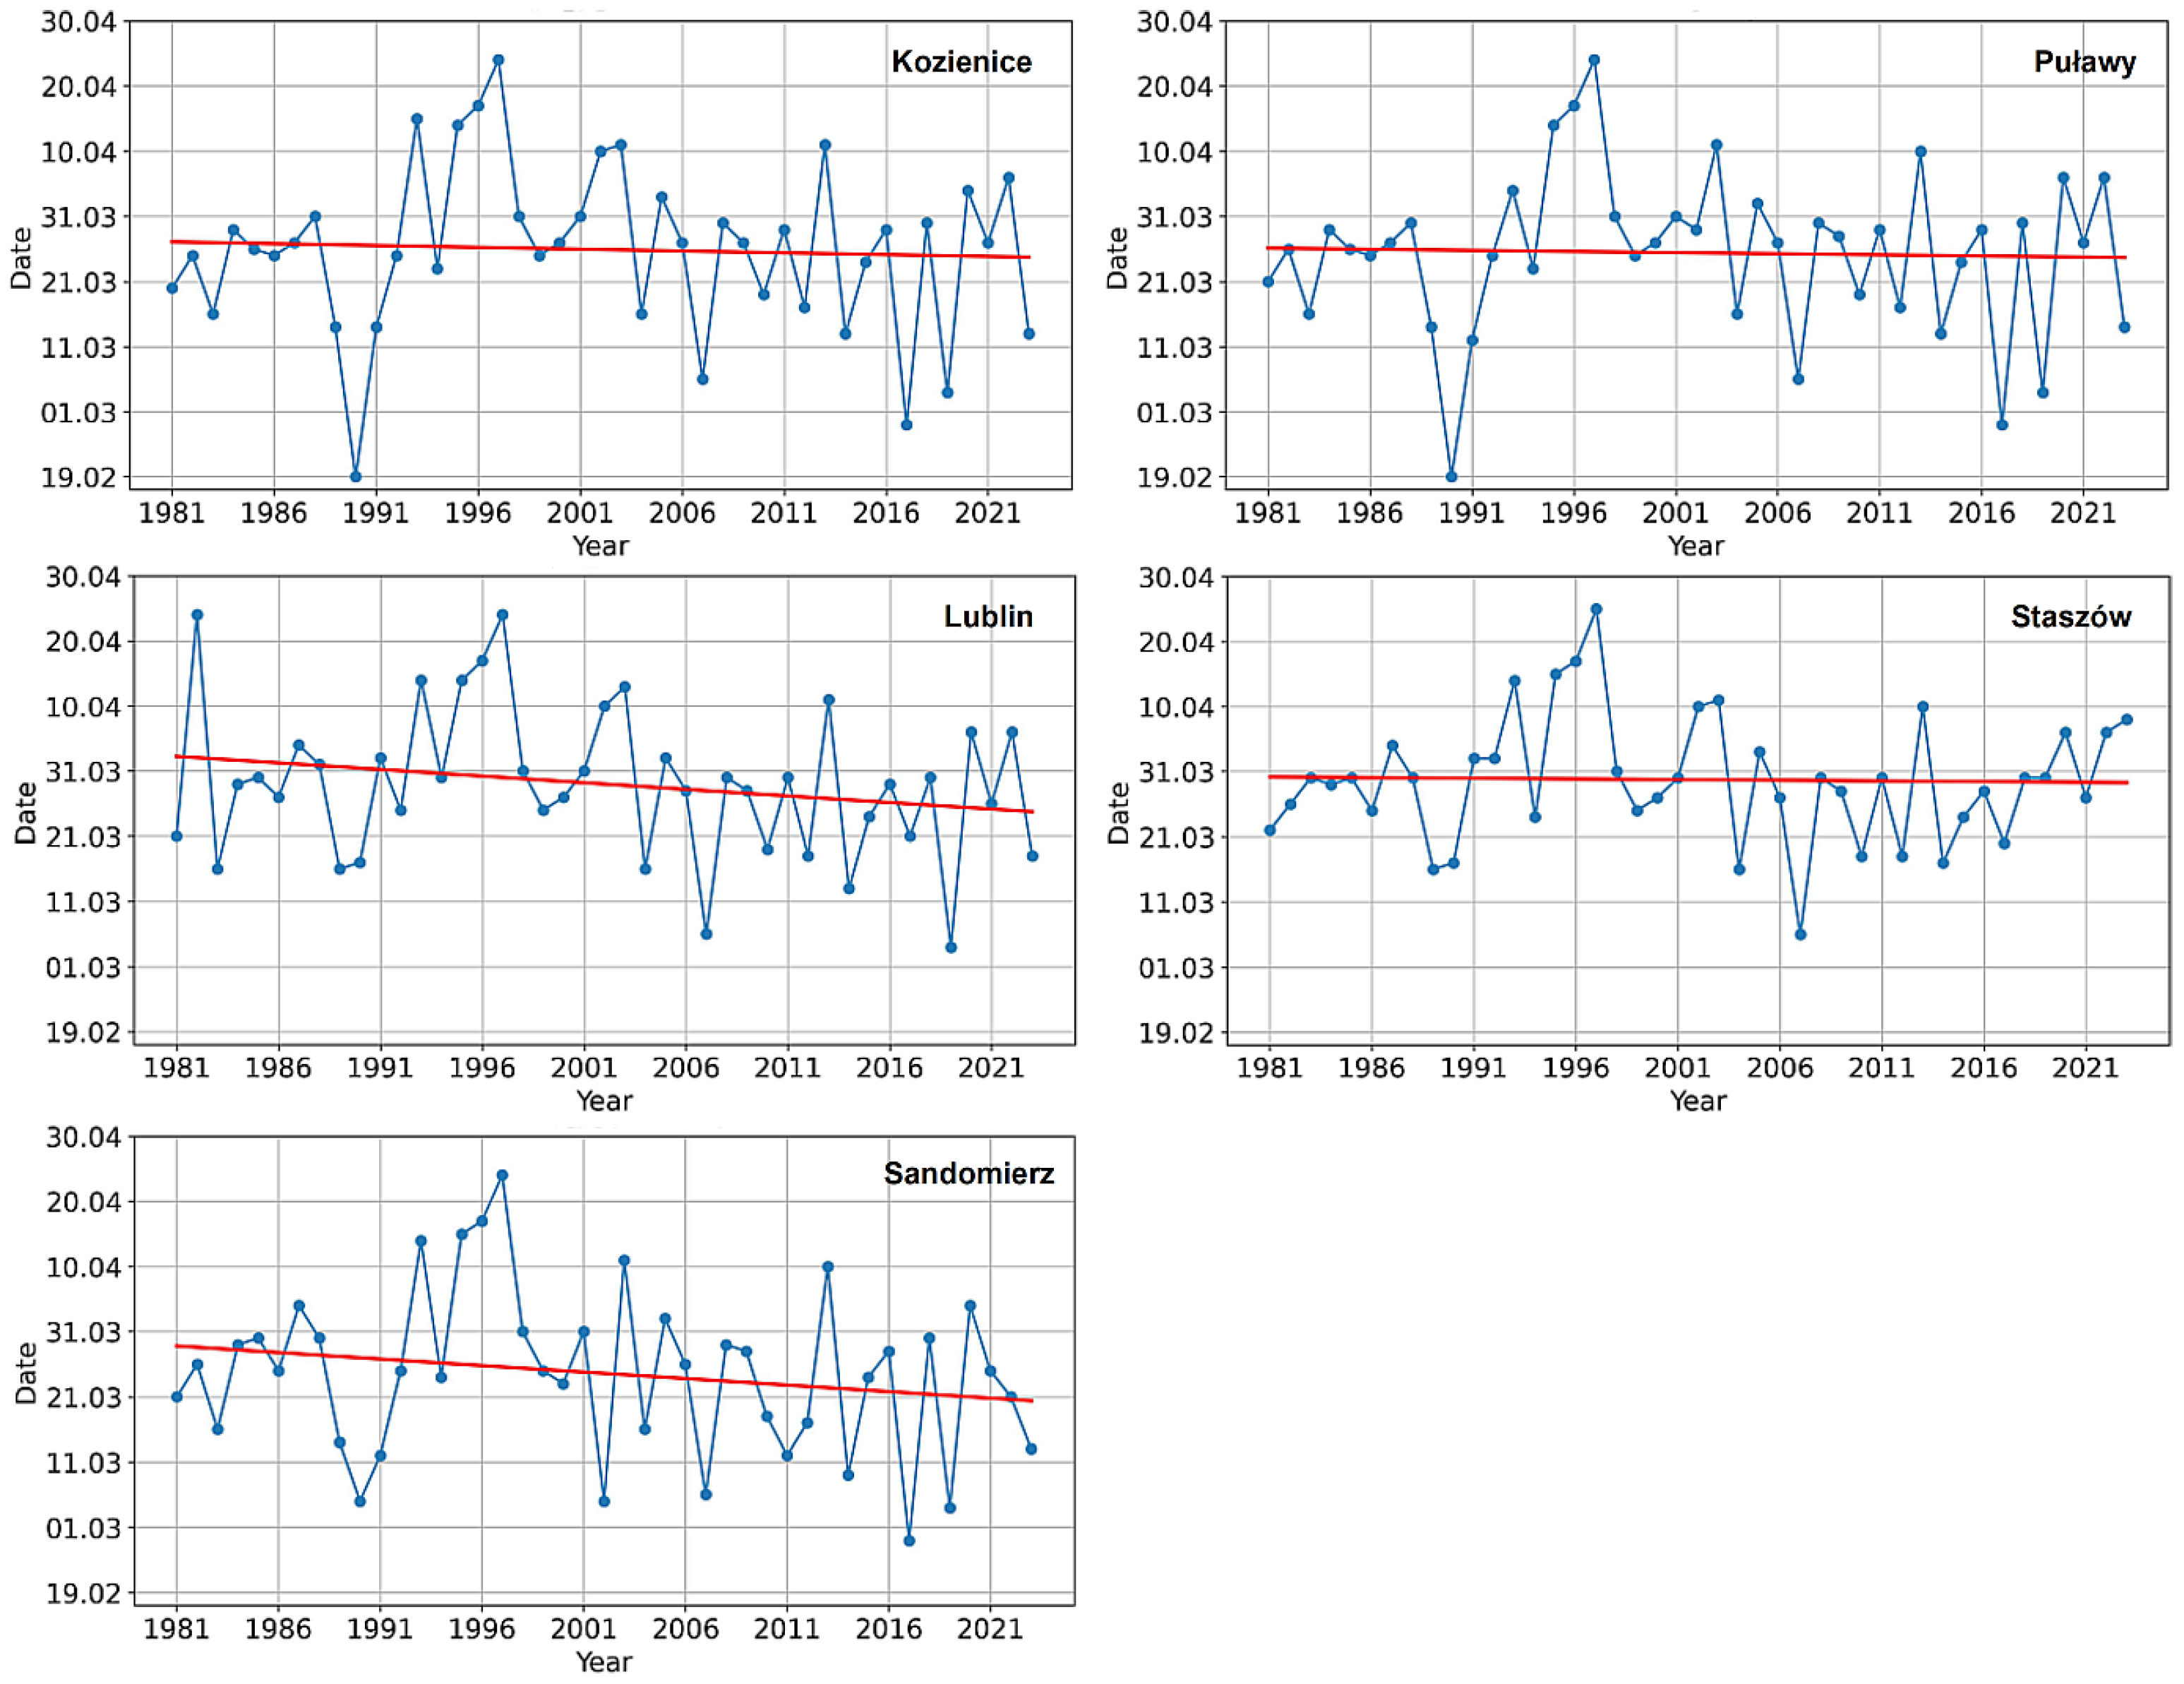
Analysis of the GSO dates from 1981 to 2023 for the five weather stations, i.e., Kozienice, Staszów, Puławy, Lublin, Sandomierz, showed variability in the mean GSO dates for this period depending on the location (
Figure 2). The earliest mean onset date was recorded in Sandomierz, where the mean growing season started on March 24. In contrast, the latest mean dates were recorded in Lublin and Staszów, where the mean period started on March 29. For Kozienice and Puławy, the mean date was March 25, indicating an earlier onset of the growing season compared to the other stations.
The range of variability in the GSO dates was different from station to station. The largest variations in the GSO dates were observed at Kozienice and Puławy, with a difference of 64 days between the earliest and latest start. The station in Staszów, on the other hand, had the lowest range of variability (50 days). In Lublin and Sandomierz, the range of variability was 51 and 56 days, respectively. It is also worth noting the coefficient of variation (CV), which indicates the relative variation in dates with respect to the mean. The stations with the highest variation were Kozienice (CV = 15.3%) and Sandomierz (CV = 15.1%), while the station with the lowest variation was Staszów (CV = 11.1%).
The multiannual variability of the GSO date showed that the earliest dates of the GSO occurred in different years depending on the location. In Kozienice and Puławy, the earliest date was 1990 (March 16), while in Lublin it was 2019 (March 12). Sandomierz recorded the earliest date of the GSO in 2017 (March 15), while Staszów recorded it in 2007 (March 18). In contrast, the latest GSO for most stations occurred mainly in 1997, indicating exceptional meteorological conditions during this period. Analysis of the differences between the two equal parts of the multi-year period showed that, in the second period, the dates of the GSO shifted to earlier dates at all stations. The highest difference was observed in Sandomierz, where the mean date moved to 7.4 days earlier, and in Lublin, where the change was 5.9 days. The smallest changes occurred in Puławy (2.6 days) and Kozienice (2.7 days).
An autocorrelation analysis with a one-year lag showed that the temporal correlation between the GSO dates was generally low. The Staszów station had the highest autocorrelation value (0.162), which may indicate some tendency for the dates to repeat in subsequent years. In the case of the Lublin station, by contrast, the correlation was negative (−0.067), suggesting a weakening of a distinct temporal pattern. Nevertheless, all autocorrelation values were statistically insignificant at the 0.05 significance level, meaning that no evident temporal correlation can be inferred at any of the stations.
The Mann–Kendall test showed no significant changes in the dates of the GSO over the period analyzed at the 0.05 level of significance. However, calculations using Sen’s method indicate a potential trend towards an earlier onset of the growing season, with the largest changes recorded at the stations in Lublin and Sandomierz, where they were about −2.0 days per decade. At other stations, the observed shifts were less significant: Kozienice: −0.56 days/10 years, Puławy: −0.35 days/10 years, and Staszów: −0.20 days/10 years.
The result of the Kruskal–Wallis test (H = 6.71, p = 0.152) indicates that the differences between the distributions of the GSO dates at each station are not statistically significant at the 0.05 level. This means that none of the stations is significantly different from the others in terms of these distributions.
3.2. Frequency of Spring Frosts
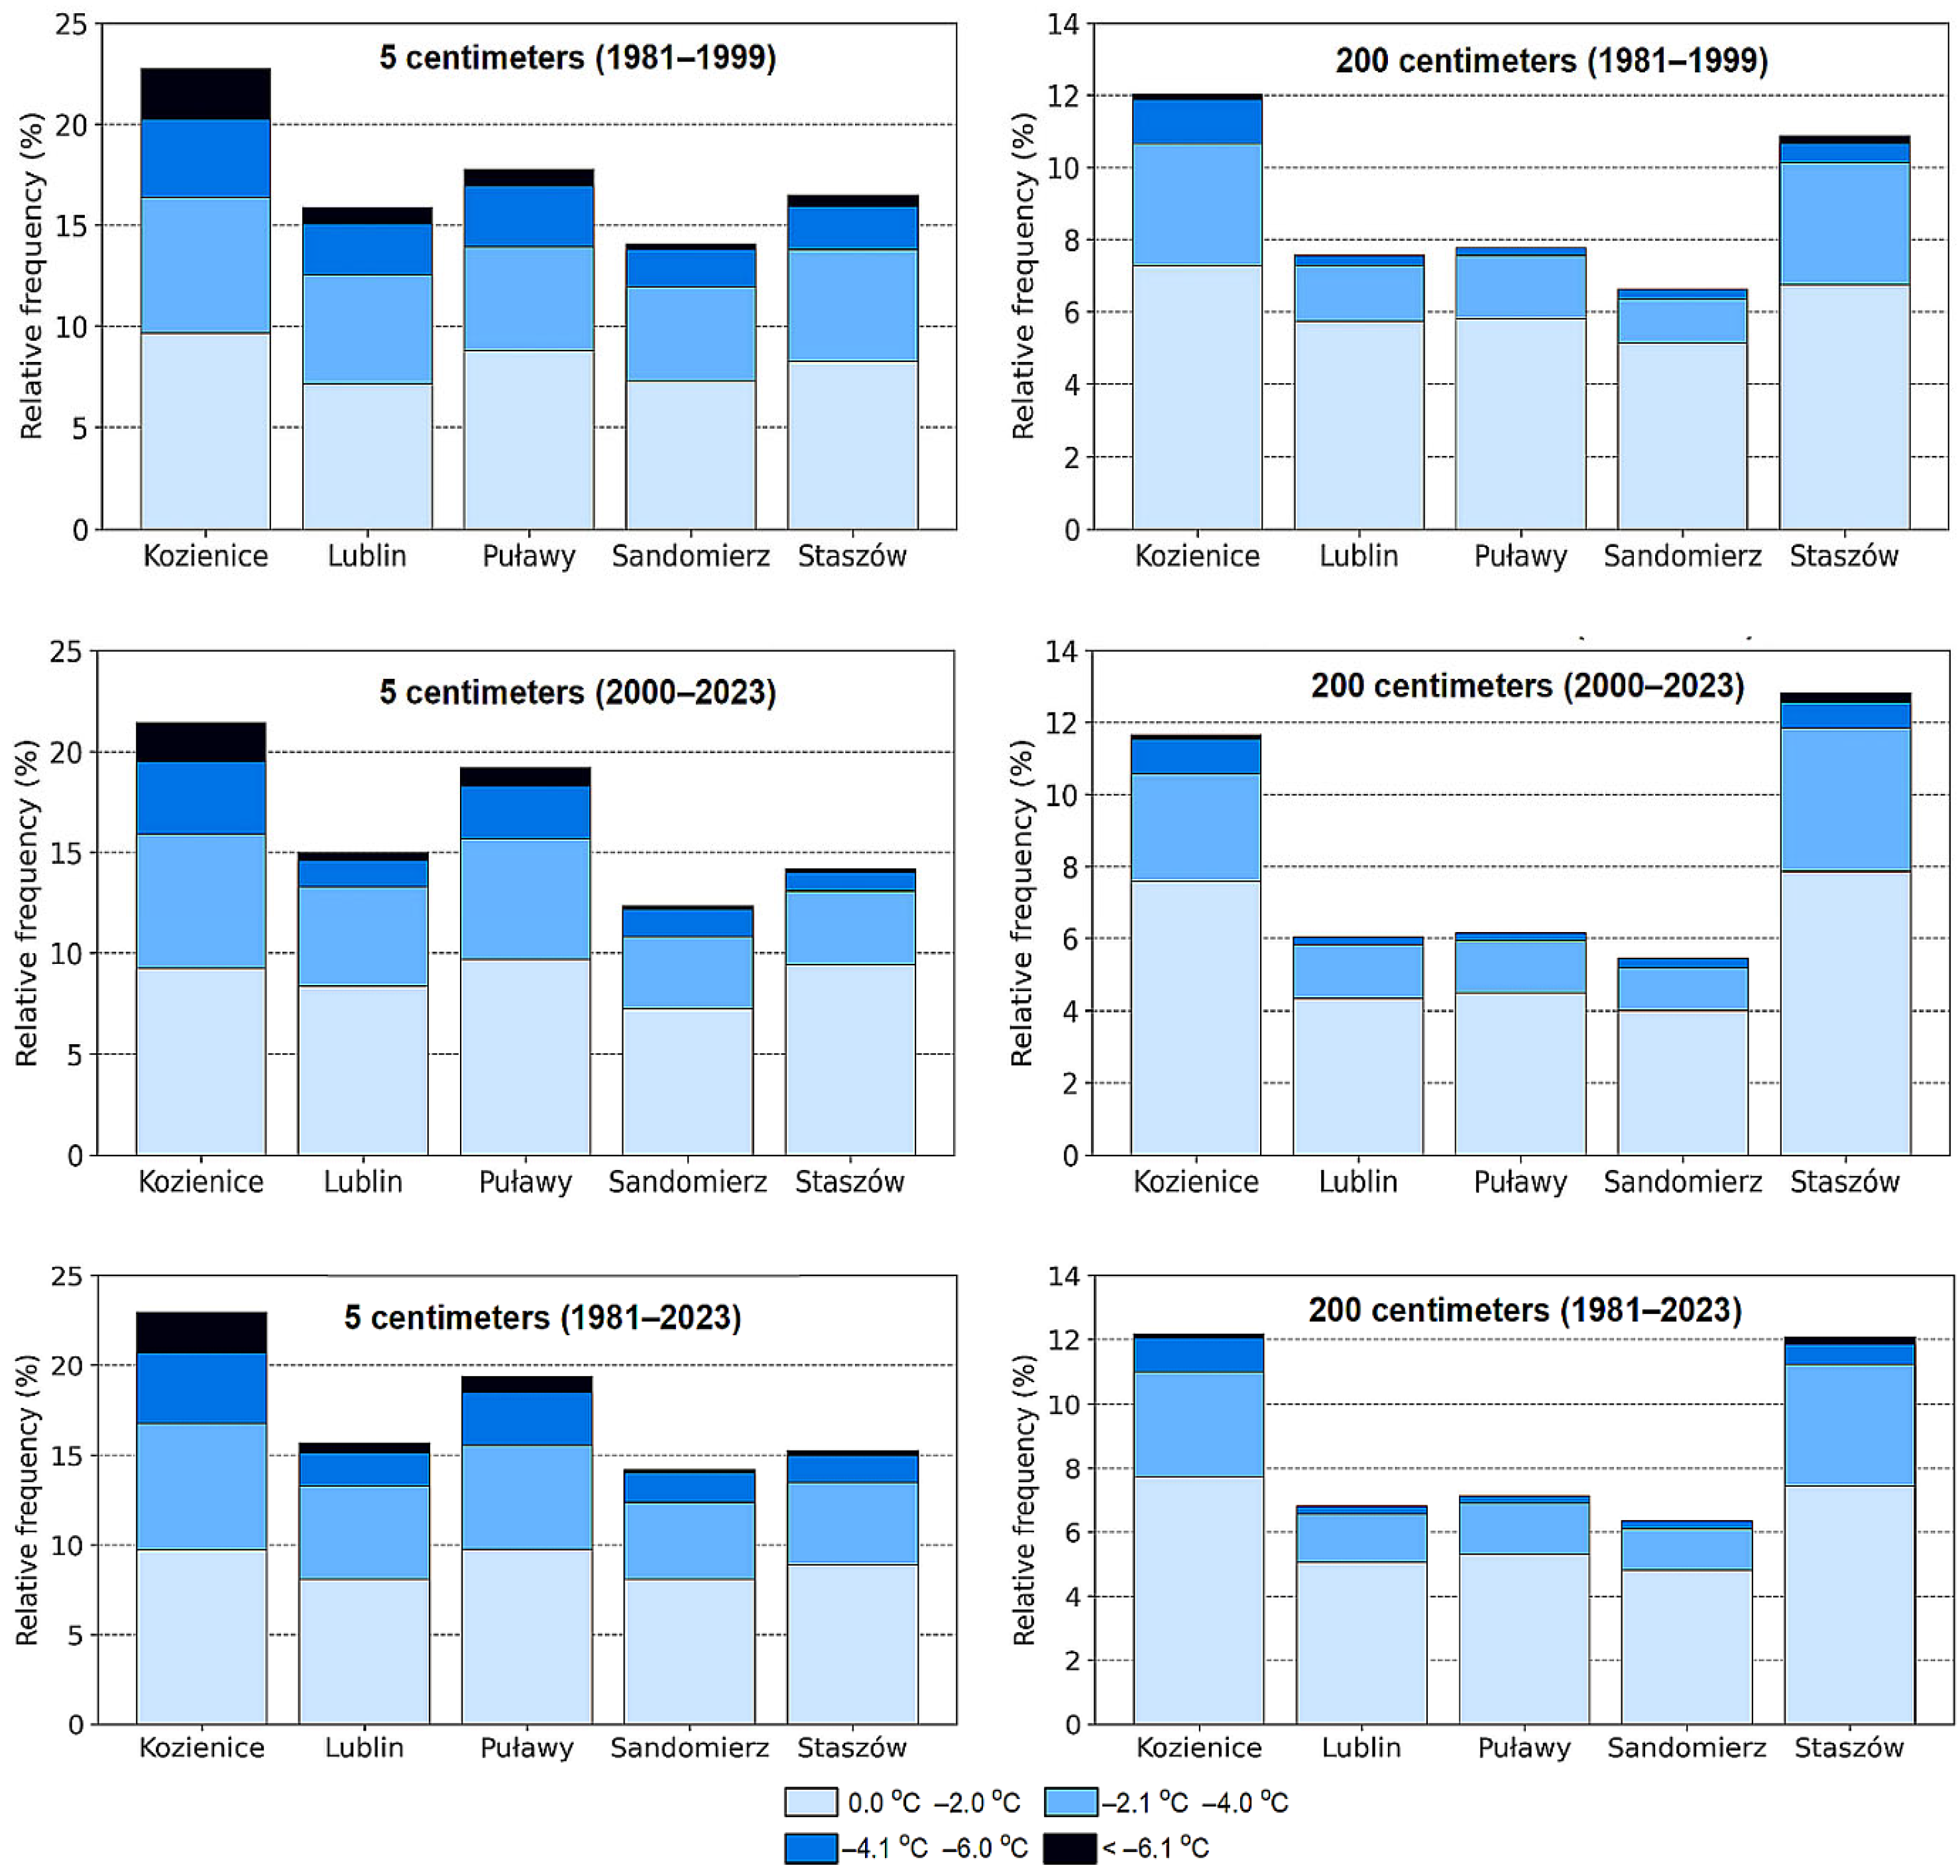
From 1981 to 2023, weak frosts (−2.0 °C to 0.0 °C) predominated at 200 cm (
Figure 3), with the highest relative frequency at all analyzed stations, reaching a maximum of 7.7% in Kozienice and 7.5% in Staszów. The frequency of weak frost at other stations was noticeably lower, with 5.3% in Lublin, 5.0% in Puławy, and 4.8% in Sandomierz. The relative frequency of moderate frosts (−4.0 °C to −2.1 °C) was much lower, reaching the highest values in Staszów (3.8%) and Kozienice (3.2%), and the lowest in Sandomierz (1.3%). Heavy and very heavy frosts (<−4.1 °C) occurred infrequently, only in Kozienice and Staszów.
Frosts were much more frequent at 5 cm than at 200 cm a.g.l. (
Figure 3). Frosts in the range of 0.0 °C to −2.0 °C were most frequent in Puławy (9.7%), followed by Kozienice and Staszów (about 8.9%) in the years 1981–2023. Moderate frost (−2.1 °C to −4.0 °C) was most often recorded in Kozienice (7.1%) and was least frequent in Sandomierz (4.3%). Heavy and very heavy frosts also occurred more frequently than at 200 cm, but their frequency was significantly lower than for the previously mentioned frost ranges, reaching a maximum of 3.9% in Kozienice.
A comparison of the periods 1981–1999 and 2000–2023 reveals a noticeable decreasing trend in frost frequency (
Figure 4), especially those of greater severity. At a height of 5 cm in Kozienice, the frequency of frost in the range of −4.0 °C to −2.1 °C decreased from 6.7% to 6.6%, and for the range of −6.0 °C to−4.1 °C, this decreased from 3.8% to 3.6%. In Lublin, the largest decrease in frequency was for heavy frosts (−6.0 °C to −4.1 °C), which had a frequency of 2.5% between 1981 and 1999, and only 1.3% after the year 2000. In Staszów, in turn, a significant decrease in frost frequency was evident, in the range of −4.0 °C to −2.1 °C (from 5.5% to 3.7%) and in the−6.0 °C to −4.1 °C range (from 2.2% to 0.9%).
At a height of 200 cm a.g.l., the changes in frost frequency during the analyzed period were different at each station compared to the changes in frequency at a height of 5 cm (especially in the last 30 years) (
Figure 4). In Kozienice, the frequency of spring frosts in the −2.0 °C to 0.0 °C range decreased from 7.6% in 1981–1999 to 7.3% in 2000–2023, while in the −6.0 °C to −4.1 °C range it increased from 1.0% to 1.2%. In Lublin, the frequency of frosts in the −4.0 °C to −2.1 °C range increased slightly from 1.5% to 1.6%, but stronger frosts (<−4.1 °C) did not occur. The higher decrease in the frequency of moderate frosts (by 0.6%) was recorded in Staszów.
3.3. Atmospheric Circulation Conditions During Spring Frosts
Considering the possibility of changes in the thermal properties of the air masses during the spring period, the circulation conditions were also analyzed separately for two periods from 1 March to 14 April and from 15 April to 31 May. The occurrence of frost at 5 cm at all stations is almost always accompanied by frost at 200 cm. Therefore, the analysis of the circulation determinants of frost was conducted for the cases of frost occurrence at 5 cm a.g.l.
From the point of view of forecasting and the possibility of changes in thermal conditions during the spring, it seems important to analyze the spatial distribution of the pressure that favors the occurrence of frost. The EOFs method was used to identify such distributions. EOFs analysis was performed to identify dominant spatial patterns in the spatial distribution of Z850 during spring frosts and stronger frosts (≤−2 °C). The division of the whole spring into two periods was motivated by the need to check for a possible change in atmospheric circulation conditions favorable to frost. The analyzed period was divided into two periods from 1981 to 1999 and from 2000 to 2023. This division was intended to assess potential changes in backward trajectories during frosts in both periods.
3.3.1. EOFs Spatial Patterns of Geopotential Height Anomalies at the 850 hPa Level
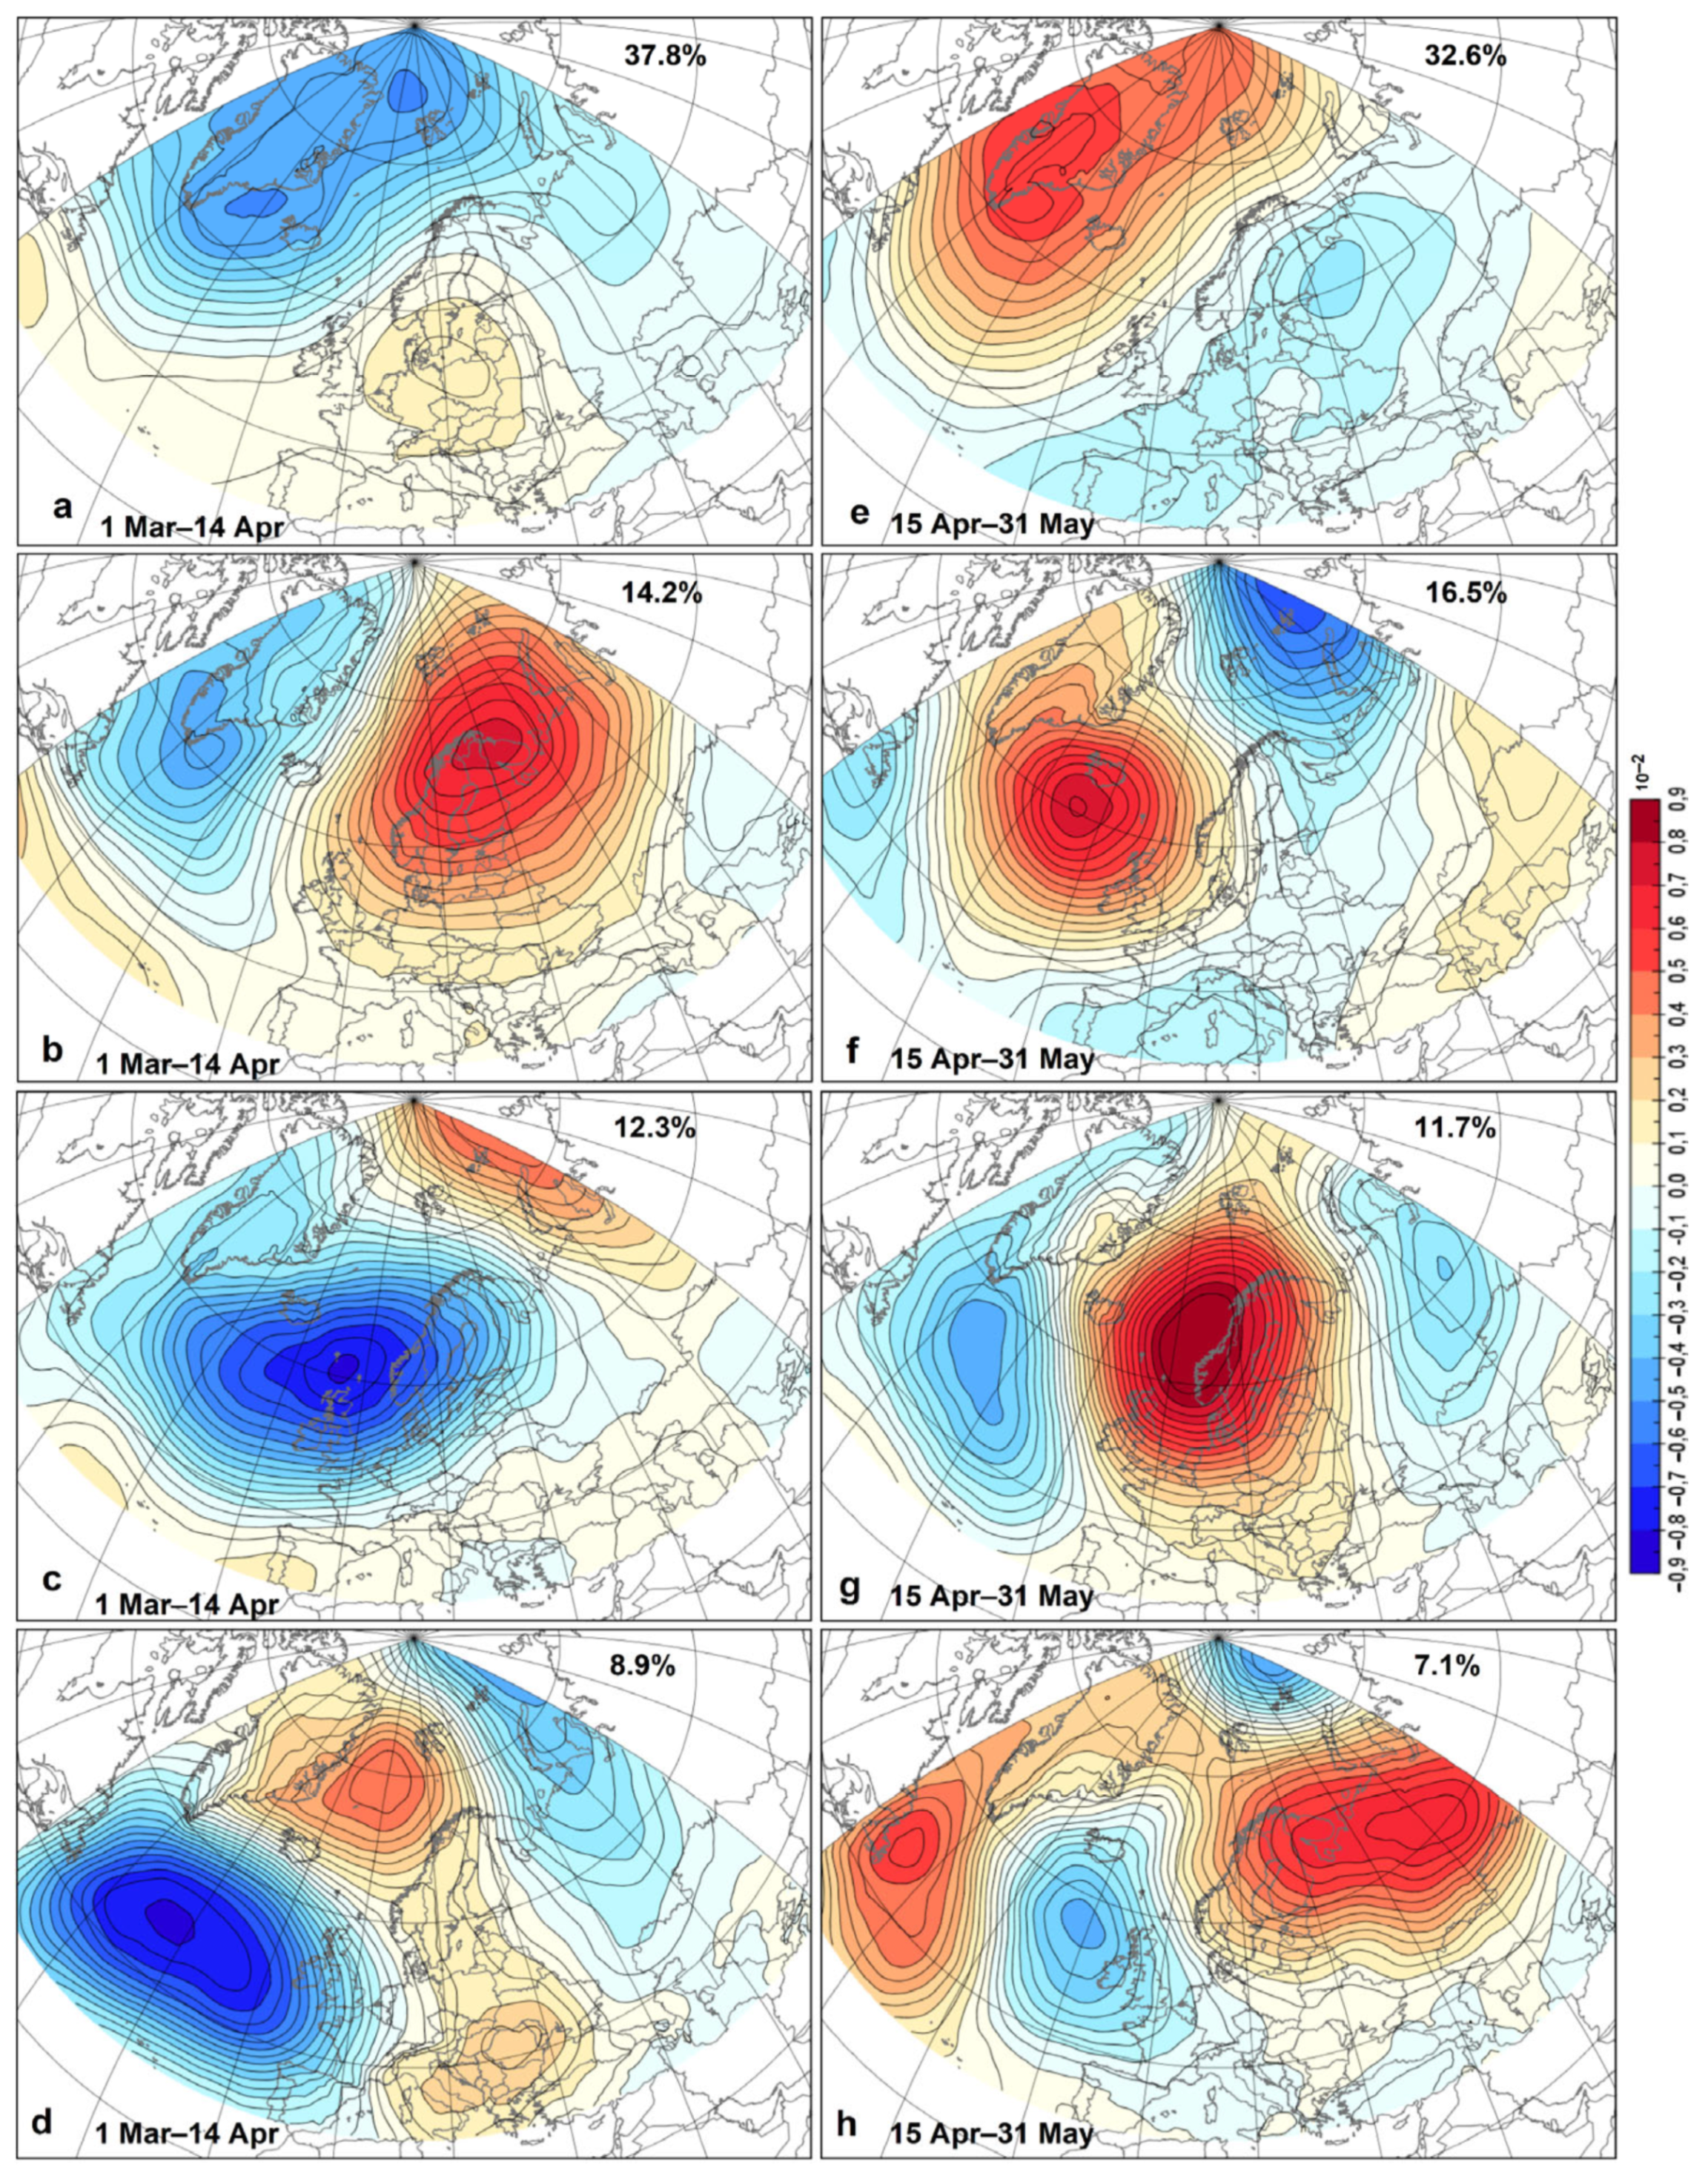
The first spatial pattern (
Figure 5a) in the period from March 1 to April 14, where the high extends over central Europe, explains 37.8% of the total variance. This type of synoptic situation is usually conducive to the persistence of certain air masses over Poland for a longer period and the strong radiation of heat from the ground in the night. The next spatial pattern (
Figure 5b) illustrates the situation, during which the airflow over the study area is controlled by a very strongly developed anticyclone over Scandinavia, which conditions the inflow of polar continental air masses from the east. A well-developed low with the center over Scotland (
Figure 5c), which extends over the area of Poland, favors the inflow of air masses from the southwest from over Canada across the Atlantic. The fourth mode (
Figure 5d) shows the barometric col centered over the Baltic Sea with weak pressure gradients over the area of Poland. Since mid-April, most of the total variance (32.6%) is explained by the weak-gradient situation over the analyzed area, where Z850 anomalies are slightly higher compared to surrounding areas (
Figure 5e). The distribution of anomalies in the next pattern (
Figure 5f) causes an inflow of Arctic air masses over Poland from the north along the east coast of Greenland. The inflow of Arctic air masses is also favored by the pattern shown in
Figure 5g. A well-developed anticyclone with its center located northeast of the analyzed area (
Figure 5h) in the second half of the spring period allows the inflow of polar continental air masses from the east.
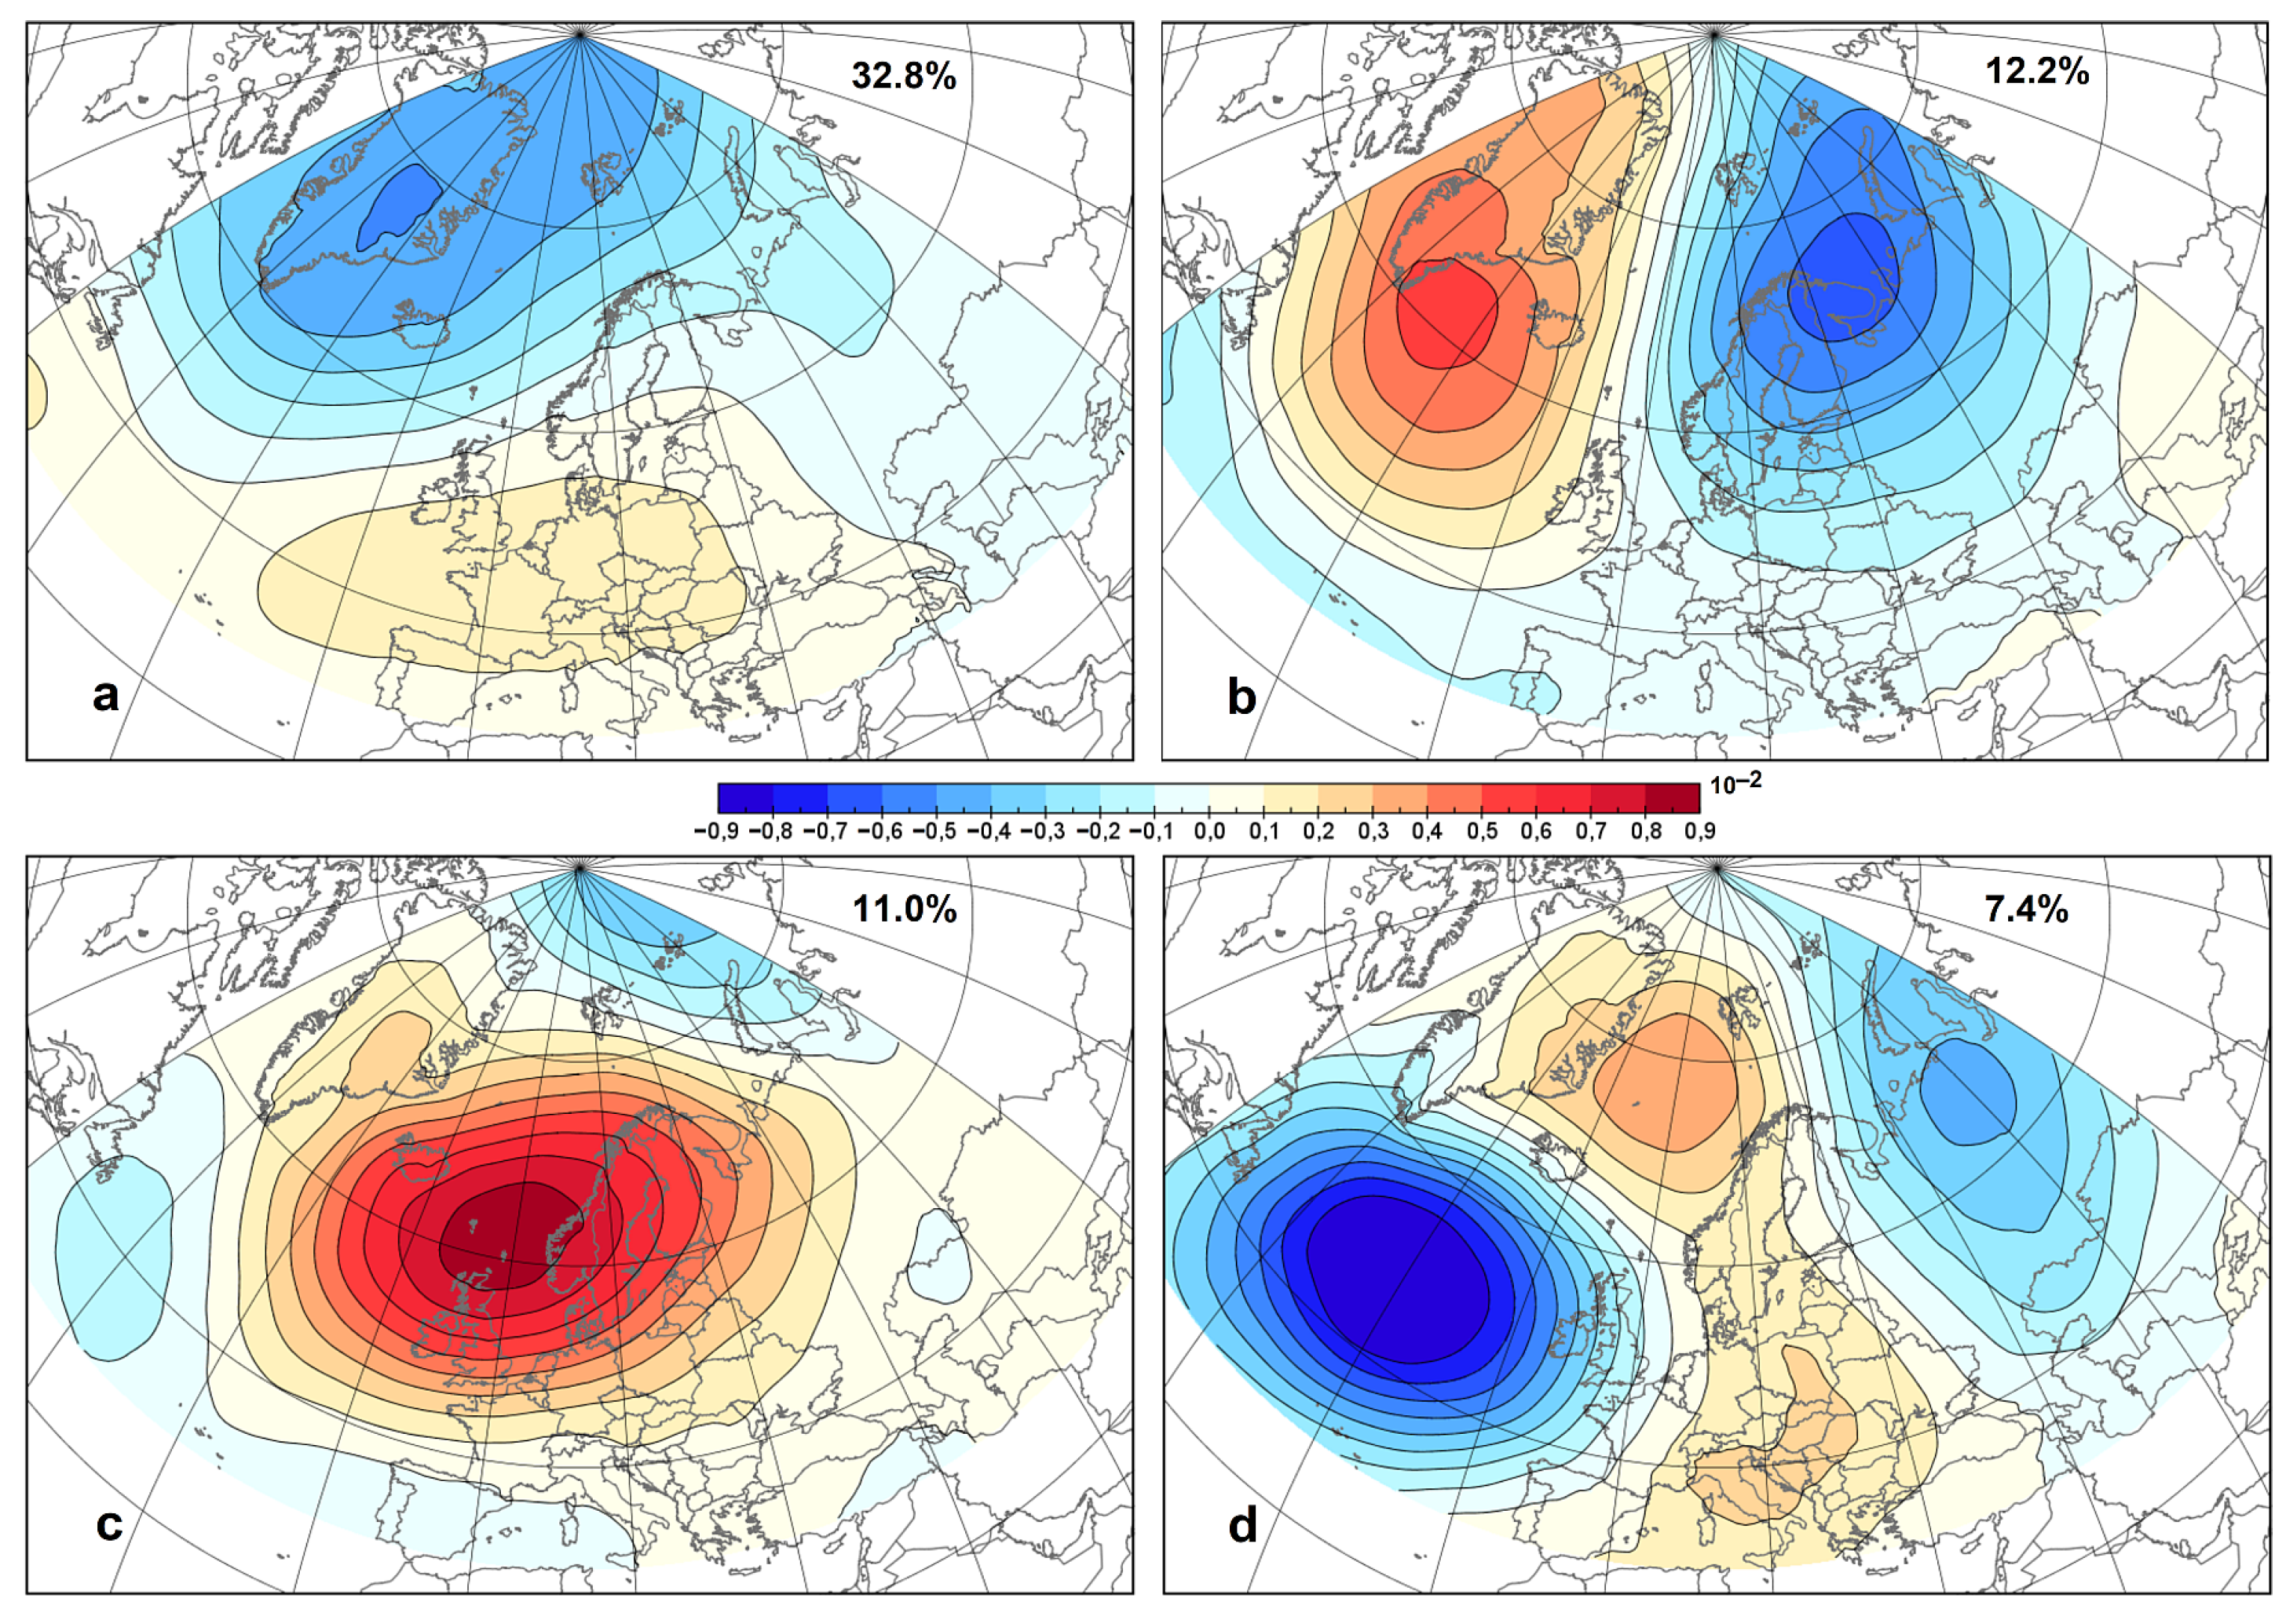
Stronger frosts are the most dangerous for plants, so a similar analysis based on the EOFs method was performed for situations where the minimum temperature fell below −2 °C (
Figure 6).
Comparing the baric situations in
Figure 5h and
Figure 6a, differences can be seen. Most of the total variance (32.8%) is explained by the pattern of positive Z850 anomalies over western and central Europe (
Figure 6a). Distribution of Z850 anomalies in the spatial pattern in
Figure 6b favors the advection of Arctic air masses. The air flow from the east is favored by a pattern with a strongly developed anticyclone with a center at the northern edge of the North Sea (
Figure 6c). The high-pressure system, which is part of the col, also covers the area of Poland in the case of the last mode (
Figure 6d). This type of situation usually favors the occurrence of radiation frost.
3.3.2. Backward Trajectorys Clusters
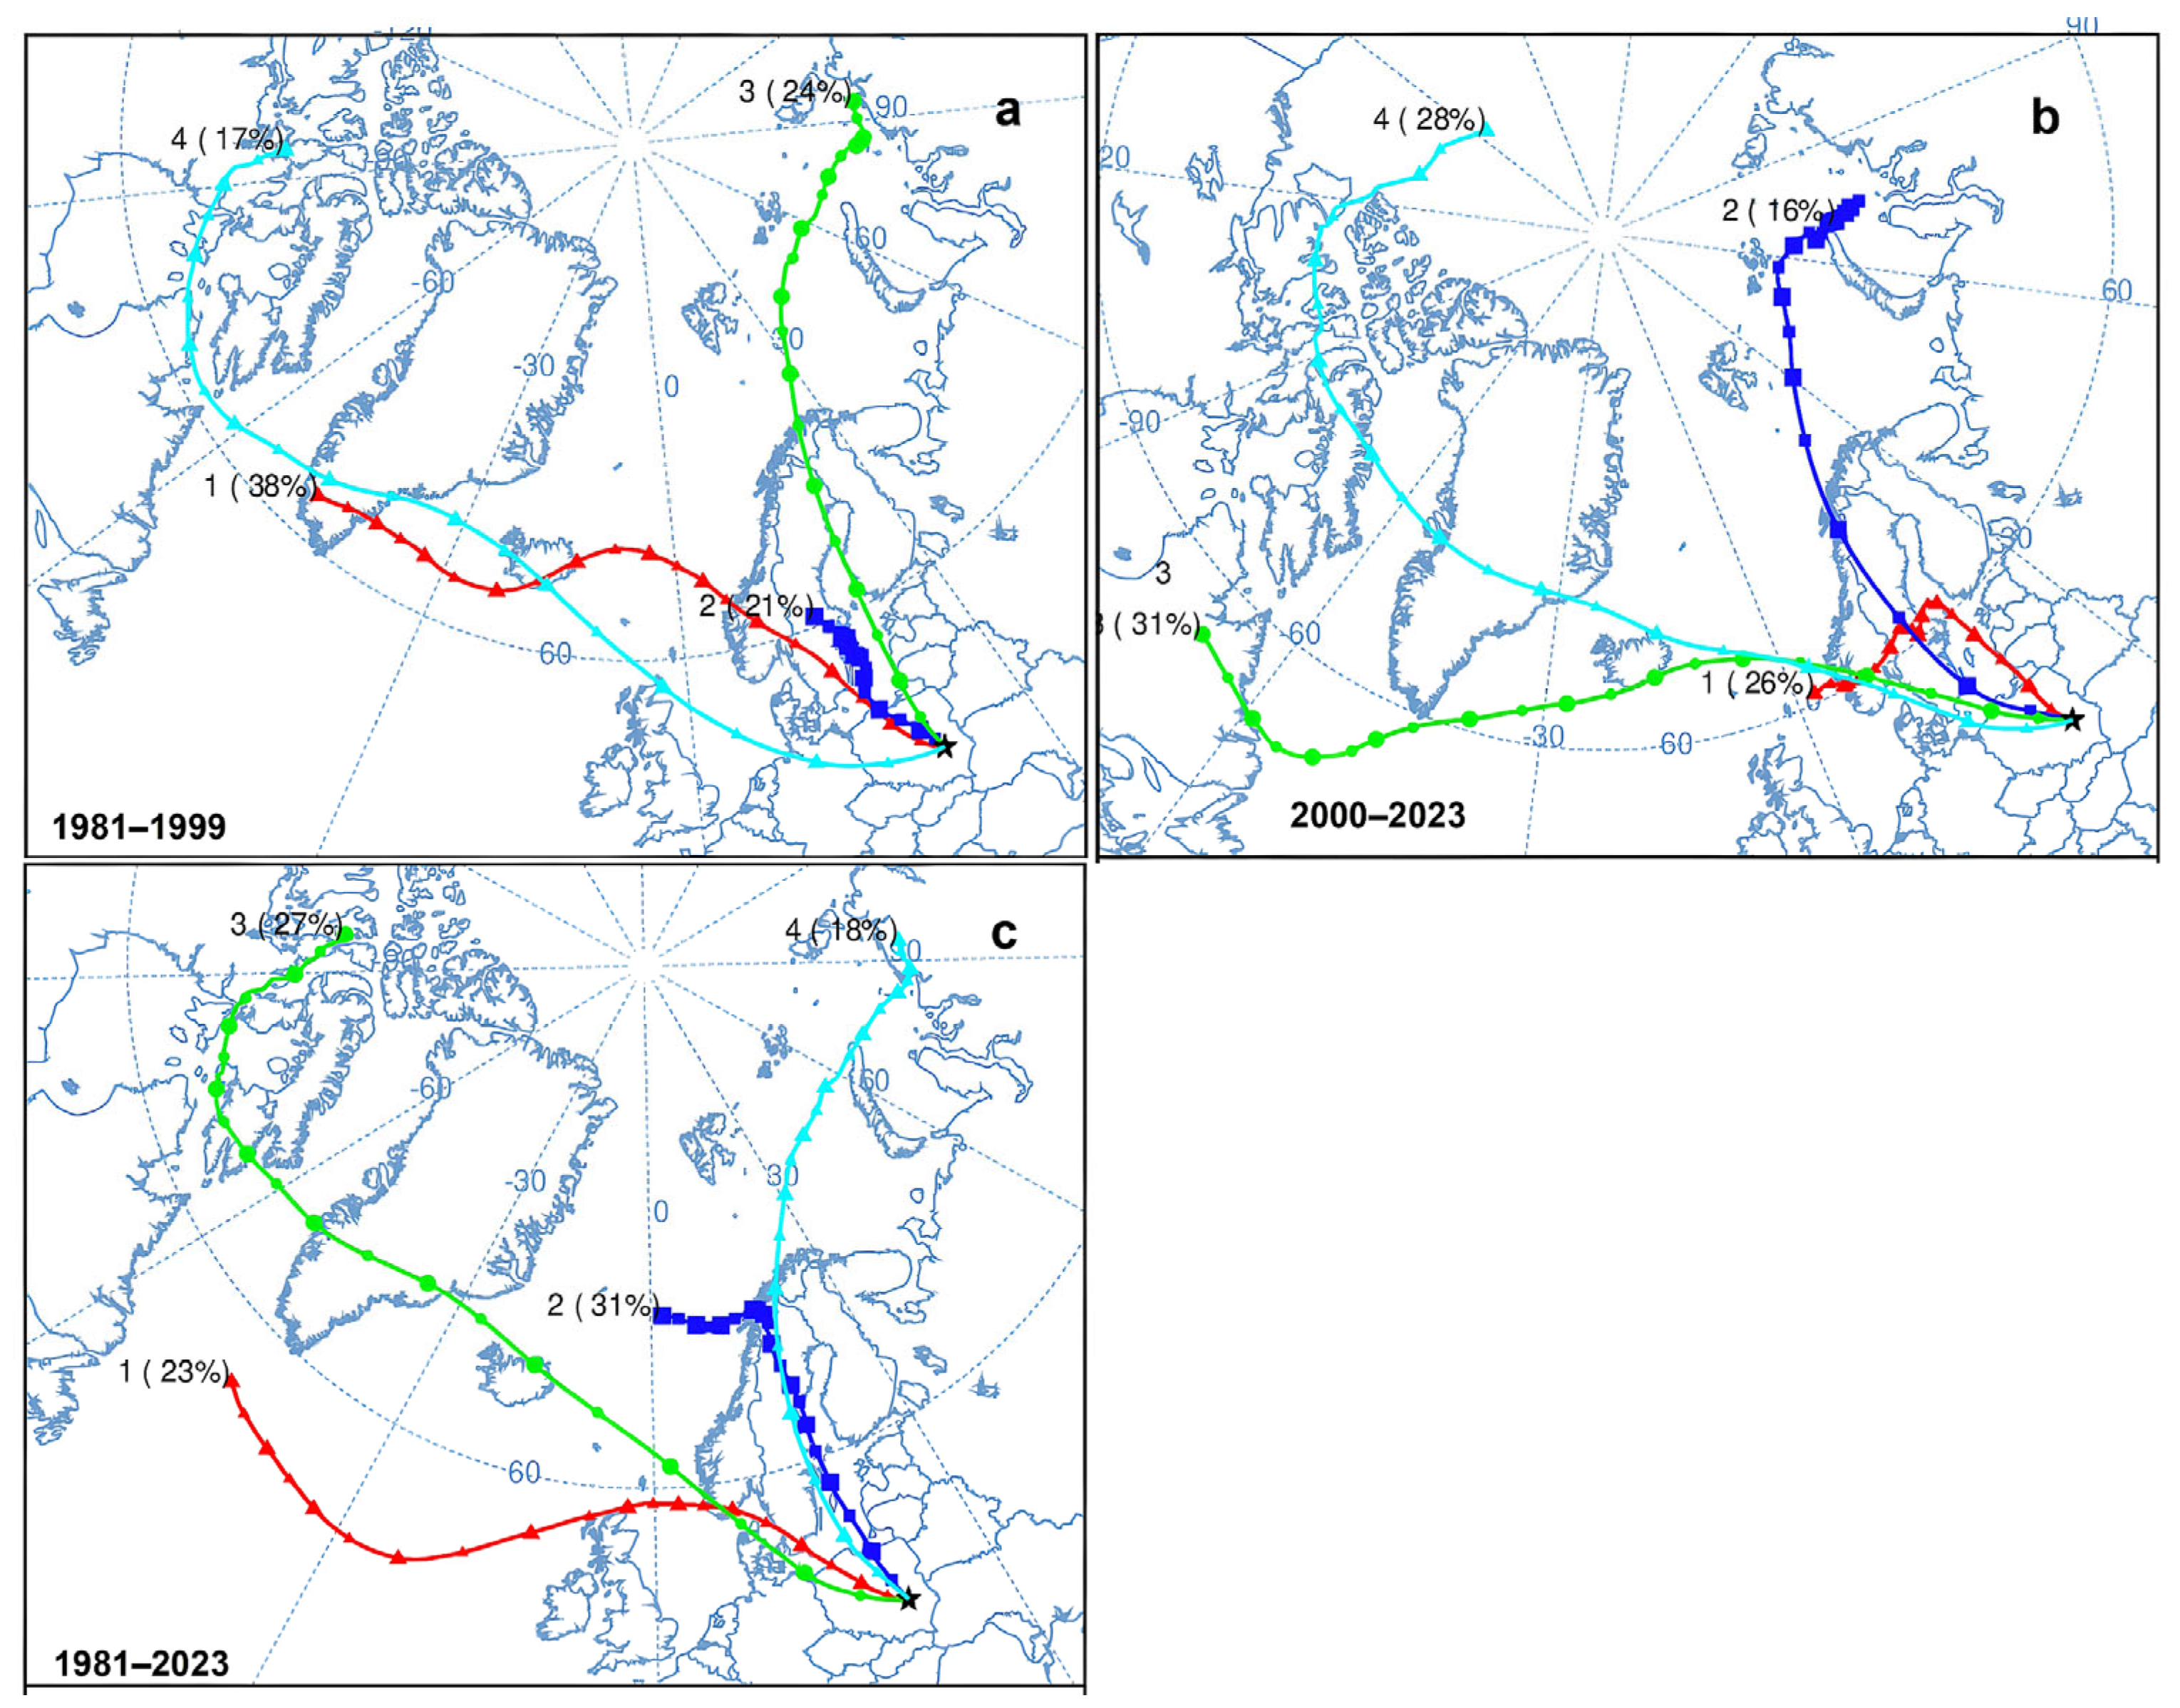
BTCs in the periods 1981–1999 and 2000–2023 show similar patterns (
Figure 7a,b). There are only some differences in the frequency of BTCs with a similar course. BTCs 1 and 4 (
Figure 7a) ran close to each other near Greenland and together accounted for 55% of all BTCs in 1981–1999. Their trajectories changed as they approach Europe. Over Poland, the BTC 1 came from the north, while the BTC 4 came from the west. BTC 2 was very short, indicating the stagnation of the air masses. A short BTC also appeared in 2000–2023, but its percentage was 5% higher compared to 1981–1999. BTCs over the eastern Arctic were very similar in both periods (
Figure 7a,b). The inflow of air masses from this region had a higher percentage (by 8%) in 1981–1999 compared to 2000–2023. Over the whole period analyzed (1981–2023), the highest percentage was attributed to BTC 2 (31%), which was short and spanned the northern ends of Scandinavia 10 days earlier. A slightly lower percentage was attributed to BTC 3, which spanned Canada. Considering the 10-day backward trajectories, it is difficult to locate the earlier start of BTC 1, which crossed the Atlantic 6 to 10 days prior, south of Greenland and Iceland (
Figure 7a). The lowest percentage (18%) between 1981 and 1999 was for BTC 4, which crossed Scandinavia and the southeastern Arctic Ocean.
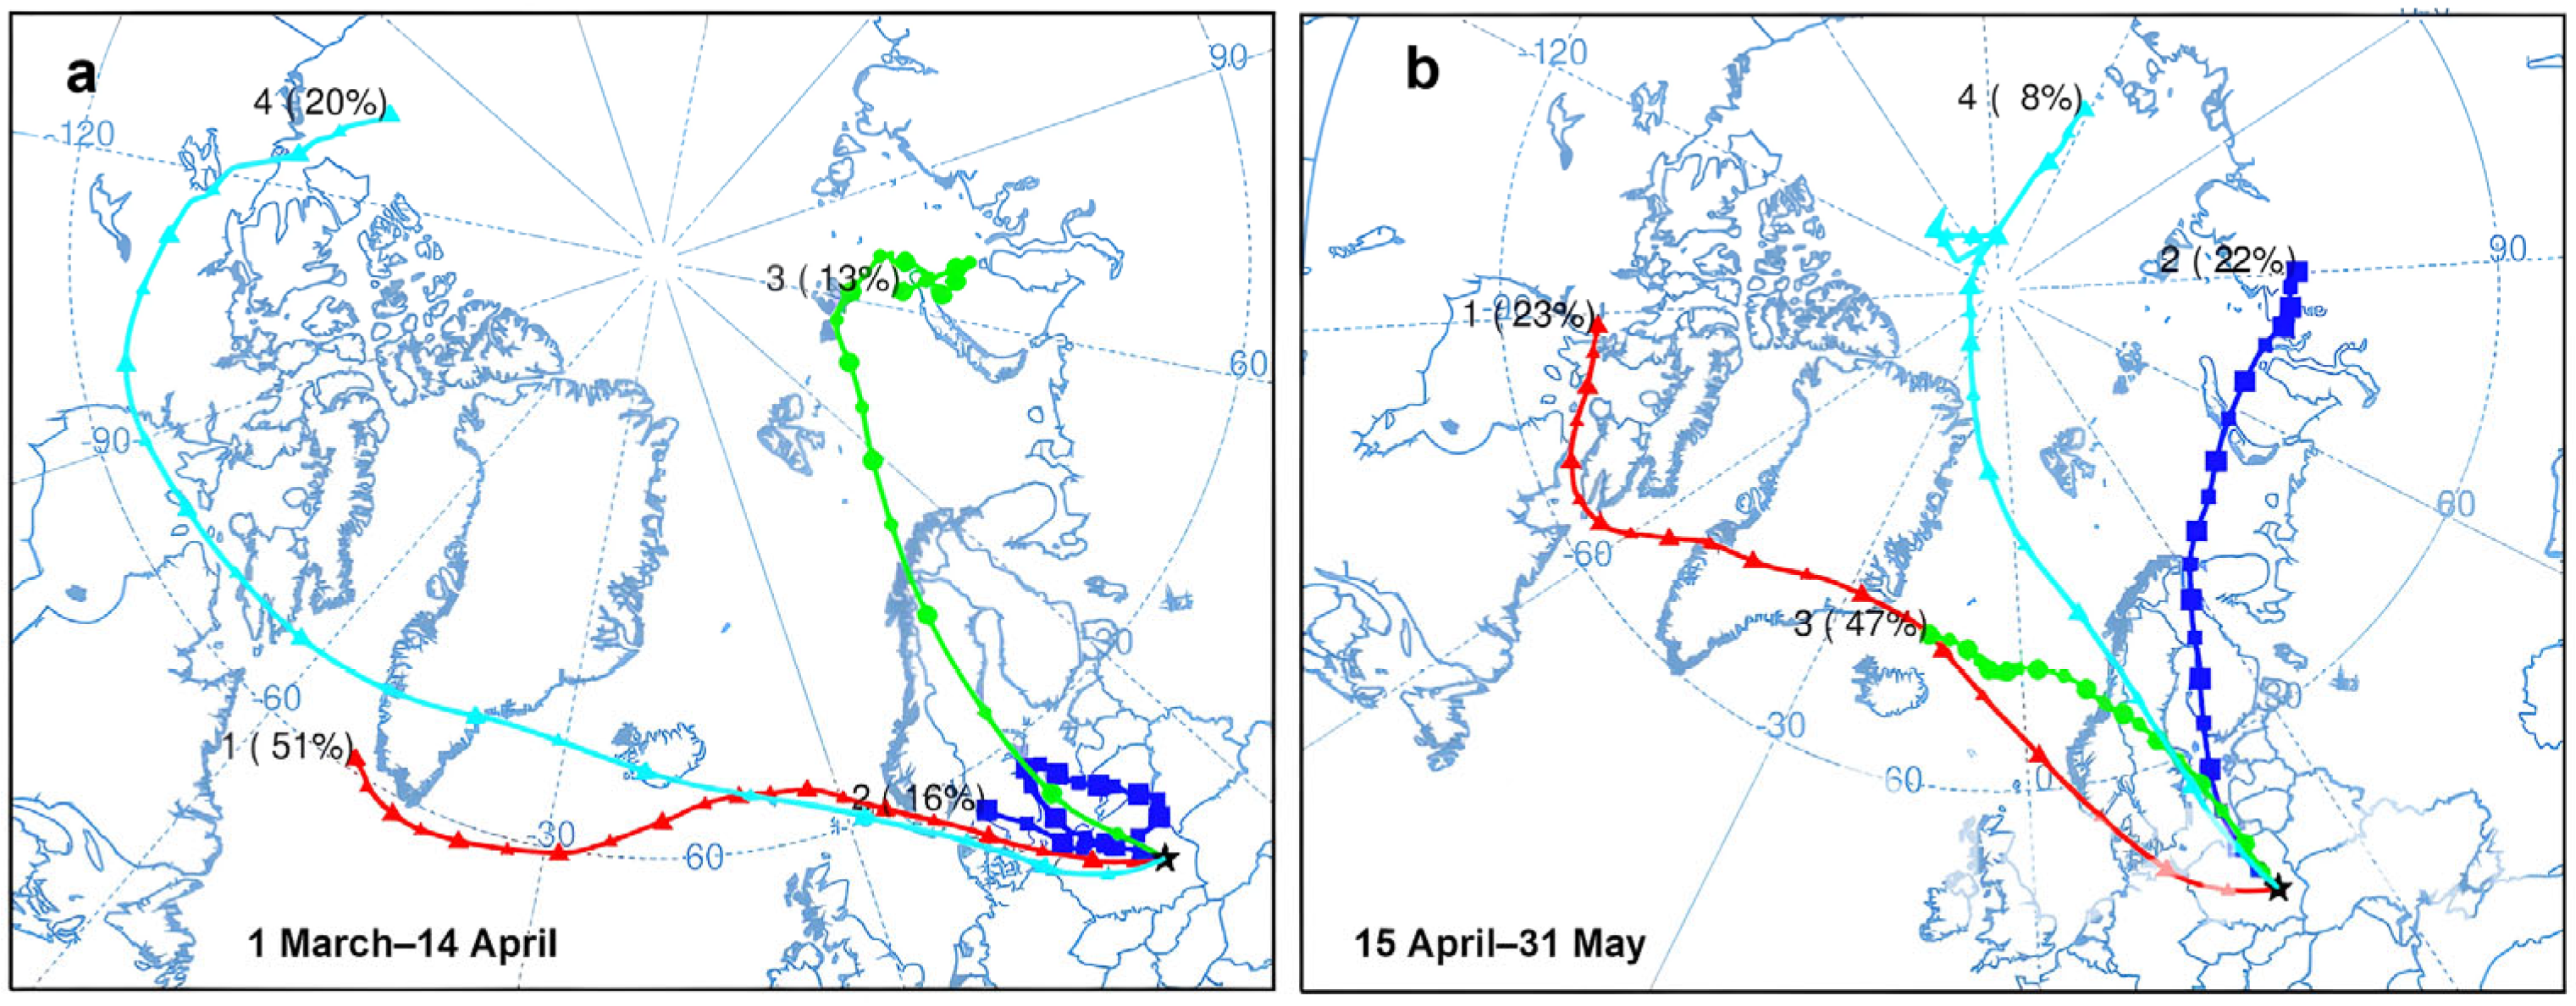
Frosts in the first half of spring were associated with a short BTC 2, which corresponds to stable high-pressure systems (
Figure 8a). In the second half of spring, ground-level frosts occurred mostly during the inflow of air masses from the Arctic. The percentage of BTCs from the Greenland area and its east coast together accounted for 70%. In the second half of spring, the percentage of BTCs crossing the Southeast and East Arctic increased slightly (by 9%).
4. Discussion and Conclusions
The results show a decrease in the frequency of spring frosts in southeastern Poland since the 1990s, despite an earlier onset of the growing season. A statistically insignificant trend towards the earlier occurrence of the GSO was observed at all stations, which may be a consequence of a warming climate. During the study period, the dates of the GSO moved a maximum of 2 days earlier per decade. This is a moderate trend compared to other regions of Europe, including Poland [
2,
12].
The highest incidence of frost, both ground-level frost and frost at a height of 200 cm a.g.l., was recorded in the northwestern part of the study area, while the highest multi-year variability of ground-level frosts was recorded at stations located in its southwestern part. These differences may be due to local microclimatic conditions related to terrain and land cover. Despite the overall downward trend, the risk of frost remains a significant threat, especially in the context of an increasingly early onset of the growing season [
36,
37]. In Germany and Switzerland, despite an increase in the average spring temperature, the risk of frost and its impact on vegetation has remained similar over the past 150 years [
38]. Projections indicate that in Switzerland, by the middle of the 21st century, spring could start up to 12 days earlier in the RCP 8.5 scenario [
39]. A similar scenario could also apply to the study area given the rate of global warming in Poland, leading to an increased risk of frost.
The analysis of the circulation conditions showed a change in thermal properties of the air masses over the study area. In the second half of spring, there is a decrease in the frequency of synoptic situations favoring frost associated with the advection of polar continental air. This is a result of the warming of the land areas of eastern Europe with the lengthening of the daylight and increased solar radiation, as well as changes in the structure of the baric systems [
40,
41]. The increase in solar radiation in the second half of spring also leads to less frequent frosts during a stable anticyclone over the study area.
The analysis by the BTC method has identified the main trajectories of inflow of air masses during frosts. In both periods analyzed (1981–1999 and 2000–2023), the four clusters of trajectories identified were similar, differing only in their percentages. The highest difference was observed in the BTC crossing the southeastern and eastern parts of the Arctic Ocean, which has decreased by 8% in recent decades. This may partly explain the observed decrease in frost frequency since the 1990s.
Most of the total variance (by the use of the EOF method) in the first half of spring is associated with an anticyclone centrally located over Poland, which is weaker in the pressure field of the first mode in the second half of spring. This type of synoptic situation is, in most cases, preceded by an anticyclonic circulation from the northern sector [
42]. An anticyclone over Poland favors the cooling of air masses at night and the persistence of frosts for an extended period, especially in early spring. These results confirm the results of earlier studies on Central Europe, indicating the important role of anticyclonic situations in generating the lowest air temperature [
17,
43].
Analysis of circulation conditions indicates a significant proportion of frosts associated with the advection of Arctic air masses. The source area of these air masses is distinguished by exceptional warming. The Arctic region becomes warmer (0.75 °C per decade) at a rate that is almost four times faster than the global mean [
44]. High temperature increases in the Arctic have led to the considerable rise in geopotential height over the region via the less-dense air, which reduced the meridional geopotential height gradient and weakened the upper-level westerly winds [
45,
46]. This may lead to more-frequent cold waves at lower latitudes. Arctic warming is accompanied by a loss of ice mass in the Arctic Ocean, resulting in changes in the teleconnection patterns [
47,
48]. Ice mass loss has been observed since the early 1990s [
49], which also coincides with a decrease in the frequency of frosts in southeastern Poland. Whether this is just a coincidence or whether there is a correlation between Arctic ice loss and frost frequency requires additional analysis. A consequence of the observed changes in the Arctic and their connections with the atmospheric circulation may be a potential reduction in the threat of frost during the advection of Arctic maritime air masses. On the other hand, the weakening of the polar vortex may, with a favorable pressure distribution, promote more-frequent occurrence of cold waves over Central Europe.
In the context of agriculture and climate change, frost continues to pose a significant threat to crops, especially those that are highly sensitive to low temperatures, such as fruit trees [
20,
50]. The analysis showed that an early onset of the growing season increases the risk of crop damage from late spring frosts, as plants enter critical development stages with a higher probability of occurrence. Despite a decrease in the number of frost days, their impact may increase due to earlier plant development and shifts in atmospheric circulation. The predicted further increase in air temperature may lead to a further extension of the growing season but, at the same time, requires the implementation of adaptation steps, such as protecting crops from frosts and monitoring synoptic conditions that favor its occurrence [
12,
39]. An analysis of the BTCs in the second half of spring suggests a potential reduction in frost risk. It showed that Arctic air masses have the most significant influence on the occurrence of frost in the second half of spring. Further warming of the Arctic may lead to a reduction in the risk of frost in the second half of spring, especially of high intensity.
In conclusion, although there is a general downward trend in the frequency of frosts, this does not mean that the risk of their occurrence has been eliminated. Changes in atmospheric circulation, including modification of the trajectory of incoming air masses and warming of source areas, can affect local thermal conditions. Projections suggest that an earlier onset of the growing season may increase plant sensitivity to late spring frosts. In the context of climate change, further research is needed on the circulation mechanisms influencing frost occurrence.

