From the perspective of the subsurface environment, the typical water body stations are close to the water sources, which provides obvious advantages regarding water vapor supply. However, the humidity effect characteristics of the six typical water body stations do not share a uniform pattern. It is obvious that the humidity effect of the local environment around a water body is more complex than traditionally understood. The urban/rural background environment in which the water body is situated, the relative position of the station and the water body, the macro wind field, the local water and overland winds caused by the diurnal temperature difference, and other factors all influence the characterization of humidity effects.
3.3.1. Differences Between Urban and Suburban Environments
Studies of urban dry and wet islands have shown that sites located in urban centers and urban fringes (suburbs), respectively, show significant differences in humidity [
43]. The roughness of the subsurface in densely built-up urban center areas is much greater than that in the suburbs. Under the same meteorological conditions, the mechanical turbulence within a city is stronger than that in the suburbs. Together with the heat island effect of urban buildings, this contributes to the development of thermal turbulence, resulting in significantly lower humidity in the urban center than in the urban suburbs [
44].
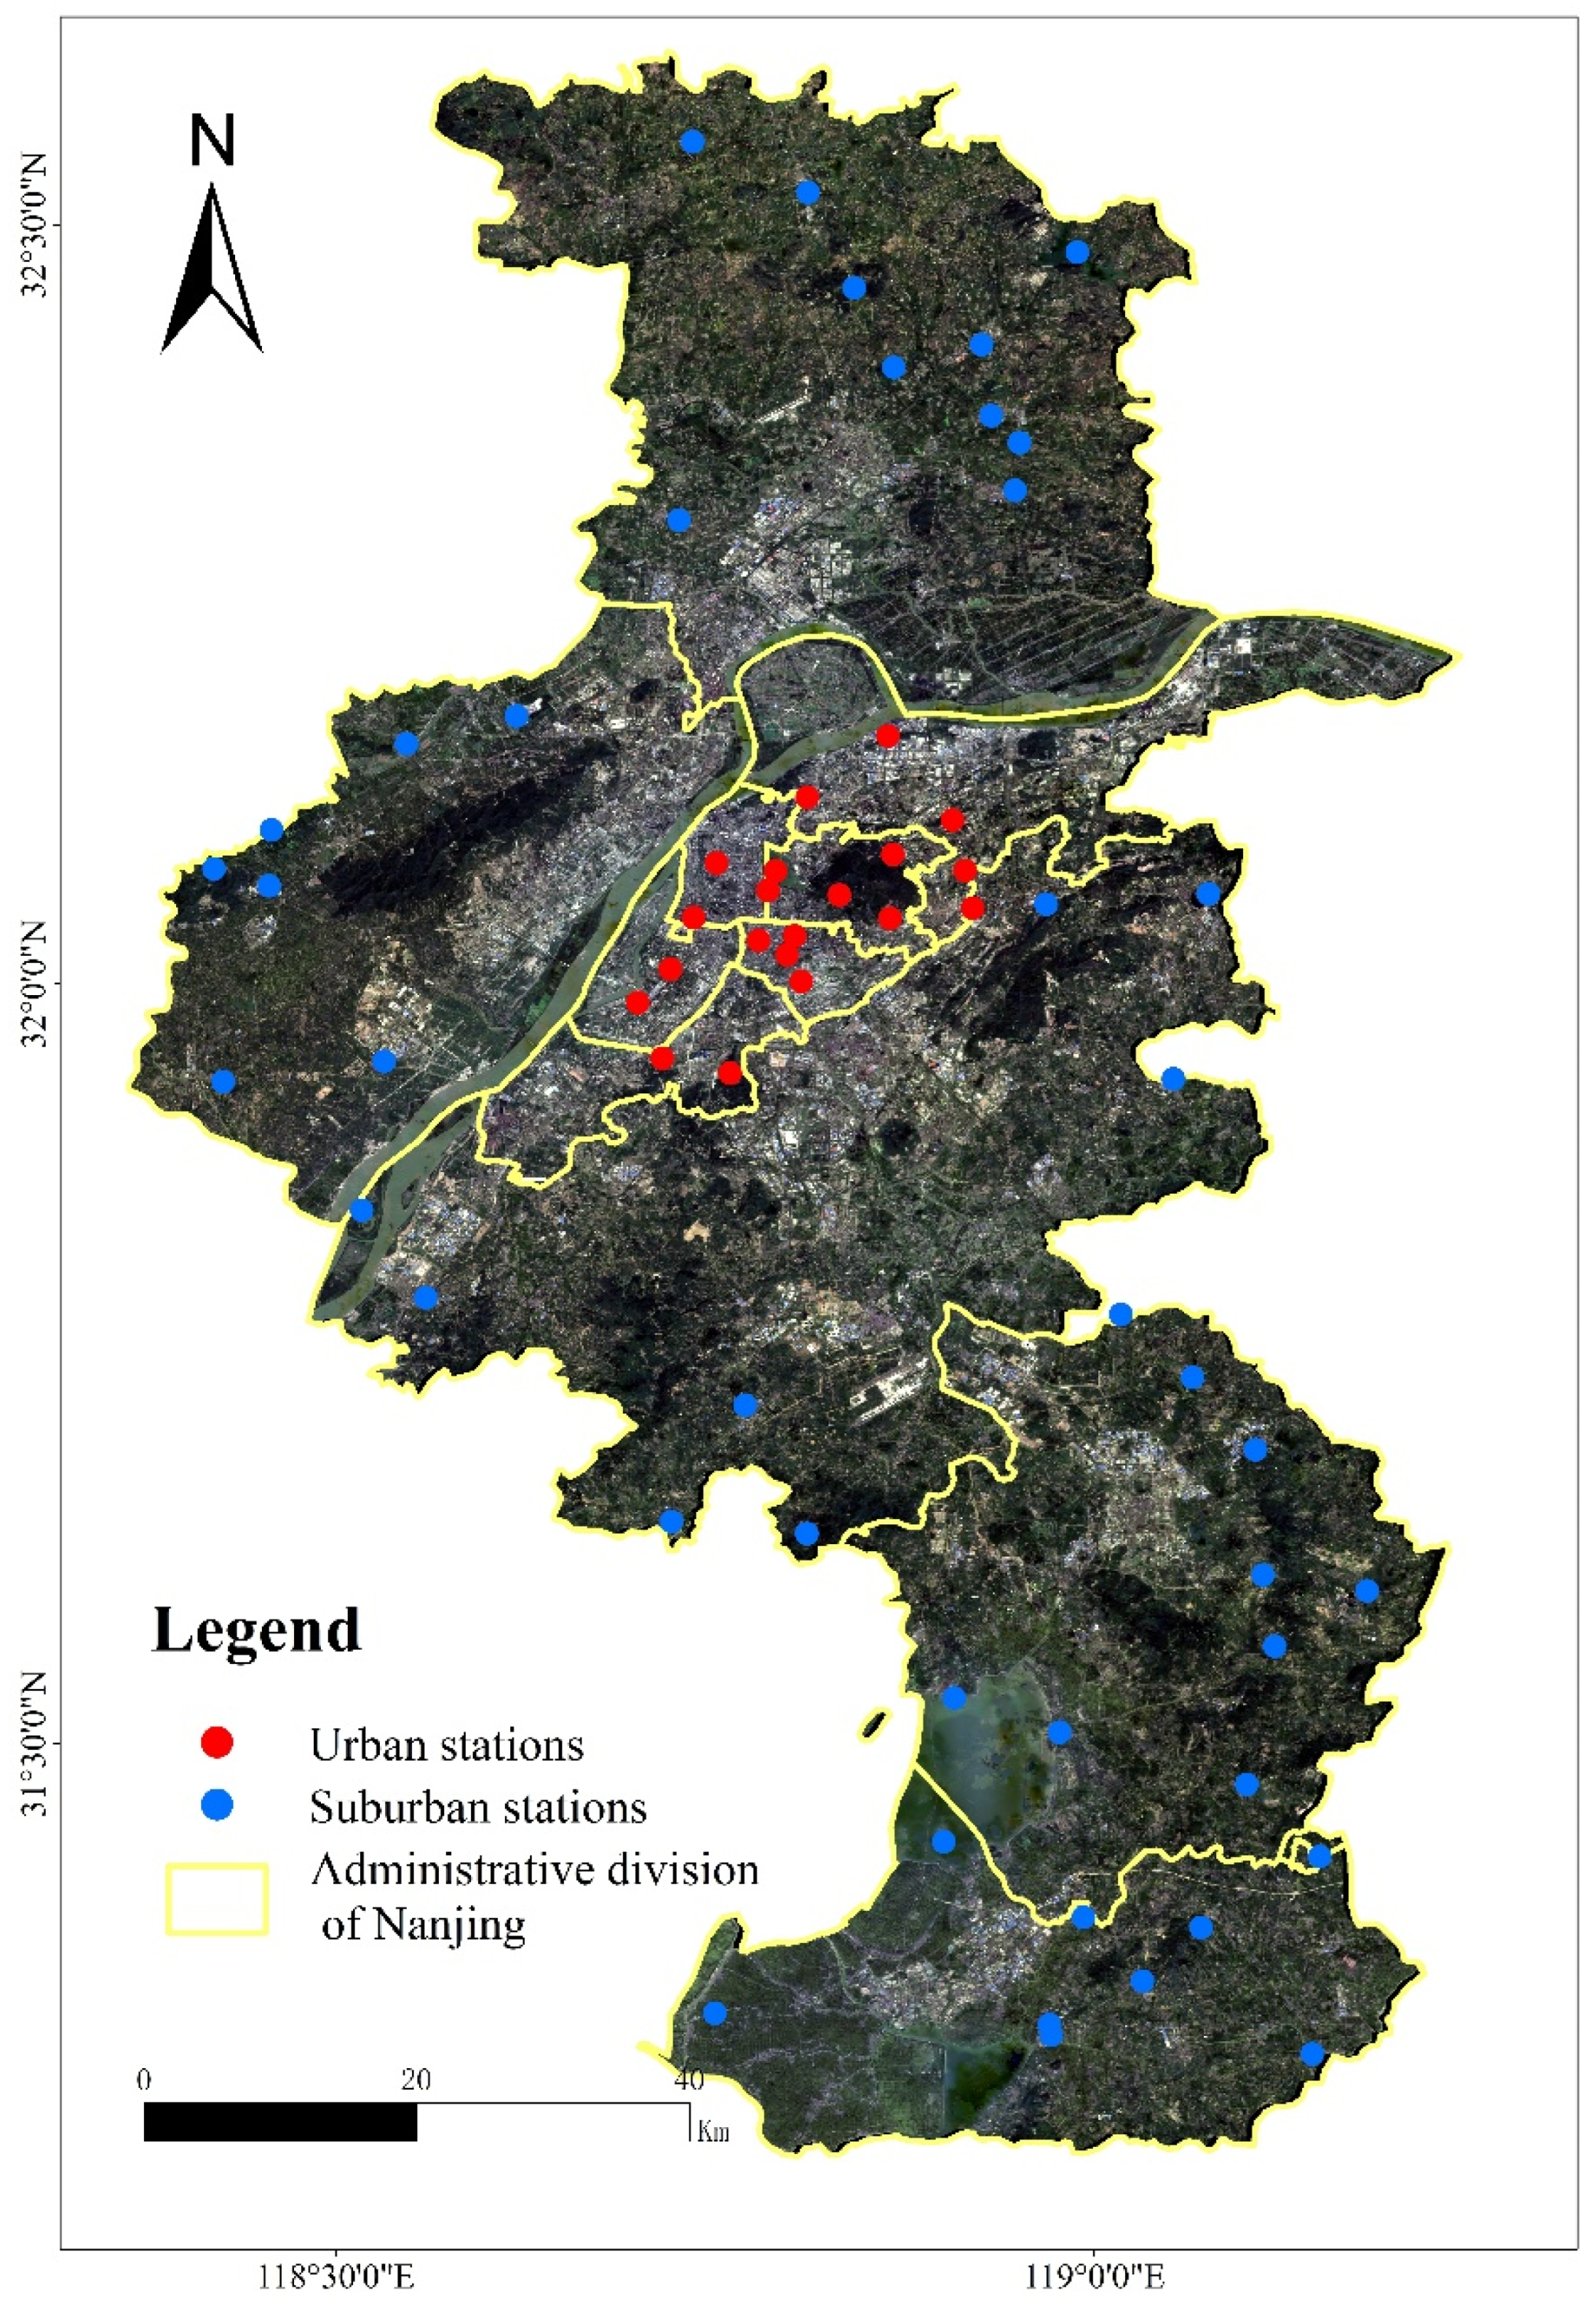
By combining building density data from satellite images and land use data, 21 typical urban stations and 43 suburban stations among 104 stations were selected to analyze the characteristics of the humidity effect intensity. The stations distribution are shown in
Figure 6. Among them, one typical water body station (M3553) is located in the city center, and four (M6707, M6708, M6711, and M9236) are located in the suburbs of the city.
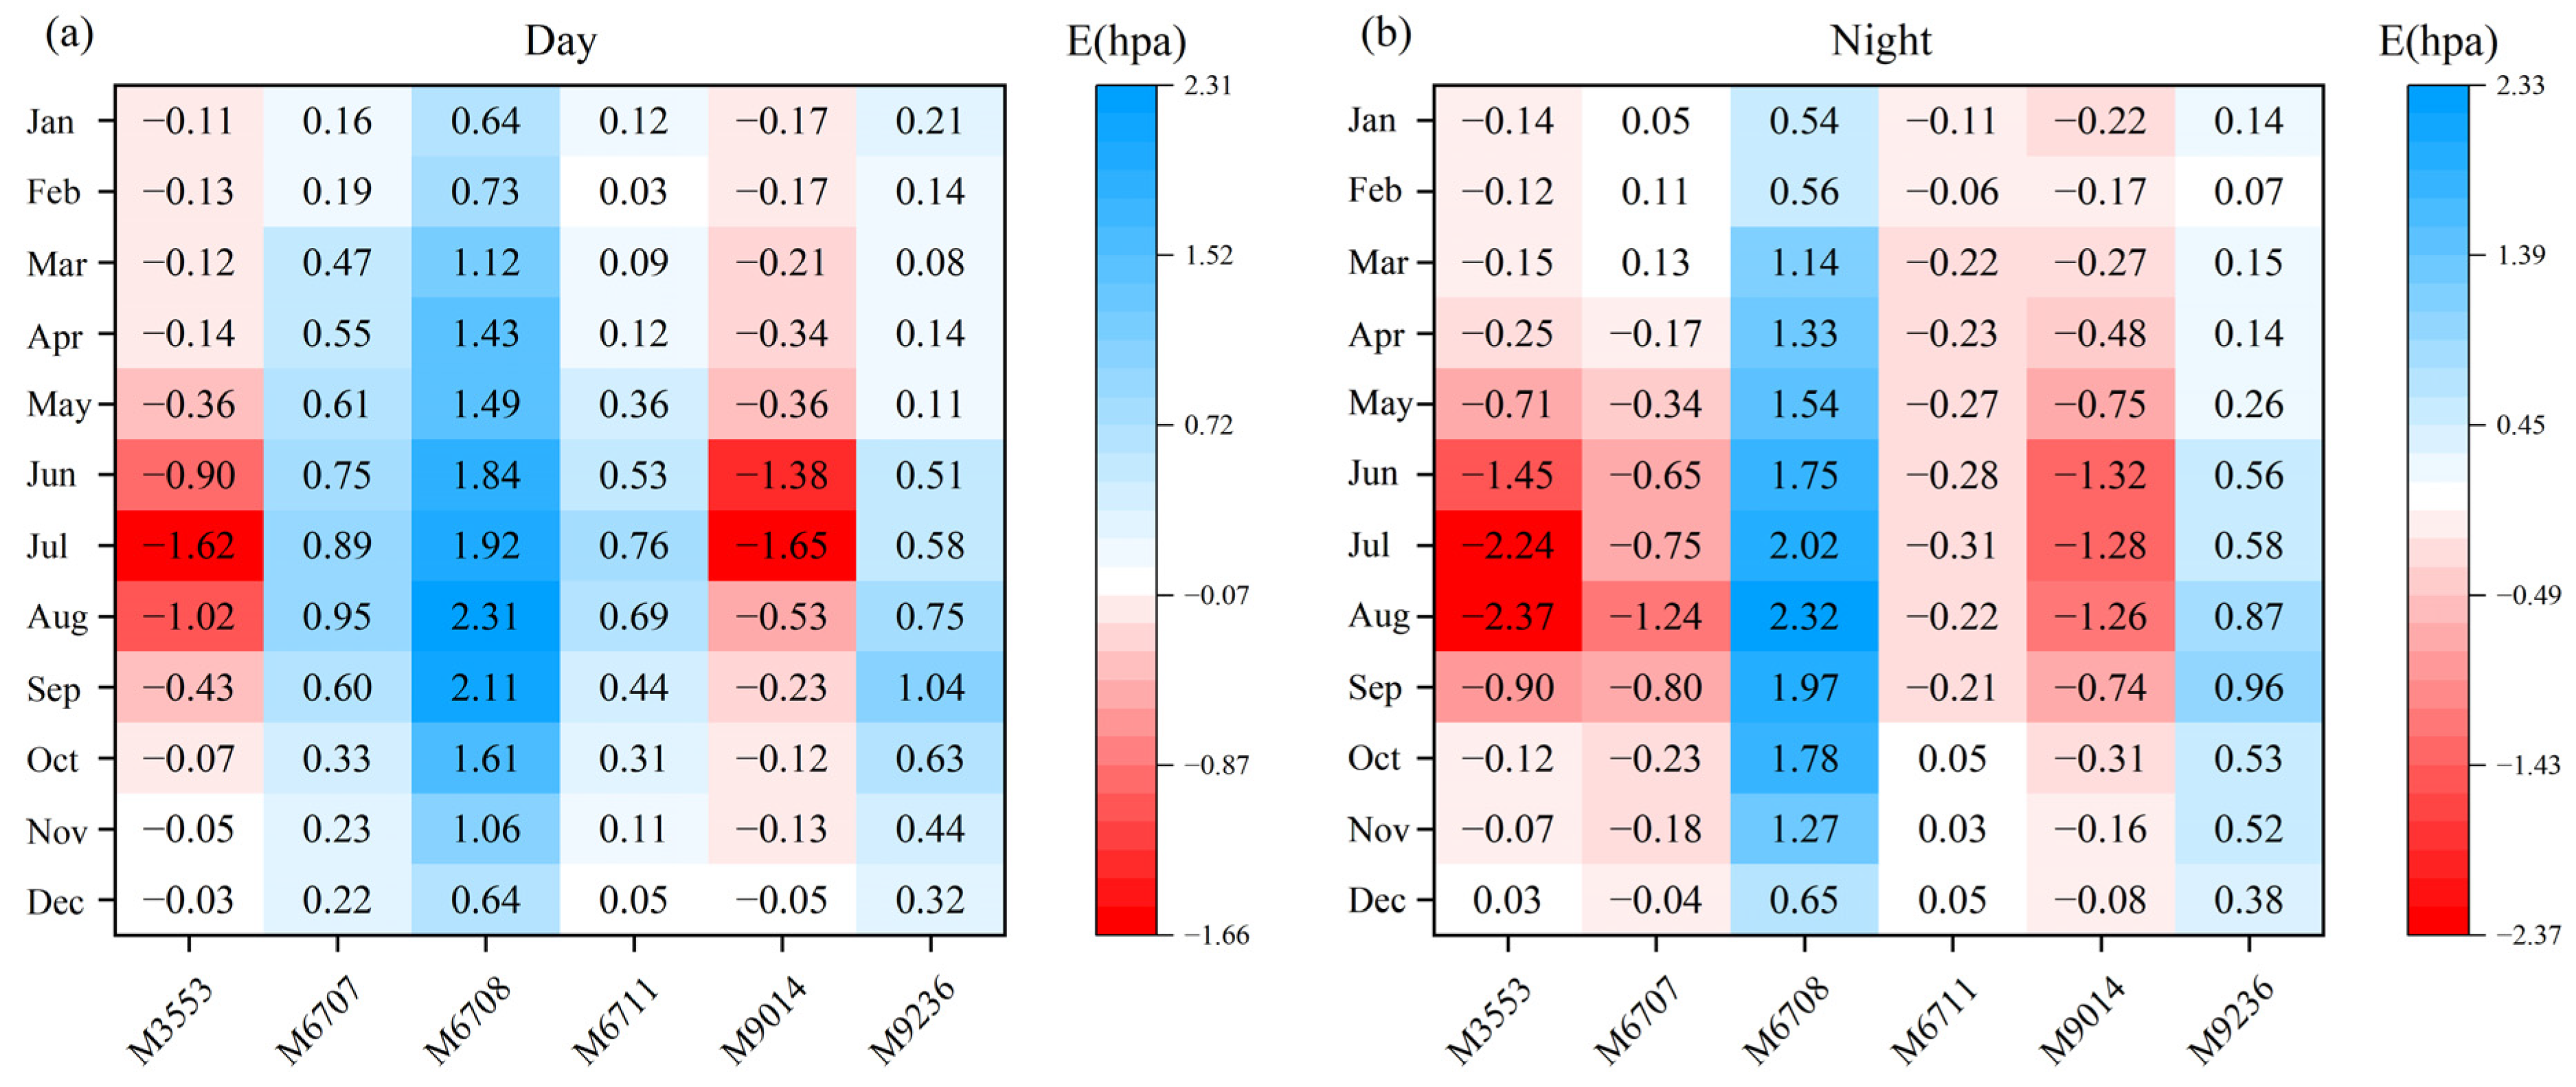
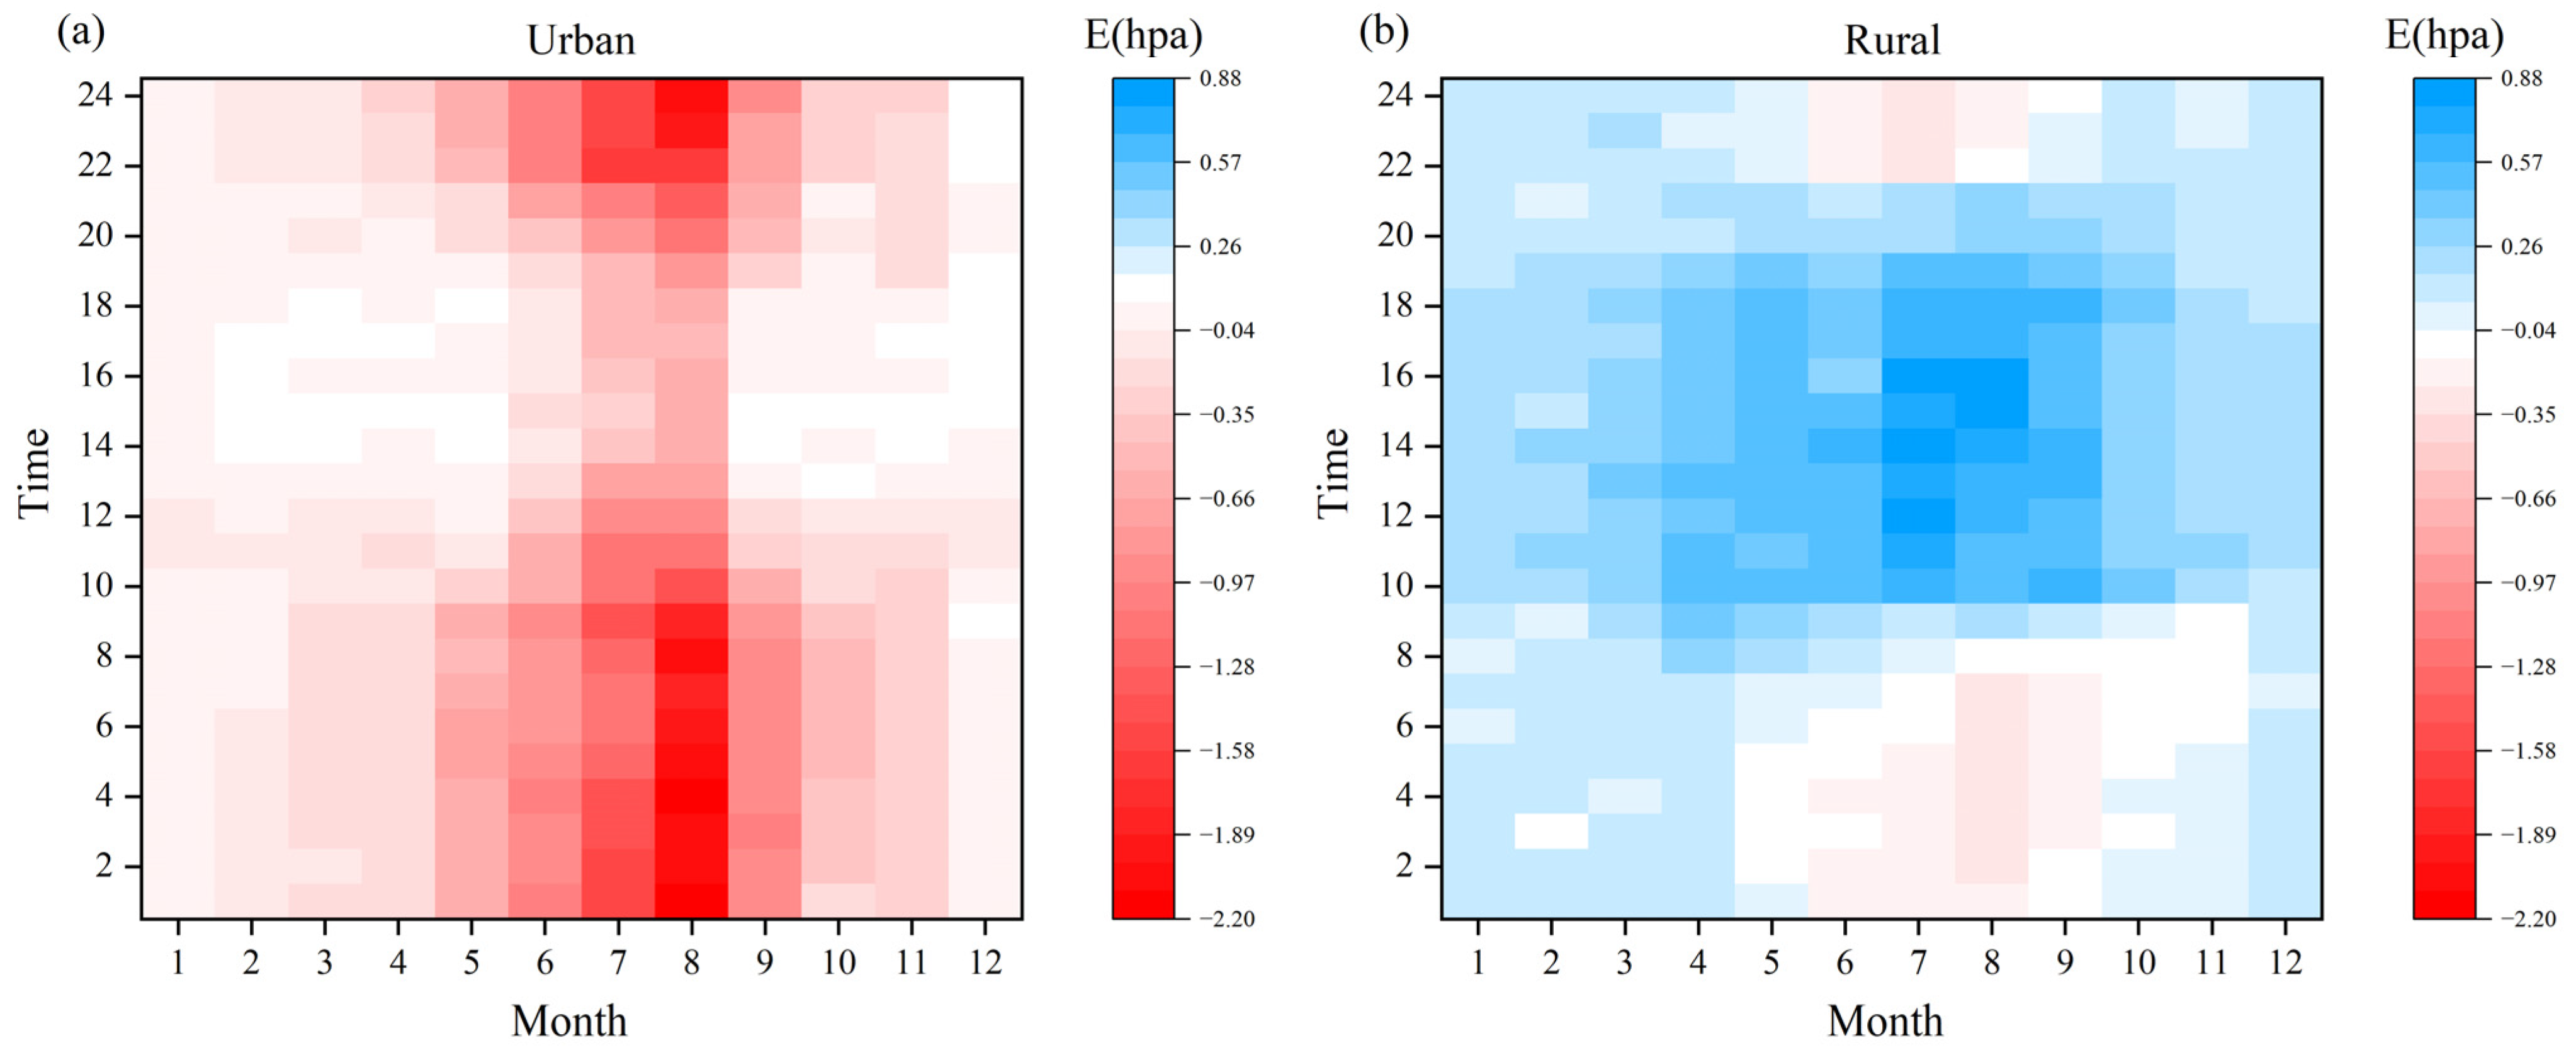
By calculating the statistical average of the humidity effect intensity between urban and suburban stations,
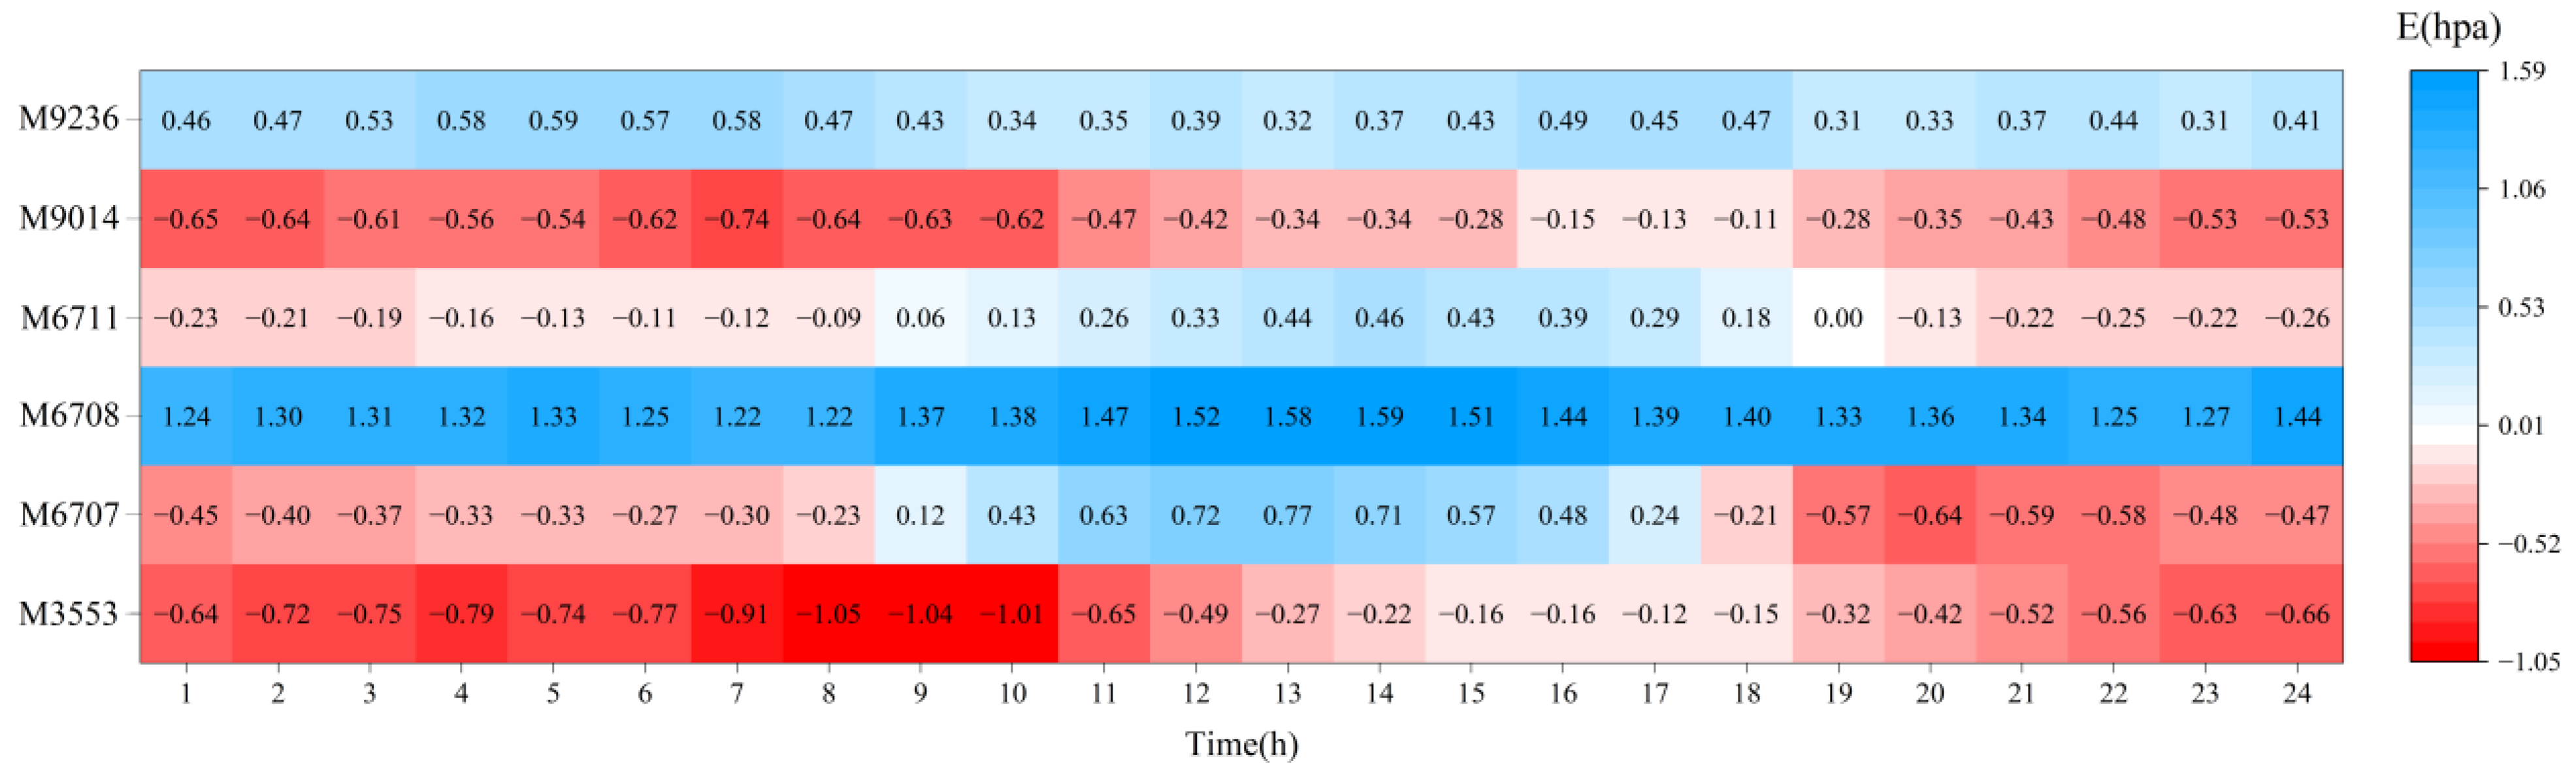
Figure 7a shows that the humidity effect in the urban center of Nanjing is mainly characterized by the drying feature of dehumidification. The dehumidification effect intensity is more significant in the summer half of the year, and higher at night than in the daytime. This is highly consistent with the humidity effect intensity observed at the M3553 station located at Xuanwu Lake in the city center (
Figure 3 and
Figure 5). This indicates that, although the M3553 station is close to a water body, the general dehumidification effect of the background environment of the city center on station M3553 exceeds the humidification effect of the local water body on the station, resulting in the station’s overall dehumidification characteristic.
In other words, the center of the city is densely built and exhibits a dry, dehumidification-dominant feature. This urban background environment offsets the dehumidification effect of the local subsurface water environment, causing the humidity effect of the water body located in the densely built-up area of the city center to align with the dehumidification effect of the main urban area background [
44,
45].
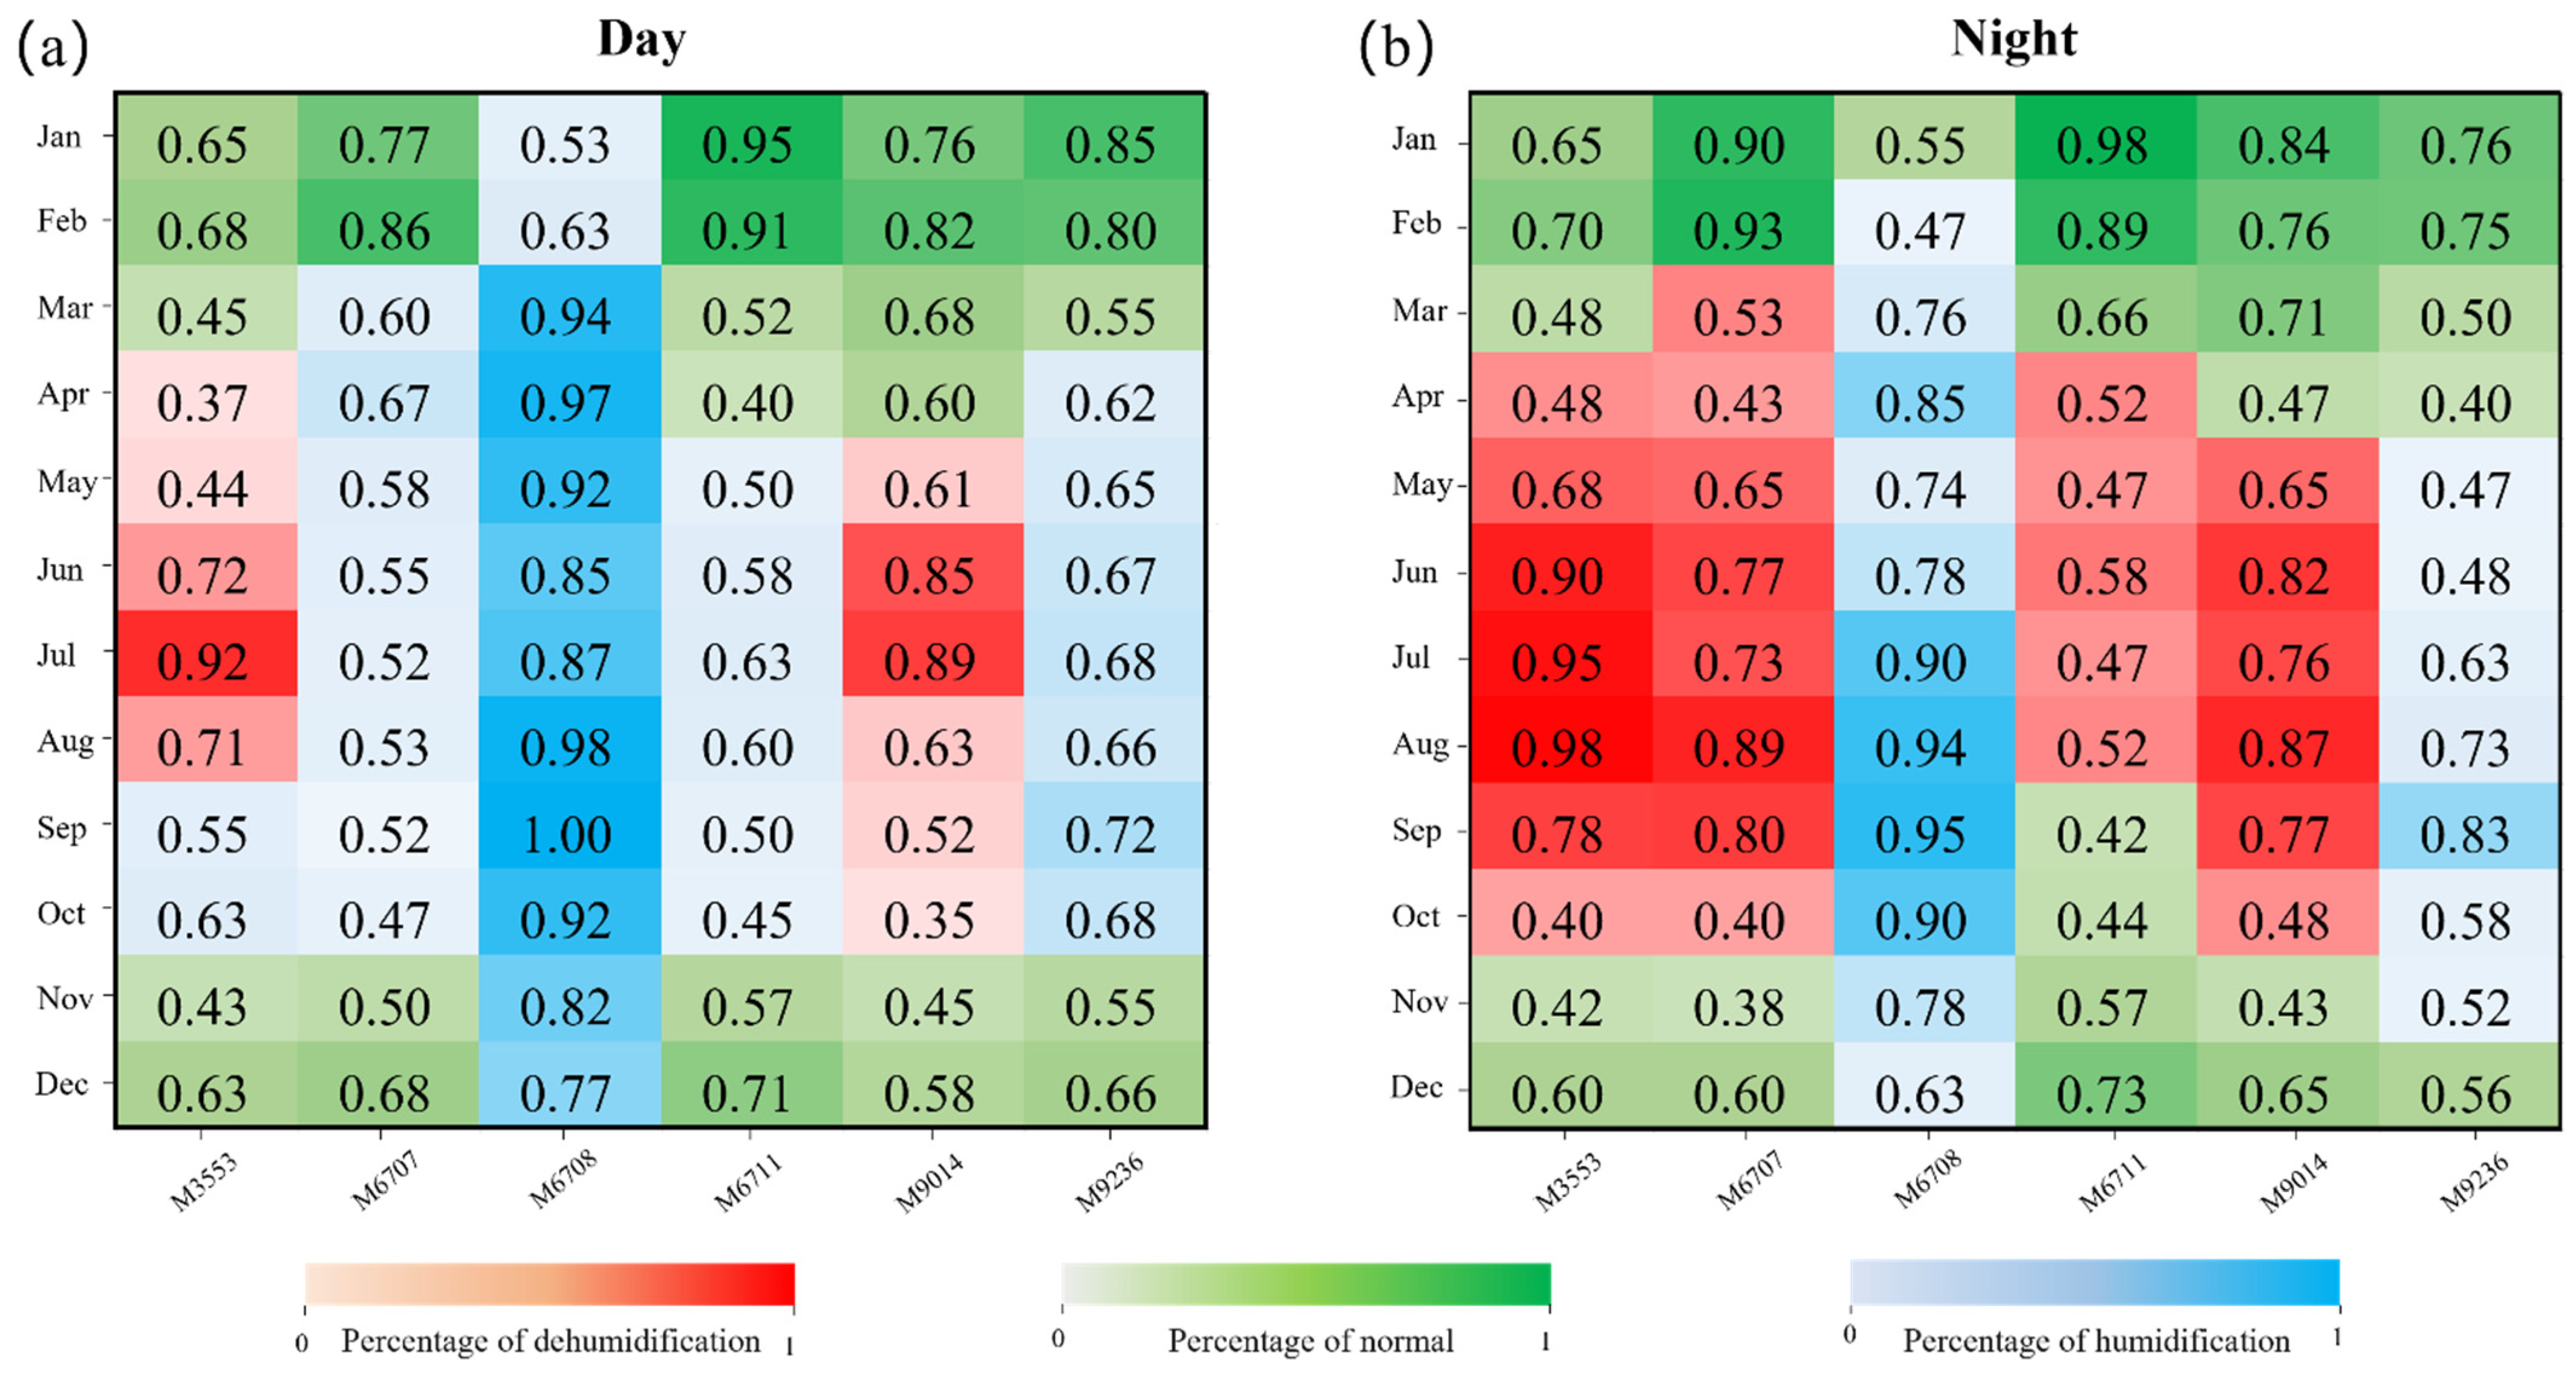
Figure 7b shows the statistical average of the humidity effect in the suburbs of Nanjing. It can be seen that the humidity effect in the suburbs of Nanjing is mainly characterized by a humidification feature, which makes it much more humid overall compared with the urban area. This effect is more pronounced in the summer half of the year, and in terms of daily variation, the humidification effect intensity during the daytime is higher than that at night. By comparing the humidity effect intensity of the typical water body stations in the suburbs, it can be seen (
Figure 3 and
Figure 4) that the humidity effect at station M6711, located at the suburban Jinniu Lake, is very consistent with that of the entire suburb (
Figure 7b), but the humidity effects of the remaining three suburban water body stations, namely M6707, M6708, and M9014, are quite different from that of the entire suburb.
It can be seen that even though these stations are located in the same suburban background environment, the differences in the local environment can still have a great impact on the humidity effect of the sites’ surroundings [
13].
3.3.2. Influence of Wind Fields on the Humidity Effect in Water Bodies
The movement of wind at the surface usually carries water vapor and drives its transfer. The prevailing wind direction significantly affects the humidity effect in the environment surrounding a water body site [
46,
47]. In addition, due to differences in the thermal properties of land and water bodies, alternating diurnal and nocturnal wind directions can occur near water sites. During the daytime, land heats faster than lake/river surfaces (water surfaces) due to solar short-wave radiation. This causes hot air to rise, and low-level air moves from the water surface to the land, resulting in a land–lake breeze (water winds), which increases the humidification effect intensity. During the nighttime, the land cools faster than the water surface, and low-level air moves from the land to the water surface, resulting in land winds, which decrease humidification effect intensity [
16,
17].
The local wind field (LW) of a typical water body station was obtained by using the observation results of conventional station winds as the macroscopic wind field (MW) and the observation results of the typical water body station as the original local wind field (OLW), according to the following method:
The hourly wind speed and direction of typical water body stations and conventional stations were decomposed in the meridional and zonal directions. The wind speed in the meridional direction was subtracted from the wind speed in the zonal direction, and the wind speed in the meridional direction of each water body station was combined with the wind speed in the zonal direction of the corresponding conventional station to obtain the local wind speeds in the meridional and zonal directions at the station. Then, the wind speeds in the meridional and zonal directions were synthesized to obtain the hourly local wind speeds and direction at the water body station [
46].
Following the above calculation, the influence of the macro wind field (MV) was eliminated, and further statistics on the frequency of local winds in each wind direction for each water body station during both daytime and nighttime from 2014 to 2020 were obtained. The results are shown in
Figure 8. The variations in the hourly average wind speed and direction were calculated in the meridional and zonal directions at each water body station and the data were synthesized into graphs, as shown in
Figure 9.
According to
Figure 8, the prevailing wind direction at site M3553 was mainly westerly, showing more northwest winds during the daytime hours and changing to purely westerly winds during the night. Site M6707 showed a relatively balanced wind distribution during daytime hours, with similar frequencies of winds from all directions. However, during the night, winds coming from the north–northeast direction prevailed.
The wind distributions of sites M6708, M6711, and M9014 did not show significant differences between day and night. Specifically, the frequency of easterly winds was more prominent at site M6708, while site M6711 was dominated by northerly and north–northeast winds, and the frequency of southerly winds was more significant at site M9014.
It is worth noting that the diurnal wind direction at site M9236 was extremely pronounced, with the prevalent winds being completely opposite during the daytime. The prevalent winds were from the northwest direction during the daytime, while they shifted to the southeast direction at night.
Figure 9 shows that the changes in wind direction across the different stations exhibited both certain regularities and significant differences. The wind direction at station M6711 was relatively stable, showing northerly winds for most of the day, and the wind speed remained low, with no significant changes.
Figure 2 indicates that station M6711 has a unique relationship with the nearby water body and is semi-surrounded by the water in an L-shape. Most of the prevalent winds during both day and night are northerly winds, but their speeds are weak, indicating they cannot have a substantial impact on the humidity effect of the site’s surroundings. Therefore, their humidity effect is mainly characterized by the typical humidity effect characteristics of suburban sites (
Figure 7b).
The wind direction at site M6708 changed from a low easterly wind speed at night to a higher northerly wind speed during the day.
Figure 2 shows that M6708 is located in the suburbs and surrounded by suburban rice fields. However, the local winds prevailing from all directions during both the day and night bring additional water vapor to the site, making it have a humidification effect throughout the day.
Site M3553, on the other hand, experienced a change in the wind direction from southwesterly at night to northwesterly during the day, although the change in wind speed during the day was not significant. According to the distribution of the M3553 site (
Figure 2), it is characterized by dehumidification during the day because it is in an urban context, where the dehumidification effect of the urban buildings is stronger than the intensity of the humidification effect of the local water bodies. The prevailing westerly winds at M3553 also blow from the direction of the city. This further aggravates the dehumidification effect at the site due to the westerly winds arriving from the hot and dry urban area [
46,
47].
The changes in the wind directions at three sites, M9236, M9014, and M6707, were particularly complex and accompanied by relatively large wind speed fluctuations.
Specifically, the wind direction at M6707 alternated between southerly and northerly winds. Mainly northerly winds occurred from 0 a.m. to 9 a.m., with a gradual decrease in wind speed over time. Then, the direction changed to southerly winds at 10 a.m. with a gradual increase in wind speed, reaching a peaking at 13 p.m. Afterward, the wind speed gradually decreased, and the winds returned to the northerly direction at 17 p.m., with a renewed increase in wind speed. Based on the actual location shown in
Figure 2, it is evident that the wind field at this site exhibits the characteristics of both land and water winds [
48,
49,
50,
51,
52], with the winds mainly blowing in the direction of the lake in the daytime and mainly in the northerly direction in the nighttime (land winds).
Site M9014, on the other hand, experienced alternating northerly and southerly winds during the diurnal period, with predominantly southerly winds and strong wind speeds most of the time, and a brief period of weaker northerly winds between 10 a.m. and 13 p.m. The site was also characterized by a strong northerly wind (water wind) during the day. According to the analysis presented in
Figure 2, it can be seen that the site was dominated by southerly winds (land winds) at night and exhibited weak northerly winds (water winds) around midday, i.e., it had a relatively weak water–land wind characteristic.
Site M9236 exhibited alternating northwesterly and southeasterly winds during the diurnal hours, with the southeasterly winds dominating. However, the winds shifted to the northwesterly direction during the period from 9 a.m. to 14 p.m. on a daily basis. Based on the location distribution shown in
Figure 2, it is evident that the wind field at this site exhibits a changing pattern of water–land winds. During the daytime, mainly river winds occur from the northwest (water winds), but at night, mainly southeasterly winds occur (land winds).
- 2.
The Impact of Water–Land Breeze on Humidity Effects
Since this study focuses on stations surrounding water bodies in Nanjing, the local circulation primarily consists of land-water breezes induced by thermal contrasts between water and land surfaces [
51,
52,
53,
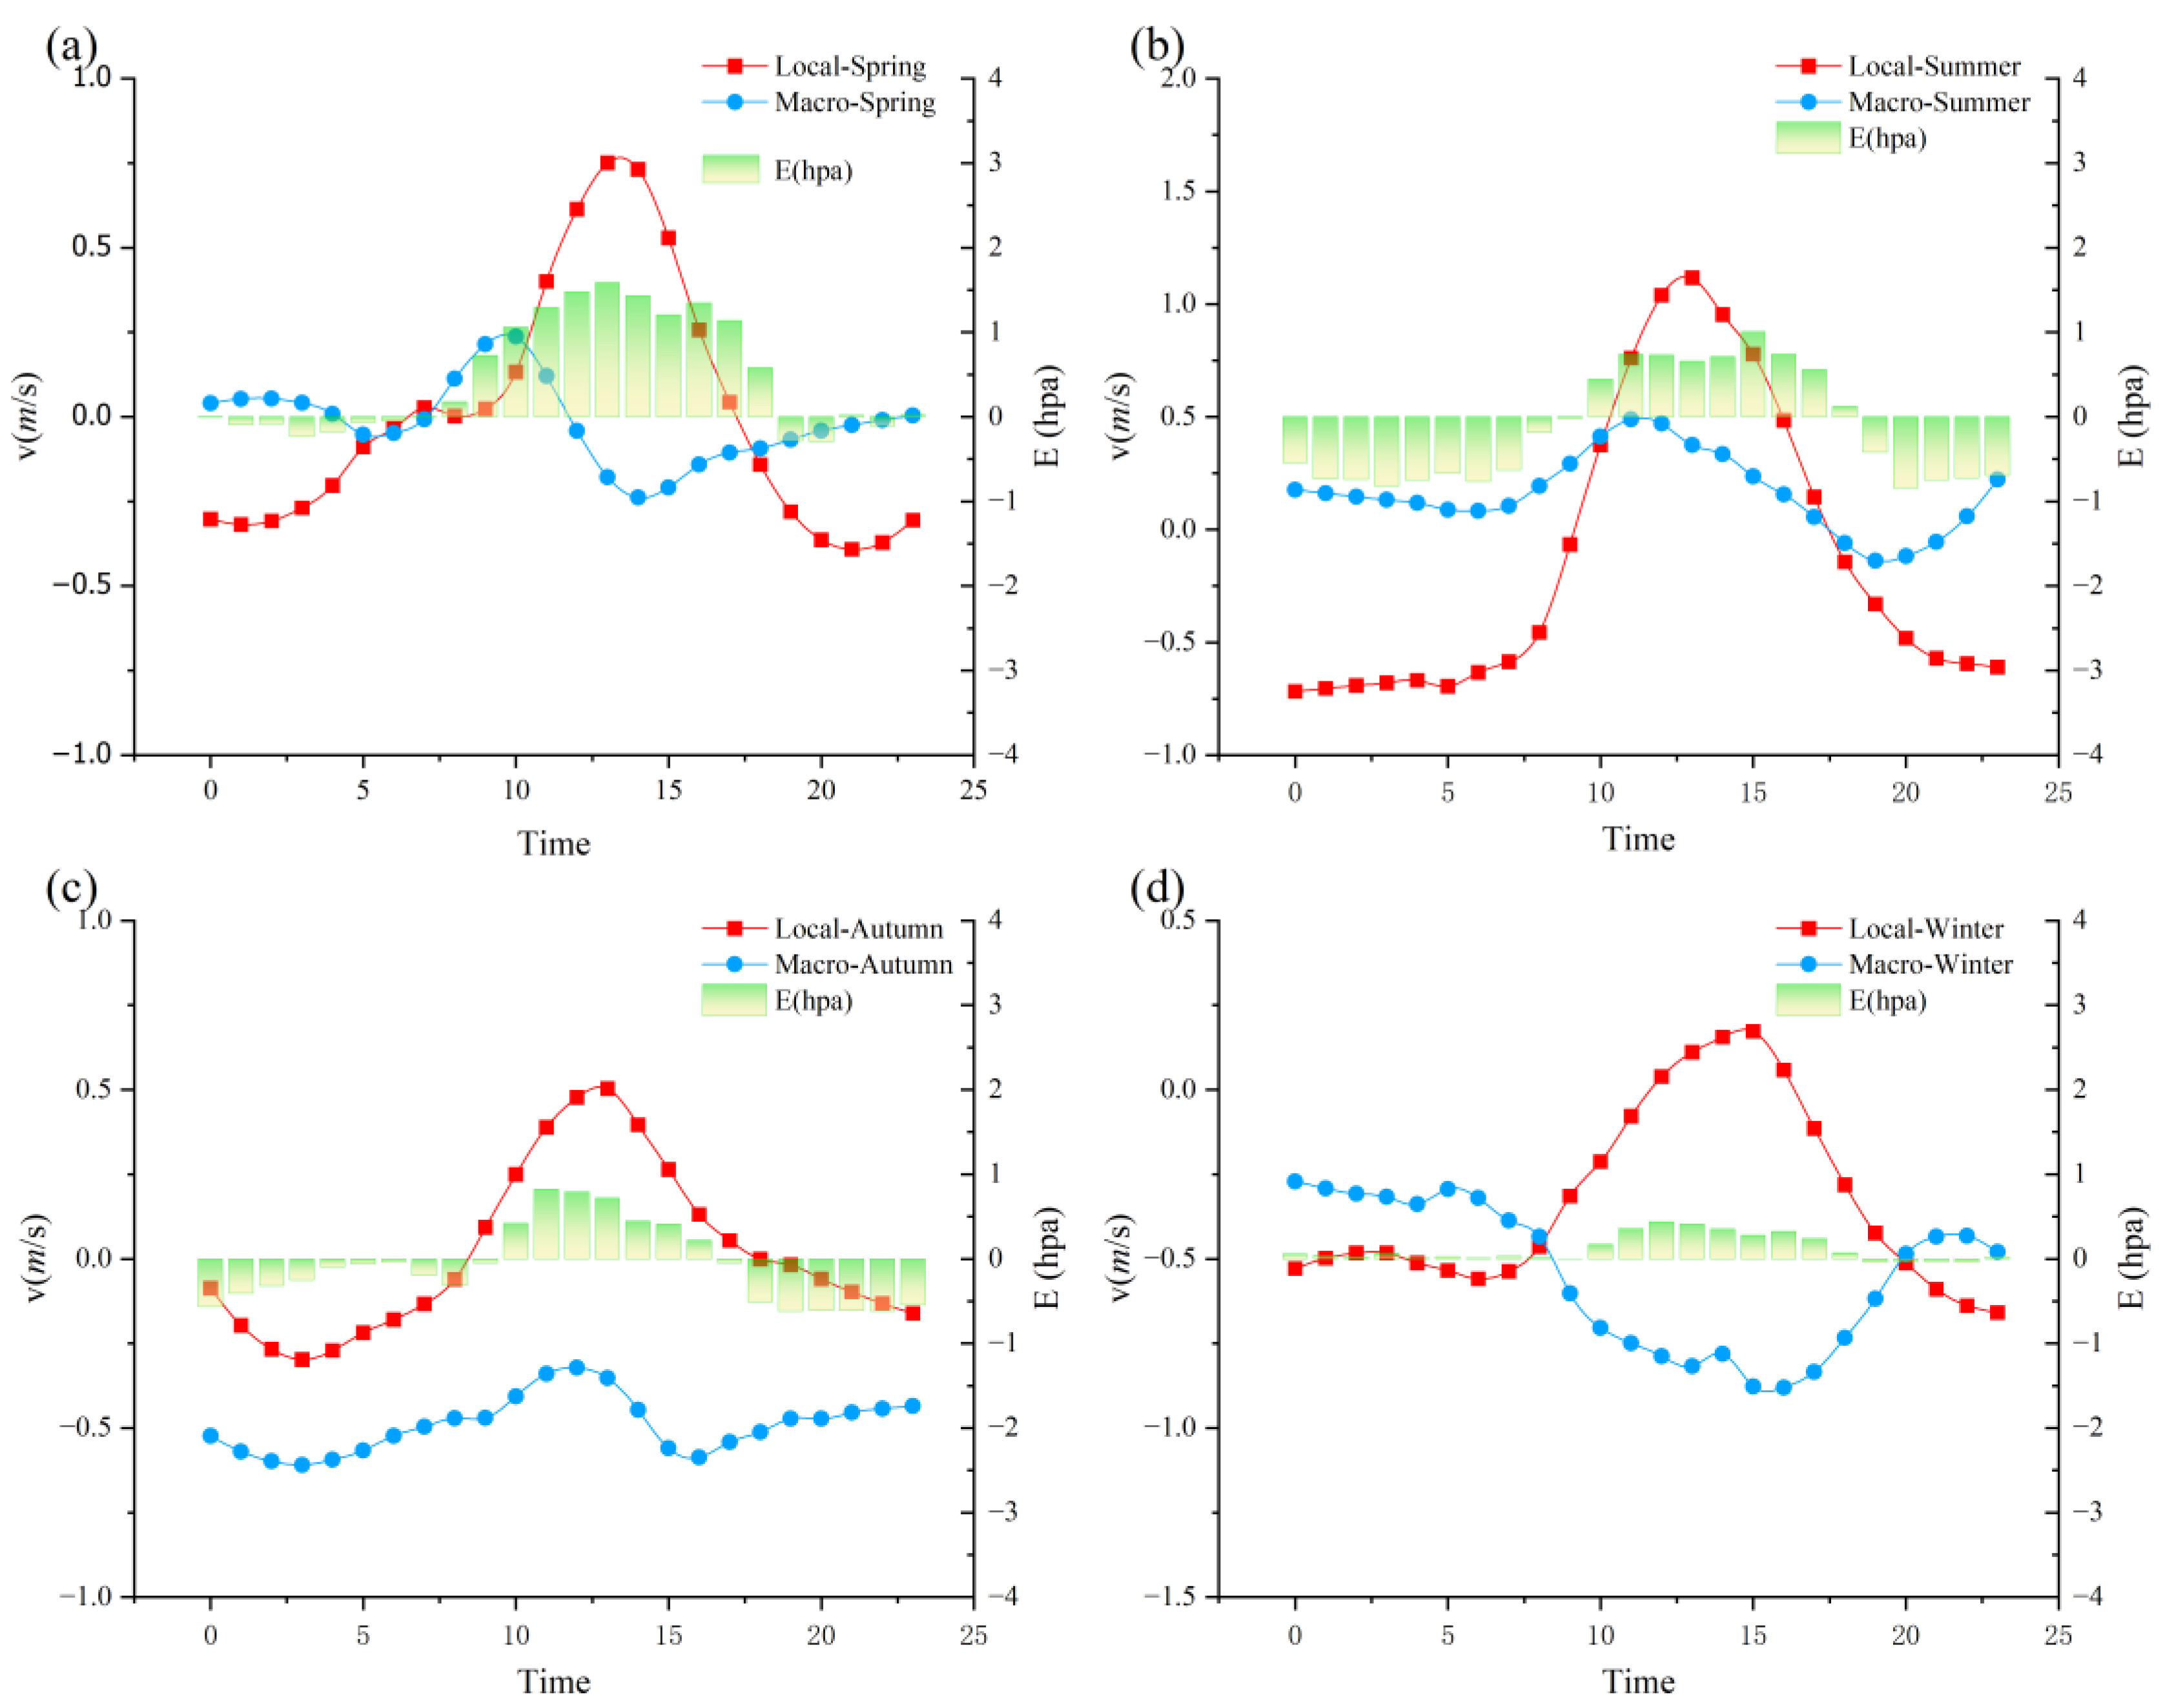
54]. Sites M6707, M9014, and M9236, where the phenomenon of water–land wind occurs, were further analyzed to observe changes in the local water–land wind (LW) and its corresponding macro wind (MW) during different seasons, as well as their influence on the humidity effect at the sites. The average temporal changes in the localized winds and their corresponding macro winds at the reference station in the zonal direction were calculated for stations M6707 and M9014 from 2014 to 2020 during different seasons (
Figure 10 and
Figure 11).
As can be seen in
Figure 10, the local wind at station M6707 showed a significant pattern of change in latitude during the day, with the phenomenon of water–land wind being obvious. The pattern of changes in the humidity effect intensity at the station aligns with the temporal changes in the humidity effect intensity at the station. The daytime hours are affected by the lake wind from the south (water wind), and the humidity effect intensity shows that the humidity increases. At nighttime, the wind direction changes to the north (land wind), and the humidity effect intensity also changes and decreases accordingly. Seasonal changes are obvious. In summer, the south wind (water wind) lasts the longest during the day, and the wind speed is also the highest, starting at 9:00 a.m. and reaching its peak strength at 13:00 a.m. At 18:00 p.m., the wind direction changes from the south (water wind) to the land wind, which reaches its highest wind speed at 0:00 p.m. In winter, the water–land wind is the weakest, and the duration of the south wind (water wind) is very short, lasting less than 4 h. The macroscopic winds at station M6707 in the zonal upward direction did not show a clear pattern of daily changes. It is evident that the local water–land wind determines the change characteristics of the humidity effect at the station.
Table 7 shows the correlation between the three attributes of wind at site M6707 and the humidity effect intensity during different seasons. It can be seen that the changes in OLW and LW at site M6707 have a strong correlation with the changes in the humidity effect intensity. The correlation between the humidity effect intensity and LW is slightly higher than that with OLW. The correlation with MW is relatively weaker, but it shows a strong negative correlation with the humidity effect intensity in winter.
This suggests that the local wind at station M6707 plays a dominate role in the variation in the humidity effect intensity at the station.
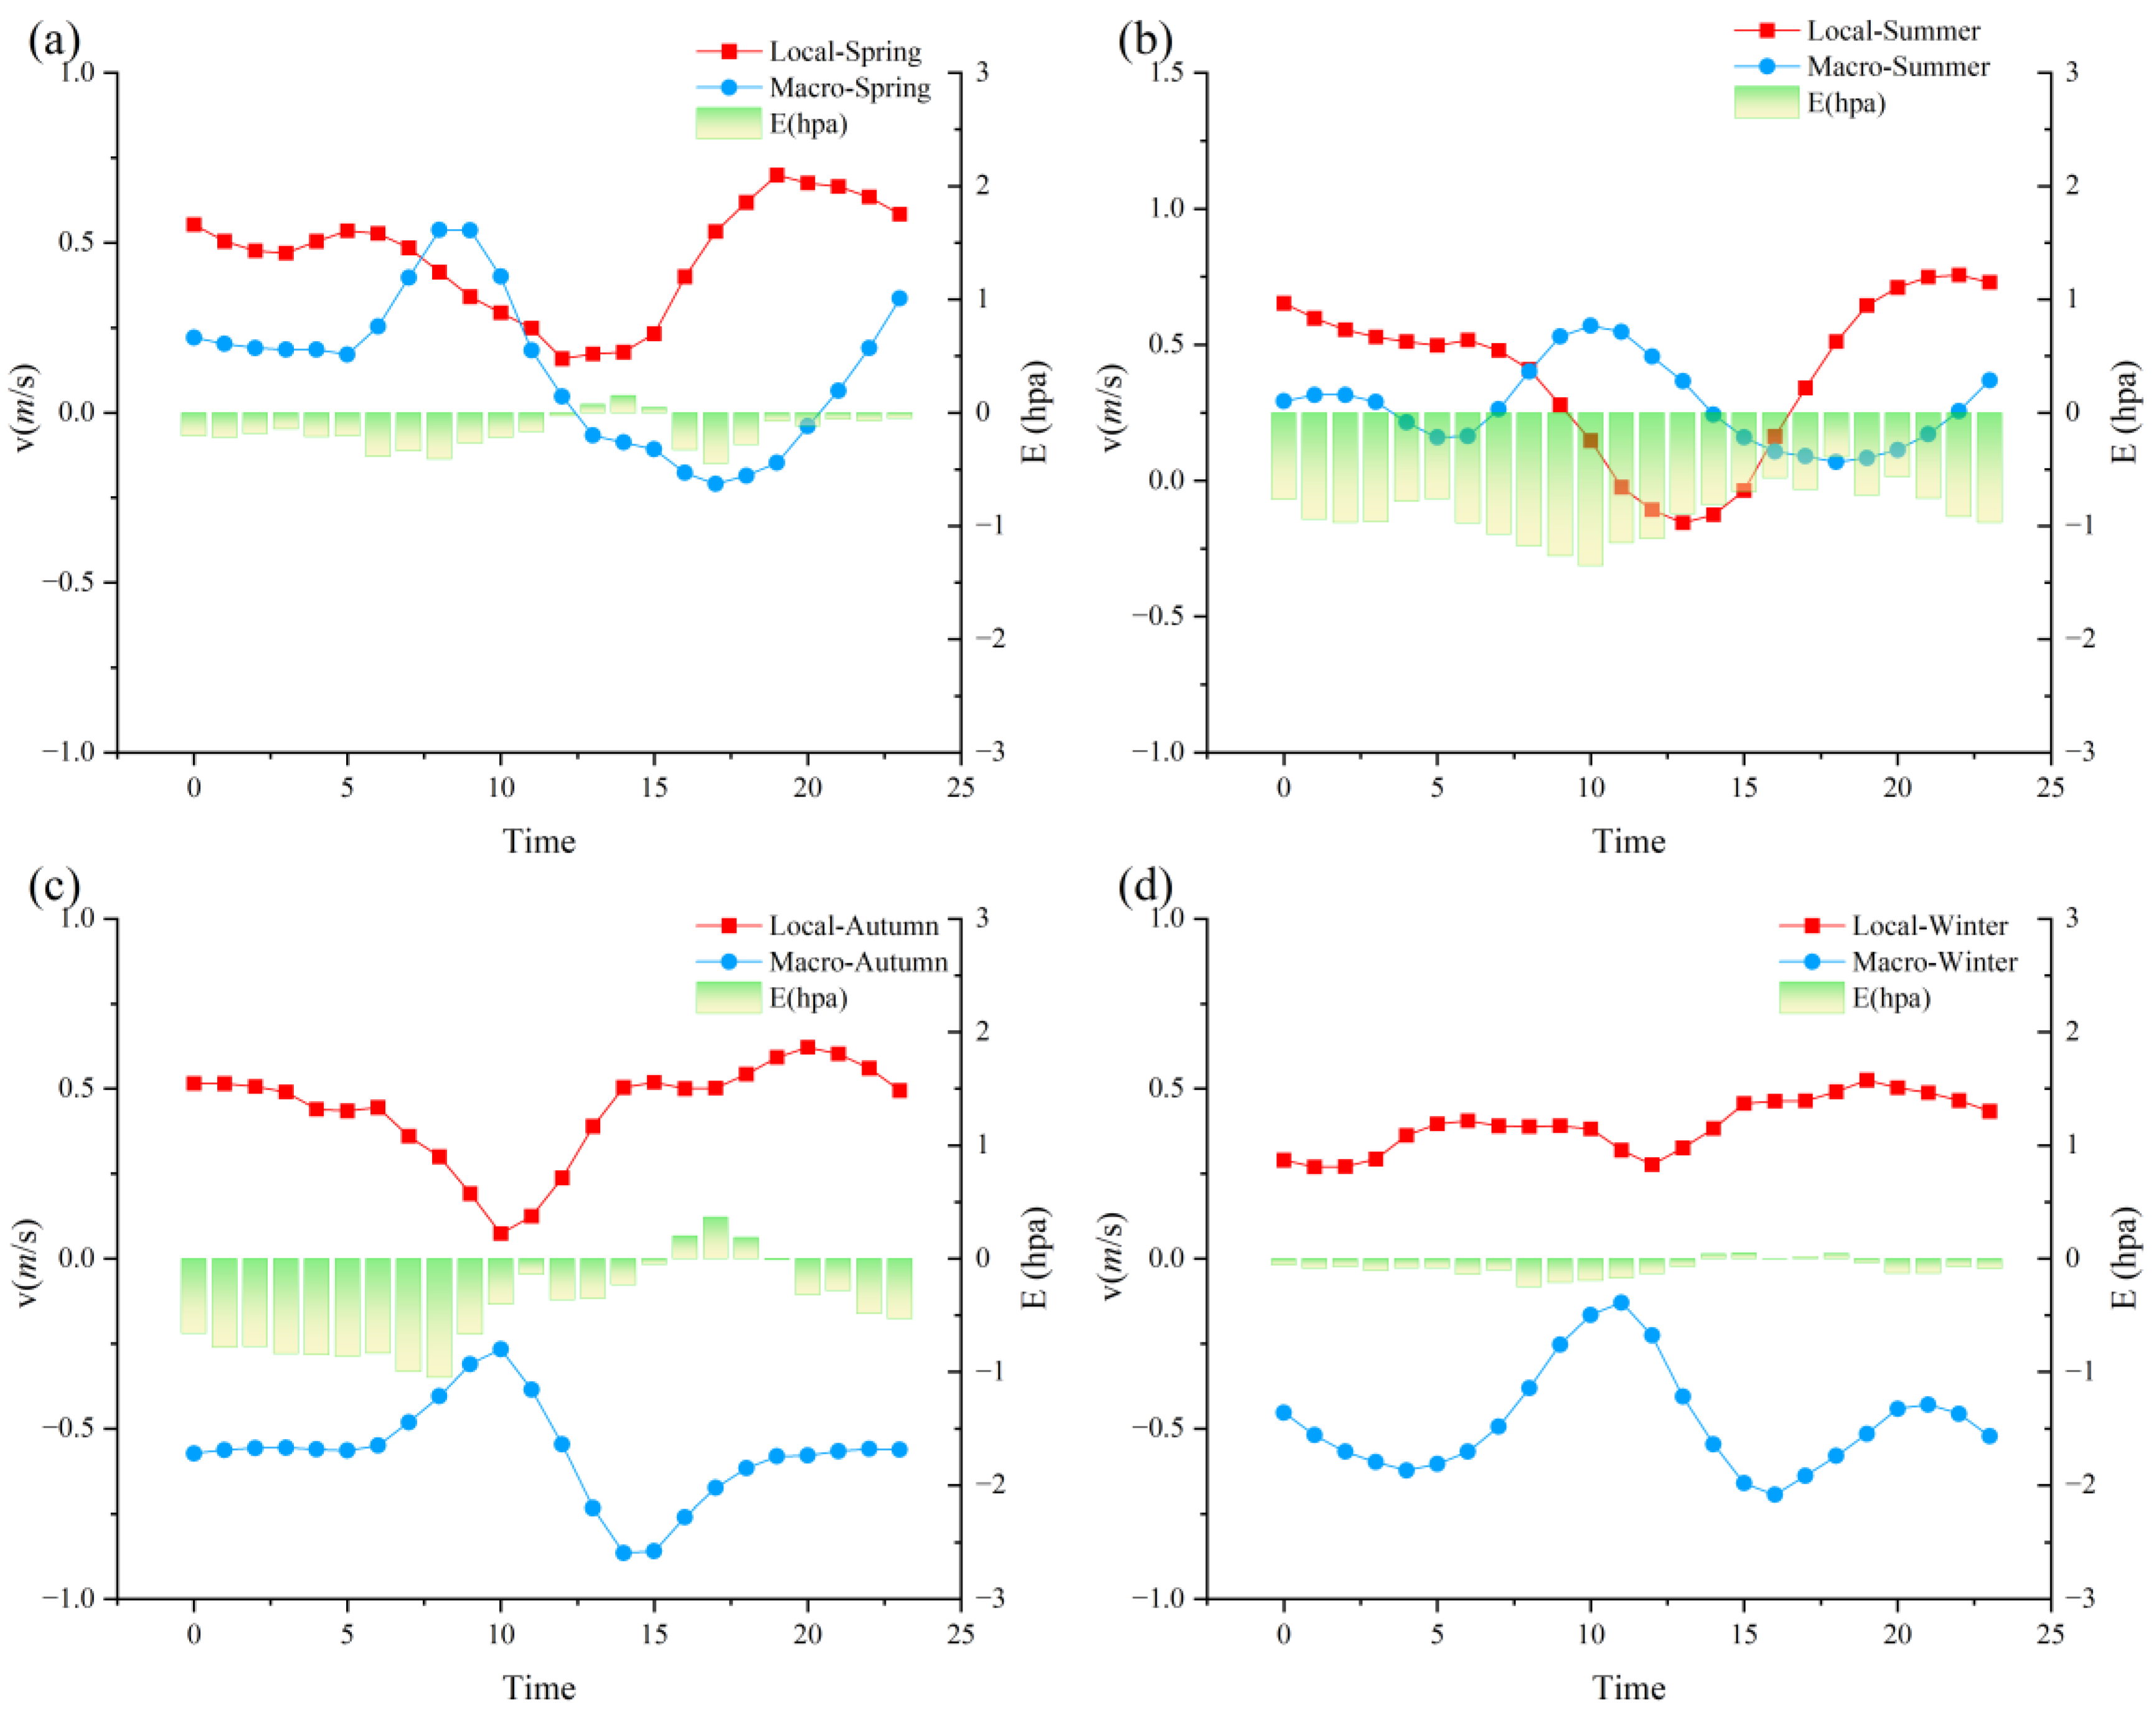
Figure 11 shows that the local wind speed in the zonal direction at station M9014 was consistently greater than 0 m/s, with the wind predominantly coming from the south (land wind). However, in the daytime, the influence of the wind from the lake in the north (water wind) creates a concave shape in the local wind curve. It can be seen that the degree of concavity of the local wind curve varies during different seasons; it is the largest in summer, but becomes weaker with a north wind (water wind) in the period from 10 to 15 o’clock. Seasonal variation clearly appeared in the macro winds at station M9014. The southerly winds in spring and summer combine with the local southerly winds at the station, strengthening the onshore winds. Meanwhile, the northerly winds in fall and winter weaken the local southerly winds, mitigating the corresponding reduction in the humidity intensity.
At station M9014, it is evident that the macro wind (land wind) and local wind (land wind) in the spring and winter seasons jointly affected the humidity, leading to its reduction. In the fall and winter, during the daytime, water winds from Shijiu Lake and the macro winds somewhat mitigated the humidity effect. However, the impact was not great, and the overall results still showed humidity characteristics.
Table 8 shows the correlation between the three wind attributes and the humidity effect intensity during different seasons at site 9014. The intensity of the humidity effect at the site was mostly negative, and the wind speed was greater than 0, manifested as southerly wind (land wind). The higher the wind speed, the lower the corresponding value of the humidity effect intensity, and the stronger the dehumidification effect. The change in the MW at site M9014 also shows a significant negative correlation with the change in the humidity effect intensity at the site. This correlation is the strongest among the three types of winds during all seasons. The correlation is relatively strong in summer and winter, reaching −0.89 and −0.81, respectively, which suggests that the macro winds at station M9014 play a dominate role in the variation in the humidity effect intensity at the station.
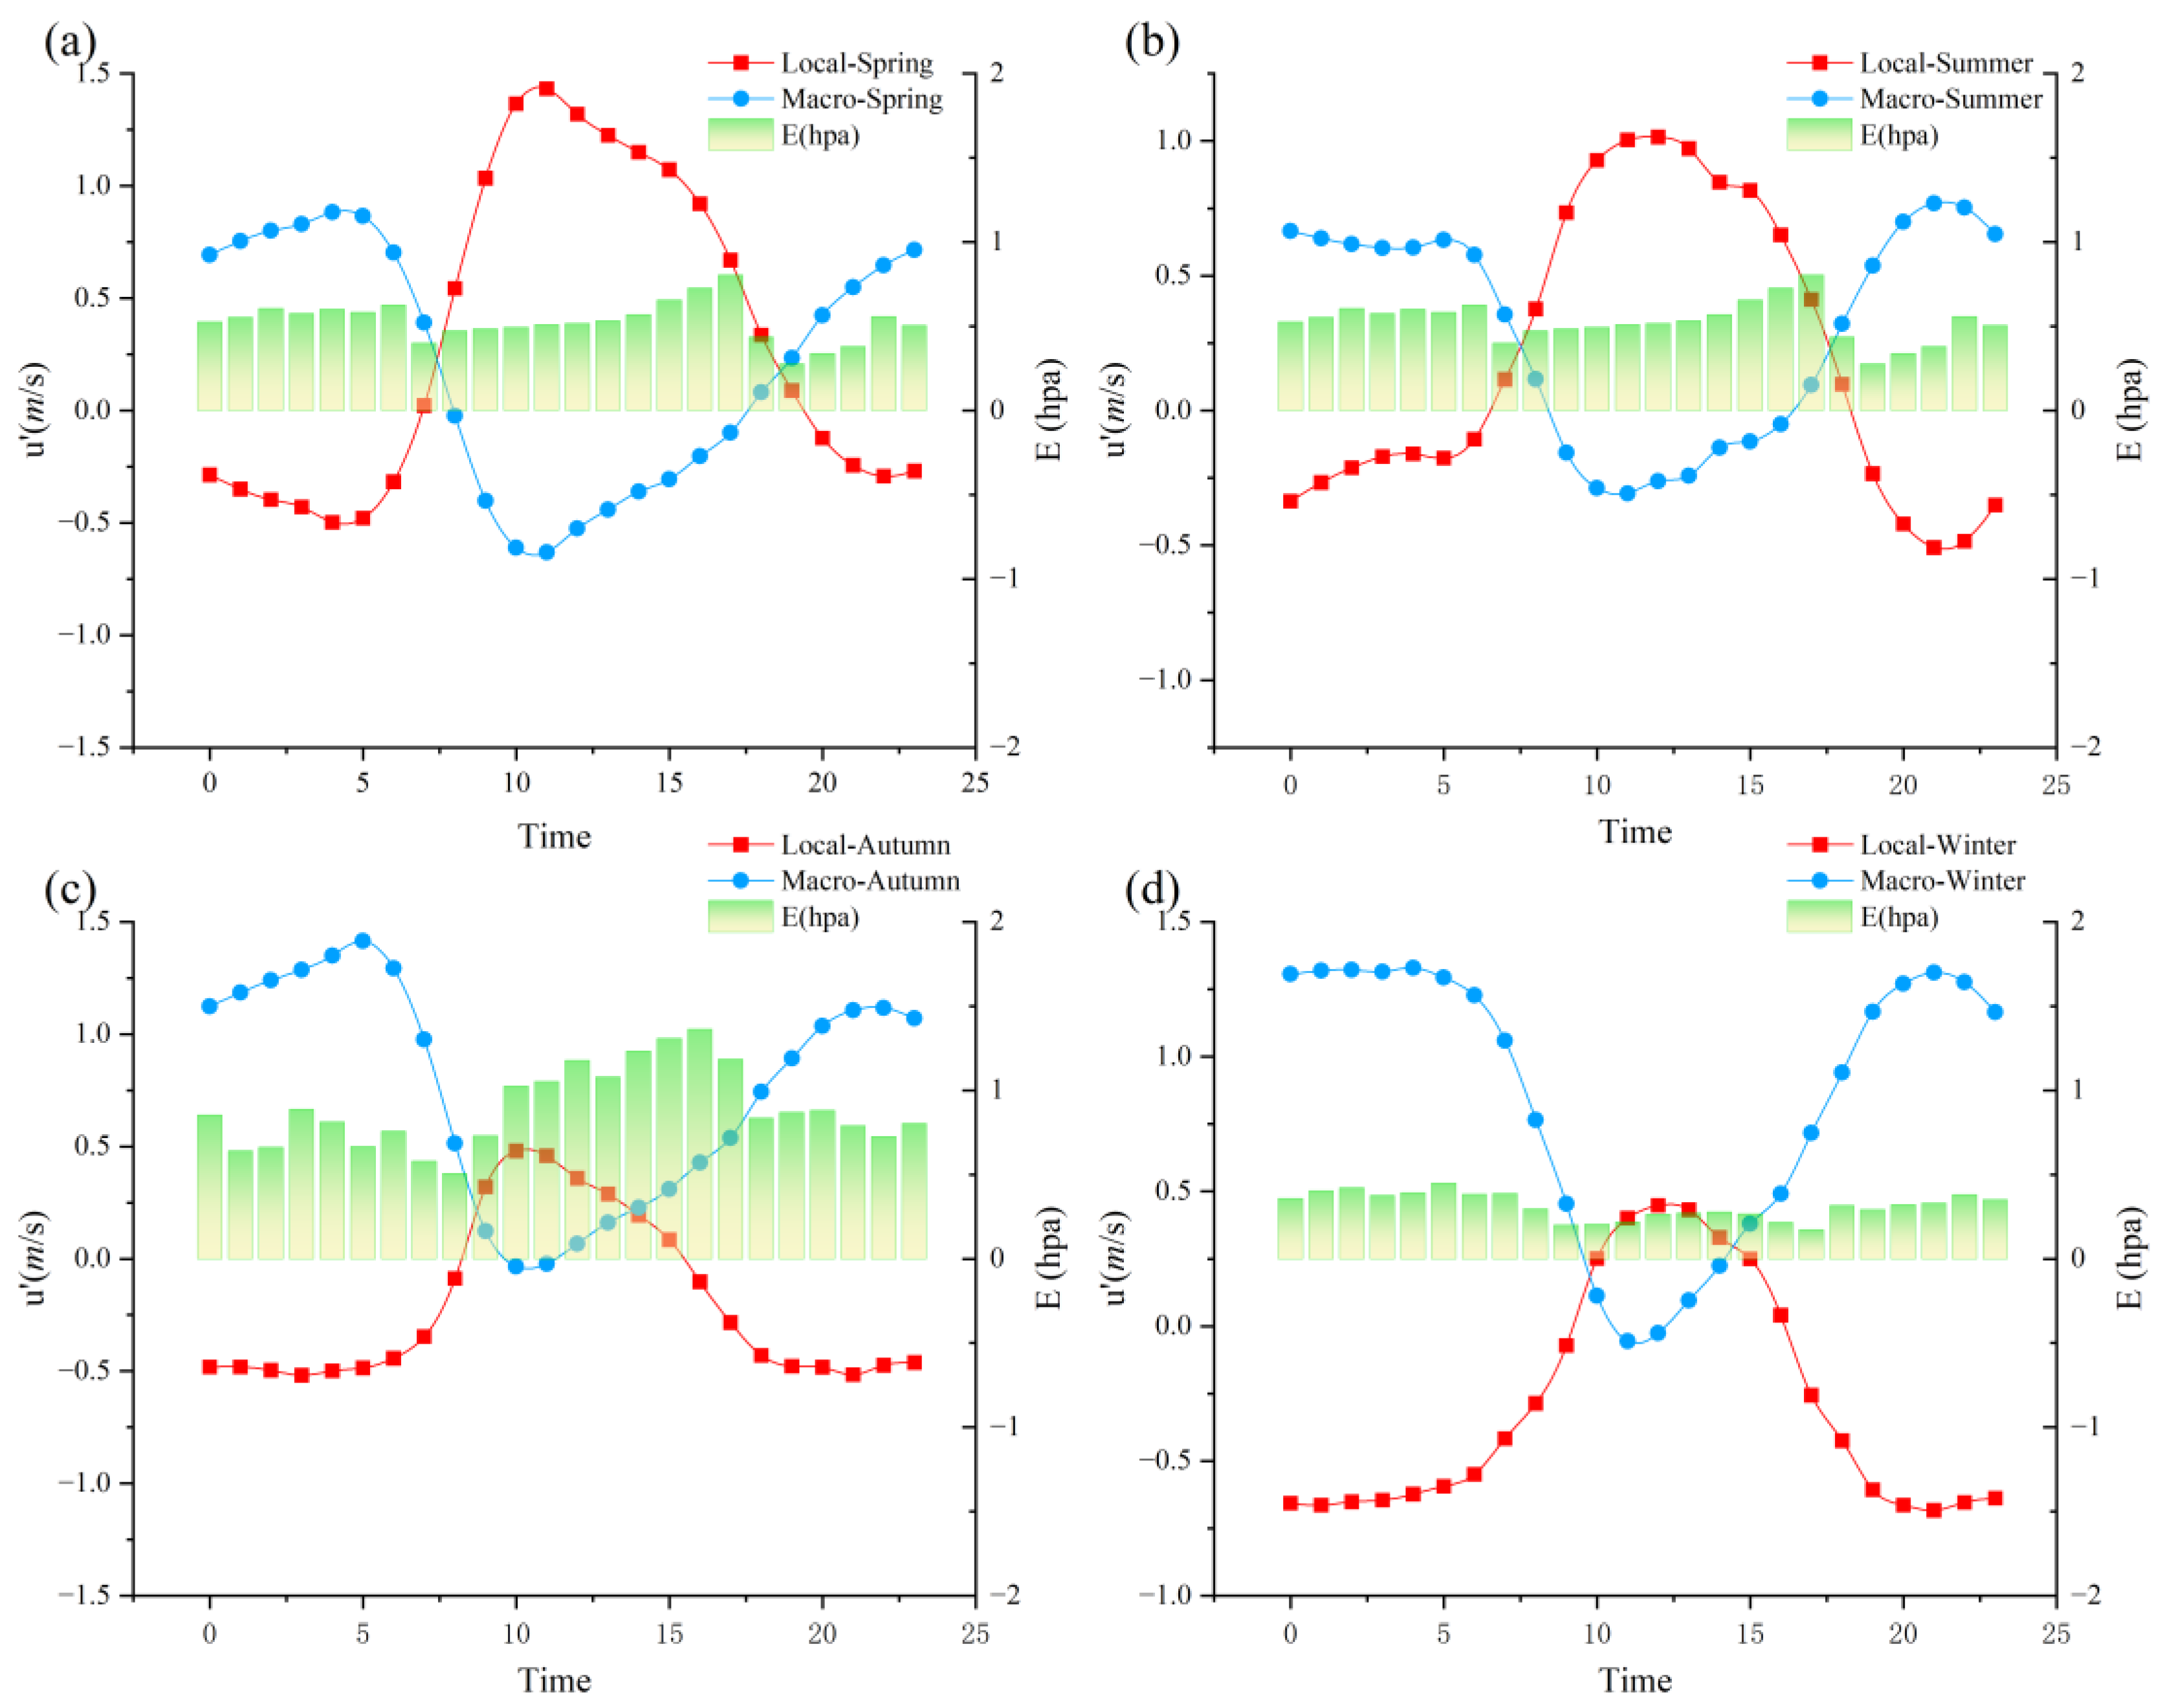
Station M9236 is located along the Yangtze River. The main body of the river is positioned in the northeast–southwest direction relative to the station. The axes of the decomposed wind direction were rotated clockwise by 45 degrees, to obtain u′ (northwest–southeast direction) and v′ (northeast–southwest direction). The average temporal changes in the local winds during different seasons at station M9236 and its corresponding macroscopic winds at the reference station in the northwest–southeast direction were calculated for the period between 2014 and 2020 (
Figure 12).
Figure 12 shows that the local wind at station M9236 exhibited obvious diurnal variations in the northwest–southeast direction, and the land–lake breeze phenomenon was significant, with northwest wind (water wind) during the daytime and southeast wind (land wind) during the nighttime. The river wind (water wind) in the northwest direction lasted longer during the daytime in spring and summer, while the water wind was shorter during the daytime in fall and winter. The macro wind at station M9236 showed diurnal variations in the northwest direction in spring and summer, with southeast wind (land wind) during the day and northwest wind (water wind) during the night. Meanwhile, in fall and winter, northwest wind (water wind) occurred throughout the day.
Station M9236 is located along the bank of the Yangtze River, which is a rich source of water vapor. The site shows humidification throughout the year during the day, indicating that it is more strongly influenced by the northwesterly river winds (water winds), which bring water vapor to the station, than by winds from other directions.
The changes in the macro and local winds at the station indicate that the strength of the humidity effect at M9236 is jointly influenced by local and macro winds. During the daytime, when the macro winds gradually weaken, the local winds (water winds) at the site play a role in bringing abundant water vapor to the site. The macro winds and local winds complement each other, alternately bringing water vapor to the site, meaning that the environment around the site shows a humidification effect throughout the day.
Table 9 shows the correlation of the three wind attributes with the humidity effect intensity during different seasons at site 9236. It can be seen that the correlation between different wind fields and the humidity varies significantly with the seasons. In spring, the original local wind field (OLW) shows a strong positive correlation with E (0.74), while the local wind field (LW) has a slightly weaker positive correlation with E (0.51), and the macroscopic wind field (MW) has almost no correlation (−0.04). In summer and fall, the correlation with the MW was enhanced, with correlations of −0.50 and −0.61, respectively. However, the OLW was the most correlated with changes in the humidity effect intensity. In winter, the correlation of the OLW with the humidity effect remained the strongest (0.85), and the correlation with the MW shifted from a negative to a positive correlation (0.79). However, the LW shifted from a positive correlation to the strongest negative correlation (−0.72). Overall, the OLW, compared to the MV and LW, was the most correlated with the change in the humidity effect intensity.


