Brief Report

Underestimation of Diurnal Variations in ERA5 Temperature and Relative Humidity over Tropical Indian Ocean

1
School of Earth and Environmental Sciences, Seoul National University, Seoul 08826, Republic of Korea
2
Research Institute of Oceanography, Seoul National University, Seoul 08826, Republic of Korea
*
Author to whom correspondence should be addressed.
Atmosphere 2025, 16(4), 404; https://doi.org/10.3390/atmos16040404
Submission received: 1 February 2025 / Revised: 22 March 2025 / Accepted: 27 March 2025 / Published: 31 March 2025
(This article belongs to the Section Biosphere/Hydrosphere/Land–Atmosphere Interactions)

Abstract

:
Significant upwelling in the equatorial ocean influences complex ocean–atmosphere interactions and contributes to diurnal variations in the lower troposphere. This study compares the temperature and relative humidity data from radiosonde observations over the tropical Indian Ocean with those from the ERA5, highlighting the underestimation of the diurnal variations in the ERA5. Radiosonde measurements were conducted at 3 h intervals for approximately 24 h, from 31 May to 1 June 2023, to investigate the diurnal variations in the lower troposphere at two fixed locations: (1) 65°E and 8°S in the upwelling region (Station 8) from 28 to 29 May 2023, and (2) 65°E and 4°S outside the upwelling region (Station 4). The radiosonde observations reveal pronounced diurnal variations in temperature and relative humidity between 950 and 650 hPa. The maximum diurnal range (maximum minus minimum) for temperature is observed above 800 hPa, with Station 8 exhibiting 4.7 °C and Station 4 exhibiting 2.7 °C. For relative humidity, Station 8 shows a diurnal range of 84%, while at Station 4, notable variations are observed only below 650 hPa, reaching 76%. However, the ERA5 underestimates the diurnal variations both within and outside the upwelling region. This underestimation is particularly evident between 850 and 750 hPa and is more pronounced within the upwelling region, where the diurnal range is larger. The diurnal ranges calculated from the ERA5 for 2004–2023 suggest that the reanalysis dataset exhibits limitations in capturing diurnal variations, particularly over the upwelling region. This report highlights the need for more in situ observations of the atmospheric variables to better represent diurnal variations in the tropical Indian Ocean.

1. Introduction

Diurnally varying solar heating induces significant changes in atmospheric temperature and relative humidity [1]. The diurnal cycle is particularly pronounced in the tropics and lower latitudes, where solar radiation is the primary driver of diurnal variability [2]. In particular, nocturnal radiative cooling drives upward motion above the ocean, influencing the diurnal convection cycle [3]. Shallow cumulus clouds, which are formed by shallow convection or turbulent mixing in the lower atmosphere, typically peak in the afternoon and coincide with the time of the maximum sea surface temperature (SST) [4,5,6]. Such variability and associated ocean–atmosphere interactions help to shape weather systems over the tropical ocean [7,8].
Significant ocean upwelling influences the complex ocean–atmosphere interactions and contributes to the atmospheric diurnal cycles in the tropical ocean. Among regions in the tropical Indian Ocean, the Seychelles–Chagos Thermocline Ridge (SCTR) is characterized by its shallow thermocline and thin mixed layer (Figure 1). The variability in upwelling in the SCTR is primarily driven by seasonal wind forcing associated with the monsoon system [9,10,11]. During the boreal summer monsoon (June–September), the intensification of the southeasterly trade winds generates strong wind stress at the ocean surface, leading to stronger Ekman divergence. This process results in the strong upwelling of cooler and nutrient-rich subsurface waters from below the thermocline to the surface, thereby modifying the upper-ocean thermal structure [12].
The depth of the 20 °C isotherm (D20) is often used as a reliable metric to quantify the upwelling variability in the SCTR (Figure 1b), and its variations affect the intensity of ocean–atmosphere interactions [13]. The analysis of D20 indicates that the strength of the SCTR upwelling also varies in association with climate variability, such as the Indian Ocean Dipole (IOD) and El Niño Southern Oscillation (ENSO). During the positive phases of the IOD and/or ENSO, upwelling in the SCTR can be suppressed due to the westward propagation of downwelling Rossby waves [14,15]. These characteristics would play a key role in modulating the diurnal cycle over the SCTR and impact regional ocean–atmosphere interactions in the tropical Indian Ocean.
Due to the limited number of in situ observations, reanalysis datasets such as the ERA5 [16] are essential for analyzing the diurnal variation of atmospheric variables in the tropical Indian Ocean. While the ERA5 and other reanalysis datasets offer valuable insights, they rely heavily on model parameterizations, which can lead to underestimations or oversimplifications of finer-scale diurnal variations [2]. These variations are particularly crucial in the upwelling regions. Such limitations highlight the importance of in situ measurements for capturing the atmospheric variability over the SCTR. This study presents the radiosonde observations with high temporal and spatial resolutions, providing the vertical profiles of temperature and relative humidity in the lower atmosphere (1000–650 hPa) over the tropical Indian Ocean. A series of these profiles obtained for approximately 24 h at a specific location aboard the research vessel would help our understanding of diurnal fluctuations in atmospheric conditions. Furthermore, a comparison between the in situ measurements and the ERA5 reanalysis dataset is provided, which would contribute to validating and improving reanalysis datasets over the tropical Indian Ocean.

2. Materials and Methods

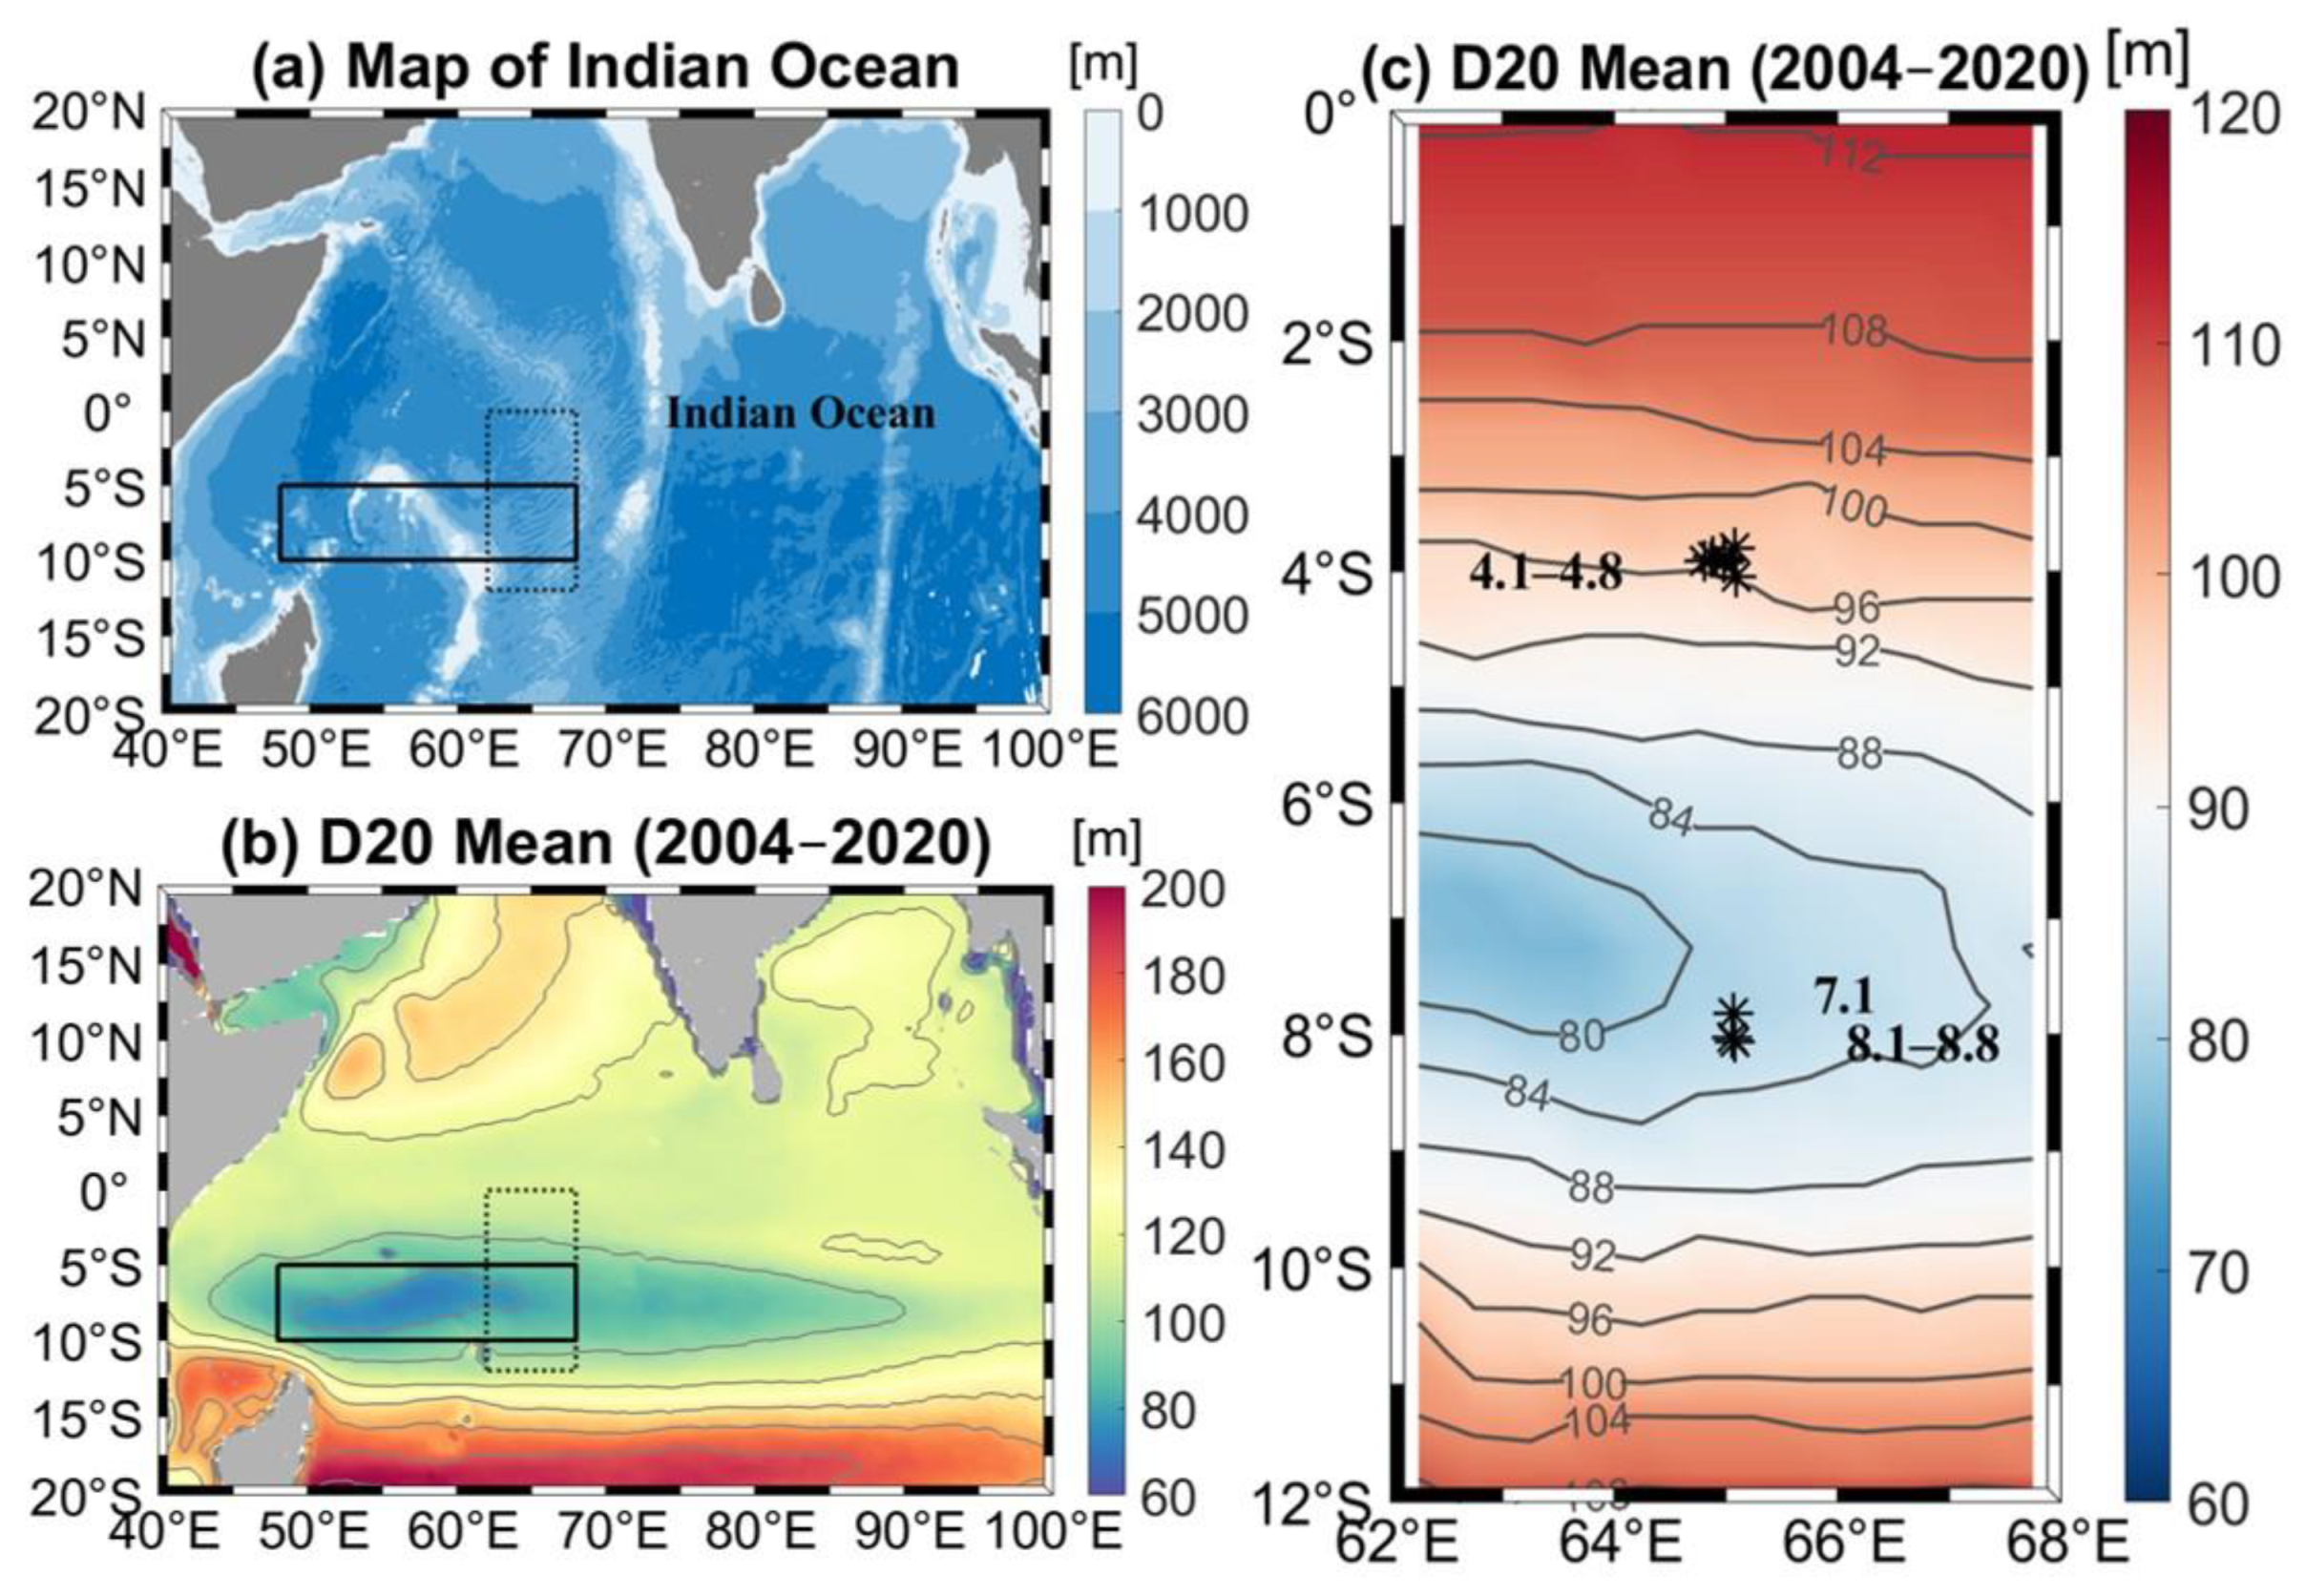
2.1. Radiosonde Observation

A total of 17 high-resolution vertical profiles of radiosonde data were obtained onboard the R/V Isabu using the Vaisala RS41-SG from 28 May to 1 June 2023 in the tropical Indian Ocean (Figure 1c). Observations were conducted every 3 h at around 65° E, 8° S (hereafter referred to as station 8) and at around 65° E, 4° S (hereafter referred to as station 4), within and outside the upwelling region, respectively (Table 1). Since these sites do not significantly deviate from each other in terms of atmospheric mesoscale perspective, they are considered a single observation point. The vertical profiles of atmospheric temperature and relative humidity had a resolution of approximately 7 m, with an ascent rate of approximately 3.5 m/s. All the profiles were interpolated to a 10 m resolution by applying cubic spline interpolation, and only data from 1000–650 hPa are presented to focus on the variations in the lower troposphere.

2.2. ERA5

The ERA5 reanalysis data were compared with the in situ radiosonde observation data. The ERA5, developed by the European Centre for Medium-Range Weather Forecasts (ECMWF), represents the latest version of ECMWF meteorological reanalysis, providing improved accuracy and resolution of atmospheric data [16]. The ERA5 dataset was selected due to its high spatial resolution of 0.25° × 0.25° in longitude and latitude at 37 pressure levels, making it particularly valuable for studying regions with limited direct observational coverage, such as the tropical Indian Ocean. The ERA5 tends to have relatively lower accuracy in representing relative humidity in tropical regions compared to mid-latitude regions. However, other reanalysis datasets, such as MERRA-2 and JRA-55, have lower spatial resolution and fewer pressure levels, making them less suitable for capturing the fine-scale diurnal variability in the tropical ocean. Despite its limitations, the ERA5 was selected as it provides a valuable reference for comparison with radiosonde observations. Hourly temperature and relative humidity data were used by selecting the exact dates and times of radiosonde launches at the nearest grid points to Stations 4 and 8. In addition, data from the period of 2004–2023 was also used to investigate the diurnal variation of the ERA5 over a 20-year period.

2.3. Simple Ocean Data Assimilation

The subsurface ocean temperature data from the Simple Ocean Data Assimilation (SODA) reanalysis product, version 3.4.2, were used to calculate the D20 for the period 2004–2020. SODA 3.4.2 is based on the Parallel Ocean Program, with a spatial resolution of 0.5° and 50 vertical levels in the ocean. The reanalysis assimilates in situ hydrographic observations and satellite data using the ensemble Kalman filter, as described by Carton et al. [17]. Due to the limited availability of oceanographic data in the tropical Indian Ocean, SODA remains an optimal choice for studying thermocline variability, such as D20, as it provides long-term subsurface ocean conditions.

3. Results

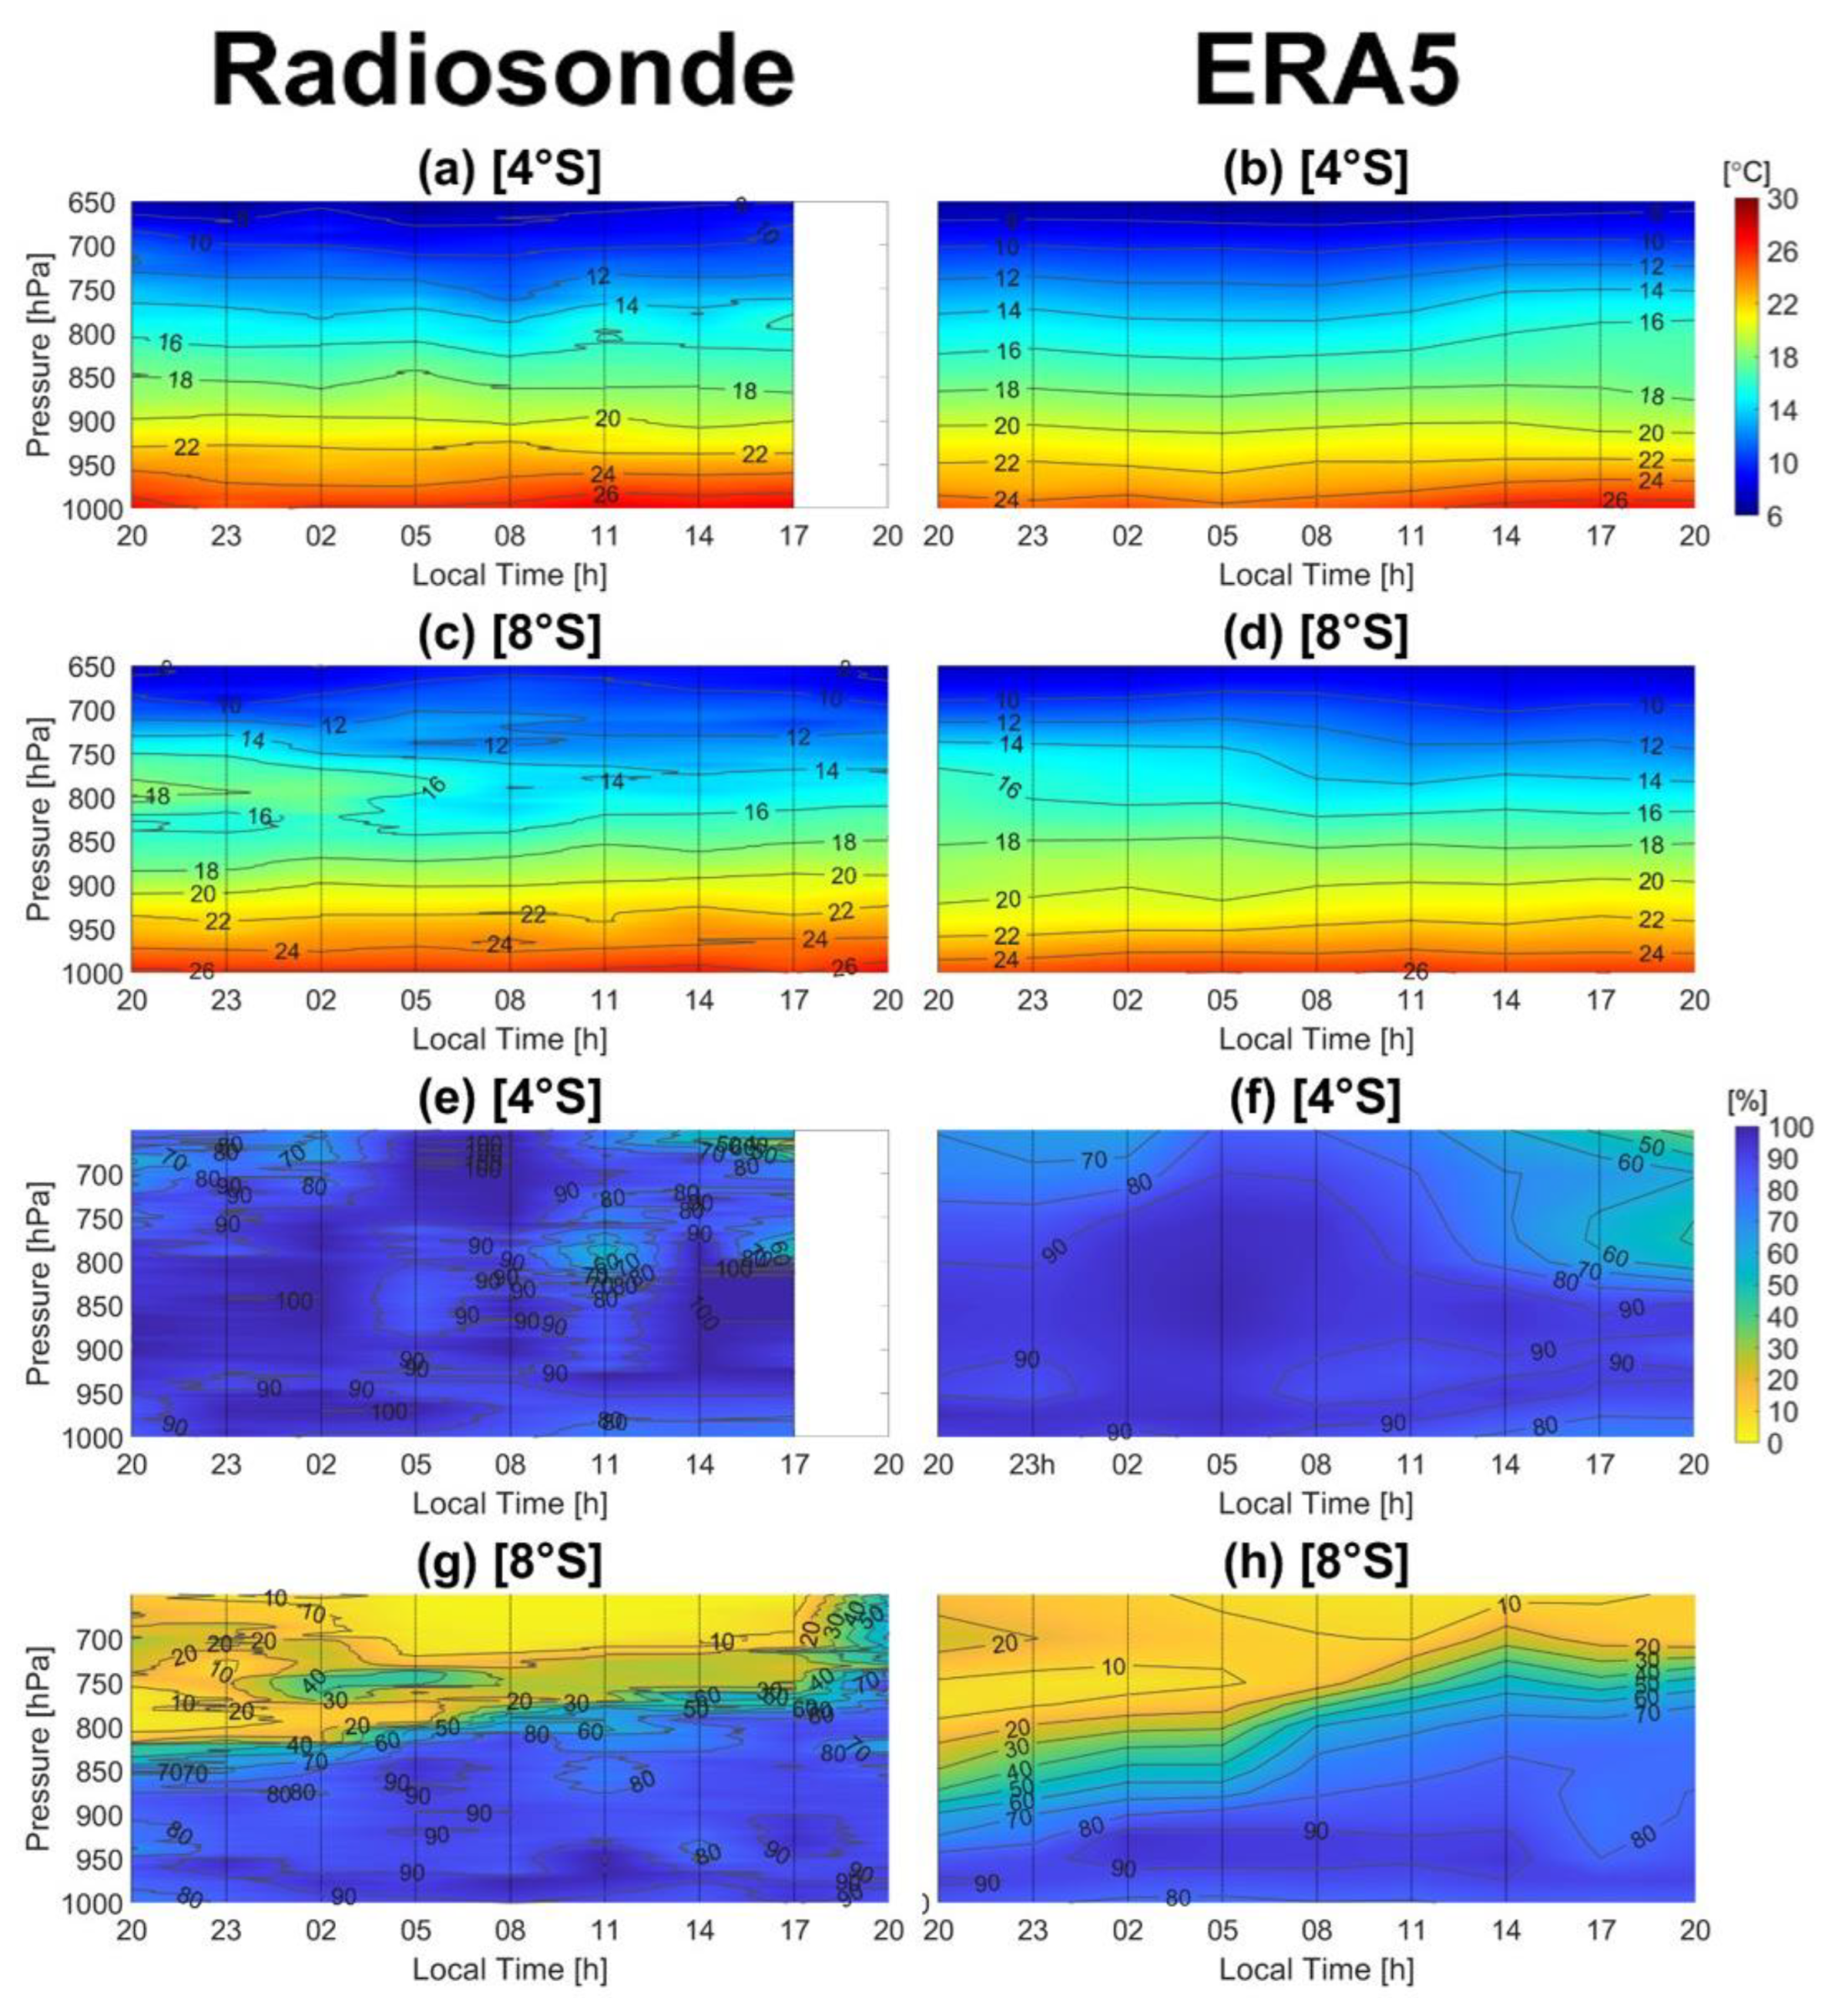
3.1. Comparison of Diurnal Variation (Radiosonde Observation vs. ERA5)

Figure 2 illustrates the vertical section of the diurnal variations at Stations 4 and 8 from the radiosonde observations and the ERA5. The temperature at Station 4, located outside the direct influence of the SCTR upwelling, shows clear diurnal variation at 1000 hPa, with a minimum in the early morning and a maximum in the late afternoon. At Station 8, located in the SCTR region, the temperature is generally colder at 1000 hPa and exhibits vertical inversion characteristics between 850 and 750 hPa during the nighttime. ERA5 exhibits similar but smoother diurnal variations compared to the observations. It is notable that the temperature inversion observed at Station 8 is not resolved in the ERA5.
In terms of relative humidity at Station 4, strong saturation is indicated by both the radiosonde observation and the ERA5. A few sporadic decreases in the observed relative humidity are evident in the ERA5, though they are much smoother in both space and time. The relative humidity at Station 8, located in the SCTR region, shows a strong vertical gradient both from the radiosonde observation and the ERA5. The low moisture layer is more significant at nighttime, likely linked to the pronounced temperature inversion layer. The inversion layer may create a boundary that traps moisture near the surface, while the air above remains relatively dry, which would amplify the vertical gradient at Station 8. The vertical gradient is smoothed out in the ERA5 compared to the radiosonde observation.

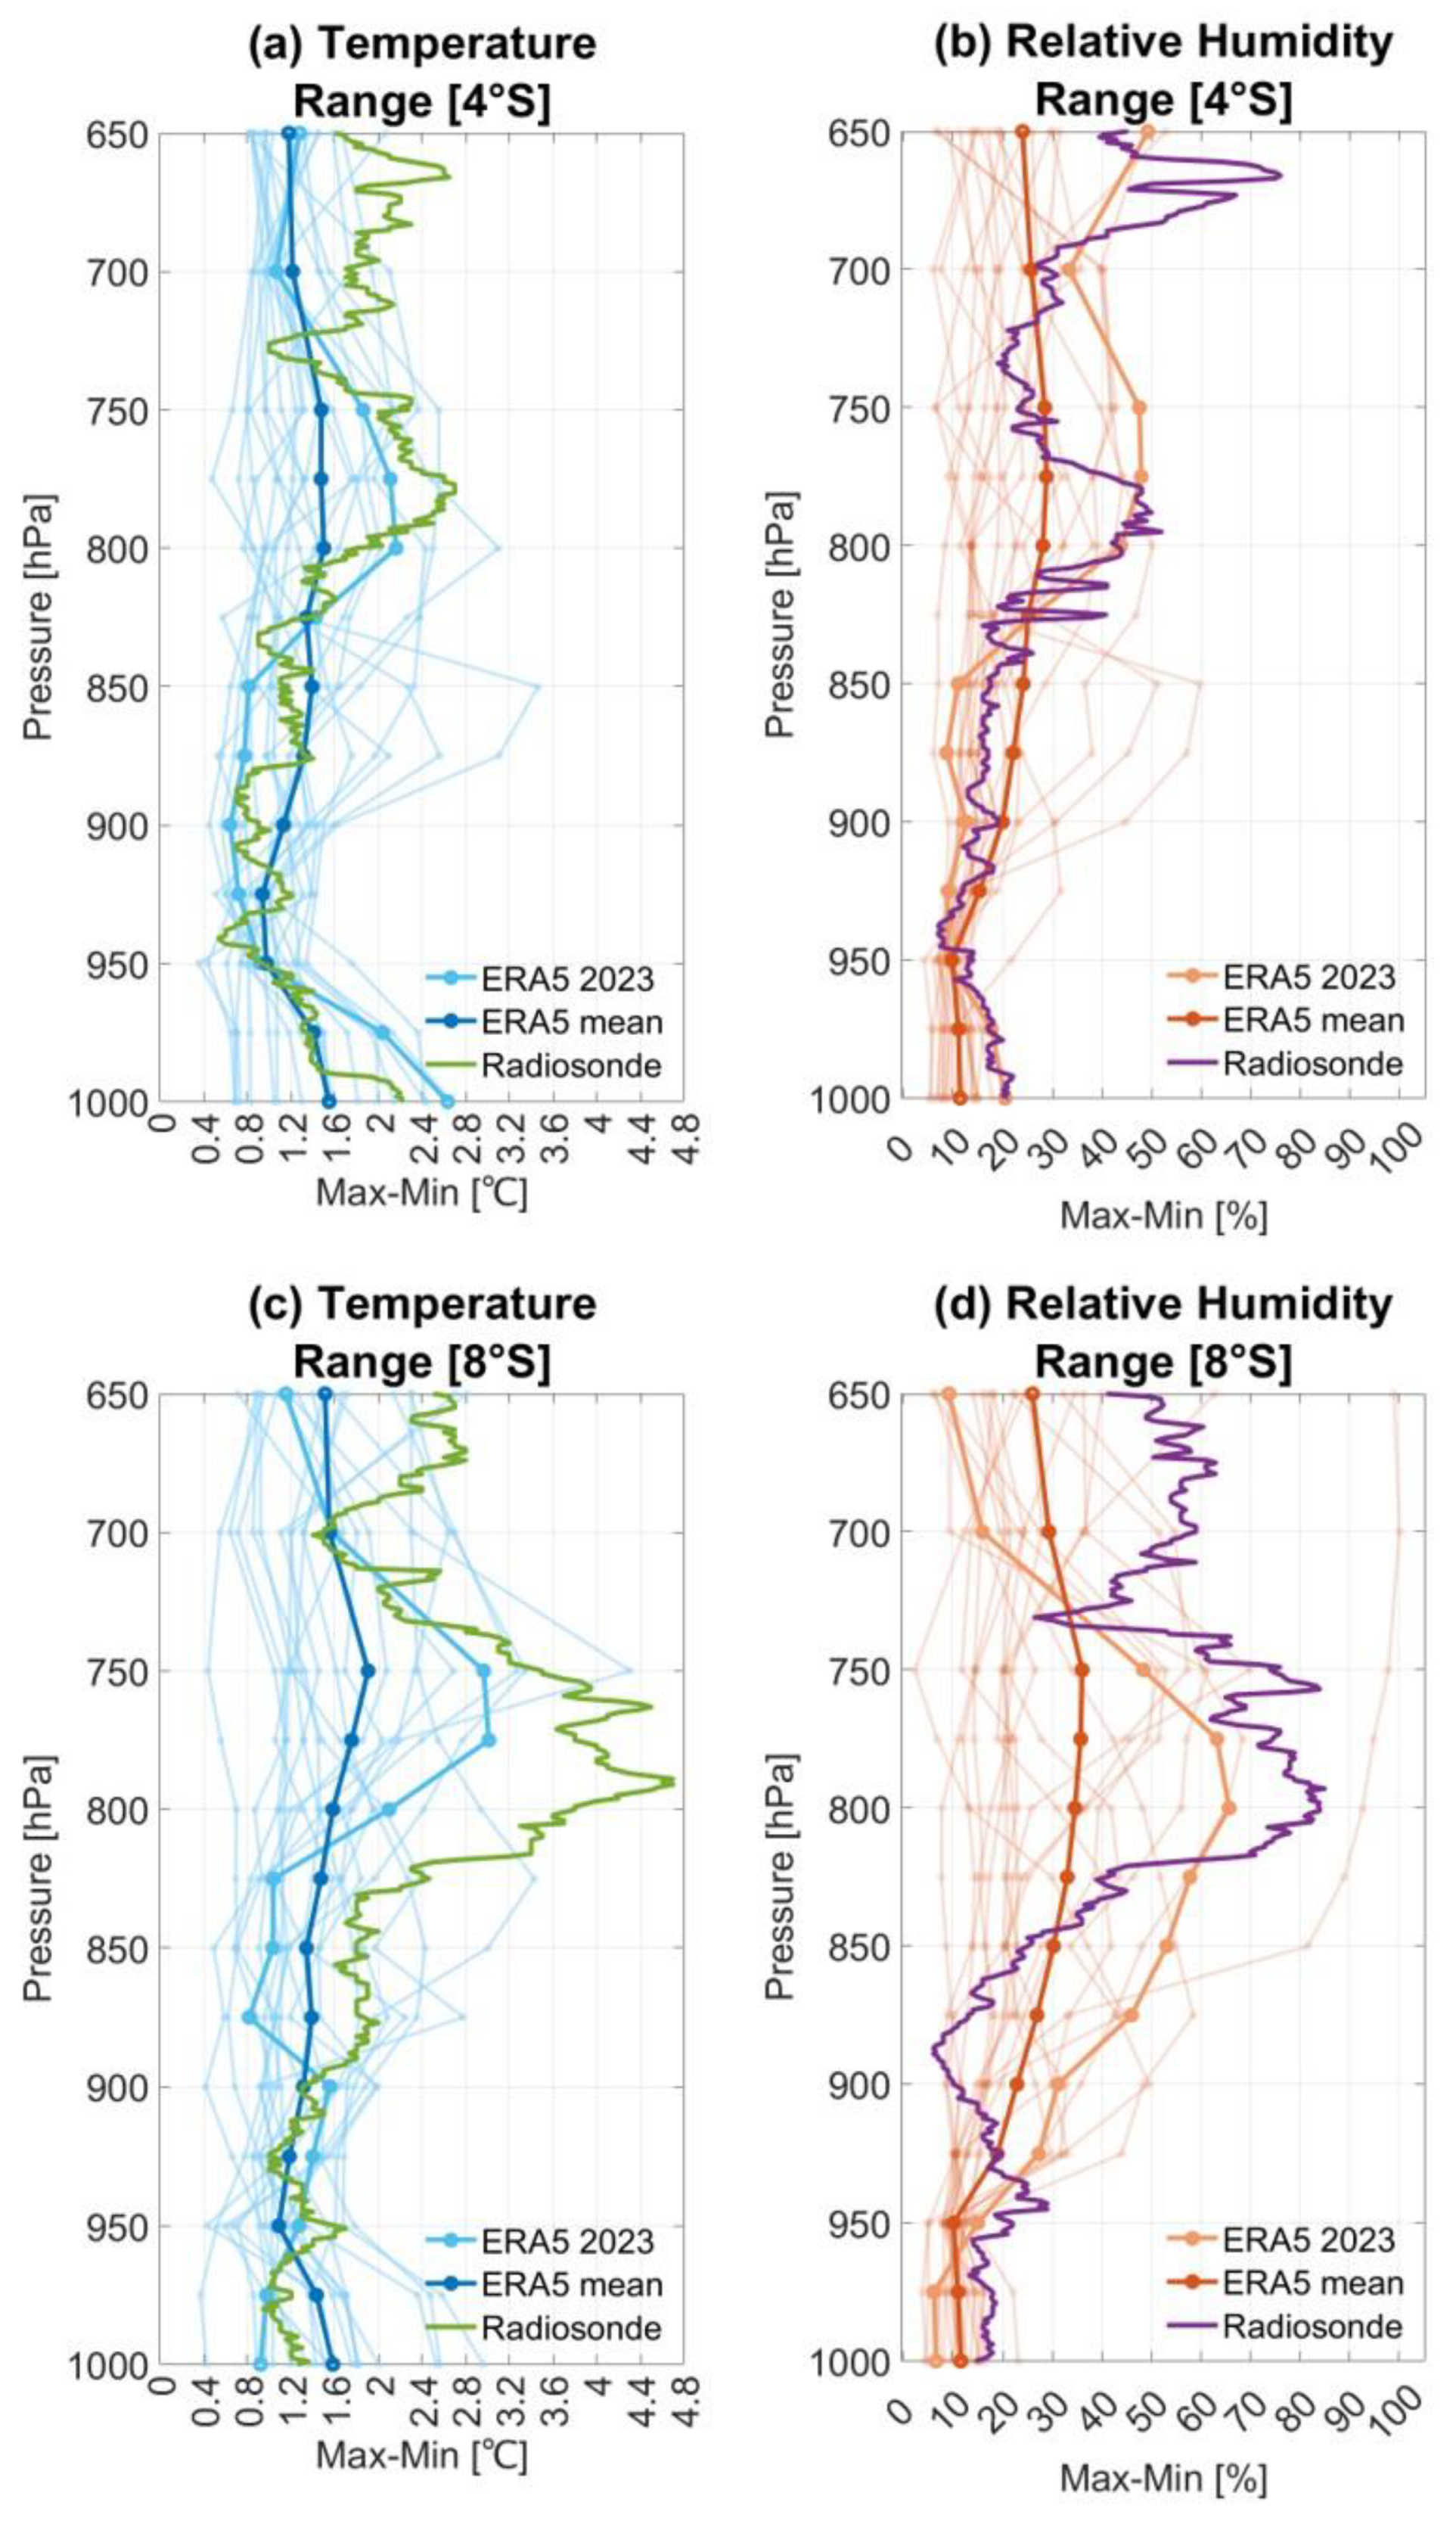
3.2. Comparison of Diurnal Ranges (Radiosonde Observation vs. ERA5)

Figure 3a,b present the diurnal ranges of temperature and relative humidity (maximum minus minimum) from the radiosonde observation and ERA5 reanalysis data at Station 4. The diurnal temperature ranges from the ERA5 (blue with dots) generally follow that of the observation (green), decreasing from 1000 hPa to 950 hPa, increasing from 850 hPa to 800 hPa, and then decreasing again from 800 hPa to 700 hPa. The diurnal humidity range from the ERA5 (orange with dots) also generally follows that of the observations (purple), showing small values from 1000 hPa to 850 hPa, an increase from 850 hPa to 800 hPa, and then a decrease from 800 hPa to 700 hPa. At Station 8, the diurnal ranges of temperature and humidity from the ERA5 generally exhibit consistent characteristics with those from the observations (Figure 3c,d). However, the diurnal temperature ranges above 900 hPa are mostly underestimated in the ERA5. The discrepancy in humidity is significant at 950–800 hPa and above 750 hPa.
It is notable that the ERA5 aligns more closely with radiosonde observations at Station 4 compared to Station 8. The diurnal ranges are generally larger at Station 8 and significantly underestimated. The diurnal ranges of the ERA5 on the same calendar date over 20 years are also displayed in Figure 3, showing overall smaller values compared to those in 2023 (Figure 3). Considering that almost all the profiles of diurnal ranges from the ERA5 for the past 20 years do not exceed those from the radiosonde observations in 2023, the underestimation of diurnal variations in the ERA5 would not be limited to just 2023.

4. Discussion and Conclusions

This study reports a comparison of the radiosonde observations with the ERA5 at Stations 4 and 8 in the tropical Indian Ocean. Both the radiosonde observations and ERA5 indicate more stable thermal conditions and reduced moisture variability at Station 4. At Station 8, under the influence of the significant upwelling in the SCTR, the comparison reveals a noticeable discrepancy in the diurnal variations, suggesting that the ERA5 reanalysis dataset may systematically underestimate the diurnal variations of temperature and relative humidity. Dai (2023) noted that the ERA5 tends to underestimate the diurnal cycle of temperature over oceanic regions [2], which is consistent with our findings, particularly in the upwelling regions of the tropical Indian Ocean, where strong surface cooling and boundary layer adjustments likely contribute to this discrepancy. Further studies incorporating additional observations of surface fluxes and boundary layer processes are needed to better understand the causes of these discrepancies.
These results underscore the challenges faced by reanalysis products in resolving the characteristics of diurnal atmospheric processes, particularly over the ocean with strong ocean–atmosphere coupling. The pronounced diurnal variations observed at Station 8 emphasize the importance of integrating high-resolution observational data, such as radiosonde measurements, into reanalysis products. Enhanced representation of diurnal variations and ocean–atmosphere interactions in regions like the SCTR will require incorporating observational insights and refining the current models to address the limitations. Such advancements will improve the accuracy of reanalysis datasets and deepen our understanding of atmospheric dynamics in complex regions like the SCTR.

Author Contributions

Conceptualization, H.N. and J.P.; methodology, J.P. and E.L.; validation, J.P.; formal analysis, J.P.; investigation, J.P.; data curation, J.P.; writing—original draft preparation, J.P. and H.N.; writing—review and editing, J.P., H.N. and E.L.; visualization, J.P.; supervision, H.N.; project administration, H.N.; funding acquisition, H.N. All authors have read and agreed to the published version of the manuscript.

Funding

This work was supported by the Korea Institute of Marine Science & Technology Promotion (KIMST), funded by the Ministry of Oceans and Fisheries, Republic of Korea, through the joint application program (RS-2023-KS231694) and the project titled “KIOS (Korea Indian Ocean Study): Korea–US Joint Observation Study of the Indian Ocean” (RS-2022-KS221662).

Institutional Review Board Statement

Not applicable.

Informed Consent Statement

Not applicable.

Data Availability Statement

The radiosonde data will be made available upon request to hanna.ocean@snu.ac.kr. Other datasets are publicly available, and the sources are described in the article.

Acknowledgments

The authors thank all crew members and scientists onboard the R/V Isabu for their assistance during the onboard experiment.

Conflicts of Interest

The authors declare no conflicts of interest.

References

  1. Dai, A. The diurnal cycle from observations and ERA5 in precipitation, clouds, boundary layer height, buoyancy, and surface fluxes. Clim. Dyn. 2024, 62, 5879–5908. [Google Scholar]
  2. Dai, A. The diurnal cycle from observations and ERA5 in surface pressure, temperature, humidity, and winds. Clim. Dyn. 2023, 61, 2965–2990. [Google Scholar] [CrossRef]
  3. Mapes, B.E.; Warner, T.T.; Xu, M.; Negri, A.J. Diurnal patterns of rainfall in northwestern South America. Part I: Observations and context. Mon. Weather Rev. 2003, 131, 799–812. [Google Scholar]
  4. Johnson, R.H.; Rickenbach, T.M.; Rutledge, S.A.; Ciesielski, P.E.; Schubert, W.H. Trimodal characteristics of tropical convection. J. Clim. 1999, 12, 2397–2418. [Google Scholar]
  5. Mapes, B.E.; Warner, T.T.; Xu, M. Diurnal patterns of rainfall in northwestern South America. Part III: Diurnal gravity waves and nocturnal convection offshore. Mon. Weather Rev. 2003, 131, 830–844. [Google Scholar] [CrossRef]
  6. Soden, B.J. The diurnal cycle of convection, clouds, and water vapor in the tropical upper troposphere. Geophys. Res. Lett. 2000, 27, 2173–2176. [Google Scholar] [CrossRef]
  7. Hayden, L.J.; Tan, J.; Bolvin, D.T.; Huffman, G.J. Variations in the diurnal cycle of precipitation and its changes with distance from shore over two contrasting regions as observed by IMERG, ERA5, and Spaceborne Ku Radar. J. Hydrometeo. 2023, 24, 675–689. [Google Scholar] [CrossRef]
  8. Hendon, H.H.; Woodberry, K. The diurnal cycle of tropical convection. J. Geophys. Res. Atmos. 1993, 98, 16623–16637. [Google Scholar] [CrossRef]
  9. Woodberry, K.E.; Luther, M.E.; O’Brien, J.J. The Wind-driven seasonal circulation in the Southern Tropical Indian Ocean. J. Geophys. Res. Ocean. 1989, 94, 17985–18002. [Google Scholar] [CrossRef]
  10. McCreary, J.P.; Kundu, P.K.; Molinari, R.L. A numerical investigation of dynamics, thermodynamics and mixed-layer processes in the Indian Ocean. Prog. Oceano. 1993, 31, 181–244. [Google Scholar]
  11. Schott, F.A.; Xie, S.; McCreary, J.P. Indian Ocean Circulation and climate variability. Rev. Geophys. 2009, 47, 2007RG000245. [Google Scholar]
  12. Yokoi, T.; Tozuka, T.; Yamagata, T. Seasonal variation of the Seychelles Dome. J. Clim. 2008, 21, 3740–3754. [Google Scholar]
  13. Xie, S.P.; Annamalai, H.; Schott, F.A.; McCreary, J.P. Structure and mechanisms of South Indian Ocean climate variability. J. Clim. 2002, 15, 864–878. [Google Scholar] [CrossRef]
  14. Masumoto, Y.; Meyers, G. Forced Rossby waves in the southern tropical Indian Ocean. J. Geophys. Res. Ocean. 1998, 103, 27589–27602. [Google Scholar] [CrossRef]
  15. Lee, E.; Kim, C.; Na, H. Suppressed upwelling events in the Seychelles–Chagos Thermocline Ridge of the Southwestern Tropical Indian Ocean. Ocean Sci. J. 2022, 57, 305–313. [Google Scholar]
  16. Hersbach, H.; Bell, B.; Berrisford, P.; Hirahara, S.; Horányi, A.; Muñoz-Sabater, J.; Nicolas, J.; Peubey, C.; Radu, R.; Schepers, D.; et al. The ERA5 global reanalysis. Q. J. R. Meteorol. Soc. 2020, 146, 1999–2049. [Google Scholar]
  17. Carton, J.A.; Chepurin, G.A.; Chen, L. SODA3: A new ocean climate reanalysis. J. Clim. 2018, 31, 6967–6983. [Google Scholar] [CrossRef]
Figure 1. Maps of (a) the bathymetry and (b,c) the depth of the 20 °C isotherm (D20) in the tropical Indian Ocean. Note that D20 is averaged for 2004–2020 based on the dataset availability. The bold black rectangular boxes in (a,b) denote the SCTR region, while the dotted black rectangular boxes indicate the domain of (c) as 12° S–0° S and 62° E–68° E. Black asterisks in (c) indicate the radiosonde observation sites during the R/V Isabu cruise. Sites 8.1–8.8 and 7.1 correspond to Station 8 as representative data of 8° S, while sites 4.1–4.8 correspond to Station 4 as representative data of 4° S.
Atmosphere 16 00404 g001
Figure 2. Diurnal variations in (ad) temperature and (eh) relative humidity from (a,c,e,g) radiosonde observations and (b,d,f,h) ERA5 at Station 4 (4° S) and Station 8 (8° S) with pressure levels ranging from 1000 hPa to 650 hPa. The vertical lines indicate 3-hourly intervals of radiosonde observation (20 h to 20 h) in local standard time (LST; UTC+5).
Atmosphere 16 00404 g002
Figure 3. Comparison of diurnal ranges (maximum minus minimum) in temperature (°C) (a,c) and relative humidity (%) (b,d) at Station 4 (4° S) and Station 8 (8° S). Green and purple plots denote the ranges from radiosonde observations, while blue and orange plots denote those from ERA5. Light blue and orange plots denote ERA5 on the same calendar date for 20 years (2004–2023), and dark blue and red plots denote the 20-year mean of ERA5.
Atmosphere 16 00404 g003
Table 1. Description of radiosonde observations conducted from 28 May to 1 June 2023 in the western tropical Indian Ocean (4° S and 8° S, 65° E). Time is presented in local standard time (LST; UTC+5). The observational data were obtained using Vaisala GPS radiosondes (RS41–SG) with a temporal resolution of 2 s and a vertical resolution of approximately 7 m.
StationSitesLatitude (°S)Longitude (°E)Date and Time
(YYYY-MM-DD HH)
44.14.04665.0972023-05-31 20
4.23.90664.8032023-05-31 23
4.33.80165.0782023-06-01 02
4.43.87664.8832023-06-01 05
4.53.96664.9832023-06-01 08
4.63.87264.9852023-06-01 11
4.73.89364.9842023-06-01 14
4.83.92764.9842023-06-01 17
88.18.02665.0622023-05-28 20
8.28.06765.0832023-05-28 23
8.38.06765.0832023-05-29 02
8.48.06765.0832023-05-29 05
8.58.06765.0832023-05-29 08
8.68.06765.0832023-05-29 11
8.78.06765.0832023-05-29 14
8.88.06765.0832023-05-29 17
7.17.81665.0682023-05-29 20
Disclaimer/Publisher’s Note: The statements, opinions and data contained in all publications are solely those of the individual author(s) and contributor(s) and not of MDPI and/or the editor(s). MDPI and/or the editor(s) disclaim responsibility for any injury to people or property resulting from any ideas, methods, instructions or products referred to in the content.

