1. Introduction
Wind shear presents a significant aerodynamic hazard, affecting aircraft stability, imposing structural stresses, and disrupting passenger comfort. The International Civil Aviation Organization (ICAO) recognizes low-level wind shear, which occurs below 1600 feet in altitude and within three nautical miles of the runway threshold, as a major operational risk during takeoff and landing. This atmospheric disturbance can cause sudden changes in wind speed, generate severe turbulence, and disrupt an aircraft’s approach path, often requiring go-arounds and increasing pilot workload [
1,
2].
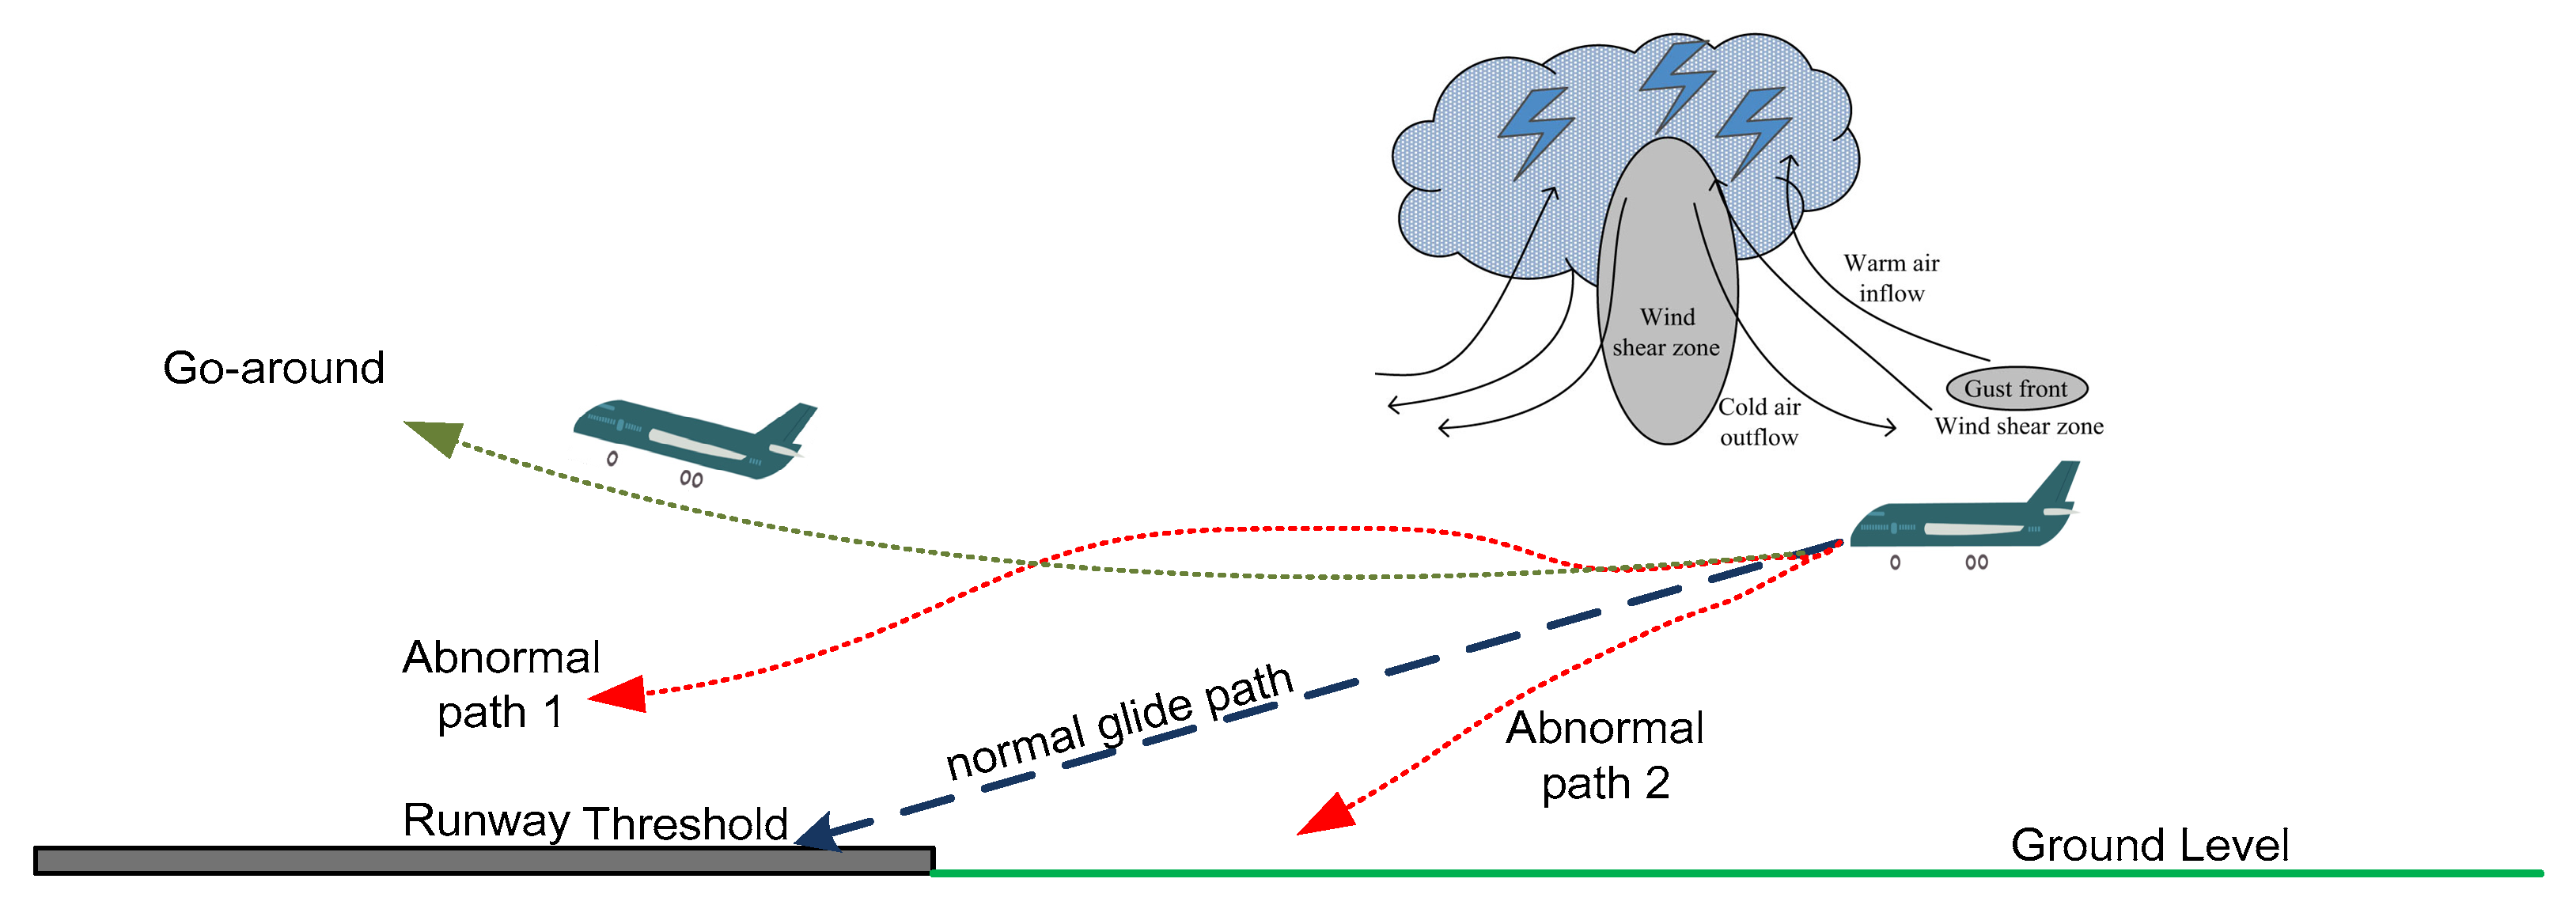
Figure 1 illustrates the impact of wind shear on an approaching aircraft, resulting in potential disruptions such as sudden deviations from the intended glide path and the need for go-arounds. The figure presents a normal glide path along with two abnormal flight paths. In the first case, the aircraft encounters severe wind disturbances, leading to a go-around before reaching the runway threshold. The second occurs due to wind shear-induced loss of altitude, causing a lower-than-expected approach near the runway. These deviations can compromise flight stability, increase pilot workload, and necessitate immediate corrective actions to maintain safe flight operations. The presence of gust fronts, cold air outflows, and turbulence within the wind shear zone further intensifies these challenges, increasing the risk of missed approaches and requiring precise pilot intervention.
The significant impact of wind shear on aviation operations necessitates precise forecasting to enhance flight safety and operational reliability. Accurate prediction allows pilots and air traffic controllers to implement proactive measures, minimizing disruptions and mitigating risks. By anticipating wind shear occurrences, adjustments can be made to flight paths, takeoff and landing schedules, and other operational procedures to ensure safer flight operations. Reliable forecasts enable timely warnings, equipping pilots with critical information to prepare for sudden wind variations and adjust their maneuvers accordingly. This predictive capability reduces the likelihood of wind shear-related incidents and improves overall flight stability.
Wind shear is a transient phenomenon that changes over time and is influenced by dynamic atmospheric conditions [
3,
4]. Numerous airports globally have gained substantial advantages from the use of precise, high-resolution, remote sensing technologies such as the Terminal Doppler Weather Radar (TDWR) and Doppler Light Detection and Ranging (LiDAR), which are essential for detecting wind shear events. The primary methods for detecting wind shear include TDWR, ground-based anemometer networks, and wind profilers [
5,
6,
7]. Since the mid-1990s, these techniques have been effective in alerting airports to wind shear, especially during tropical cyclones and thunderstorms. However, TDWR systems can be less accurate in clear weather conditions. To address this, the LiDAR system has been integrated with TDWR to enhance the detection and warning capabilities for wind shear in clear weather. Doppler LiDAR can detect return signals from aerosols, providing accurate Doppler wind measurements even in clear air.
Although advanced technologies effectively detect wind shear near airports, they have limitations in predicting its timing and associated risk factors. Accurate wind shear forecasting is essential for improving aviation safety, as it enables timely warnings and the implementation of proactive measures during critical flight phases. Time series modeling is particularly effective for this task, utilizing historical data to analyze and predict wind shear occurrences by identifying temporal patterns and trends. This predictive capability enhances situational awareness, allowing data-driven adjustments to flight operations and reducing the likelihood of wind shear-related incidents [
8].
Extensive research has focused on wind speed forecasting within the power and energy sectors, driven by the increasing demand for wind energy generation and advancements in wind energy technology. This body of work is reflected in numerous studies that explore predictive modeling techniques, ranging from statistical methods to machine learning approaches, aimed at improving the accuracy and reliability of wind speed predictions for efficient energy management and grid stability [
9,
10,
11,
12]. In contrast, relatively few studies have focused on predicting wind shear events near airport runways. Despite its significant impact on aviation safety, research in this area remains limited, with most efforts directed toward detection rather than prediction. Capturing the complex atmospheric dynamics that lead to wind shear presents a major challenge, requiring advanced modeling approaches that can accurately forecast its occurrence and intensity. Improved prediction techniques are essential for enhancing flight safety and optimizing operational planning [
13,
14,
15,
16]. As a result, wind shear prediction in aviation has received less attention than wind energy forecasting. Recent advancements in Artificial Intelligence (AI) have led to significant improvements in accuracy and efficiency across various aviation applications. Machine learning and deep learning models have been applied to predict and analyze complex meteorological phenomena, including turbulence, wind shear, and storm patterns. These AI-driven forecasts enhance situational awareness for pilots and air traffic controllers, contributing to safer and more efficient flight operations. For instance, in aviation meteorology, AI models have been widely employed to evaluate turbulence and wind shear effects. Hybrid Principal Component Analysis (PCA) and K-Means clustering have been used to assess the impact of turbulence on aircraft performance [
17]. For forecasting intense wind shear events, Extreme Gradient Boosting (XGBoost) has demonstrated strong predictive capabilities [
8]. The severity classification of wind shear has been achieved using the BalanceCascade framework combined with SHAP analysis, allowing for better interpretability of model predictions [
18]. The assessment of flight turbulence using LiDAR data has been explored through a combination of Conditional Generative Adversarial Networks (CGAN) and XGBoost, enhancing the accuracy of turbulence predictions [
19]. Similarly, Random Forest (RF) has been applied for real-time diagnosis of turbulence associated with thunderstorms, aiding in better turbulence monitoring and warning systems [
20]. In aviation safety, AI-driven techniques have been utilized to predict and mitigate risks associated with flight operations. A hybrid model combining Support Vector Machines (SVM) and Deep Neural Networks (DNN) has been employed for forecasting aviation incident risks [
21]. For flight risk identification, clustering algorithms have been used to select the most relevant parameters for risk assessment [
22]. To predict aircraft system failures, Multi-Layer Perceptron (MLP) and Support Vector Regression (SVR) models have been implemented, offering accurate failure detection and maintenance insights [
23]. Furthermore, Recurrent Neural Networks (RNNs) have been applied to detect anomalies in aircraft data, improving early fault detection and operational reliability [
24].
In aviation operations, AI models have been integrated to optimize air traffic management and flight efficiency. RF has been employed to forecast temporal and spatial delay states of air traffic, improving congestion management [
25]. To enhance flight delay prediction, an Attention-Based Bidirectional Long Short-Term Memory (AB-LSTM) network has been implemented, providing higher accuracy in delay forecasting [
26]. Predicting departure delays at airports has been facilitated using Neural Networks, allowing for better scheduling and resource allocation [
27]. Similarly, LSTM models have been utilized to estimate aircraft boarding times at gates, optimizing passenger flow and turnaround efficiency [
28]. Furthermore, an Explainable Boosting Machine (EBM) has been applied to predict missed approaches induced by wind shear based on pilot reports (PIREPs), providing an interpretable framework for identifying operational disruptions [
29].
Despite these advancements, wind shear forecasting remains a challenging task, requiring more robust predictive models that can effectively capture its complex temporal dependencies. This study aims to develop an advanced wind shear prediction framework that integrates Variational Mode Decomposition (VMD) [
30,
31], Tree-structured Parzen Estimator (TPE), and Temporal Convolutional Network (TCN) [
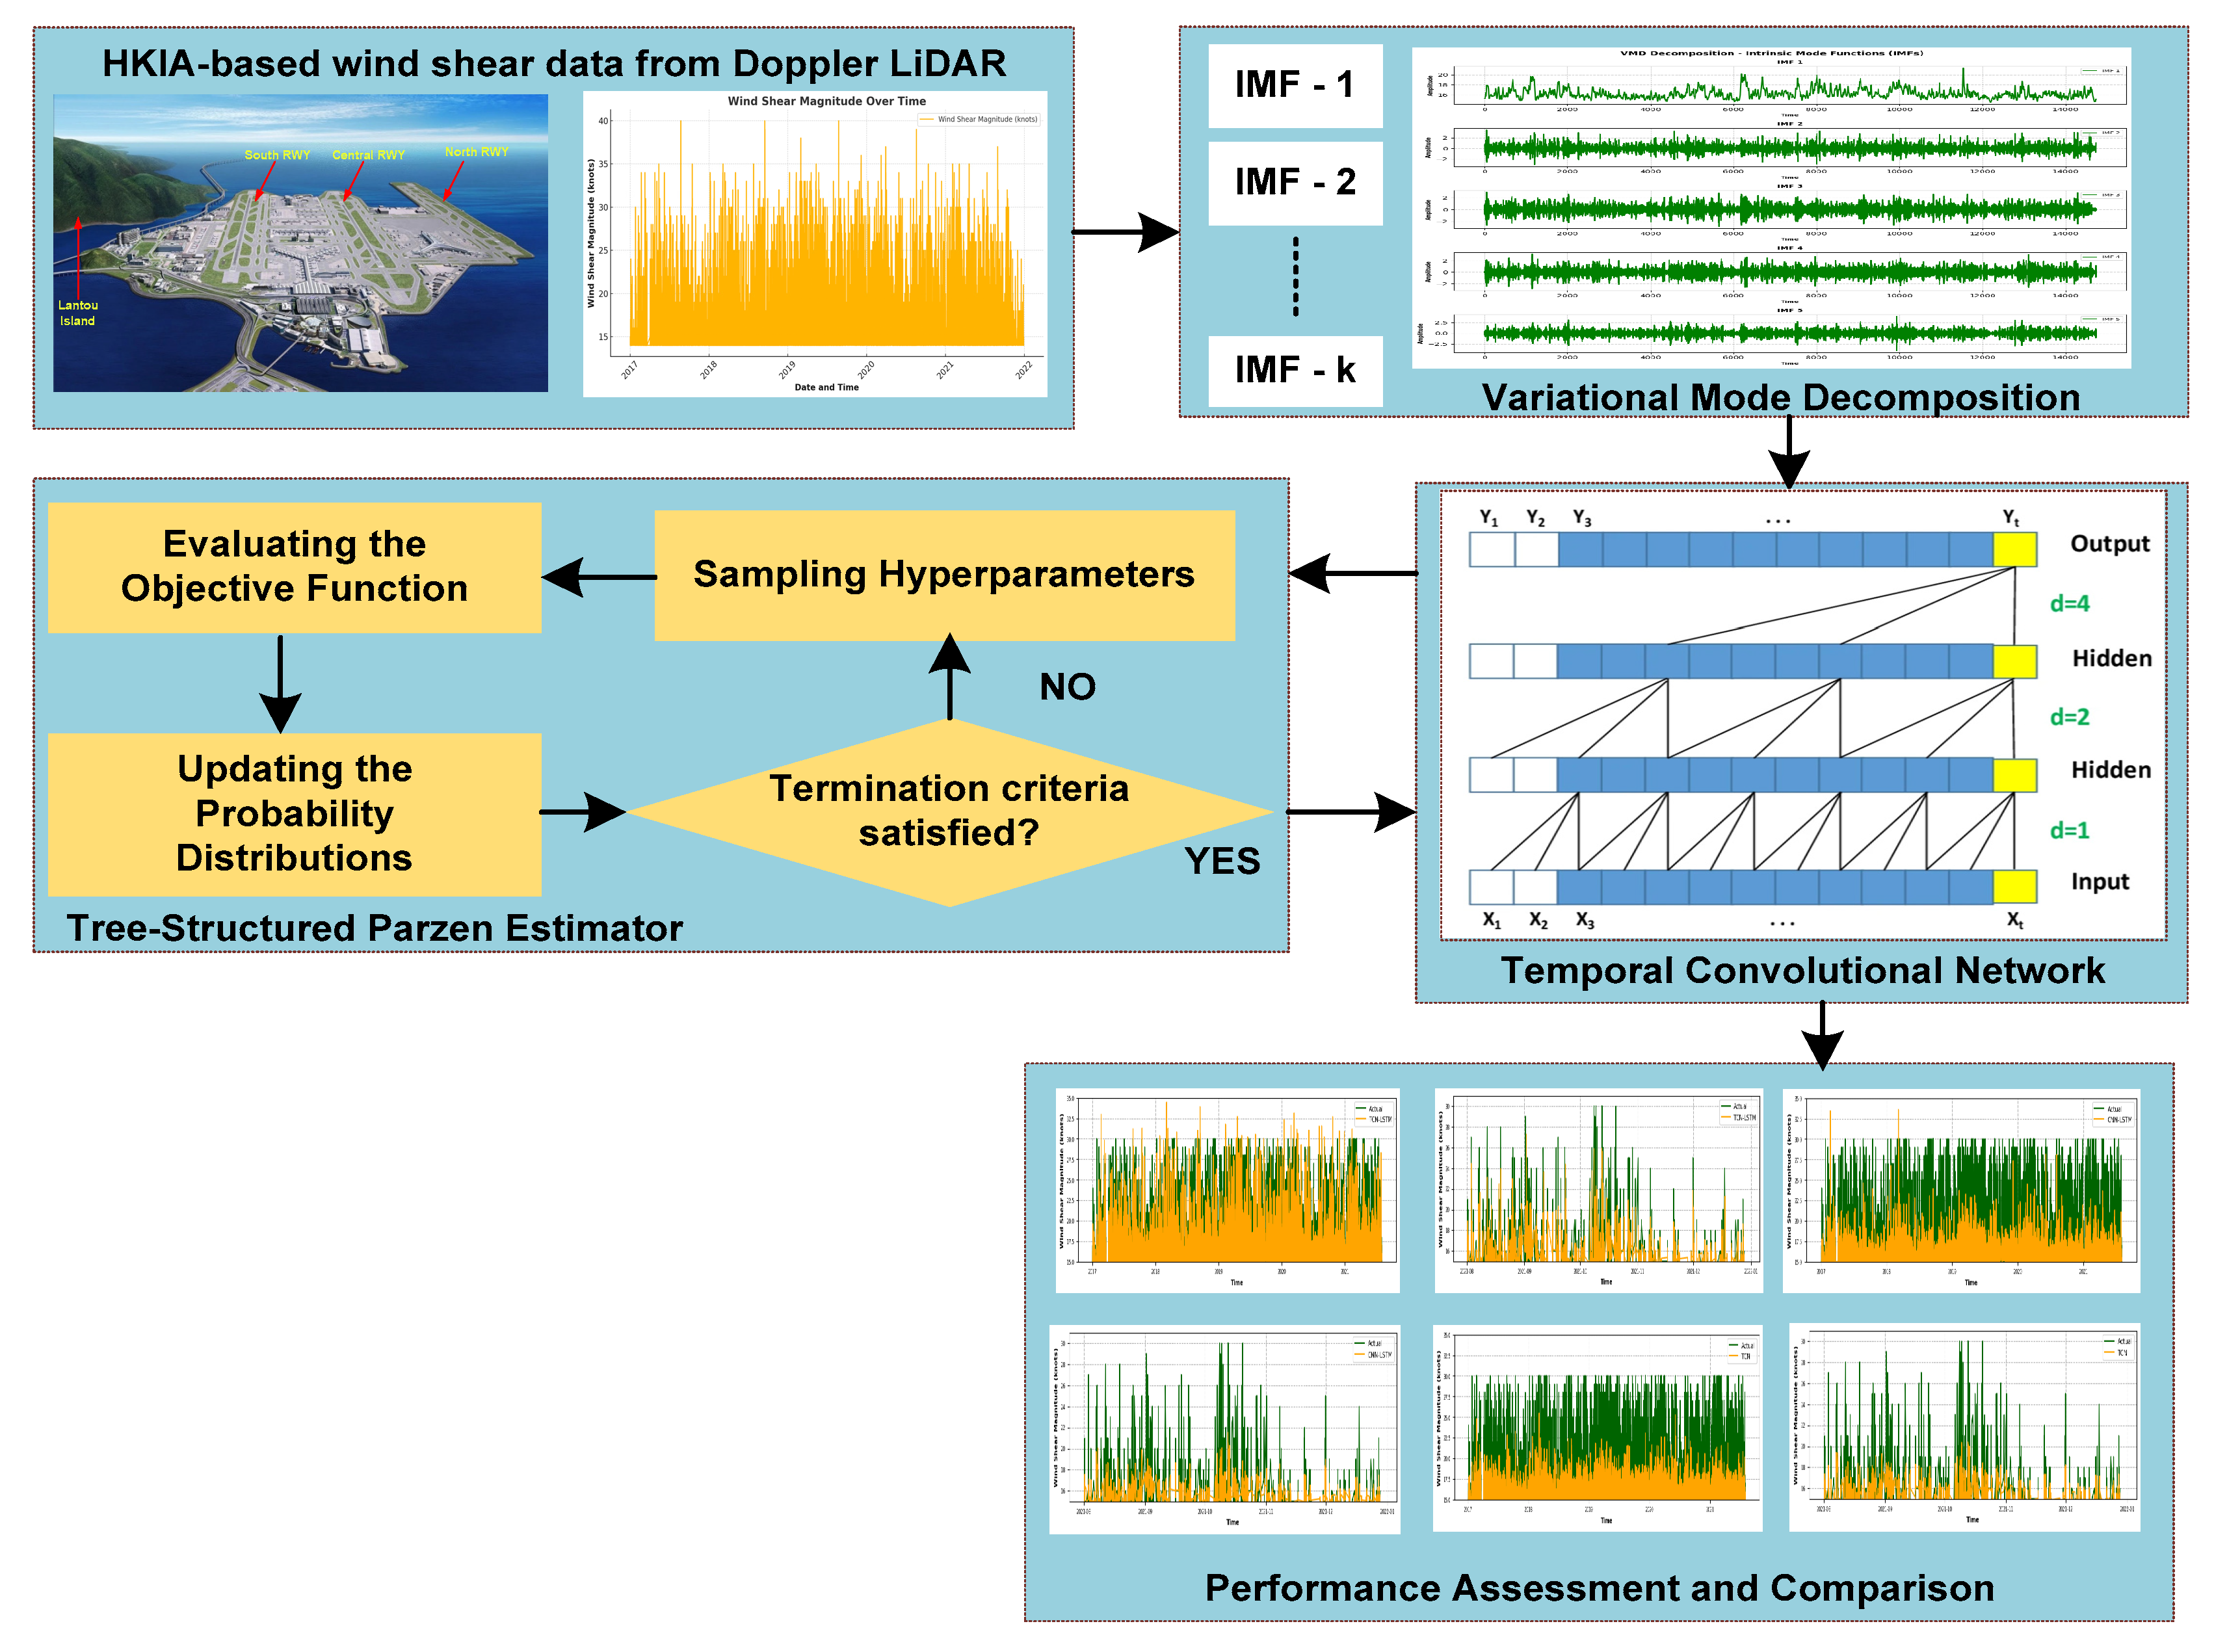
32]. The primary objective is to enhance wind shear forecasting accuracy at Hong Kong International Airport (HKIA) using Doppler LiDAR data. The key research tasks include (1) decomposing wind shear signals into intrinsic mode functions (IMFs) using VMD for better feature extraction; (2) optimizing TCN hyperparameters with TPE to improve predictive performance; (3) evaluating the effectiveness of the proposed VMD-TPE-TCN model against state-of-the-art deep learning models such as LSTM, BiLSTM, and GRU; and (4) assessing the model’s ability to provide reliable forecasts that support aviation safety and operational planning as shown in
Figure 2. To the best of our knowledge, this is the first application of a VMD-TPE-TCN framework for wind shear modeling in aviation safety, marking a significant advancement in meteorological forecasting.
The remainder of the paper is organized as follows:
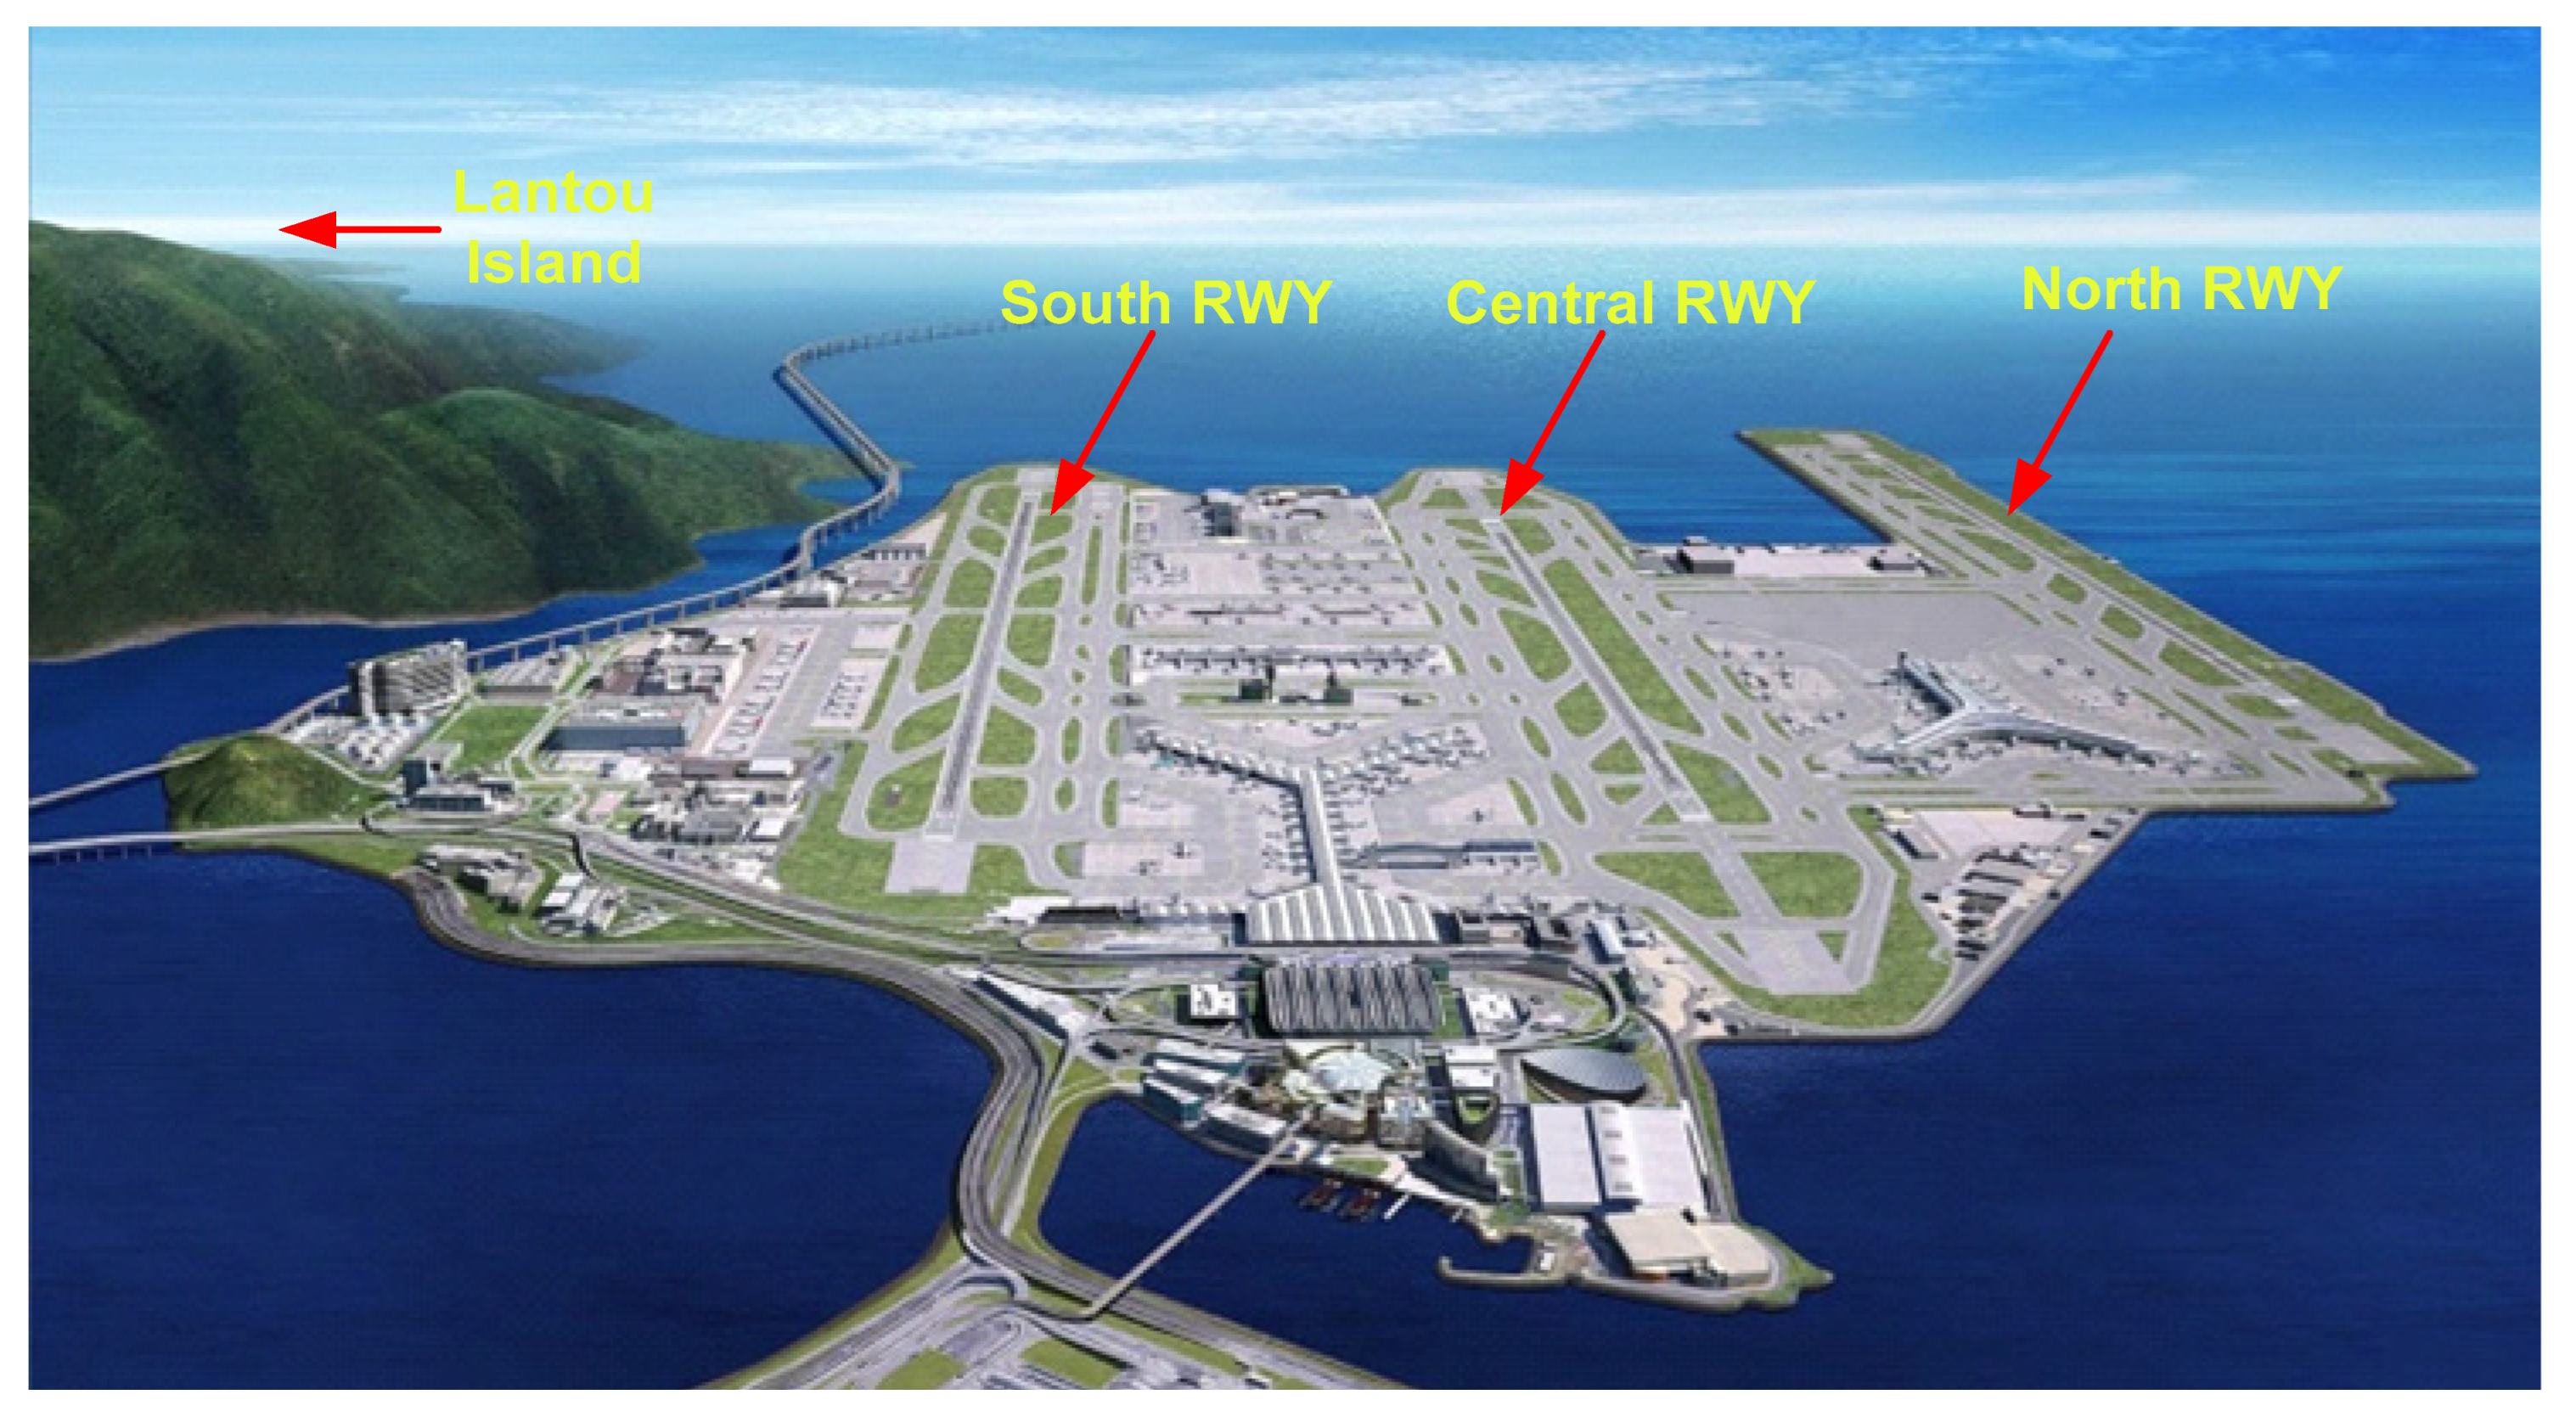
Section 2 illustrates detailed information about the study location and HKIA-based Doppler LiDAR data, and provides an overview of the Hybrid VMD-TPE-TCN framework and performance metrics.
Section 3 provides a detailed analysis of data including performance assessment.
Section 4 concludes by summarizing the findings and future recommendations.
3. Results and Discussion
The wind shear dataset from the Doppler LiDAR at HKIA comprises a total of 147,290 wind shear measurements collected from 1 January 2020 to 29 December 2021. These measurements are recorded at irregular intervals, capturing variations that meet or exceed the 14-knot threshold for wind shear events, as defined by the ICAO.
Table 3 presents the descriptive statistics for wind shear magnitude, including the minimum, mean, maximum, median, standard deviation (SD), skewness, and kurtosis. For modeling and forecasting, the Doppler LiDAR dataset is split into training and testing sets. The training data include records from 1 January 2020 to 30 July 2021, while the testing dataset consists of observations from 1 August 2021 to 29 December 2021. The implementation was carried out in Python 3.10 on a PC with an Intel(R) Core(TM) i7-6700HQ CPU at 2.6 GHz and 16 GB of RAM, running Windows 10.
3.1. VMD Decomposition for Wind Shear Magnitude Data
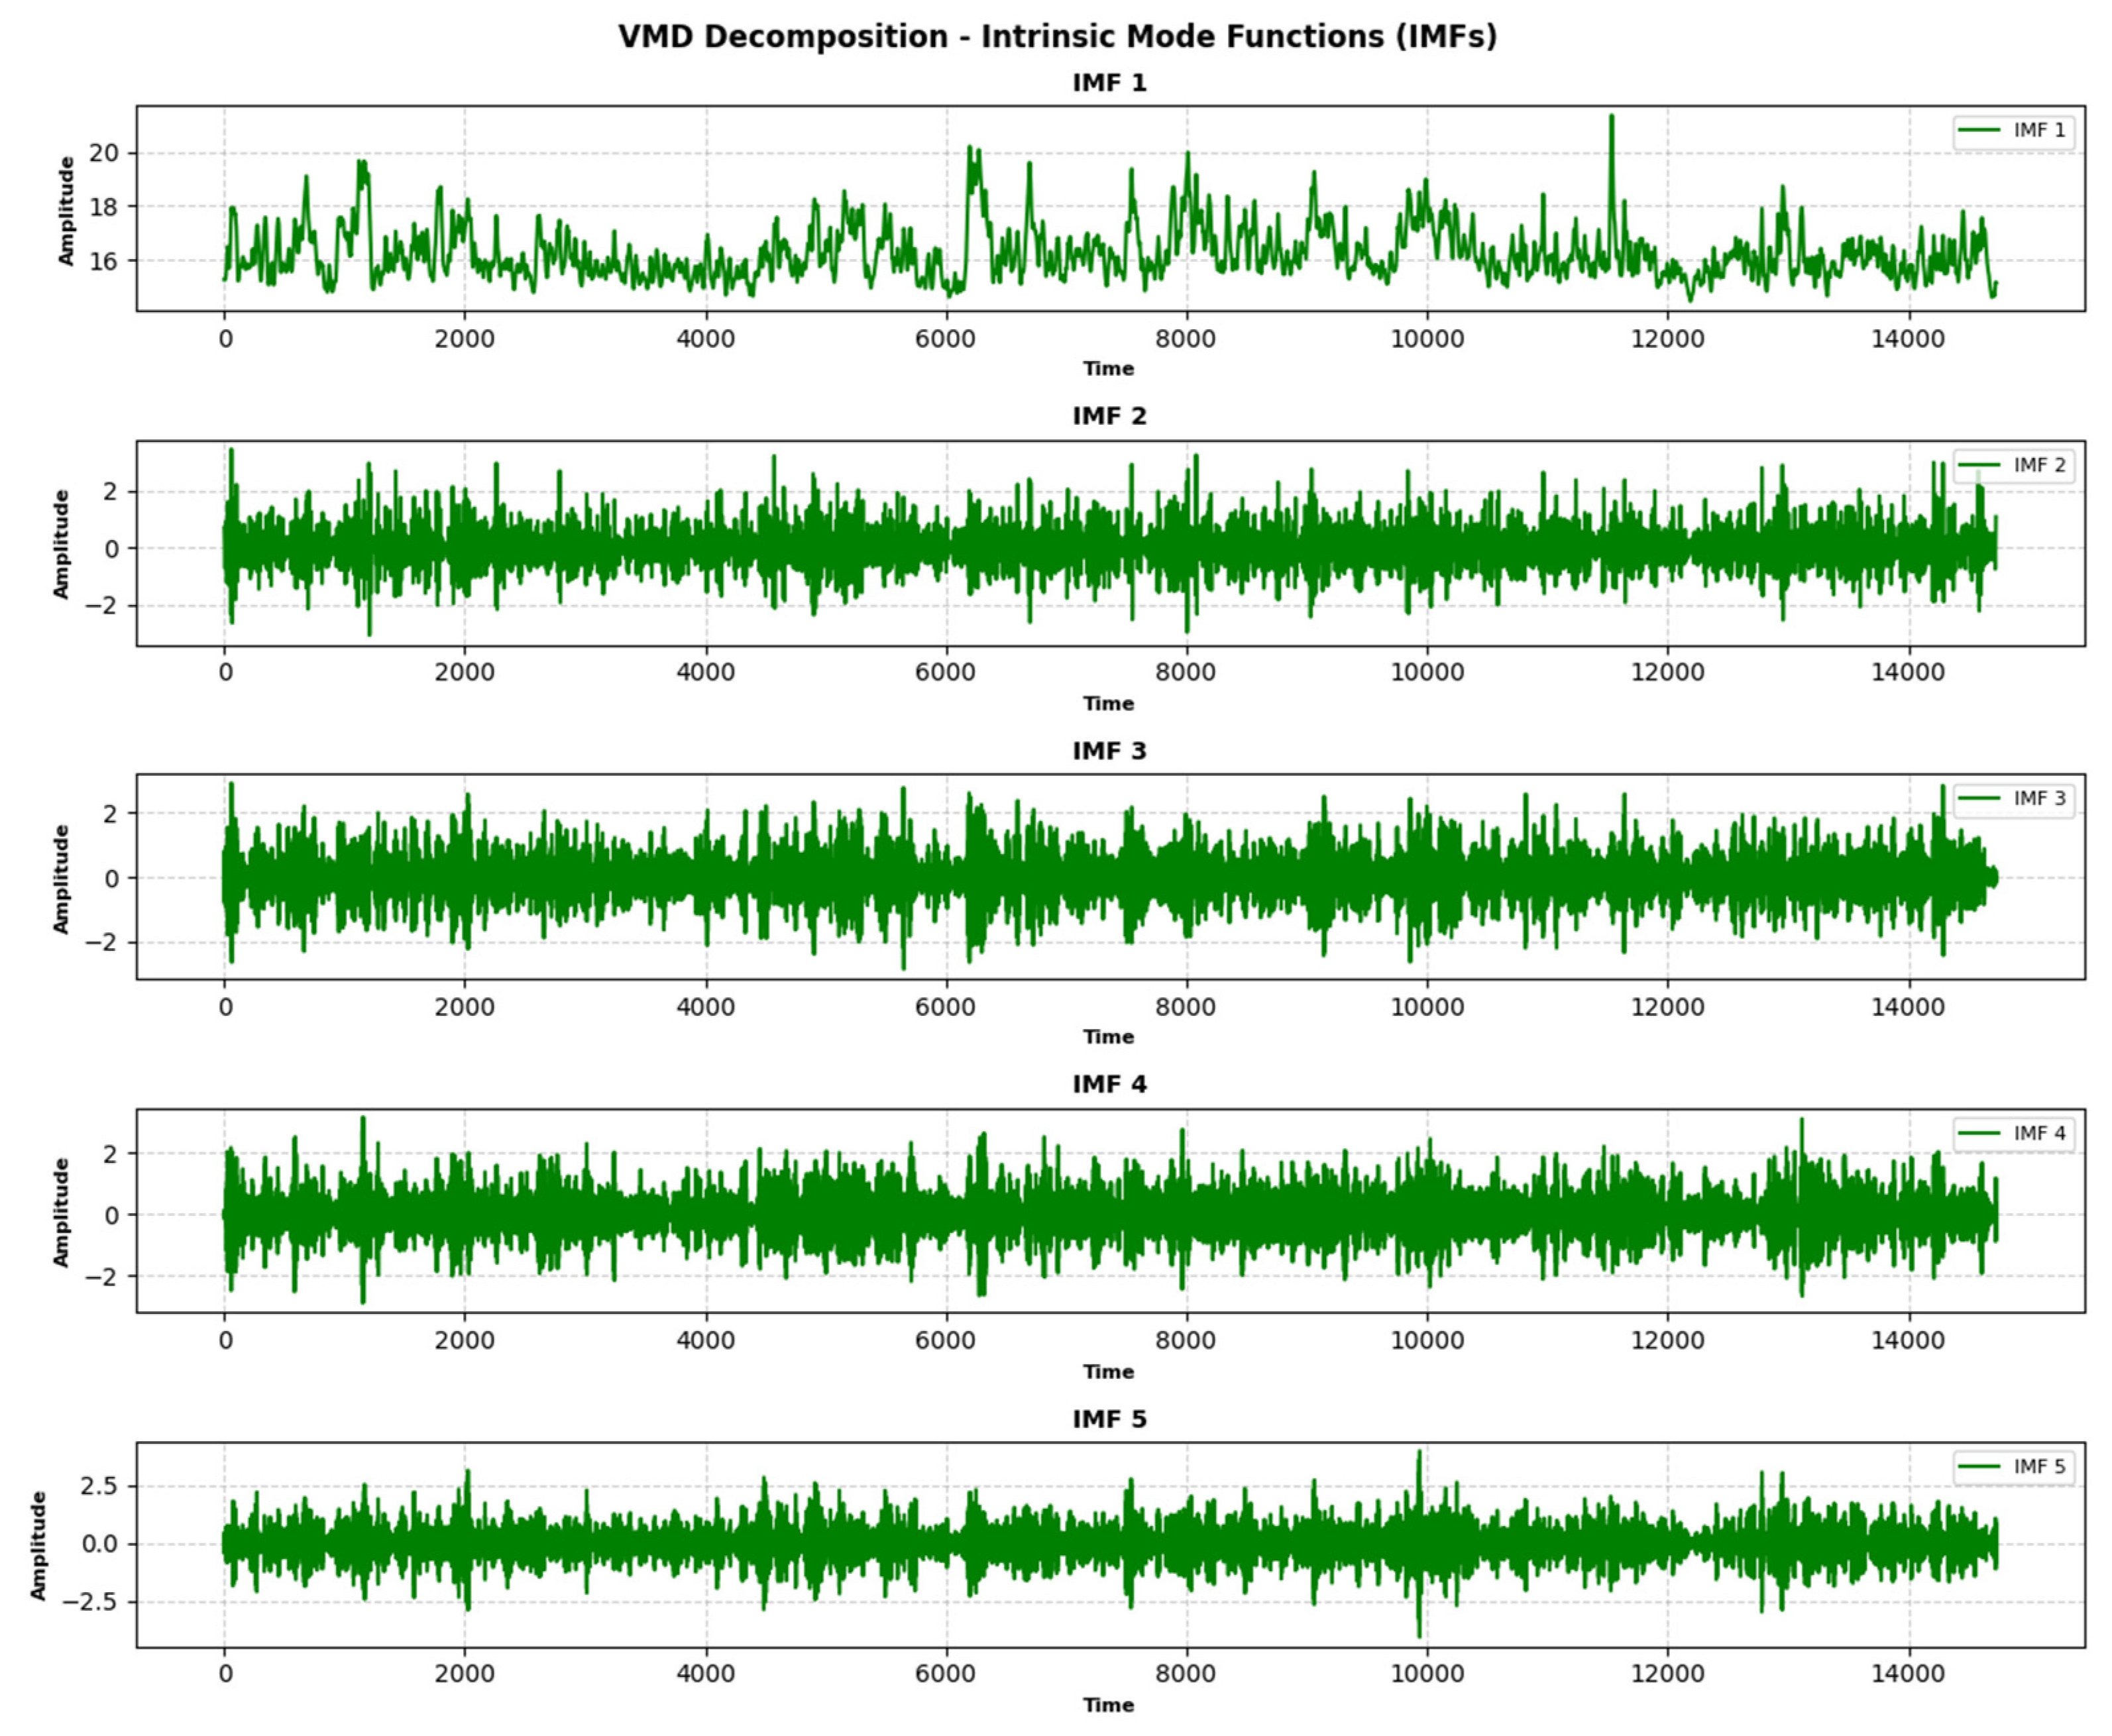
In this study, the VMD technique is employed to decompose the wind shear magnitude time series into a set of IMFs. The wind shear magnitude data, represented by the variable signal, are first downsampled by retaining every 10th data point to reduce computational complexity while preserving the essential characteristics of the signal. The VMD algorithm is then applied with the following parameters: a moderate bandwidth constraint (alpha = 1500), no strict noise tolerance (tau = 0), and an optimized number of IMFs (K = 5) to ensure a concise yet meaningful decomposition. The initialization of frequencies is set to one, and a tolerance level of 1 × 10
−7 is used to ensure convergence. The VMD process decomposes the wind shear magnitude signal into optimized IMFs, each representing distinct frequency components and temporal patterns inherent in the data. The IMFs are plotted individually, with the x-axis representing time and the y-axis representing the amplitude of each IMF. High-frequency IMFs, such as IMF 1 and IMF 2, capture rapid fluctuations or noise in the signal, while low-frequency IMFs, such as IMF 4 and IMF 5, represent slower trends or long-term patterns. This decomposition allows for a detailed analysis of the signal’s multi-scale characteristics, separating it into distinct components, which can be individually analyzed for processing via TPE-optimized TCN. These IMFs are visualized using green lines in subplots, with each subplot corresponding to a specific IMF, as shown in
Figure 7.
3.2. Training and Hyperparameter Tuning of Each IMF of TCN Model
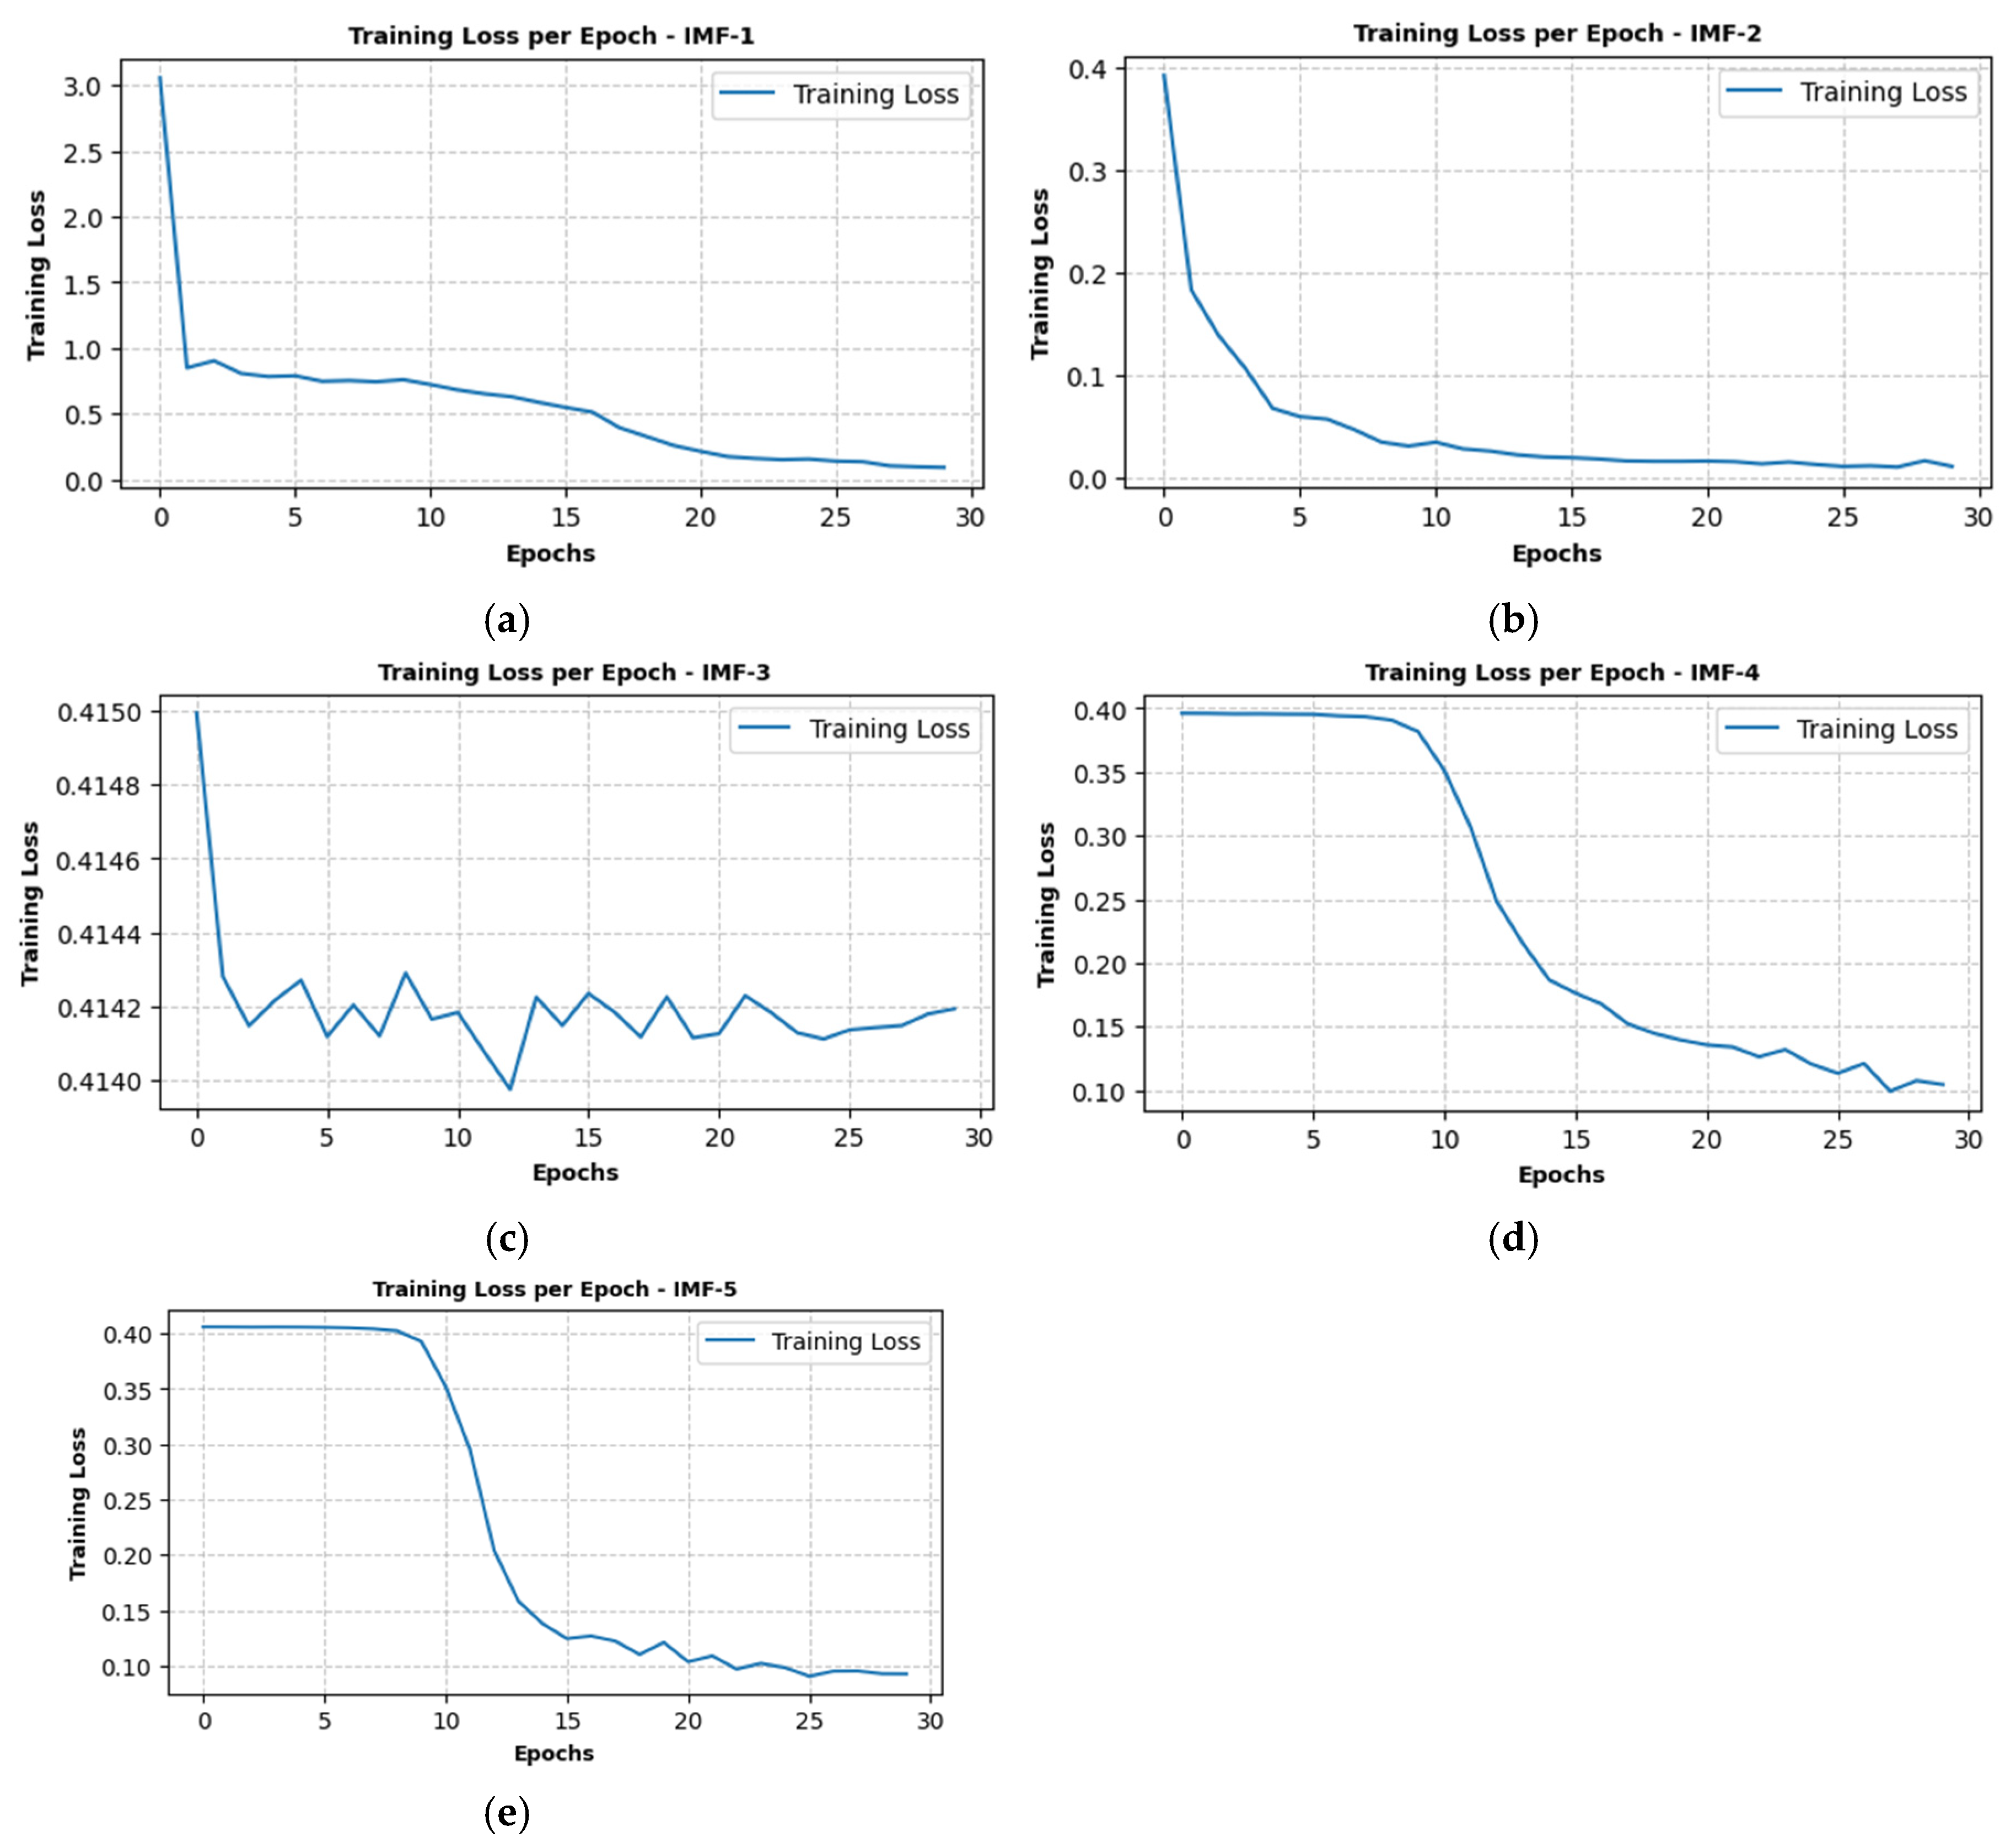
The process of training and hyperparameter tuning for the TCN model involves several key steps to ensure optimal performance in predicting IMFs derived from wind shear magnitude data. The process begins with the preparation of input–output pairs using a sliding window approach, where a window size of 90 time steps is used to create sequences of input data and corresponding target values for each IMF. This step ensures that the model captures temporal dependencies in the data. Next, hyperparameter optimization is performed using the TPE technique. The hyperparameters optimized include the number of filters, learning rate, and batch size, with the goal of minimizing the MSE loss. The TCN model architecture consists of 1D convolutional layers with dilated causal convolutions, ReLU activation functions, and a global average pooling layer followed by a dense layer for regression. This architecture is designed to effectively capture temporal patterns in the data.
Figure 8 shows the training loss per epoch for each IMF. The training loss curves for each IMF are plotted to visualize the model’s convergence during training, showing a steady decrease in loss over epochs.
For each IMF, the TCN model is trained using the optimized hyperparameters, and its performance is evaluated using metrics including MSE, RMSE, and Theil’s U Statistic, as shown in
Table 4 and
Table 5, respectively. Similarly,
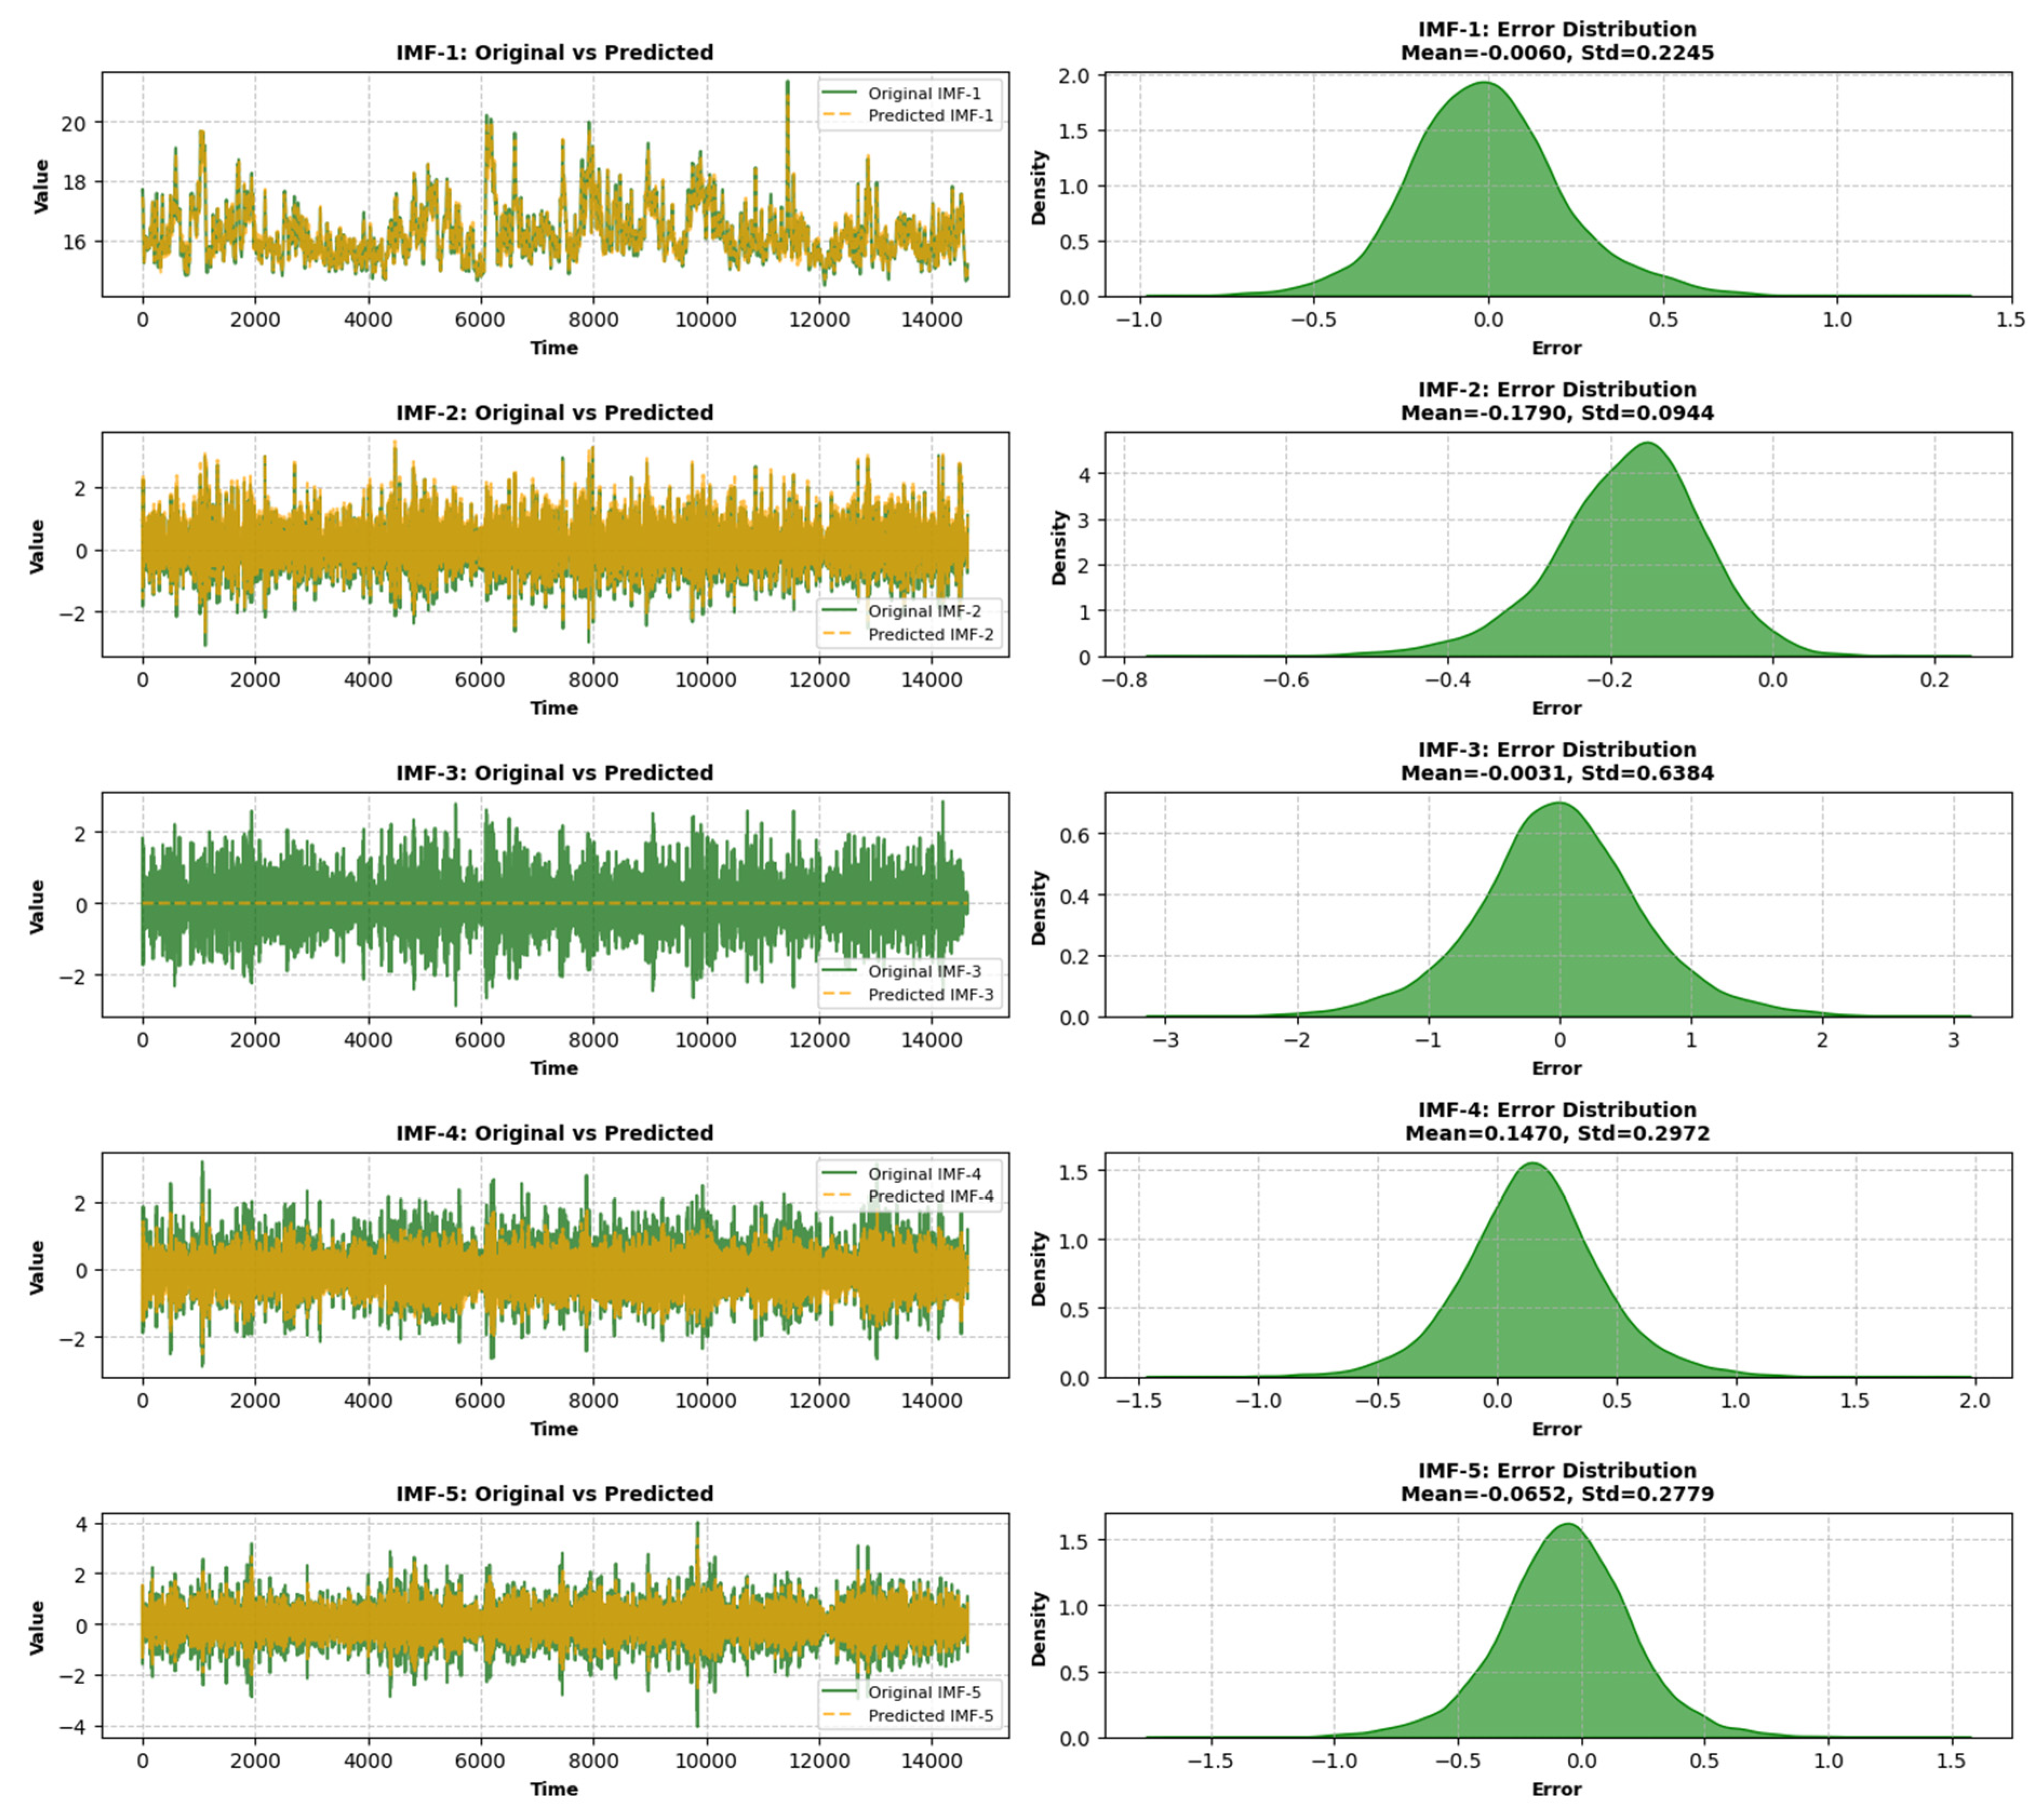
Figure 9 shows the actual and predicted values of each IMF obtained from the TPE-optimized TCN model. For IMF-1, the optimal hyperparameters are batch size = 32, filters = 128, and learning rate = 0.00167, resulting in excellent predictive accuracy with MSE = 0.020, RMSE = 0.142, and Theil’s U = 0.004. Similarly, for IMF-2, the model achieves strong performance with batch size = 80, filters = 64, and learning rate = 0.00698, yielding MSE = 0.010, RMSE = 0.102, and Theil’s U = 0.076. These results indicate that the TCN model effectively captures high-frequency components of the wind shear data.
For IMF-3, the model shows moderate performance with batch size = 64, filters = 48, and learning rate = 0.00217, producing MSE = 0.035, RMSE = 0.186, and Theil’s U = 0.152. However, the model struggles with low-frequency IMFs, such as IMF-4 and IMF-5. For IMF-4, the optimal hyperparameters are batch size = 80, filters = 64, and learning rate = 0.00145, but the performance metrics are poor, with MSE = 0.391, RMSE = 0.625, and Theil’s U = 0.964. Similarly, for IMF-5, the model achieves sub-optimal results with batch size = 96, filters = 96, and learning rate = 0.00105, resulting in MSE = 0.400, RMSE = 0.632, and Theil’s U = 0.956.
3.3. Rescaling and Reconstruction of Wind Shear Signals
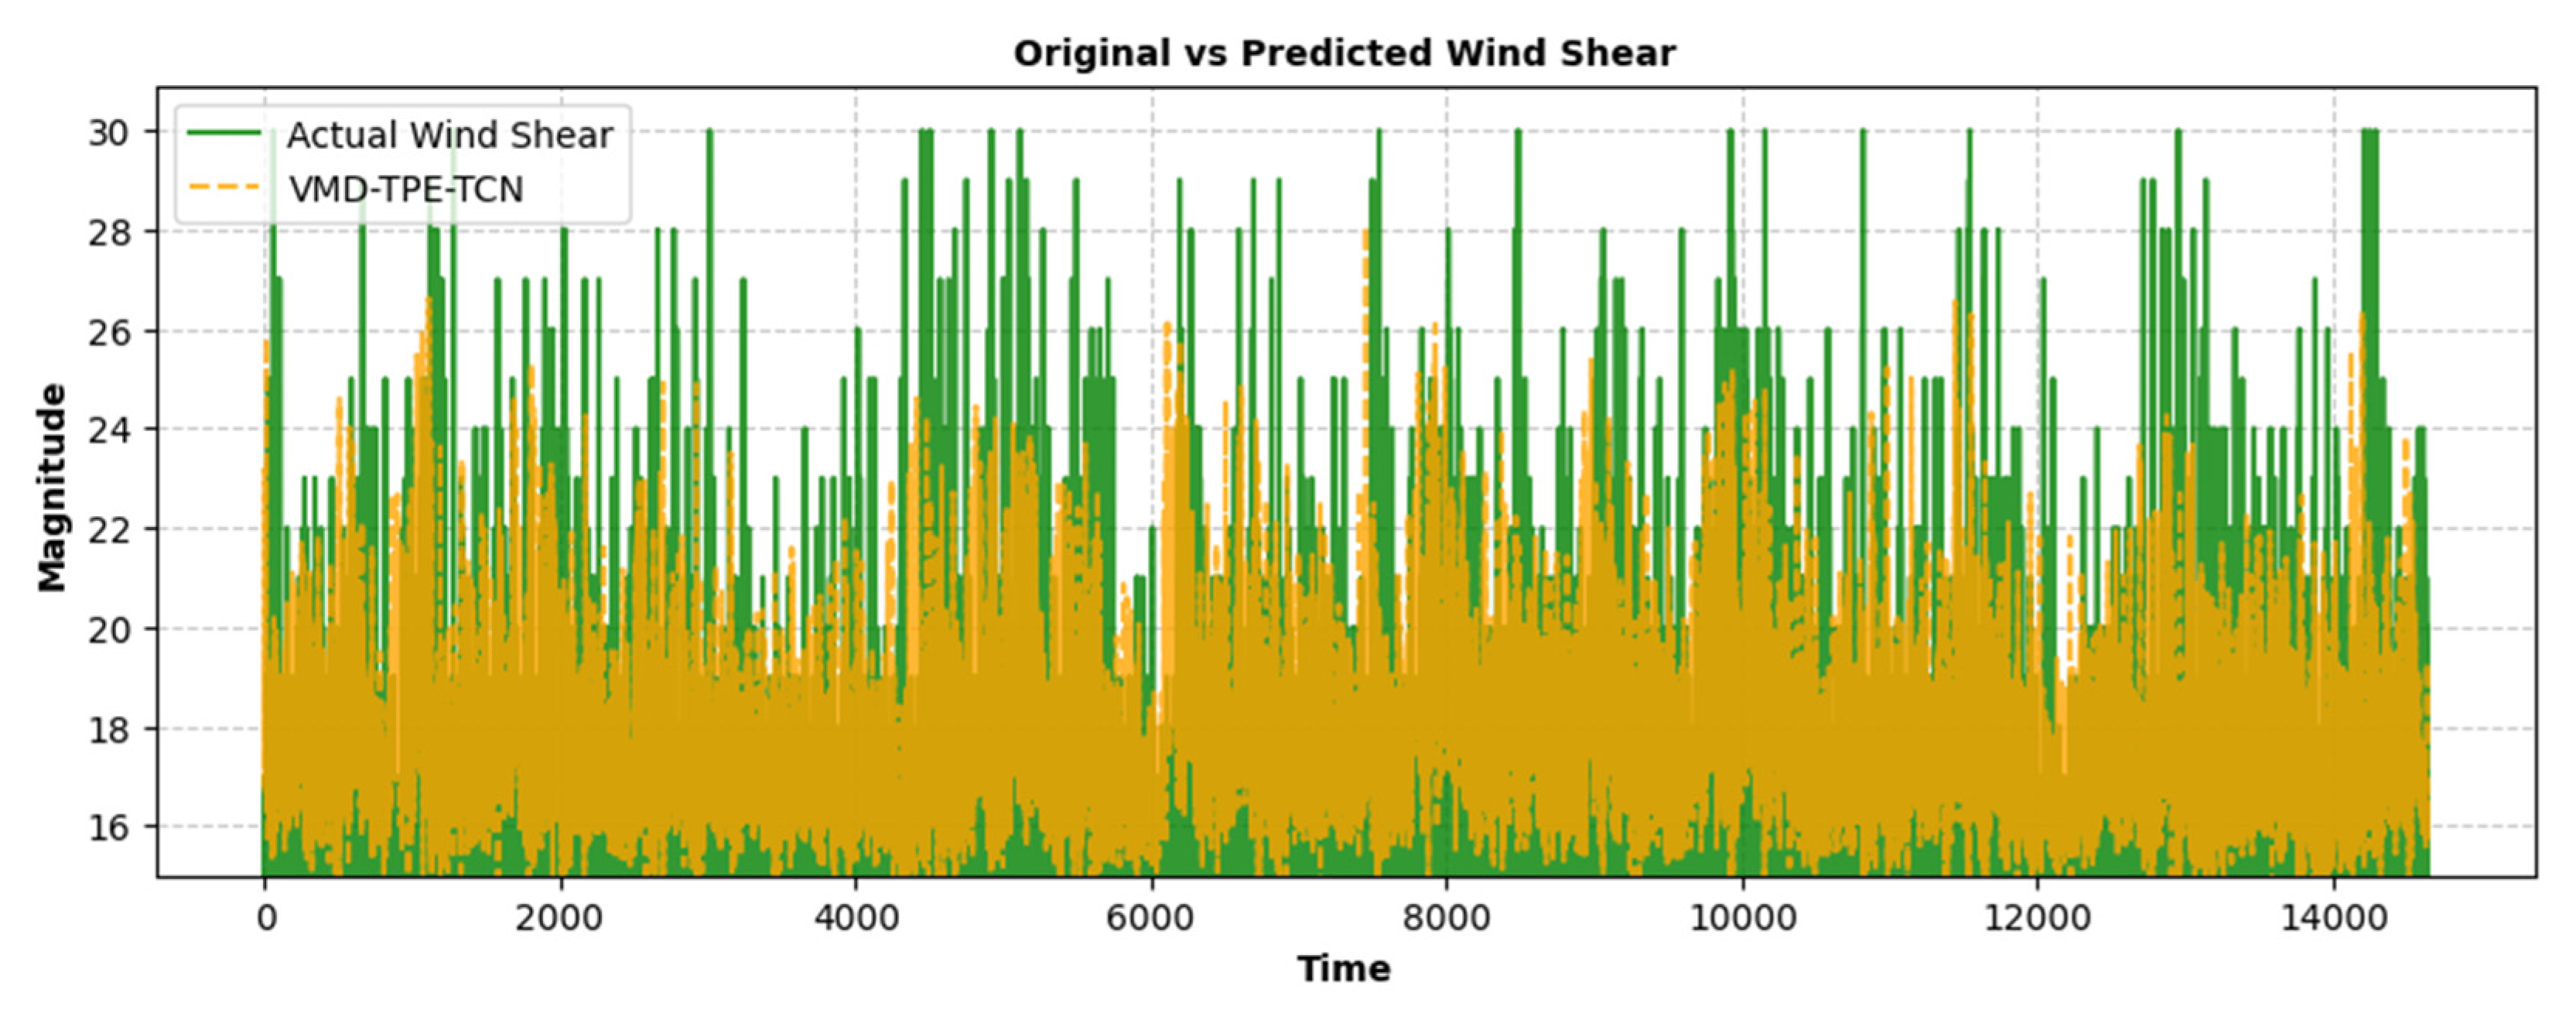
The rescaling and reconstruction process is a critical step in the VMD-TPE-TCN, where the predicted IMFs are rescaled to their original magnitude and combined to reconstruct the wind shear signal. Each predicted IMF is rescaled to match the original scale of the corresponding IMF obtained from VMD. The rescaled IMFs are summed to reconstruct the wind shear signal. However, due to the poor performance of IMF-3, as indicated by its high MSE, RMSE, and Theil’s U values shown in
Table 5, it is excluded from the final reconstruction. This exclusion helps improve the overall accuracy of the reconstructed signal by focusing on the well-predicted IMFs (IMF-1, IMF-2, IMF-4, and IMF-5), as shown in
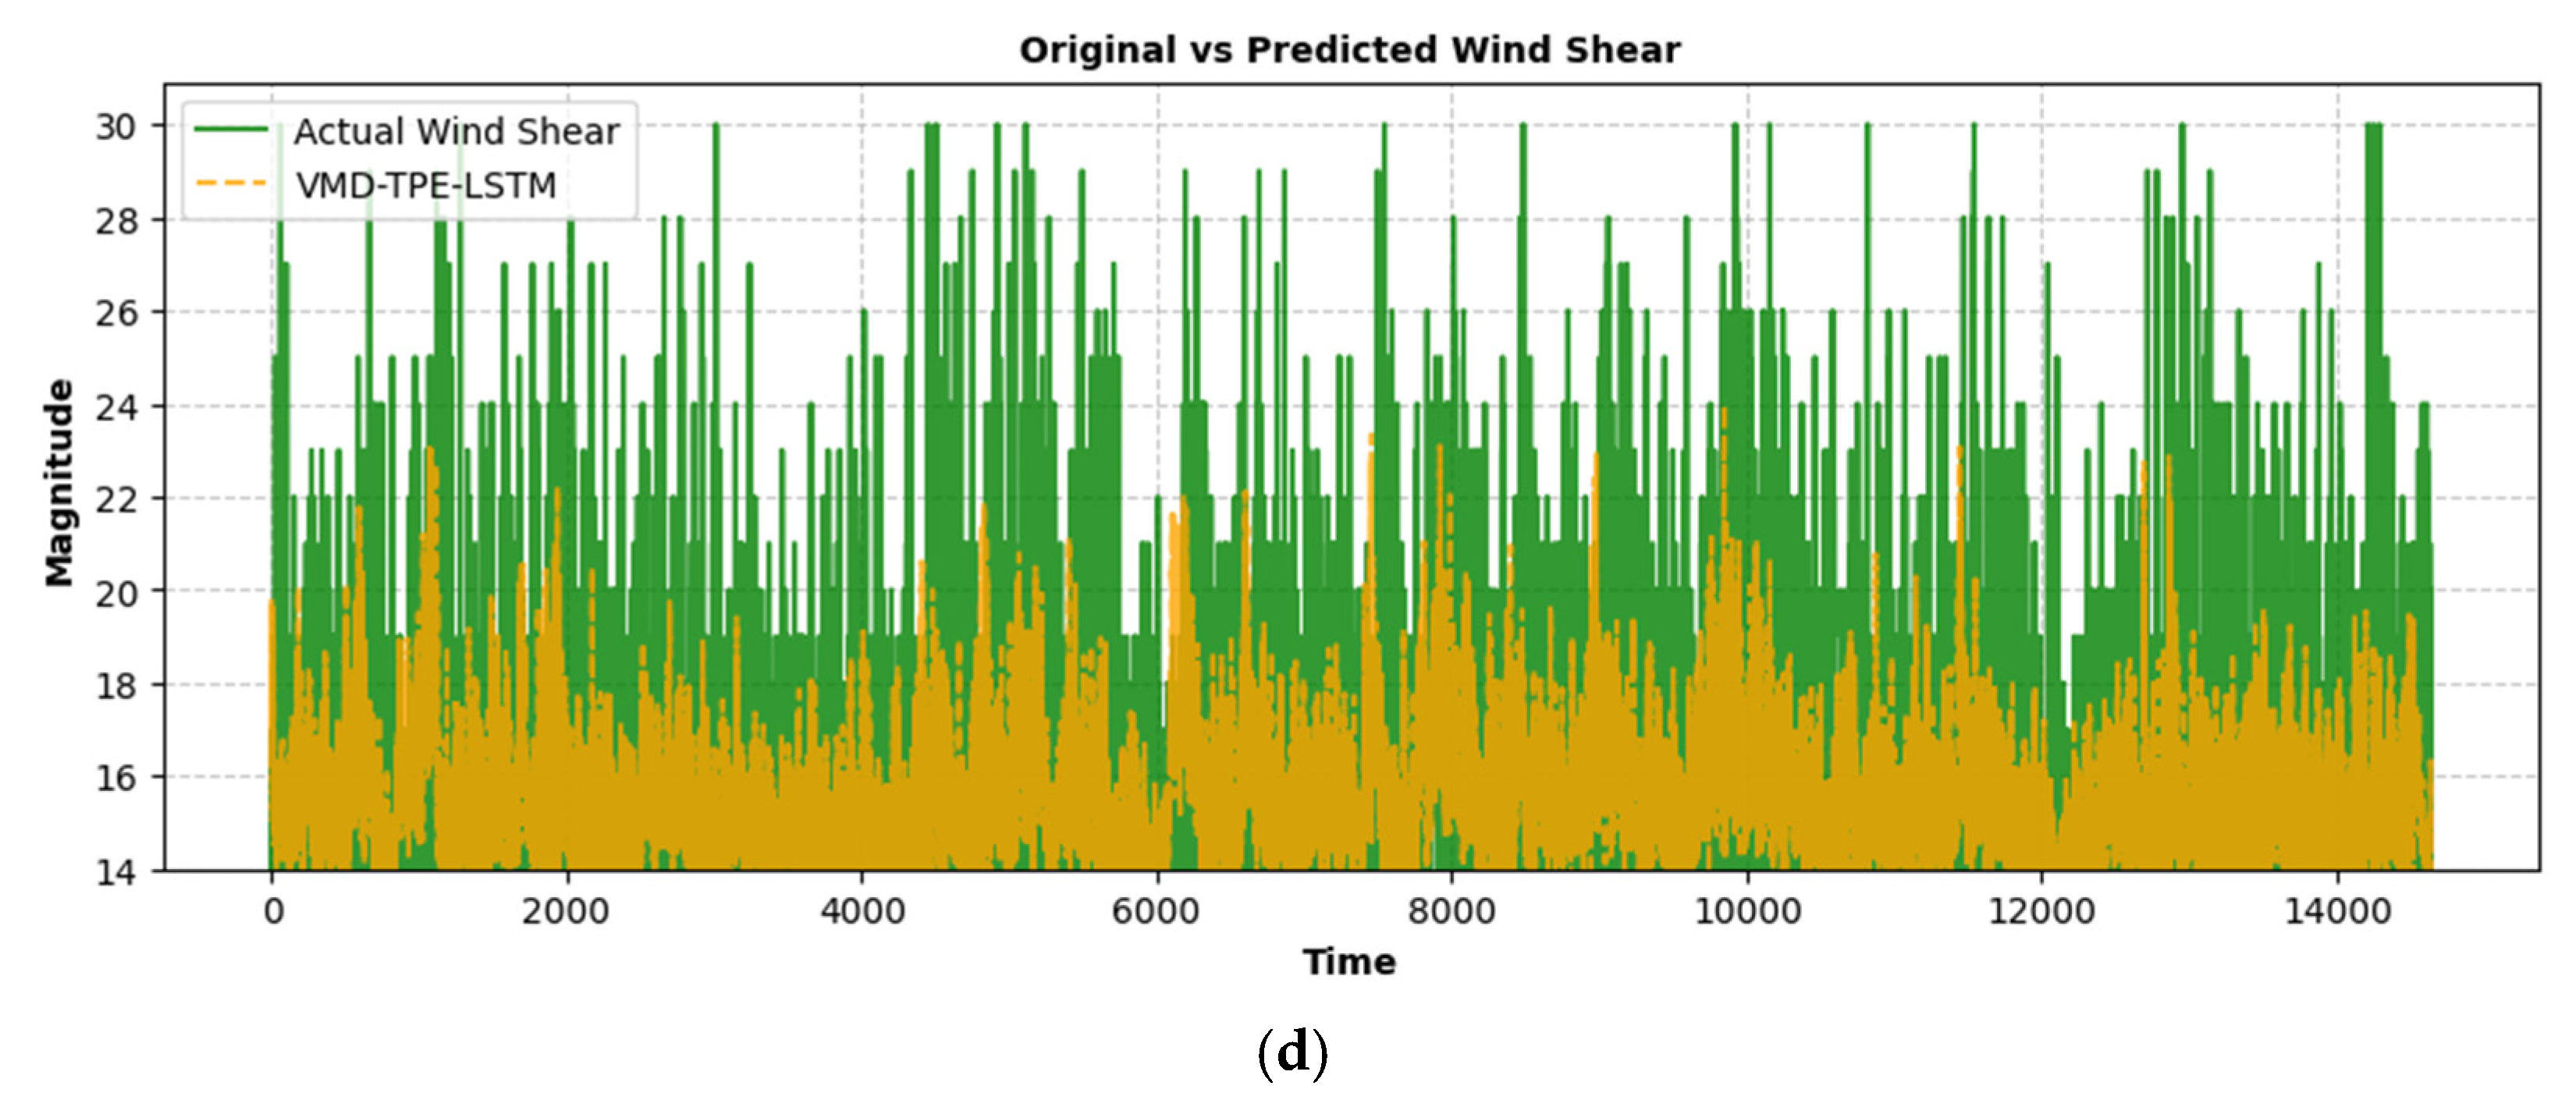
Table 6. The actual and predicted wind shear signals are plotted together for comparison, as shown in
Figure 10. The actual signal is represented by a solid green line, while the predicted signal from the VMD-TPE-TCN framework is shown as a dashed orange line.
3.4. Comparison with Other Competitive Models
The evaluation of the proposed VMD-TPE-TCN
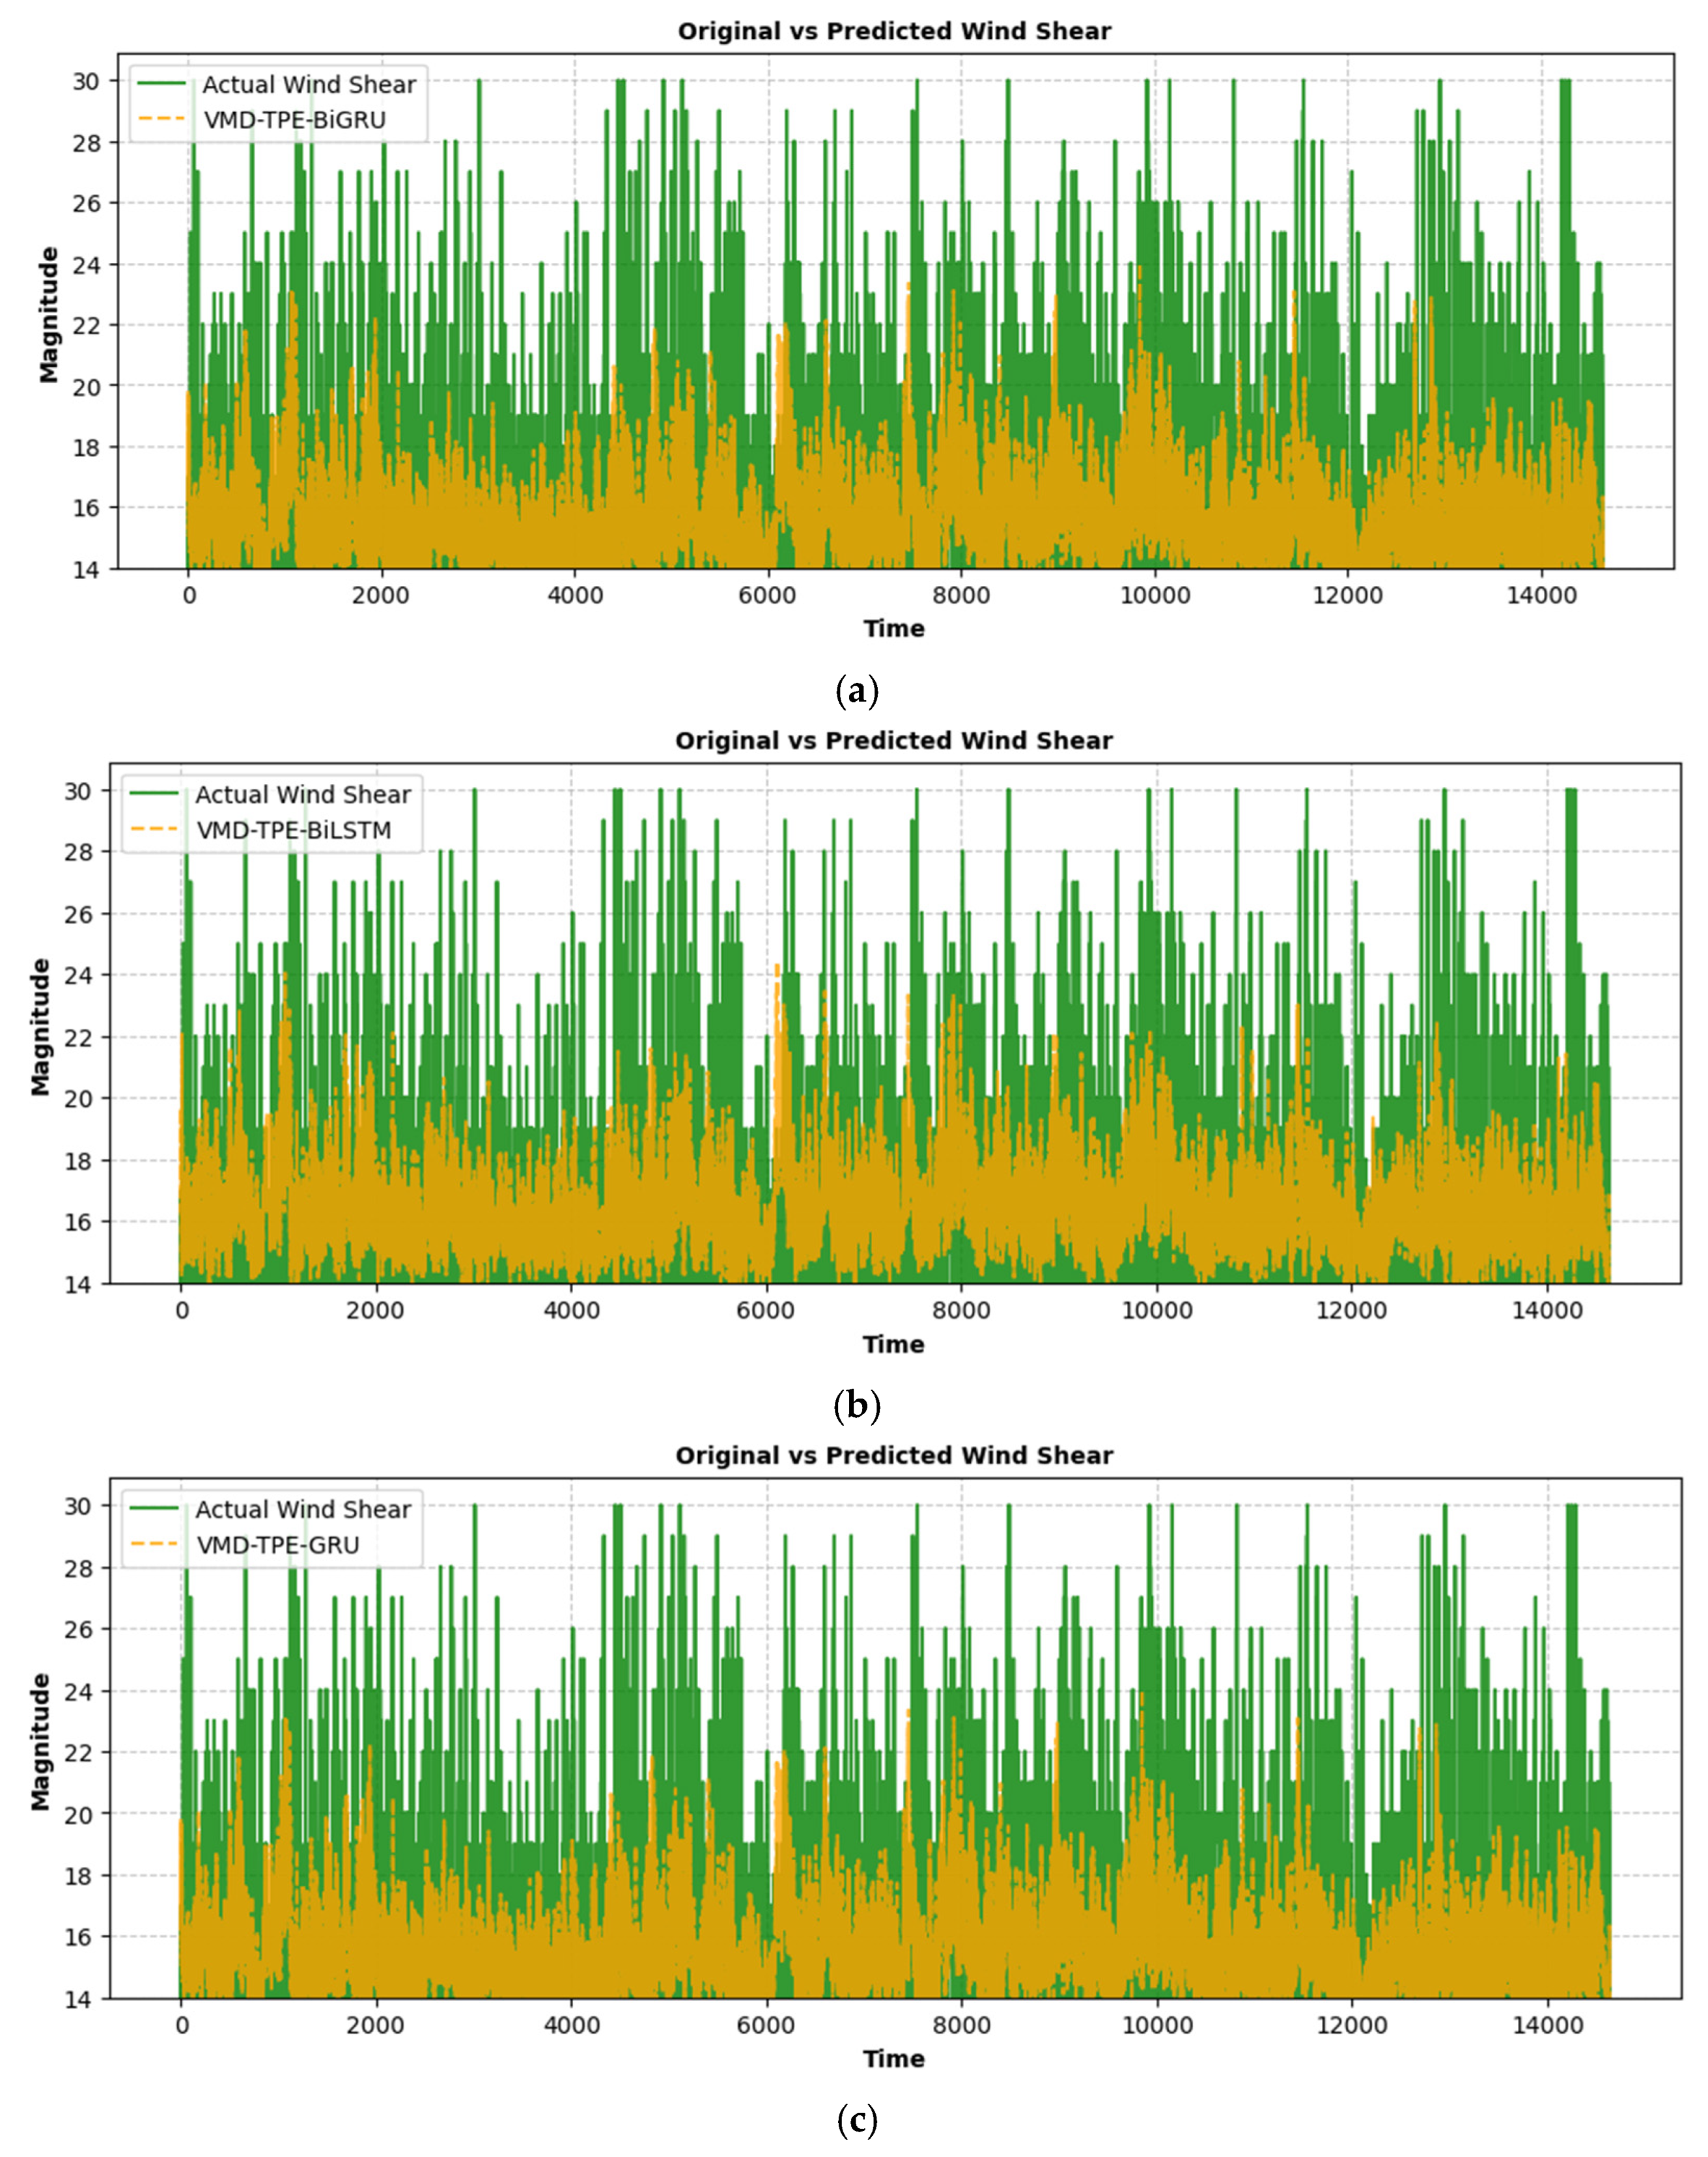
(IMF1-2-4-5) model in comparison with competitive architectures, including VMD-TPE-BiGRU, VMD-TPE-BiLSTM, VMD-TPE-GRU, and VMD-TPE-LSTM, shows its better performance in wind shear magnitude prediction, as shown in
Figure 11. The VMD-TPE-TCN model achieves the lowest RMSE (2.04) and Theil’s U (0.1270), indicating higher predictive accuracy and better generalization compared to the other models. In addition, the MAE (6.50) of the VMD-TPE-TCN
(IMF1-2-4-5) framework is significantly lower, demonstrating its effectiveness in minimizing absolute prediction errors. The VMD-TPE-BiGRU model is the next best model with RMSE (2.94), Theil’s U (0.1770), and MAE (8.50), as shown in
Table 7. A comparative analysis reveals substantial relative improvements achieved by the VMD-TPE-TCN
(IMF1-2-4-5) model over other architectures. It achieves an approximate 30.6% reduction in RMSE compared to VMD-TPE-BiGRU, 32.9% compared to VMD-TPE-BiLSTM, and 37.8% compared to VMD-TPE-LSTM. Theil’s U Statistic, which quantifies forecast accuracy relative to a naïve benchmark, is also significantly lower for the VMD-TPE-TCN
(IMF1-2-4-5) model, demonstrating a 28.3% improvement over VMD-TPE-BiGRU, 30.7% over VMD-TPE-BiLSTM, and 37.6% over VMD-TPE-LSTM. These outcomes show the ability of the VMD-TPE-TCN
(IMF1-2-4-5) framework to capture intricate temporal dependencies more effectively while reducing prediction errors, establishing it as the most reliable model for wind shear forecasting in aviation safety applications.
4. Conclusions and Recommendations
This study proposed a hybrid VMD-TPE-TCN framework for wind shear magnitude forecasting, integrating Variational Mode Decomposition (VMD) for multi-scale signal decomposition and a Tree-structured Parzen Estimator (TPE)-optimized Temporal Convolutional Network (TCN) for enhanced temporal pattern learning. The Doppler LiDAR data from HKIA were used for model training and evaluation. The VMD technique decomposes wind shear signals into Intrinsic Mode Functions (IMFs), allowing TCN to model each IMF individually while TPE optimizes the hyperparameters to refine predictive performance. To validate its effectiveness, the VMD-TPE-TCN framework was compared against alternative models, including VMD-TPE-BiGRU, VMD-TPE-BiLSTM, VMD-TPE-GRU, and VMD-TPE-LSTM. The following conclusions can be drawn:
The VMD-TPE-TCN (IMF1-2-4-5) framework demonstrated the best predictive performance among all tested models, achieving an MAE of 6.50, RMSE of 2.04, and Theil’s U Statistic of 0.1270. These results indicate its superior ability to capture temporal dependencies in wind shear data while minimizing forecasting errors.
The second-best model, VMD-TPE-BiGRU, recorded an MAE of 8.50, RMSE of 2.94, and Theil’s U Statistic of 0.1770, showing slightly lower predictive accuracy compared to the proposed framework.
In contrast, the worst-performing model, VMD-TPE-LSTM, exhibited higher prediction errors, with an MAE of 10.70, RMSE of 3.65, and Theil’s U Statistic of 0.2035, reflecting its reduced effectiveness in modeling wind shear dynamics.
There are certain limitations of this study, which are as follows:
The model was trained using Doppler LiDAR data from HKIA, which may restrict its applicability to other airports with different meteorological patterns and geographical conditions.
An improper selection of IMFs may lead to over-decomposition or loss of crucial wind shear information, potentially affecting prediction accuracy.
Given the dynamic nature of wind shear patterns influenced by climate variability, the current model lacks real-time adaptive learning mechanisms that could enable continuous updating of the forecasting model in response to changing atmospheric conditions.
Future research should focus on expanding the applicability of the VMD-TPE-TCN framework by integrating additional datasets from diverse airport environments to improve generalization. In addition, the integration of real-time adaptive learning mechanisms would enable the model to dynamically adjust to evolving meteorological trends, making wind shear forecasting more responsive and reliable in operational settings.
