Article

Microphysical Characteristics of Summer Precipitation over the Taklamakan Desert Based on GPM-DPR Data from 2014 to 2023

1
School of Atmospheric Sciences, Lanzhou University, Lanzhou 730000, China
2
Key Laboratory of Tropical Atmosphere-Ocean System, School of Atmospheric Sciences, Ministry of Education, Sun Yat-sen University, Zhuhai 519082, China
3
College of Meteorology and Oceanography, National University of Defense Technology, Changsha 410073, China
*
Authors to whom correspondence should be addressed.
Atmosphere 2025, 16(4), 354; https://doi.org/10.3390/atmos16040354
Submission received: 3 March 2025 / Revised: 15 March 2025 / Accepted: 17 March 2025 / Published: 21 March 2025
(This article belongs to the Special Issue Satellite Remote Sensing Applied in Atmosphere (3rd Edition))

Abstract

:
Precipitation events have been occurring more frequently in the hyper-arid region of the Taklamakan Desert (TD) under recent climate change. However, in this water-limited environment, the microphysical characteristics of precipitation, as well as their link to rainfall intensity, remain unclear. To address this, this study utilizes dual-frequency precipitation radar (DPR) data of the Global Precipitation Measurement (GPM) satellite from 2014 to 2023 to analyze the microphysical characteristics of different precipitation types (stratiform and convective) in the TD during the summer. The results show that liquid water path (LWP) is a key factor influencing precipitation type: when LWP is insufficient, stratiform precipitation is more likely to occur (84.1%), while convective precipitation is difficult to occur (15.9%). Microphysical process analysis indicates that in convective precipitation, abundant low-level moisture leads to the growth of liquid particles primarily through the collision–coalescence process (59.7%), resulting in larger raindrop diameters (1.7 mm) and lower concentrations (31.9 mm−1 m−3). In contrast, stratiform precipitation, with limited LWP, primarily involves the melting and breaking-up of high-level ice-phase particles, leading to smaller raindrop diameters (1.2 mm) and higher concentrations (34.3 mm−1 m−3). The warm rain process plays a significant role in raindrop formation in both types of precipitation. The greater (lesser) the amount of LWP, the larger (smaller) the contribution of collision–coalescence (break-up) processes, and the larger (smaller) the raindrop diameter and precipitation intensity.

1. Introduction

With global warming, precipitation and precipitation extremes in arid regions have increased significantly in recent decades [1,2,3,4], raising the risk of flood disasters [5,6,7]. The Taklamakan Desert (TD) is the largest extremely arid region in China, far from the ocean and major water sources, with less than 50 mm of annual precipitation [4,8]. However, observations indicate an increasing trend in precipitation over TD, with a significant increase in the frequency of extreme precipitation events in TD after the 2000 (approximately 3.18 day/10a) [8,9,10,11,12]. For example, in July 2021, a rainstorm exceeding the annual average precipitation occurred in TD, triggering mudslides and landslides [13]. Therefore, understanding the precipitation characteristics in TD is crucial for both forecasting and disaster prevention.
Previous studies have focused on the circulation and water transport related to precipitation in TD. In summer, the north–south position, intensity, and axis direction of the West Asian subtropical westerly jet influence precipitation over TD [14,15]. And the Central Asian vortex plays a crucial role in the extreme precipitation over TD [16]. Central Asia and Northwestern Asia are the major moisture source areas for precipitation over TD, and the ablation of glacial and snow melting in the surrounding mountains also supplies moisture [17,18]. However, previous studies have primarily focused on analyzing the circulation and moisture source of precipitation over TD, while research on the cloud microphysical processes that are closely related to precipitation are limited.
Precipitation systems have different microphysical characteristics as a result of dynamic and thermodynamic processes, which are generally classified into stratiform and convective precipitation [19,20]. Stratiform precipitation is typically characterized by weak vertical motion and low convective available potential energy (CAPE), with a bright band at the melting layer in radar reflectivity. In contrast, convective precipitation is associated with strong vertical motion and high CAPE without a distinct melting-layer bright band [21,22]. The thermodynamic characteristics of precipitation are different under different climate conditions. For example, in 2019, a heavy rainfall event occurred near the TD, with 77.2 mm of precipitation over 24 h, but the maximum CAPE was only 62.3 J kg−1, indicating weak convection [23]. Similarly, in 2020, there was a heavy rainfall event in TD with 65.5 mm over 24 h, and the CAPE was only 2.7 J kg−1 [24], which is different from the heavy rainfall over wet regions that typically have a high CAPE (>2000 J kg−1) [25]. From a microphysical perspective, the vertical structure of hydrometeor characteristics in rainfall reflects the thermodynamic and raindrop formation processes, subsequently influencing the intensity of surface precipitation. Li et al. [26], using a ground-based disdrometer near the Tianshan Mountains around TD, suggested that the average raindrop diameter in this region is less than 1 mm. Similarly, Zeng et al. [27] analyzed the disdrometer at Yining in the TD region and showed that raindrop diameters in arid regions are smaller than those in wet regions of China, whether the precipitation is stratiform or convective. Due to the temporal and spatial limitations of ground-based observations in arid areas, further investigation into the cloud microphysical characteristics of precipitation in these regions is still required.
Before 2014, the satellite of the Tropical Rainfall Measuring Mission (TRMM), which can detect precipitation microphysical structures, covered the region between 35° S and 35° N, excluding the TD region. Consequently, related studies have primarily focused on tropical wet regions, suggesting that the occurrence frequencies of different precipitation types vary and that their microphysical structures exhibit significant differences. Schumacher and Houze [26] found that convective precipitation accounts for half of the rainfall in the tropical and mid-latitude regions, while in southern China, convective precipitation accounts for 3/5 of the summer rainfall [28]. Hu et al. [29] studied precipitation efficiency and microphysical processes in the Yangtze-Huaihe River Basin, finding that in high-efficiency rainfall, raindrop growth below the melting layer is dominated by collision–coalescence, while in low-efficiency rainfall, raindrop break-up is the main process below the melting layer. Kumar et al. [30] suggested that the collision–coalescence process dominates in convective precipitation, accounting for 75.35% during the monsoon season, while it is less than 50% in stratiform precipitation. Since 2014, TRMM has been replaced by Global Precipitation Measurement (GPM), which expands its coverage from 65° S to 65° N, providing valuable data for studying the microphysical structure of precipitation in arid regions like the TD. Li et al. [31] used GPM DPR data to discuss the precipitation microphysical characteristics in different regions of northwest China (including TD), suggesting that orographic lifting leads to higher reflectivity, raindrop diameter, and raindrop number concentration in the mountainous region compared to basins. However, the hyper-arid region, TD, is located in the Tarim Basin (black box in Figure 1), which has a relatively flat terrain. Thus, further research is required to better understand the microphysical characteristics of different types of precipitation and their relationship with precipitation intensity in the TD where the terrain is flat, and water vapor is lacking.
In conclusion, microphysical characteristics of precipitation are different between different regions. Most of the research on the vertical structure of precipitation based on GPM DPR is concentrated in tropical wet regions. In the hyper-arid TD, the research on the microphysical characteristics of precipitation mostly used a ground-based disdrometer, and they were unable to obtain the vertical structure of precipitation. Moreover, the frequency of precipitation types, the microphysical processes of each type, and their link to rainfall intensity remain unclear. Since rainfall over TD mainly occurs in the summer (June–August), this study focused on the microphysical structure of summer rainfall in TD. The insights of this study are crucial for advancing the understanding of the microphysical characteristics of precipitation over hyper-arid regions and provide valuable references for improving the numerical simulations and forecasts of heavy summer rainfall in the TD hyper-arid region.

2. Data and Methods

The GPM satellite, launched in 2014, is designed to observe precipitation between 65° N and 65° S. The core GPM satellite carries a dual-frequency precipitation radar (DPR) that operates at Ku-band (13.6 GHz) and Ka-band (35.5 GHz). This dual-frequency capability allows for the retrieval and inversion of the microphysical characteristics of hydrometeors in precipitation [32,33,34].
The latest version (V07) of the DPR scan can be divided into two types: full scan (FS) and high-sensitivity scan (HS). The FS product provides higher accuracy, which is used in this study. The FS has a horizontal resolution of about 5 km (49 horizontal scan pixels) and a vertical resolution of 125 m (176 vertical pixels) [32]. The data are classified into three categories of precipitation types—convective, stratiform, and others—using the dual-frequency ratio method (DFRm) (for detailed methodology, see https://gpm.nasa.gov/sites/default/files/2022-06/ATBD_DPR_V07A.pdf, accessed on 1 March 2025). “Other” precipitation includes mixed convective and stratiform precipitation or noise due to measurement errors [32,35]. Therefore, this study focuses on convective and stratiform precipitation.
In this study, instantaneous precipitation samples measured during the GPM satellite’s overpasses of the TD (shown in Figure 1, black box) from 2014 to 2023 during summer are analyzed. According to the instrument sensitivity, all samples with a precipitation rate of less than 0.5 mm·h−1 were excluded [36]. A total of 48,320 samples were obtained, ensuring statistically reliable results. To study the relationship between precipitation microphysical characteristics and precipitation rate, precipitation is classified according to short-term rainfall standards into light rain (0.5–2 mm·h−1), moderate rain (2–4 mm·h−1), heavy rain (4–8 mm·h−1), and rainstorm (>4 mm·h−1).
The GPM DPR V07 product provides detailed microphysical variables, including attenuated corrected reflectivity factor (Ze), hydrometeors diameter (Dm), number concentration (Nw), liquid water path (LWP), ice water path (IWP), and near-surface precipitation rate (R). LWP and IWP represent the total amount of liquid (ice-phase) hydrometeors in a unit area of the atmospheric column, retrieved by the attenuation differences between the Ka and Ku signals for different-phase hydrometeors; precipitation rate is retrieved using empirical formulas relating radar reflectivity to precipitation rate [37]. The reliability of the GPM-DPR retrieval products has been validated in studies [32,38,39].
To understand raindrop characteristics in precipitation over TD, Dm and Nw at 2 km are used as approximations for the mean raindrop diameter and number concentration [40]. The one-dimensional shaft model of the bin-microphysics is used to understand the warm rain processes [41]. In their approach, changes in radar reflectivity from 3 km to 1 km (i.e., ∆Ze = Ze1km − Ze3km) and changes in the mean raindrop diameter (∆Dm = Dm1km − Dm3km) are analyzed to understand warm rain processes. The probability distribution of ∆Ze and ∆Dm can be divided into four quadrants: when ∆Ze > 0 and ∆Dm > 0, it indicates that the raindrops primarily undergo the collision–coalescence process, where smaller droplets merge into larger ones; when ∆Ze < 0 and ∆Dm > 0, raindrop evaporation and sedimentation are dominant processes; when ∆Ze < 0 and ∆Dm < 0, the raindrops primarily undergo the break-up process, where larger droplets fragment into smaller ones; and when ∆Ze > 0 and ∆Dm < 0, an equilibrium between collision–coalescence and break-up processes occurs.

3. Microphysical Characteristics of Convective and Stratiform Precipitation

To understand the statistical characteristics of convective and stratiform precipitation microphysics in the TD region during the summer of 2014–2023. Table 1 shows the sample number, mean raindrop diameters, raindrop number concentrations, liquid water path (LWP), and ice water path (IWP) of convective and stratiform precipitation observed by GPM-DPR in the TD. It also provides a comparison of these microphysical characteristics with those from the summer precipitation in a nearby wet region during the monsoon (the Arabian Sea [40]). During the study period, a total of 40,608 (7712) samples of stratiform (convective) precipitation were observed in the TD region, with convective precipitation accounting for only 15.9% of the total precipitation samples and stratiform precipitation accounting for 84.1%. Compared to the wet region, where stratiform precipitation accounts for 75%, the proportion of stratiform precipitation is even higher, indicating that stratiform precipitation dominates in TD.
The liquid water path and ice water path of convective (stratiform) precipitation in the TD region are 528.7 (269.5) gm−2 and 410.7 (268.6) gm−2, respectively, while those of convective (stratiform) precipitation in the wet region are 2923.1 (888.1) gm−2 and 322.9 (396.7) gm−2. The liquid water content in the arid region is significantly lower, which is related to the scarcity of low-level water vapor in the arid region of TD. The mean raindrop diameter (Dm) and number concentration (Nw) for convective (stratiform) precipitation in the TD arid region is 1.7 (1.2) mm and 31.3 (33.3) mm−1 m−3, respectively, while for the wet region during the monsoon (e.g., Arabian Sea), Dm and Nw of convective (stratiform) precipitation are 1.5 (1.3) mm and 36.3 (34.1) mm−1 m−3 [40], respectively. The characteristics of raindrops in stratiform precipitation in the arid region are similar to those in the wet region. However, the number of raindrops in convective precipitation is significantly lower than that in the wet region, suggesting that there are differences in the microphysical processes of raindrop formation in different climatic regions and precipitation types.
In order to understand the relationship between the liquid water path (LWP) and ice water path (IWP) of different precipitation types in the TD arid region, the two-dimensional frequency distributions of the liquid water path and ice water path of convective and stratiform precipitation are shown in Figure 2. The two-dimensional frequency distributions of IWP and LWP for convective (stratiform) precipitation are defined as the number of samples in an interval for the IWP and LWP divided by the total number of convective (stratiform) precipitation samples [40].
For convective precipitation in the TD region, the distribution of LWP ranges from 0 to 1100 g·m−2 and IWP ranges from 0 to 1000 g·m−2, whereas for stratiform precipitation, the distribution of LWP ranges from 0 to 700 g·m−2 and IWP ranges from 0 to 800 g·m−2. It can be seen that the LWP and IWP distribution ranges for convective precipitation are broader than those for stratiform precipitation. Specifically, the range of LWP for convective precipitation is 1.5 times larger than that of stratiform precipitation, indicating that convective precipitation typically requires a substantial amount of low-level liquid water, consistent with previous studies on precipitation in wet regions [40,42]. In the arid region, where low-level moisture is scarce, convective precipitation is difficult to occur. In contrast, convective precipitation is more common in wet regions where low-level moisture is abundant, which is consistent with Table 1. During the stratiform precipitation process, the IWP range is greater than the LWP range, suggesting that stratiform precipitation is typically more dependent on high-level ice water than low-level liquid water. This reflects the characteristic of precipitation in the TD arid region, where stratiform precipitation predominates. The above also reflects that the primary difference between the occurrence of stratiform and convective precipitation in the TD arid region is related to the amount of low-level liquid water.
In order to understand the differences in the microphysical characteristics of raindrops between convective and stratiform precipitation in the TD arid region, the two-dimensional frequency distribution of raindrop number concentration (Nw) and diameter (Dm) at 2 km is shown in Figure 3.
For both convective and stratiform precipitation, Nw increases as Dm decreases, indicating that both types of precipitation have a low concentration of large raindrops and a high concentration of small raindrops, which is consistent with observations in wet regions [40,42]. For convective precipitation, the range of Nw is between 20 and 45 mm−1 m−3, and Dm ranges from 0.5 to 3 mm. For stratiform precipitation, Nw ranges from 25 to 45 mm−1 m−3, and Dm ranges from 0.5 to 2 mm. These results indicate that compared to stratiform precipitation, the distribution of raindrop diameters for convective precipitation is broader, and the raindrops are generally larger. This reflects that convective precipitation, which is associated with a higher content of low-level liquid water, is more likely to form larger raindrops. In contrast, in cases where liquid water content is insufficient, raindrops are difficult to grow.
The vertical profile of raindrop size distribution (DSD) is essential for understanding the formation and development of precipitation in arid regions as it directly influences the microphysical processes. Figure 4 shows the normalized frequency distributions of radar reflectivity (Ze), particle diameter (Dm), and number concentration (Nw) for both types of precipitation. The normalized frequency distribution is defined as the vertical frequency distribution of the variable divided by its maximum frequency, allowing for comparisons between different types of precipitation. Comparing the reflectivity (Ze) of convective precipitation and stratiform precipitation (Figure 4a,b), the Ze range of convective precipitation (10~50 dBz) is wider than that of stratiform precipitation (10~40 dBz), indicating that convective precipitation is more likely to form ice and liquid particles with larger particle size and larger number. In the high-frequency center (>60%), Ze increases with height in convective precipitation; while in stratiform precipitation, Ze increases with height above the 0 °C layer and decreases with height below the 0 °C layer. This reflects that in stratiform precipitation, liquid-phase particles primarily form by the melting of ice-phase particles; while in convective precipitation, liquid-phase particles are primarily formed by the condensation of water vapor uplifted by strong updrafts at low levels [40].
In convective precipitation, the high-frequency centers of Dm and Nw (>60% region, Figure 4b,c) are concentrated at 1 mm and 38 mm−1 m−3 from the surface to 3 km, and at 1.2–1.8 mm and 28–32 mm−1 m−3 near the 0 °C layer (3–8 km). This indicates that there are a large number of small liquid particles at the lower layer. As the height increases, the particle diameter increases and the number decreases, indicating that the liquid particles in the convective precipitation undergo a collision–coagulation process due to the strong lift. For stratiform precipitation, the high-frequency centers of Dm and Nw (>60% region, Figure 4e,f) are concentrated around 1.1–1.3 mm and 32–36 mm−1 m−3 near the 0 °C layer, indicating that the diameters and numbers of liquid-phase particles are nearly the same as with ice-phase particles. This reflects that stratiform precipitation is primarily produced by the melting of ice-phase particles into liquid-phase particles.
To further quantify the microphysical processes of the raindrop formation for convective and stratiform precipitation, the two-dimensional frequency distributions of ΔDm and ΔZe shown in Figure 5, according to the method of Kumjian and Prat [41] (detailed in the Section 2). In Figure 5a, the collision–coalescence process contributes the most to convective precipitation (59.7%), which is consistent with Figure 4. However, it is smaller than the convective precipitation in the humid regions (Arabian Sea and South China) (the collision–coalescence process accounts for 63–71%) [31,40], which may be related to the lower liquid water in the TD arid region. For stratiform precipitation, the break-up process accounts for 51.0%, the collision–coalescence process only accounts for 31.5%, and the evaporation process accounts for 12.4%. This indicates that in the arid region, after ice-phase particles melt into raindrops, break-up is the dominant process, where larger raindrops break into smaller ones, along with some evaporation. This may be related to the arid climate in TD with scarce water vapor in the lower layer.

4. Relationship Between Precipitation Intensity and Microphysical Processes

Figure 6 shows the scatter of precipitation rate versus LWP (liquid water path) and IWP (ice water path) to understand the relationship between precipitation rate and the content of particles in different phases for different types of precipitation. The positive correlation between the convective precipitation rate and LWP is 0.92; while the correlation with IWP is 0.38, indicating the convective precipitation rate is closely related to the LWP, and the intensity of precipitation increases with the increase in LWP, with a linear rate of 8.63. Similar to convective precipitation, the positive correlation between stratiform precipitation rate and LWP is even stronger, with a correlation coefficient of 0.91. In contrast, the positive correlation between stratiform precipitation rate and IWP is stronger than that for convective precipitation, with a correlation coefficient of 0.53. This suggests that the ice water content is more important in stratiform precipitation than in convective precipitation, likely due to the melting processes of ice-phase particles dominating in stratiform precipitation.
To understand the relationship between precipitation intensity and microphysical characteristics of hydrometeor distribution in convective and stratiform precipitation, Figure 7 shows the relationship between the diameter (Dm) and number concentration (Nw) of hydrometeors at different precipitation intensities.
In convective precipitation (Figure 7a,c), as precipitation intensity increases, Dm increases, while Nw does not show a significant increase, which suggests that the growth in the size of liquid particles is the primary factor driving the increase in convective precipitation rate, which contrasts with the characteristics of convective precipitation in the wet region of China’s Yangtze River Basin, where the precipitation intensity is more related to the particle number concentration [29]. In stratiform precipitation (Figure 7b,d), as precipitation intensity increases, the change in Dm above the 0 °C level is minimal, but below the 0 °C level, Dm increases, and Nw also increases. This indicates that the growth in the diameter of the liquid particles and the increase in the number of liquid particles is favored by the increase in the precipitation rate of stratiform precipitation. In both convective and stratiform precipitation, the increase in the diameter of liquid-phase particles plays a key role in enhancing precipitation intensity.
To analyze the relationship between precipitation intensity and raindrop microphysical processes in convective and stratiform precipitation, Figure 8 shows the two-dimensional frequency distribution of ΔDm and ΔZe at different precipitation rates.
Figure 8a–d show that with increasing precipitation intensity in convective precipitation, the contribution of the collision–coalescence process increases from 51.5% to 73.9%; while the contribution of the break-up process decreases from 39.7% to 19.2%, resulting in the increase in raindrop diameter. In stratiform precipitation (Figure 8e–h), as precipitation intensity increases, the contribution of the collision–coalescence process increases from 29.6% to 49.2%, and the break-up process decreases from 54.4% to 26.1%, similarly promoting the increase in raindrop diameter. In stratiform precipitation of varying precipitation intensities, the collision–coalescence process is weaker than in convective precipitation, which corresponds to smaller raindrop diameters in stratiform precipitation compared to convective precipitation, indicating that the collision–coalescence process favors an increase in raindrop diameter. This suggests that the more liquid water in the lower layers, the more facility the collision–coalescence process, leading to larger raindrop diameters and greater precipitation intensity.

5. Conclusions

In this study, based on GPM-DPR satellite observation from 2014 to 2023, we study in detail the characteristics of convective and stratiform precipitation, the liquid water and ice water paths, hydrometeor diameter and number concentration, and microphysical processes in the TD arid region. This study also analyzes the relationship between cloud microphysical characteristics and intensities of convective and stratiform precipitation. The conclusions are as follows:
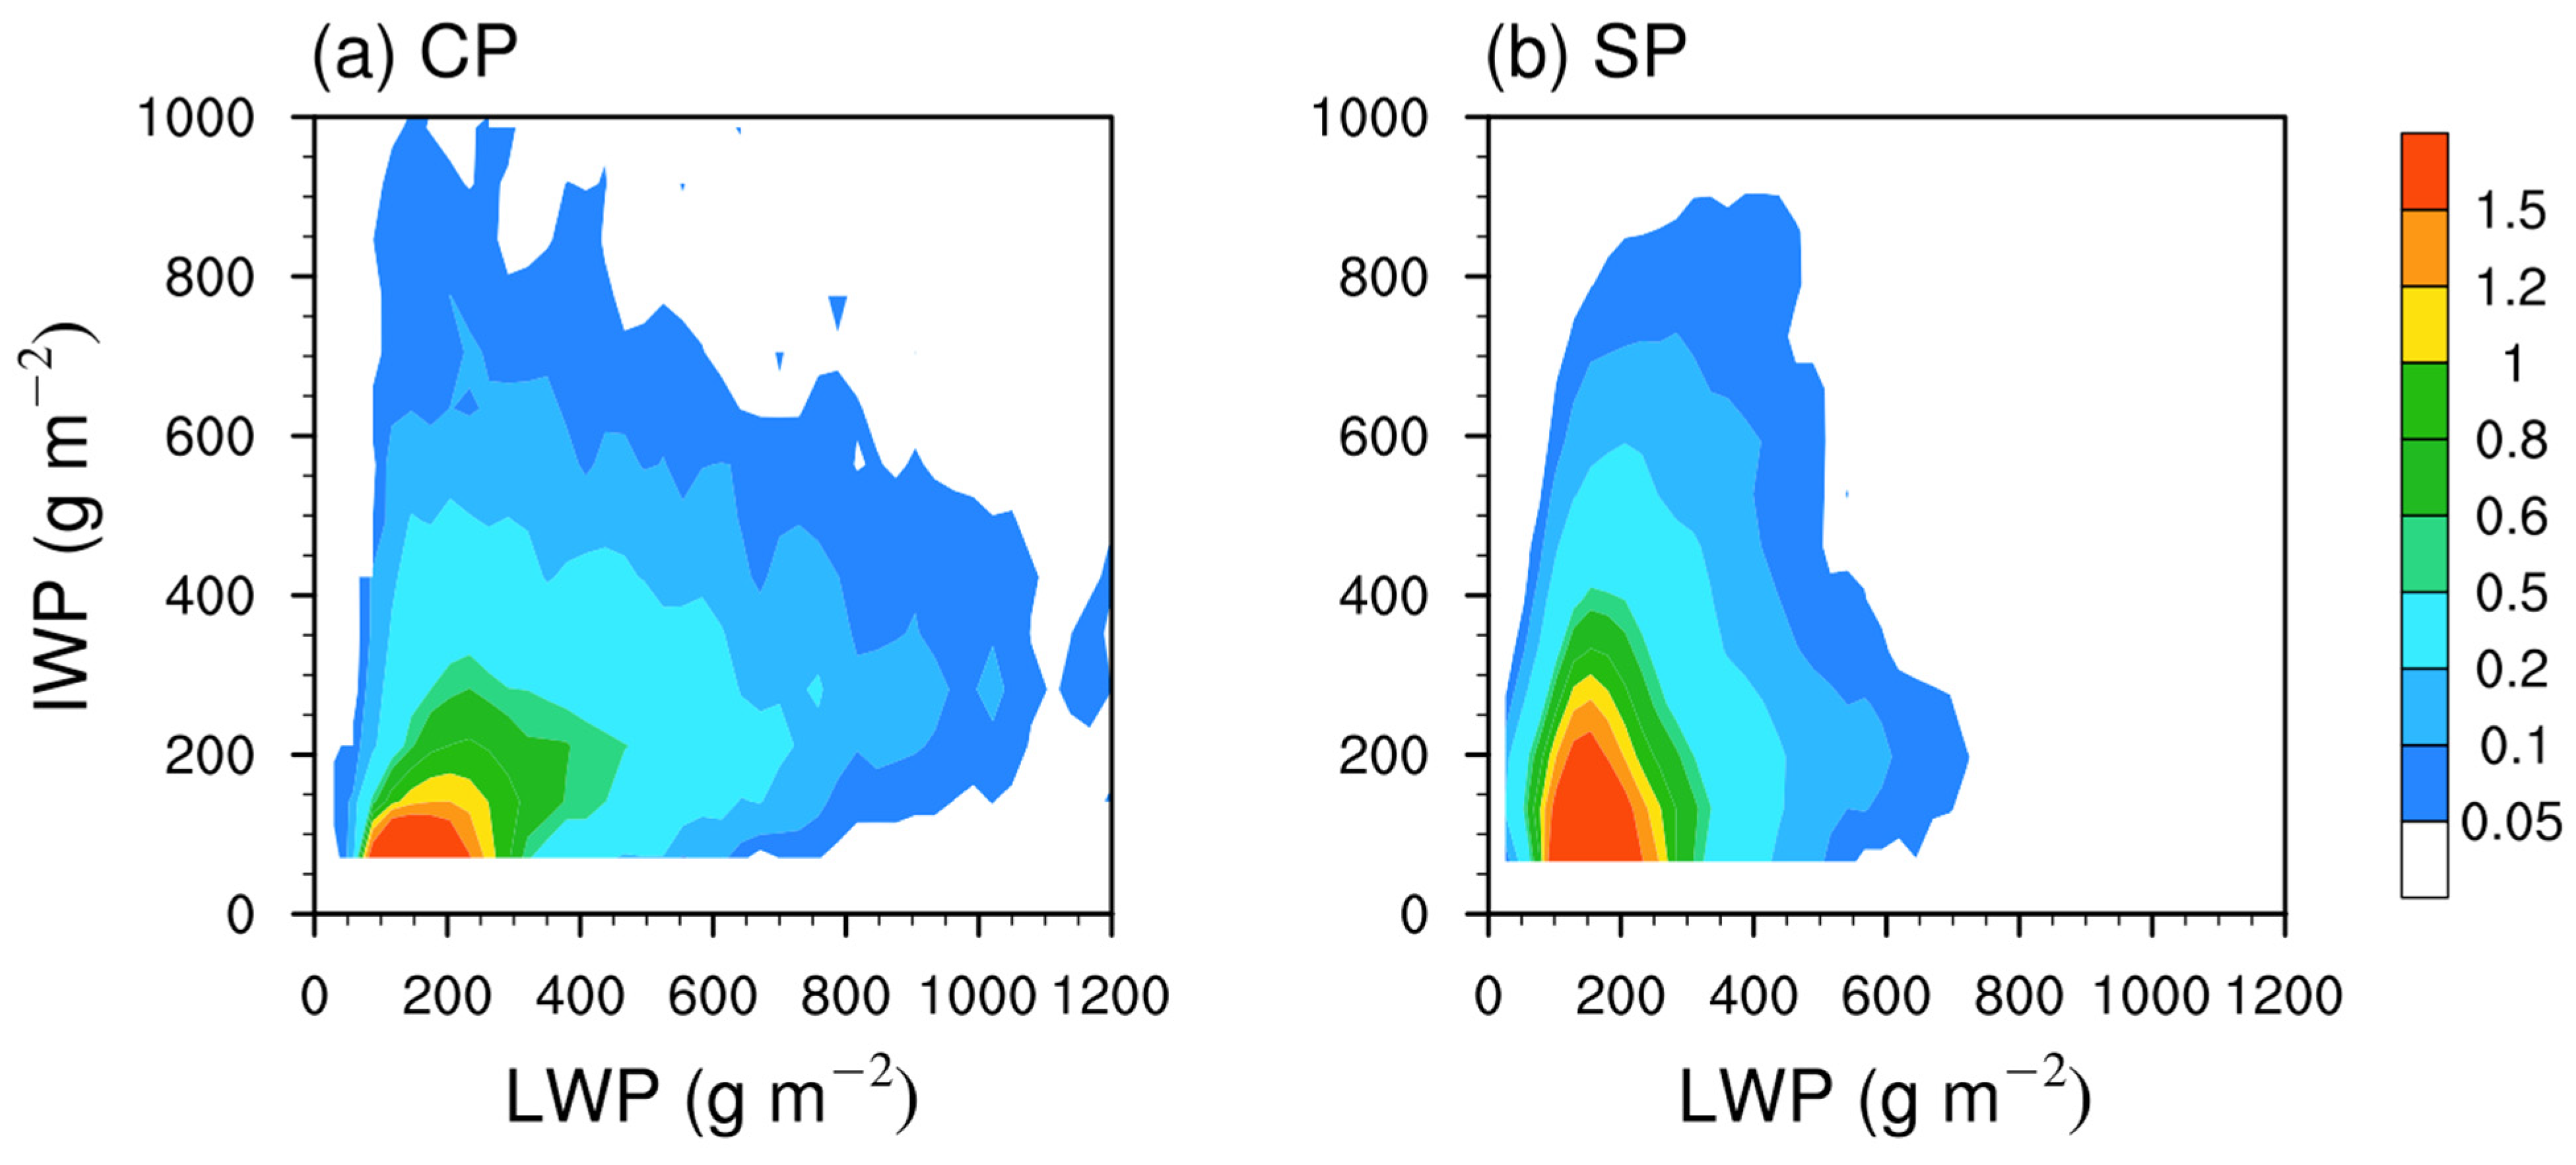
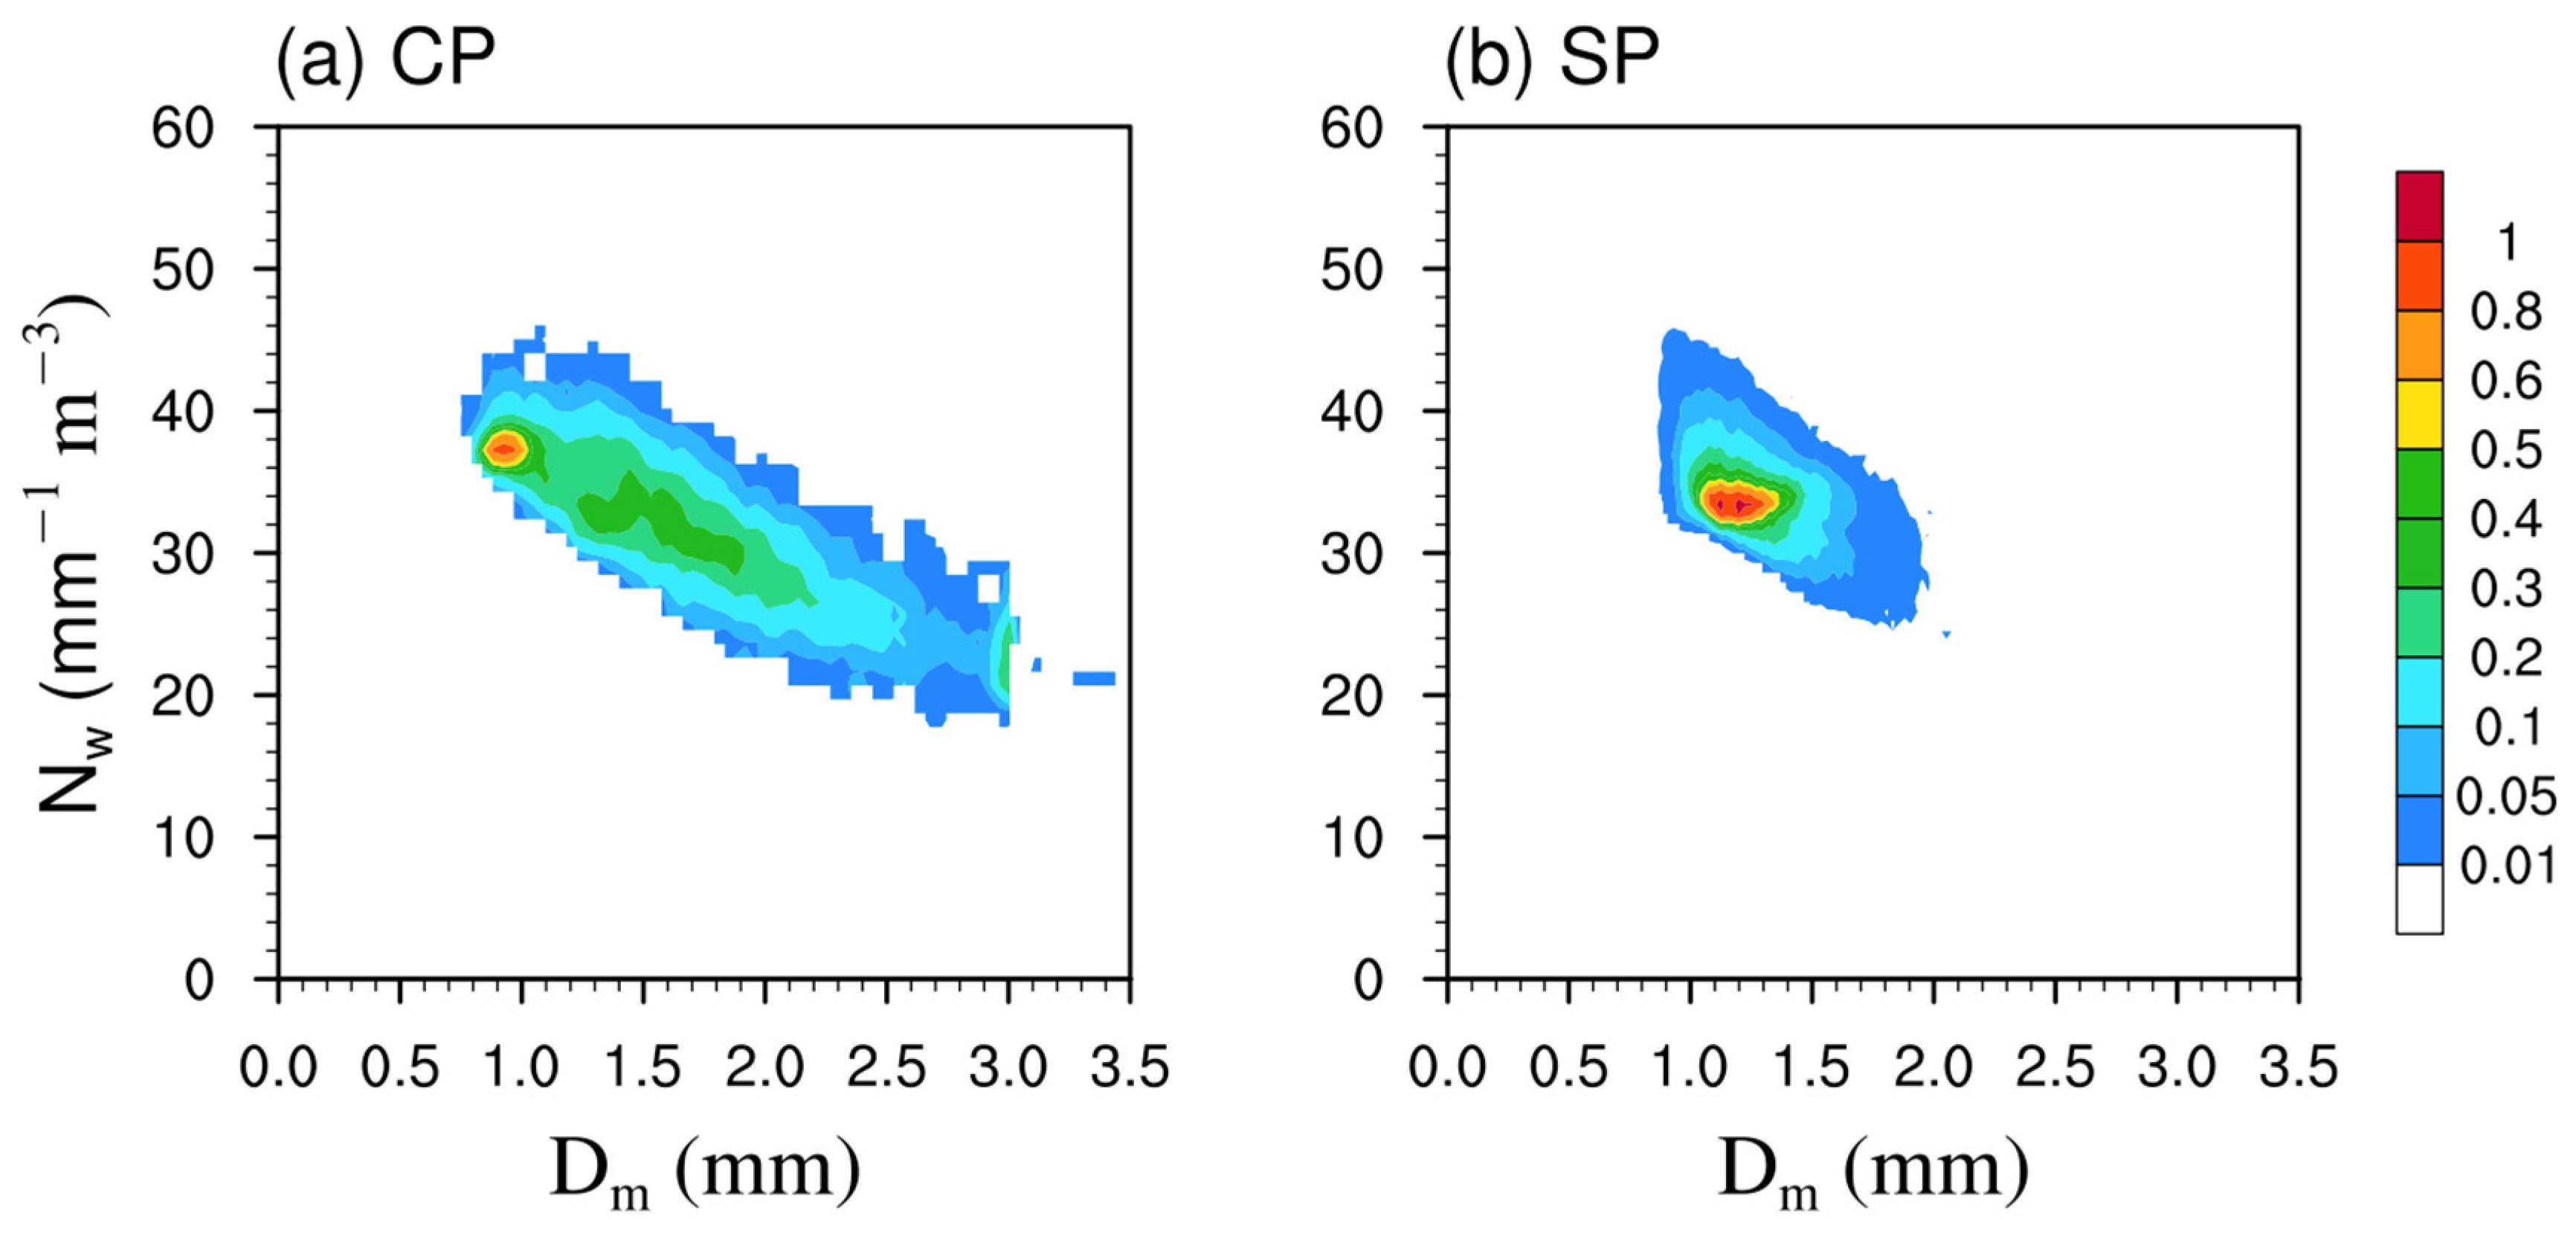
  • In the arid region (TD), the mean liquid water path (528.7 and 269.5 gm−2) during convective and stratiform precipitation is lower than that in the wet regions (e.g., the Arabian Sea) (2923.1 and 888.1 gm−2) [40], reflecting the characteristics of limited low-level liquid water in arid regions. The LWP of stratiform precipitation is lower than that of convective precipitation, corresponding to the precipitation in the arid region (TD) being dominated by stratiform precipitation (84.1% of total precipitation). Due to the different LWPs in convective and stratiform precipitation, the raindrop diameter in stratiform precipitation (1.2 mm) is smaller than that in convective precipitation (1.7 mm); while the raindrop number concentration in stratiform precipitation (34.3 mm−1 m−3) is higher than that in convective precipitation (31.9 mm−1 m−3), indicating that the raindrops are easier to grow under the environment of sufficient water vapor at the lower level.
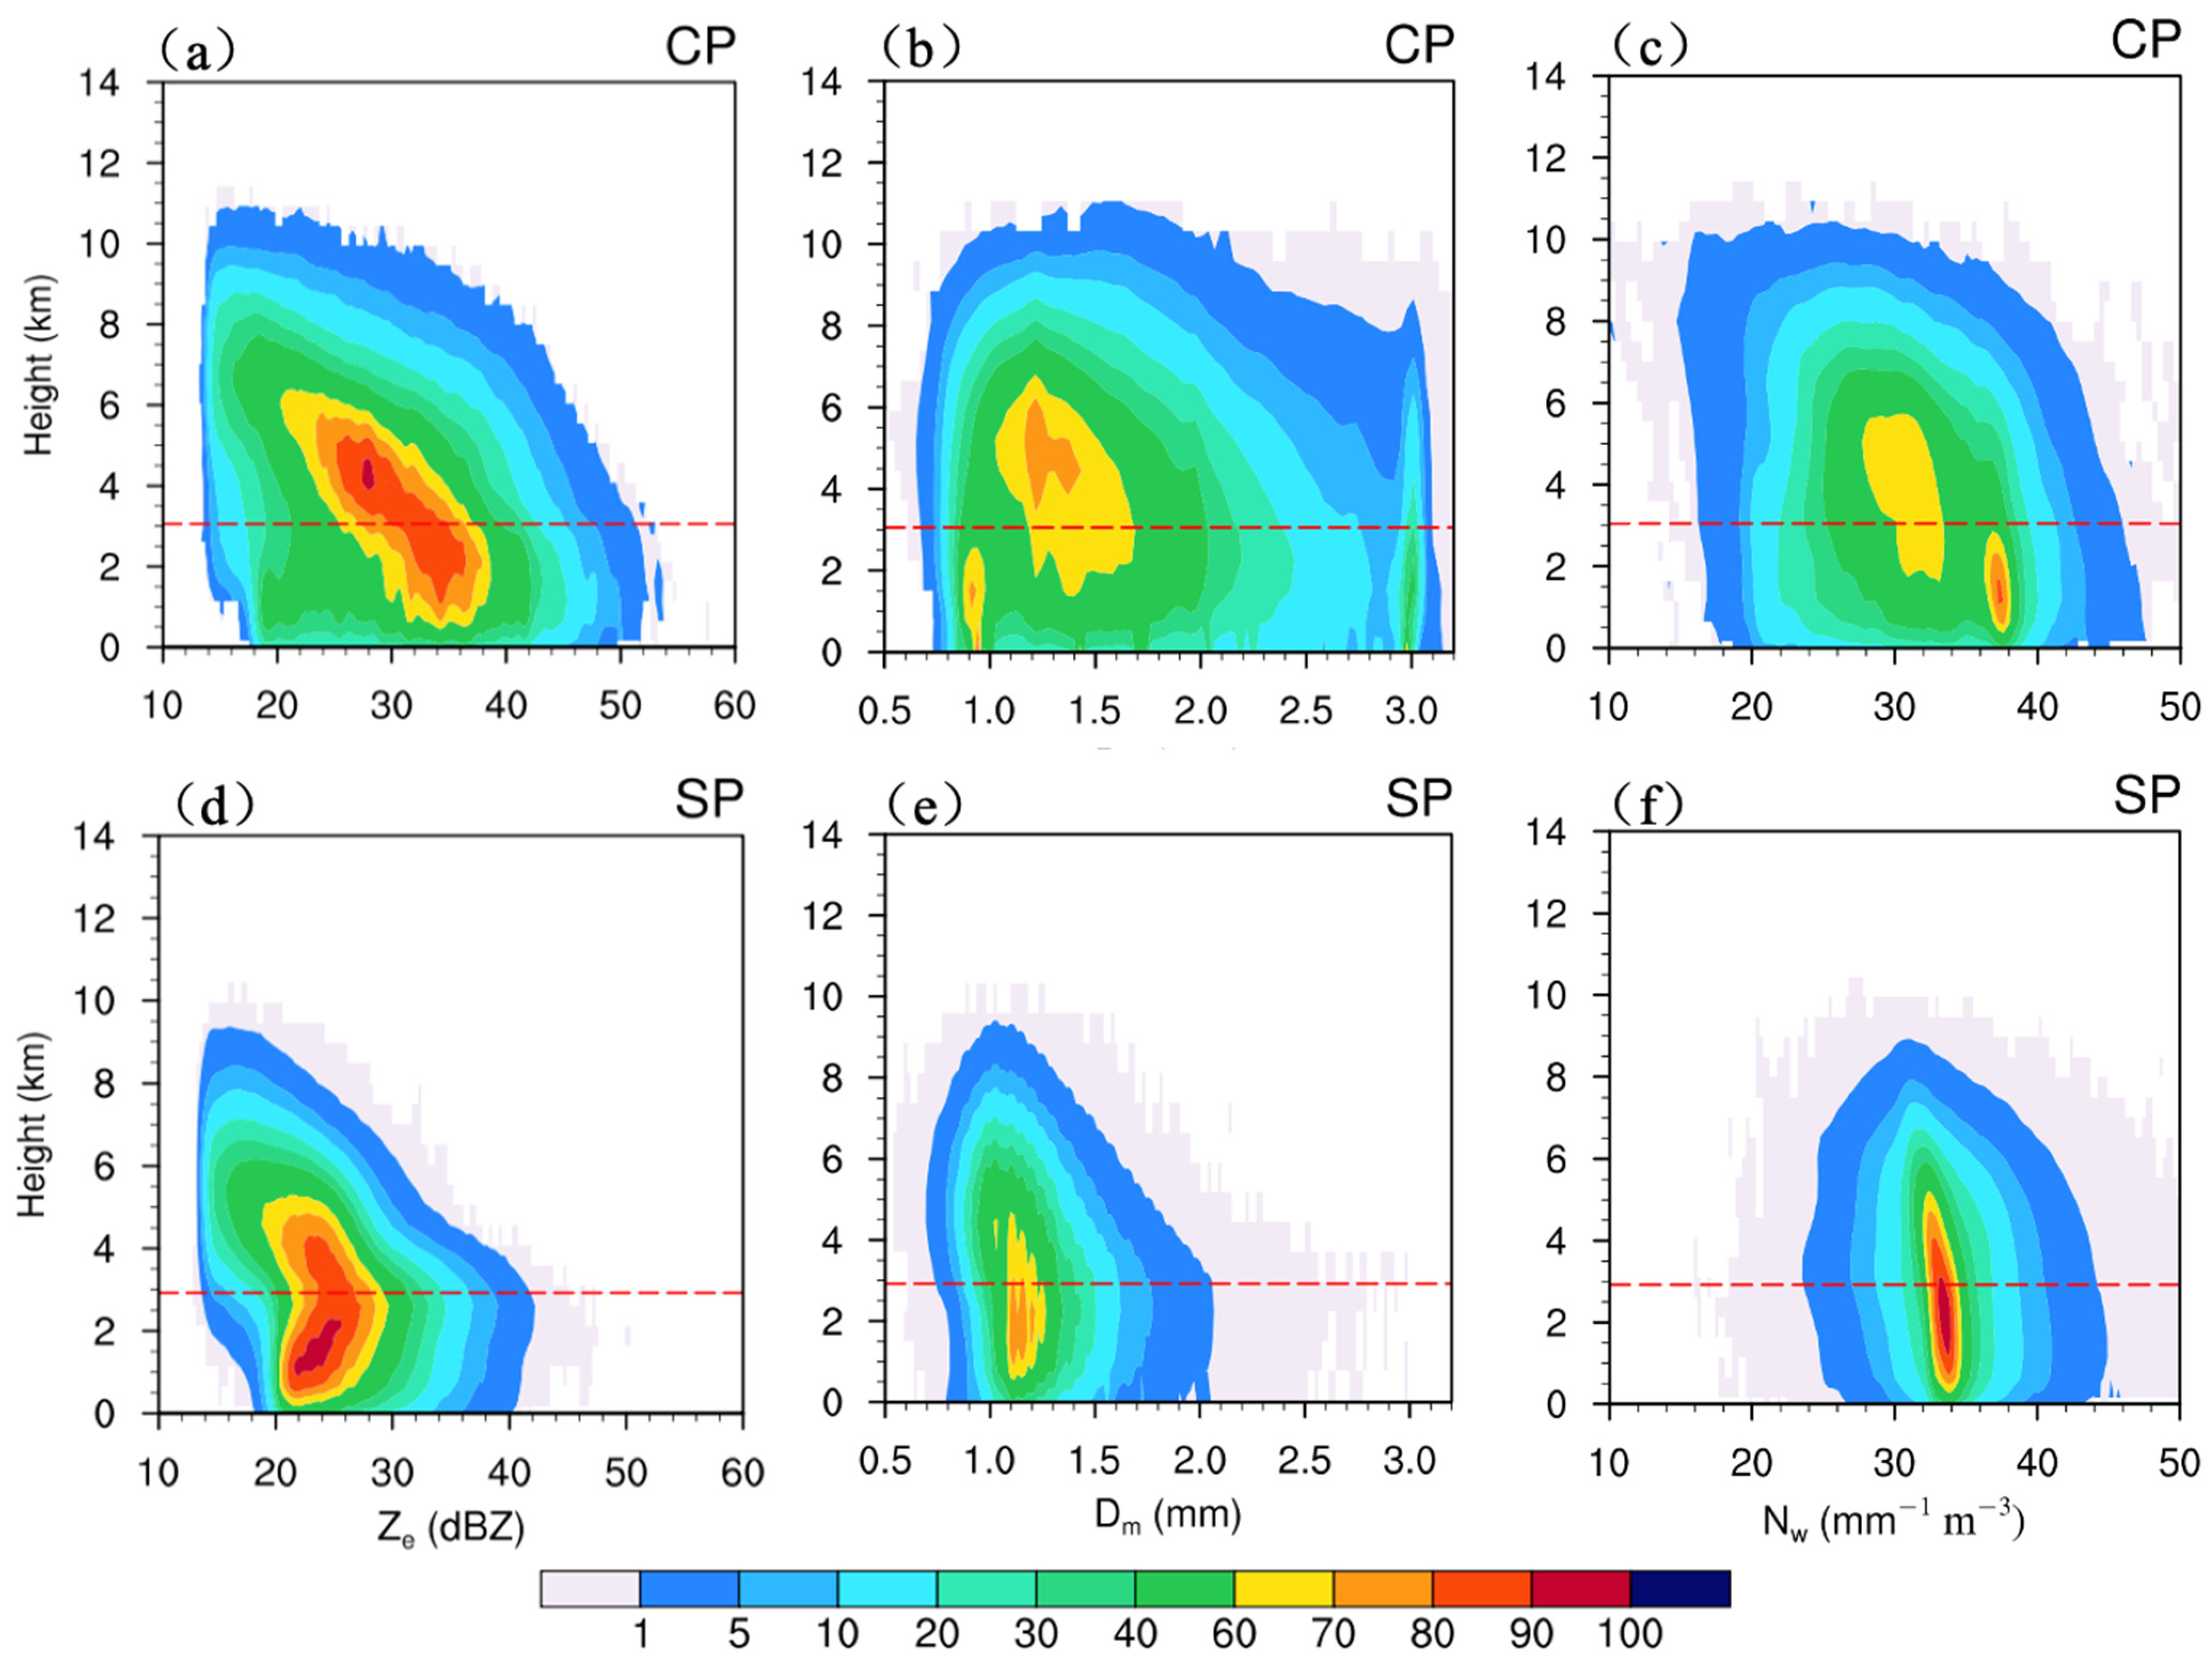
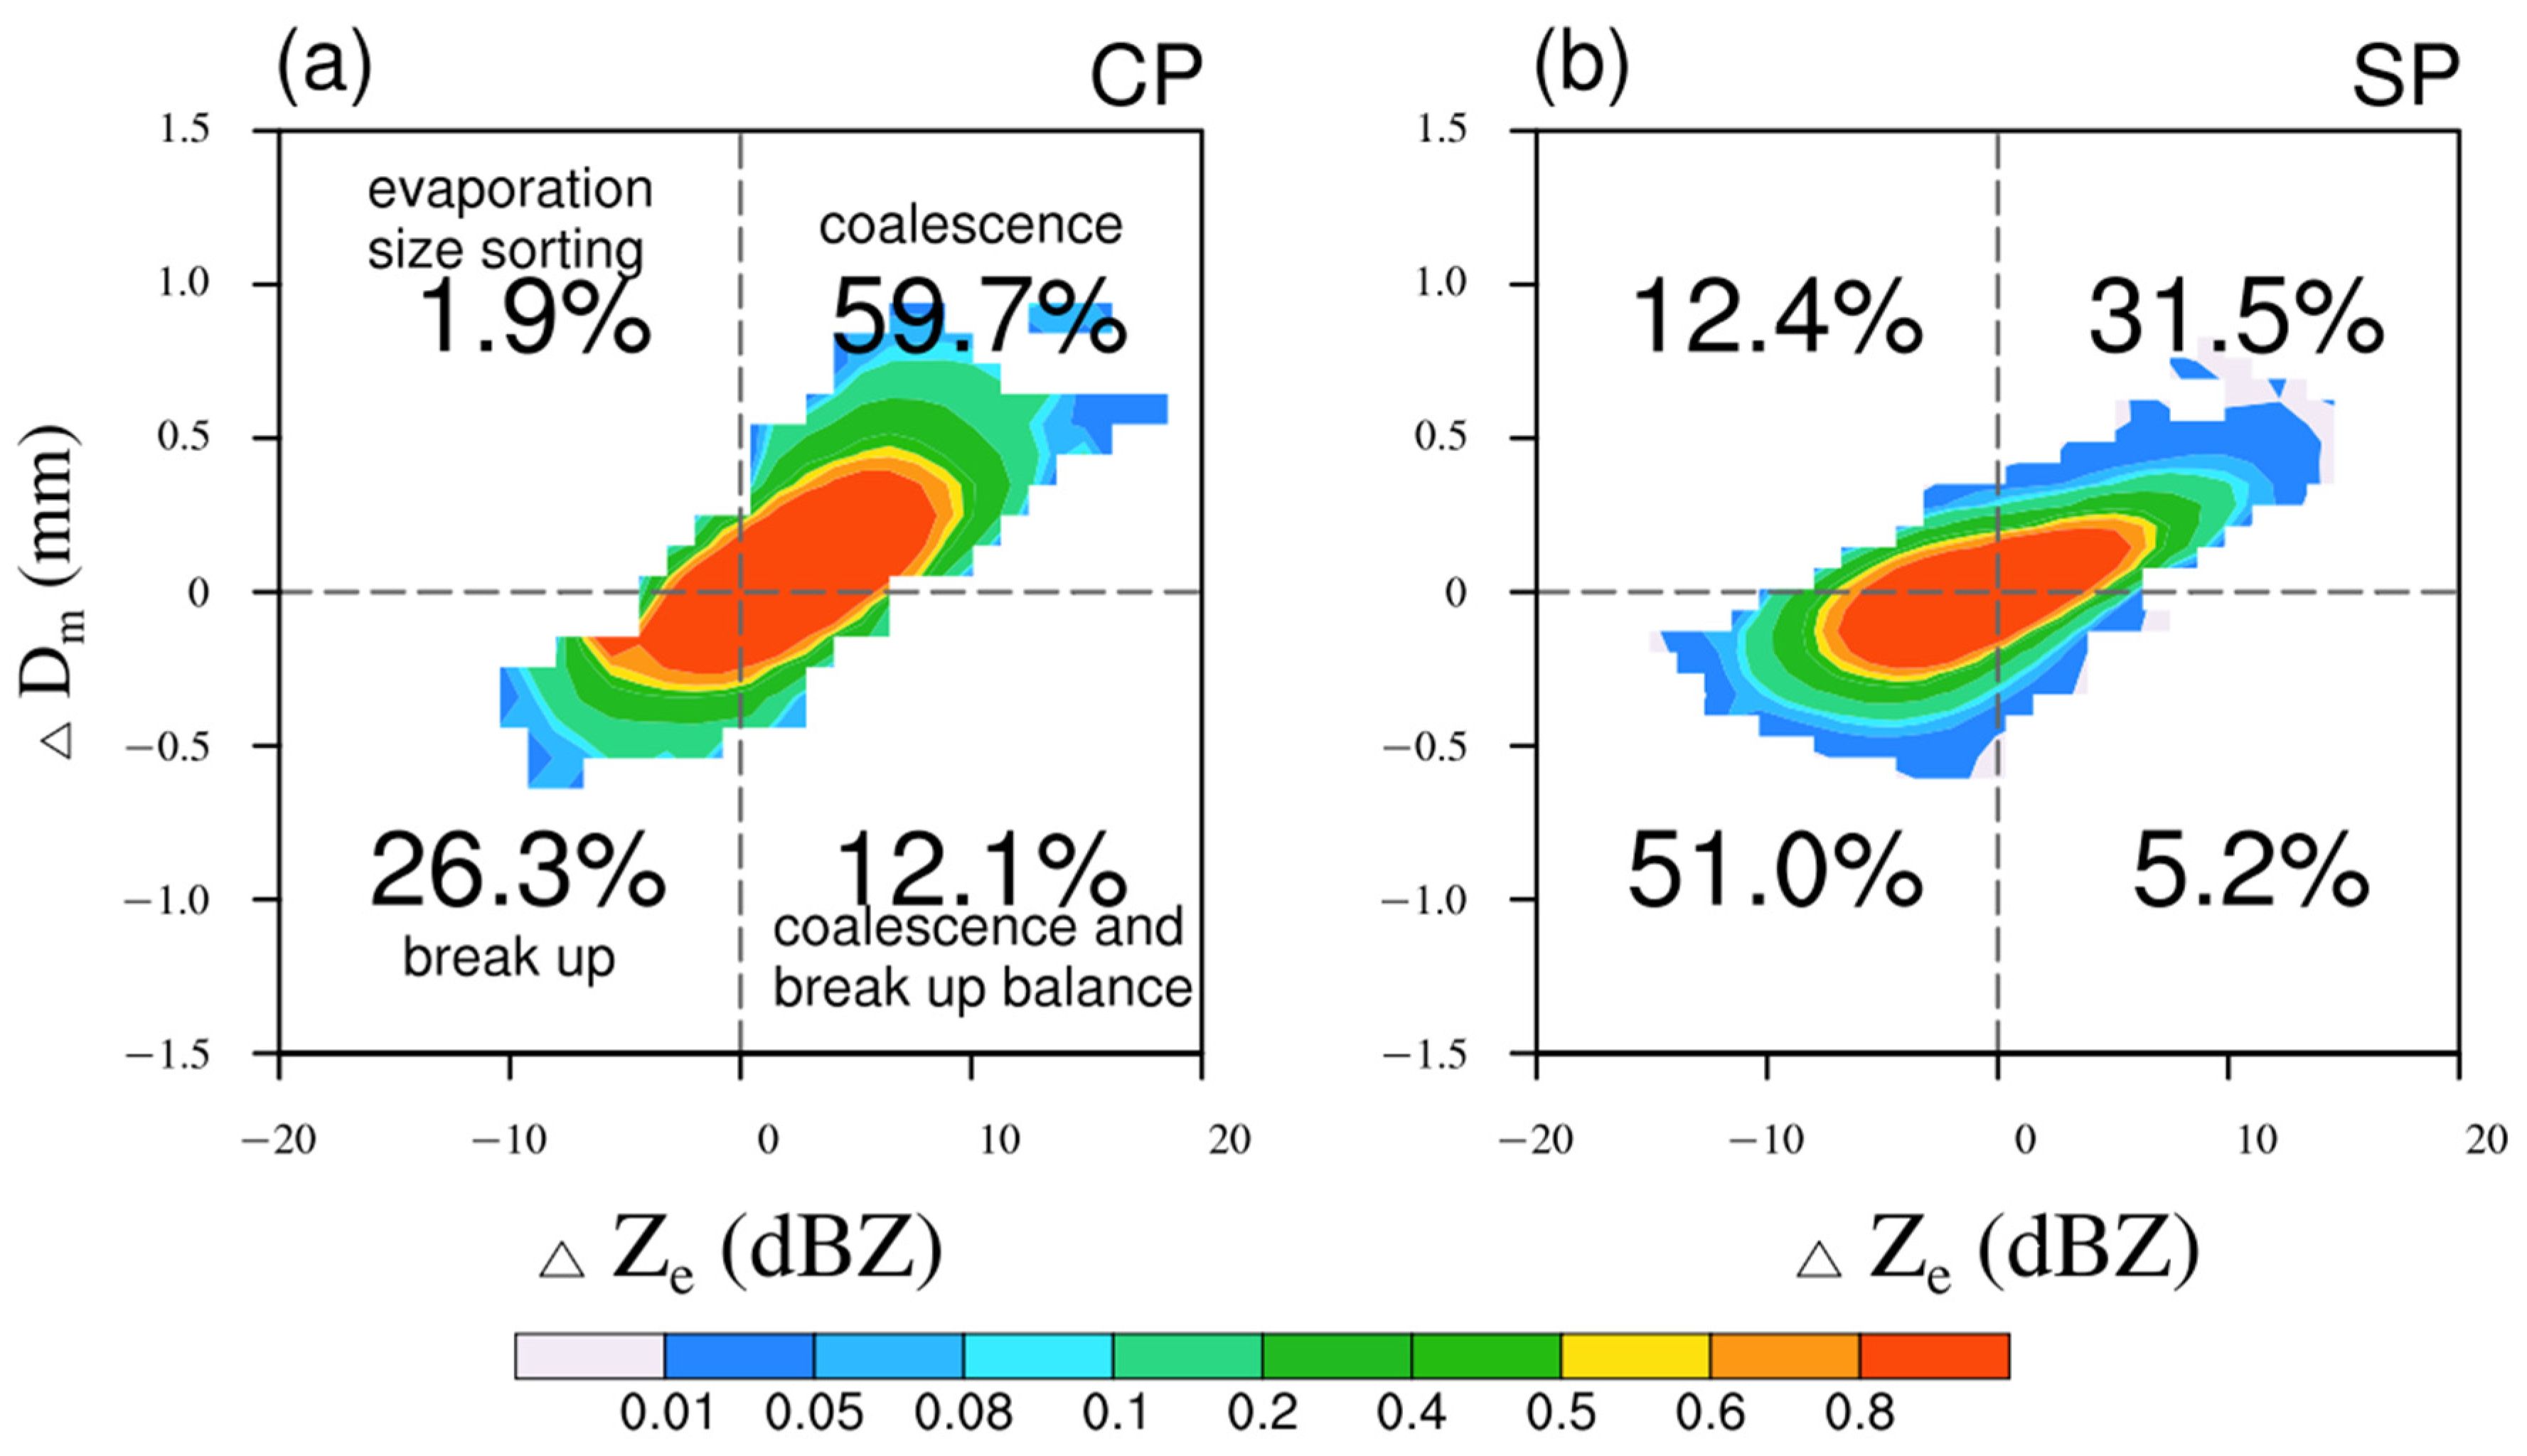
  • In convective precipitation in the arid region (TD), liquid particles are primarily formed by the uplift and condensation of low-level water vapor. During the uplift process of liquid particles in convective precipitation, a collision–coalescence process occurs, with the collision–coalescence process contributing the most to the raindrops (59.7%). In stratiform precipitation, liquid particles are mainly formed by the melting of upper-level ice-phase hydrometeors and their undergoing break-up, with the break-up process contributing the most to raindrops (51.0%).
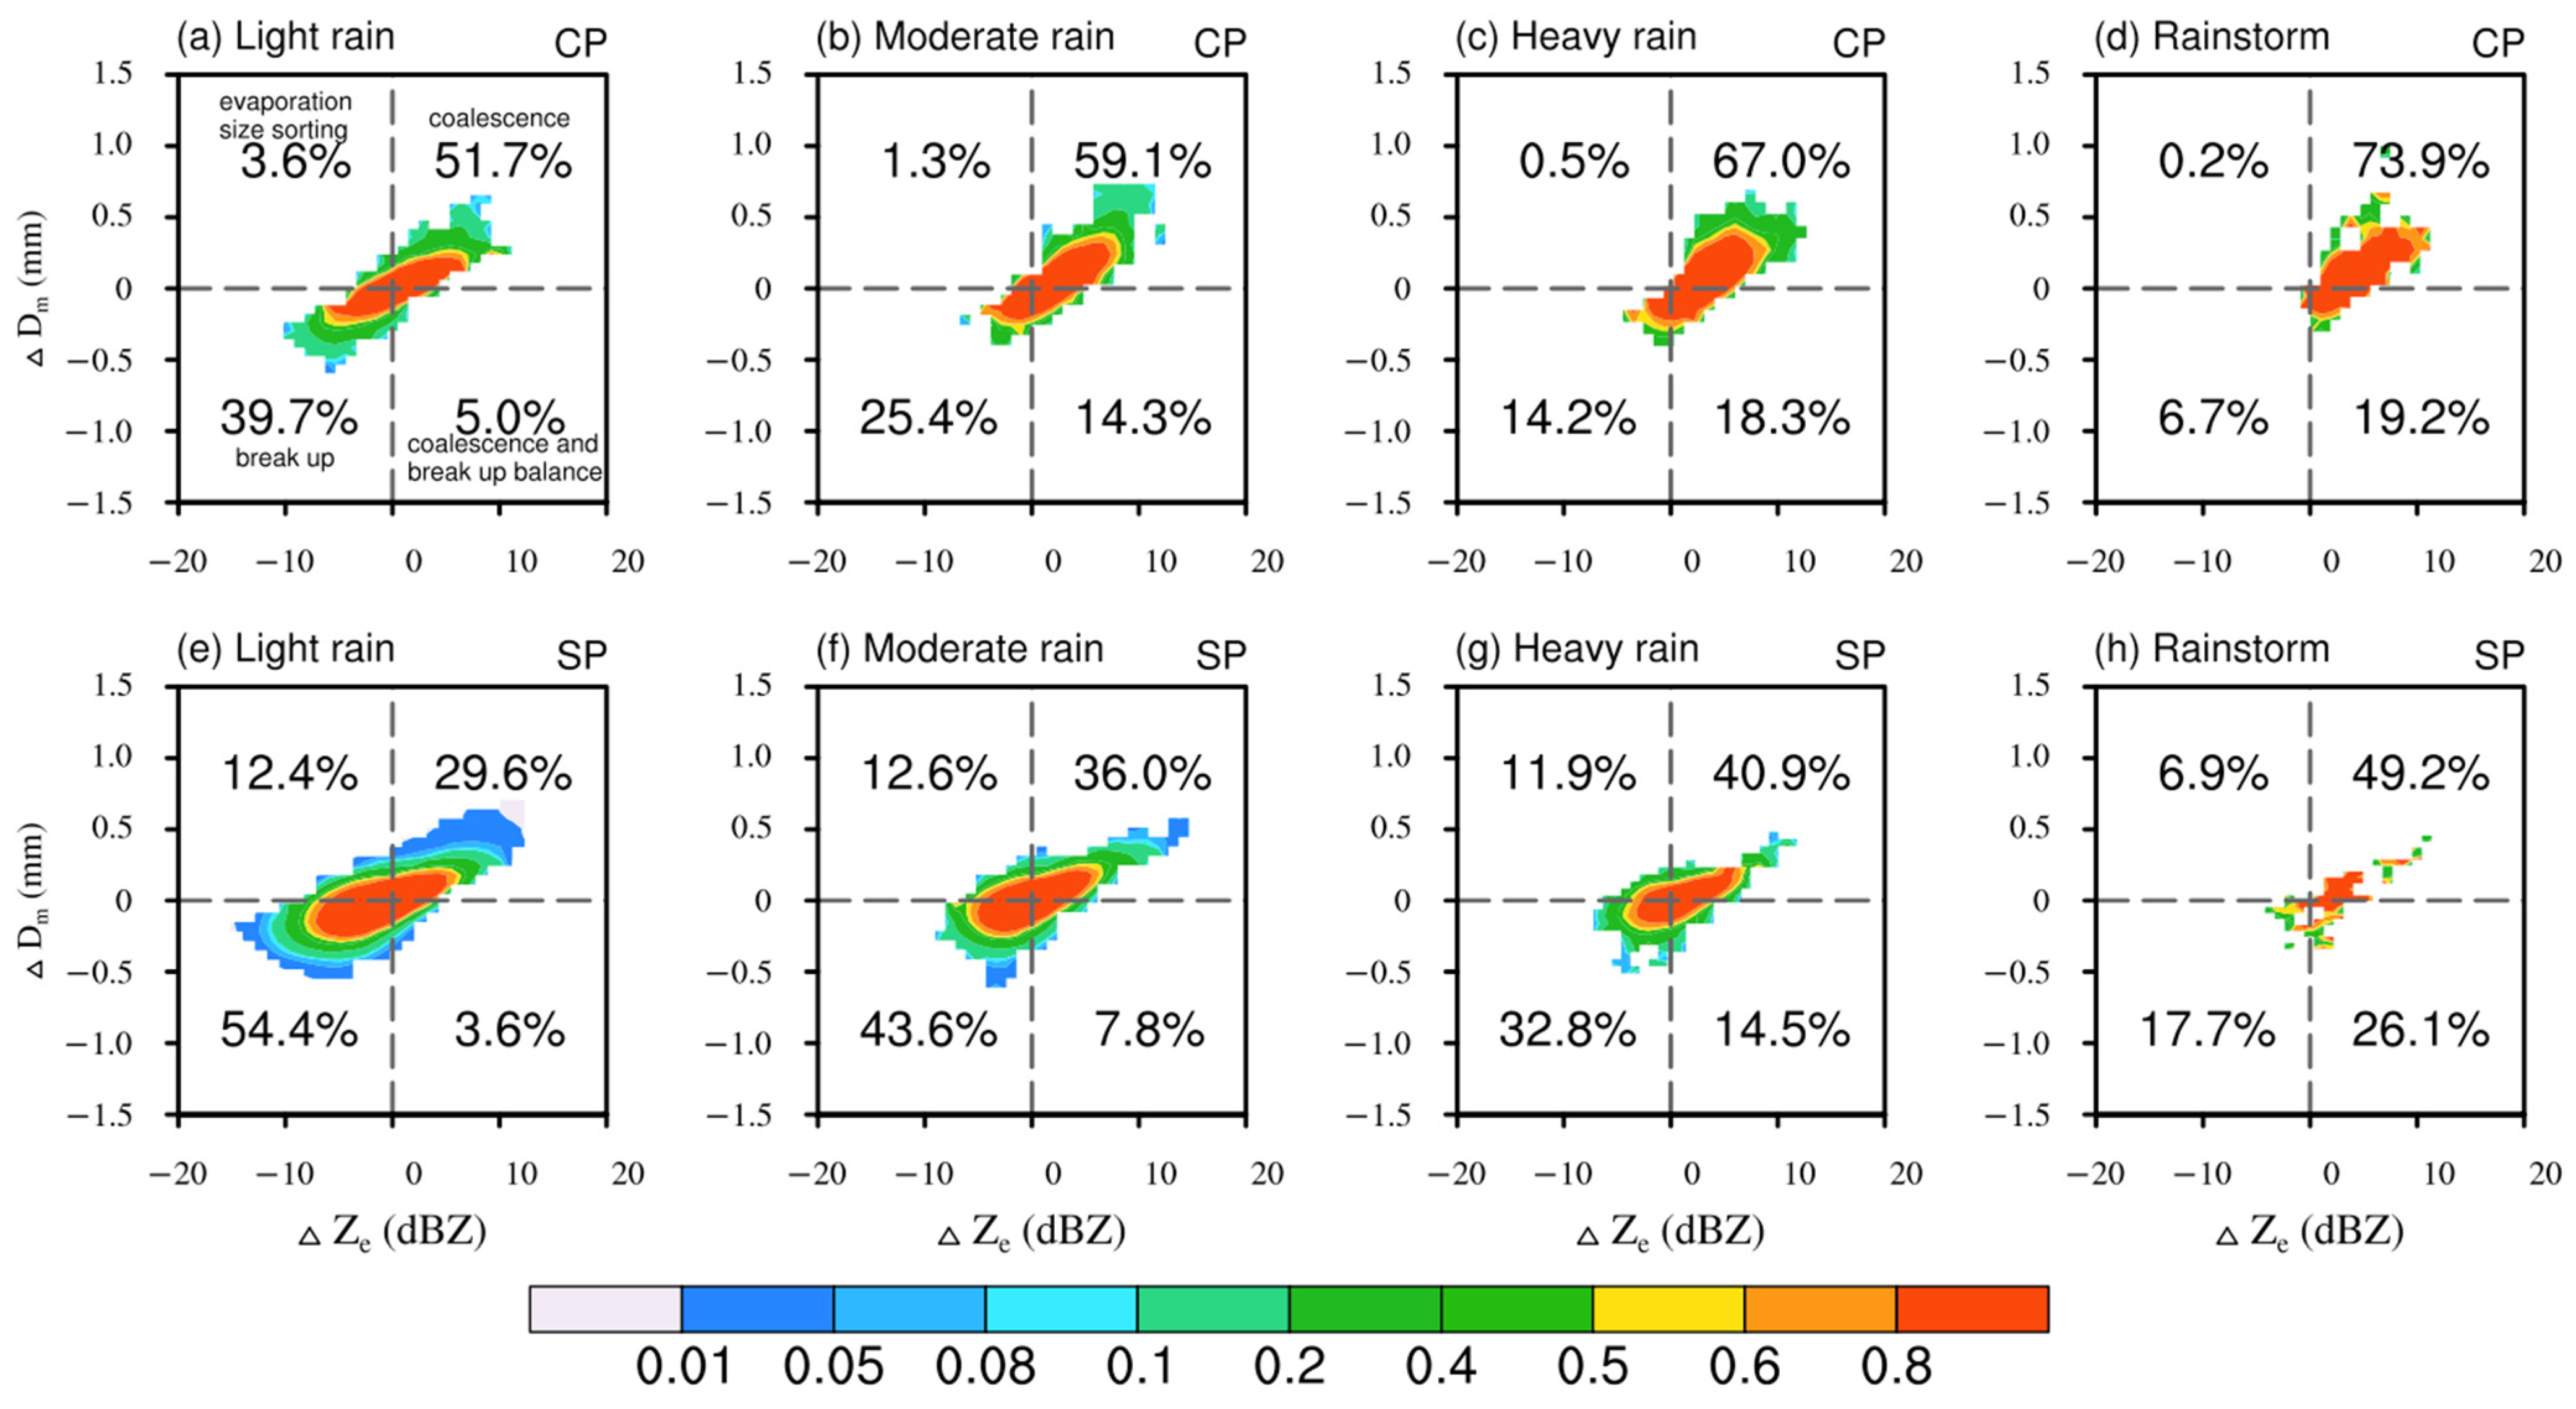
  • The precipitation rates in both convective and stratiform precipitation in the arid region (TD) are closely related to the liquid water content (LWP), with correlations exceeding 0.9. Warm rain processes in both convective and stratiform precipitation are important for raindrop formation; the more liquid water in the lower layers, the greater the collision–coalescence, the larger the raindrop diameter, and the greater the precipitation rate.
These findings give a new insight into the precipitation over the hyper-arid region, highlight the different types of precipitation vertical structural microphysical characteristics, quantitatively estimate the dominant warm rain process, and elucidate the impact of microphysical features on rain rate. These results also provide a reference for improving the microphysical parametrization of precipitation forecasting over hyper-arid regions. This study focused on the statistical microphysical characteristics of the precipitation over TD in the summer from 2014 to 2023. How the thermodynamic structure of precipitation affects the microphysical characteristics of precipitation still requires further research, combined with ground sounding and other observations.

Author Contributions

Conceptualization, W.Z. and B.Z.; methodology, W.Z.; software, W.Z.; validation, W.Z.; formal analysis, W.Z. and G.Y.; investigation, W.Z.; resources, J.C.-H.L.; data curation, W.Z.; writing—original draft preparation, W.Z. and G.Y.; writing—review and editing, W.Z., G.Y., J.C.-H.L. and B.Z.; visualization, W.Z.; supervision, J.C.-H.L. and B.Z.; project administration, W.Z.; funding acquisition, J.C.-H.L. and B.Z. All authors have read and agreed to the published version of the manuscript.

Funding

This research was funded by the NUDT Research Initiation Funding for High-Level Scientific and Technologically Innovative Talents (202402-YJRC-LJ-001) and the National Natural Science Foundation of China (42405038).

Institutional Review Board Statement

Not applicable.

Informed Consent Statement

Not applicable.

Data Availability Statement

The DPR product from the Global Precipitation Measurement (GPM) mission can be downloaded from https://doi.org/10.5067/GPM/DPR/GPM/2A/07 (accessed on 3 March 2025).

Conflicts of Interest

The authors declare no conflicts of interest.

References

  1. Muller, A.; Reason, C.J.C.; Fauchereau, N. Extreme Rainfall in the Namib Desert during Late Summer 2006 and Influences of Regional Ocean Variability. Int. J. Climatol. 2008, 28, 1061–1070. [Google Scholar] [CrossRef]
  2. Smith, J.A.; Baeck, M.L.; Yang, L.; Signell, J.; Morin, E.; Goodrich, D.C. The Paroxysmal Precipitation of the Desert: Flash Floods in the Southwestern United States. Water Resour. Res. 2019, 55, 10218–10247. [Google Scholar] [CrossRef]
  3. Meseguer-Ruiz, O.; Ponce-Philimon, P.I.; Baltazar, A.; Guijarro, J.A.; Serrano-Notivoli, R.; Olcina Cantos, J.; Martin-Vide, J.; Sarricolea, P. Synoptic Attributions of Extreme Precipitation in the Atacama Desert (Chile). Clim. Dyn. 2020, 55, 3431–3444. [Google Scholar] [CrossRef]
  4. Yao, J.; Chen, Y.; Chen, J.; Zhao, Y.; Tuoliewubieke, D.; Li, J.; Yang, L.; Mao, W. Intensification of Extreme Precipitation in Arid Central Asia. J. Hydrol. 2021, 598, 125760. [Google Scholar] [CrossRef]
  5. Donat, M.G.; Lowry, A.L.; Alexander, L.V.; O’Gorman, P.A.; Maher, N. More Extreme Precipitation in the World’s Dry and Wet Regions. Nat. Clim. Change 2016, 6, 508–513. [Google Scholar] [CrossRef]
  6. Ingram, W. Increases All Round. Nat. Clim. Change 2016, 6, 443–444. [Google Scholar] [CrossRef]
  7. Tollefson, J. Global Warming Already Driving Increases in Rainfall Extremes. Nature News, 7 March 2016. [Google Scholar] [CrossRef]
  8. Li, M.; Yao, J. Precipitation Extremes Observed over and around the Taklimakan Desert, China. PeerJ 2023, 11, e15256. [Google Scholar] [CrossRef] [PubMed]
  9. Dong, W.; Ming, Y.; Deng, Y.; Shen, Z. Recent Wetting Trend over Taklamakan and Gobi Desert Dominated by Internal Variability. Nat. Commun. 2024, 15, 4379. [Google Scholar] [CrossRef]
  10. Xueying, Z.; Jian, J.; Guoqiang, L.; Fang, W.; Huimin, Q.; Huaiqin, S. Characteristics of Precipitation at Hinterland of Taklimakan Desert, China. J. Desert Res. 2019, 39, 187. [Google Scholar] [CrossRef]
  11. Wang, C.; Zhang, S.; Li, K.; Zhang, F.; Yang, K. Change Characteristics of Precipitation in Northwest China from 1961 to 2018. DQKX 2021, 45, 713–724. [Google Scholar] [CrossRef]
  12. Wang, C.; Zhang, S.; Zhang, F.; Kechen, L.; Yang, K. On the Increase of Precipitation in the Northwestern China under the Global Warming. Adv. Earth Sci. 2021, 36, 980. [Google Scholar]
  13. Gong, Y.; Yu, H.; Hu, H.; Huang, J.; Ren, Y.; Zhou, J.; Peng, M.; Chen, S.; Alam, K.; Zhao, W.; et al. The Water Vapor Origin of a Rainstorm Event in the Taklamakan Desert. J. Geophys. Res. Atmos. 2024, 129, e2024JD041382. [Google Scholar] [CrossRef]
  14. Ren, G.Q.; Zhao, Y. Relationship between the Subtropical Westerly Jet and Summer Rainfall over Central Asia from 1961 to 2016. Plateau Meteorol. 2022, 41, 1425–1434. [Google Scholar]
  15. Yang, L.M.; Liu, J. Some advances of water vapor research in Xinjiang. J. Nat. Hazards 2018, 27, 1–13. [Google Scholar]
  16. Ayitken, M.; Yang, L.M.; Zhang, Y.H.; Musa, Y. Characteristic analysis of environment of short-time heavy rainfall under the background of the Central Asian Vortex in Xinjiang in recent ten years. Arid Zone Geogr. 2018, 41, 273–281. [Google Scholar]
  17. Hu, Q.; Zhao, Y.; Huang, A.; Ma, P.; Ming, J. Moisture transport and sources of the extreme precipitation over northern and southern Xinjiang in the summer half-year during 1979–2018. Front. Earth Sci. 2021, 9, 770877. [Google Scholar] [CrossRef]
  18. Wang, C.; Li, J.; Zhang, F.; Yang, K. Changes in the moisture contribution over global arid regions. Clim. Dyn. 2023, 61, 543–557. [Google Scholar] [CrossRef]
  19. Biggerstaff, M.I.; Houze, R.A. Kinematics and Microphysics of the Transition Zone of the 10–11 June 1985 Squall Line. J. Atmos. Sci. 1993, 50, 3091–3110. [Google Scholar] [CrossRef]
  20. Tremblay, A. The Stratiform and Convective Components of Surface Precipitation. J. Atmos. Sci. 2005, 62, 1513–1528. [Google Scholar] [CrossRef]
  21. Anagnostou, E.N. A Convective/Stratiform Precipitation Classification Algorithm for Volume Scanning Weather Radar Observations. Meteorol. Appl. 2004, 11, 291–300. [Google Scholar] [CrossRef]
  22. Powell, S.W.; Houze, R.A.; Brodzik, S.R. Rainfall-Type Categorization of Radar Echoes Using Polar Coordinate Reflectivity Data. J. Atmos. Ocean. Technol. 2016, 33, 523–538. [Google Scholar] [CrossRef]
  23. Kong, X.; Yang, J.; Li, H.; Fu, Z. Analysis on Water Vapor Characteristics of an Extreme Rainstorm in the Arid Region of Western Hexi Corridor. Meteorol. Mon. 2021, 47, 412–423. [Google Scholar]
  24. Fu, S.; Wang, F.; Li, B.; Fang, C. Raindrop Spectral Characteristics of an Autumn Convective Precipitation on the North Slope of the Qilian Mountains. Available online: http://azr.xjegi.com/CN/10.13866/j.azr.2024.10.01 (accessed on 20 February 2025).
  25. Schumacher, C.; Funk, A. Assessing Convective-Stratiform Precipitation Regimes in the Tropics and Extratropics With the GPM Satellite Radar. Geophys. Res. Lett. 2023, 50, e2023GL102786. [Google Scholar] [CrossRef]
  26. Schumacher, C.; Houze, R.A. Stratiform Rain in the Tropics as Seen by the TRMM Precipitation Radar. J. Clim. 2003, 16, 1739–1756. [Google Scholar] [CrossRef]
  27. Zeng, Y.; Yang, L.; Tong, Z.; Jiang, Y.; Zhang, Z.; Zhang, J.; Zhou, Y.; Li, J.; Liu, F.; Liu, J. Statistical Characteristics of Raindrop Size Distribution during Rainy Seasons in Northwest China. Adv. Meteorol. 2021, 2021, 6667786. [Google Scholar] [CrossRef]
  28. Huo, Z.; Ruan, Z.; Wei, M.; Ge, R.; Li, F.; Ruan, Y. Statistical Characteristics of Raindrop Size Distribution in South China Summer Based on the Vertical Structure Derived from VPR-CFMCW. Atmos. Res. 2019, 222, 47–61. [Google Scholar] [CrossRef]
  29. Hu, X.; Ai, W.; Qiao, J.; Hu, S.; Han, D.; Yan, W. Microphysics of Summer Precipitation over Yangtze-Huai River Valley Region in China Revealed by GPM DPR Observation. Earth Space Sci. 2022, 9, e2021EA002021. [Google Scholar] [CrossRef]
  30. Kumar, S. Precipitation Structure and Convective Intensity over South-East South Asia During Active and Break Spells of the Indian Summer Monsoon Using TRMM, GPM, Megha-Tropiques Satellites and Reanalysis Data. Int. J. Climatol. 2025, e8758. [Google Scholar] [CrossRef]
  31. Li, D.; Qi, Y.; Li, H. Vertical Structures and Microphysical Characteristics of Summer Precipitation in North China Detected by GPM-DPR. Sci. Total Environ. 2024, 933, 173129. [Google Scholar] [CrossRef]
  32. D’Adderio, L.P.; Vulpiani, G.; Porcù, F.; Tokay, A.; Meneghini, R. Comparison of GPM Core Observatory and Ground-Based Radar Retrieval of Mass-Weighted Mean Raindrop Diameter at Midlatitude. J. Hydrometeorol. 2018, 19, 1583–1598. [Google Scholar] [CrossRef]
  33. Skofronick-Jackson, G.; Kirschbaum, D.; Petersen, W.; Huffman, G.; Kidd, C.; Stocker, E.; Kakar, R. The Global Precipitation Measurement (GPM) Mission’s Scientific Achievements and Societal Contributions: Reviewing Four Years of Advanced Rain and Snow Observations. Q. J. R. Meteorol. Soc. 2018, 144, 27–48. [Google Scholar] [CrossRef] [PubMed]
  34. Masaki, T.; Iguchi, T.; Kanemaru, K.; Furukawa, K.; Yoshida, N.; Kubota, T.; Oki, R. Calibration of the Dual-Frequency Precipitation Radar Onboard the Global Precipitation Measurement Core Observatory. IEEE Trans. Geosci. Remote Sens. 2022, 60, 5100116. [Google Scholar] [CrossRef]
  35. Gao, J.; Tang, G.; Hong, Y. Similarities and Improvements of GPM Dual-Frequency Precipitation Radar (DPR) upon TRMM Precipitation Radar (PR) in Global Precipitation Rate Estimation, Type Classification and Vertical Profiling. Remote Sens. 2017, 9, 1142. [Google Scholar] [CrossRef]
  36. Iguchi, T.; Seto, S.; Meneghini, R.; Yoshida, N.; Awaka, J.; Kubota, T. GPM/DPR Level-2 Algorithm Theoretical Basis Document; NASA Goddard Space Flight Center: Greenbelt, MD, USA, 2010. Available online: https://gpm.nasa.gov/resources/documents/gpmdpr-level-2-algorithm-theoretical-basis-document-atbd (accessed on 1 March 2025).
  37. Bringi, P.V.N.; Chandrasekar, V. Polarimetric Doppler Weather Radar: Principles and Applications; Cambridge University Press: Cambridge, UK, 2001. [Google Scholar]
  38. Behrangi, A.; Song, Y.; Huffman, G.J.; Adler, R.F. Comparative Analysis of the Latest Global Oceanic Precipitation Estimates from GPM V07 and GPCP V3.2 Products. J. Hydrometeorol. 2024, 25, 293–309. [Google Scholar] [CrossRef]
  39. Cannon, F.; Ralph, F.M.; Wilson, A.M.; Lettenmaier, D.P. GPM Satellite Radar Measurements of Precipitation and Freezing Level in Atmospheric Rivers: Comparison with Ground-Based Radars and Reanalyses. J. Geophys. Res. Atmos. 2017, 122, 12–747. [Google Scholar]
  40. Kumar, A.; Srivastava, A.K.; Sunilkumar, K.; Srivastava, M.K. Microphysical Characteristics of Cyclonic Rainfall: A GPM-DPR Based Study Over the Arabian Sea. Earth Space Sci. 2023, 10, e2023EA002895. [Google Scholar] [CrossRef]
  41. Kumjian, M.R.; Prat, O.P. The Impact of Raindrop Collisional Processes on the Polarimetric Radar Variables. J. Atmos. Sci. 2014, 71, 3052–3067. [Google Scholar] [CrossRef]
  42. Huang, H.; Chen, F. Precipitation Microphysics of Tropical Cyclones Over the Western North Pacific Based on GPM DPR Observations: A Preliminary Analysis. J. Geophys. Res. Atmos. 2019, 124, 3124–3142. [Google Scholar] [CrossRef]
Figure 1. Study region and its surrounding terrain (unit: m), the rectangular box represents the sampling region.
Atmosphere 16 00354 g001
Figure 2. Two-dimensional spatial frequency of ice water path (IWP, unit: g·m−2) and liquid water path (LWP, unit: g·m−2) in convective and stratiform precipitation: (a) convective precipitation; (b) stratiform precipitation.
Atmosphere 16 00354 g002
Figure 3. The two-dimensional spatial frequency of near-surface raindrop diameter (Dm, unit: mm) and raindrop number concentration (Nw, unit: mm−1 m−3) in convective and stratiform precipitation: (a) convective precipitation; (b) stratiform precipitation.
Atmosphere 16 00354 g003
Figure 4. Normalized frequency distribution of reflectivity (Ze, unit: dBZ), hydrometeor diameter (Dm, unit: mm), and number concentration (Nw, unit: mm−1 m−3) in convective and stratiform precipitation (unit: %): (ac) convective precipitation; (df) stratiform precipitation. (a,d) Radar reflectivity; (b,e) hydrometeor diameter; (c,f) hydrometeor number concentration. The red line indicates the 0 °C level.
Atmosphere 16 00354 g004
Figure 5. Two-dimensional frequency distribution of ΔDm (unit: mm) and ΔZe (unit: dBZ) in convective and stratiform precipitation: (a) convective precipitation; (b) stratiform precipitation.
Atmosphere 16 00354 g005
Figure 6. Scatter of precipitation rate of the liquid water path (LWP) (unit: kg m−2) and ice water path (IWP) (unit: kg m−2): (a,b) convective precipitation; (c,d) stratiform precipitation. (a,c) Liquid water path; (b,d) ice water path. All correlations passed the 99% significance test.
Atmosphere 16 00354 g006
Figure 7. Hydrometeor diameter (Dm) (unit: mm) and number concentration (Nw) (unit: mm−1 m−3) in convective and stratiform precipitation for different precipitation intensities: (a,c) convective precipitation; (b,d) stratiform precipitation. (a,b) Dm; (c,d) Nw. The red line represents the 0 °C layer.
Atmosphere 16 00354 g007
Figure 8. Two-dimensional frequency distribution of ΔDm (unit: mm) and ΔZe (unit: dBZ) in convective and stratiform precipitation for different precipitation intensities: (ad) convective precipitation; (eh) stratiform precipitation. (a,e) Light rain; (b,f) moderate rain; (c,g) heavy rain, (d,h) rainstorm.
Atmosphere 16 00354 g008
Table 1. Number of convective and stratiform precipitation samples, liquid water path, ice water path, raindrop diameter, and raindrop number detected by GPM-DPR over the TD during the summer from 2014 to 2023.
RegionsPrecipitation TypeSamples
(Proportion %)
LWP
(gm−2)
IWP
(gm−2)
Diameter
(mm)
Number Concentration
(mm−1 m−3)
TDConvective 7712528.7410.71.731.9
precipitation(16%)
Stratiform 40,608269.5268.61.234.3
precipitation(84%)
Arabian Sea [40]Convective 73972923.1322.91.536.3
precipitation(25%)
Stratiform 21,757888.1396.71.334.1
precipitation(75%)
Disclaimer/Publisher’s Note: The statements, opinions and data contained in all publications are solely those of the individual author(s) and contributor(s) and not of MDPI and/or the editor(s). MDPI and/or the editor(s) disclaim responsibility for any injury to people or property resulting from any ideas, methods, instructions or products referred to in the content.

