Article

The Impact of Climate Change on the Functioning of Drainage Systems in Industrial Areas—A Case Study

by
Katarzyna Wartalska
1,*,
Szymon Szymczewski
2,
Weronika Domalewska
1,
Marcin Wdowikowski
1,
Kornelia Przestrzelska
1,
Andrzej Kotowski
1 and
Bartosz Kaźmierczak
1
1
Faculty of Environmental Engineering, Wrocław University of Science and Technology, 50-370 Wrocław, Poland
2
Industrial Development Agency JSC, 00-400 Warsaw, Poland
*
Author to whom correspondence should be addressed.
Atmosphere 2025, 16(3), 347; https://doi.org/10.3390/atmos16030347
Submission received: 21 February 2025 / Revised: 14 March 2025 / Accepted: 19 March 2025 / Published: 20 March 2025
(This article belongs to the Special Issue The Water Cycle and Climate Change (3rd Edition))

Abstract

:
Stormwater drainage from urbanised areas has gained importance due to progressing land surface sealing and climate change. More frequent extreme rainfall events lead to overloaded drainage systems and flash floods, particularly in industrial zones experiencing rapid development. The study analysed the sewage system operation in the Special Economic Zone (SEZ) in Lower Silesia, Poland to assess the impact of climate-induced rainfall changes. Three rainfall scenarios were used: model rainfall using historic rainfall intensities, model rainfall using actual intensities, and real precipitation recorded in June 2022. Findings indicate that climate change has negatively affected the stormwater drainage system, resulting in increased overloads and flooding. Particularly, the II scenario showed a significant rise in rainwater inflow to retention reservoirs by 53.1% for ZR-1 and 44.5% for ZR-2 (compared to the I scenario). To address these issues, adaptations are needed for increased rainwater flows, including additional retention facilities, blue–green infrastructure, or rainwater harvesting for the SEZ needs.

1. Introduction

One of the most important infrastructures in urban and industrial areas is the stormwater drainage system, which is used to convey excess rainwater from the catchment area to receiving bodies such as rivers, lakes, or ditches. Stormwater drainage systems should protect against the effects of flooding, that result in economic and social losses. However, it is not possible to achieve its completely reliable operation due to the stochastic nature of precipitation [1,2].
Safe design of sewerage systems is aimed at ensuring an adequate standard of drainage of the area, which is defined as adapting the system to accept forecasted maximum rainwater streams with a frequency equal to the permissible (socially acceptable) frequency of their flooding on the area. The EN 752 standard [3] proposes differentiating the permissible frequency of sewerage system spills on a seven-grade scale of environmental hazard impact, i.e., for seven defined example locations (Table 1). At the same time, it is stipulated that the values of the permissible spillway hazard frequencies provided in Table 1, as examples, may be both increased and decreased (in the case of redeveloping existing systems when achieving the criteria entails excessively high costs).
Verifying the designed channel diameters (for given slopes of their bottoms) should be carried out by hydrodynamic modelling for various rainfall load scenarios [4,5]. Short-lived intensive heavy rainfall events, usually of small territorial extent, as well as prolonged rainfall events of lesser intensity but large extent, can result in flooding.
The issue of draining rainwater from urbanised areas has gained particular significance in recent years. On the one hand, the ever-increasing sealing of the land surface is increasing the values of rainwater runoff coefficients, resulting in a hydraulic overload of stormwater drainage systems [6], while on the other hand, more and more attention is being paid to climate change, especially in the context of global warming and the increasing frequency of extreme weather events [7,8,9]. Due to global warming and as a result of anthropogenic activities, extreme precipitation events will become more common [10,11,12,13]. Both increasing urbanisation and climate change are having a negative impact on the efficiency of sewerage systems, causing them to become increasingly overloaded, leading to local or urban flooding [14,15].
The increase in air temperature has a significant impact on the circulation of water in the hydrological cycle (evaporation–condensation–precipitation) and increasing the occurrence of extreme weather events, especially in recent decades. Trends of increasing frequency of extreme precipitation are observed across Europe. For example, the paper [16] predicts an increase in intense precipitation in selected regions of Belgium, France, the Netherlands, and Germany of 10–50% over the following 100 years. In the UK, there is a forecast of an increase in precipitation intensity of approx. 20% by 2085, and projections estimating that more than 1.2 million more people will be at risk of pluvial flooding in 2050 than today, due to climate change and increasing urbanisation. The paper [17] predicts that precipitation in Denmark with a current exceedance probability of p = 0.01 (once in 100 years) will change to a probability of exceedance of p = 0.05 (once in 20 years) in 100 years.
In order to meet the combined challenges of climate change and urbanisation, carefully selected adaptation measures are required through technical, economic, and political commitment [18,19,20]. It should be noted that each case must be considered independently, due to the diversity of drainage systems [21]. Technical adaptation solutions include increasing channel diameters or building retention tanks [22,23,24].
A specific situation exists in peri-urban agricultural land converted to industrial use land. It is possible to distinguish special economic zones (SEZs), which operate in Poland on the basis of the Act of 20 October 1994 [25]. SEZs are usually drained by means of drainage ditches, sized for surface runoff as for agricultural land. Industrial areas, on the other hand, are characterised by significant levels of surface sealing, reaching up to 90%. As a result, there is significantly high immediate surface runoff of rainwater in these areas. Direct discharge of these waters into drainage ditches could lead to localised flooding, damage to road culverts etc. In order to ensure an adequate standard of drainage in such areas, reservoirs are used to allow hydraulic relief of the receiving waters [26,27].
Land development that changes over time (increasing the level of sealing) as a result of business development in the economic zones may lead to overloading stormwater drains over time and the need to upgrade them to meet the required drainage standard for the site. Although the modelling of stormwater sewerage systems is frequently addressed in the literature, most papers are concerned with urban areas including residential development, while there are few papers devoted to industrial areas. This study analyses the performance of the existing drainage system in the SEZ area of Lower Silesia (Poland) under changing precipitation conditions driven by climate change. The frequency of extreme rainfall events in the SEZ is increasing, often surpassing the design thresholds of the drainage system. This has resulted in overloading and malfunctioning of the stormwater drainage system. To investigate the impact of climate change on the system’s operation, hydrodynamic simulations were performed with rainfall scenarios, taking into account the system design conditions and actual rainfall characteristics. The study results may constitute a valuable source of information for operators of systems of this type.

2. Materials and Methods
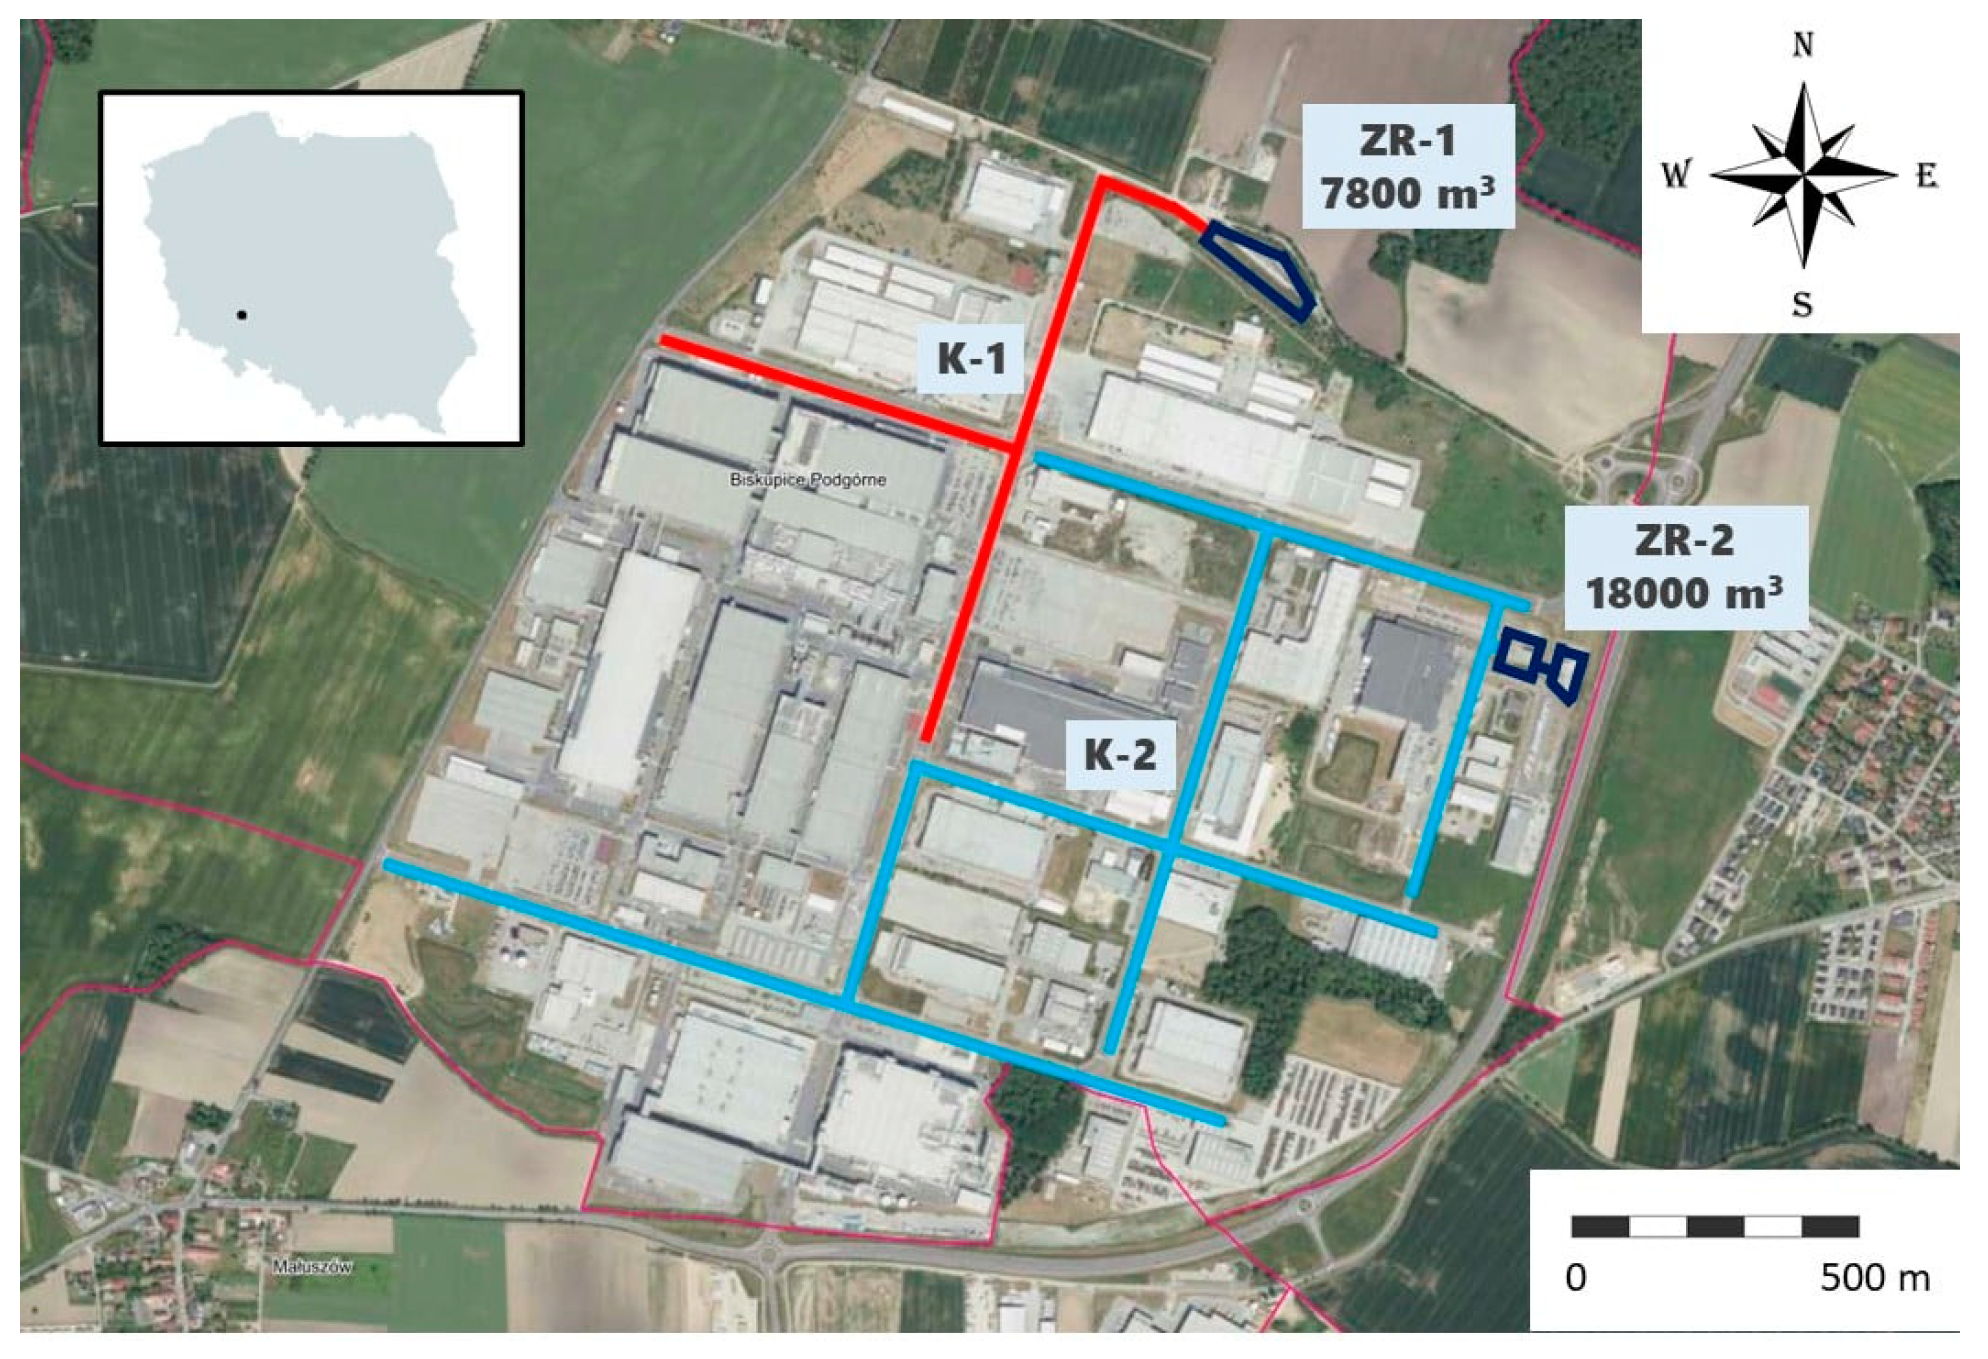
2.1. Study Area

The study area consists of a Special Economic Zone near Wrocław (Lower Silesia, Poland), an industrial site that covers an area of approx. 280 ha and is directly adjacent to farmland. For the most built-up parcels, the degree of land sealing is approx. 70%. Site ordinates are in the range of 145.03–153.63 m a.s.l. The site denivelation is 8.6 m.
In the area of the SEZ, there is a stormwater drainage system consisting of two collectors: K-1 and K-2 (Figure 1). In addition to street drains, the sub-catchments (internal stormwater drainage systems) of the businesses located in the Zone are connected to the collectors. The sewerage network is made of PEHD, with diameters ranging from 0.3 to 1.8 m. The total length of the system is approximately 8 km and includes a total of 164 manholes. The K-1 collector, with a total length of 2.1 km, discharges rainwater into the ZR-1 retention basin, located in the northern part of the Zone. Rainwater received by the K-2 collector, with a total length of 5.8 km, is discharged into the ZR-2 retention reservoir located in the north-eastern part of the Zone.
The retention volume of the ZR-1 reservoir is 7800 m3, with an average fill of 2.20 m. The diameter of the inlet channel is 1.8 m, while the outlet channel is 1.4 m. Rainwater retained in the reservoir is discharged through an outflow regulator into the drainage ditch and further into the Kasina River and then through the Ślęza River into the Oder River.
The retention volume of the ZR-2 reservoir is 18,000 m3, with an average fill of 2.32 m. The diameter of the inlet channel is 1.6 m, while the outlet channel is 1.4 m. Rainwater retained in the reservoir is discharged through an outflow regulator into a nearby drainage ditch and further through the Ślęza River into the Oder River.

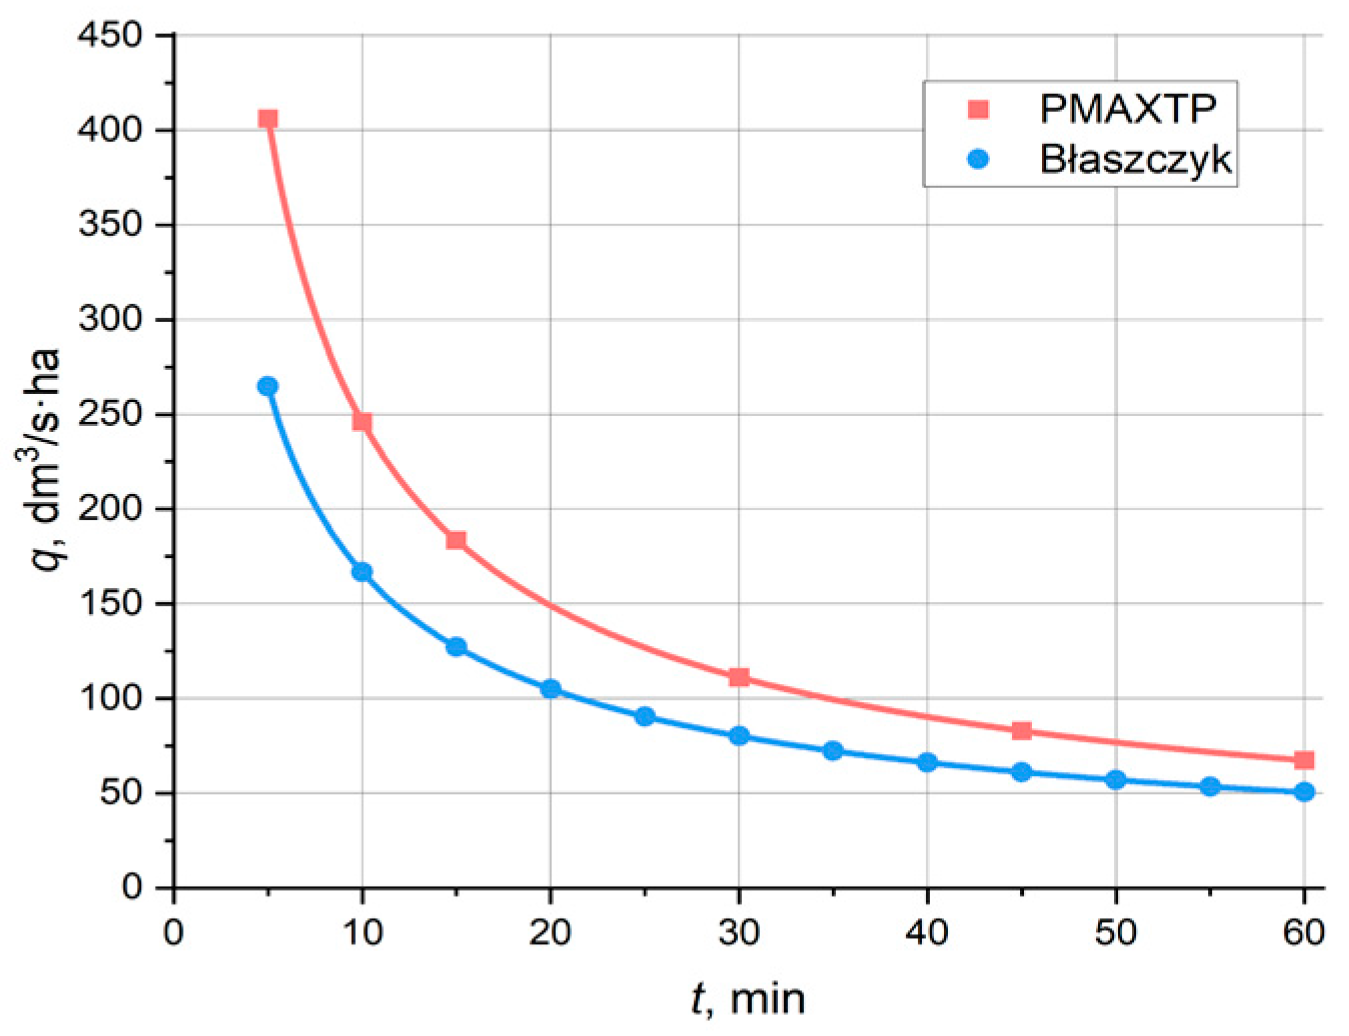
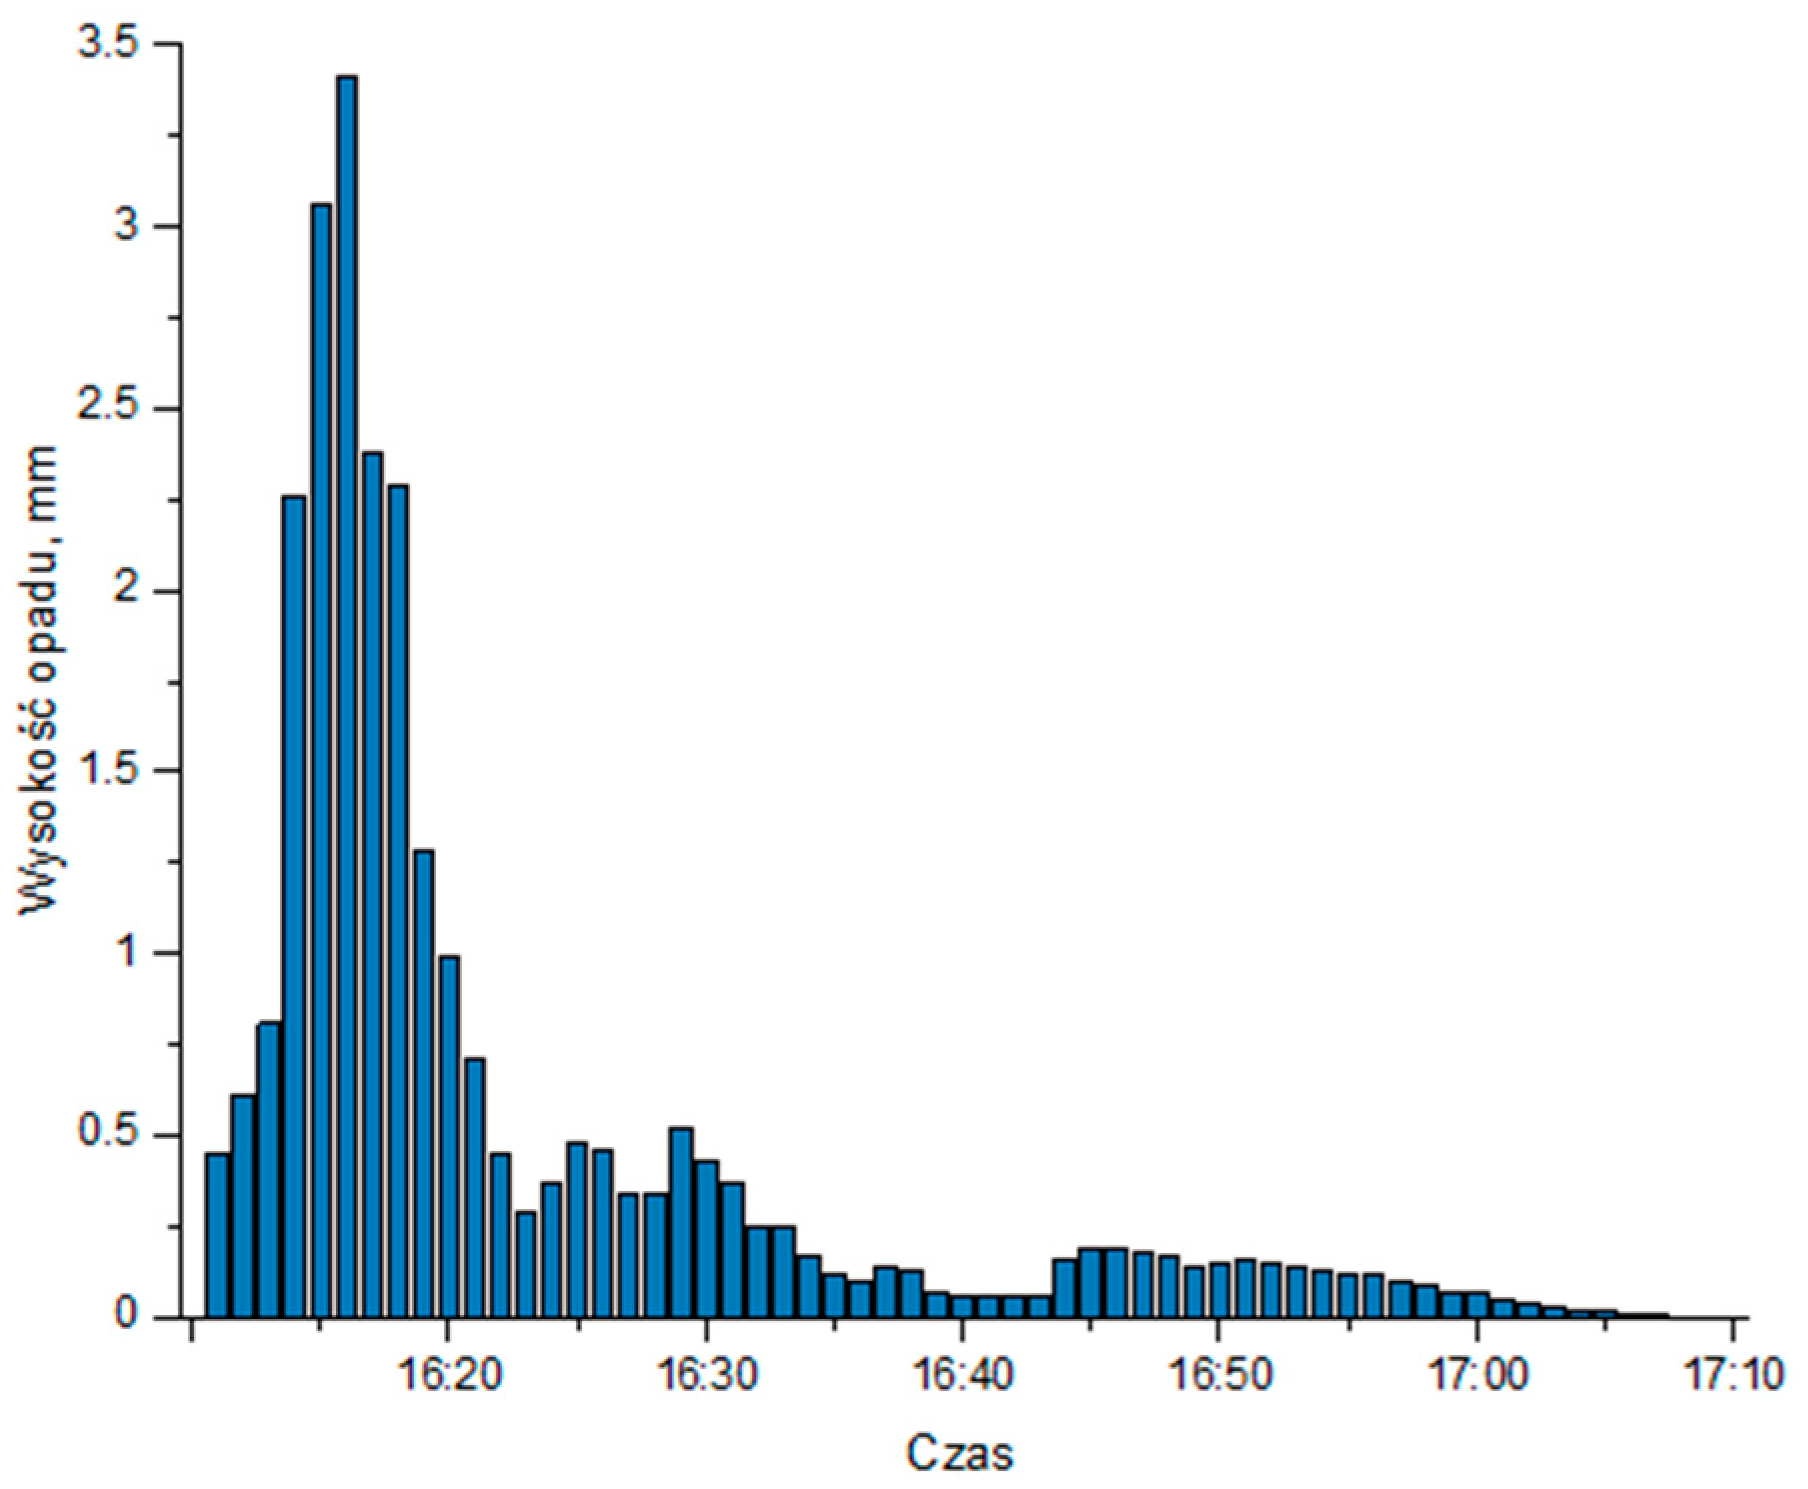
2.2. Precipitation Characteristics

Rainfall in the SEZ was determined based on the PMAXTP maximum rainfall atlas [28], available at the website of the Institute of Meteorology and Water Management—National Research Institute (IMGW-PIB) at https://klimat.imgw.pl/opady-maksymalne/ (accessed on 31 January 2025). The website provides, free of charge, reliable, up-to-date information concerning the amount of rainfall of a specific duration and probability of occurrence for any selected locations in Poland. High-quality data concerning precipitation, verified for individual measuring stations of the IMGW-PIB network, evenly distributed across Poland, is interpolated in the PMAXTP atlas for local meteorological conditions.
Rainfall levels (h in mm), downloaded from the PMAXTP atlas, for the Zone locations for selected durations (from 5 to 4320 min) and frequencies of occurrence (from C = 1 to C = 50 years—as in Table 1) are summarised in Table 2.

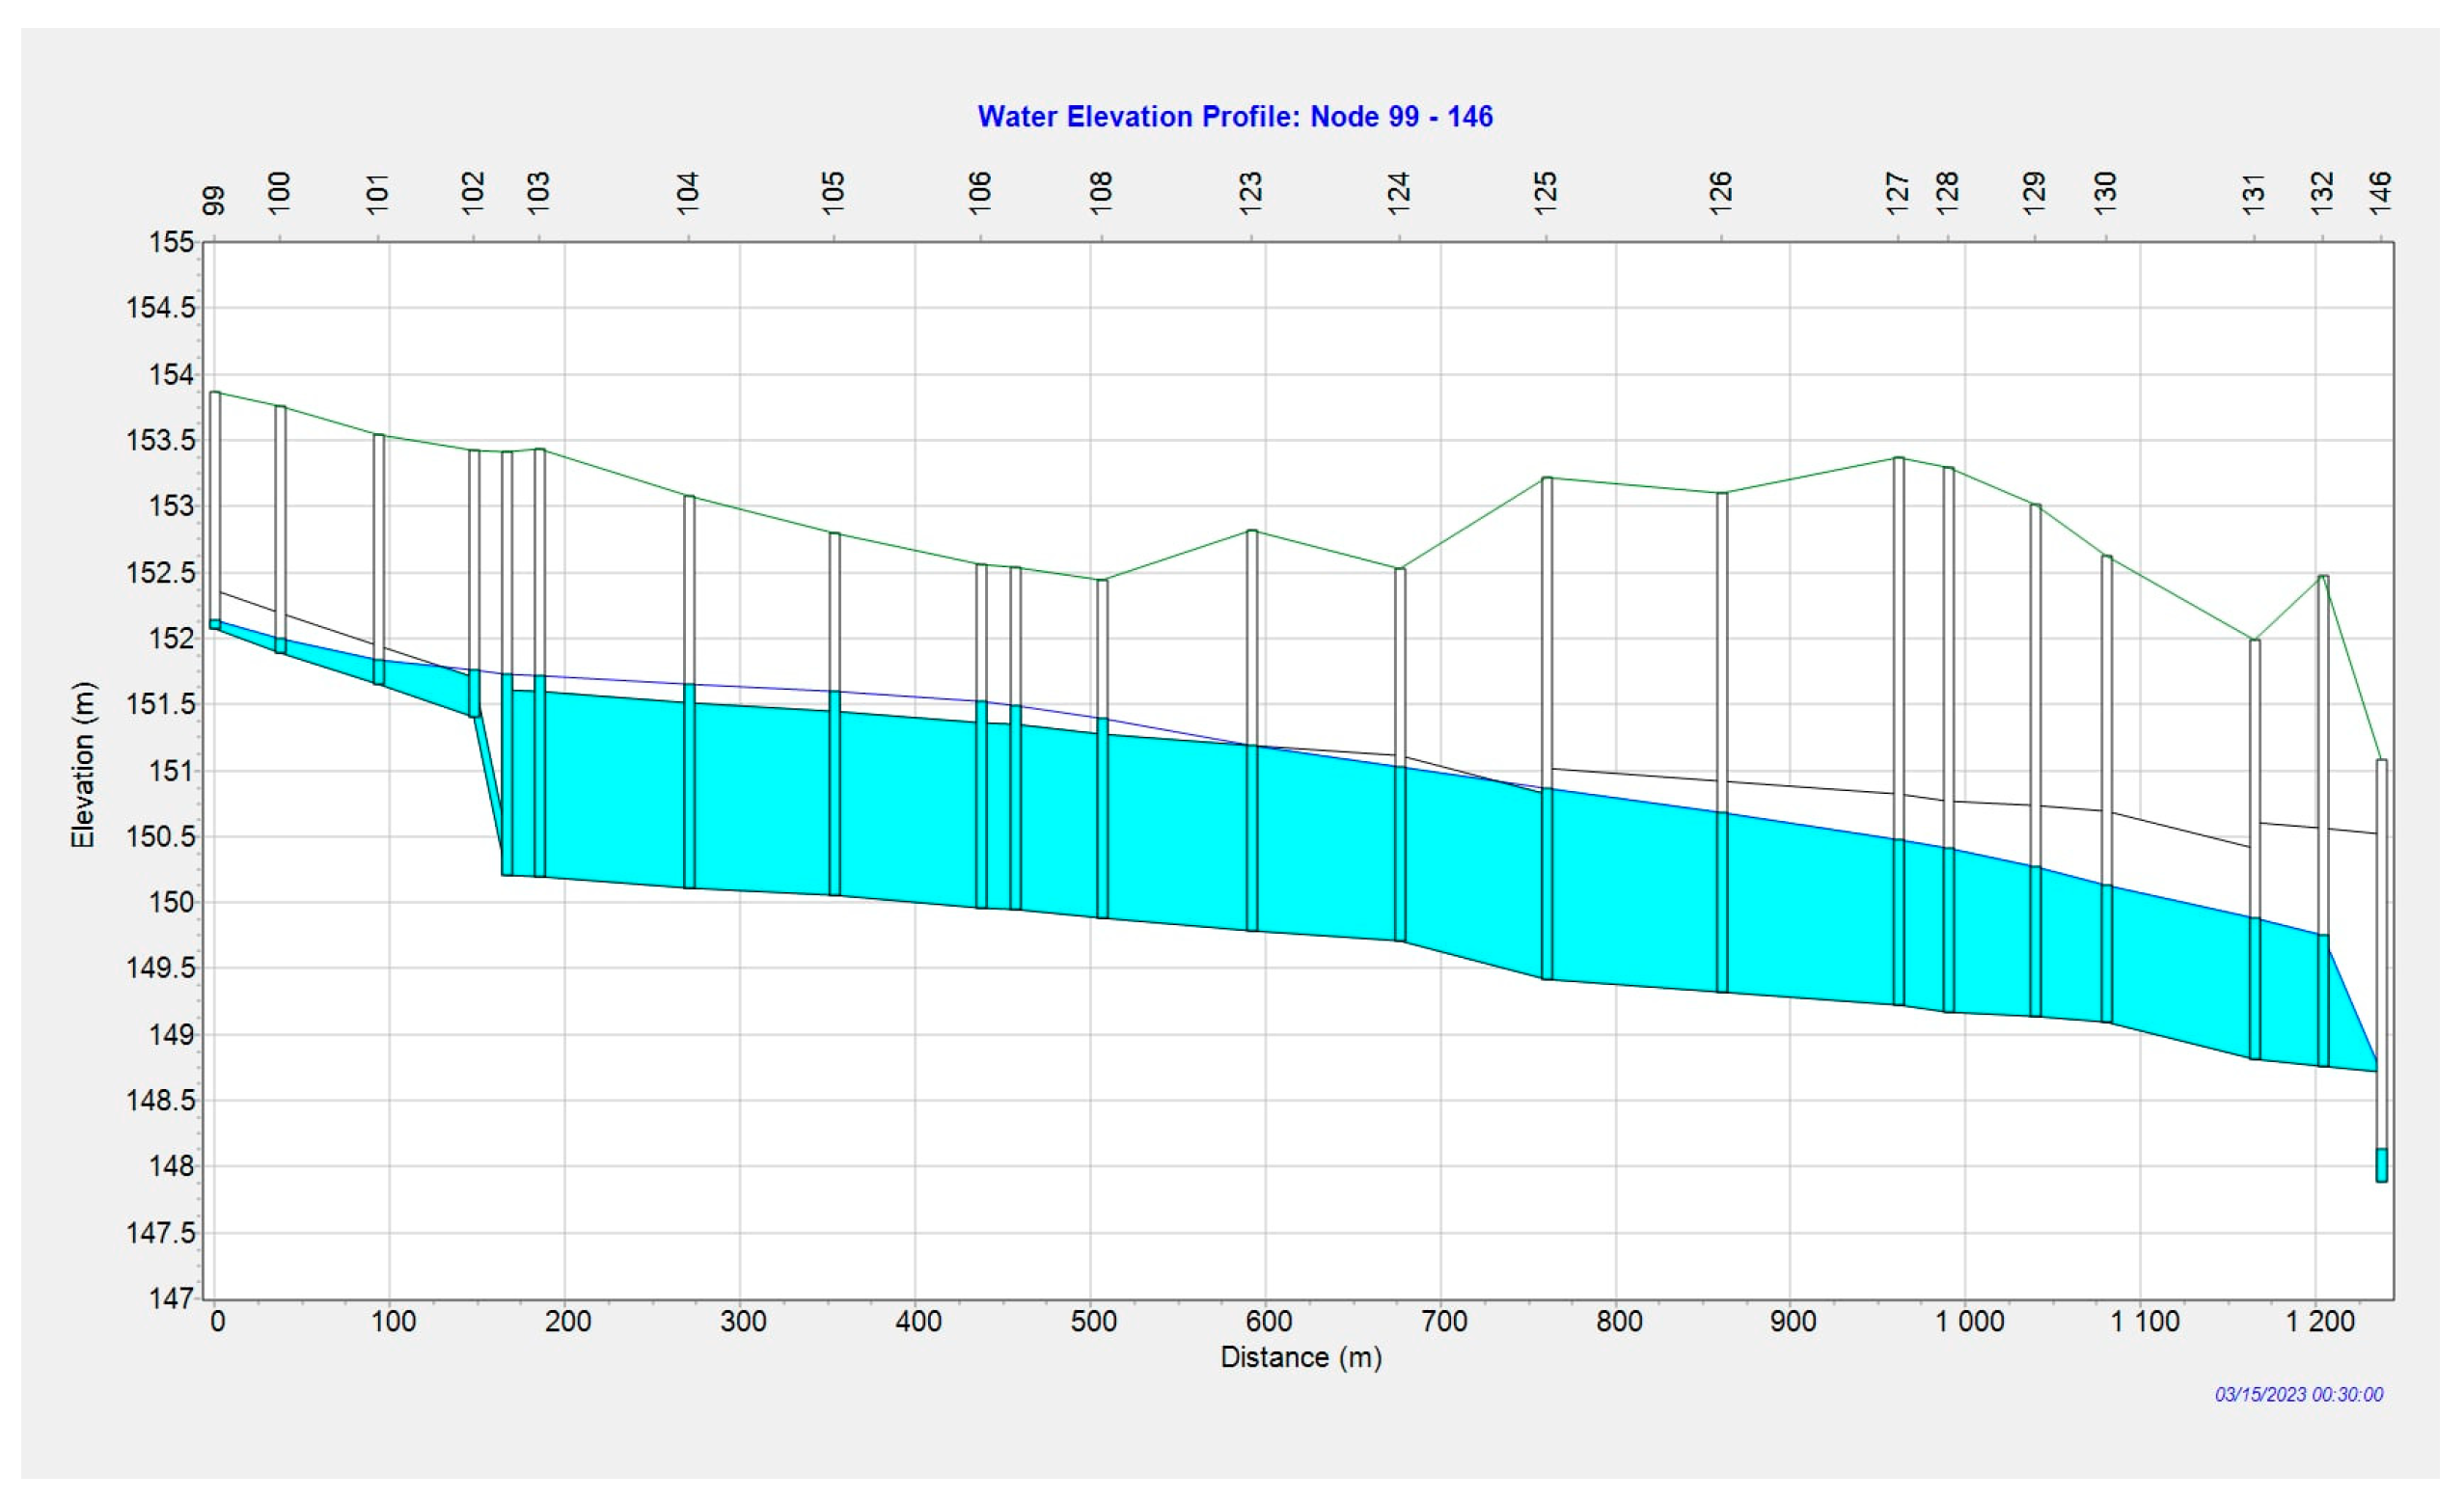
2.3. Hydrodynamic Modelling of Stormwater Drainage System

In order to develop a hydrodynamic model of the stormwater drainage network in the SEZ, maps, collector profiles, a list of plots or declarations of entrepreneurs concerning the surface hardening of individual sub-catchments were used. The National Spatial Information Infrastructure web platform geoportal.gov was also used.
Based on the available project documentation, the geometry of the existing stormwater drainage system was mapped in the SWMM (Storm Water Management Model). SWMM is a dynamic rainfall-runoff simulation model developed by the U.S. Environmental Protection Agency (EPA) to analyse stormwater runoff, as well as the performance of stormwater management systems. SWMM conducts both hydrologic and hydraulic simulations for flow calculations [29]. The model divides the catchment area into subcatchments and calculates runoff based on rainfall input. Once the runoff is generated, the flow is routed through the drainage network (pipes, channels, or storage facilities). Hydraulic calculations within SWMM use the Saint–Venant equations and solve them numerically to model water flow through the system [30].
In the case of modelling flows in conditions of rapid filling or emptying of the system, one should be aware that the results may be burdened with a certain error. The combination of two-phase (air-water) and transient flows, in addition to the change in the flow regime from free surface to pressurised flow, poses challenges in the hydraulic analysis of the junction system. Although research on this topic is still limited, recent studies (e.g., [31,32]) suggest that SWMM, when configured correctly, can effectively describe more dynamic flow conditions, such as rapid inflow scenarios.
The entire catchment of the SEZ area was divided into 144 sub-catchments. Each sub-catchment was divided into paved (roofs, streets, car parks, pavements) and unpaved (lawns) areas. Parameters characterising the sub-catchments, e.g., catchment areas and widths, slope, percentage of sealed surfaces, or Horton’s infiltration model, were entered into the SWMM.
To simulate the system’s operation, rainfall scenarios had to be prepared. Model rainfall and actual precipitation from 8 June 2022 were used for this purpose. The idea behind the model rainfall is to render the course of a typical rainfall of varying intensity over time in a way that is close to reality. In the case of Euler type II model rainfall (the most commonly used in practice), the time instant of the onset of the highest intensity rainfall is determined after 1/3 of the duration of the design rainfall and rounded up to 5 min. This interval is complemented to the left on the time axis by further intervals with lower rainfall intensities, until the time instant t = 0 is reached. Subsequent rainfall intervals occur on the time axis to the right of the peak interval and fill the period until the end of the rainfall duration.
The currently recommended frequency of design rainfall for dimensioning stormwater drainage in an industrial area is 1 time in 5 years [3], the model rainfall was therefore prepared for rainfall with a frequency of C = 5 years and a duration of t = 60 min. Due to the fact that the stormwater drainage system was designed (in 2006) on the basis of rainfall intensities obtained from Błaszczyk’s model (there was no PMAXTP atlas yet, which was produced in 2022), one of the model rainfalls was developed using this rainfall model (Scenario I) [33]. At this point it should be noted that based on measurements at the meteorological station of the IMGW-PIB in Wrocław from the period 1960–2009, it has been shown that Błaszczyk’s formula underestimates the level of currently observed rainfall by an order of 40% [34]. The second of the model rainfall (Scenario II), was developed on the basis of data from the PMAXTP atlas (Table 2). The rainfall intensity curves for C = 5 years for Błaszczyk’s model and the PMAXTP atlas are shown in Figure 2, while Figure 3 shows the hyetographs of model rainfall.
The maximum rainfall intensity occurs between the 15th and 20th minutes of its duration and is 95.30 mm/h for the rainfall developed from Błaszczyk’s model, while it is 146.18 mm/h for the rainfall developed from the PMAXTP data.
A rain gauge has been installed in the Zone area. On 8 September 2022, it recorded precipitation that caused localised flooding and traffic difficulties. At that time, the daily precipitation was 29.81 mm, with the highest amount of 26.28 mm falling from 16:11 to 17:07 (Figure 4).
The maximum precipitation interval levels were related to the maximum precipitation data from Table 2 and their incidence was determined. The precipitation recorded in the Zone on 8 September 2022 should be considered to occur statistically less frequently than once in 10 years (10 < C < 30 years). This precipitation was also used for the simulation (Scenario III).

3. Results

3.1. Simulations for Scenario I

Simulation results concerning the performance of a drainage system loaded with Euler type II model rainfall developed from rainfall intensities obtained according to Błaszczyk’s formula (Figure 3) are presented in the form of K-1 (Figure 5) and K-2 (Figure 6) collector profiles including fills in the 30th minute of rainfall duration (maximum fills).
It is possible to observe the pressurised flow of rainwater on many sections of the drainage. The worst situation occurs in the vicinity of the field basin at the beginning of the K-2 collector (Figure 6). The congestion is caused by the small diameters of the sewers in this Section (0.3 and 0.4 m) and the presence of a hydraulic trap (constructed to resolve collisions with other underground infrastructure). Despite the congestions, there are no sewer overflows.
The maximum inflow rate to reservoir ZR-1 was 3.50 m3/s. An analysis of the course of water accumulation in reservoir ZR-1 showed that it accumulated a maximum of 5341 m3 of rainwater. In the case of reservoir ZR-2, the maximum inflow rate was 3.57 m3/s. The maximum volume of rainwater stored in the ZR-2 reservoir was 9038 m3.

3.2. Simulations for Scenario II

Simulation results for the operation of a stormwater drainage system loaded with Euler type II model rainfall developed based on rainfall intensities obtained from the IMGW-PIB atlas (Figure 3) are presented in the form of K-1 (Figure 7) and K-2 (Figure 8) collector profiles including fillings in the 30th minute of the rainfall.
In the presented collector profiles, pressurised rainwater flow can be observed in almost all sections of the system. Similarly, as in the case of simulations for model rainfall according to Błaszczyk’s formula, the worst situation is in the vicinity of the field basin at the initial section of the K-2 collector (Figure 8). Spillages can be observed in terms of both profiles (the pressure line reaches ground level). The total volume of simulated flooding is 1275 m3.
The maximum inflow rate to reservoir ZR-1 was 5.36 m3/s. An analysis of the course of water accumulation in reservoir ZR-1 showed that it accumulated a maximum of 7034 m3 of rainwater. In the case of reservoir ZR-2, the maximum inflow rate was 5.15 m3/s. The maximum volume of rainwater stored in the ZR-2 reservoir was 12,036 m3.

3.3. Simulations for Scenario III

The rainwater catchment was also charged with the actual precipitation on 8 September 2022 (Figure 4). The profile of collectors K-1 and K-2, together with the fills at 15 min of rainfall duration (highest fills), is shown in Figure 9 and Figure 10. In the presented collector profiles, pressurised rainwater flow can be observed in almost all sections of the system. As in the case of previous simulations, the worst situation is in the vicinity of the field basin at the beginning of the K-2 collector (Figure 10). Spillages can be observed in both profiles (the pressure line reaches ground level). The total volume of simulated flooding is 3032 m3.
The maximum inflow rate to reservoir ZR-1 was 5.48 m3/s. An analysis of the course of water accumulation in reservoir ZR-1 showed that it accumulated a maximum of 7800 m3 of rainwater (total design volume of the reservoir). Excess incoming water (total of 807 m3) was discharged via an emergency overflow (maximum 1.28 m3/s). For reservoir ZR-2, the maximum inflow rate was 5.54 m3/s. The maximum volume of rainwater collected in the ZR-2 reservoir was 13,067 m3.

4. Discussion

Simulations were carried out in three variants: for model rainfall based on Błaszczyk’s formula, used in the past (Scenario I); for model rainfall according to the PMAXTP atlas (Scenario II); and for actual rainfall recorded in the Zone (Scenario III). The simulation results are summarised in Table 3.
When comparing the simulation results across different scenarios, it is possible to notice that there is a significant increase in precipitation—specifically, a 33.0% rise in Scenario II (model rainfall based on PMAXTP) compared to Scenario I (model rainfall based on the now outdated Błaszczyk’s model). The precipitation amount calculated from the PMAXTP closely aligns with the actual precipitation (Scenario III), indicating a good reflection of the current precipitation patterns in the study area. The significant differences in rainfall levels emphasise the necessity of updating the intensity–duration–frequency (IDF) curves to account for the changes in precipitation characteristics resulting from climate change [26,35]. Various methods for adapting IDF curves to a changing climate can be found in the literature [36]. The simplest solution is to consider a constant percentage increase across all extreme rainfall [37]. Other approaches include using an adaptive percentage increase based on various factors such as local temperature and precipitation frequency. Additionally, a correction factor for current rainfall intensity could be employed, which would depend on the projected temperature increase and a precipitation scaling factor based on the Clausius–Clapeyron relationship [36].
The Canadian Standard Association [38] recommends assuming a 7% increase in precipitation intensity for every degree Celsius rise in temperature. This aligns with the IPCC report, which states that “the atmosphere’s capacity to hold water increases by about 7% for every 1 °C increase in temperature” [39]. However, some studies, including [26], challenge this value as a global indicator of climate change. They note that precipitation events occurring less frequently (with higher C) record larger increases in intensity. Moreover, changes in precipitation intensity may also be affected by the duration of the events—short-term convective precipitation with higher frequency are likely to experience the most significant increases in intensity in warmer climates [36,40].
These observations are supported by existing literature. The paper [41] attempts to predict future maximum precipitation, authoritative for dimensioning of drainage systems, based on precipitation observations recorded in Wrocław between 1960 and 2018. As a result of the analyses, a predictive model was developed for the maximum precipitation, depending on its duration (from t = 5 to t = 4320 min), the probability of exceedance (from p = 0.02 to p = 1), and the year for which the rainfall is counted (from r = 1989 to r = 2050). The analysis of the results led to several important conclusions. Regardless of the precipitation frequency, an increase in short-term precipitation was observed. The increase affected precipitation with durations of up to approx. t = 120 min for C = 1 year; t = 60 min for C = 2 years; t = 30 min for C = 3 years; t = 15 min for C = 5 years; and t = 10 min for C = 10, 30, and 50 years. The largest increases were observed for very short precipitation durations of t = 5, 10, and 15 min, at 6–10% and 3–15%, 2–15%, and 3–15% for C = 1, 2, 3, and 5 years, respectively. For C = 10, 30, and 50 years, the largest increases in rainfall were up to 15% and were observed for rainfall with t = 5 min. In contrast, for precipitation with longer durations, decreases in levels were recorded, especially for durations exceeding t = 1080 min, and amounting to 3–6%, 5–8%, 7–9%, 8–10%, and 9–13% for C = 1, 2, 3, 5, and 10, 30, and 50 years, respectively. In summary, a further increase in short-duration precipitation and a decrease in longer-duration precipitation is forecast.
A recent study [42] compares the current IDF curves for the city of Dodola in Ethiopia with the those projected for the years 2020–2100. The comparison indicates relative changes in future versus historical precipitation intensities of 1.5–30.6%, 2.48–42.6%, and 3.7–23.24% for the years 2020–2040, 2041–2070, and 2071–2100, respectively. A similar study focused on another town in Ethiopia (Mekelle) found out an expected increase in precipitation intensity of up to 65.95% at shorter frequencies and a decrease up to maximum range of 78.61% for longer frequencies [43]. Additionally, a trend analysis was conducted in Estonia to assess changes in short-duration (20–180 min) precipitation intensity, which is critical for designing sewage systems [44]. Based on a 70-year observation period (1950–2021), the average trend of approximately 4% increase in annual maximum intensities per decade was determined, regardless of the precipitation duration analysed.
Additional research findings regarding comparative analyses of current and projected IDF curves can be found in the review paper by Fowler et al. [45]. For each study, the spatial scale, the dominant direction of change, and the methodology used are indicated. It has been noted that trends in short-term precipitation changes can be up to twice as strong as what would be expected from increases in atmospheric humidity alone.
In recent years, finer-resolution climate model simulations have provided more reliable predictions of shorter-than-daily precipitation. This advancement is crucial for developing IDF curves, as it now allows for predictions regarding both the general direction of changes in rainfall intensity and the more precise intensity of change—for specific precipitation occurrence frequencies and durations [40].
Using higher intensity rainfall for hydrodynamic modelling translates significantly into the operating conditions of the analysed sewerage system (Table 3). The increased pressure on the stormwater drainage system is evident, particularly in the volume of spills from the system, which were not recorded in the simulation results for the model rainfall based on Błaszczyk’s formula. In Scenario II, spillages with a total volume of 1275 m3 were observed. This indicates that the sewerage system is unable to take on the rainfall loads of current precipitation patterns, intensified by climate change. Furthermore, the model rainfall according to the now outdated Błaszczyk’s formula is not a criterion for testing the performance of the sewerage system. A clear difference is also evident concerning the maximum inflow of rainwater to the retention basins. For reservoir ZR-1, this inflow in Scenario I was 3.50 m3/s, while in Scenario II, it increased to 5.36 m3/s (marking a 53.1% increase). Consequently, the volumes of rainwater collected in reservoir ZR-1 were 5341 m3 and 7043 m3 for Scenarios I and II, respectively, representing a 31.5% increase. Similar performance changes were observed for reservoir ZR-2. Inflow to the reservoir increased by 44.5% (from 3.57 m3/s to 5.36 m3/s). The volume of water stored in ZR-1 also saw a significant rise, increasing by approximately 33% (from 9038 m3/s to 12,036 m3/s). Throughout both Scenario I and II simulations, there were no emergency discharges from the reservoirs.
Simulation results using actual rainfall (Scenario III), having similar parameters to the model rainfall using the PMAXTP atlas, confirm the observations of system performance described above. In this scenario, the slightly increased rainfall amount leads to a higher volume of system spills and an emergency discharge from Reservoir ZR-1. The remaining parameters are quantitatively comparable to the results obtained in Scenario II.
The conclusions drawn from analysing the operation of the stormwater drainage system in the SEZ align with the findings from other studies concerning the impact of increased rainfall intensity on the operation of the sewerage system. The paper [46] simulated the performance of a stormwater drainage system in an urbanised area in Iraq, with a sealing rate of 66% (similar to the sealing rate for the analysed SEZ area: approx. 70%). The sewerage system was originally designed for a precipitation frequency of C = 2 years and a duration of t = 60 min, corresponding to an intensity of 9.6 mm/h. However, in recent years, precipitation events with intensities significantly exceeding the design parameters (up to 3 times) have been observed. Hydrodynamic simulations of the network’s performance, using actual hourly precipitation data from the catchment area, revealed that 47% of manholes experienced flooding. The analysed sewerage system has proven to be incapable of handling the increased rainwater flows resulting from climate change. A similar study concerning a different area in Iraq [47], included an industrial catchment for which the proportion of sealed surfaces was also 66%. Within this area, an increase in the intensity of short-term precipitation has been recorded. Hydrodynamic simulations were carried out for precipitation events with frequencies of C = 2, 5, 10, and 25 years, also taking into account potential changes in land use (increased sealing). Changes in precipitation patterns due to climate change have had a greater negative impact than changes in land use. It was estimated that the sewerage system would only be able to work properly for the next 10 years.
Another study investigated the potential impacts of climate change on drainage infrastructure in Wuhan (China) [48]. The study focused on an area of 3.44 km2 with approx. 83% of impervious areas. It was found that the probability distribution of extreme rainfall for two historical periods (1961–1985 and 1986–2005) has changed and the design rainfall with return periods of 2, 3, 4, and 5 years increases more significantly than those of 10 and 20 years. As a result, the incapability of the current drainage infrastructure in the study area was aggravated, observed by overall increases in design peak flow and total runoff from the catchment. It was assumed that the existing drainage infrastructure will barely manage the future 2-year design rainfall event and that modernization actions should be carried out to avoid flooding.
Studies conducted in Chennai (coastal city in India) [49] examined the performance of the existing stormwater drains under both current and future climate scenarios. The daily rainfall data for the period 1975–2015 was used to generate IDF curves for 2-, 5-, 10-, 50-, and 100-year return periods under current and future climate scenarios. Comparison between observed and projected IDF curves showed an increase of 12% in rainfall intensity for the 2-year and 87% increase for the 100-year return period. The number of nodes flooded increased with the rainfall return period, from 23 nodes for a 2-year period up to 50 nodes for the 100-year return period. Some nodes were identified as flooding for all return periods under observed and projected climate scenarios. The results indicated that the existing stormwater drainage system cannot withstand even a 2-year return period rainfall.
Despite the extensive literature on assessing the impact of climate change on the performance of sewerage systems and the risk of flooding in urban areas [50], there has been limited research focusing specifically on industrial zones. To ensure the safe and reliable operation of production facilities in these areas, it is essential to provide a properly functioning stormwater sewerage system capable of handling the increased rainwater flows intensified by climate change and progressive surface sealing [51]. Many researchers suggest that the increase in precipitation intensity criteria for sewer design can range from 20% to as much as 80%, depending on the specific location being drained [16,52,53]. This poses a significant challenge for existing drainage systems in urbanised areas, designed based on precipitation characteristics that are no longer valid. These systems are experiencing increasing performance problems, taking on increased rainwater flows. To maintain an acceptable incidence of flooding and overloading of the system, it is sometimes necessary to upgrade the drainage infrastructure, including constructing storage reservoirs or increasing the capacity of existing ones [54].
It is important to consider that the costs and time required for retrofitting are significant. As a result, this may lead to the need to phase the upgrade work, potentially limiting the system’s flexibility to adapt to critical circumstances [54,55]. In light of climate change and increasing sealing of industrial sites, the expansion of conventional stormwater drainage or the construction of retention tanks may not align with sustainability criteria [56,57].
The development of industrial zones has significantly affected how rainwater is managed, forcing planners to look for alternative methods of managing it. Intense, rapid urbanisation and the associated reduction in permeable surfaces, such as green spaces, results in increased surface runoff, which has numerous negative effects on the environment and the hydrological cycle [58]. One of the solutions being introduced to manage rainwater is blue–green infrastructure (BGI), and its integration with industrial sectors is combined in the well-known Eco-Industrial Park (EIP) concepts [58,59]. Although not every solution is universally applicable or practical in every industrial area, BGI should be tailored to fit local conditions. This adaptation must consider the characteristics of the environment, along with the available technological and natural resources [58]. Some of the best known examples are the Kalundborg EIP in Denmark [60], Fourth Valley (UK), Kawasaki (Japan), Rotterdam (The Netherlands), Map Ta Phut (Thailand), North Texas (USA) [58], or several locations in Australia—the ’steel river’ project in Newcastle, New South Wales or the applications of GI practises in heavy industrial areas: Kiwinana (Western Australia), Gladstone (Queensland), and Geelong (Victoria) [61].
The effectiveness of BGI in reducing the volume of runoff and the risk of flash floods is confirmed by studies reported in the literature, including [62,63,64,65,66,67]. Many industrial areas across the world are currently looking at the applications of green infrastructure to reduce the impacts of excessive runoff and mitigate flash floods. Therefore, there is a strong need for introducing a systematic methodology for the optimum applications of BGI practises for industrial areas to manage stormwater [58].
Apart from reducing the volume of surface runoff, BGI can also have a positive impact on rainwater quality. Conventional stormwater drainage systems in industrial areas have been set up to discharge rainwater, often without taking into account the need to remove pollutants from the water before discharging it into a receiving water body. Pollutants in industrial rainwater destroy natural aquatic environments through the presence of suspended solids, heavy metals, polycyclic aromatic hydrocarbons, or benzotriazoles [68,69]. The problem of polluting rainwater with heavy metals in industrial areas is usually more serious than in areas with other types of use [70]. BGI supports rainwater treatment processes. This is evidenced by the results of studies concerning the efficiency of pollutant removal using Low Impact Development (LID) [71]. Combining nature-based solutions with existing conventional sewerage systems can counteract the pollution of receiving waters.

5. Conclusions

Changes in the nature of precipitation, intensified by climate change, as well as increasing urbanisation are leading to increasing problems in the operation of drainage systems in urbanised areas. Industrial areas are particularly vulnerable to stormwater drainage congestion, whose dynamic expansion leads to increased sealing and consequently to the discharge of increased rainwater flows. A verification of the stormwater drainage system operation in the Special Economic Zone area, taking into account changes in precipitation characteristics, confirmed the negative impact of climate change on system performance. Increasingly frequent intensive precipitation in the SEZ area, which exceeds the design rainfall frequency, will lead to overloading and malfunctioning of the stormwater drainage system, which is unsuited to receiving such significant rainwater flows. This is evidenced by the results of simulated system operation with the actual precipitation load for the catchment on 8.09.2022.
The variant simulations conducted for the operation of the stormwater drainage system in the SEZ area allow the following conclusions to be drawn:
  • The least overloading of the stormwater drainage system was recorded when the catchment was loaded with the model rainfall developed from Błaszczyk’s formula. This is the model on which the sewerage system is designed and there should be no sewer malfunctions for it. However, changes in the catchment characteristics (increased sealing) relative to the design conditions have led to increased inflow of rainwater into the system, which translates into problems in stormwater drainage.
  • Using up-to-date maximum precipitation data in the hydrodynamic model (model rainfall developed from the PMAXTP) translates into achieving higher system overloads and demonstrating system malfunctions (presence of flooding). These changes are evident in the increased inflow of rainwater to the reservoirs—an increase of 53.1% and 44.5% for reservoir ZR-1 and ZR-2, respectively.
  • The drainage system shows insufficient hydraulic capacity, causing localised rainwater overflow to ground level. To reduce the number and volume of node flooding, it is necessary to adapt the system to accommodate the increased rainwater flows resulting from climate change and the progressive development of the SEZ. It is recommended to implement additional rainwater retention facilities (reservoirs). Additionally, it would be beneficial to consider the introduction of blue–green infrastructure or rainwater harvesting systems for the Zone’s own use. These solutions could support the area in adapting to climate change.
The research conducted confirms the need for research into verifying the operation of sewerage systems in industrial areas in the face of climate change. A critical analysis of design assumptions for land drainage systems is also needed, particularly in the context of updating IDF rainfall curves. Papers in this area will be of particular value to designers and operators of stormwater drainage systems.

Author Contributions

Conceptualization, K.W., S.S., W.D. and B.K.; methodology, K.W., W.D., M.W. and K.P.; formal analysis, K.W., M.W. and A.K.; investigation, K.W., S.S., W.D. and K.P.; data curation, S.S. and K.P.; writing—original draft preparation, K.W., S.S., W.D., K.P. and A.K.; writing—review and editing, K.W., M.W., S.S. and B.K.; visualisation, W.D. and M.W.; supervision, A.K. and B.K. All authors have read and agreed to the published version of the manuscript.

Funding

This research received no external funding.

Institutional Review Board Statement

Not applicable.

Informed Consent Statement

Not applicable.

Data Availability Statement

The data are not publicly available due to privacy.

Acknowledgments

This work was supported by the Industrial Development Agency JSC.

Conflicts of Interest

The authors declare no conflicts of interest.

Abbreviations

The following abbreviations are used in this manuscript:
BGIBlue–Green Infrastructure
EIPEco-Industrial Park
IDFIntensity–Duration–Frequency
LIDLow Impact Development
SEZSpecial Economic Zone
SWMMStorm Water Management Model

References

  1. Szalińska, W.; Otop, I. Evaluation of spatio-temporal rainfall patterns with selected indicators for extreme event identification. Woda Sr. Obsz. Wiej. 2012, 12, 269–282. [Google Scholar]
  2. Wartalska, K.; Kotowski, A. Model hyetographs of short-term rainfall for Wroclaw in the perspective of 2050. Atmosphere 2020, 11, 663. [Google Scholar] [CrossRef]
  3. PN-EN 752: 2017; Drain and Sewer Systems Outside Buildings—Sewer System Management. PKN: Warsaw, Poland, 2017.
  4. Kaźmierczak, B.; Kotowski, A. Weryfikacja Przepustowości Kanalizacji Deszczowej w Modelowaniu Hydrodynamicznym; Oficyna Wydawnicza Politechniki Wrocławskiej: Wrocław, Poland, 2012. [Google Scholar]
  5. Nowakowska, M.; Kotowski, A. Metodyka i Zasady Modelowania Odwodnień Terenów Zurbanizowanych; Oficyna Wydawnicza Politechniki Wrocławskiej: Wrocław, Poland, 2017. [Google Scholar]
  6. Kotowski, A. Podstawy Bezpiecznego Wymiarowania Odwodnień Terenów. Sieci Kanalizacyjne (t. I); Obiekty Specjalne (t. II); Wydawnictwo Seidel–Przywecki: Warsaw, Poland, 2015. [Google Scholar]
  7. Hermida, L.; Sánchez, J.L.; López, L.; Berthet, C.; Dessens, J.; García-Ortega, E.; Merino, A. Climatic trends in hail precipitation in France: Spatial, altitudinal, and temporal variability. Sci. World J. 2013, 2013, 494971. [Google Scholar] [CrossRef]
  8. Kundzewicz, Z.W.; Kanae, S.; Seneviratne, S.I.; Handmer, J.; Nicholls, N.; Peduzzi, P.; Mechler, R.; Bouwer, L.M.; Arnell, N.; Mach, K.; et al. Flood risk and climate change: Global and regional perspectives. Hydrolog. Sci. J. 2012, 59, 1–28. [Google Scholar] [CrossRef]
  9. Schiermeier, Q. Increased flood risk linked to global warming. Nature 2011, 470, 7334. [Google Scholar] [CrossRef]
  10. Siekmann, M.; Pinnekamp, J. Indicator based strategy to adapt urban drainage systems in regard to the consequences caused by climate change. In Proceedings of the 12th International Conference on Urban Drainage, Porto Alegre, Brazil, 11–16 September 2011. [Google Scholar]
  11. Ahmed, S.; Tsanis, I. Climate Change Impact on Design Storm and Performance of Urban Storm-Water Management System—A Case Study on West Central Mountain Drainage Area in Canada. J. Waste Water Treat. Anal. 2015, 7, 229. [Google Scholar] [CrossRef]
  12. Dąbrowski, W.; Dąbrowska, B. The likely impact of climate change on sewerage systems dysfunction. Gas Water Sanit. Eng. 2012, 1, 17–20. [Google Scholar]
  13. Saboia, M.A.M.; Souza Filho, F.A.; Araujo Junior, L.M.; Silveira, C.S. Climate changes impact estimation on urban drainage system located in low latitudes districts: A study case in Fortaleza-CE. Braz. J. Water Resour. 2017, 22, 1–15. [Google Scholar] [CrossRef]
  14. Bezak, N.; Šraj, M.; Mikoš, M. Copula-based IDF curves and empirical rainfall thresholds for flash floods and rainfall-induced landslides. J. Hydrol. 2016, 541, 272–284. [Google Scholar] [CrossRef]
  15. Rak, J.R.; Wartalska, K.; Kaźmierczak, B. Weather risk assessment for collective water supply and sewerage systems. Water 2021, 13, 1970. [Google Scholar] [CrossRef]
  16. Arnbjerg-Nielsen, K. Quantification of climate change effects on extreme precipitation used for high resolution hydrologic design. Urban Water J. 2012, 9, 57–65. [Google Scholar] [CrossRef]
  17. Zhou, Q. Urban Drainage Design and Climate Change Adaptation Decision Making. Ph.D. Thesis, Technical University of Denmark, Kongens Lyngby, Denmark, 2012. [Google Scholar]
  18. Arnbjerg-Nielsen, K.; Willems, P.; Olsson, J.; Beecham, S.; Pathirana, A.; Gregersen, I.B.; Madsen, H.; Nguyen, V.-T.-V. Impacts of climate change on rainfall extremes and urban drainage systems: A review. Water Sci. Technol. 2013, 68, 16–28. [Google Scholar] [CrossRef] [PubMed]
  19. Semadeni-Davies, A.; Hernebring, C.; Svensson, G.; Gustafsson, L.G. The impacts of climate change and urbanisation on drainage in Helsingborg, Sweden: Combined sewer system. J. Hydrol. 2008, 350, 100–113. [Google Scholar] [CrossRef]
  20. Yazdanfar, Z.; Sharma, A. Urban drainage system planning and design—Challenges with climate change and urbanization: A review. Water Sci. Technol. 2015, 72, 165–179. [Google Scholar] [CrossRef] [PubMed]
  21. Egger, C.; Honti, M.; Maurer, M. Impact of climate change on urban drainage system performance. In Proceedings of the 9th International Workshop on Precipitation in Urban Areas: Urban Challenges in Rainfall Analysis, St. Mortiz, Switzerland, 6–9 December 2012. [Google Scholar]
  22. Fratini, C.F.; Geldof, G.D.; Kluck, J.; Mikkelsen, P.S. Three Points Approach (3PA) for urban flood risk management: A tool to support climate change adaptation through transdisciplinarity and multifunctionality. Urban Water J. 2012, 9, 317–331. [Google Scholar] [CrossRef]
  23. Kaźmierczak, B.; Wdowikowski, M.; Nowakowska, M. Rainwater retention on the heavily industrialized areas. Ecol. Eng. Environ. Technol. 2016, 48, 107–112. [Google Scholar] [CrossRef]
  24. Kirshen, P.; Caputo, L.; Vogel, R.M.; Mathisen, P.; Rosner, A.; Renaud, T. Adapting Urban Infrastructure to Climate Change: A Drainage Case Study. J. Water Resour. Plan. Manag. 2015, 141, 04014064. [Google Scholar] [CrossRef]
  25. Act of 20 October 1994 on Special Economic Zones (Dz. U., Official Journal of 2007, No. 42, Item 274, Consolidated Text and Dz. U. of 2008, No. 118, Item 746, as Amended). Available online: https://www.global-regulation.com/translation/poland/3353674/the-act-of-20-october-1994-on-special-economic-zones.html (accessed on 1 January 2025).
  26. Xu, M.; Bravo de Guenni, L.; Córdova, J.R. Climate change impacts on rainfall intensity–duration–frequency curves in local scale catchments. Environ. Monit. Assess. 2024, 196, 372. [Google Scholar] [CrossRef]
  27. Dziopak, J.; Słyś, D. Modelowanie Zbiorników Retencyjnych Klasycznych i Grawitacyjno-Pompowych w Kanalizacji; Oficyna Wydawnicza Politechniki Rzeszowskiej: Rzeszów, Poland, 2007. [Google Scholar]
  28. Bisaga, W.; Bryła, M.; Kaźmierczak, B.; Kielar, R.; Kitowski, M.; Marosz, M.; Miętek, B.; Ozga-Zieliński, B.; Tokarczyk, T.; Walczykiewicz, T.; et al. Modele Probabilistyczne Opadów Maksymalnych o Określonym Czasie Trwania i Prawdopodobieństwie Przewyższenia—Projekt PMAXTP; Institute of Meteorology and Water Management—National Research Institute: Warsaw, Poland, 2022. [Google Scholar]
  29. Molla, A.; Mitra, C.; Vasconcelos, J. Assessment of and Solutions to the Stormwater Management System of Auburn University Campus in Auburn, Alabama. J. Water Manag. Model. 2022, 30, C488. [Google Scholar] [CrossRef]
  30. Pachaly, R.L.; Vasconcelos, J.G.; Allasia, D.G.; Bocchi, J.P.P. Evaluating SWMM capabilities to simulate closed pipe transients. J. Hydraul. Res. 2022, 60, 74–81. [Google Scholar] [CrossRef]
  31. Ferreira, J.P.; Ferras, D.; Covas, D.I.; Kapelan, Z. Improved SWMM modeling for rapid pipe filling incorporating air behavior in intermittent water supply systems. J. Hydraul. Eng. 2023, 149, 04023004. [Google Scholar] [CrossRef]
  32. Geller, V.G.; Tao, Y.; Lokhandwala, A.; Vasconcelos, J.G.; Wright, D.B.; Hodges, B.R. Evaluating SWMM Modeling Performance for Rapid Flows on Tunnels with Geometric Discontinuities. J. Hydraul. Eng. 2025, 151, 04024052. [Google Scholar] [CrossRef]
  33. Błaszczyk, W. Spływy deszczowe w sieci kanalizacyjnej (Wytyczne do normatywu). Gaz Woda I Tech. Sanit. 1954, 9, 262–271. [Google Scholar]
  34. Kotowski, A.; Kaźmierczak, B.; Dancewicz, A. Modelowanie Opadów do Wymiarowania Kanalizacji; Wydawnictwo Komitetu Inżynierii Lądowej i Wodnej PAN: Warsaw, Poland, 2010. [Google Scholar]
  35. Kourtis, I.M.; Nalbantis, I.; Tsakiris, G.; Psiloglou, B.; Tsihrintzis, V.A. Updating IDF Curves Under Climate Change: Impact on Rainfall-Induced Runoff in Urban Basins. Water Resour. Manag. 2023, 37, 2403–2428. [Google Scholar] [CrossRef]
  36. Martel, J.-L.; Brissette, F.P.; Lucas-Picher, P.; Troin, M.; Arsenault, R. Climate Change and Rainfall Intensity–Duration–Frequency Curves: Overview of Science and Guidelines for Adaptation. J. Hydrol. Eng. 2021, 26, 03121001. [Google Scholar] [CrossRef]
  37. Madsen, H.; Lawrence, D.; Lang, M.; Martinkova, M.; Kjeldsen, T.R. Review of trend analysis and climate change projections of extreme precipitation and floods in Europe. J. Hydrol. 2014, 519, 3634–3650. [Google Scholar] [CrossRef]
  38. CSA. Development, Interpretation, and Use of Rainfall Intensity-Duration-Frequency (IDF) Information: Guideline for Canadian Water Resources Practitioners; Canadian Standards Association: Toronto, ON, Canada, 2019. [Google Scholar]
  39. IPCC. Fourth Assessment Report: Climate Change 2007; The AR4 Synthesis Report; IPCC: Geneva, Switzerland, 2007. [Google Scholar]
  40. Berg, P.; Moseley, C.; Haerter, J.O. Strong increase in convective precipitation in response to higher temperatures. Nat. Geosci. 2013, 6, 181–185. [Google Scholar] [CrossRef]
  41. Kaźmierczak, B. Prognozy Zmian Maksymalnych Wysokości Opadów Deszczowych We Wrocławiu; Oficyna Wydawnicza Politechniki Wrocławskiej: Wrocław, Poland, 2019. [Google Scholar]
  42. Bibi, T.S.; Tekesa, N.W. Impacts of climate change on IDF curves for urban stormwater management systems design: The case of Dodola Town, Ethiopia. Environ. Monit. Assess. 2023, 195, 170. [Google Scholar] [CrossRef]
  43. Gebreigziabher, E.T. Analysis Rainfall Intensity—Under Climate Change for Mekele. Int. J. Tech. Res. Sci. 2020, 5, 1–11. [Google Scholar] [CrossRef]
  44. Tamm, O.; Saaremäe, E.; Rahkema, K.; Jaagus, J.; Tamm, T. The intensification of short-duration rainfall extremes due to climate change—Need for a frequent update of intensity–duration–frequency curves. Clim. Serv. 2023, 30, 100349. [Google Scholar] [CrossRef]
  45. Fowler, H.J.; Lenderink, G.; Prein, A.F.; Westra, S.; Allan, R.P.; Ban, N.; Barbero, R.; Berg, P.; Blenkinsop, S.; Do, H.X.; et al. Anthropogenic intensification of short-duration rainfall extremes. Nat. Rev. Earth Environ. 2021, 2, 107–122. [Google Scholar] [CrossRef]
  46. Hassan, W.H.; Nile, B.K.; Al-Masody, B.A. Climate change effect on storm drainage networks by storm water management model. Environ. Eng. Res. 2017, 22, 393–400. [Google Scholar] [CrossRef]
  47. Hussain, S.N.; Zwain, H.M.; Nile, B.K. Modeling the effects of land-use and climate change on the performance of stormwater sewer system using SWMM simulation: Case study. J. Water Clim. Change 2022, 13, 125–138. [Google Scholar] [CrossRef]
  48. Xiong, L.; Yan, L.; Du, T.; Yan, P.; Li, L.; Xu, W. Impacts of Climate Change on Urban Extreme Rainfall and Drainage Infrastructure Performance: A Case Study in Wuhan City, China. Irrig. Drain. 2019, 68, 152–164. [Google Scholar] [CrossRef]
  49. Andimuthu, R.; Kandasamy, P.; Mudgal, B.V.; Jeganathan, A.; Balu, A.; Sankar, G. Performance of urban storm drainage network under changing climate scenarios: Flood mitigation in Indian coastal city. Sci. Rep. 2019, 9, 7783. [Google Scholar] [CrossRef]
  50. Wu, J.; Wu, X.; Zhang, J. Development trend and frontier of stormwater management (1980–2019): A bibliometric overview based on CiteSpace. Water 2019, 11, 1908. [Google Scholar] [CrossRef]
  51. Wang, Y.; van Roon, M.; Knight-Lenihan, S. Opportunities and challenges in water sensitive industrial development: An Auckland case study, New Zealand. Int. J. Sustain. Dev. World Ecol. 2021, 28, 143–156. [Google Scholar] [CrossRef]
  52. Roozbahani, A.; Behzadi, P.; Massah Bavani, A. Analysis of performance criteria and sustainability index in urban stormwater systems under the impacts of climate change. J. Clean. Prod. 2020, 271, 122727. [Google Scholar] [CrossRef]
  53. Willems, P.; Arnbjerg-Nielsen, K.; Olsson, J.; Nguyen, V.T.V. Climate change impact assessment on urban rainfall extremes and urban drainage: Methods and shortcomings. Atmos. Res. 2012, 103, 106–118. [Google Scholar] [CrossRef]
  54. Zhou, Q. A review of sustainable urban drainage systems considering the climate change and urbanization impacts. Water 2014, 6, 976–992. [Google Scholar] [CrossRef]
  55. Krebs, P.; Larsen, T.A. Guiding the development of urban drainage systems by sustainability criteria. Water Sci. Technol. 1997, 35, 89–99. [Google Scholar] [CrossRef]
  56. Hellström, D.; Jeppsson, U.; Kärrman, E. A framework for systems analysis of sustainable urban water management. Environ. Impact Assess. Rev. 2000, 20, 311–321. [Google Scholar] [CrossRef]
  57. Zhang, F.; Zhang, L.; Wang, Y.; Wang, H. Sexual hormones in a coastal river adjacent to the Bohai Sea: Characteristic pollutants and dominantly influencing factors. Environ. Res. 2022, 212, 113133. [Google Scholar] [CrossRef]
  58. Jayasooriya, V.M.; Ng, A.W.; Muthukumaran, S.; Perera, C.B. Optimization of green infrastructure practices in industrial areas for runoff management: A review on issues, challenges and opportunities. Water 2020, 12, 1024. [Google Scholar] [CrossRef]
  59. Wu, Y.; Gao, X. Can the establishment of eco-industrial parks promote urban green innovation? Evidence from China. J. Clean. Prod. 2022, 341, 130855. [Google Scholar] [CrossRef]
  60. Valenzuela-Venegas, G.; Henríquez-Henríquez, F.; Boix, M.; Montastruc, L.; Arenas-Araya, F.; Miranda-Pérez, J.; Díaz-Alvarado, F.A. A resilience indicator for Eco-Industrial Parks. J. Clean. Prod. 2018, 174, 807–820. [Google Scholar] [CrossRef]
  61. Corder, G.D.; Golev, A.; Fyfe, J.; King, S. The status of industrial ecology in Australia: Barriers and enablers. Resources 2014, 3, 340–361. [Google Scholar] [CrossRef]
  62. Chen, P.Y.; Tung, C.P.; Li, Y.H. Low impact development planning and adaptation decision-making under climate change for a community against pluvial flooding. Water 2017, 9, 756. [Google Scholar] [CrossRef]
  63. Hu, M.; Sayama, T.; Zhang, X.; Tanaka, K.; Takara, K.; Yang, H. Evaluation of low impact development approach for mitigating flood inundation at a watershed scale in China. J. Environ. Manag. 2017, 193, 430–438. [Google Scholar] [CrossRef]
  64. Liu, W.; Chen, W.; Peng, C. Assessing the effectiveness of green infrastructures on urban flooding reduction: A community scale study. Ecol. Modell. 2014, 291, 6–14. [Google Scholar] [CrossRef]
  65. Qin, H.-P.; Li, Z.-X.; Fu, G. The effects of low impact development on urban flooding under different rainfall characteristics. J. Environ. Manag. 2013, 129, 577–585. [Google Scholar] [CrossRef]
  66. Zellner, M.; Massey, D.; Minor, E.; Gonzalez-Meler, M. Exploring the effects of green infrastructure placement on neighborhood-level flooding via spatially explicit simulations. Comput. Environ. Urban Syst. 2016, 59, 116–128. [Google Scholar] [CrossRef]
  67. Zhu, Z.; Chen, X. Evaluating the effects of low impact development practices on urban flooding under different rainfall intensities. Water 2017, 9, 548. [Google Scholar] [CrossRef]
  68. Bełcik, M.; Grzegorzek, M.; Canales, F.A.; Struk-Sokołowska, J.; Kaźmierczak, B. Examination of interactions between heavy metals and benzotriazoles in rainwater runoff and snowmelt in an urban catchment in Poland. Water Resour. Ind. 2024, 31, 100236. [Google Scholar] [CrossRef]
  69. Pamuru, S.T.; Forgione, E.; Croft, K.; Kjellerup, B.V.; Davis, A.P. Chemical characterization of urban stormwater: Traditional and emerging contaminants. Sci. Total Environ. 2022, 813, 151887. [Google Scholar] [CrossRef] [PubMed]
  70. Park, M.H.; Ridgeway, I.K.; Swamikannu, X.; Stenstrom, M.K. Evaluation of stormwater BMPs for implementing industrial stormwater permitting strategy. Water Sci. Technol. 2010, 62, 2558–2563. [Google Scholar] [CrossRef]
  71. Jiang, Y.; Yuan, Y.; Piza, H. A review of applicability and effectiveness of low impact development/green infrastructure practices in Arid/Semi-Arid United States. Environments 2015, 2, 221–249. [Google Scholar] [CrossRef]
Figure 1. Research area and stormwater drainage system scheme.
Atmosphere 16 00347 g001
Figure 2. Rainfall curves for C = 5 years from the Błaszczyk’s model and the PMAXTP atlas.
Atmosphere 16 00347 g002
Figure 3. Model rainfall for C = 5 years, t = 60 min.
Atmosphere 16 00347 g003
Figure 4. Rainfall hyetograph (in 1 min intervals) on 8 September 2022 between 16:11 and 17:07.
Atmosphere 16 00347 g004
Figure 5. K-1 collector profile in the 30th minute of the model rainfall duration C = 5 years, calculated according to the Błaszczyk’s formula.
Atmosphere 16 00347 g005
Figure 6. K-2 collector profile in the 30th minute of the model rainfall duration C = 5 years, calculated according to the Błaszczyk’s formula.
Atmosphere 16 00347 g006
Figure 7. K-1 collector profile in the 30th minute of the model rainfall duration C = 5 years, calculated according to the IMGW-PIB atlas.
Atmosphere 16 00347 g007
Figure 8. K-2 collector profile in the 30th minute of the model rainfall duration C = 5 years, calculated according to the IMGW-PIB atlas.
Atmosphere 16 00347 g008
Figure 9. K-1 collector profile in the 15th minute of the actual rainfall duration of 8 September 2022.
Atmosphere 16 00347 g009
Figure 10. K-2 collector profile in the 15th minute of the actual rainfall duration of 8 September 2022.
Atmosphere 16 00347 g010
Table 1. Examples of sewer design criteria for overflows [3].
ImpactExample LocationsReturn Period
1 per C Years
Very lowRoads or open spaces away from buildings1
LowAgricultural land (depending on land use, e.g., pasture, arable)2
Low to mediumOpen spaces used for public amenity3
MediumRoads or open spaces adjacent to buildings5
Medium to highFlooding in occupied buildings excluding basements10
HighDeep flooding in occupied basements or road underpasses30
Very highCritical infrastructure50
Table 2. Rainfall amount for frequency of occurrence from C = 1 to C = 50 years.
t, MinC = 1C = 2C = 3C = 5C = 10C = 30C = 50
57.69.811.612.314.418.419.9
109.112.213.815.017.522.023.8
1510.213.615.116.619.424.526.5
3012.315.818.320.123.329.431.7
4513.717.520.422.526.232.735.3
6014.919.121.924.228.335.338.0
9016.621.324.627.031.539.342.1
12018.023.126.629.434.542.445.4
18020.325.829.732.938.247.250.4
36024.531.336.139.846.257.161.2
72029.938.143.848.356.069.173.4
108033.442.749.154.162.677.181.9
144036.246.353.258.667.783.388.4
216040.351.959.665.675.792.998.5
288043.756.264.671.181.9100.3106.3
432048.962.972.279.691.6111.8118.6
Table 3. Summary of simulation results.
ParameterScenario IScenario IIScenario III
Rainfall duration60 min60 min60 min
Rainfall amount18.2 mm24.2 mm26.3 mm
Total flooding volume from the system0 m31275 m33032 m3
Total flooding volume from the system3.50 m3/s5.36 m3/s5.48 m3/s
Rainwater collected in ZR-15341 m37034 m37800 m3
Maximum emergency discharge from ZR-10 m3/s0 m3/s1.28 m3/s
Emergency discharge volume from ZR-10 m30 m3807 m3
Maximum inflow to ZR-23.57 m3/s5.15 m3/s5.54 m3/s
Rainwater collected in ZR-29038 m312,036 m313,067 m3
Maximum emergency discharge from ZR-20 m3/s0 m3/s0 m3/s
Emergency discharge volume from ZR-20 m30 m30 m3
Disclaimer/Publisher’s Note: The statements, opinions and data contained in all publications are solely those of the individual author(s) and contributor(s) and not of MDPI and/or the editor(s). MDPI and/or the editor(s) disclaim responsibility for any injury to people or property resulting from any ideas, methods, instructions or products referred to in the content.

