Article

Enhancing Kármán Vortex Street Detection via Auxiliary Networks Incorporating Key Atmospheric Parameters

1
Institute for Ocean Engineering, Shenzhen International Graduate School, Tsinghua University, Shenzhen 518055, China
2
Marine Technology Research Center, Tsinghua University, Shenzhen 518055, China
*
Author to whom correspondence should be addressed.
Atmosphere 2025, 16(3), 338; https://doi.org/10.3390/atmos16030338
Submission received: 2 February 2025 / Revised: 8 March 2025 / Accepted: 10 March 2025 / Published: 17 March 2025
(This article belongs to the Section Atmospheric Techniques, Instruments, and Modeling)

Abstract

:
Kármán vortex streets are quintessential phenomena in fluid dynamics, manifested by the periodic shedding of vortices as airflow interacts with obstacles. The genesis and characteristics of these vortex structures are significantly influenced by various atmospheric parameters, including temperature, humidity, pressure, and wind velocities, which collectively dictate their formation conditions, spatial arrangement, and dynamic behavior. Although deep learning methodologies have advanced the automated detection of Kármán vortex streets in remote sensing imagery, existing approaches largely emphasize visual feature extraction without adequately incorporating critical atmospheric variables. To overcome this limitation, this study presents an innovative auxiliary network framework that integrates essential atmospheric physical parameters to bolster the detection performance of Kármán vortex streets. Utilizing reanalysis data from the European Centre for Medium-Range Weather Forecasts (ECMWF-ERA5), representative atmospheric features are extracted and subjected to feature permutation importance (PFI) analysis to quantitatively evaluate the influence of each parameter on the detection task. This analysis identifies five pivotal variables: geopotential, specific humidity, temperature, horizontal wind speed, and vertical air velocity, which are subsequently employed as inputs for the auxiliary task. Building upon the YOLOv8s object detection model, the proposed auxiliary network systematically examines the impact of various atmospheric variable combinations on detection efficacy. Experimental results demonstrate that the integration of horizontal wind speed and vertical air velocity achieves the highest detection metrics (precision of 0.838, recall of 0.797, mAP50 of 0.865, and mAP50-95 of 0.413) in precision-critical scenarios, outperforming traditional image-only detection method (precision of 0.745, recall of 0.745, mAP50 of 0.759, and mAP50-95 of 0.372). The optimized selection of atmospheric parameters markedly improves the detection metrics and reliability of Kármán vortex streets, underscoring the efficacy and practicality of the proposed methodological framework. This advancement paves the way for more robust automated analysis of atmospheric fluid dynamics phenomena.

1. Introduction

Kármán vortex streets are a typical and important phenomenon in fluid dynamics, often forming alternating vortex structures when a fluid flows around obstacles such as islands and mountains. Chopra and Hubert (1964) [1] first introduced the concept of Kármán vortex streets in the Earth’s atmosphere. Wille (1960) [2] further explored the theoretical foundations of these vortex structures. More recent studies were conducted based on high-resolution satellite (Horváth et al. (2020) [3], Niino (2016) [4]). This phenomenon exists widely in natural marine and atmospheric environments [5,6]. As a key topic in atmospheric science and climate research, the formation mechanism of Kármán vortex streets involves various complex atmospheric physical parameters, including humidity, temperature, horizontal wind speed, and vertical air velocity. These factors interact across different spatial and temporal scales, collectively determining the conditions for vortex street formation [7], their spatial distribution, and their dynamic evolution characteristics.
In recent years, with the rapid development of artificial intelligence and machine learning technologies [8,9], their application in pattern recognition and large-scale data analysis has shown great potential, particularly in the field of atmospheric science [10,11]. Deep-learning-based object detection algorithms have made significant progress in remote sensing image analysis [12], extreme weather event recognition [13], and climate change research [14]. Furthermore, research on Kármán vortex street detection and formation-influencing factors is still in the early stages. This is primarily because the detection of Kármán vortex streets in atmospheric and environmental data is a complex task that requires the integration of various physical parameters, and the exploration of suitable models is still evolving. For example, while Ham et al. [15] applied deep learning to ENSO forecasts, the use of deep learning specifically for vortex street detection in remote sensing data has not been extensively explored. Furthermore, studies like those by Nunalee [16] and Nunalee and Basu [17] focused on dynamical characteristics and periodicity but did not fully address how to optimize detection performance or handle the complexity of large-scale atmospheric data. Similarly, Stegner et al. [18] studied the instability of vortex streets but did not extend these findings into practical detection systems. As such, the field is still in its early stages, with significant challenges remaining in model development and application to real-world data.
These studies have not fully integrated key atmospheric parameters related to vortex street formation, resulting in noticeable limitations in detection accuracy and model robustness. Furthermore, there is still a lack of systematic quantitative analysis on the specific roles of various atmospheric parameters in the vortex street formation process, which limits the theoretical support and practical application range of the models.
Existing research has shown that mesoscale Kármán vortex streets significantly affect other mesoscale/microscale atmospheric processes, such as vertical and horizontal wind shear, thermal stability, and turbulent kinetic energy dissipation. The changes in these processes directly affect the formation and evolution of vortex streets. Moreover, the wind characteristics at different ends of an island are mainly influenced by terrain, and this difference not only determines the formation pattern and intensity of vortex streets but also further alters the stability of the vortex structures [19]. Meanwhile, variations in horizontal wind speed directly influence the separation process of vortices, thereby playing an important role in regulating the formation of Kármán vortex streets [20]. On the other hand, there is a close correlation between Kármán vortex streets and relative humidity. Changes in humidity cause differences in atmospheric water vapor distribution, which in turn significantly impact turbulence characteristics and flow stability [21]. At the same time, temperature gradients are closely related to atmospheric thermodynamic stability by affecting airflow density and viscosity [22]. Therefore, atmospheric parameters are key data that are inseparable from the formation of Kármán vortex streets.
Therefore, this study proposes an auxiliary task optimization method that combines atmospheric physical parameters, for the first time integrating these parameters with deep-learning-based object detection algorithms to improve the accuracy and robustness of Kármán vortex street detection. In response to the limitations of existing detection algorithms, which mainly rely on remote sensing image features, this study optimizes the performance of current object detection models by incorporating atmospheric physical parameters closely related to Kármán vortex street formation. Specifically, based on ECMWF reanalysis-ERA5 data, seven atmospheric features were extracted, and their contributions to the detection task were quantified using permutation feature importance (PFI) analysis. Five key features—geopotential, specific humidity, temperature, horizontal wind speed, and vertical air velocity—were ultimately selected as input parameters for the auxiliary task. In terms of model design, YOLOv8s [23,24] was chosen as the base model for object detection, and an auxiliary task network was introduced to optimize detection performance through a joint training mechanism. The auxiliary network predicts the average values of key parameters at five atmospheric pressure levels, and its output is fused with the object detection results to improve the model’s adaptability to Kármán vortex street detection under complex atmospheric conditions. The experiments show that the best auxiliary task combination significantly improves detection accuracy, validating the effectiveness of the proposed method.
This study is the first to combine atmospheric physical parameters with deep-learning-based object detection algorithms, breaking through the limitations of traditional methods that only rely on image features. This not only improves detection performance but also provides new data support for understanding the formation mechanism of Kármán vortex streets.

2. Data and Methods

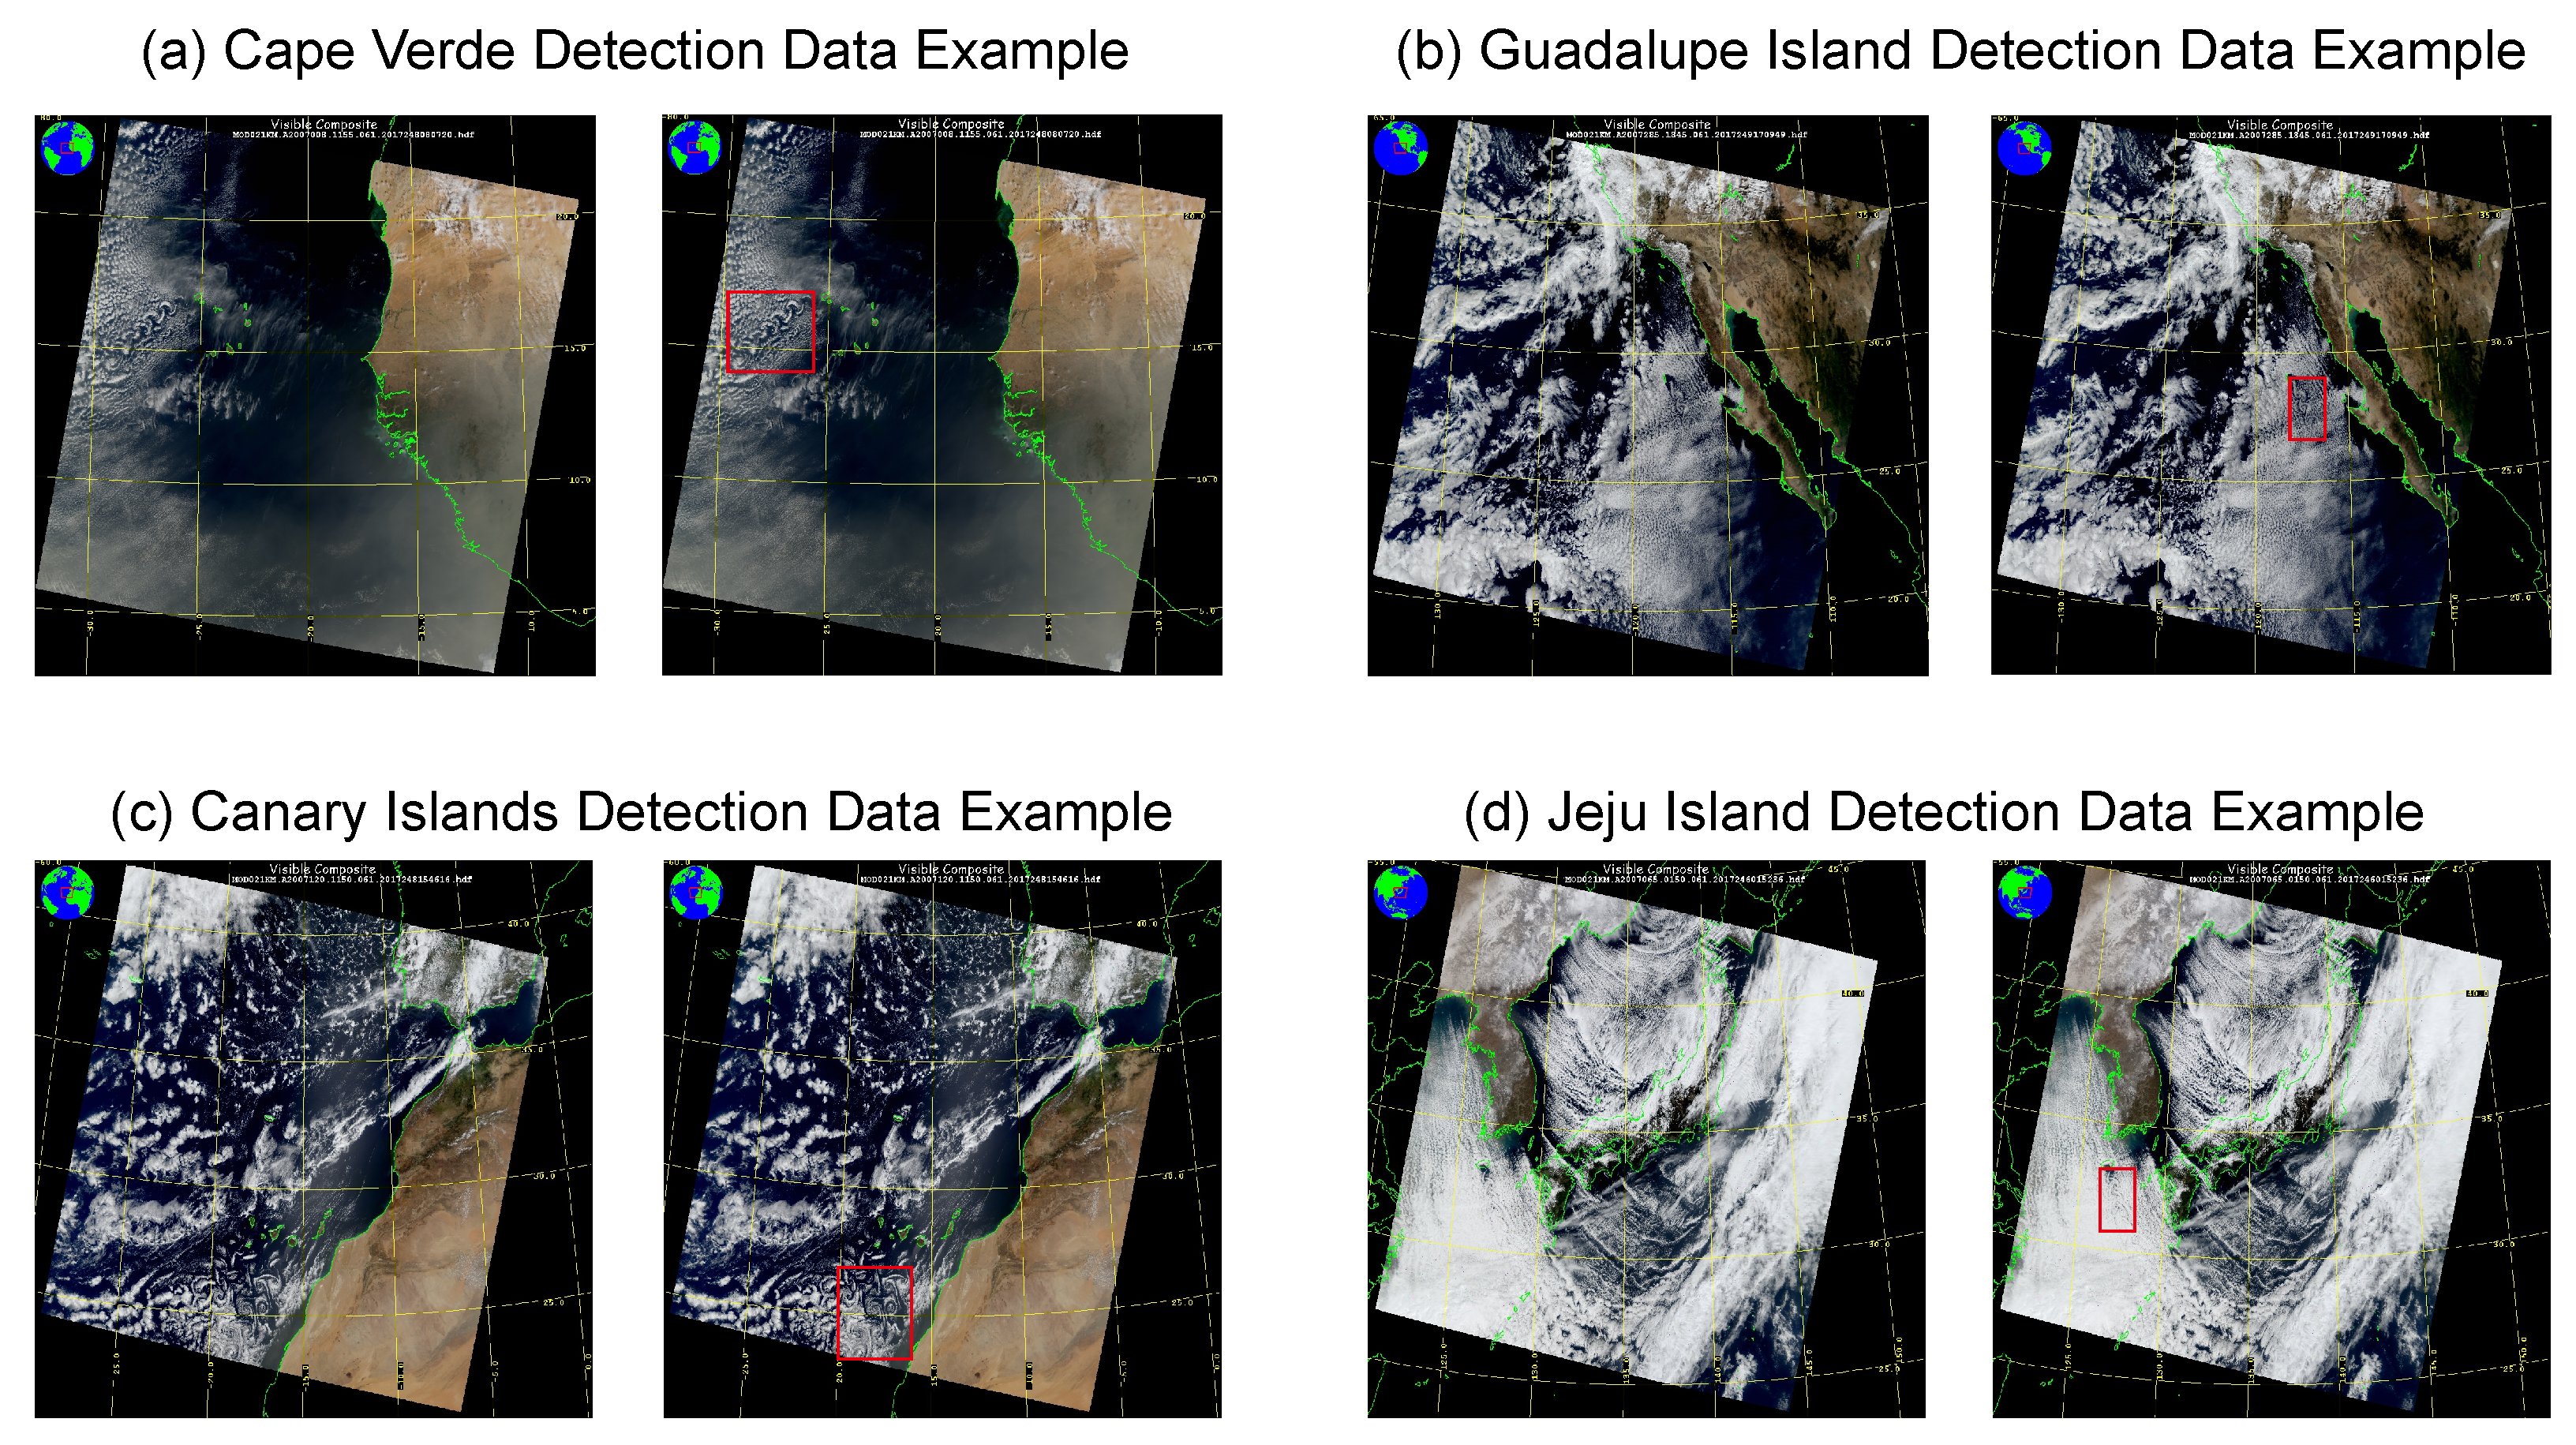
2.1. Object Detection Imgaery Dateset

This study uses a custom Kármán vortex street detection dataset, which contains visible and infrared cloud images captured by the Terra/MODIS satellite (through NASA’s LAADS DAAC system) from 2004 to 2023. These images are stored in the MOD021KM product [25,26], focusing on regions where vortex streets frequently form, such as Jeju Island, the Canary Islands, Cape Verde, and Guadalupe Island. The dataset includes 1051 satellite cloud images with a resolution of 250 m, each with a size of 1024 × 1024 pixels. To ensure high data quality, the dataset has been cleaned, and 1383 Kármán vortex street instances were manually labeled using the LabelImg tool [27]. All labeled data are saved in the PASCAL VOC format to ensure compatibility with object detection algorithms. The dataset size is approximately 540 MB, providing support for the development and evaluation of the Kármán vortex street automation detection model. Examples are shown in Figure 1. Geographical information of the four islands is shown in Table 1.

2.2. Atmospheric Parameter Dataset

This study constructs a complementary atmospheric parameter dataset specifically for the Kármán vortex street detection dataset in order to systematically investigate the environmental conditions closely related to the formation of Kármán vortex streets. Based on the ERA5 reanalysis data from the European Centre for Medium-Range Weather Forecasts (ECMWF) [28], this research extracts atmospheric variables from the “Hourly Data on Pressure Levels from 1940 to Present” within the target spatiotemporal range. ERA5 reanalysis data is generated by an advanced data assimilation system, integrating global observation data (including satellite observations, ground observations, and sounding data), providing relatively continuous, accurate, and consistent global atmospheric data. The dataset has a spatial resolution of 0.5° × 0.5° and records various meteorological elements at an hourly interval, providing a solid data foundation for studying the dynamic changes and formation mechanisms of atmospheric Kármán vortex streets. Compared to traditional reanalysis data, ERA5 shows significant improvements in the data assimilation process and quality control, allowing for finer characterization of different meteorological elements. At a resolution of 0.5° × 0.5°, researchers can accurately capture atmospheric dynamics and thermodynamics occurring at different altitudes, ensuring a thorough analysis of the evolution patterns of Kármán vortex streets across different spatiotemporal scales. Additionally, the hourly time resolution is crucial for the study of transient phenomena like Kármán vortex streets, enabling higher-precision registration with actual observations or remote sensing images and providing more possibilities for exploring causal relationships between vortex streets and changes in atmospheric variables.
This study selects seven atmospheric variables closely related to the formation of Kármán vortex streets for analysis: geopotential, relative humidity, specific humidity, air temperature, east-west wind speed, north-south wind speed, and vertical air velocity. These atmospheric parameters collectively describe the dynamics and thermodynamics of the Kármán vortex street regions. Geopotential reflects the distribution of atmospheric energy and the stability of stratification, serving as a key indicator for evaluating atmospheric stability and convection activity; humidity (including specific humidity and relative humidity) describes the characteristics of water vapor in the atmosphere and significantly affects fluid density and the intensity of convection activity; temperature controls the thermodynamic characteristics of the fluid, determining airflow stability and temperature gradients; horizontal wind speed (including east-west wind speed and north-south wind speed) defines the dynamic characteristics of the horizontal wind field, with wind speed changes directly affecting Reynolds number and thus influencing the scale and frequency of vortex streets; and vertical air velocity describes vertical perturbation processes in the atmosphere, reflecting the disturbance of the atmospheric structure due to convection activity, which is crucial for the formation and evolution of vortex streets. In general, these seven atmospheric parameters reveal the conditions and processes of the Kármán vortex street formation from different perspectives. They not only influence the formation of Kármán vortex streets spatially but also determine their stability and evolution patterns temporally. The comprehensive analysis of these parameters provides important support in understanding and predicting the dynamic behavior of Kármán vortex streets.
To ensure the representativeness and scientific validity of the data, this study selected 300 vortex street target region samples and 300 control samples without vortex streets from the Kármán vortex street image dataset. Data for the seven atmospheric variables from five pressure levels—500 hPa, 700 hPa, 800 hPa, 900 hPa, and 1000 hPa—were extracted for each sample. These pressure levels are key layers where Kármán vortex street characteristics are prominently observed. Above 500 hPa, both temperature and pressure significantly decrease, the air density reduces, and the terrain’s blocking effect weakens with height. The altitude of islands or mountains is usually not high enough to significantly interfere with the upper troposphere. Additionally, high-altitude wind fields often exhibit stronger vertical shear, which can disrupt the periodic structure of Kármán vortex streets [29]. Near the surface (e.g., 1000 hPa), there is strong friction and turbulent mixing, making it difficult for vortex streets to maintain their shape [30]. Observational cases suggest that airflow in the 700–900 hPa range is relatively consistent with island elevations, where periodic wake separation can occur on the lee side, thereby favoring the formation of regular vortex streets. Etling [31] studied atmospheric vortex streets in the wake of large islands, while Chung and Kim [32] identified mountain-generated vortex streets over the Korea South Sea. Beggs et al. [19] also documented the identification of Von Kármán vortices in the surface winds of Heard Island. In a more recent study, Etling [33] observed an unusual atmospheric vortex street, and Liu et al. [34] investigated the impact of atmospheric vortex streets on precipitation in the wake of the Tibetan Plateau. The raw data are stored in NetCDF4 format and read using Python’s xarray library. The processed data are stored as Python lists, where each element is a sample consisting of features and labels. The feature part is a four-dimensional tensor with dimensions (7, 5, H, W), where 7 represents the variable types, 5 represents the pressure levels, and H and W represent the height and width of the target bounding box. The label part is a scalar, with values of 0 or 1, indicating whether a Kármán vortex street is present in the sample. After preprocessing, the final training data consist of 300 Kármán vortex street samples and 300 non-Kármán vortex street samples, covering seven atmospheric variables at five different pressure levels, providing ample data support for subsequent object detection tasks and auxiliary tasks.

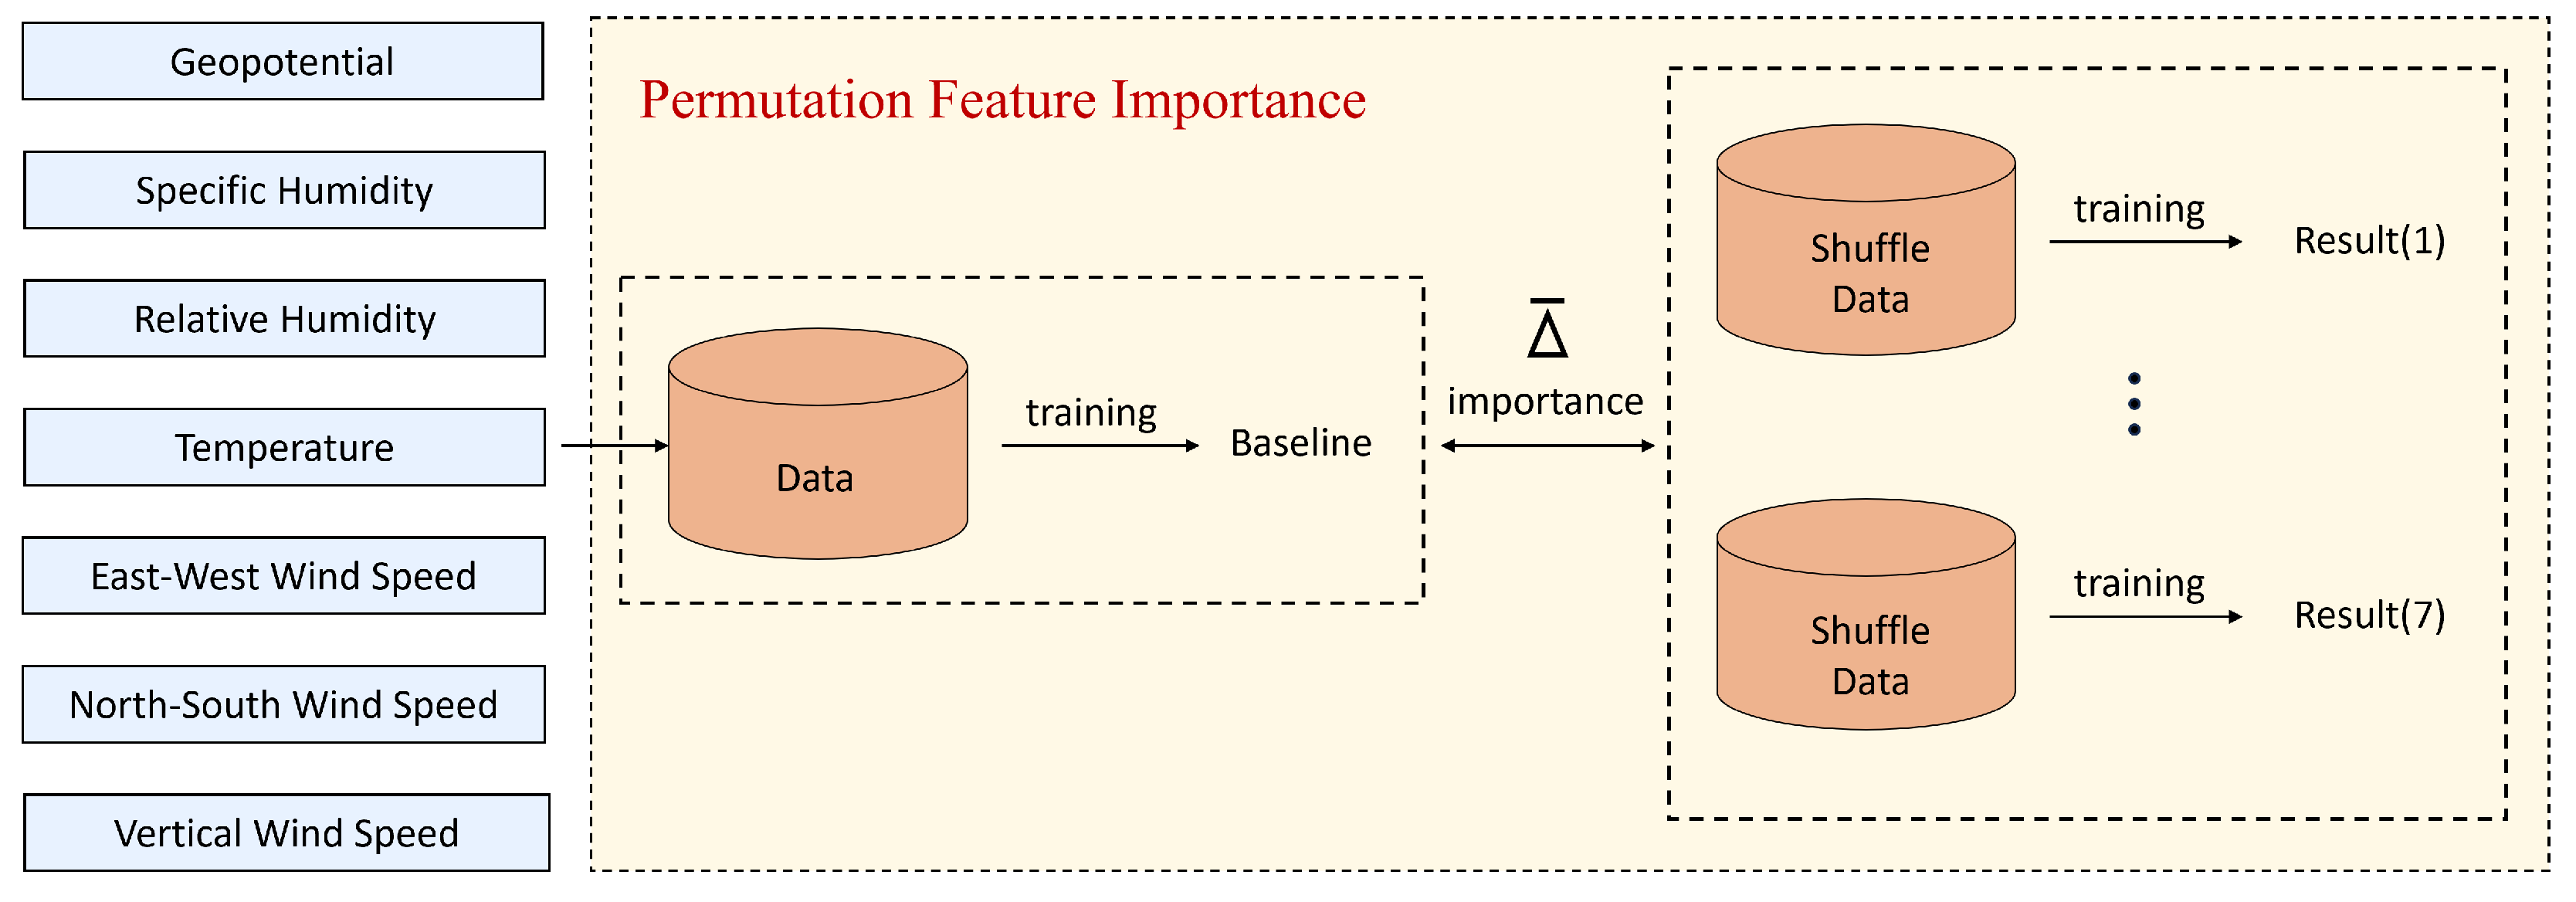
2.3. Permutation Feature Importance (PFI)

Permutation feature importance (PFI) [35,36] is a method for quantitatively assessing the contribution of input features to model performance, widely used in machine learning and deep learning models. PFI evaluates the degree of performance degradation by randomly shuffling the input data of a particular feature, thereby measuring its importance. In this study, the PFI method is used to analyze the contribution of ECMWF atmospheric parameters to Kármán vortex street detection. The specific steps are as follows: First, a classification network is designed with feature maps of seven atmospheric features as input, and the output is a prediction of whether a Kármán vortex street exists. The network is then trained, and its baseline performance (classification accuracy) in the validation set is calculated. Next, by randomly shuffling a specific feature map (i.e., randomly rearranging all pixel values of a particular feature), while keeping other feature data unchanged, the model’s performance is re-evaluated, and the performance degradation due to the permutation is recorded. Finally, the experiment is repeated multiple times for each feature, and the average performance degradation is calculated and used as the feature’s importance score. This process provides a scientific basis for feature selection in the model, ensuring that the final input features significantly enhance the model’s detection performance while reducing the impact of redundant information on model efficiency. The specific process is shown in Figure 2.

2.4. ATNet Network Architecture

To quantify the contribution of seven atmospheric variables (geopotential, relative humidity, precise humidity, air temperature, east-west wind speed, north-south wind speed, and vertical air flow speed) in Kármán vortex street detection, this study designs a classification model based on 3D convolutional neural networks (3D CNN), named ATNet (atmospheric tensor network). ATNet takes the 3D feature maps of the seven variables as input, with dimensions (7, 5, H, W), where 7 represents the seven variables, 5 is the number of pressure levels, and H and W are the height and width of the target region. The model extracts features through a series of convolution, pooling, and fully connected operations and predicts the presence of Kármán vortex streets in the sample, outputting a probability value (0 or 1). Feature importance is quantified using the permutation feature importance (PFI) method to assess the contribution of each variable to model performance, providing a basis for selecting variables for subsequent auxiliary tasks.
The structure of ATNet is shown in Figure 3. Its design considers the multi-level, spatiotemporal features in the Kármán vortex street image dataset, as well as how to effectively handle samples with different input region sizes. To achieve this, the model employs a structure with multiple 3D convolution modules, pooling layers, and fully connected layers. This design efficiently extracts spatiotemporal distribution features from the input data while maintaining stability and efficiency during model training. Three-dimensional convolution layers are widely used for processing data with spatiotemporal features, as they can capture features in both the spatial and temporal dimensions simultaneously, which is crucial for the dynamic changes in the Kármán vortex street image dataset.
Through two layers of 3D convolution modules, ATNet effectively extracts initial local features. After each convolution layer, batch normalization (BN) is applied. The inclusion of BN reduces internal covariate shift, improves training stability, and accelerates the convergence process. Moreover, the SeLU activation function ensures the network’s nonlinear expressiveness, enhancing the model’s learning capability. The pooling layers play an essential role in deep neural networks, especially when handling high-dimensional data. By downsampling, pooling layers reduce the data’s dimensionality and effectively compress computational resource demands. ATNet uses 3D max-pooling layers for downsampling, which not only reduces computational costs but also preserves the most critical features of the input data, preventing information loss.
To handle input samples of different sizes and provide a uniform output, ATNet introduces an adaptive average pooling layer after feature extraction. This pooling layer transforms the spatial dimensions of the input data into a fixed output size (8 × 16 × 16), allowing the model to adapt to samples with varying region sizes. Additionally, a flattening operation maps the extracted features into a one-dimensional vector, enabling them to be input into the fully connected layers for further processing.
The fully connected layers progressively reduce the dimensionality and output the probability of the presence of Kármán vortex streets through the Sigmoid activation function. This design not only incorporates commonly used training techniques in convolutional neural networks (CNN), such as BN layers and SeLU activation functions, but also effectively handles different input region sizes. This makes ATNet more flexible and robust when processing Kármán vortex street data.

2.5. Feature Permutation Importance Analysis Experiment Design

The aim of this experiment is to quantify the contribution of seven atmospheric variables to the performance of the Kármán vortex street recognition model, and based on the results, optimize and select the variables. Feature permutation importance analysis (PFI) quantifies the importance of a variable by shuffling its features and observing the extent of performance degradation in the model.
The network model used in the experiment can receive four-dimensional input data of arbitrary size (7 × 5 × H × W). During the feature extraction phase, adaptive pooling operations are used to unify feature maps of different sizes into a fixed size, ensuring that the network can handle data with different input sizes. Then, a fully connected layer (MLP) is used to predict the probability of the presence of Kármán vortex streets. The experimental dataset consists of 300 Kármán vortex street samples and 300 non-Kármán vortex street samples, which are split into training and test sets at an 80% vs. 20% ratio. The model is trained under fixed parameter settings, and the average accuracy of baseline performance is calculated after 50 training sessions (20 epochs per session).
Next, feature permutation experiments are conducted for each atmospheric variable. In the experiment, the feature values of each variable are randomly shuffled, while the features of the other variables remain unchanged, and the model is retrained to calculate the extent of accuracy degradation. This degradation is used as an importance metric to quantify the contribution of each atmospheric variable to model performance. In this way, we can more precisely understand the influence of each atmospheric variable in the recognition of Kármán vortex streets, providing a basis for subsequent variable selection and optimization.

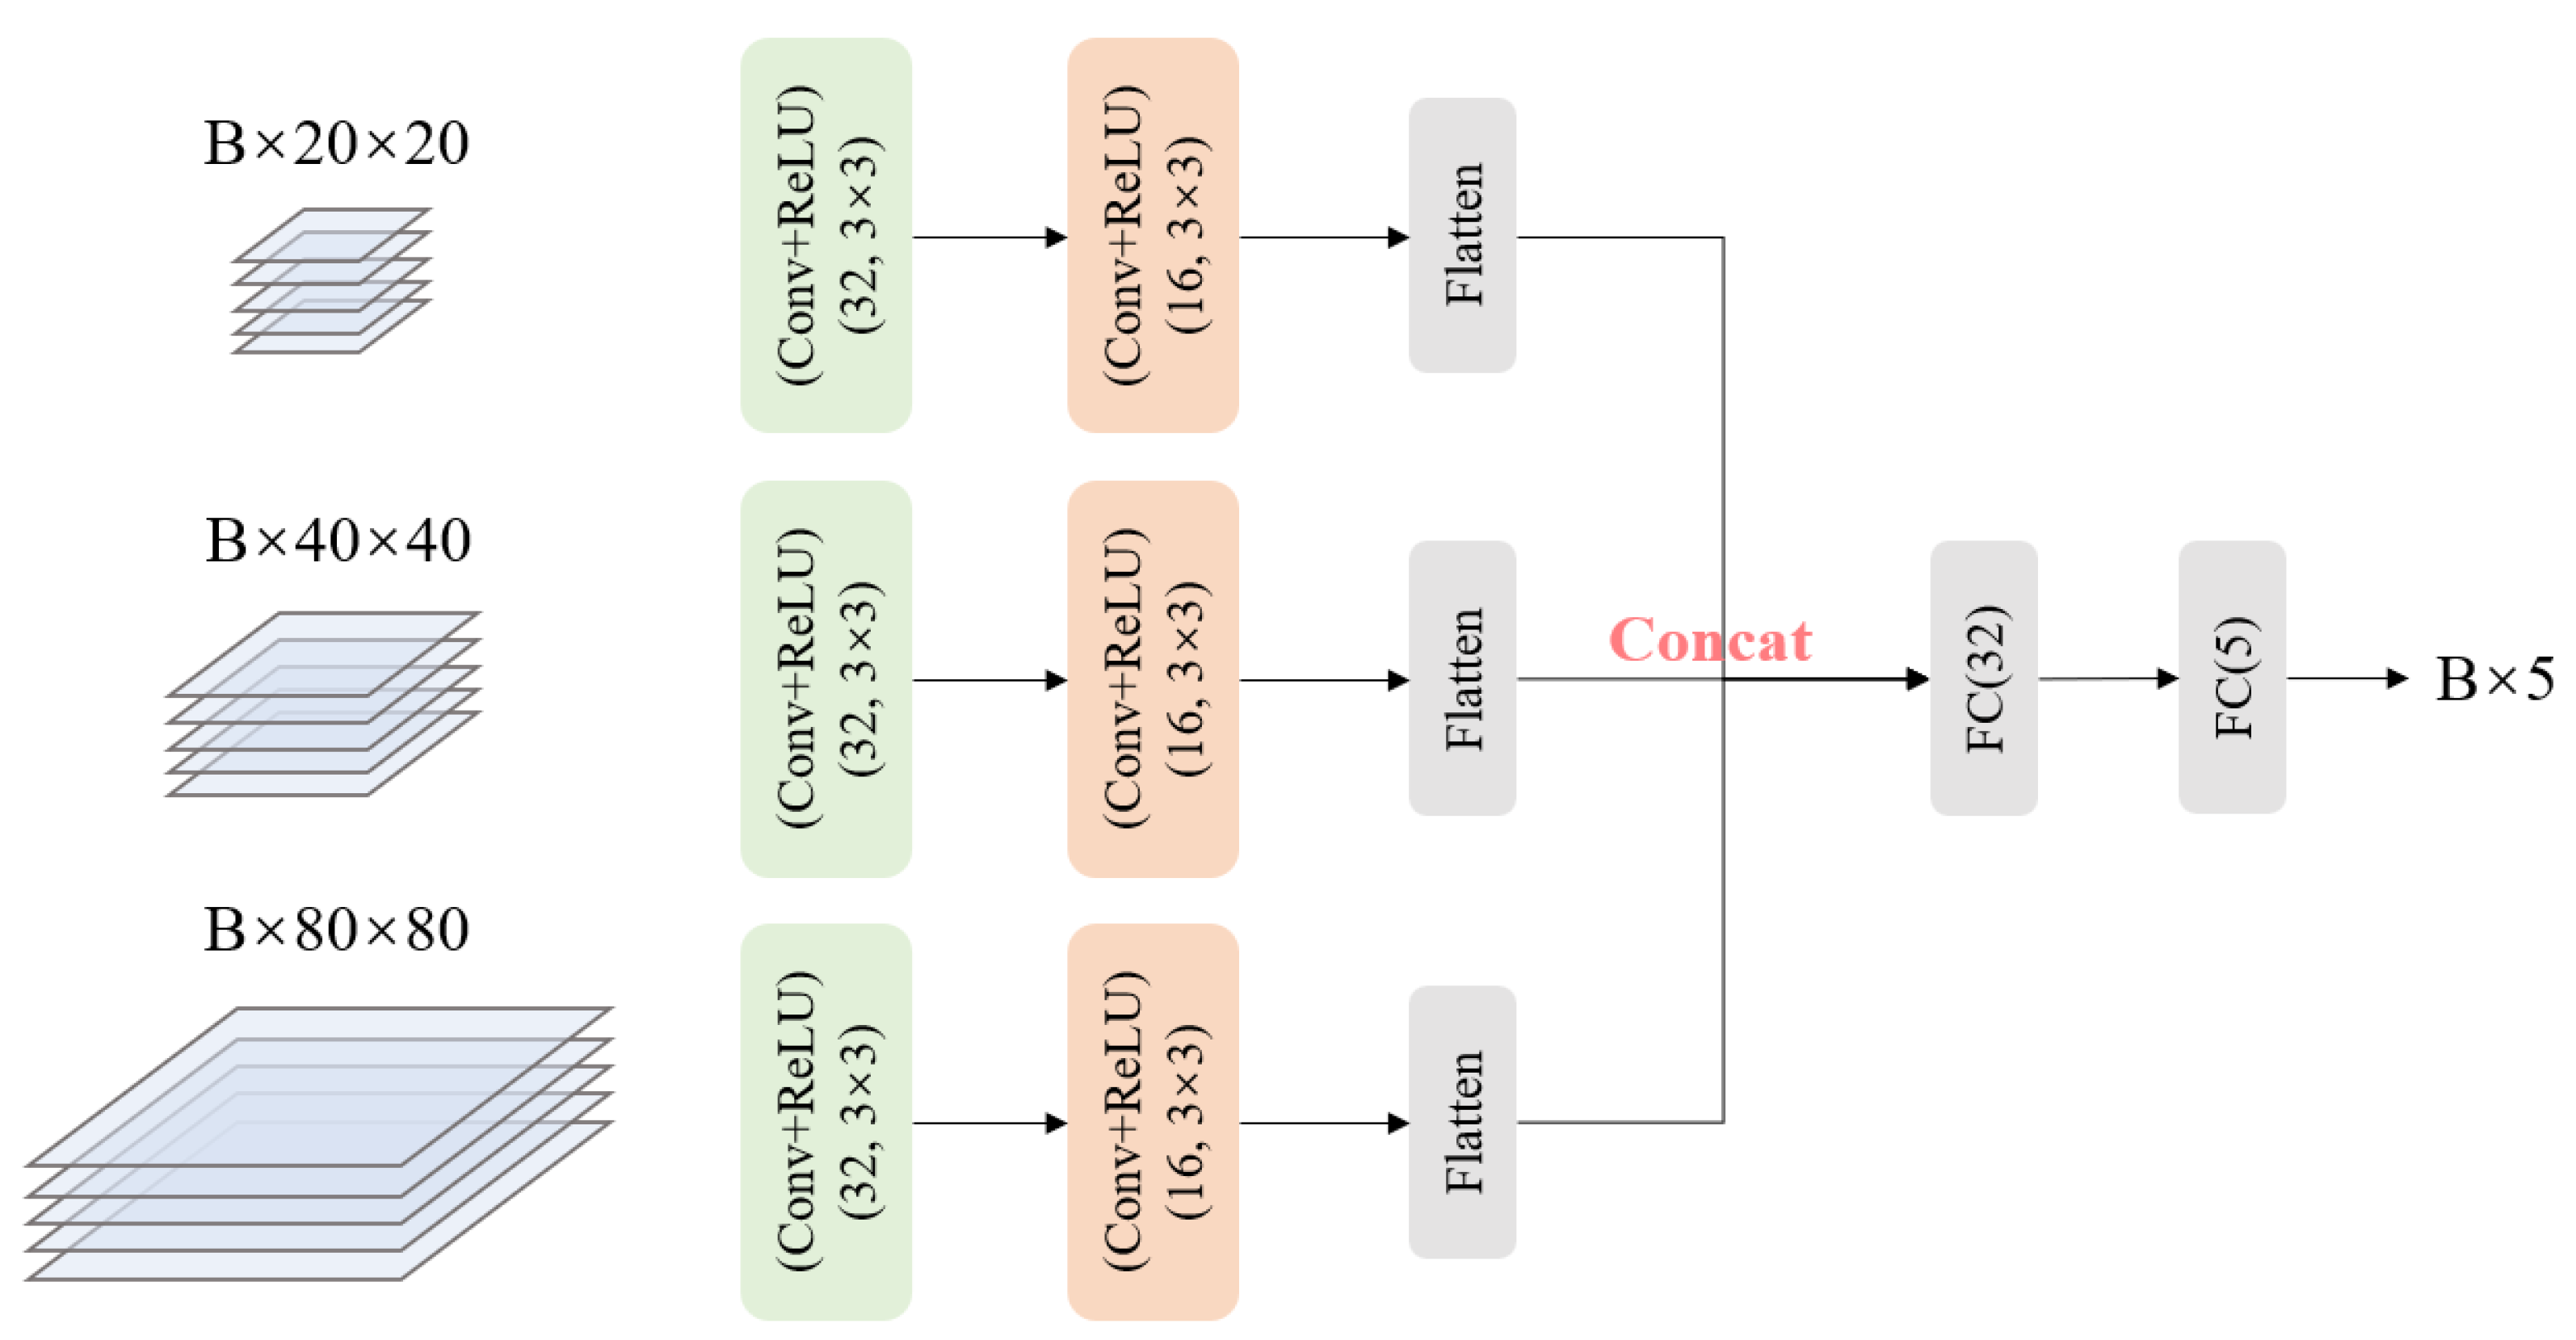
2.6. Object Detection Model

YOLOv8s is a lightweight and high-performance object detection algorithm in the YOLO series that excels in handling complex image patterns. The model extracts multi-level image feature maps through its backbone network and combines them with the detection head for object localization and classification. In previous work, the performance of the Kármán vortex street object detection model was significantly improved by using the gamma distribution log-likelihood loss, especially for the deep architecture models YOLOv8s and YOLOv9t. This approach captures the geometric characteristics of objects, providing strong support for improving detection accuracy and robustness. Therefore, this research uses YOLOv8s for the detection task of Kármán vortex streets based on the above findings. The general structure of YOLOv8 is shown in Figure 4. In the YOLOv8s architecture, the feature maps P3, P4, and P5 are extracted at different scales to capture hierarchical representations of objects. P3 provides fine-grained features for detecting smaller objects, while P4 and P5 contribute to recognizing larger-scale structures. In the subsequent analysis, these three feature maps will be leveraged for auxiliary task prediction to enhance model performance.
The YOLOv8s model architecture combines an efficient backbone network and a neck network. The backbone network uses an improved residual module and efficient convolution layers to enhance feature extraction capabilities while reducing computational complexity. The neck network integrates the advantages of feature pyramid networks (FPNs) and path aggregation networks (PANets), improving multi-scale object detection. YOLOv8s optimizes the resolution and channel number of feature maps, significantly improving performance in small and multi-scale object detection tasks. The model uses an improved CIoU loss and classification loss, achieving better localization accuracy and category distribution prediction. In addition, YOLOv8s introduces adaptive anchor box generation, rich data augmentation techniques, and mixed-precision training strategies, which not only enhance the model’s generalization ability but also speed up the training process and reduce memory usage. In terms of performance, YOLOv8s is more competitive than YOLOv5s and YOLOv7s in mAP (mean average precision), with fast inference speed, meeting real-time detection requirements.

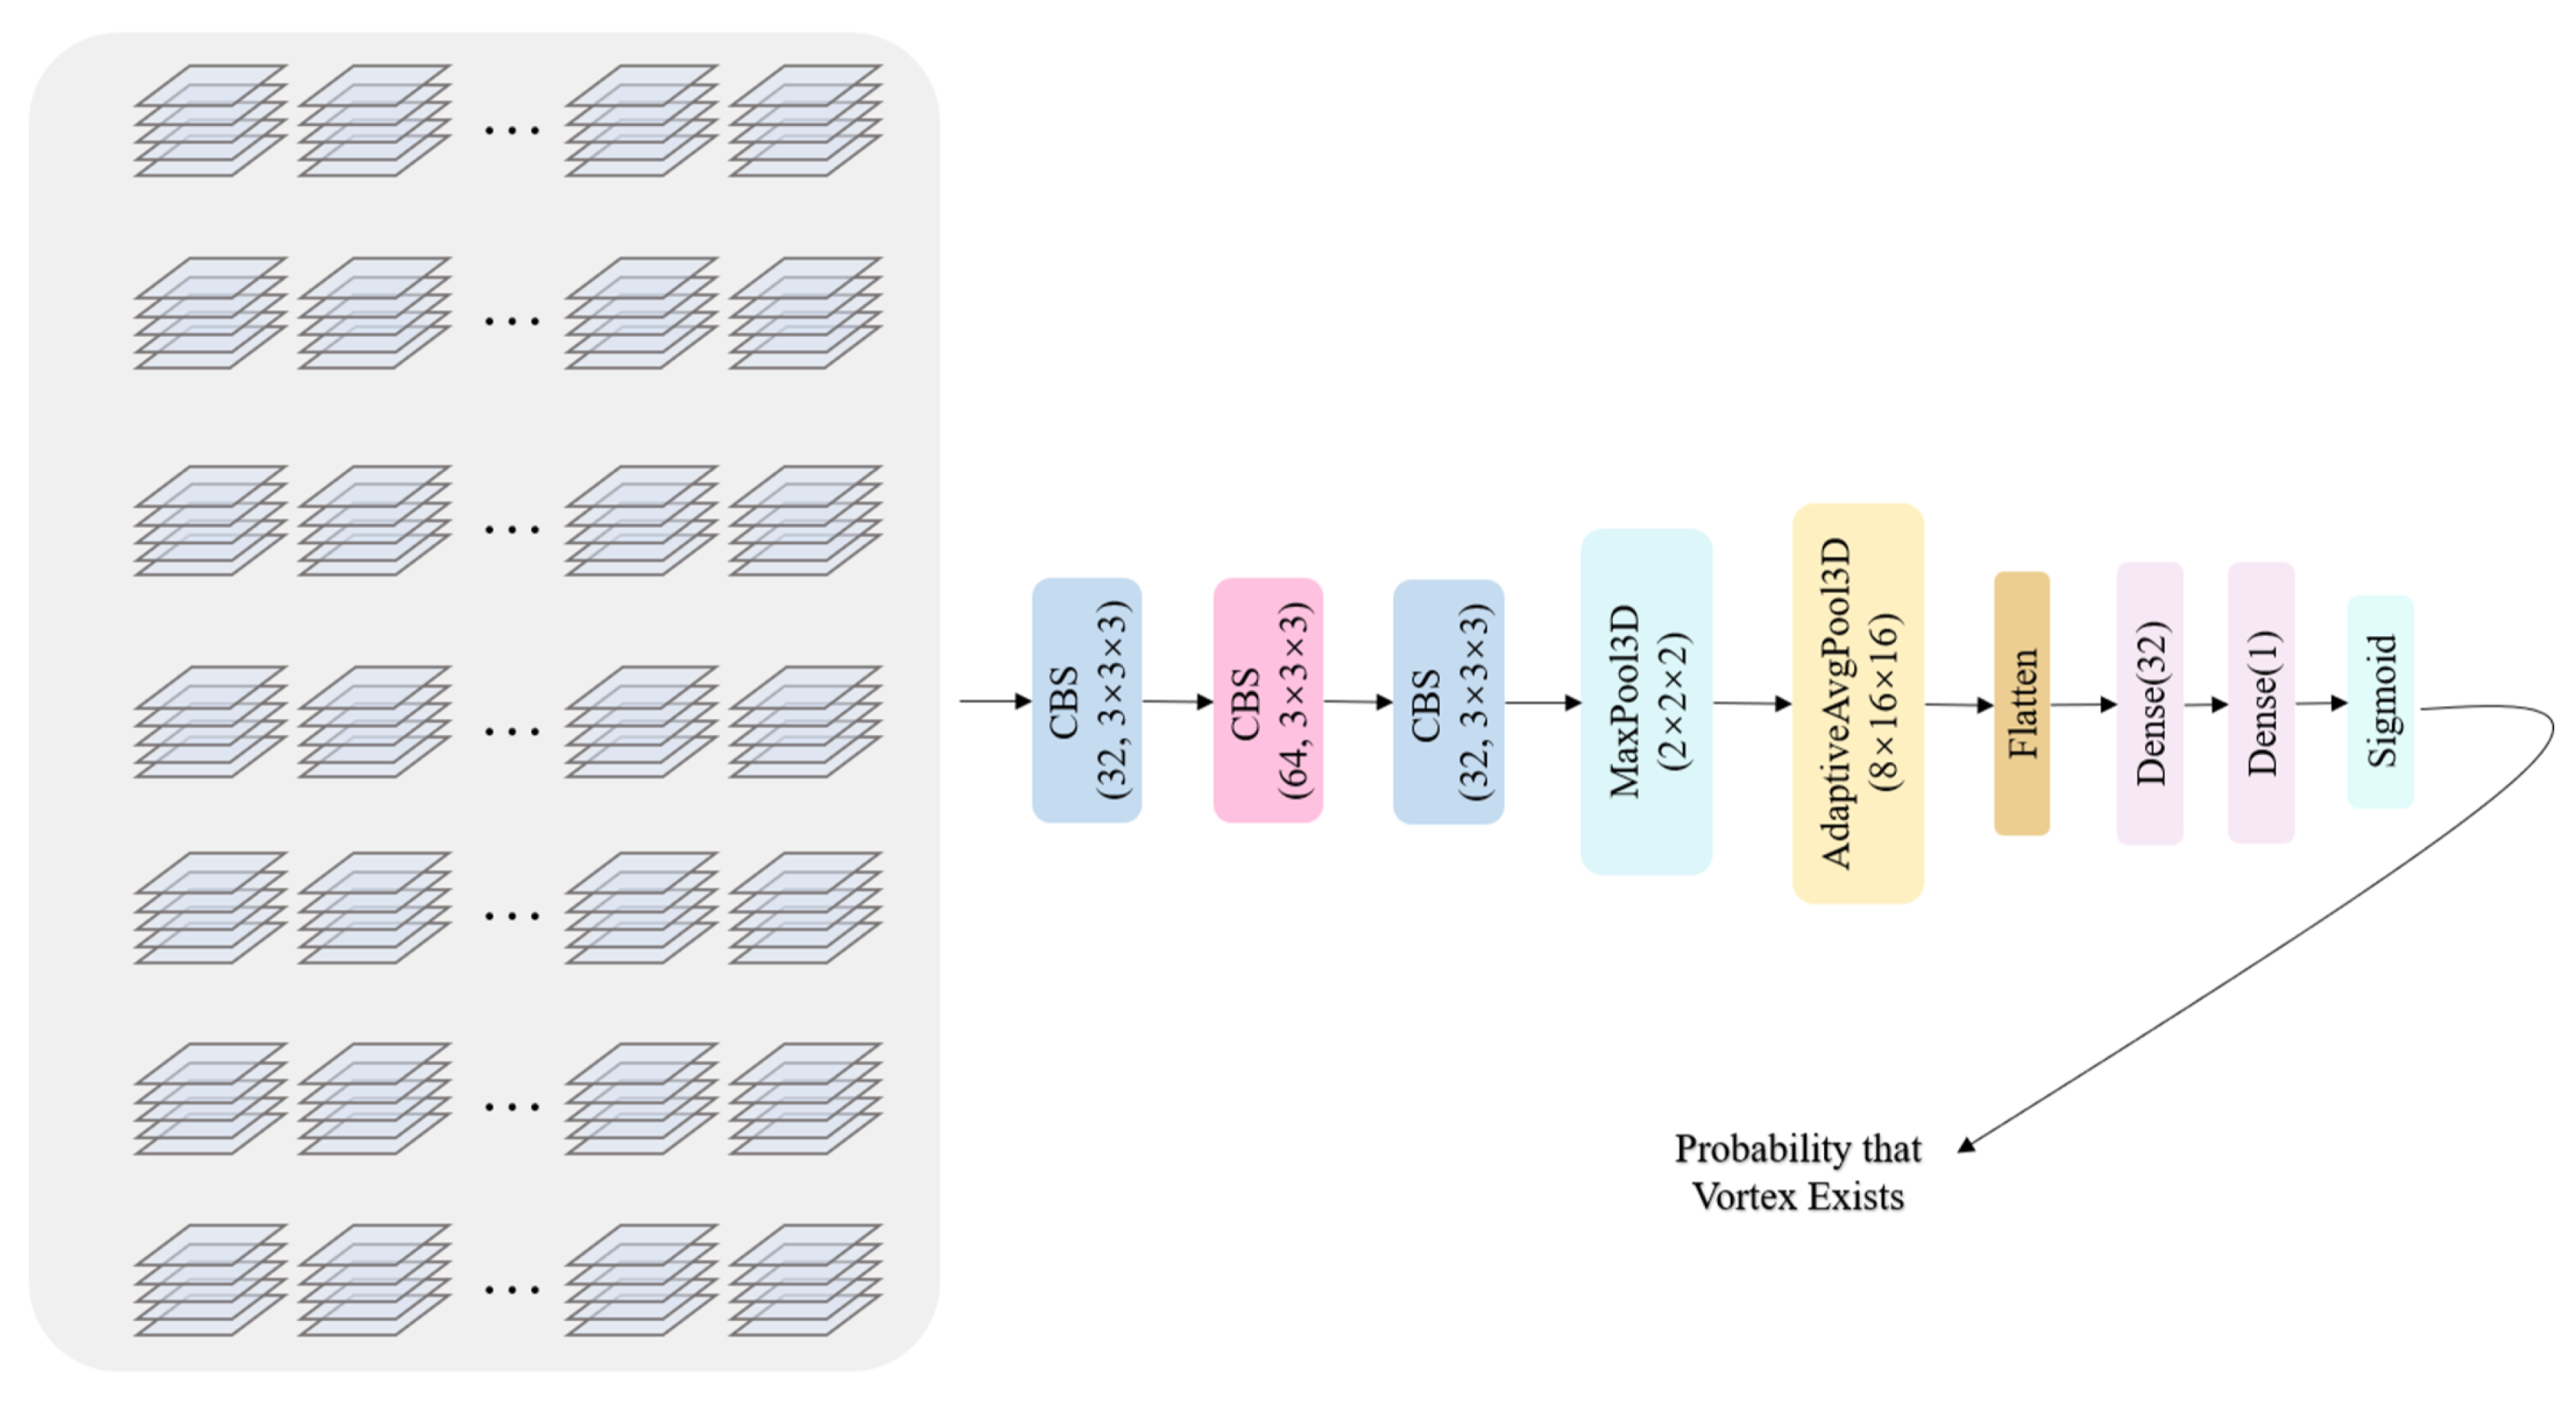
2.7. Auxiliary Task Network Design

To further enhance the performance of YOLOv8s in Kármán vortex street detection tasks, this study introduces an auxiliary task network (AuxNet). The design goal of the auxiliary task is to leverage the feature information of atmospheric variables to improve the model’s ability to perceive atmospheric parameters in Kármán vortex street regions, thereby enhancing the object detection performance. The schematic diagram of this network is shown in Figure 5.
The input to AuxNet consists of multi-scale feature maps extracted by the backbone network of YOLOv8s, while the output is the region average value of a specific atmospheric variable at five different pressure levels. This design effectively combines the spatial distribution characteristics of atmospheric variables with image features, supporting multi-task learning. AuxNet is composed of two main parts: a shared convolutional module and a fully connected module.
The shared convolutional module performs layer-by-layer convolution on the input feature maps, extracting high-level feature representations while reducing the number of channels to lower the parameter count. The fully connected module flattens the multi-scale feature maps into a one-dimensional vector, which is then passed through two fully connected layers to output five numbers corresponding to the mean values at five atmospheric pressure levels (500 hPa, 700 hPa, 800 hPa, 900 hPa, and 1000 hPa).
The input to AuxNet is a list of multi-scale feature maps, which are output from different convolutional layers of the YOLOv8s model. Specifically, the shapes of the output feature maps are [[65, 80, 80], [65, 40, 40], [65, 20, 20]], with varying resolutions and channel numbers. To handle these different resolutions and channel numbers, AuxNet uses the shared convolutional module, which processes each feature map individually to extract standardized high-level feature representations. The processed feature maps are then flattened into one-dimensional vectors, and all flattened features are concatenated into a single vector. Finally, this vector is processed through a series of fully connected layers to output the prediction results. The network architecture is shown in Figure 6.
The specific structure design of AuxNet aims to improve the model’s efficiency and performance when handling multi-scale feature maps, ensuring that it can effectively extract and integrate data from different scales while maintaining computational efficiency and rich feature representation.
First, the model adopts a shared convolutional layer design. Through two convolutional operations, the channel numbers of the input feature maps are reduced to 32 and 16, respectively, thereby reducing the number of parameters and improving computational efficiency. After each convolution, the ReLU activation function is applied to introduce nonlinear transformations, enabling the model to learn complex feature representations while preserving the spatial resolution of the feature maps.
Next, the convolution results of each feature map are flattened and converted into one-dimensional vectors, and all feature vectors are concatenated into a single representation. This design allows the information from multi-scale feature maps to be effectively integrated, enhancing the model’s ability to represent multi-scale features.
Finally, the concatenated feature vector is passed through two fully connected layers for dimensionality reduction. These layers progressively compress the high-dimensional features into lower dimensions, ultimately outputting five numbers that represent the average values of the variable at five atmospheric pressure levels. The design of the fully connected layers ensures that the model can integrate comprehensive information from different pressure levels and accurately predict atmospheric parameters.
In summary, AuxNet, through the combination of shared convolutional layers, feature flattening and concatenation, and fully connected layers, not only improves computational efficiency but also enhances feature representation, allowing the model to more accurately process and predict atmospheric parameters related to Kármán vortex street detection.

2.8. Training and Optimization of Auxiliary Tasks

In multi-task learning scenarios with auxiliary tasks, the magnitude differences between different physical quantities (such as geopotential, relative humidity, temperature, wind fields, etc.) can be enormous. Some quantities may reach the order of 10 6 (e.g., geopotential), while others are on the order of 10 6 (e.g., specific humidity). Directly adding these loss terms to the primary loss can often lead to the training process being dominated by certain extremely large or small magnitude parameters, resulting in training divergence or convergence difficulties. Therefore, this study first applies z-score normalization to the labels of each auxiliary task, ensuring that their value distributions are approximately in the same range. This helps effectively combine them in the final total loss during training, with weight parameters treated as hyperparameters.
By normalizing the scales, the training process avoids large gradient issues caused by exceptionally large-magnitude loss terms or the neglect of gradients due to very small-magnitude terms. This unified scaling approach ensures that the auxiliary losses in multi-task learning can smoothly participate in the training process, maintaining the overall numerical stability and promoting better convergence of the network.
This research selects five auxiliary variables that contribute significantly in the PFI analysis, and an independent AuxNet network is designed for each variable. These auxiliary task networks are trained concurrently with the YOLOv8s main network, creating a hybrid training multi-task learning framework. The input of each AuxNet network is a multi-scale feature map, and the output is the regional average of the variable at five atmospheric pressure levels (7, 5, H, W), computed by averaging the last two dimensions (H and W) of the feature maps. During the training process, experiments were conducted with different combinations of the five variables, involving 32 possible combinations. Each combination includes the original object detection task trained on the image dataset along with auxiliary task hybrid training. The model’s performance on the Kármán vortex street dataset was analyzed from both engineering and atmospheric science perspectives to verify the effectiveness of the auxiliary tasks.

2.9. Auxiliary Task Experiment Design

In the experimental design, the input to the auxiliary network consists of multi-scale feature maps extracted by the YOLOv8s backbone network. The network processes these feature maps and outputs five values, each representing the regional average of a variable at five atmospheric pressure levels. The experiment involves a comprehensive variable combination test for five key atmospheric physical variables, covering a total of 32 combinations, including the baseline experiment without auxiliary variables (1 combination), single-variable auxiliary tasks (5 combinations), dual-variable auxiliary tasks (10 combinations), triple-variable auxiliary tasks (10 combinations), four-variable auxiliary tasks (5 combinations), and full-variable auxiliary tasks (1 combination).
During training, the auxiliary tasks and the original object detection tasks are trained using a hybrid training strategy, sharing the YOLOv8s backbone network to extract global features, ensuring the collaborative effect of information between the tasks. The performance evaluation metrics include precision, recall, mean average precision at 50% IoU (mAP50), and mean average precision over IoU thresholds ranging from 50% to 95% (mAP50-95), which comprehensively reflect the model’s detection capability and generalization performance. Through this experimental design, the study aims to explore the specific impact of different variable combinations on object detection performance, providing quantitative evidence and optimization directions for future research.

3. Results

3.1. Feature Permutation Importance Analysis Results

The importance of variables is represented by the perm decrease (accuracy drop), calculated using the following formula:
Perm Decrease = Accuracy baseline Accuracy result
where:
  • Accuracy baseline is the accuracy of the baseline model;
  • Accuracy result is the final accuracy after a specific experiment.
The specific results of the experiment are shown in Table 2. Among them, geopotential, specific humidity, northward wind, and eastward wind have relatively large perm decrease values; these significantly affect model performance and are classified as high-contribution variables. Temperature and vertical velocity show similar performance, with comparable importance, and are classified as medium-contribution variables. Relative Humidity has the lowest impact on the model’s performance, making it a low-contribution variable, and it was discarded in subsequent experiments. Eastward wind and northward wind were merged into a new wind speed variable to further optimize the model input and reduce the dimensionality of the variables. Ultimately, the optimized five variables are: geopotential, specific humidity, temperature, wind speed, and vertical velocity. These variables will be used as input features for further verification in subsequent auxiliary task experiments.
The significant impact of these variables on Kármán vortex formation is consistent with established fluid dynamics theories. Geopotential, which represents the atmospheric pressure distribution, directly influences wind speed and direction, thus affecting vortex shedding behind obstacles [38,39]. The changes in wind velocity and the formation of vortex streets are well documented in the literature, with studies showing that variations in pressure gradients lead to significant alterations in airflow, which in turn impacts vortex formation.
Similarly, specific humidity has a marked influence on air density and turbulence characteristics. Increased humidity reduces air density, which alters the flow dynamics and promotes vortex formation. Higher humidity levels are known to increase buoyancy and enhance turbulence, which further influences the intensity and shedding frequency of vortex streets [40,41].
The wind components (northward wind and eastward wind) were merged into a unified wind speed variable for dimensionality reduction, reflecting the critical role of wind velocity in vortex formation. Wind velocity is essential for vortex shedding, as it governs the shear forces that create and stabilize the vortex pattern. As wind speed increases, the vortex shedding frequency also rises, contributing to the formation of Kármán vortex streets [42].
Temperature is another key variable, influencing fluid density and stability. Temperature gradients can lead to buoyancy-driven instabilities in the atmosphere, which play a significant role in the formation and behavior of vortex streets (Pope, 2000) [38,43]. The vertical velocity affects the wake dynamics behind an obstacle, where upward or downward air motion can increase the frequency and intensity of vortex shedding [44,45].
Finally, relative humidity, although a contributing factor to the flow dynamics, showed the smallest impact on model performance, as it primarily influences the viscosity and density of air. While humidity can enhance turbulence in certain conditions, its role in vortex formation is less pronounced compared to the other variables, and, as a result, it was discarded in subsequent experiments [46].

3.2. Auxiliary Function Analysis Results

The evaluation metrics used in the experiment include precision, recall, mAP50 (mean average precision at 50% IOU), and mAP50-95 (mean average precision at IOU thresholds from 50% to 95%). The results are shown in Table 3.
In this study, the training and testing dataset splits were kept consistent across all experiments, with a random seed set to 26. However, it is important to note that using different random seed splits may lead to slight variations in the results presented here. Due to time and cost constraints, sensitivity analysis regarding the impact of random seeds on the results was not conducted in this work.
In this experiment, the YOLOv8s object detection algorithm was optimized by using five auxiliary variables (geopotential, specific humidity, temperature, horizontal wind speed, and vertical air velocity). The experiment covered various settings, including single-variable optimization, multi-variable combinations, and variable removal. Overall, the results show that different auxiliary variables and their combinations had a significant impact on the model’s four performance metrics (precision, recall, mAP50, and mAP50-95).
In the single-variable optimization experiments, specific humidity and temperature performed notably well in recall and mAP50. Specifically, specific humidity reached a recall of 0.81 and mAP50 increased to 0.818, indicating its strong contribution to recall ability in object detection. Horizontal wind speed and vertical air velocity showed a more focused impact on different metrics. For example, horizontal wind speed had a more significant effect on mAP50 (0.802), while vertical air velocity was more effective in improving recall (0.785), though its mAP50-95 performance was weaker, only reaching 0.382. Geopotential, as a single variable, achieved the highest mAP50 of 0.812 among all single-variable experiments, while its precision and recall were relatively balanced, demonstrating its good auxiliary effect in the overall object detection task.
In the two-variable optimization experiments, the combination of variables further demonstrated a stronger complementary effect. In particular, the combination of horizontal wind speed + vertical air velocity achieved the best performance across core metrics like precision, recall, and mAP50. Specifically, mAP50 reached 0.865, with precision and recall at 0.838 and 0.797, respectively, significantly outperforming other two-variable combinations. Additionally, geopotential + horizontal wind speed and specific humidity + temperature also showed good overall performance, reaching mAP50 values of 0.835 and 0.857, but their mAP50-95 performances were slightly weaker, suggesting that these combinations may be more suited for mid- to low-precision object detection scenarios.
In the three-variable combination experiments, performance improvements were even more significant. Notably, the combination of geopotential + specific humidity + temperature achieved a mAP50 of 0.876, with recall increasing to 0.835, indicating excellent overall performance. This suggests that this combination can provide more comprehensive information, helping the model capture more fine-grained target features. However, compared to two-variable combinations, the three-variable combination’s advantage was more prominent in mAP50, while the improvement in mAP50-95 was smaller, indicating limited contribution to high-precision object detection.
The four-variable experiments were conducted by removing one auxiliary variable to analyze the optimization of the four-variable combination. These experiments generally exhibited more stable performance than the single-variable and two-variable setups while avoiding potential redundancy in the full-variable configuration. Among all four-variable combinations, the experiment without specific humidity performed the best, with recall reaching 0.802, mAP50 at 0.828, and mAP50-95 at 0.387. This suggests that while specific humidity performed well in improving single-variable recall, it may have redundancy in multi-variable combinations, with its information partially substituted by other variables such as geopotential and wind speed. Additionally, the combination excluding horizontal wind speed also performed well, with mAP50 reaching 0.831 and recall at 0.81, indicating that the absence of horizontal wind speed had a relatively small impact on overall performance. The combination without geopotential showed moderate improvement in recall but a significant decrease in mAP50 and mAP50-95, especially with mAP50-95 dropping to 0.358. This further confirms the importance of geopotential for high-precision detection tasks. In contrast, when vertical air velocity was excluded, mAP50 and recall slightly decreased, but precision increased to 0.826, indicating that vertical air velocity still contributes to capturing complex target information, albeit with slightly lower importance than the other variables.
The full-variable experiment yielded more average results, with precision and recall at 0.733 and 0.823, respectively, and mAP50 reaching 0.828. While the overall performance was acceptable, it did not show a clear advantage compared to the best variable combinations. This might be due to the excessive number of auxiliary variables introducing some redundant information, which led to decreased efficiency in feature extraction and training. In the variable removal experiments, the impact of excluding different variables varied. For example, removing horizontal wind speed had the least effect on the overall metrics, with the performance closely approaching the best result, while removing geopotential or specific humidity significantly lowered key metrics, further validating the importance of these variables in the optimization task.
Moreover, in this study, the performance of the YOLOv8s model, enhanced with auxiliary tasks was compared with several classical models, including different versions of YOLO (YOLOv8, YOLOv9, YOLOv10, YOLOv11) and RT-DETR. Table 4 provides a comprehensive evaluation of these models across key metrics: precision, recall, mAP50, and mAP50-95.
The key finding of this comparison is that the YOLOv8s model, optimized with auxiliary variables, consistently outperformed traditional models in all major performance metrics. For instance, while YOLOv8s achieved a precision and recall of 0.745, it clearly outperformed simpler versions like YOLOv9t (with a precision of 0.725 and recall of 0.749) and YOLOv9m (precision of 0.711 and recall of 0.753). The mAP50 of YOLOv8s (0.759) also surpassed that of YOLOv9t (0.771) and YOLOv9m (0.740), showing a significant improvement in detecting vortices with greater accuracy.
This suggests that by using auxiliary tasks, it is possible to achieve better performance than classical models, especially in scenarios where model efficiency and accuracy are equally important. The improvements in performance across the metrics of precision, recall, and mAP50 demonstrate the value of including additional environmental factors in the model, enhancing its ability to generalize across various vortex detection tasks. This approach demonstrates that auxiliary tasks are a promising avenue for improving detection performance, even when compared to larger, more complex models like RT-DETR.

3.3. Actual Prediction Results

Upon completion of the training process, the proposed model is capable of performing Kármán vortex detection without the need for additional auxiliary task labels. This indicates that during the training phase, the model effectively learns the necessary features for target detection by incorporating various auxiliary tasks. In the inference phase, the model can independently carry out Kármán vortex detection, directly extracting and recognizing vortex features from the input images.
Figure 7 presents the actual predicted annotations of the Kármán vortex street by the model, reflecting the model’s positioning performance in practical applications. From the detection results, it can be observed that the annotated Kármán vortex street areas are generally accurate in terms of their overall location, indicating that the model can effectively identify regions with vortex street characteristics within cloud layers. Additionally, each annotation box is accompanied by a confidence score (e.g., 0.6, 0.7), which reflects the model’s confidence in predicting the vortex street region and can be used for subsequent filtering or further analysis.
Moreover, some overlapping detection boxes can be observed in the displayed results. This phenomenon may stem from the spatial complexity of vortex street features, especially in the initial stages of vortex street formation or in sparsely distributed regions. In such cases, the model might mistakenly label adjacent features as multiple independent regions. Furthermore, in some detection results, the annotation boxes do not fully encompass all the edge features of the vortex street, likely due to the model’s insufficient sensitivity to small-scale or edge features. This issue may affect the overall detection accuracy, particularly when conducting morphological studies of the vortex street as a whole.
Overall, the model can accurately capture the core features of most Kármán vortex streets, and the annotated results provide valuable practical reference. Future improvements could include optimizing post-processing algorithms to reduce overlapping boxes and enhancing the model’s ability to capture edge features, thereby improving the completeness of vortex street morphology representation.

4. Discussion

4.1. Feature Permutation Importance Analysis Method

Through the permutation feature importance (PFI) analysis, this study systematically evaluated the contribution of various atmospheric variables to the Kármán vortex street detection task, providing clear directions for variable selection and combination in subsequent experiments. The results indicate that the selection and combination of atmospheric variables play a critical role in optimizing model performance, especially in improving detection accuracy and reducing computational complexity.
  • Identification of High-Contribution Variables: The results show that geopotential, specific humidity, east-west wind speed, and north-south wind speed have a significant impact on model performance, exhibiting high importance. Specifically, geopotential and specific humidity reflect the key driving forces of atmospheric dynamics and humidity on Kármán vortex street formation, while east-west wind speed and north-south wind speed also demonstrate strong spatial flow characteristics. Therefore, these variables are classified as high-contribution variables and have an essential role in the model.
  • Exclusion and Simplification of Low-Contribution Variables: In contrast, relative humidity had a minimal impact on model performance, with its feature importance value being only 0.0465, far lower than other variables. Therefore, relative humidity was deemed to contribute little to Kármán vortex street detection and was excluded after analysis. This conclusion aligns with the principle of model optimization, as removing low-contribution variables avoids interference from redundant features, reduces computational complexity, and enhances model training and prediction efficiency.
  • Variable Merging and Optimization: In the analysis of the influence of multiple wind speed variables, east-west wind speed and north-south wind speed exhibited similar importance, with values of 0.0851 and 0.1014, respectively. Considering that these two variables provide similar physical information and their combination had nearly the same effect on model performance, they were merged into a single wind speed variable. This merging strategy not only simplified the model’s input features but also retained core information, reduced unnecessary redundancy, and improved computational efficiency.
  • Optimized Variable Combination: Based on the above analysis, the five optimized variables selected are: geopotential, specific humidity, temperature, wind speed, and vertical velocity. This combination fully considers the importance and physical significance of each variable, while reducing the input feature dimension and maintaining detection accuracy, thus providing more precise and efficient feature input for subsequent auxiliary task experiments.
  • Effectiveness of Model Optimization and Deep Learning Integration: Through feature importance analysis and variable optimization, this study not only successfully improved the model performance for Kármán vortex street detection but also effectively integrated physical parameters with deep learning techniques. By rationally selecting and merging variables, the study achieved improved model accuracy and robustness without increasing computational complexity. The optimized variable combination provides a more effective feature foundation for subsequent experiments and further demonstrates the effectiveness of combining physical knowledge with machine learning technologies.
This study systematically identified the contributions of various atmospheric variables to the Kármán vortex street detection task using permutation feature importance analysis, significantly enhancing model performance through optimized variable combinations. The exclusion of low-contribution variables and merging of related variables effectively reduced the model’s input dimension, alleviated computational burden, and improved detection accuracy and generalization capability. The final selection of five optimized variables not only holds high physical significance but also provides more precise feature support for future research and applications. This process demonstrates how scientific feature selection, combined with deep learning methods, can offer new technical pathways and insights for the automated detection of complex meteorological phenomena.

4.2. Analysis of Optimal Variable Combinations

This paper experimentally verifies the impact of different combinations of fluid dynamics features on model performance, with a focus on the roles of horizontal wind speed, vertical air flow, and precise humidity in object detection. Specifically, the combination of horizontal wind speed and vertical air flow, as well as the four-variable combination excluding precise humidity, exhibit excellent performance across multiple metrics, demonstrating their potential in improving model robustness and accuracy. The following presents the detailed analysis results.
  • Advantages of the Horizontal Wind Speed and Vertical Air Flow Combination: The combination of horizontal wind speed and vertical air flow demonstrates significant advantages. Horizontal wind speed captures shear flow and surface flow field characteristics in the target area, while vertical air flow provides complementary information on vertical movement disturbances in the troposphere. Together, they offer comprehensive three-dimensional fluid dynamics features, which are crucial for capturing target details. In terms of mAP50-95, this combination significantly outperforms others, showcasing its ability to enhance object detection accuracy in complex backgrounds, particularly in capturing fine-grained details.
  • Comparison Analysis of Other Combinations: Although other dual-variable and three-variable combinations perform similarly in certain metrics, they fail to achieve optimal performance in both mAP50 and mAP50-95. For example, the combination of potential, precise humidity, and air temperature performs well in recall (0.835) but has lower precision and mAP50-95 values (0.402 and 0.402, respectively), failing to provide comprehensive high-precision detection performance. In contrast, the combination of horizontal wind speed and vertical air flow shows balanced performance across all metrics, making it especially suitable for high-precision object detection in practical applications.
  • Four-Variable Combination Experimental Results: In the four-variable experiments, the combination excluding precise humidity demonstrates balanced and superior performance. This combination achieves a recall of 0.802, mAP50 of 0.828, and mAP50-95 of 0.387. Compared to other four-variable combinations, it stands out in high-precision detection tasks. The results suggest that while precise humidity contributes to the model, its redundancy is relatively high, and it can be partially replaced by other variables in a multi-variable optimization scenario to improve performance.

5. Conclusions

In conclusion, the dual-variable combination of horizontal wind speed and vertical air flow, as well as the four-variable combination excluding precise humidity, were identified as the most effective setups for Kármán vortex street detection. These findings hold significant practical implications for real-world meteorological applications. By optimizing the selection of fluid dynamic variables, this study contributes to improving the accuracy and computational efficiency of automated vortex detection models, which is crucial for aviation safety, climate research, and early warning systems. The reduction in feature dimensionality enhances real-time processing feasibility, making it more practical for large-scale atmospheric monitoring and satellite-based AI forecasting systems. These results underscore the value of integrating domain knowledge with deep learning to advance the automated detection of complex meteorological phenomena.

6. Prospects

  • Variable Selection and Dynamic Weight Optimization: Experimental results show that different auxiliary variables significantly impact object detection performance, and some variables may exhibit redundancy in certain combinations. Future work could explore dynamic variable selection strategies, such as attention mechanisms or feature importance evaluation methods, to dynamically determine the contribution of key variables. Furthermore, adaptive weight optimization for auxiliary task losses can automatically adjust the importance of each task during training, thereby improving the model’s stability and convergence speed.
  • Expanding Physical Parameters and Multi-Task Learning: In addition to the five variables currently used, future work could attempt to introduce more physical parameters, such as cloud characteristics, precipitation rate, or turbulence intensity, to provide richer contextual information for object detection. At the same time, a multi-task learning framework could be constructed, combining object detection with auxiliary variable prediction tasks. By sharing feature representations, the model performance could be enhanced. For instance, temperature gradients or flow field characteristics could serve as intermediate supervision signals to further optimize detection results.
  • Cross-Domain and Temporal Dynamics Research: The existing results can be further extended to different domains, such as higher-resolution satellite data or ground-based observation scenarios, while also incorporating temporal dynamics (e.g., temporal variations of variables) to enhance the model’s adaptability to dynamic scenes. Verifying these methods across different geographical regions, atmospheric conditions, or time scales could increase their practical application value, especially in complex climate and weather monitoring.
  • Data Augmentation and Simulation Validation: Using data augmentation and simulation techniques to generate scenes with diverse physical parameter distributions can provide the model with broader testing conditions. Meanwhile, by combining physical simulations with data-driven methods, the generated synthetic data can reduce reliance on labeled data, offering crucial support for performance validation in extreme or rare scenarios. This hybrid approach helps further enhance the robustness and application potential of detection systems.

Author Contributions

Conceptualization, D.C. and Y.Z. (Yihan Zhang); methodology, Y.Z. (Yihan Zhang); software, Y.Z. (Yihan Zhang); validation, Y.Z. (Yihan Zhang); formal analysis, Y.Z. (Yihan Zhang); investigation, Y.Z. (Yihan Zhang); resources, Y.Z. (Yihan Zhang); data curation, Y.Z. (Yihan Zhang) and C.W.; writing—original draft preparation, Y.Z. (Yihan Zhang) and Z.Z.; writing—review and editing, Y.Z. (Yihan Zhang), Z.Z., Q.S., and Y.Z. (Yuqi Zhang); visualization, Z.Z. and Y.Z. (Yihan Zhang); supervision, D.C.; project administration, D.C. and Y.Z. (Yihan Zhang); funding acquisition, D.C. All authors have read and agreed to the published version of the manuscript.

Funding

This research was funded by Institute for Ocean Engineering, Shenzhen International Graduate School, Tsinghua University.

Data Availability Statement

The data used to support the findings of this study are available from the corresponding author upon request. This study utilizes a custom dataset developed by our research team, focusing on Kármán vortex street detection. This dataset includes annotated satellite imagery and atmospheric parameters, and detailed information will be provided in an upcoming publication.

Conflicts of Interest

All the authors declare that the research was conducted in the absence of any commercial or financial relationships that could be construed as a potential conflict of interest.

References

  1. Chopra, K.P.; Hubert, L.F. Karman vortex-streets in Earth’s atmosphere. Nature 1964, 203, 1341–1343. [Google Scholar] [CrossRef]
  2. Wille, R. Karman vortex streets. Adv. Appl. Mech. 1960, 6, 273–287. [Google Scholar]
  3. Horváth, Á.; Koltai, J.; Lemaitre, M.; Janjic, T.; Bony, S. Evolution of an atmospheric Kármán vortex street from high-resolution satellite winds: Guadalupe Island case study. J. Geophys. Res. Atmos. 2020, 125, e2019JD032121. [Google Scholar] [CrossRef]
  4. Ito, J.; Niino, H. Atmospheric Kármán vortex shedding from Jeju island, East China Sea: A numerical study. Mon. Weather. Rev. 2016, 144, 139–148. [Google Scholar] [CrossRef]
  5. Li, X.; Zhang, X.; Pichel, W.G.; Clemente-Colón, P. A SAR observation and numerical study on ocean surface imprints of atmospheric vortex streets. Sensors 2008, 8, 3321–3334. [Google Scholar] [CrossRef] [PubMed]
  6. Thomson, R.E.; Gower, J.F.R.; Bowker, N.W. Vortex streets in the wake of the Aleutian Islands. Mon. Weather. Rev. 1977, 105, 873–884. [Google Scholar] [CrossRef]
  7. Abernathy, F.H.; Kronauer, R.E. The formation of vortex streets. J. Fluid Mech. 1962, 13, 1–20. [Google Scholar] [CrossRef]
  8. LeCun, Y.; Bengio, Y.; Hinton, G. Deep learning. Nature 2015, 521, 436–444. [Google Scholar] [CrossRef]
  9. Reichstein, M.; Camps-Valls, G.; Stevens, B.; Jung, M.; Denzler, J.; Carvalhais, N.; Prabhat, F. Deep learning and process understanding for data-driven Earth system science. Nature 2019, 566, 195–204. [Google Scholar] [CrossRef]
  10. Kuma, P.; Labbouz, L.; Brandenburg, D.; Eyring, V.; Shaposhnikov, D.; Trepte, C.R. Machine learning of cloud types in satellite observations and climate models. Atmos. Chem. Phys. 2023, 23, 523–549. [Google Scholar] [CrossRef]
  11. Chapman, W.E.; Robertson, F.R.; Jacobson, T.S.; Dolwick, J.S. Improving atmospheric river forecasts with machine learning. Geophys. Res. Lett. 2019, 46, 10627–10635. [Google Scholar] [CrossRef]
  12. King, M.D.; Tsay, S.C.; Platnick, S.; Wang, M.; Liou, K.N. Remote sensing of liquid water and ice cloud optical thickness and effective radius in the Arctic: Application of airborne multispectral MAS data. J. Atmos. Ocean. Technol. 2004, 21, 857–875. [Google Scholar] [CrossRef]
  13. King, M.D.; Kaufman, Y.J.; Menzel, W.P.; Tanré, D. Cloud and aerosol properties, precipitable water, and profiles of temperature and water vapor from MODIS. IEEE Trans. Geosci. Remote. Sens. 2003, 41, 442–458. [Google Scholar] [CrossRef]
  14. Platnick, S.; King, M.D.; Meyer, K.G.; Tanré, D.; Gleason, J.J.; Hutchison, K. The MODIS cloud products: Algorithms and examples from Terra. IEEE Trans. Geosci. Remote. Sens. 2003, 41, 459–473. [Google Scholar] [CrossRef]
  15. Ham, Y.G.; Kim, J.H.; Luo, J.J. Deep learning for multi-year ENSO forecasts. Nature 2019, 573, 568–572. [Google Scholar] [CrossRef]
  16. Nunalee, C.G. A Dynamical Characterization of Atmospheric von Kármán Vortex Streets Induced by Bluff Topography. Ph.D. Thesis, North Carolina State University, Raleigh, NC, USA, 2015. [Google Scholar]
  17. Nunalee, C.G.; Basu, S. On the periodicity of atmospheric von Kármán vortex streets. Environ. Fluid Mech. 2014, 14, 1335–1355. [Google Scholar] [CrossRef]
  18. Stegner, A.; Pichon, T.; Beunier, M. Elliptical-inertial instability of rotating Karman vortex streets. Phys. Fluids 2005, 17, 066601. [Google Scholar] [CrossRef]
  19. Beggs, P.J.; Selkirk, P.M.; Kingdom, D.L. Identification of Von Kármán vortices in the surface winds of Heard Island. Bound.-Layer Meteorol. 2004, 113, 287–297. [Google Scholar] [CrossRef]
  20. Heinze, R.; Raasch, S.; Etling, D. The structure of Kármán vortex streets in the atmospheric boundary layer derived from large eddy simulation. Meteorol. Z. 2012, 21, 1–14. [Google Scholar] [CrossRef]
  21. Nardecchia, F.; Mattoni, B.; Burattini, C.; Bisegna, F. The impact of humidity on vortex creation around isolated buildings. Build. Res. Inf. 2020, 48, 551–571. [Google Scholar] [CrossRef]
  22. Chen, J.G.; Zhou, Y.; Antonia, R.A.; Zhou, T.M. The turbulent Kármán vortex. J. Fluid Mech. 2019, 871, 92–112. [Google Scholar] [CrossRef]
  23. Jocher, G.; Qiu, J.; Ultralytics Team. YOLOv8: A New Approach to Real-Time Object Detection. Ultralytics. 2023. Available online: https://github.com/ultralytics/yolov8 (accessed on 2 February 2025).
  24. Jocher, G.; Qiu, J. Ultralytics YOLO11. Ultralytics. 2024. Available online: https://github.com/ultralytics/ultralytics (accessed on 2 February 2025).
  25. NASA. MOD021KM: MODIS/Terra Level 1B Calibrated Radiances, Version 6. Distributed by NASA’s LAADS DAAC. 2024. Available online: https://ladsweb.modaps.eosdis.nasa.gov/ (accessed on 21 January 2025).
  26. NASA. MODIS (Moderate Resolution Imaging Spectroradiometer): Specifications. Available online: https://modis.gsfc.nasa.gov/about/specifications.php (accessed on 3 February 2025).
  27. Tzutalin. Tzutalin/Labelimg: LabelImg Is a Graphical Image Annotation Tool and Label Object Bounding Boxes in Images. GitHub Repository 2015. Available online: https://github.com/tzutalin/labelImg (accessed on 2 February 2025).
  28. Hersbach, H.; Bell, B.; Berrisford, P.; Hirahara, S.; Horányi, A.; Muñoz-Sabater, J.; Nicolas, J.; Peubey, C.; Radu, R.; Schepers, D.; et al. The ERA5 Global Reanalysis. Q. J. R. Meteorol. Soc. 2020, 146, 1999–2049. [Google Scholar] [CrossRef]
  29. Riley, J.J.; Lelong, M.-P. Fluid motions in the presence of strong stable stratification. Annu. Rev. Fluid Mech. 2000, 32, 613–657. [Google Scholar] [CrossRef]
  30. Tritton, D.J. Physical Fluid Dynamics; Springer Science & Business Media: Berlin, Germany, 2012. [Google Scholar]
  31. Etling, D. On atmospheric vortex streets in the wake of large islands. Meteorol. Atmos. Phys. 1989, 41, 157–164. [Google Scholar] [CrossRef]
  32. Chung, Y.S.; Kim, H.S. Mountain-generated vortex streets over the Korea South Sea. Int. J. Remote. Sens. 2008, 29, 867–877. [Google Scholar] [CrossRef]
  33. Etling, D. An unusual atmospheric vortex street. Environ. Fluid Mech. 2019, 19, 1379–1391. [Google Scholar] [CrossRef]
  34. Liu, Q.; Wu, Z.; Tan, Z.-M.; Yang, F.; Fu, C. The Atmospheric Vortex Streets and Their Impact on Precipitation in the Wake of the Tibetan Plateau. Atmosphere 2023, 14, 1096. [Google Scholar] [CrossRef]
  35. Altmann, A.; Toloşi, L.; Sander, O.; Lengauer, T. Permutation importance: A corrected feature importance measure. Bioinformatics 2010, 26, 1340–1347. [Google Scholar] [CrossRef]
  36. Fisher, A.; Rudin, C.; Dominici, F. All models are wrong, but many are useful: Learning a variable’s importance by studying an entire class of prediction models simultaneously. J. Mach. Learn. Res. 2019, 20, 1–81. [Google Scholar]
  37. Ultralytics. Yolov8 anchor-free bounding box prediction—Issue 189. GitHub 2023. Available online: https://github.com/ultralytics/ultralytics/issues/189 (accessed on 2 February 2025).
  38. Holton, J.R.; Hakim, G.J. An Introduction to Dynamic Meteorology; Academic Press: Cambridge, CA, USA, 2013; Volume 88. [Google Scholar]
  39. Pedlosky, J. Geophysical Fluid Dynamics; Springer Science & Business Media: Berlin, Germany, 2013. [Google Scholar]
  40. Wallace, J.M.; Hobbs, P.V. Atmospheric Science: An Introductory Survey; Elsevier: London, UK, 2006; Volume 92. [Google Scholar]
  41. Emanuel, K.A. Atmospheric Convection; Oxford University Press: London, UK, 1994. [Google Scholar]
  42. Batchelor, G.K. An Introduction to Fluid Dynamics; Cambridge University Press: London, UK, 2000. [Google Scholar]
  43. Stull, R.B. An Introduction to Boundary Layer Meteorology; Springer Science & Business Media: Berlin, Germany, 2012; Volume 13. [Google Scholar]
  44. Banta, R.M.; Schaaf, C.B.; Hardesty, R.M. Mountain waves and downslope winds. In Atmospheric Processes over Complex Terrain; Springer: Berlin, Germany, 1990; pp. 59–81. [Google Scholar]
  45. Smith, R.B. The influence of mountains on the atmosphere. In Advances in Geophysics; Elsevier: London, UK, 1979; Volume 21, pp. 87–230. [Google Scholar]
  46. Yau, M.K.; Rogers, R.R. A Short Course in Cloud Physics; Elsevier: London, UK, 1996. [Google Scholar]
Figure 1. Imagery dataset examples: (a) atmospheric Kármán vortex streets observed southwest of the Cape Verde Islands in January 2007; (b) atmospheric Kármán vortex streets observed southeast of Guadalupe Island in October 2007; (c) atmospheric Kármán vortex streets observed southwest of the Canary Islands in April 2007; (d) atmospheric Kármán vortex streets observed southeast of Jeju Island in March 2007.
Atmosphere 16 00338 g001
Figure 2. Atmospheric parameter feature importance analysis.
Atmosphere 16 00338 g002
Figure 3. ATNet network architecture.
Atmosphere 16 00338 g003
Figure 4. Network structure of YOLOv8s [37].
Atmosphere 16 00338 g004
Figure 5. Auxiliary task.
Atmosphere 16 00338 g005
Figure 6. Network structure of AuxNet.
Atmosphere 16 00338 g006
Figure 7. The model’s actual prediction labels for the Kármán vortex streets on four islands reflect the model’s localization performance in practical applications.
Atmosphere 16 00338 g007
Table 1. Geographical and contextual information of selected islands.
IslandLocationRegionNotable Features
Jeju Island33.50° N, 126.53° ERepublic of KoreaVolcanic island and strong winds.
Canary Islands28.12° N, 15.43° WAtlantic Ocean (Spain)Subtropical climate, trade winds influence.
Cape Verde15.12° N, 23.61° WAtlantic Ocean (West Africa)Arid climate, Sahara dust influence.
Guadalupe Island29.03° N, 118.27° WPacific Ocean (Mexico)Arid climate, located in upwelling zones.
Table 2. Permutation decrease (accuracy drop) for different variables.
Variable NamePerm Decrease (Accuracy Drop)
Geopotential0.1029
Specific Humidity0.1015
Northward Wind0.1014
Eastward Wind0.0851
Temperature0.0753
Vertical Velocity0.0753
Relative Humidity0.0465
Table 3. Evaluation metrics for different experiment scenarios.
Experiment NamePrecisionRecallmAP50mAP50-95
No Auxiliary Variables0.7450.7450.7590.372
Geopotential0.764 (+1.9%)0.738 (−0.7%)0.812 (+5.3%)0.371 (−0.1%)
Specific Humidity0.763 (+1.8%)0.810 (+6.5%)0.818 (+5.9%)0.364 (−0.8%)
Temperature0.764 (+1.9%)0.738 (−0.7%)0.812 (+5.3%)0.361 (−1.1%)
Horizontal Wind Speed0.755 (+1.0%)0.748 (+0.3%)0.802 (+4.3%)0.359 (−1.3%)
Vertical Velocity0.725 (−2.0%)0.785 (+4.0%)0.795 (+3.6%)0.382 (+1.0%)
Geopotential + Specific Humidity0.762 (+1.7%)0.771 (+2.6%)0.806 (+4.7%)0.358 (−1.4%)
Geopotential + Temperature0.711 (−3.4%)0.873 (+12.8%)0.833 (+7.4%)0.365 (−0.7%)
Geopotential + Horizontal Wind Speed0.790 (+4.5%)0.808 (+6.3%)0.835 (+7.6%)0.404 (+3.2%)
Geopotential + Vertical Velocity0.803 (+5.8%)0.772 (+2.7%)0.839 (+8.0%)0.360 (−1.2%)
Specific Humidity + Temperature0.721 (−2.4%)0.835 (+9.0%)0.857 (+9.8%)0.388 (+1.6%)
Specific Humidity + Horizontal Wind Speed0.744 (−0.1%)0.810 (+6.5%)0.831 (+7.2%)0.377 (+0.5%)
Specific Humidity + Vertical Velocity0.688 (−5.7%)0.797 (+5.2%)0.763 (+0.4%)0.332 (−4.0%)
Temperature + Horizontal Wind Speed0.744 (−0.1%)0.810 (+6.5%)0.831 (+7.2%)0.377 (+0.5%)
Temperature + Vertical Velocity0.756 (+1.1%)0.745 (+0.0%)0.749 (−1.0%)0.346 (−2.6%)
Horizontal Wind Speed + Vertical Velocity0.838 (+9.3%)0.797 (+5.2%)0.865 (+10.6%)0.413 (+4.1%)
Geopotential + Specific Humidity + Temperature0.755 (+1.0%)0.835 (+9.0%)0.876 (+11.7%)0.402 (+3.0%)
Geopotential + Specific Humidity + Horizontal Wind Speed0.744 (−0.1%)0.810 (+6.5%)0.831 (+7.2%)0.377 (+0.5%)
Geopotential + Specific Humidity + Vertical Velocity0.755 (+1.0%)0.803 (+5.8%)0.811 (+5.2%)0.378 (+0.6%)
Geopotential + Temperature + Horizontal Wind Speed0.729 (−1.6%)0.771 (+2.6%)0.770 (+1.1%)0.368 (−0.4%)
Geopotential + Temperature + Vertical Velocity0.854 (+10.9%)0.772 (+2.7%)0.851 (+9.2%)0.351 (−2.1%)
Geopotential + Horizontal Wind Speed + Vertical Velocity0.748 (+0.3%)0.801 (+5.6%)0.832 (+7.3%)0.373 (+0.1%)
Specific Humidity + Temperature + Horizontal Wind Speed0.826 (+8.1%)0.721 (−2.4%)0.768 (+0.9%)0.373 (+0.1%)
Specific Humidity + Temperature + Vertical Velocity0.787 (+4.2%)0.734 (−1.1%)0.799 (+4.0%)0.367 (−0.5%)
Specific Humidity + Horizontal Wind Speed + Vertical Velocity0.759 (+1.4%)0.709 (−3.6%)0.790 (+3.1%)0.358 (−1.4%)
Temperature + Horizontal Wind Speed + Vertical Velocity0.804 (+5.9%)0.759 (+1.4%)0.843 (+8.4%)0.376 (+0.4%)
Excluding Geopotential0.797 (+5.2%)0.747 (+0.2%)0.810 (+5.1%)0.358 (−1.4%)
Excluding Specific Humidity0.725 (−2.0%)0.802 (+5.7%)0.828 (+6.9%)0.387 (+1.5%)
Excluding Temperature0.758 (+1.3%)0.754 (+0.9%)0.821 (+6.2%)0.379 (+0.7%)
Excluding Horizontal Wind Speed0.744 (−0.1%)0.810 (+6.5%)0.831 (+7.2%)0.377 (+0.5%)
Excluding Vertical Velocity0.826 (+8.1%)0.727 (−1.8%)0.795 (+3.6%)0.370 (−0.2%)
All Variables0.833 (+8.8%)0.823 (+7.8%)0.828 (+6.9%)0.372 (+0.0%)
Table 4. Performance on classical models.
AlgorithmsParams (M)PrecisionRecallmAP50mAP50-95
YOLOv8s11.20.7450.7450.7590.372
YOLOv8m25.90.7910.7110.7810.357
YOLOv9t2.00.7250.7490.7710.345
YOLOv9m20.10.7110.7530.7400.341
YOLOv9c25.50.7240.7700.7690.354
YOLOv10s7.20.7330.6700.7370.342
YOLOv10m15.40.7390.6920.7420.351
YOLOv11n2.60.7160.7250.7620.343
YOLOv11s9.40.7000.7320.7590.349
YOLOv11m20.10.7310.7940.7940.361
RT-DETR Large42.30.8090.8290.8400.405
Disclaimer/Publisher’s Note: The statements, opinions and data contained in all publications are solely those of the individual author(s) and contributor(s) and not of MDPI and/or the editor(s). MDPI and/or the editor(s) disclaim responsibility for any injury to people or property resulting from any ideas, methods, instructions or products referred to in the content.

