

Vegetation Dynamics and Response to Climate Change in Yarlung Tsangpo River Basin During 1981–2020

 , ,
, , 
Abstract
1. Introduction
2. Materials and Methods
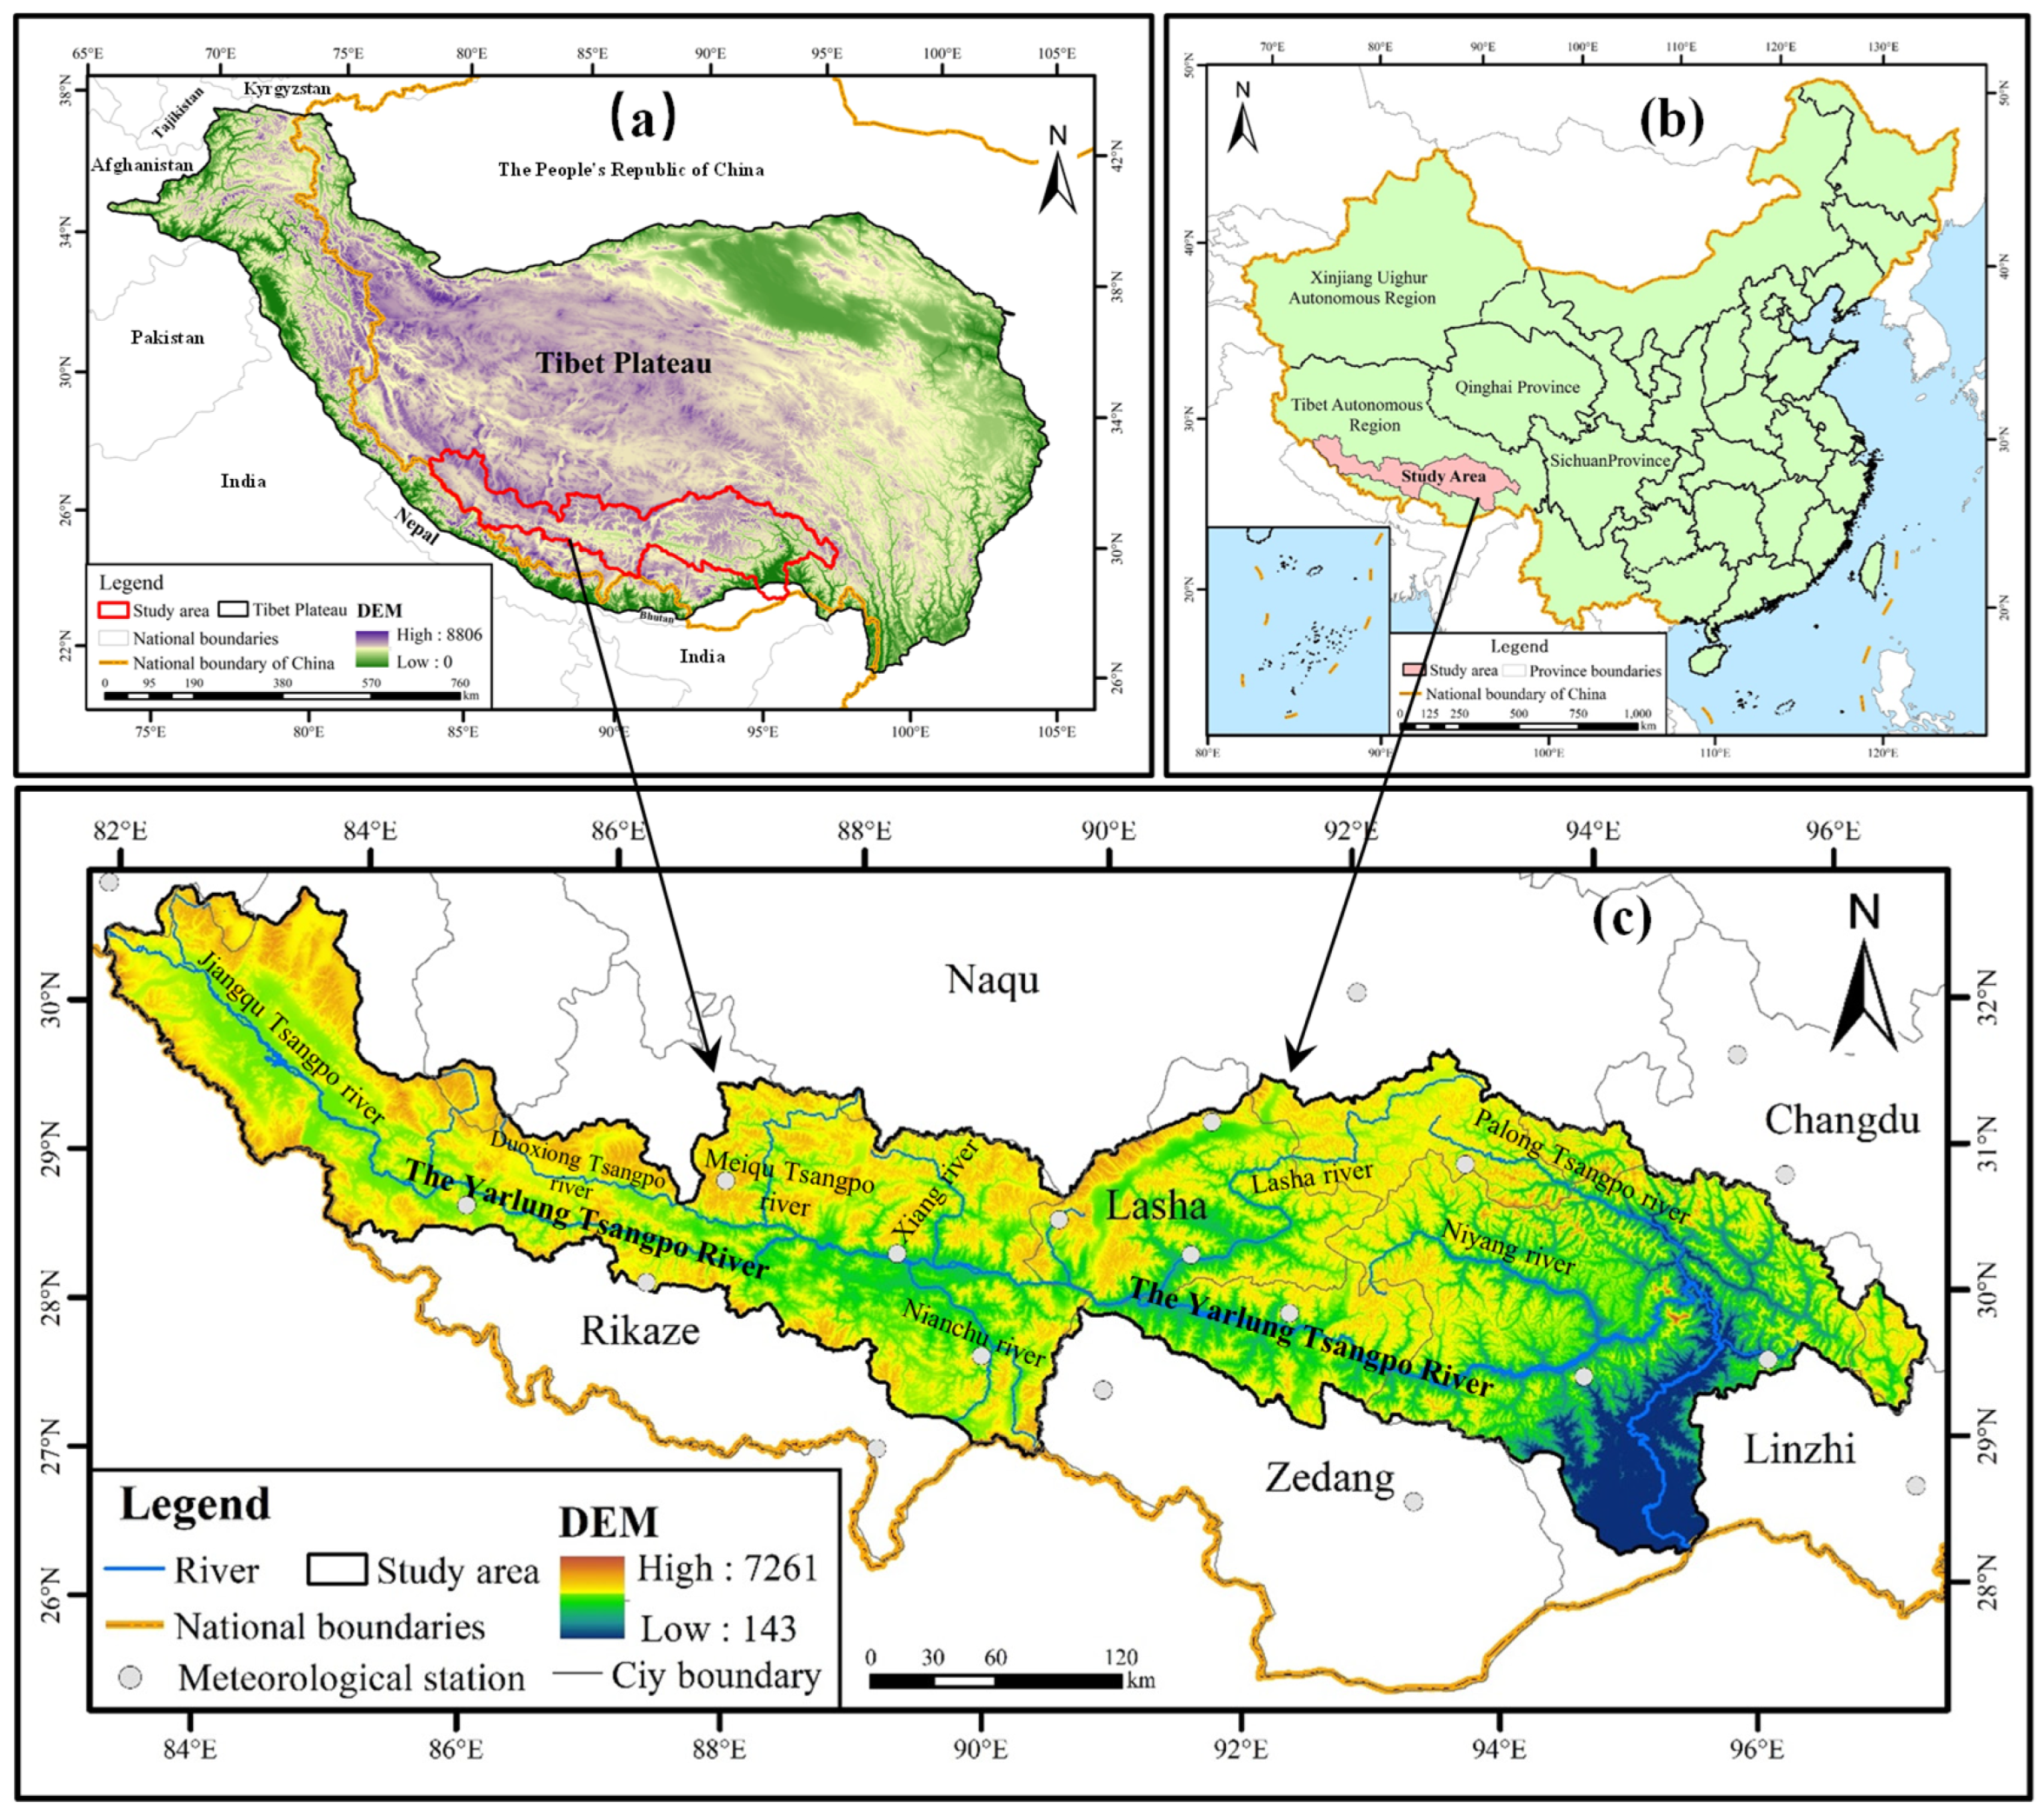
2.1. Study Site
2.2. Data Source
2.3. Calculation Methods of Vegetation and Meteorological Indicators
2.3.1. Climate Variables and NDVI Data Preprocessing
2.3.2. Calculation of AET
2.3.3. Calculation of FVC
2.4. Analysis Methods of Trend Characteristics
2.4.1. Trend Analysis Methods
2.4.2. Single Correlation Analysis Methods
2.4.3. Partial Correlation Analysis Methods
2.4.4. Complex Correlation Analysis Methods
3. Results
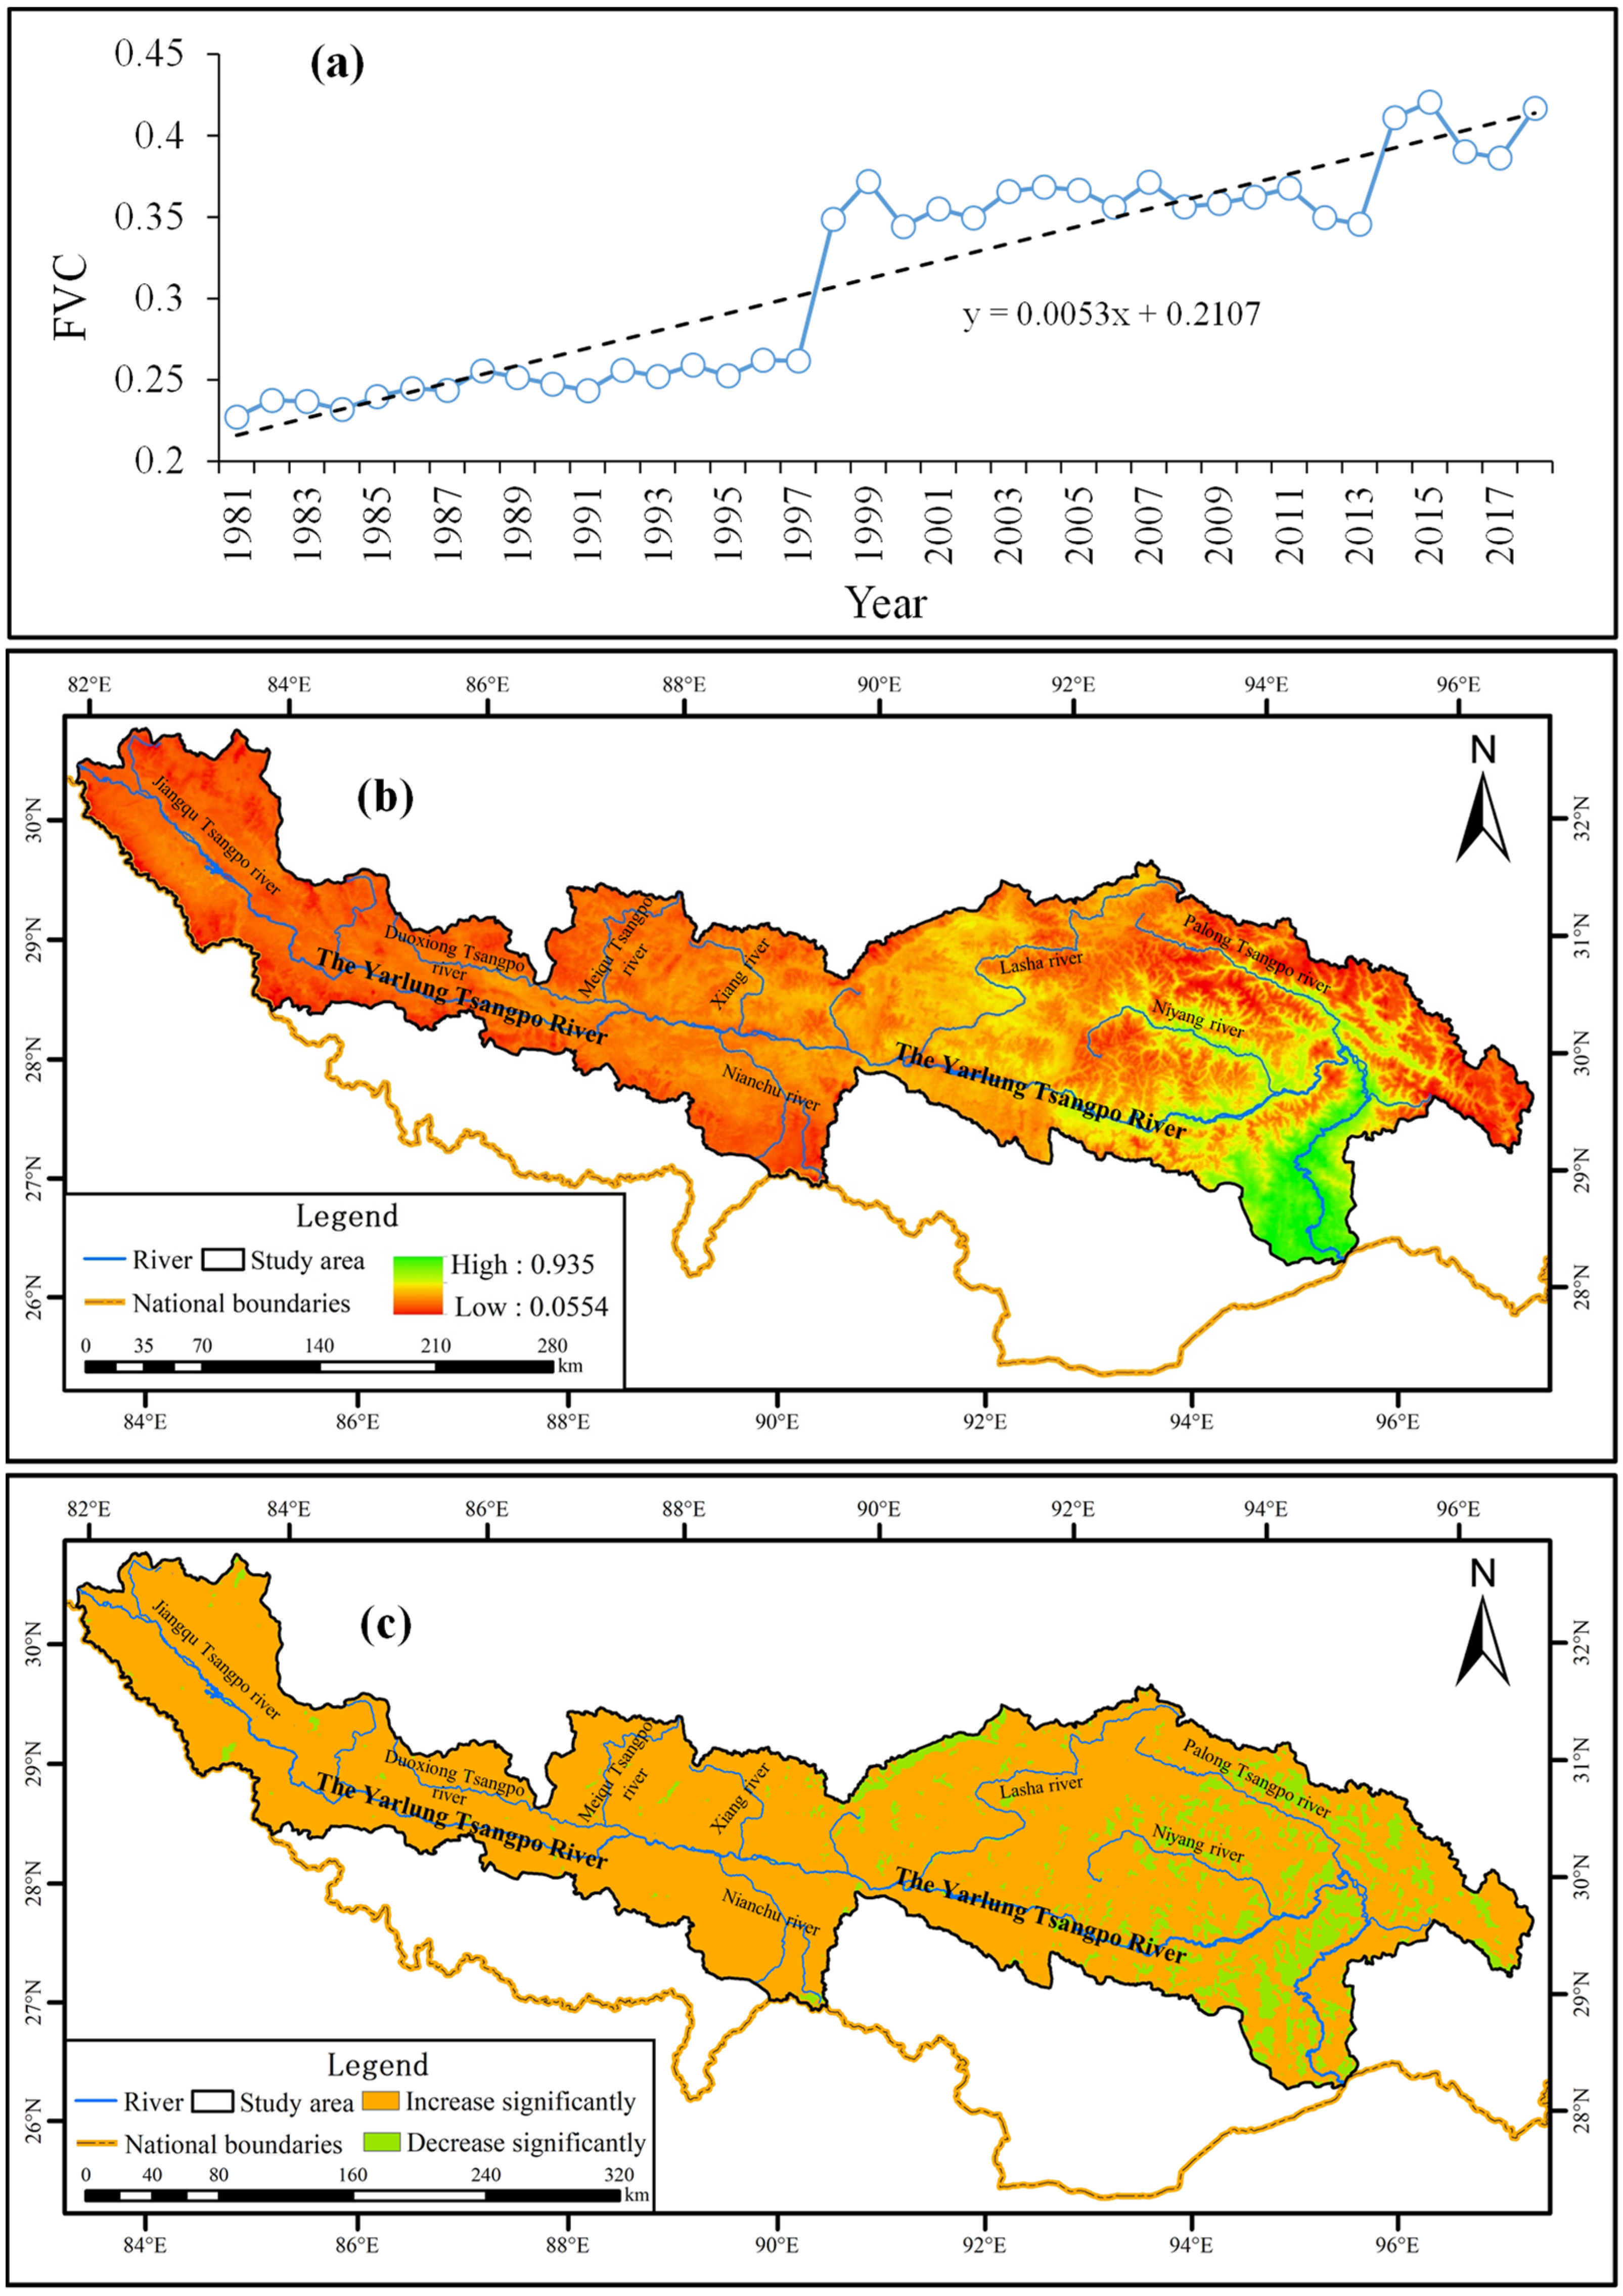
3.1. Characteristics of Vegetation Dynamics in the YTRB
3.2. Characteristics of Climate Variables in the YTRB
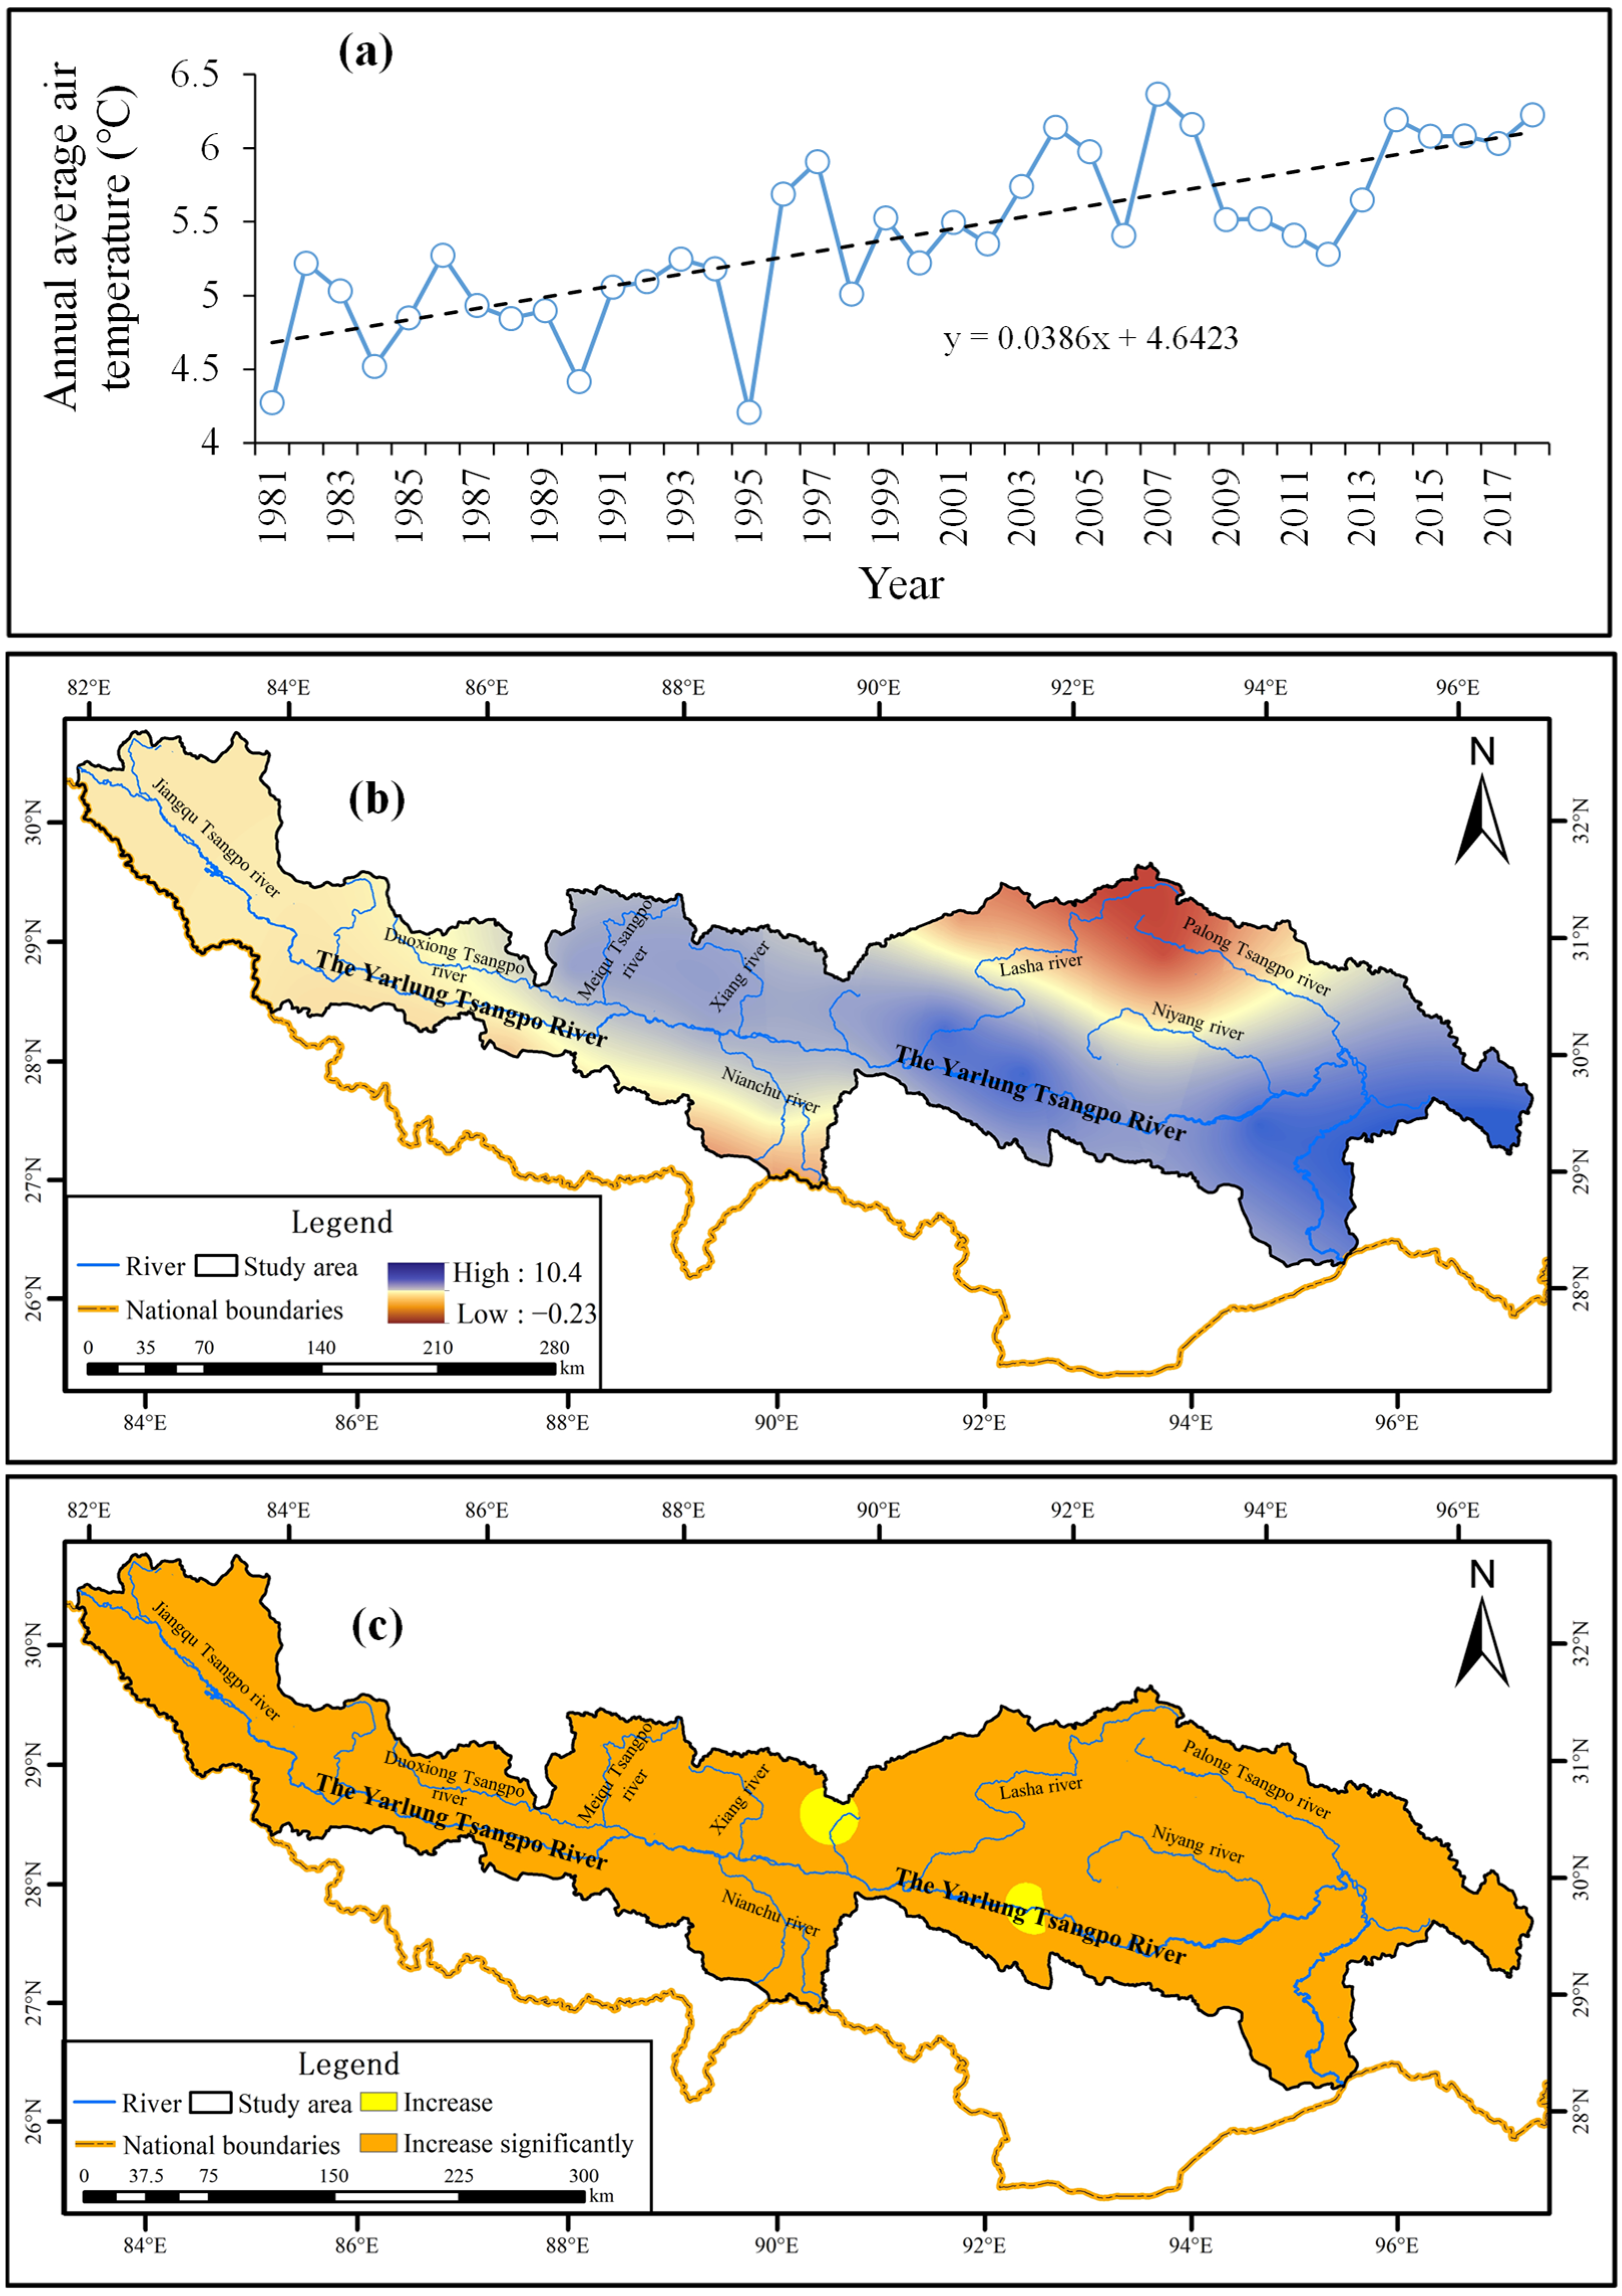
3.2.1. ATEM
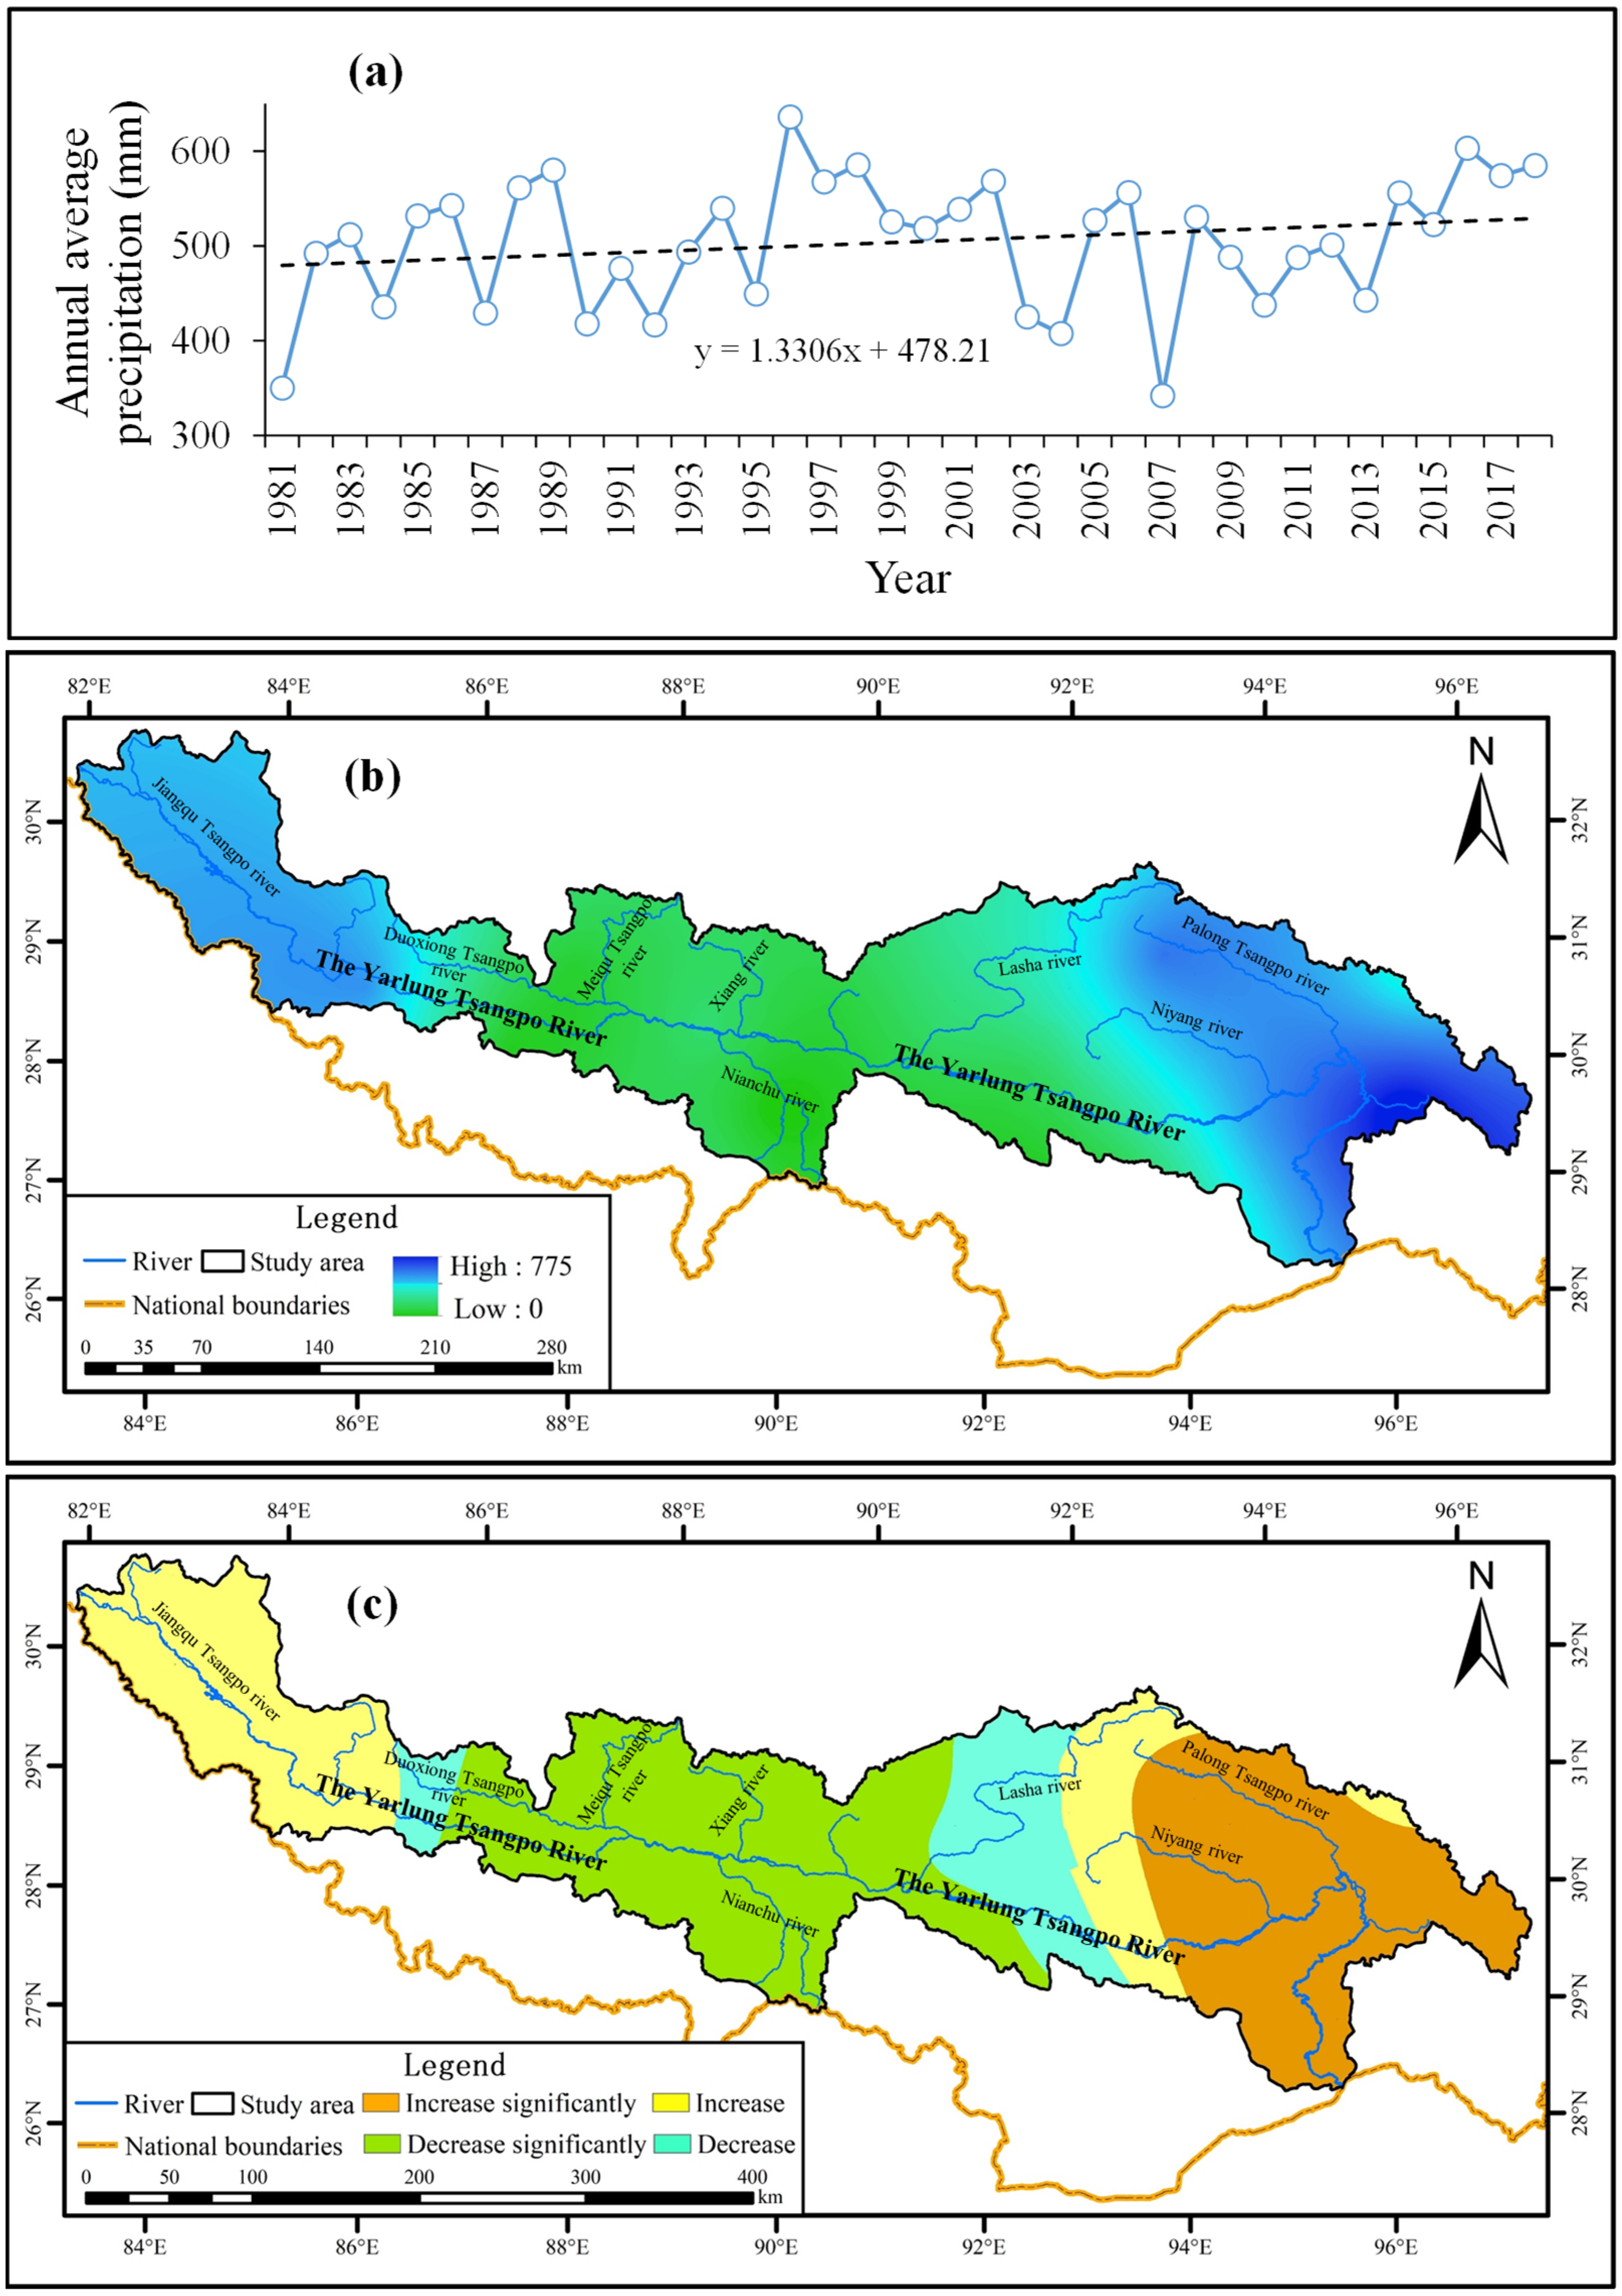
3.2.2. PRE
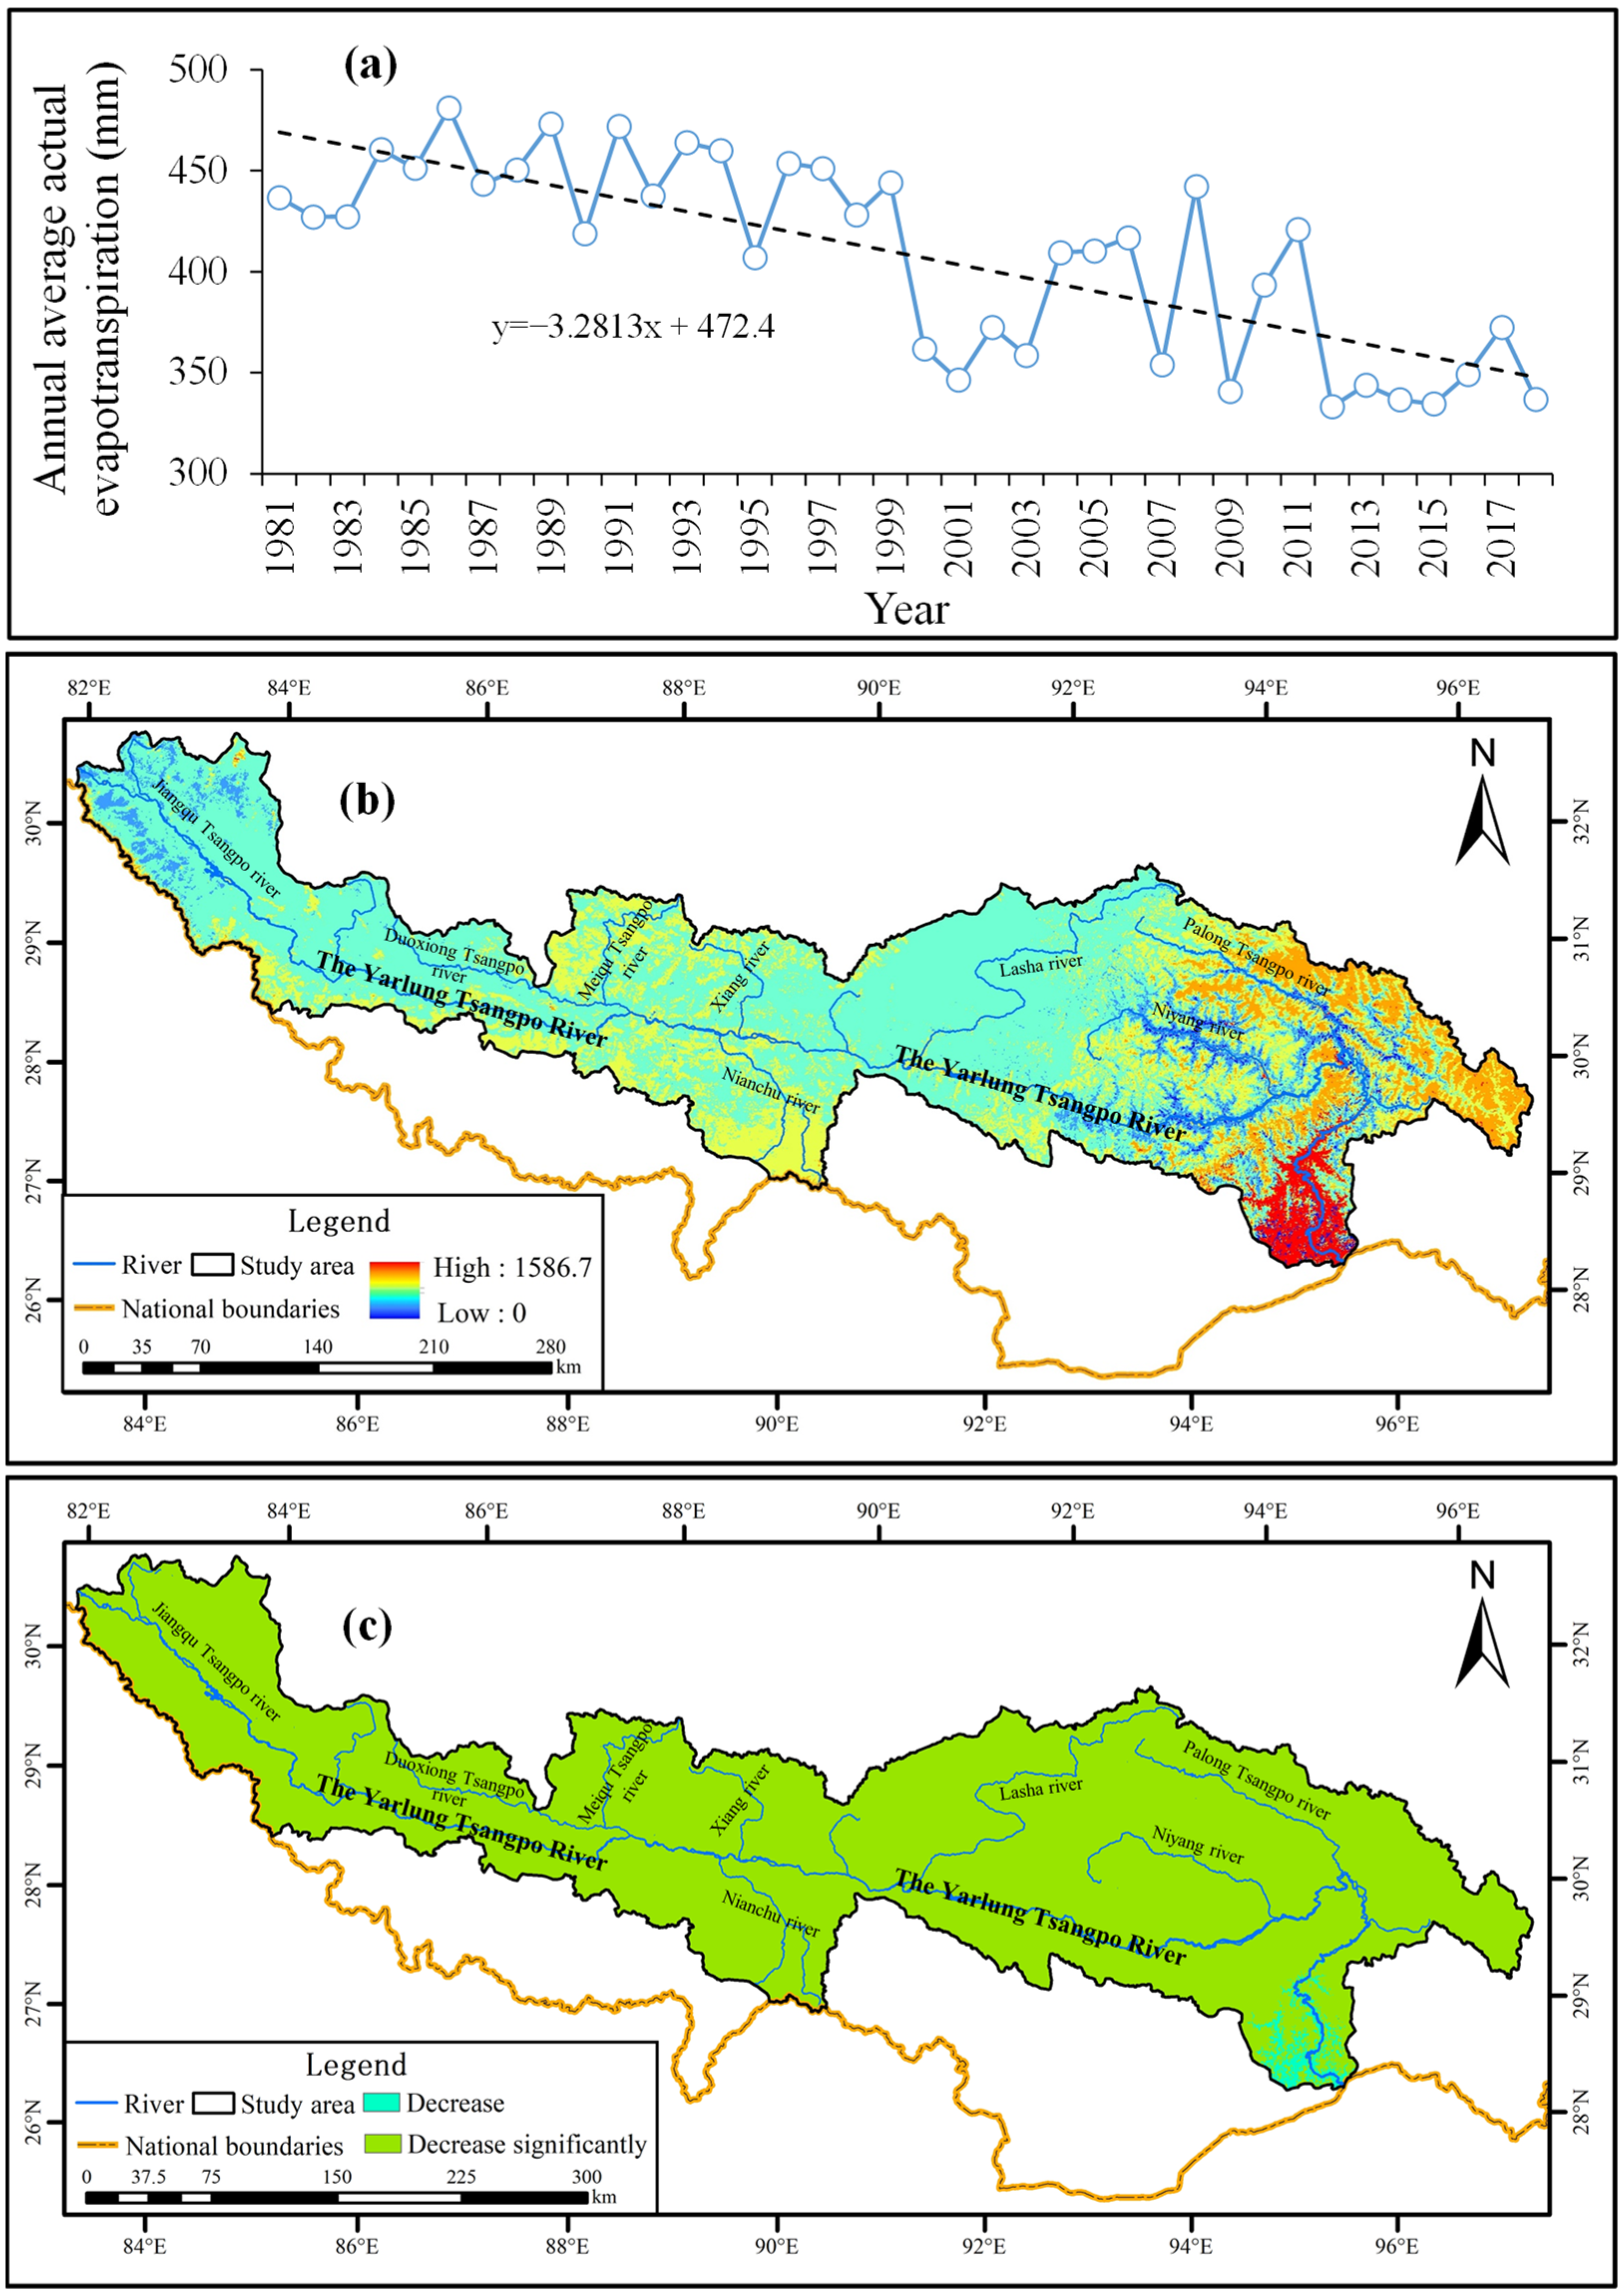
3.2.3. AET
3.3. Correlation Analysis Between Vegetation Dynamics and Climatic Variables in the YTRB
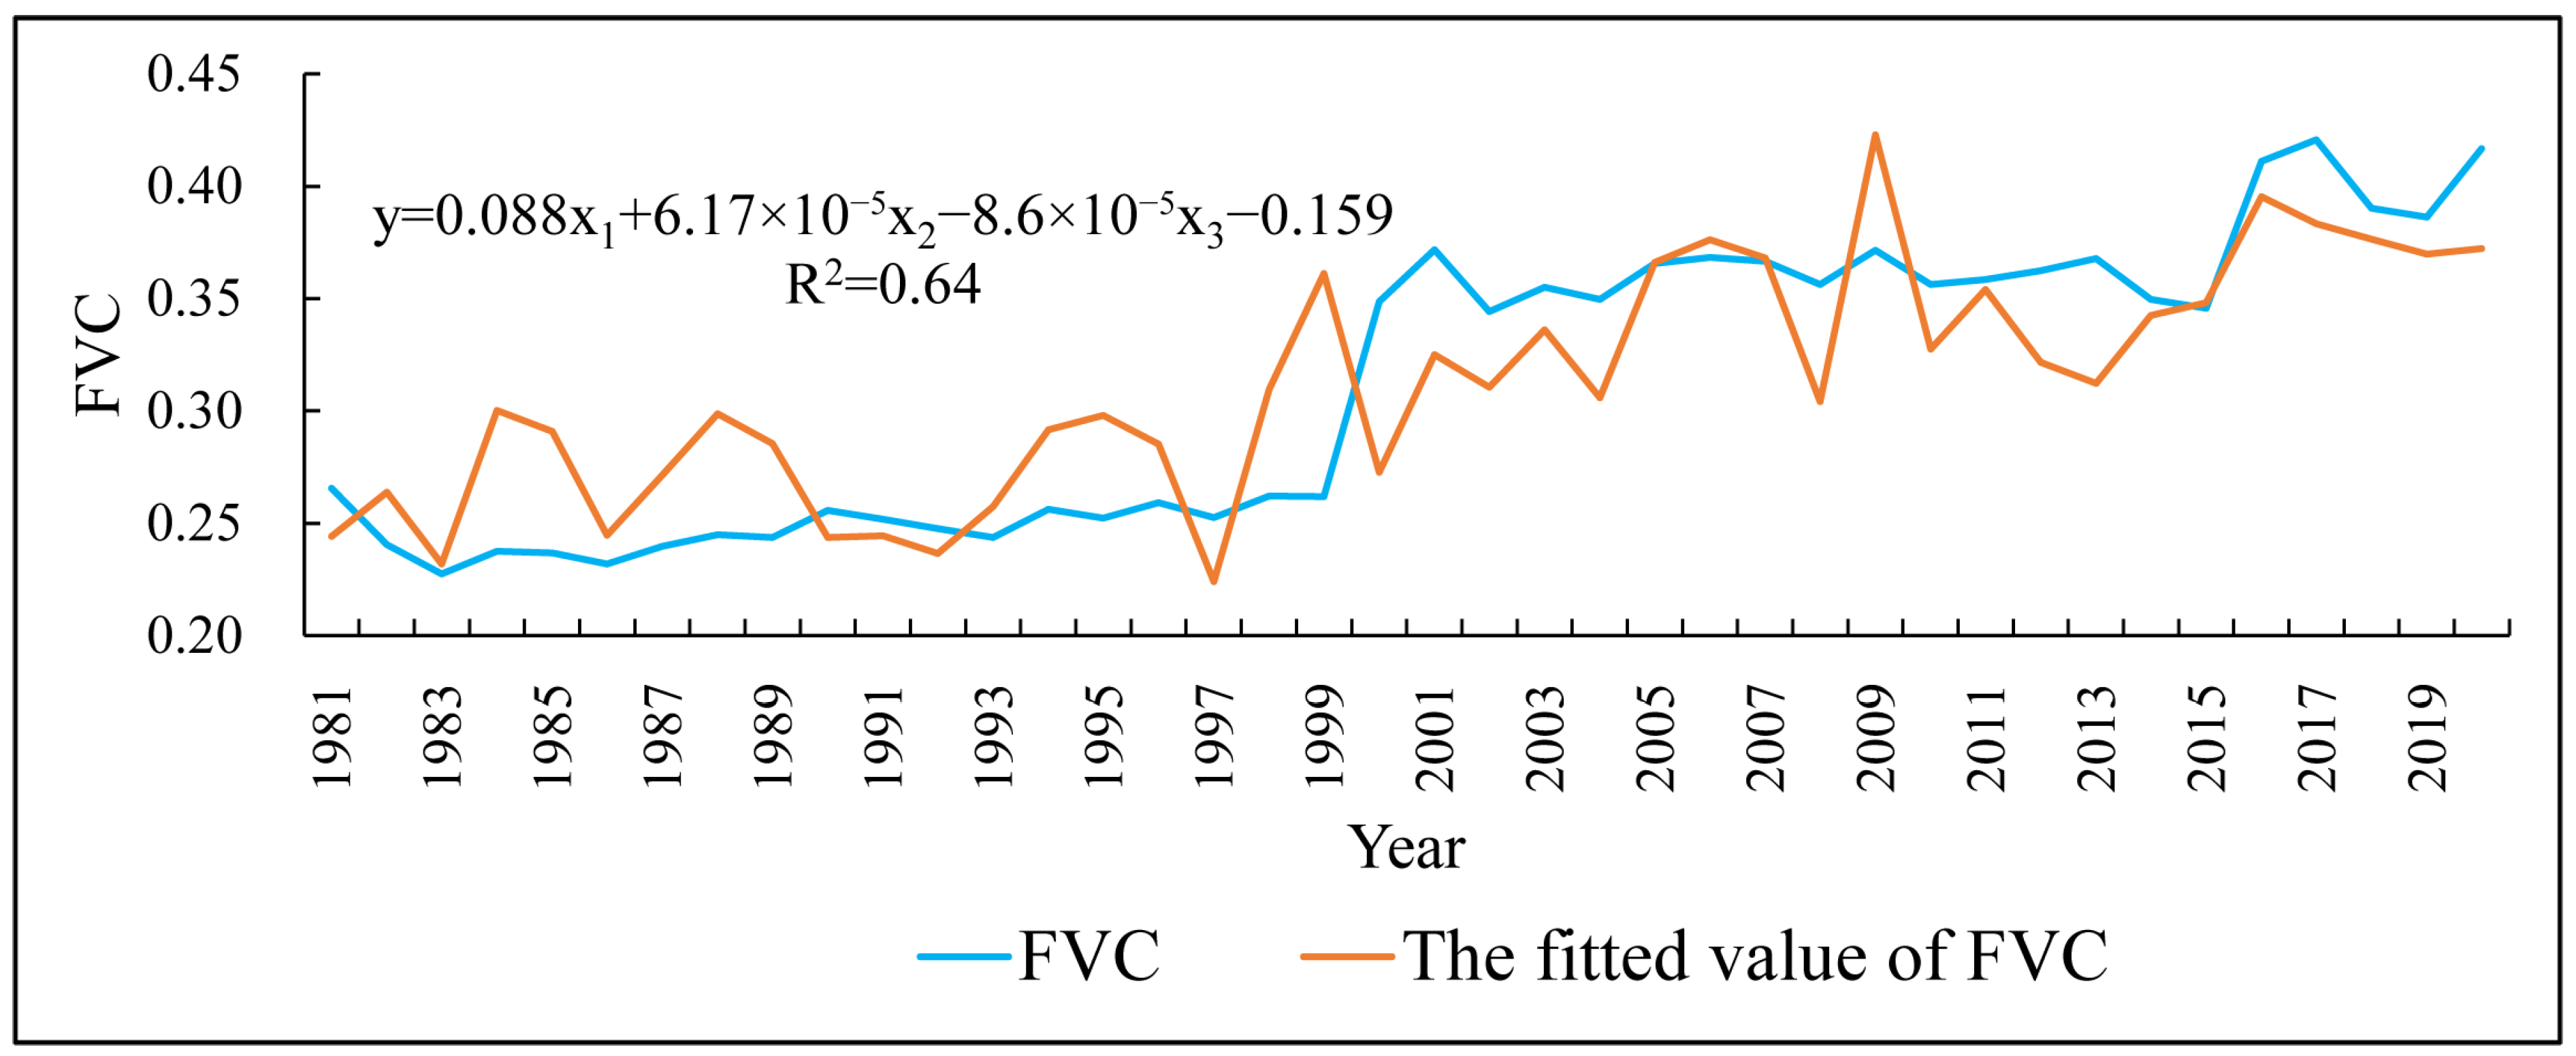
3.3.1. Regression Analysis
3.3.2. Single Correlation Analysis
3.3.3. Partial Correlation Analysis
3.3.4. Complex Correlation Analysis
4. Discussion
4.1. Characterization of Changes Vegetation Dynamics in the YTRB
4.2. Characterization of Changes Climate Variables in the YTRB
4.3. Response Analysis of Vegetation Dynamics to Climate Change in the YTRB
5. Conclusions
Author Contributions
Funding
Institutional Review Board Statement
Informed Consent Statement
Data Availability Statement
Acknowledgments
Conflicts of Interest
Abbreviations
| YTRB | The Yarlung Tsangpo River Basin |
| FAC | Fractional vegetation cover |
| ATEM | Air temperature |
| PRE | Precipitation |
| AET | Actual evapotranspiration |
References
- Hoffmann, W.A.; Jackson, R.B. Vegetation–climate feedbacks in the conversion of tropical savanna to grassland. J. Clim. 2000, 13, 1593–1602. [Google Scholar] [CrossRef]
- Bonan, G.B.; Pollard, D.; Thompson, S.L. Effects of boreal forest vegetation on global climate. Nature 1992, 359, 716–718. [Google Scholar] [CrossRef]
- Feng, T.J.; Wei, W.; Chen, L.D.; Cerdà, A.; Yang, L.; Yu, Y. Combining land preparation and vegetation restoration for optimal soil eco-hydrological services in the Loess Plateau, China. Sci. Total Environ. 2019, 657, 535–547. [Google Scholar] [CrossRef] [PubMed]
- Liu, W.; Li, Z.; Zhu, J.; Xu, C.; Xu, X. Dominant factors controlling runoff coefficients in karst watersheds. J. Hydrol. 2020, 590, 125486. [Google Scholar] [CrossRef]
- Luo, Y.W.; Ma, N.; Zhang, Y.Q.; Zang, C.F.; Szilagyi, J.; Tian, J.; Wang, L.H.; Xu, Z.W.; Tang, Z.X.; Wei, H.S. Response of alpine vegetation function to climate change in the Tibetan Plateau: A perspective from solar-induced chlorophyll fluorescence. Sci. Total Environ. 2024, 952, 175845. [Google Scholar] [CrossRef] [PubMed]
- Xiao, J.Y.; Xie, B.G.; Zhou, K.C.; Liang, C.; Li, J.H.; Xie, J.; Zhang, X.M. Bidirectional dependency between vegetation and terrestrial water storage in China. J. Hydrol. 2023, 626, 130313. [Google Scholar] [CrossRef]
- Deng, Y.; Wang, S.; Bai, X.; Luo, G.; Wu, L.; Chen, F.; Wang, J.; Li, C.; Yang, Y.; Hu, Z.; et al. Vegetation greening intensified soil drying in some semi-arid and arid areas of the world. Agric. For. Meteorol. 2020, 292–293, 108103. [Google Scholar] [CrossRef]
- Zhang, Y.Q.; Li, C.C.; Chiew, F.H.S.; Post, D.A.; Zhang, X.Z.; Ma, N.; Tian, J.; Kong, D.D.; Lenug, L.R.; Yu, Q.; et al. Southern Hemisphere dominates recent decline in global water availability. Science 2023, 382, 579–584. [Google Scholar] [CrossRef]
- Mudereri, B.T.; Chitata, T.; Mukanga, C.; Mupfiga, E.T.; Gwatirisa, C.; Dube, T. Can biophysical parameters derived from Sentinel-2 space-borne sensor improve land cover characterisation in semi-arid regions? Geocarto Int. 2021, 36, 2204–2223. [Google Scholar] [CrossRef]
- Mehmood, K.; Anees, S.A.; Rehman, A.; Tariq, A.; Zubair, M.; Liu, Q.; Rabbi, F.; Khan, K.A.; Luo, M. Exploring spatiotemporal dynamics of NDVI and climate-driven responses in ecosystems: Insights for sustainable management and climate resilience. Ecol. Inform. 2024, 80, 102532. [Google Scholar] [CrossRef]
- Anees, S.A.; Mehmood, K.; Rehman, A.; Rehman, N.U.; Muhammad, S.; Shahzad, F.; Hussain, K.; Luo, M.; Alarfaj, A.A.; Alharbi, S.A.; et al. Unveiling fractional vegetation cover dynamics: A spatiotemporal analysis using MODIS NDVI and machine learning. Environ. Sustain. Ind. 2024, 24, 100485. [Google Scholar] [CrossRef]
- Pan, S.A.; Anees, S.A.; Yang, X.R.; Mehmood, K. The stoichiometric characteristics and the relationship with hydraulic and morphological traits of the Faxon fir in the subalpine coniferous forest of Southwest China. Ecol. Indic. 2024, 159, 111636. [Google Scholar] [CrossRef]
- Anees, S.A.; Zhang, X.; Shakeel, M.; Alkahtani, M.A.; Khan, K.A.; Akram, M.; Ghramh, H.A. Estimation of fractional vegetation cover dynamics based on satellite remote sensing in Pakistan: A comprehensive study on the FVC and its drivers. J. King Saud Univ. Sci. 2022, 34, 101848. [Google Scholar] [CrossRef]
- Pal, S.; Ziaul, S.K. Detection of land use and land cover change and land surface temperature in English Bazar urban centre. Egypt. J. Remote Sens. 2017, 20, 125–145. [Google Scholar] [CrossRef]
- Mu, X.H.; Yang, Y.; Xu, H.; Guo, Y.H.; Lai, Y.K.; Mcvicar, T.R.; Xie, D.H.; Yan, G.J. Improvement of NDVI mixture model for fractional vegetation cover estimation with consideration of shaded vegetation and soil components. Remote Sens. Environ. 2024, 314, 114409. [Google Scholar] [CrossRef]
- Wu, Y.Y.; Fang, H.W.; He, G.J.; Huang, L.; Wang, J.Y. Climate-driven changes in hydrological and hydrodynamic responses in the Yarlung Tsangpo River. J. Hydrol. 2021, 598, 126267. [Google Scholar] [CrossRef]
- Adeyeri, O.E.; Zhou, W.; Ndehedehe, C.E.; Wang, X. Global vegetation, moisture, thermal and climate interactions intensify compound extreme events. Sci. Total Environ. 2024, 912, 169261. [Google Scholar] [CrossRef]
- Adeyeri, O.E.; Luax, P.; Ishola, K.A.; Zhou, W.; Balogun, I.A.; Adeyewa, Z.D.; Kunstmann, H. Homogenising meteorological variables: Impact on trends and associated climate indices. J. Hydrol. 2022, 607, 127585. [Google Scholar] [CrossRef]
- Adeyeri, O.E.; Zhou, W.; Wang, X.; Zhang, R.H.; Laux, P.; Ishola, K.A.; Usman, M. The trend and spatial spread of multisectoral climate extremes in CMIP6 models. Sci Rep. 2022, 12, 21000. [Google Scholar] [CrossRef] [PubMed]
- Xue, Y.X.; Lu, H.W.; Guan, Y.L.; Tian, P.P.; Yao, T.C. Impact of thermal condition on vegetation feedback under greening trend of China. Sci. Total. Environ. 2021, 785, 147380. [Google Scholar] [CrossRef] [PubMed]
- Liu, Y.C.; Li, Z.; Chen, Y.N.; Kayumba, P.M.; Wang, X.X.; Liu, C.X.; Long, Y.X.; Sun, F. Biophysical impacts of vegetation dynamics largely contribute to climate mitigation in High Mountain Asia. Agr. Forest. Meteorol. 2022, 327, 109233. [Google Scholar] [CrossRef]
- Immerzeel, W.W.; Lutz, A.F.; Andrade, M.; Bahl, A.; Biemans, H.; Bolch, T.; Hyde, S.; Brumby, S.; Davies, B.J.; Elmore, A.C.; et al. Importance and vulnerability of the world’s water towers. Nature 2020, 577, 364–369. [Google Scholar] [CrossRef] [PubMed]
- Liu, L.; Niu, Q.K.; Heng, J.X.; Li, H.; Xu, Z.X. Characteristics of dry and wet conversion and dynamic vegetation response in Yarlung Zangbo River basin. Trans. Chin. Soc. Agric. Eng. 2023, 36, 175–184. [Google Scholar] [CrossRef]
- Huang, Q.; Zhang, Y.Q.; Li, C.C.; Ma, N. Quantifying propagation effects of climate and vegetation changes on evapotranspiration and streamflow signatures in Yarlung Tsangpo River Basin. J. Hydrol. Reg. Stud. 2024, 56, 102015. [Google Scholar] [CrossRef]
- Pang, G.J.; Wang, X.J.; Yang, M.X. Using the NDVI to identify variations in, and responses of, vegetation to climate change on the Tibetan Plateau from 1982 to 2012. Quatern. Int. 2017, 444, 87–96. [Google Scholar] [CrossRef]
- Shao, Q.; Cao, W.; Fan, J.; Huang, L.; Xu, X. Effects of an ecological conservation and restoration project in the Three-River Source Region, China. J. Grogr. Sci. 2017, 27, 183–204. [Google Scholar] [CrossRef]
- Meng, Q.B.; Liu, Y.L.; Ju, Q.; Liu, Y.; Wang, G.Q.; Jin, J.L.; Guan, T.S.; Liu, C.S.; Bao, Z.X. Vegetation change and its response to climate change in the Yarlung Zangbo River basin in the past 18 years. SNWTT 2021, 19, 539–550. [Google Scholar] [CrossRef]
- Jiang, L.; Feng, W.L.; Guo, B. Analysis of dynamic monitoring of vegetation change and the correlation with precipitation factor in Yalu Tsangpo River Basin during the past 13 years. Res. Environ. Yangtze Basin 2014, 23, 1610–1619. [Google Scholar]
- Guo, B.; Jiang, L.; Ge, D.Z.; Shang, M. Driving mechanism of vegetation coverage change in the Yarlung Zangbo River Basin under the stress of global warming. J. Trop. Subtrop. Bot. 2017, 25, 209–217. [Google Scholar]
- Lv, Y.; Dong, G.T.; Yang, S.T.; Zhou, Q.W.; Cai, M.Y. Spatio-temporal variation in NDVI in the Yarlung Zangbo River Basin and its relationship with precipitation and elevation. Resour. Sci. 2014, 36, 603–611. [Google Scholar]
- Han, X.M.; Zuo, D.P.; Li, P.J.; Xu, Z.X.; Gao, X.X. Spatiotemporal variability of vegetation cover and its response to climate change in Yarlung Zangbo River Basin. Adv. Sci. Technol. Water Resour. 2021, 41, 16–23. [Google Scholar] [CrossRef]
- Li, H.; Li, Y.K.; Shen, W.; Li, Y.A.; Lin, J.; Lu, X.; Xu, X.; Jiang, J. Elevation-dependent vegetation greening of the Yarlung Zangbo River Basin in the Southern Tibetan Plateau, 1999–2013. Remote Sens. 2015, 7, 16672–16687. [Google Scholar] [CrossRef]
- Cui, L.; Pang, B.; Zhao, G.; Ban, C.; Ren, M.; Peng, D.; Zuo, D.; Zhu, Z. Assessing the sensitivity of vegetation cover to climate change in the Yarlung Zangbo River Basin using machine learning algorithms. Remote Sens. 2022, 14, 1556. [Google Scholar] [CrossRef]
- Li, H.D.; Jiang, J.; Chen, B.; Li, Y.K.; Xu, Y.Y.; Shen, W.S. Pattern of NDVI-based vegetation greening along an altitudinal gradient in the eastern Himalayas and its response to global warming. Environ. Monit. Assess. 2016, 188, 186. [Google Scholar] [CrossRef]
- Zhu, Y.X.; Zheng, Z.T.; Zhao, G.; Zhu, J.T.; Zhao, B.; Sun, Y.H.; Gao, J.; Zhang, Y.J. Evapotranspiration increase is more sensitive to vegetation greening than to vegetation type conversion in arid and semi-arid regions of China. GPC 2025, 244, 104634. [Google Scholar] [CrossRef]
- Berholtz, N.; Lukyanov, V.; Cohen, S.; Zipilevitz, E.; Gilad, Z.; Silverman, D.; Adler, U.; Tanny, J. Irrigation of protected pepper crops according to growth stage using dynamic evapotranspiration estimates increases the water use efficiency. Sci. Hortic. 2023, 310, 111768. [Google Scholar] [CrossRef]
- Zhang, Y.L.; Liu, L.S.; Li, B.Y.; Zheng, D. Comparison of boundary datasets covering Tibetan Plateau between 2021 and 2014 versions. J. Glob. Change Data Discov. 2021, 5, 32–42. [Google Scholar] [CrossRef]
- Linke, S.; Lehner, B.; Ouellet, D.C.; Ariwi, J.; Grill, G.; Anand, M.; Beames, P.; Burchard, L.V.; Maxwell, S.; Moidu, H.; et al. Global hydro-environmental sub-basin and river reach characteristics at high spatial resolution. Sci. Data 2019, 6, 283. [Google Scholar] [CrossRef] [PubMed]
- Shi, X.; Zhang, F.; Lu, X.; Wang, Z.; Gong, T.; Wang, G.; Zhang, H. Spatiotemporal variations of suspended sediment transport in the upstream and midstream of the Yarlung Tsangpo River (the upper Brahmaputra), China. Earth. Surf. Proc. Land. 2018, 43, 432–443. [Google Scholar] [CrossRef]
- Liu, J.P. Study of the Climate Change and Underlying Surface Change as well as Their Runoff Effects in the Yarlung Zangbo River Basin. Ph.D. Dissertation, University of Chinese Academy of Sciences, Beijing, China, 2019. [Google Scholar]
- Wei, D.; Zhao, H.; Zhang, J.X.; Qi, Y.H.; Wang, X.D. Human activities alter response of alpine grasslands on Tibetan Plateau to climate change. J. Environ. Manag. 2020, 262, 110335. [Google Scholar] [CrossRef]
- Mini, M.A.; Torkan, G.; Eslamian, S.; Zareian, M.J.; Adamowski, J.F. Analysis of deterministic and geostatistical interpolation techniques for mapping meteorological variables at large watershed scales. Acta. Geophys. 2019, 67, 275. [Google Scholar] [CrossRef]
- Jiang, T.L.; Su, X.L.; Guo, S.M.; Wu, H.J. Spatiotemporal variation of vegetation water consumption and its response to meteorological drought in Northwest China. J. Health Econ. 2021, 52, 229–240. [Google Scholar] [CrossRef]
- Cheng, D.Y.; Li, X.D. Vegetation coverage change in a karst area and effects of terrain and population. J. Geo-Inf. Sci. 2019, 21, 1227–1239. [Google Scholar] [CrossRef]
- Yang, J.; Jia, L.; Hao, J.; Luo, Q.; Chi, W.; Wang, Y.; Zheng, H.; Yuan, R.; Na, Y. Temporal and Spatial Variation Characteristics of the Ecosystem in the Inner Mongolia Section of the Yellow River Basin. Atmosphere 2024, 15, 827. [Google Scholar] [CrossRef]
- Wang, T.; Fan, G.; Zhang, H.; Shen, X. Temporal and Spatial Variability of Ground Frost Indices in Northeast China. Atmosphere 2024, 15, 817. [Google Scholar] [CrossRef]
- Hou, J.; Du, L.; Liu, K.; Hu, Y.; Zhu, Y. Characteristics of vegetation activity and its responses to climate change in desert/grassland biome transition zones in the last 30 years based on GIMMS3g. Theor. Appl. Climatol. 2019, 136, 915–928. [Google Scholar] [CrossRef]
- Li, Z.; Jiang, F.Q. A study of abrupt climate change in Xinjiang Region during 1961–2004. J. Glaciol. Geocryol. 2007, 3, 351–359. [Google Scholar] [CrossRef]
- Feng, Y.; Su, H.; Tang, Z.; Wang, S.; Zhao, X.; Zhang, H.; Ji, C.; Zhu, J.; Xie, P.; Fang, J. Reduced resilience of terrestrial ecosystems locally is not reflected on a global scale. Commun. Earth. Environ. 2021, 2, 88. [Google Scholar] [CrossRef]
- Wang, J.C.; Guo, J.X.; Xu, J.; Li, F. Multi-time scales change Characteristics and Relationship of Meteorological Variables in the Upper and Middle Regions of the Huaihe River Basin in Recent 55 Years. Acta Geogr. Sin. 2017, 37, 611–619. [Google Scholar] [CrossRef]
- Wu, L.; Zhou, J.; Li, H.C.; Luo, W.Q. Analysis on the response of land use/land cover and ecological service value to topographic changes in the mountainous areas of Southwest China. Pol. J. Environ. Stud. 2024, 33, 6423–6442. [Google Scholar] [CrossRef]
- Li, X.; Yang, D.; Feng, L.; Huang, Y.; Yi, W. Dynamics of vegetation NDVI in Chengdu-Chongqing economic circle from 2000 to 2018. Chin. J. Ecol. 2021, 40, 2967–2977. [Google Scholar] [CrossRef]
- Zhu, L.; Sun, S.; Li, Y.; Liu, X.; Hu, K. Effects of climate change and anthropogenic activity on the vegetation greening in the Liaohe River basin of Northeastern China. Ecol. Ind. 2023, 148, 110105. [Google Scholar] [CrossRef]
- Rawaz, R.H.; Waso, O.L. NDVI forest cover changes at high altitudes of the Sulaymaniyah Governorate of Kurdistan Region, Northern Iraq, 1984–2021. Geogr. J. Geogr. Assoc. 2023, 108, 74–85. [Google Scholar] [CrossRef]
- Tao, S.; Kuang, T.; Peng, W.; Wang, G. Analyzing the spatio-temporal variation and drivers of NDVI in upper reaches of the Yangtze River from 2000 to 2015: A case study of Yibin city. Acta. Ecol. Sin. 2020, 40, 5029–5043. [Google Scholar]
- Zuo, D.P.; Han, Y.N.; Xu, Z.X.; Li, P.J.; Ban, W.C.S.; Pang, B.; Peng, D.Z.; Kan, G.Y.; Zhang, R.; Yang, H. Time-lag effects of climatic change and drought on vegetation dynamics in an alpine river basin of the Tibet Plateau, China. J. Hydrol. 2021, 600, 126532. [Google Scholar] [CrossRef]
- Wang, Z.Y.; Song, W.; Yin, L.C. Responses in ecosystem services to projected land cover changes on the Tibetan Plateau. Ecol. Indic. 2022, 142, 109228. [Google Scholar] [CrossRef]
- Aslam, M.S.; Huanxue, P.; Sohail, S.; Majeed, M.T.; Rahman, S.U.; Anees, S.A. Assessment of major food crops production-based environmental efficiency in China, India, and Pakistan. Environ. Sci. Pollut. 2022, 29, 10091–10100. [Google Scholar] [CrossRef]
- Mehmood, K.; Anees, S.A.; Rehman, A.; Rehman, N.U.; Muhammad, S.; Shahzad, F.; Liu, Q.; Alharbi, S.A.; Alfarraj, S.; Ansari, M.J.; et al. Assessment of climatic influences on net primary productivity along elevation gradients in temperate ecoregions. Trees For. People 2024, 18, 100657. [Google Scholar] [CrossRef]
- Wang, X.D.; Wang, R.J. Terrain Gradient Effect of Land Use and Its Driving Factors in the Qinghai-Tibet Plateau. Pol. J. Environ. Stud. 2022, 31, 5299–5312. [Google Scholar] [CrossRef]
- Li, Y.; Zhuang, J.; Bai, P.; Yu, W.; Zhao, L.; Huang, M.; Xing, Y. Evaluation of three long-term remotely sensed precipitation estimates for meteorological drought monitoring over China. Remote Sens. 2023, 15, 86. [Google Scholar] [CrossRef]
- Ministry of Ecology and Environment of the People’s Republic of China. Fourth National Communication on Climate Change of the People’s Republic of China, Part 3; Ministry of Ecology and Environment: Beijing, China, 2023; pp. 40–75.
- Nlend, B.; Huneau, F.; Garel, E.; Santoni, S.; Mattei, A. Precipitation isoscapes in areas with complex topography: Influence of large-scale atmospheric dynamics versus microclimatic phenomena. J. Hydrol. 2023, 617, 128896. [Google Scholar] [CrossRef]
- Li, G.P.; Yu, Z.B.; Wang, W.G.; Ju, Q.; Chen, X. Analysis of the spatial Distribution of precipitation and topography with GPM data in the Tibetan Plateau. Atmos. Res. 2021, 247, 105259. [Google Scholar] [CrossRef]
- Yang, H.; Cui, C.G.; Wang, X.F.; Zhang, W.G.; Wang, B. Research progresses of precipitation variation over the Yarlung Zangbo River basin under global climate warming. Torrential Rain Disasters 2019, 38, 565–575. [Google Scholar]
- Yang, K.; Wu, H.; Qin, J.; Lin, C.G.; Tang, W.J.; Chen, Y.Y. Recent climate changes over the Tibetan Plateau and their impacts on energy and water cycle: A review. Glob. Planet Change 2014, 112, 79–91. [Google Scholar] [CrossRef]
- Li, B.; Yang, L.; Tang, S.H. The climatic characteristics of summer convection over the Tibetan Plateau revealed by geos-tationary satellite. Acta Meteorol. Sin. 2018, 76, 983–995. [Google Scholar] [CrossRef]
- Zhang, C. Moisture source assessment and the varying characteristics for the Tibetan Plateau precipitation using TRMM. Environ. Res. Lett. 2020, 15, 104003. [Google Scholar] [CrossRef]
- Xu, Y.; Gao, Y.H. Quantification of evaporative sources of precipitation and its changes in the southeastern Tibetan Plateau and middle Yangtze River Basin. Atmosphere 2019, 10, 428. [Google Scholar] [CrossRef]
- Zhang, D.X.; Yan, H.; Miao, Y.; Zhang, M. Analysis of Water Vapor Transport Reduction in the Yarlung Tsangpo Grand Canyon Region: A Trajectory Tracking Approach. Plateau Meteorol. 2024, 43, 114–126. [Google Scholar] [CrossRef]
- Rahman, M.; Azim, S.; Jannat, F.; Rony, M.R.H.; Ahmad, B.; Sarkar, M.A.R. Quantification of rainfall, temperature, and reference evapotranspiration trend and their interrelationship in sub-climatic zones of Bangladesh. Heliyon 2023, 9, e19559. [Google Scholar] [CrossRef] [PubMed]
- Rasouli, K.; Pomeroy, J.W.; Whitfield, P.H. Are the effects of vegetation and soil changes as important as climate change impacts on hydrological processes? Hydrol. Earth. Syst. Sci. 2019, 23, 4933–4954. [Google Scholar] [CrossRef]
- Wang, T.H.; Yang, D.W.; Fang, B.J.; Yang, W.C.; Qin, Y.; Wang, Y.H. Data-driven mapping of the spatial distribution and potential changes of frozen ground over the Tibetan Plateau. Sci. Total. Environ. 2019, 649, 515–525. [Google Scholar] [CrossRef] [PubMed]
- Xie, J.L.; Yin, G.F.; Ma, D.J.; Chen, R.; Zhao, W.; Xie, Q.Y.; Wang, C.; Lin, S.R.; Yuan, W.P. Climatic limitations on grassland photosynthesis over the Tibetan Plateau shifted from temperature to water. Sci. Total. Environ. 2024, 906, 167663. [Google Scholar] [CrossRef]
- Liu, Y.W. Optimum temperature for photosynthesis: From leaf- to ecosystem-scale. Sci. Bull. 2020, 65, 601–604. [Google Scholar] [CrossRef] [PubMed]
- Suzuki, K.; Hiyama, T.; Matsuo, K.; Ichii, K.; Iijima, Y.; Yamazaki, D. Accelerated continental-scale snowmelt and ecohydrological impacts in the four largest Siberian river basins in response to spring warming. Hydrol. Process. 2020, 34, 3867–3881. [Google Scholar] [CrossRef]
- Wang, Y.S.; Zhang, Y.Z.; Yu, X.X.; Jia, G.D.; Liu, Z.Q.; Sun, L.B.; Zheng, P.F.; Zhu, X.H. Grassland soil moisture fluctuation and its relationship with evapotranspiration. Ecol. Indic. 2021, 131, 108196. [Google Scholar] [CrossRef]
- Lin, Z.; Long, T.; Jiao, W.; Ye, Z.; Zhang, D.; He, G. Estimation and spatiotemporal analysis of actual evapotranspiration over Qinghai-Tibet Plateau using an Alpine Grassland-Adapted Priestley-Taylor model. J. Hydrol. 2024, 641, 131756. [Google Scholar] [CrossRef]
- Wang, T.; Yang, M.H.; Yan, S.J.; Geng, G.P.; Li, Q.H.; Wang, F. Temporal and spatial vegetation index variability and response to temperature and precipitation in the Qinghai-Tibet Plateau using GIMMS NDVI. Pol. J. Environ. Stud. 2020, 29, 4385–4395. [Google Scholar] [CrossRef]
- Adhikari, S.; Zhou, W.; Dou, Z.; Sakib, N.; Ma, R.; Chaudhari, B.; Liu, B. Analysis of Flash Drought and Its Impact on Forest Normalized Difference Vegetation Index (NDVI) in Northeast China from 2000 to 2020. Atmosphere 2024, 15, 818. [Google Scholar] [CrossRef]
- Sun, H.; Wang, X.; Fan, D.; Sun, O. Contrasting vegetation response to climate change between two monsoon regions in southwest china: The roles of climate condition and vegetation height. Sci. Total. Environ. 2021, 802, 149643. [Google Scholar] [CrossRef] [PubMed]
- Peng, W.; Zhang, D.; Luo, Y.; Tao, S.; Xu, X. Influence of natural factors on vegetation NDVI using geographical detection in Sichuan province. Acta. Geogr. Sin. 2019, 74, 1758–1776. [Google Scholar] [CrossRef]
- Perez, M.; Lombardi, D.; Bardino, G.; Vitale, M. Drought assessment through actual evapotranspiration in Mediterranean vegetation dynamics. Ecol. Indic. 2024, 166, 112359. [Google Scholar] [CrossRef]
- Zhang, L.N.; Xu, E.Q. Effects of agricultural land use on soil nutrients and its variation along altitude gradients in the downstream of the Yarlung Zangbo River Basin, Tibetan Plateau. Sci. Total. Environ. 2023, 905, 167583. [Google Scholar] [CrossRef] [PubMed]


Disclaimer/Publisher’s Note: The statements, opinions and data contained in all publications are solely those of the individual author(s) and contributor(s) and not of MDPI and/or the editor(s). MDPI and/or the editor(s) disclaim responsibility for any injury to people or property resulting from any ideas, methods, instructions or products referred to in the content. |
© 2025 by the authors. Licensee MDPI, Basel, Switzerland. This article is an open access article distributed under the terms and conditions of the Creative Commons Attribution (CC BY) license (https://creativecommons.org/licenses/by/4.0/).
Share and Cite
Liu, F.; Tang, J.; Guo, J.; Zhang, L.; Sang, X.; Guo, W.; Qin, T. Vegetation Dynamics and Response to Climate Change in Yarlung Tsangpo River Basin During 1981–2020. Atmosphere 2025, 16, 262. https://doi.org/10.3390/atmos16030262
Liu F, Tang J, Guo J, Zhang L, Sang X, Guo W, Qin T. Vegetation Dynamics and Response to Climate Change in Yarlung Tsangpo River Basin During 1981–2020. Atmosphere. 2025; 16(3):262. https://doi.org/10.3390/atmos16030262
Chicago/Turabian StyleLiu, Fang, Junlong Tang, Jing Guo, Leilei Zhang, Xuefeng Sang, Weijian Guo, and Tianling Qin. 2025. "Vegetation Dynamics and Response to Climate Change in Yarlung Tsangpo River Basin During 1981–2020" Atmosphere 16, no. 3: 262. https://doi.org/10.3390/atmos16030262
APA StyleLiu, F., Tang, J., Guo, J., Zhang, L., Sang, X., Guo, W., & Qin, T. (2025). Vegetation Dynamics and Response to Climate Change in Yarlung Tsangpo River Basin During 1981–2020. Atmosphere, 16(3), 262. https://doi.org/10.3390/atmos16030262