
Formation and Precipitation Processes of the Southwest Vortex Impacted by the Plateau Vortex

Abstract
1. Introduction
2. Data and Method
2.1. Case Overview
2.2. Dataset
2.3. Method
3. Results
3.1. Statistical Analysis of the SW Vortices Associated with the P Vortices
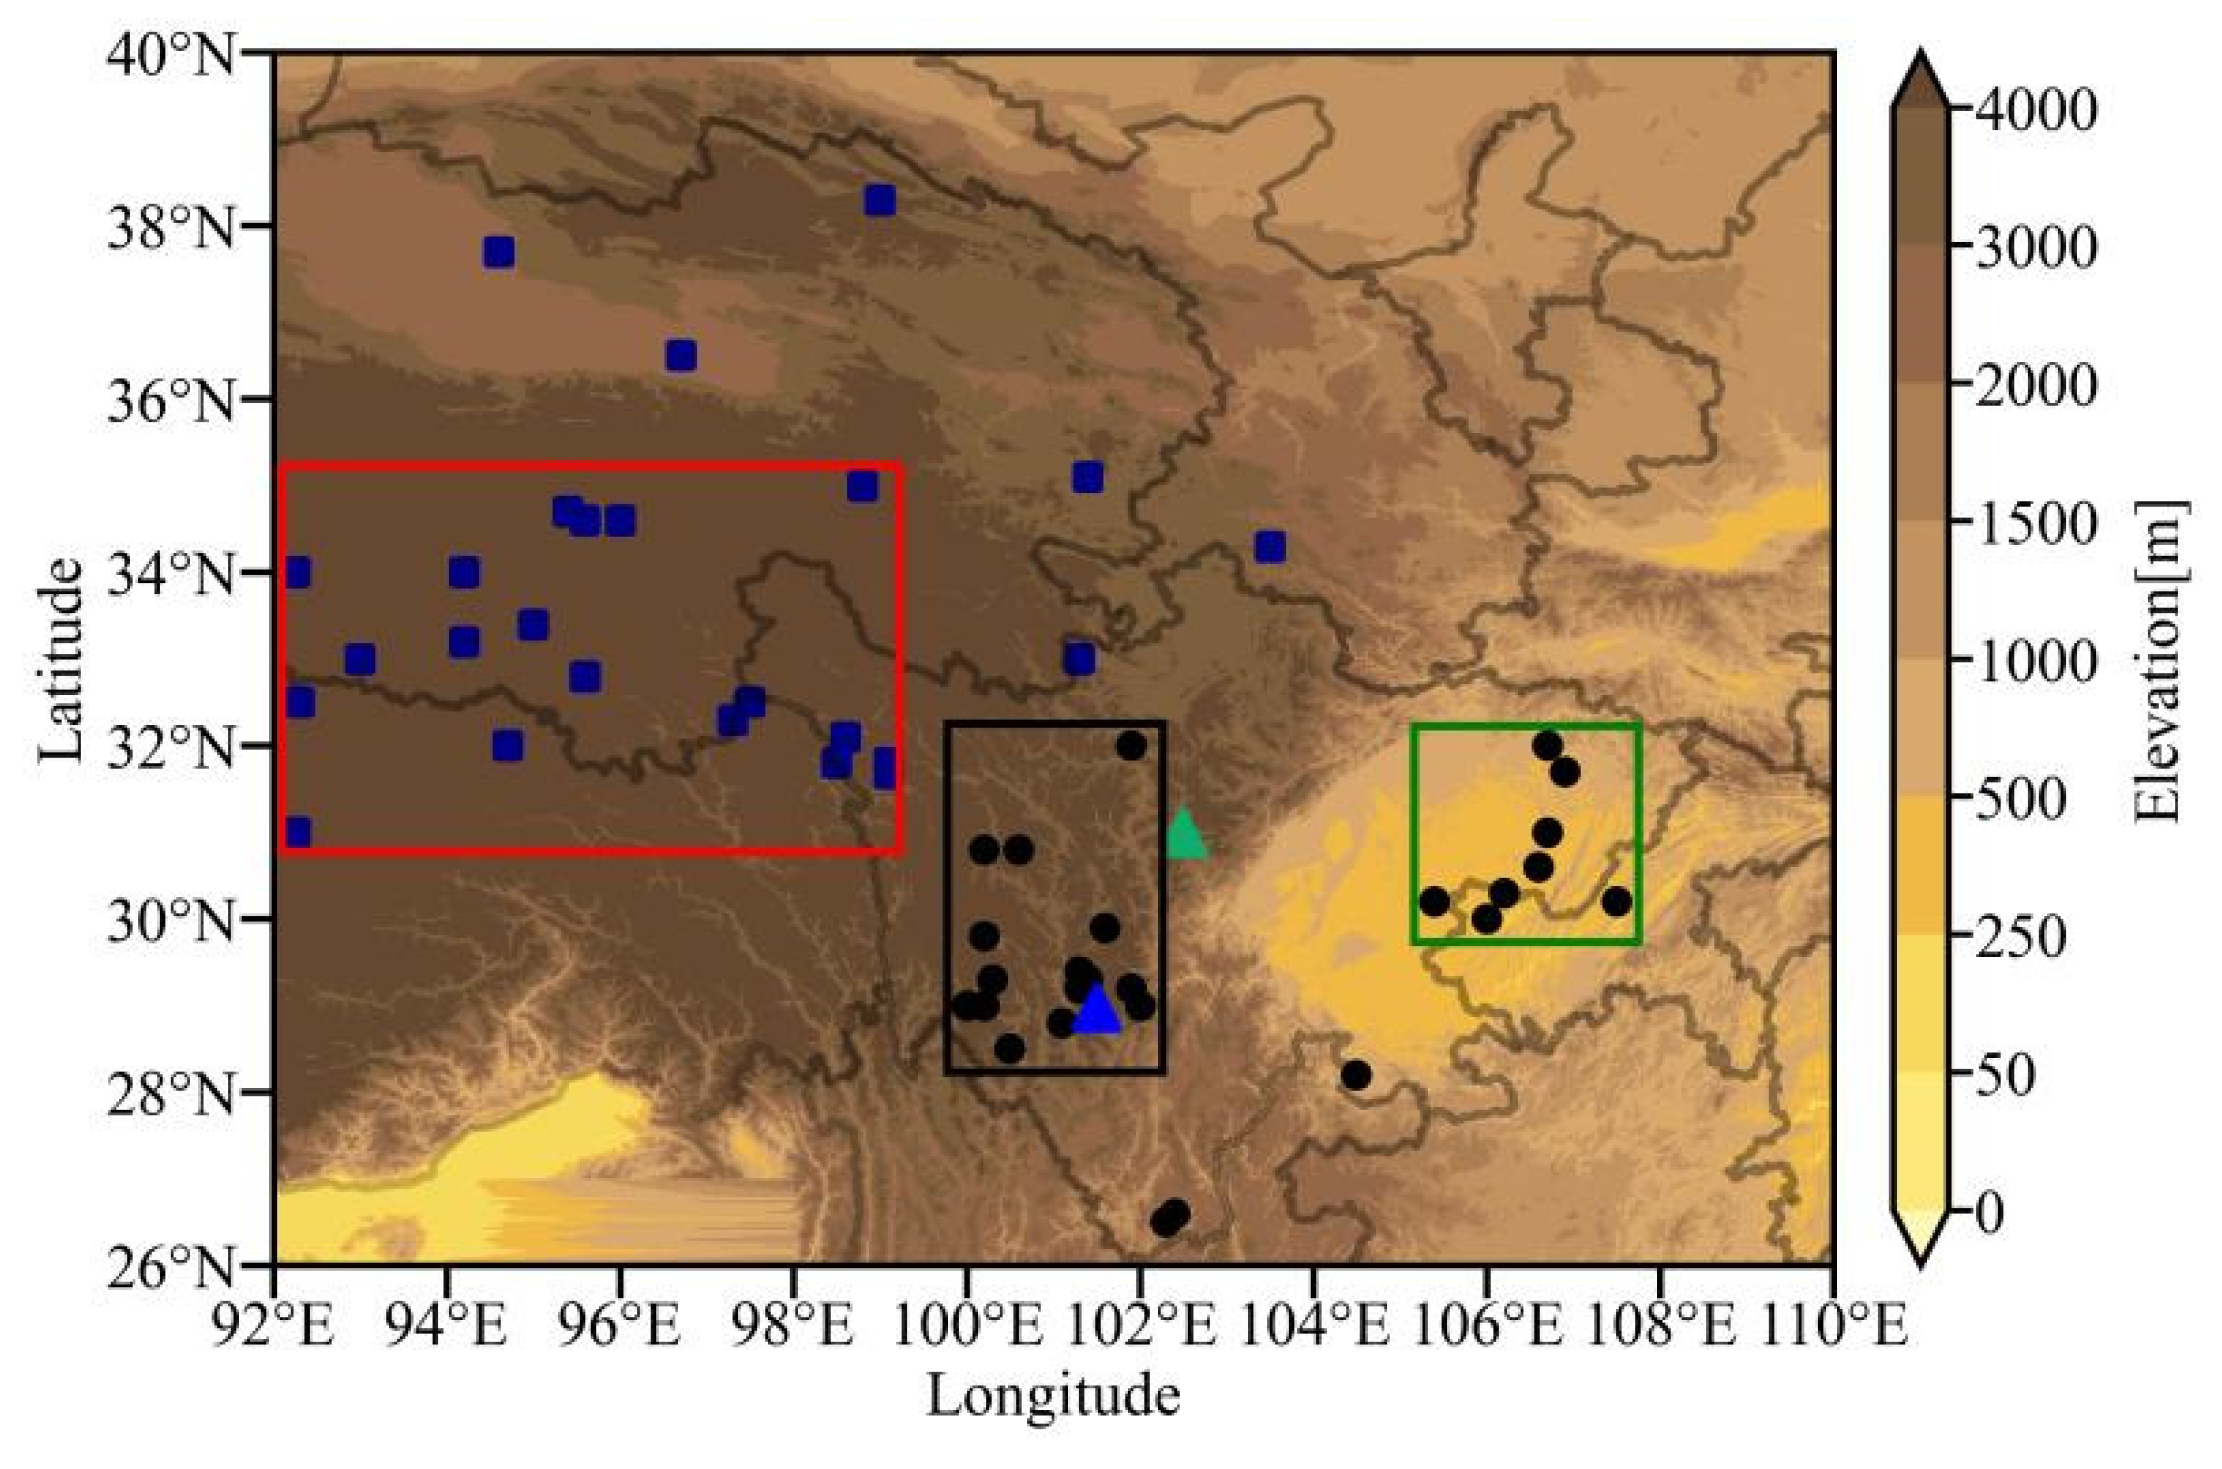
3.1.1. The Source
3.1.2. The Time Disparity
3.1.3. The Trajectories
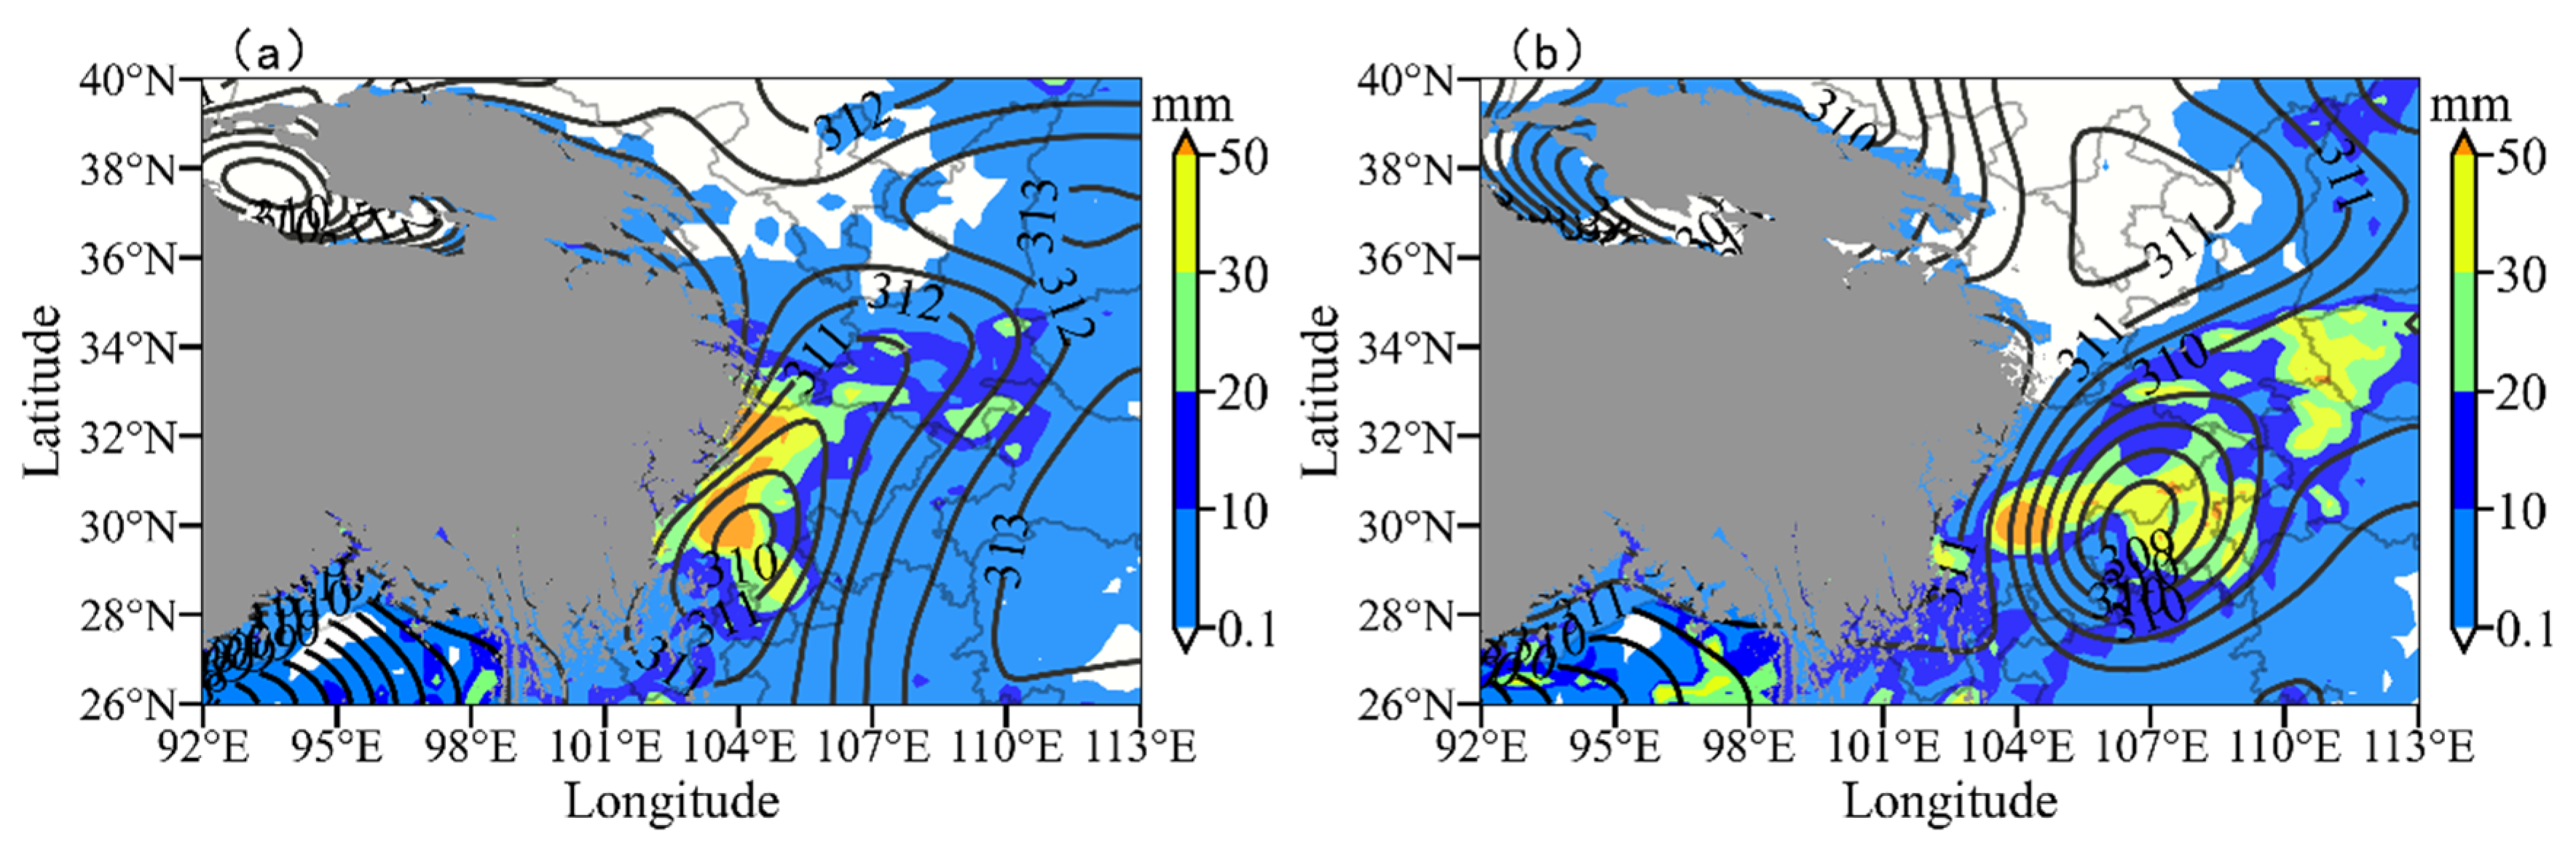
3.1.4. Precipitation
3.2. The Structure of the Vortex
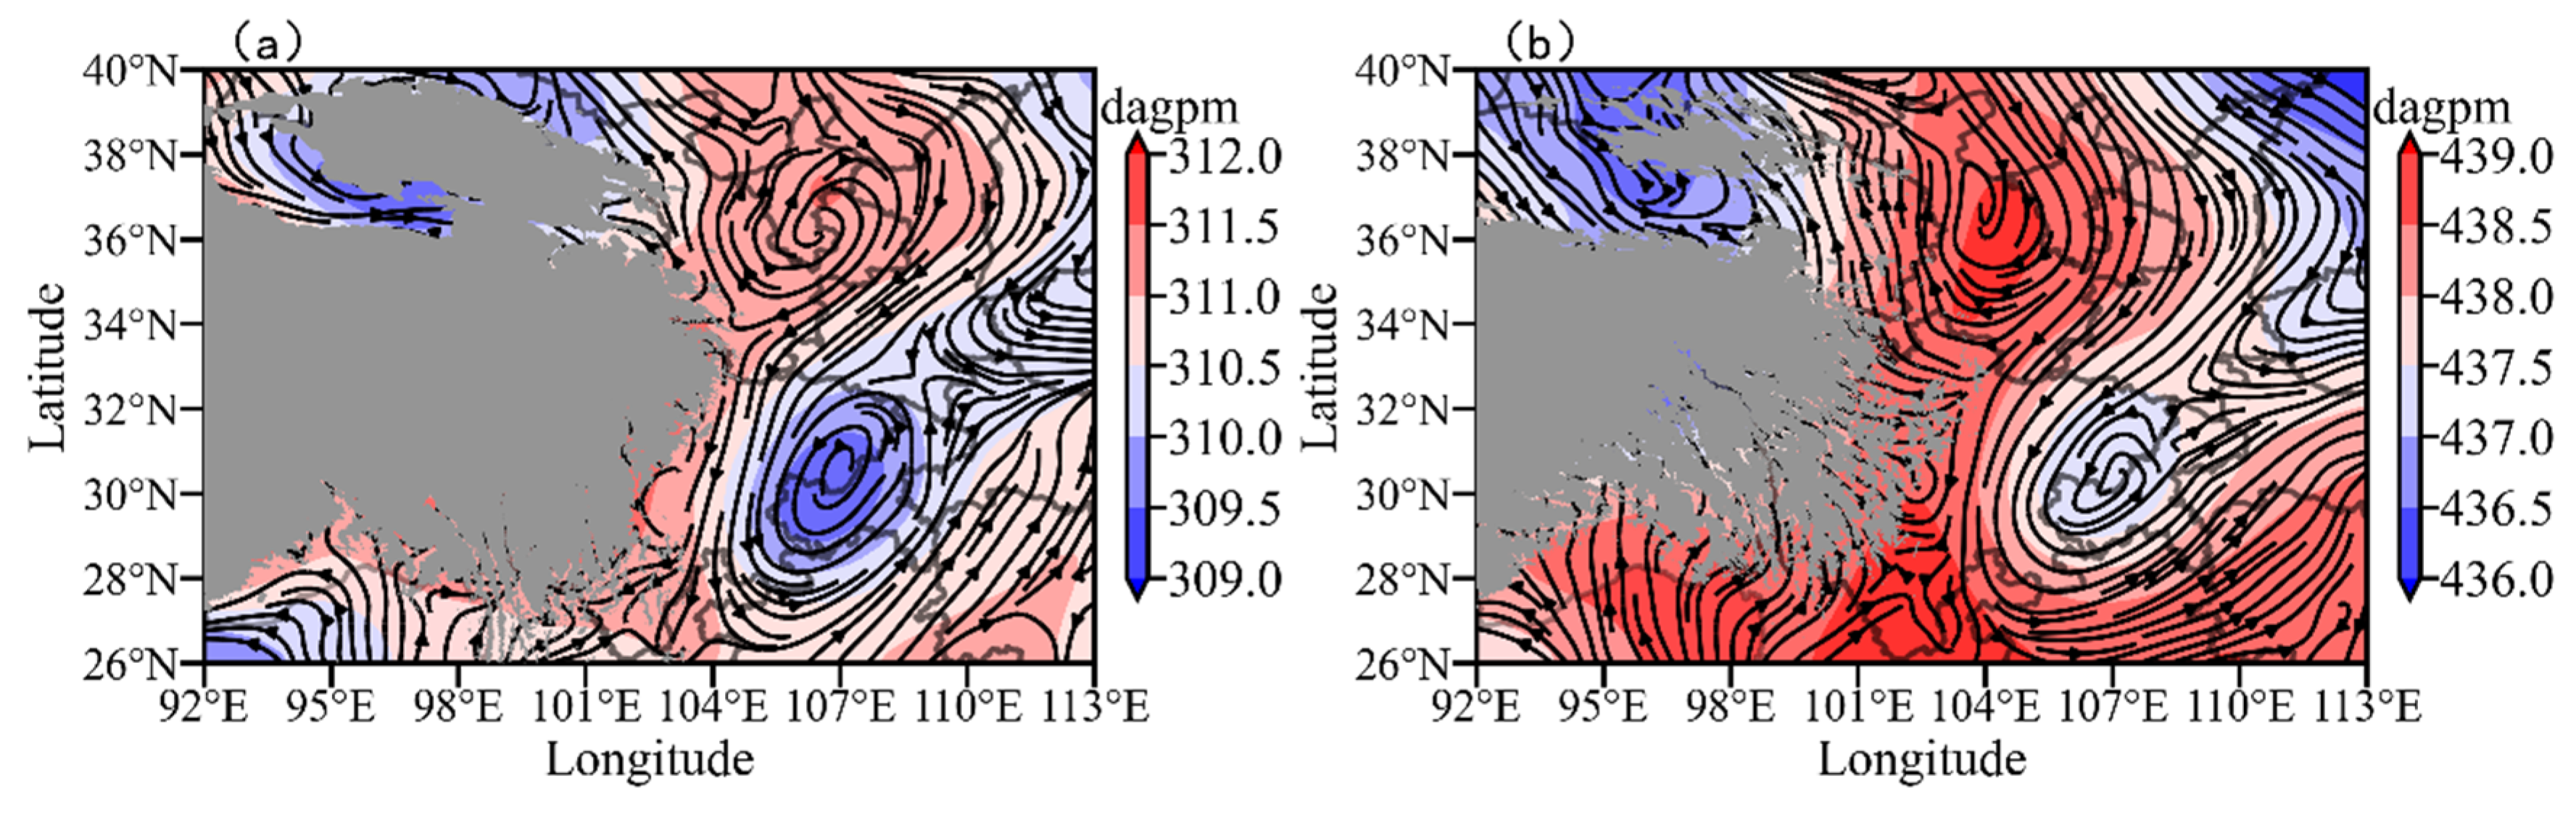
3.2.1. Circulation
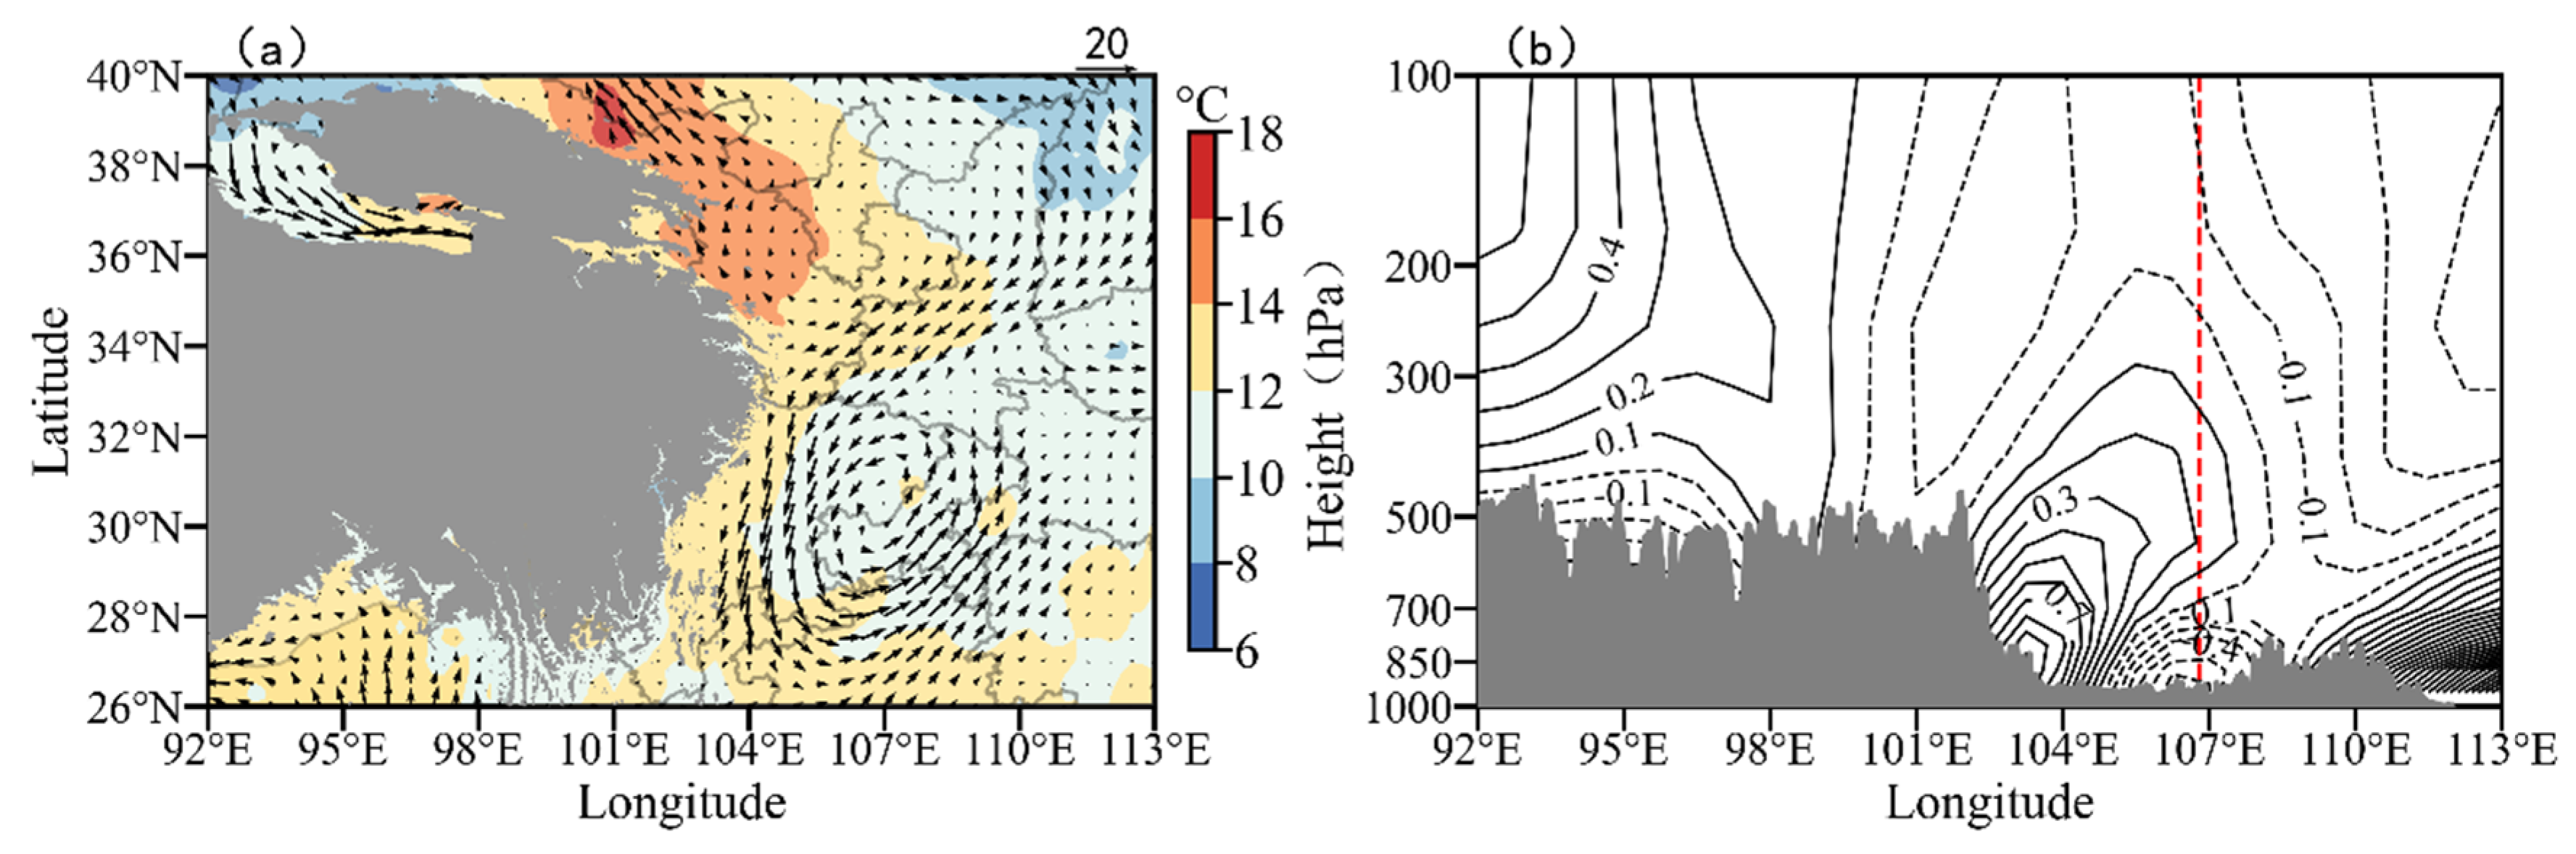
3.2.2. Temperature
3.2.3. Water Vapor
3.3. Mechanism of the Vortex’s Precipitation
3.3.1. Convective Instability
3.3.2. Dynamic Analysis
4. Discussion
5. Summary and Conclusions
Author Contributions
Funding
Institutional Review Board Statement
Informed Consent Statement
Data Availability Statement
Conflicts of Interest
Appendix A

| No. | P Vortex | SW Vortex | Movement Direction | Precipitation Location and Intensity 2 | Maximum 3 | ||
|---|---|---|---|---|---|---|---|
| Initial Position | Initial Date/Time | Initial Position 1 | Initial Date/Time | Unit: mm | |||
| 1 | 35N/96E | 2007.7.15/08:00 | 31.8N/100.5E | 7.16/08:00 | Eastward | Rainstorm in the northeast part of the Basin. | 95 |
| 2 | 34.2N/99E | 2012.7.20/08:00 | 30.8N/102E | 7.21/08:00 | Eastward | Heavy downpour and rainstorm in the southeast part of the Basin. | 188 |
| 3 | 33.4N/95E | 2013.5.13/20:00 | 30.0N/105.0E | 5.14/08:00 | Eastward | Moderate rain in the northeast of the Basin. | 110 |
| 4 | 33.2N/94.2E | 2013.5.24/08:00 | 29.0N/105.0E | 5.23/08:00 | Eastward | Rainstorm in the northwest of the Basin. | 105 |
| 5 | 34N/94.2E | 2013.6.4/20:00 | 30N/107.0E | 6.5/08:00 | Eastward | Rainstorm in the northeast part of the Basin. | 90 |
| 6 | 34.6N/95.6E | 2013.6.29/08:00 | 29.5N/105.0E | 6.30/08:00 | Stationary | Rainstorm in the northeast part of the Basin. | 273 |
| 7 | 32N/106.6E | 2014.7.4/08:00 | 29.0N/104.0E | 7.5/08:00 | Eastward | Rainstorm in the south part of the Basin. | 102 |
| 8 | 34N/92.2E | 2016.7.8/08:00 | 30.8N/100.2E | 7.9/08:00 | Eastward | Heavy downpour and rainstorm in the western part of the Basin. | 210 |
| 9 4 | 31.2N/92.2E | 2019.8.5/08:00 | 29.8N/100.2E | 8.6/08:00 | Eastward | Rainstorm in the central region of the Basin. | 109 |
| 10 | 33N/93.2E | 2021.9.3/08:00 | 31.8N/101E | 9.4/08:00 | Stationary | Rainstorm in the northeast part of the Basin, and in south Shaanxi. | 107 |
| Common characteristics | 33N/96.7E | 6.8/08:00 | 29.1N/101E | 6.9/08:00 | Eastward | Storm in the northeast part of the Basin. | 273 |
| 30.8N/106.5E | |||||||
References
- Tao, S.Y.; Ding, Y.H. Observational evidence of the influence of the Qinghai-Xizang Plateau on the occurrence of heavy rain and severe convective storm in China. Bull. Am. Meteor. Soc. 2021, 62, 23–30. [Google Scholar] [CrossRef]
- Lu, J.H. Overview of Southwest Vortex; Meteorological Press: Beijing, China, 1986. [Google Scholar]
- Kuo, Y.H.; Cheng, L.S.; Bao, J.W. Numerical simulation of the 1981 Sichuan flood. Part I: Evolution of a mesoscale southwest Vortex. Mon. Weather. Rev. 1988, 116, 2081–2105. [Google Scholar] [CrossRef]
- Zhao, D.J.; Jiang, Y.H.; Li, Y. Diagnostic analysis and numerical simulation of a torrential rainstorm process caused southwestern low vortex. Plateau Meteorol. 2011, 30, 1158–1169. [Google Scholar]
- Xiao, Y.H.; Yu, S.H.; Gao, W.L.; Xiao, D.X.; Xiao, H.R.; Shui, R. Cause analysis of one sustained into-the-sea Plateau Vortex accompanied by Southwest Vortex. Plateau Meteorol. 2018, 37, 1616–1627. [Google Scholar]
- Li, Y.Q.; Xu, X.D.; Zhao, X.B. The theory and practice for observing design-layout of Southwest China vortex atmospheric scientific experiment. Chin. Eng. Sci. 2012, 14, 35–45. [Google Scholar]
- Li, G.P.; Wan, J.; Lu, J.H. Potential mechanism of the warm vortex genesis in Southwest China. J. Appl. Meteorol. Sci. 1991, 2, 91–99. [Google Scholar]
- He, G.B. Review of the Southwest Vortex Research. Meteorol. Mon. 2012, 38, 155–163. [Google Scholar]
- Guo, M.Z. The statistic analyses on the easterly movement of plateau vortex. Plateau Meteorol. 1986, 5, 184–188. [Google Scholar]
- Yu, S.H. New research advances of the Tibetan Plateau vortex in summer. Torrential Rain Disasters 2008, 27, 367–372. [Google Scholar]
- Liu, X.Y.; Gong, Y.F.; Rren, Q.; Zhang, Q. Synergistic Effect of Tibetan Plateau Severe Convection and Tibetan Plateau Vortex Eastward-Propagating on the Downstream Heavy Precipitation Process. Plateau Mt. Meteorol. Res. 2024, 44, 10–20. [Google Scholar]
- Li, S.S.; Li, G.P. Evolution and Mechanism Analysis of a Plateau Vortex and Plateau Shear Line. Chin. J. Atmos. Sci. 2017, 41, 713–726. [Google Scholar]
- Zhang, Z.J.; Fan, G.Z. Relationship between Atmospheric Heat Source and the Plateau Vortex in the Eastern Tibetan Plateau. J. Southwest Univ. 2023, 45, 167–177. [Google Scholar]
- Zheng, B.; Fan, G.Z.; Wu, Z.P.; Bai, H. Effect of Plateau Monsoon Strength on Plateau Vortex. Mid-Low Latit. Mt. Meteorol. 2021, 45, 15–22. [Google Scholar]
- Chen, G.; Li, G.P.; Li, Y.Q. The Research Progress of the Tibetan Plateau Vortex in Recent Twenty Years. Adv. Meteorol. Sci. Technol. 2012, 2, 6–12. [Google Scholar]
- Li, G.P.; Zhao, F.H. Analysis of 30-Year Climatology of the Tibetan Plateau Vortex in Summer with NCEP Reanalysis Data. Chin. J. Atmos. Sci. 2014, 38, 756–769. [Google Scholar]
- Feng, X.Y.; Liu, C.H.; Rasmussen, R.; Fan, G.Z. A 10-yr Climatology of Tibetan Plateau Vortices with NCEP Climate Forecast System Reanalysis. J. Appl. Meteorol. Climatol. 2014, 53, 34–46. [Google Scholar] [CrossRef]
- Lin, Z.Q.; Zhou, Z.B.; Jia, L. Objective Identifying Method of Qinghai-Xizang Plateau Vortex Using NCEP/NCAR Reanalysis Dataset. Plateau Meteorol. 2013, 32, 1580–1588. [Google Scholar]
- Yu, S.H.; Gao, W.L. Analysis of Environmental Background and Potential Vorticity of Different Accompanied Moving Cases of Tibetan Plateau Vortex and Southwest China Vortex. Chin. J. Atmos. Sci. 2017, 41, 831–856. [Google Scholar]
- Xiao, Y.Q.; Lou, P.X.; Li, M.J.; Wang, J.X. Analysis on a Heavy Rainstorm in Qinba Region Caused by Southwest Vortex and Northwest Vortex. Plateau Meteorol. 2023, 42, 98–107. [Google Scholar]
- Kuo, Y.H.; Cheng, L.S.; Richard, A.A. Mesoscale Analyses of the Sichuan Flood catastrophe, 11–15 July 1981. Mon. Weather. Rev. 1984, 114, 1984–2003. [Google Scholar] [CrossRef]
- Ma, X.D.; Zhi, X.F.; Wang, J.; Chen, J.; Feng, H.Z. Analysis of the Southwest Vortex activities in summer and their relationship with precipitation during the period of 1979–2016. Trans. Atmos. Sci. 2018, 41, 198–206. [Google Scholar]
- Xiao, H.R.; Chen, J. Numerical study of one Plateau Vortex moving eastward affecting heavy rainfall in Sichuan. Plateau Mt. Meteorol. Res. 2010, 300, 12–17. [Google Scholar]
- Wang, Z.; Wang, J.P. Climatic Characteristics of Southwest China Vortex and Its Impact on Rainstorm in Chongqing from 2012 to 2020. Plateau Mt. Meteorol. Res. 2024, 44, 128–133. [Google Scholar]
- Liu, J.Q.; Liu, H.G.; Xu, J.Y. Analysis on Strong Convective Weather Triggered by Southwest Vortex. Plateau Meteorol. 2021, 40, 525–534. [Google Scholar]
- Zhang, X.N.; Duan, X. Analysis on Southwest Vortex Rainstorm in Lower Latitude Plateau of China. Plateau Meteorol. 2005, 24, 941–947. [Google Scholar]
- Zhou, C.H.; Xiao, D.X.; Yu, S.H. Circulation Background and Structural Characteristics of the Southwest Vortex Inducing Extreme Rainstorm in Sichuan Basin. Meteorol. Mon. 2022, 48, 1577–1589. [Google Scholar]
- Cheng, L.S.; Guo, Y.H. Influence of Initial Conditions and Large-scale Topography on Mesoscale Simulation of the SW Vortex Evolution. J. Lanzhou Univ. (Nat. Sci.) 1990, 26, 140–147. [Google Scholar]
- Pu, Y.K.; Guo, S.C.; Ma, L.X. The dynamical analysis of the generation and development of the southwest low vortex. J. Yunnan Univ. 1984, 4, 113–118. [Google Scholar]
- Wang, B.; Isidoro, O. Study of a heavy rain vortex formed over the eastern flank of the Tibetan Plateau. Mon. Weather. Rev. 1987, 115, 1370–1393. [Google Scholar] [CrossRef]
- Zheng, C.; Liu, Y.J.; Wang, Y.P.; Zhang, H.W.; Li, R.Q. Characteristics of rainstorm caused by southwest vortex in Qin-Ba Mountains in Shaanxi Province. J. Shaanxi Meteorol. 2024, 1, 24–28. [Google Scholar]
- Zhang, Y.X.; Xu, D.B.; Li, Y.Q.; Li, Y.C.; Gao, L.; Yan, R.T. Research on the Characteristics of Typical ‘Southwest Type’ Basin Vortex in the Sichuan Basin. Plateau Meteorol. 2024, 43, 905–918. [Google Scholar]
- Peng, X.D.; Cheng, L.S. A Case Numerical Study on the Evolution of the Low Vortex and Shear-line on the East Side of the PlateauⅡ. Mesoscale Numerical Simulation. J. Lanzhou Univ. 1994, 30, 124–131. [Google Scholar]
- Zhao, Y.C.; Wang, Y.H. A case study on plateau vortex inducing southwest vortex and producing extremely heavy rain. Plateau Meteorol. 2010, 29, 813–819. [Google Scholar]
- Liu, Y.F.; Li, G.P. Climatic Characteristics of Atmospheric Heat Source over the Tibetan Plateau and Its Possible Relationship with the Generation of the Tibetan Plateau Vortex in the Summer. Chin. J. Atmos. Sci. 2016, 40, 864–876. [Google Scholar]
- Fritsch, J.M.; Murphy, J.D.; Kain, J.S. Warm core vortex amplification over land. J. Atmos. Sci. 1994, 51, 1780–1987. [Google Scholar] [CrossRef]
- Wang, B. Development mechanism for Tibetan Plateau warm vortices. J. Atmos. Sci. 1987, 44, 2978–2994. [Google Scholar] [CrossRef]
- Chen, Z.M.; Miao, Q.; Min, W.B. A case analysis on mesoscale structure of severe southwest vortex. J. Appl. Meteorol. Sci. 1998, 9, 273–282. [Google Scholar]
- Chen, G.; Li, G.P. The analyses of wave and eye region in Tibetan Plateau vortex. Plateau Mt. Meteorol. Res. 2010, 30, 6–11. [Google Scholar]
- Yang, Y.C.; Li, Y.Q.; Chen, Y.R. The Characteristic Analysis of an Eastwards Plateau Vortex by Its Strengthening Process. Plateau Meteorol. 2018, 37, 702–720. [Google Scholar]
- Huang, F.J. A composite analysis of the Southwest vortex. Secentia Atmos. Sin. 1986, 10, 402–408. [Google Scholar]
- Fang, H.; Yuan, W.H.; Xu, Y.P. Three-Dimensional Circulation Structure in Advance of Summer Heavy Rainfall in the Middle-Lower Reaches of the Yangtze River. Chin. J. Atmos. Sci. 2020, 44, 761–775. [Google Scholar]


Disclaimer/Publisher’s Note: The statements, opinions and data contained in all publications are solely those of the individual author(s) and contributor(s) and not of MDPI and/or the editor(s). MDPI and/or the editor(s) disclaim responsibility for any injury to people or property resulting from any ideas, methods, instructions or products referred to in the content. |
© 2025 by the authors. Licensee MDPI, Basel, Switzerland. This article is an open access article distributed under the terms and conditions of the Creative Commons Attribution (CC BY) license (https://creativecommons.org/licenses/by/4.0/).
Share and Cite
Bai, A.; Bai, J.; Wang, Z.; Tu, C. Formation and Precipitation Processes of the Southwest Vortex Impacted by the Plateau Vortex. Atmosphere 2025, 16, 115. https://doi.org/10.3390/atmos16020115
Bai A, Bai J, Wang Z, Tu C. Formation and Precipitation Processes of the Southwest Vortex Impacted by the Plateau Vortex. Atmosphere. 2025; 16(2):115. https://doi.org/10.3390/atmos16020115
Chicago/Turabian StyleBai, Aijuan, Jinfeng Bai, Zhao Wang, and Chaoyong Tu. 2025. "Formation and Precipitation Processes of the Southwest Vortex Impacted by the Plateau Vortex" Atmosphere 16, no. 2: 115. https://doi.org/10.3390/atmos16020115
APA StyleBai, A., Bai, J., Wang, Z., & Tu, C. (2025). Formation and Precipitation Processes of the Southwest Vortex Impacted by the Plateau Vortex. Atmosphere, 16(2), 115. https://doi.org/10.3390/atmos16020115