Article

Air Quality at Your Street 2.0—Air Quality Modelling for All Streets in Denmark

1
Department of Environmental Science, Aarhus University, 4000 Roskilde, Denmark
2
Center for Research in Public Health and Clinical Epidemiology (CISPEC), Faculty of Engineering and Industrial Sciences, UTE University, Quito 170527, Ecuador
*
Author to whom correspondence should be addressed.
Atmosphere 2025, 16(12), 1346; https://doi.org/10.3390/atmos16121346
Submission received: 18 September 2025 / Revised: 21 November 2025 / Accepted: 21 November 2025 / Published: 27 November 2025
(This article belongs to the Section Air Quality)

Abstract

High-resolution air quality data are critical for exposure assessment, regulatory compliance, and urban planning. In this study, we present modelled annual mean concentrations of NO2, PM2.5, PM10, Black Carbon (BC), and particle number concentration (PNC) for all ~2.5 million Danish addresses in 2019 using the Air Quality at Your Street 2.0 system. The modelling framework combines coupled chemistry–transport models (DEHM/UBM/OSPM) with input from the Green Mobility Model and GPS-based vehicle speed data. Model outputs were evaluated against observations from the Danish Air Quality Monitoring Programme, showing strong agreement for NO2, PM2.5, PM10, and BC, but notable overestimation of PNC background levels and underestimation of street contributions. Indicative exceedances of NO2 EU limit values decreased markedly from 2012 to 2019, while exceedances of updated EU and WHO guidelines persist, especially for particulate matter. This work identifies key sources of model uncertainty and supports high-resolution national-scale assessment and citizen access via an interactive map.

Graphical Abstract

1. Introduction

The new EU directive on air quality and cleaner air for Europe [1], as well as the former directive [2], require member states to provide information to the public about air quality. This requirement focuses on the dissemination of information based on measured air quality and alerts in the case of exceedance of thresholds. Member states are requested to provide information about measured air quality on the internet. In addition, it is common that member states provide short-term air pollution forecasts based on meteorological and air quality modelling, e.g., the Copernicus Atmosphere Monitoring Service (CAMS), providing air quality forecasts for Europe daily based on several European models (https://atmosphere.copernicus.eu/, accessed on 20 November 2025). Some member states also provide an air quality index that attempts to aggregate complex information about levels of multiple pollutants into a few health-related categories for easy communication, e.g., based on the EU Air Quality Index [3]. The new EU directive requires member states to provide information about the Air Quality Index either as a national derived index or, as a minimum, referring to the Air Quality Index provided by the European Environmental Agency. There are no formal requirements regarding information to the public based on air quality modelling. However, air quality modelling plays a more important role in the new directive as it is a requirement for member states to assess within their territory the spatial representativeness of measurements performed at their national network of monitoring stations, which can only be carried out with high-resolution air quality modelling. Therefore, it is also a requirement that applied models are documented as fit-for-purpose and are evaluated in international intercomparisons.
Air Quality at Your Street is a digital, freely available air quality map that shows the air quality for all addresses in Denmark. The uniqueness of the model system is that it presents modelled annual mean street concentrations for all address locations in Denmark. The purpose of the air quality map is to illustrate the geographical variation of air quality in Denmark for selected health-related air pollutants. DCE-Danish Centre for Environment and Energy at Aarhus University has updated the air quality data in Air Quality at Your Street to cover 2019 and has also included two new air pollutants. The new updated version is called Air Quality at Your Street 2.0. The concentration of several harmful substances is calculated using air quality models, and the air quality map can be viewed on the website http://luftenpaadinvej.au.dk (accessed on 15 November 2025). The interface is in Danish and English. The target groups are the public for information and awareness about air quality at the address level to answer questions such as the following: what is the air quality where I live, work, or my children go to school? Other target groups are national and local authorities that may use the information as a screening tool for air quality assessment in relation to, e.g., indicative assessment of compliance with air quality limit values and initial screening in relation to Environmental Impact Assessments of, e.g., new development or road projects. The objective is to describe the geographical variation of ambient annual mean air quality levels in Denmark at a very high spatial resolution. Air Quality at Your Street may give an indication of potential exceedances of air quality limit values, but due to the greater uncertainty related to modelling, official announcements are primarily based on measurements from measurement stations under the National Air Quality Monitoring Programme. Air Quality at Your Street has become part of the monitoring programme as a complementary tool for assessment of air quality in Denmark since 2017. We use the term indicative exceedances when the exceedance information is based on models.
The first version of Air Quality at Your Street (now called 1.0) was launched in 2016 and included calculated annual mean concentrations for 2012 of NO2 (nitrogen dioxide), PM2.5 (mass of particles less than 2.5 μm), and PM10 (mass of particles less than 10 μm) [4]. As a new feature for 2019, the air pollutants BC (Black Carbon) and particle number concentration (PNC) are also included in Air Quality at Your Street 2.0. All input data have been updated for version 2.0 to reflect 2019. This includes new traffic data from the Green Mobility Model (GMM) [5], a new address database and building footprints to provide locations and street geometry and updated emissions and meteorology data for 2019 for the applied air quality models. A detailed description of Air Quality at Your Street 2.0 can be found in [6] in Danish with an English summary.
This study addresses the following research questions:
(1)
How accurately does the Air Quality at Your Street 2.0 model predict annual mean concentrations of NO2, PM2.5, PM10, Black Carbon (BC), and particle number concentration (PNC) across Danish addresses compared to national monitoring data?
(2)
What are the major sources of uncertainty in the modelling system, and how do they affect the accuracy of air quality predictions?
We apply the Air Quality at Your Street 2.0 model to evaluate air pollution levels between 2012 and 2019. Specifically, we aim to (a) estimate the number of indicative exceedances of EU air quality limit values and WHO 2021 air quality guidelines and (b) calculate the concentrations of NO2, PM2.5, PM10, BC, and PNC across Denmark in 2019.

2. Materials and Methods

Multi-scale modelling is applied to model annual mean concentrations of NO2, PM2.5, PM10, BC and PNC for 2019 for all addresses in Denmark. The model system is called DEHM/UBM/AirGIS and has been developed by Aarhus University (www.au.dk/AirGIS, accessed on 20 November 2025). The model system includes a regional transport model (DEHM) [7,8,9], a high-resolution background model (UBM) [10,11] and a street air quality model (OSPM) with associated meteorology and emission data [12,13]. DEHM provides regional background concentrations as input to UBM, which provides urban background concentrations for OSPM®. Street configuration data and traffic data for OSPM® for each address are generated with a 2½ dimensional GIS-based landscape model within the AirGIS system based on GIS data for roads and traffic, buildings, and calculation points [14,15]. All models are driven by meteorological data from the WRF numerical weather prediction model (Weather, Research and Forecasting) [16]. For the DEHM model, global emission databases are used for the Northern Hemisphere domain based on EDGAR (Emission Database for Global Atmospheric Research) and GEIA (Global Emission Inventory Activity). Emissions for the European domain have a resolution of 0.1 degrees and are based on EMEP emissions from 2017 (www.emep.int, accessed on 20 November 2025). The emission inventories used in the domain over Denmark for UBM are geographically distributed from the national emission inventory of 2018 [17] to a resolution of 1 km × 1 km based on the SPREAD model [18,19]. Ship emissions are based on EPITOME with a resolution of 0.1 degrees [20] and globally at a coarser resolution. For OSPM, COPERT emissions are used and integrated into OSPM.
For version 2.0, emissions have also been established for BC and PNC. BC is also included in the international emission inventories as a separate component of PM2.5 emissions in most cases. BC mainly originates from combustion processes, but also from sources like tyre wear and dust from coal storage. BC is defined as carbon-containing particles that absorb light. The Danish calculation of BC is largely based on the standard emission factors included in the EMEP/EEA Guidebook and is most often defined as a fraction of PM2.5 emissions. BC was first included in the EMEP/EEA Guidebook in 2013, and in many cases, BC is assumed to be equal to EC (Elemental Carbon) due to a lack of measurement data for BC [21]. BC is not measured in the Danish air quality monitoring programme, but EC is measured based on a chemical analysis, and EC can be used as an indicator of BC.
Particle numbers are not included in the official national emission inventory or in the official international emission inventories, as emission inventories for particle numbers are not required, and hence methodologies are not included according to the EMEP/EEA Guidebook guidelines. However, in connection with an EU research project named HERMES on the relationship between particle numbers and health effects for 1979–2018, Aarhus University has implemented particle number emissions in the DEHM, UBM, and OSPM models. This research project calculated, for the first time, particle number concentrations with a high resolution for Denmark [22,23].
In version 2.0, a simple method to adjust for mass closure was implemented. Like other regional models, the applied version of DEHM also faces challenges in achieving mass closure for PM2.5 and PM10, as predictions underestimate the mass of particles compared to measurements. The missing mass is likely related to water included in the particles (measured but not modelled), underestimation of particles like windblown dust and resuspended particles, underestimation of pollen, and underestimation of POAs (Primary Organic Aerosols). Adjustment to achieve mass closure has, in this study, been resolved by multiplying the predicted PM2.5 and PM10 concentrations with a factor of 1.33, which has been used for several years, derived by comparison with measurements from the Danish Air Quality Monitoring Programme [24] that also fit well with EMEP measurements in Europe [7]. The reason for adjusting model outputs for PM2.5 and PM10 by the factor is to provide results feasible for comparison with EU limit values and WHO air quality guidelines.
Models and input data for version 1.0 of Air Quality at Your Street are described in greater detail in [25] and version 2.0 in Danish with an English summary in [6].
Table 1 provides an overview of similarities and differences between version 1.0 and 2.0.

2.1. Evaluation of Traffic Volumes and Speeds

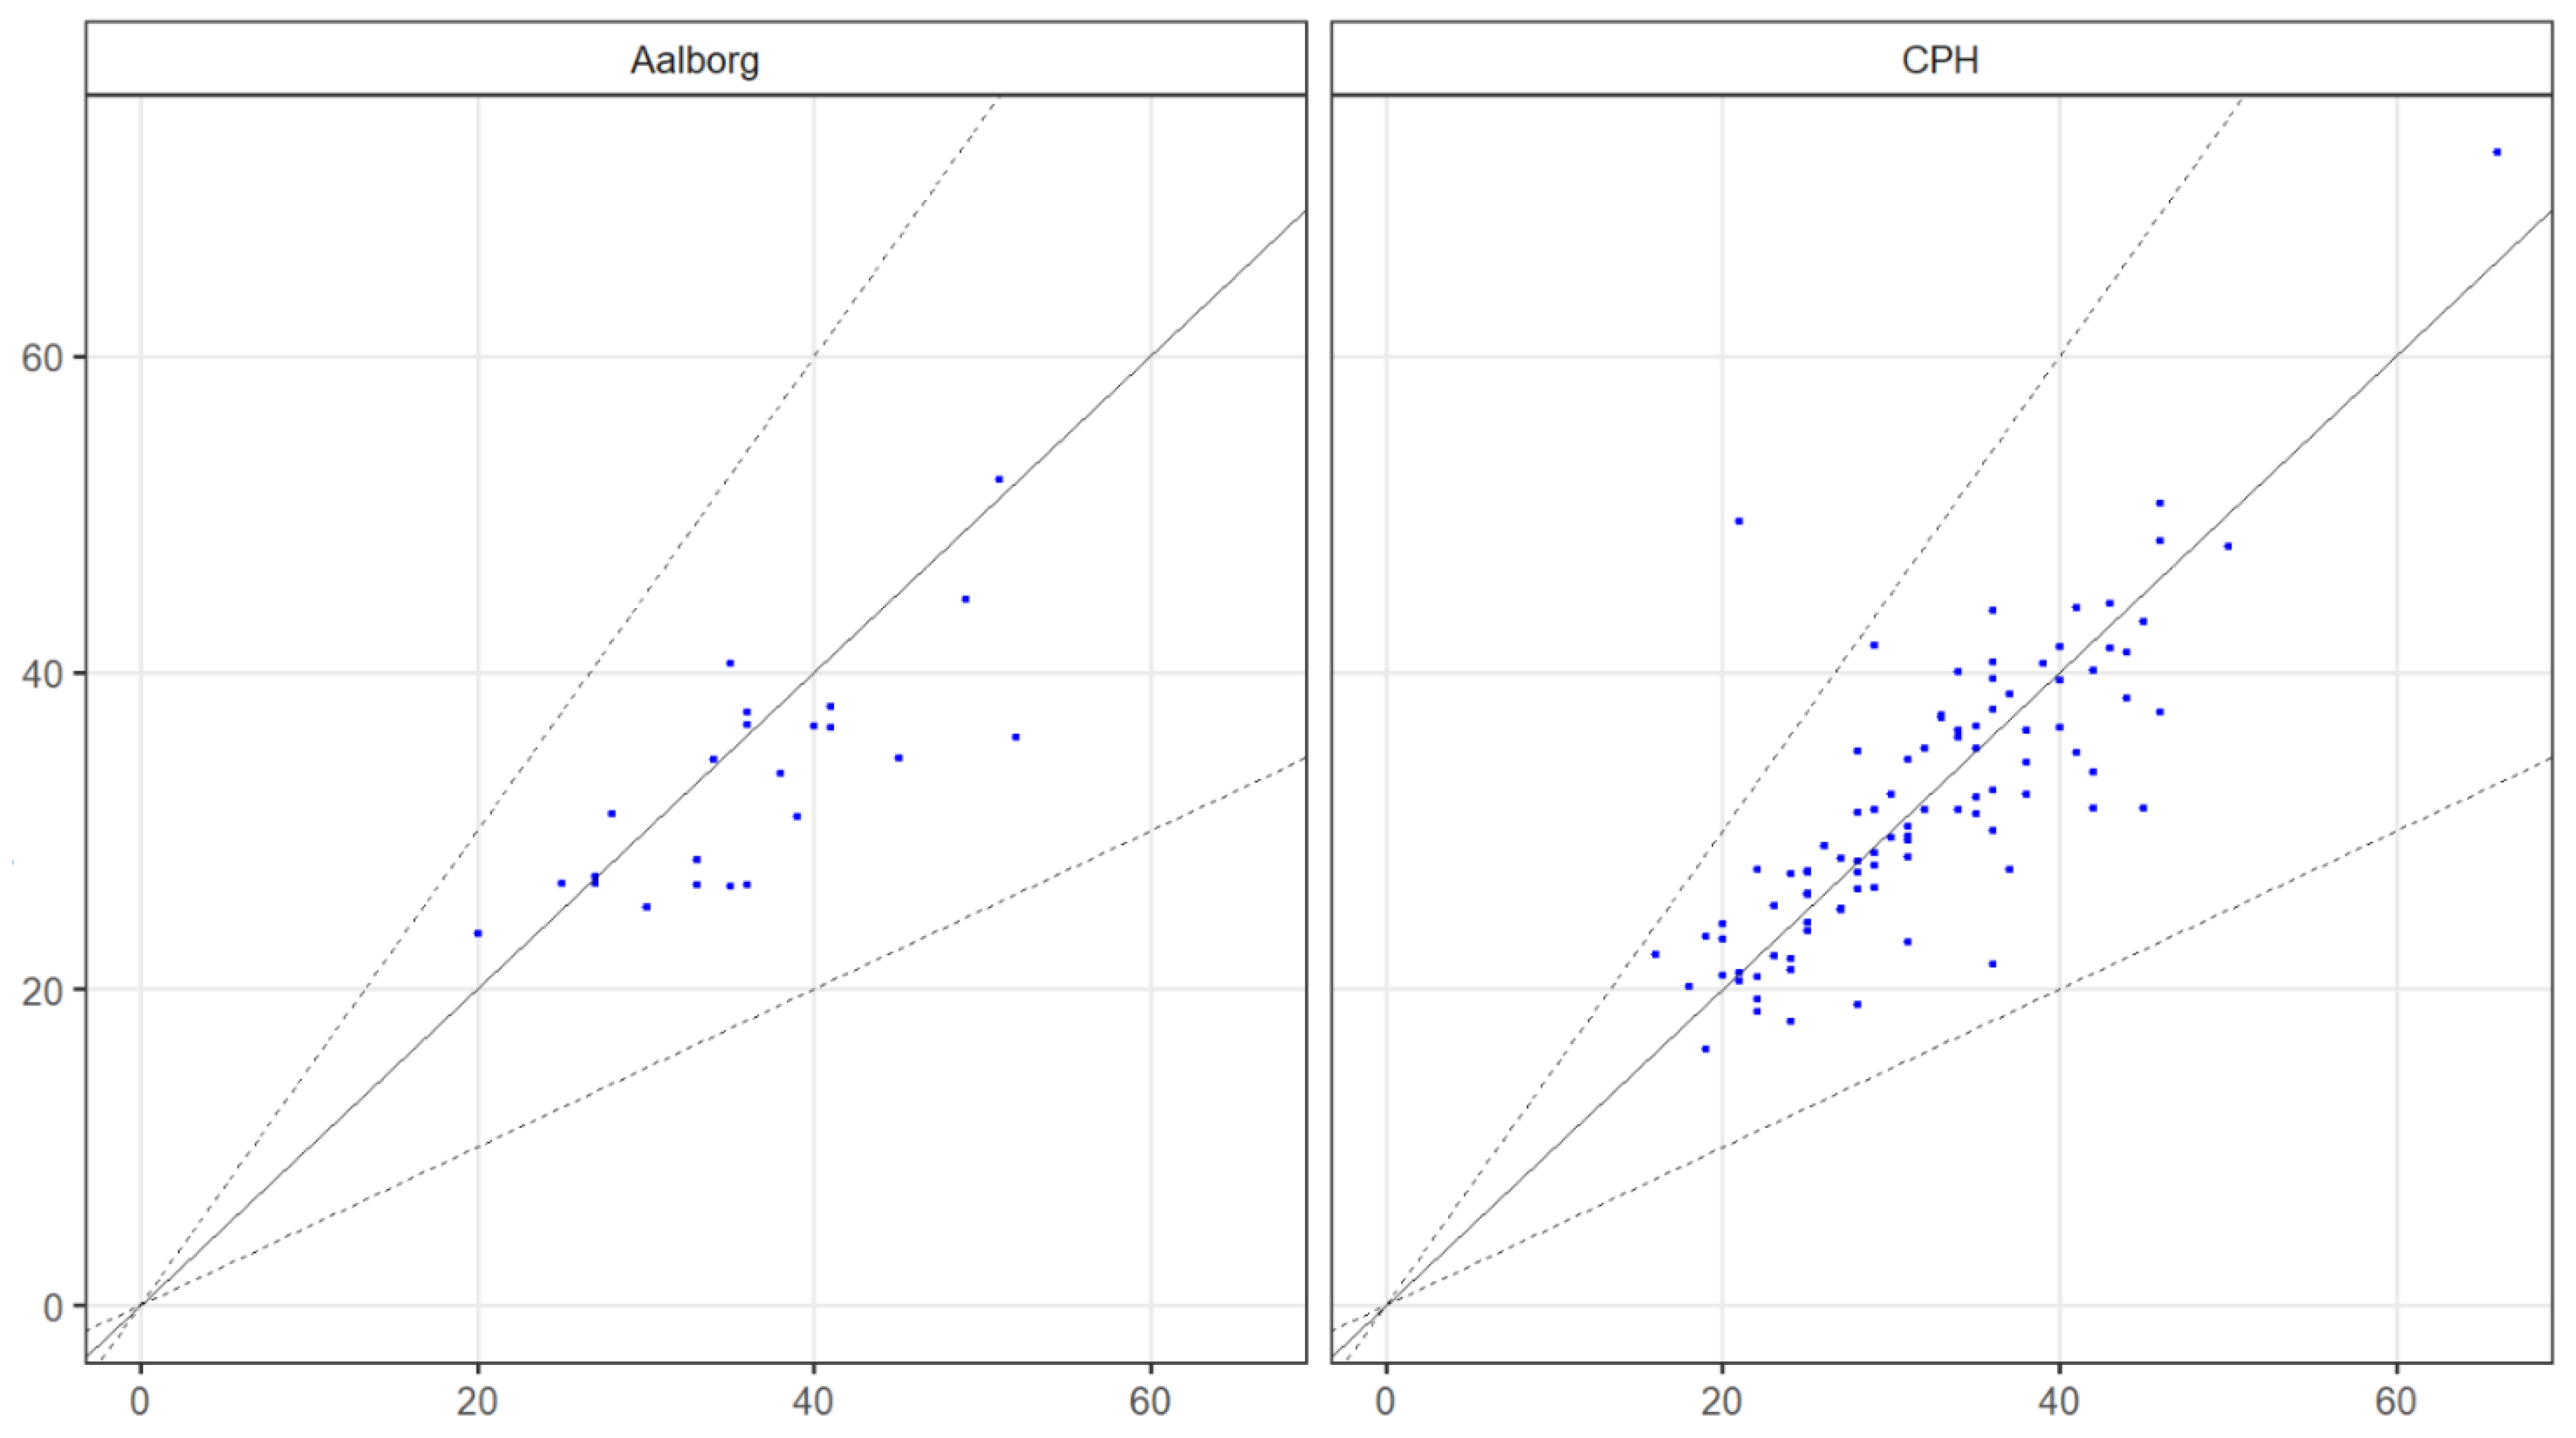
A comparison of modelled AADT from GMM with an independent AADT dataset from Copenhagen and Aalborg in Denmark was carried out for 2020, as GMM represents traffic volumes for the year 2020. These two cities were selected due to the availability of high-quality traffic data, including 94 sites for Copenhagen and 23 for Aalborg, as part of an air quality assessment of selected streets in these cities under the Danish Air Quality Monitoring Programme [26]. For Copenhagen, traffic data are based on manual counts, and for Aalborg, data are based on a combination of manual counts, automatic counts, and a local traffic model.
The correlation between modelled and counted traffic volume is fair for Copenhagen (R2 = 0.30), with an underestimation of approx. 11% on average; see Figure 1. For Aalborg, the correlation is high (R2 = 0. 76), with a marginal underestimation of approximately 2% on average. Single streets may be under- or overestimated by up to a factor of two.
The correlation between the two travel speed datasets is R2 = 0.64 for Copenhagen with zero bias and R2 = 0.51 for Aalborg with 8% bias; see Figure 2.

2.2. Measurements for Evaluation of Model Results

Measurements from 2019 for evaluating model results are obtained from the Danish Air Quality Monitoring Programme for street, urban background, and regional/rural background stations [24]. NO2 is measured via chemiluminescence; PM2.5 and PM10 via LVS (Low-Volume Sampling), which is a gravimetric reference method; and PNC via custom-built DMPS instruments (Differential Mobility Particle Sizer) to measure particle number size distributions in the submicrometer size regime. In our case, particles with diameters in the range from 11 nm to 478/550 nm are detected by the instruments. The two upper limits refer to different versions of the DMPS instruments that have been used over time, and analysis shows that there is a negligible difference in the measured number of particles between the two different limits [27].
The output of PNC from the model system is, in theory, particles with a size of approx. 10–1000 nm, which we here denote as particle number concentrations (PNCs) ([22,23]). The unit of concentration of the particle numbers is number per cm3. Measurements of particle numbers in the air quality monitoring program in 2019 were not available in the size range starting at approx. 10 nm due to the implementation of new instruments, but they were available from 2002 to 2016 and from 2020 onwards for four stations (11–478/550 nm) and showed a general decline [26]. Therefore, the modelled PNC for 2019 was compared with observations from 2020 to provide an indicative comparison (see Table S5 in the Supplementary Materials), and scatter plots of PNC are not presented in the following sections. Comparing data from different years adds to the uncertainty due to differences in emissions and meteorology and only allows for an indicative comparison.
Ultrafine particles are defined as the number of particles with an aerodynamic diameter up to 100 nm. However, in a previous study, it was shown that the particle number in the entire 11–550 nm range is estimated to be only approx. 15–25% higher than the number of ultrafine particles (≤100 nm). The difference depends on the locality (rural background, city background, street) [27]. Therefore, the model output and measurements could also be seen as an indicator for ultrafine particles, given the above limitations [23].
Model calculations were taken from the nearest address to represent the location of the street measurement stations. Modelled street concentrations represent concentrations at a height of 2 m close to building facades. Most street measurement stations are located at the curbside, measured at a height of approx. 3 m, and are estimated to provide similar concentration values.

3. Results and Discussion

3.1. Evaluation of Model Results in 2019

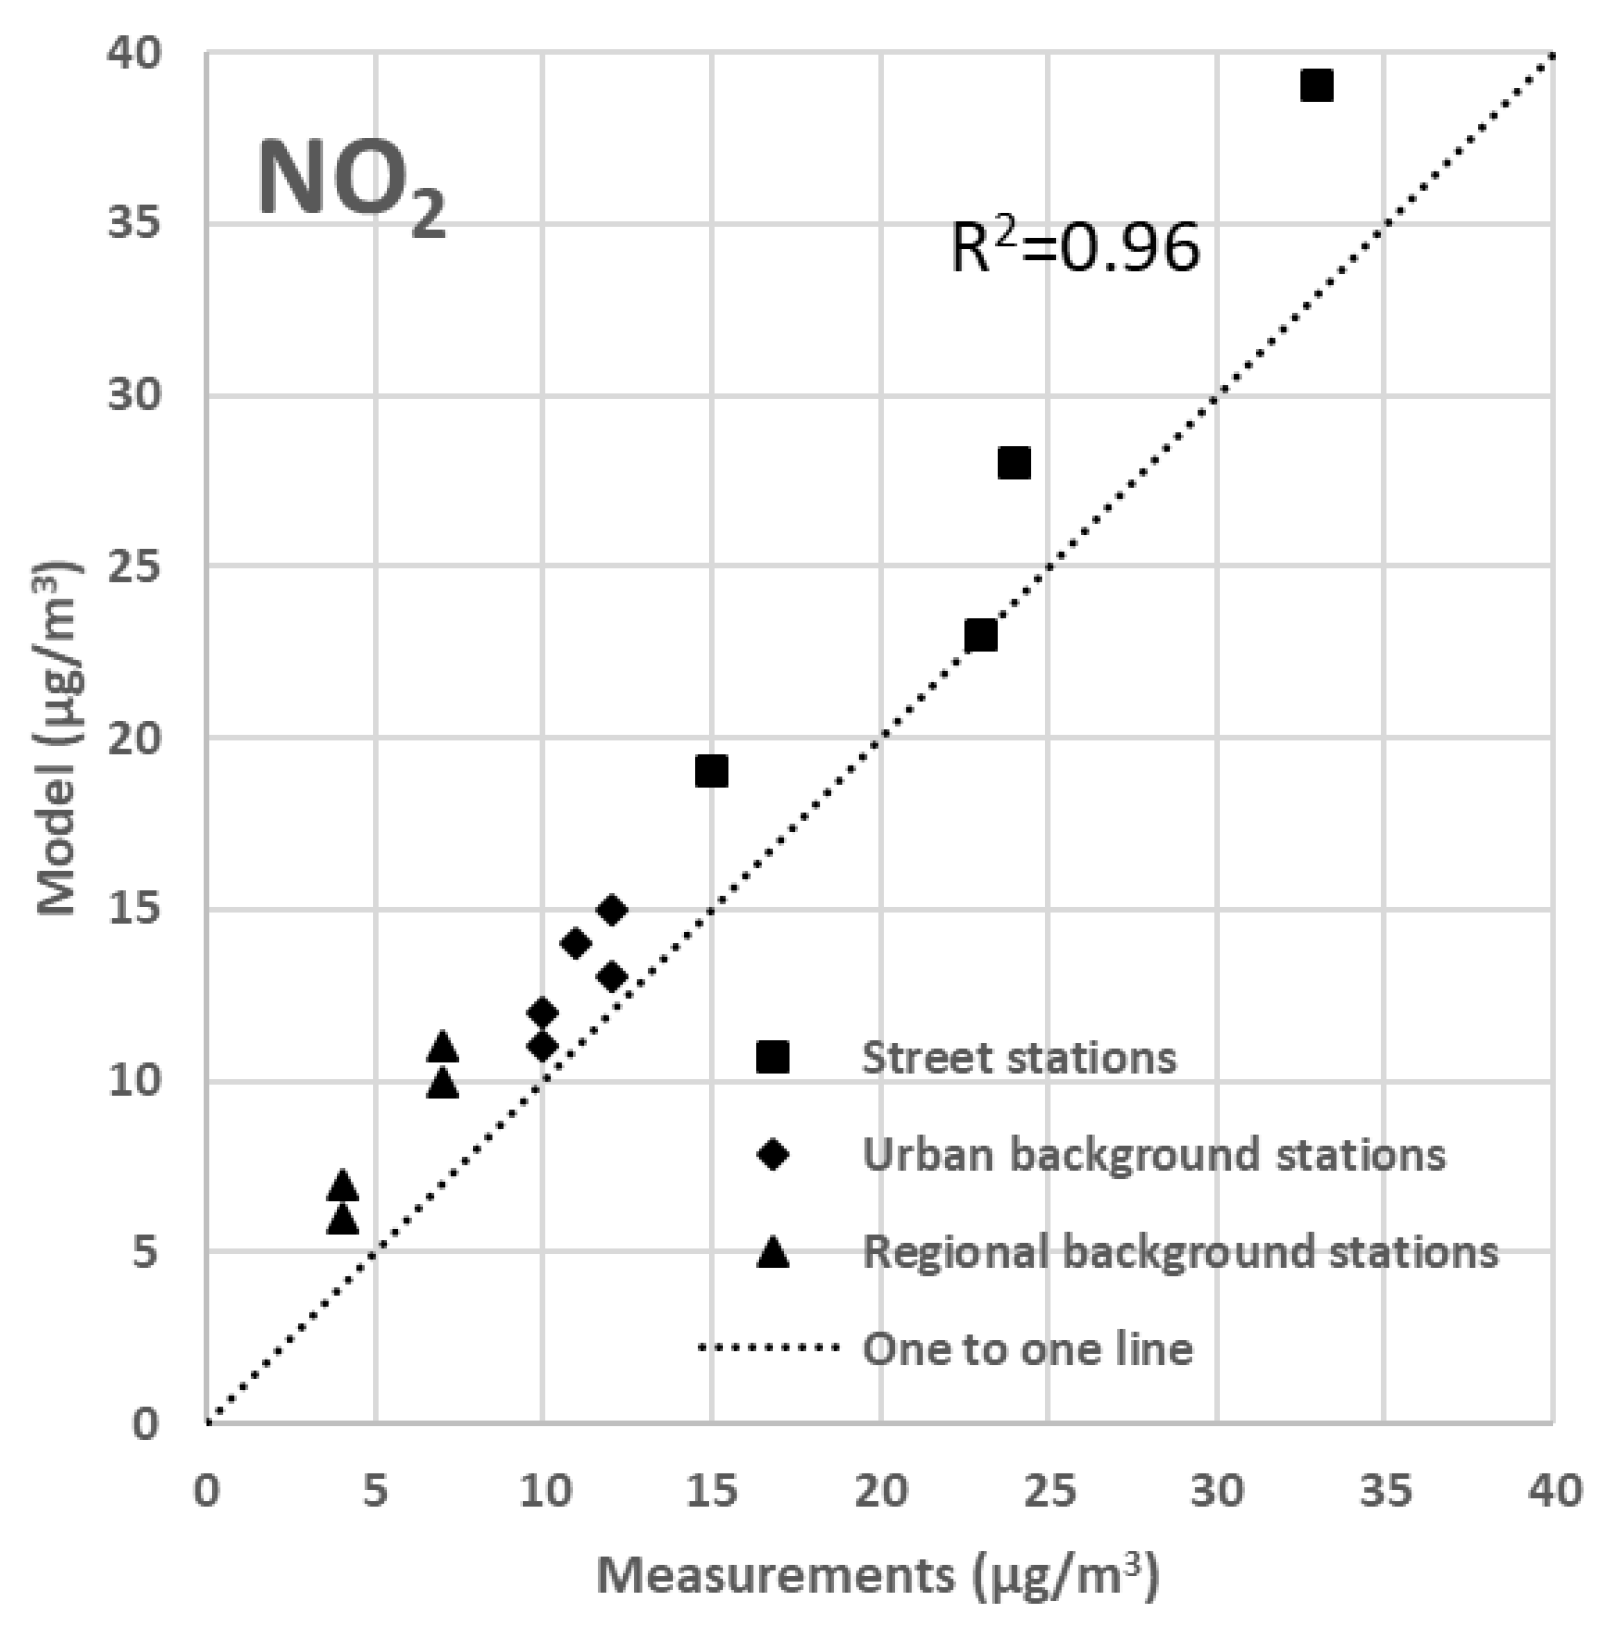
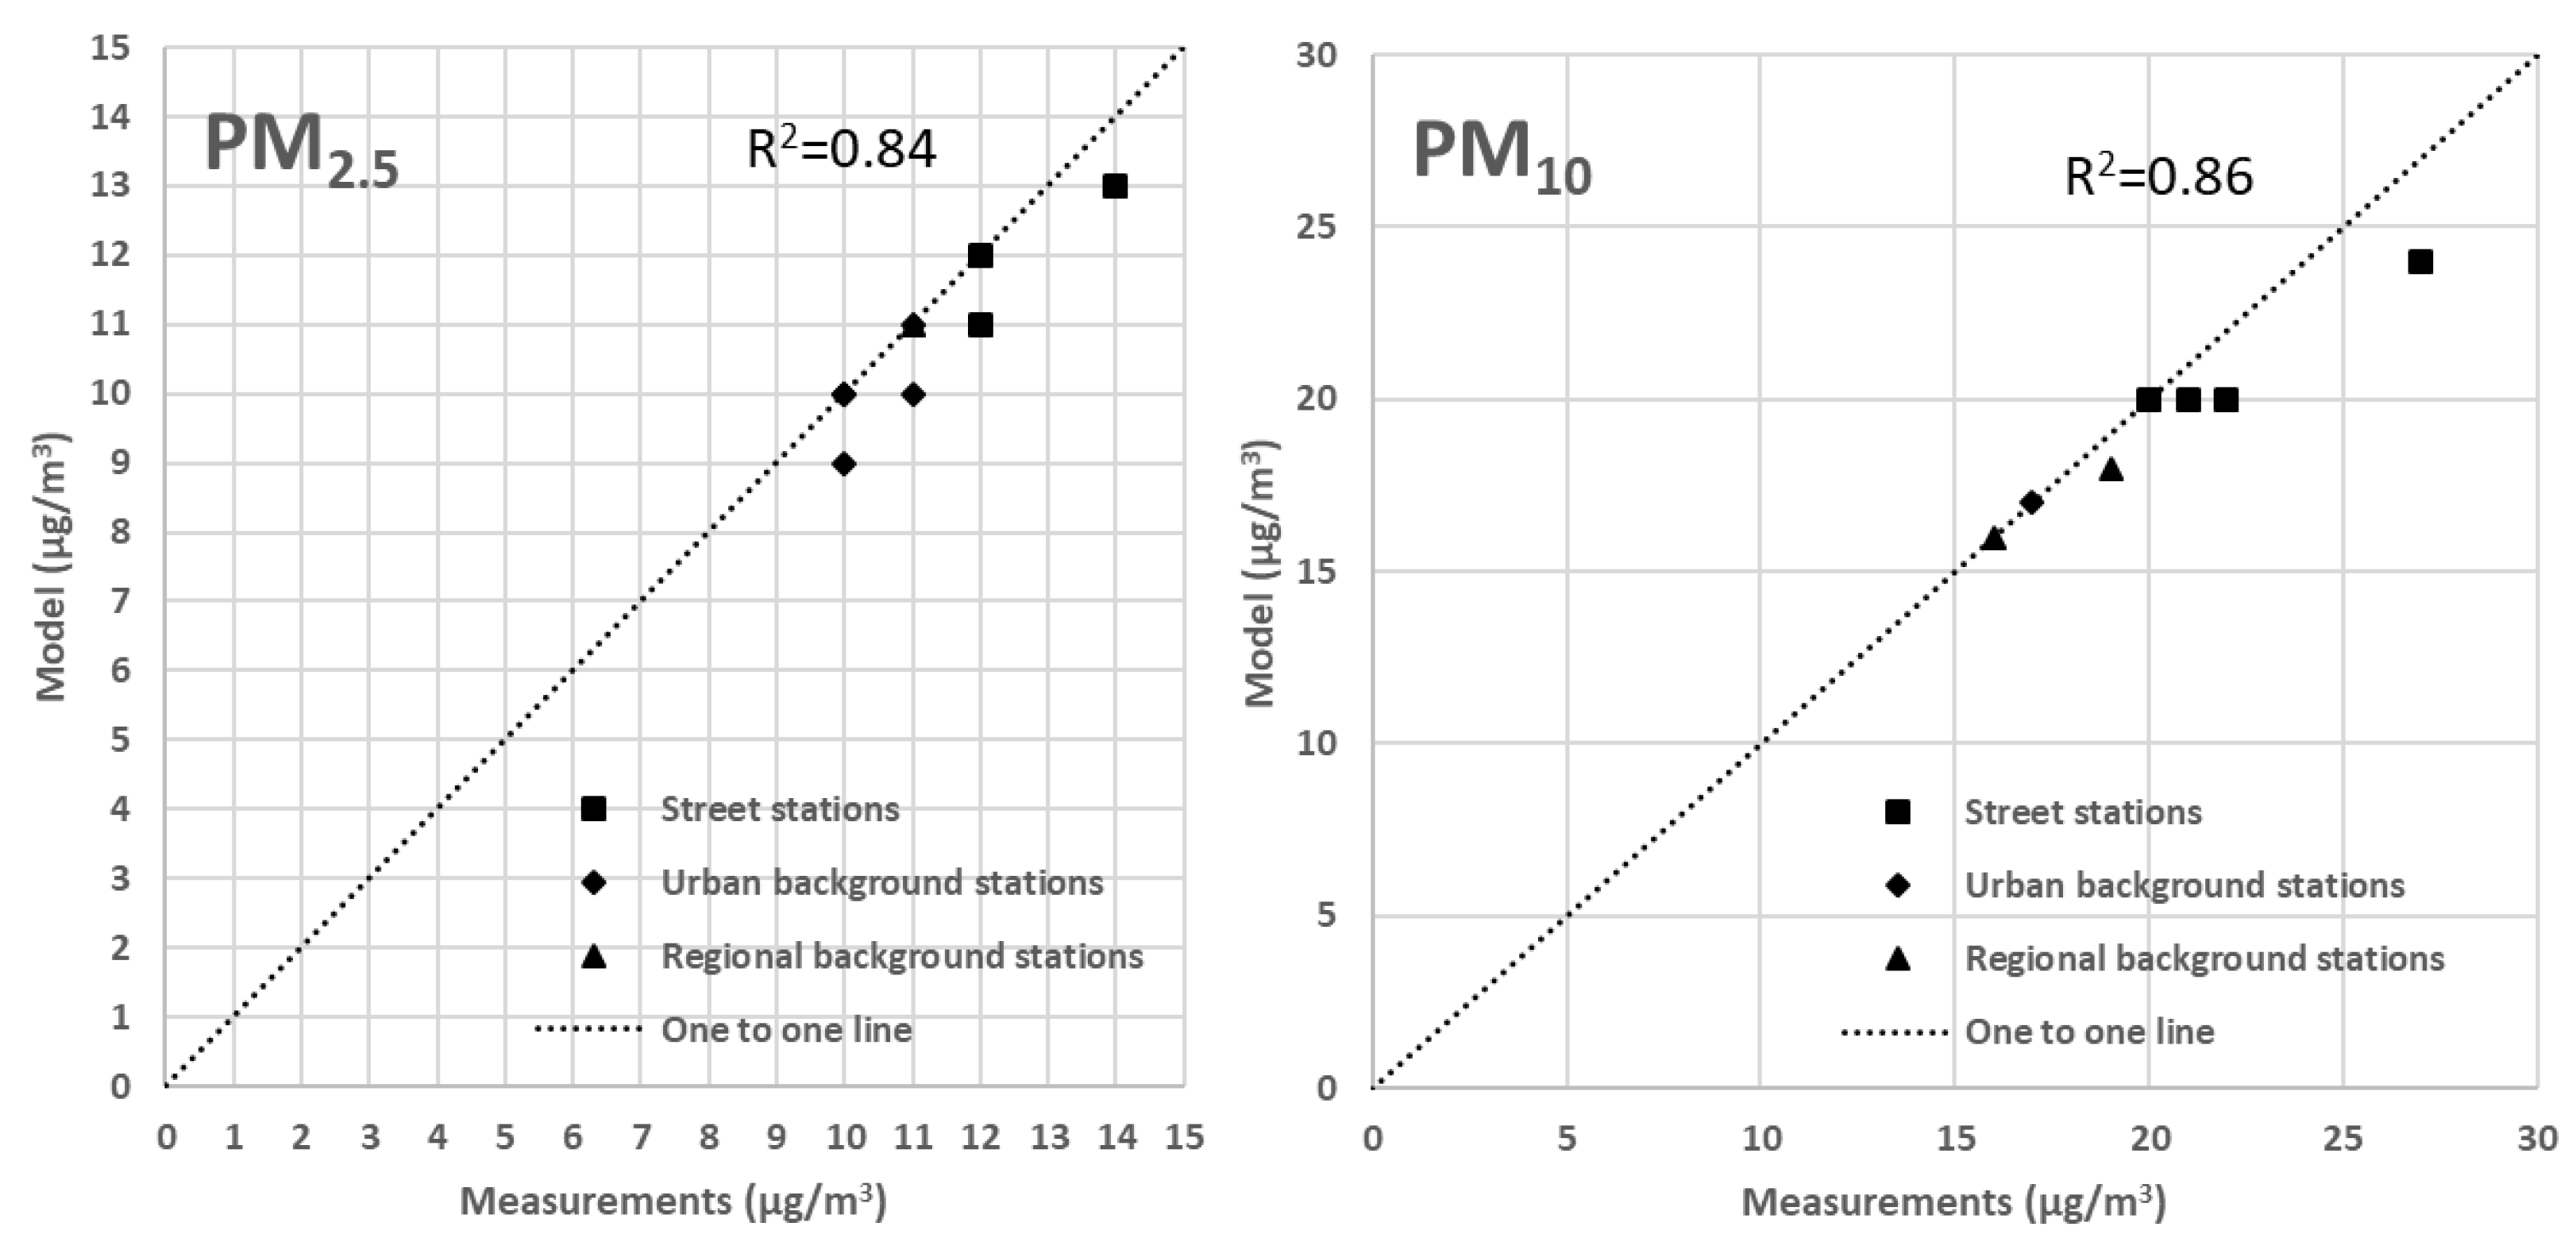
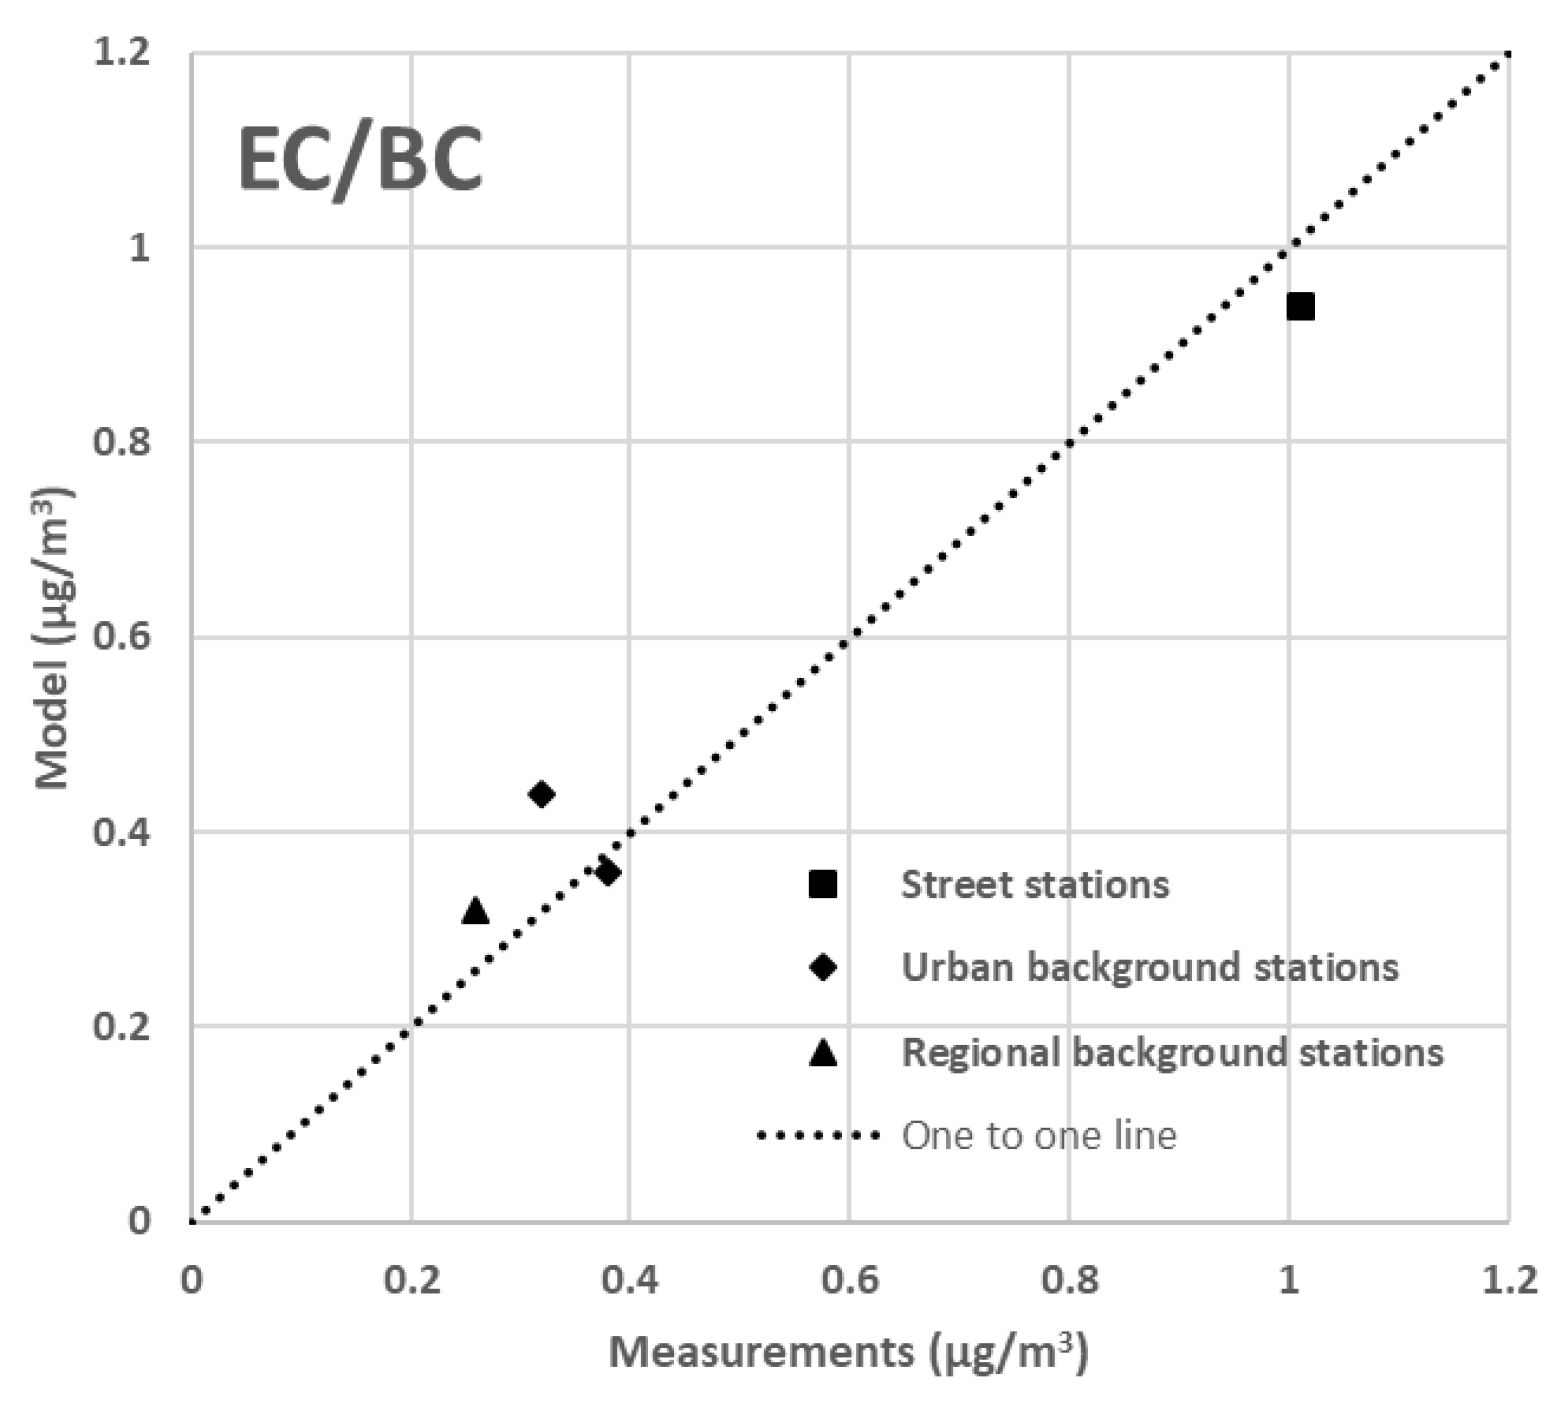
In the following section, the correlation and bias between modelled (by the full model chain) and measured annual mean concentrations for the five pollutants in the study are shown in Figure 3, Figure 4 and Figure 5. The measured and modelled data used for Figure 3, Figure 4 and Figure 5 are included in Tables S1–S5 in the Supplementary Materials.
For NO2, the bias between model results and measurements ranges between 0% and 27% when compared to street stations, between 8% and 23% compared to urban background stations, and between 44% and 64% for regional stations. There is a relatively large overestimation at rural stations, indicating that predicted street concentrations at addresses in rural areas with low traffic levels are overestimated. The correlation is very high (R2 = 0.96), but as shown, the modelling system tends to overestimate NO2 compared to measurements (Figure 3).
For PM2.5, the bias between model results and measurements ranges between −8% and 8% when compared to street stations, and between −10% and 5% compared to background stations. For PM10, model results are slightly underestimated—in the range of −13% to 0% for street stations and for the background stations, and model results range from −10% to 0% of measurements (Figure 4).
The model system estimates the level of measurements for both street concentrations and background concentrations with high correlation for PM2.5 (R2 = 0.84) and PM10 (R2 = 0.86), though with a general slight underestimation.
BC is not measured in the Danish air quality monitoring programme, but EC (Elemental Carbon) is measured, which can be used as an indicator of BC. The modelled concentrations of BC in Air Quality at Your Street 2.0 are only 7% above the EC measurements for H.C. Andersens Boulevard in Copenhagen, the only available street station with EC measurements. The model results differ from measured EC concentrations between −6% to 38% for the background stations (Figure 5).
Despite a good correlation between calculations and measurements, there is still considerable uncertainty in the model results, as there is uncertainty in the emission inventory of BC. There is also uncertainty about how well measurements of EC are an indicator of BC. The Municipality of Copenhagen conducted an air quality monitoring program in Copenhagen, where BC was measured for the first time in 2021 on a busy street (Folehaven, with 39,200 vehicles daily) with traffic intensity comparable to that of H.C. Andersens Boulevard (55,500 vehicles daily). The annual mean concentration of BC was 1.14 µg/m3, comparable with modelled BC concentration at H.C. Andersens Boulevard in 2019 of 0.94 µg/m3 and measured EC concentrations of 1.01 µg/m3.
An indicative comparison was performed between modelled PNC concentrations from 2019 and measurements from 2020; see Table S5 in the Supplementary Materials. The modelling system overestimates by approximately 21% for H.C. Andersens Boulevard in Copenhagen (the only available street station) and largely overestimates for the background stations (by between 100% and 193%). This means that the modelled street contribution is much smaller than what the measurements suggest. The street contribution is the difference between the street concentration at H.C. Andersens Boulevard and the urban background concentration at the H.C. Ørsted Institute. The measured street contribution is approx. 4500–5700 number/cm3, and the modelled street contribution is only 1700 number/cm3. The comparison with the few available measuring stations for PNC therefore suggests that the modelled background concentrations are overestimated, and the street contribution is underestimated. The uncertainty in the modelling of particle numbers is, therefore, large. Although the modelled and measured PNC is within 21% for the busy street of H.C. Andersens Boulevard, it is “right” for the wrong reasons, as background concentrations are overestimated and the street contribution is underestimated.
In previous studies, the model chain DEHM-UBM-OSPM was compared to measurements from 2001 to 2016 (street station) and from 2001 to 2018 (background stations), which also showed that background concentrations are overestimated [22] and the street contribution is underestimated [23].

3.2. Geographic Distribution of Background and Street Concentrations for NO2

The geographical distribution of modelled background concentrations over land and marine areas in Denmark, calculated using DEHM/UBM and street concentrations calculated using DEHM/UBM/AirGIS, is shown in Figure 6 for NO2.
The geographic distribution of NO2 concentrations over land areas in Figure 6a shows a clear signal from local sources, especially for contributions from road traffic, with larger cities and major transport corridors having the highest concentrations. In marine areas, international ships passing through Danish waters are clearly reflected in high concentrations, as is domestic navigation. This also gives rise to elevated concentrations in nearby coastal land areas. The contribution of road traffic to the geographical variation on land is evident with increased street concentrations in major cities and along major transport corridors (Figure 6b).
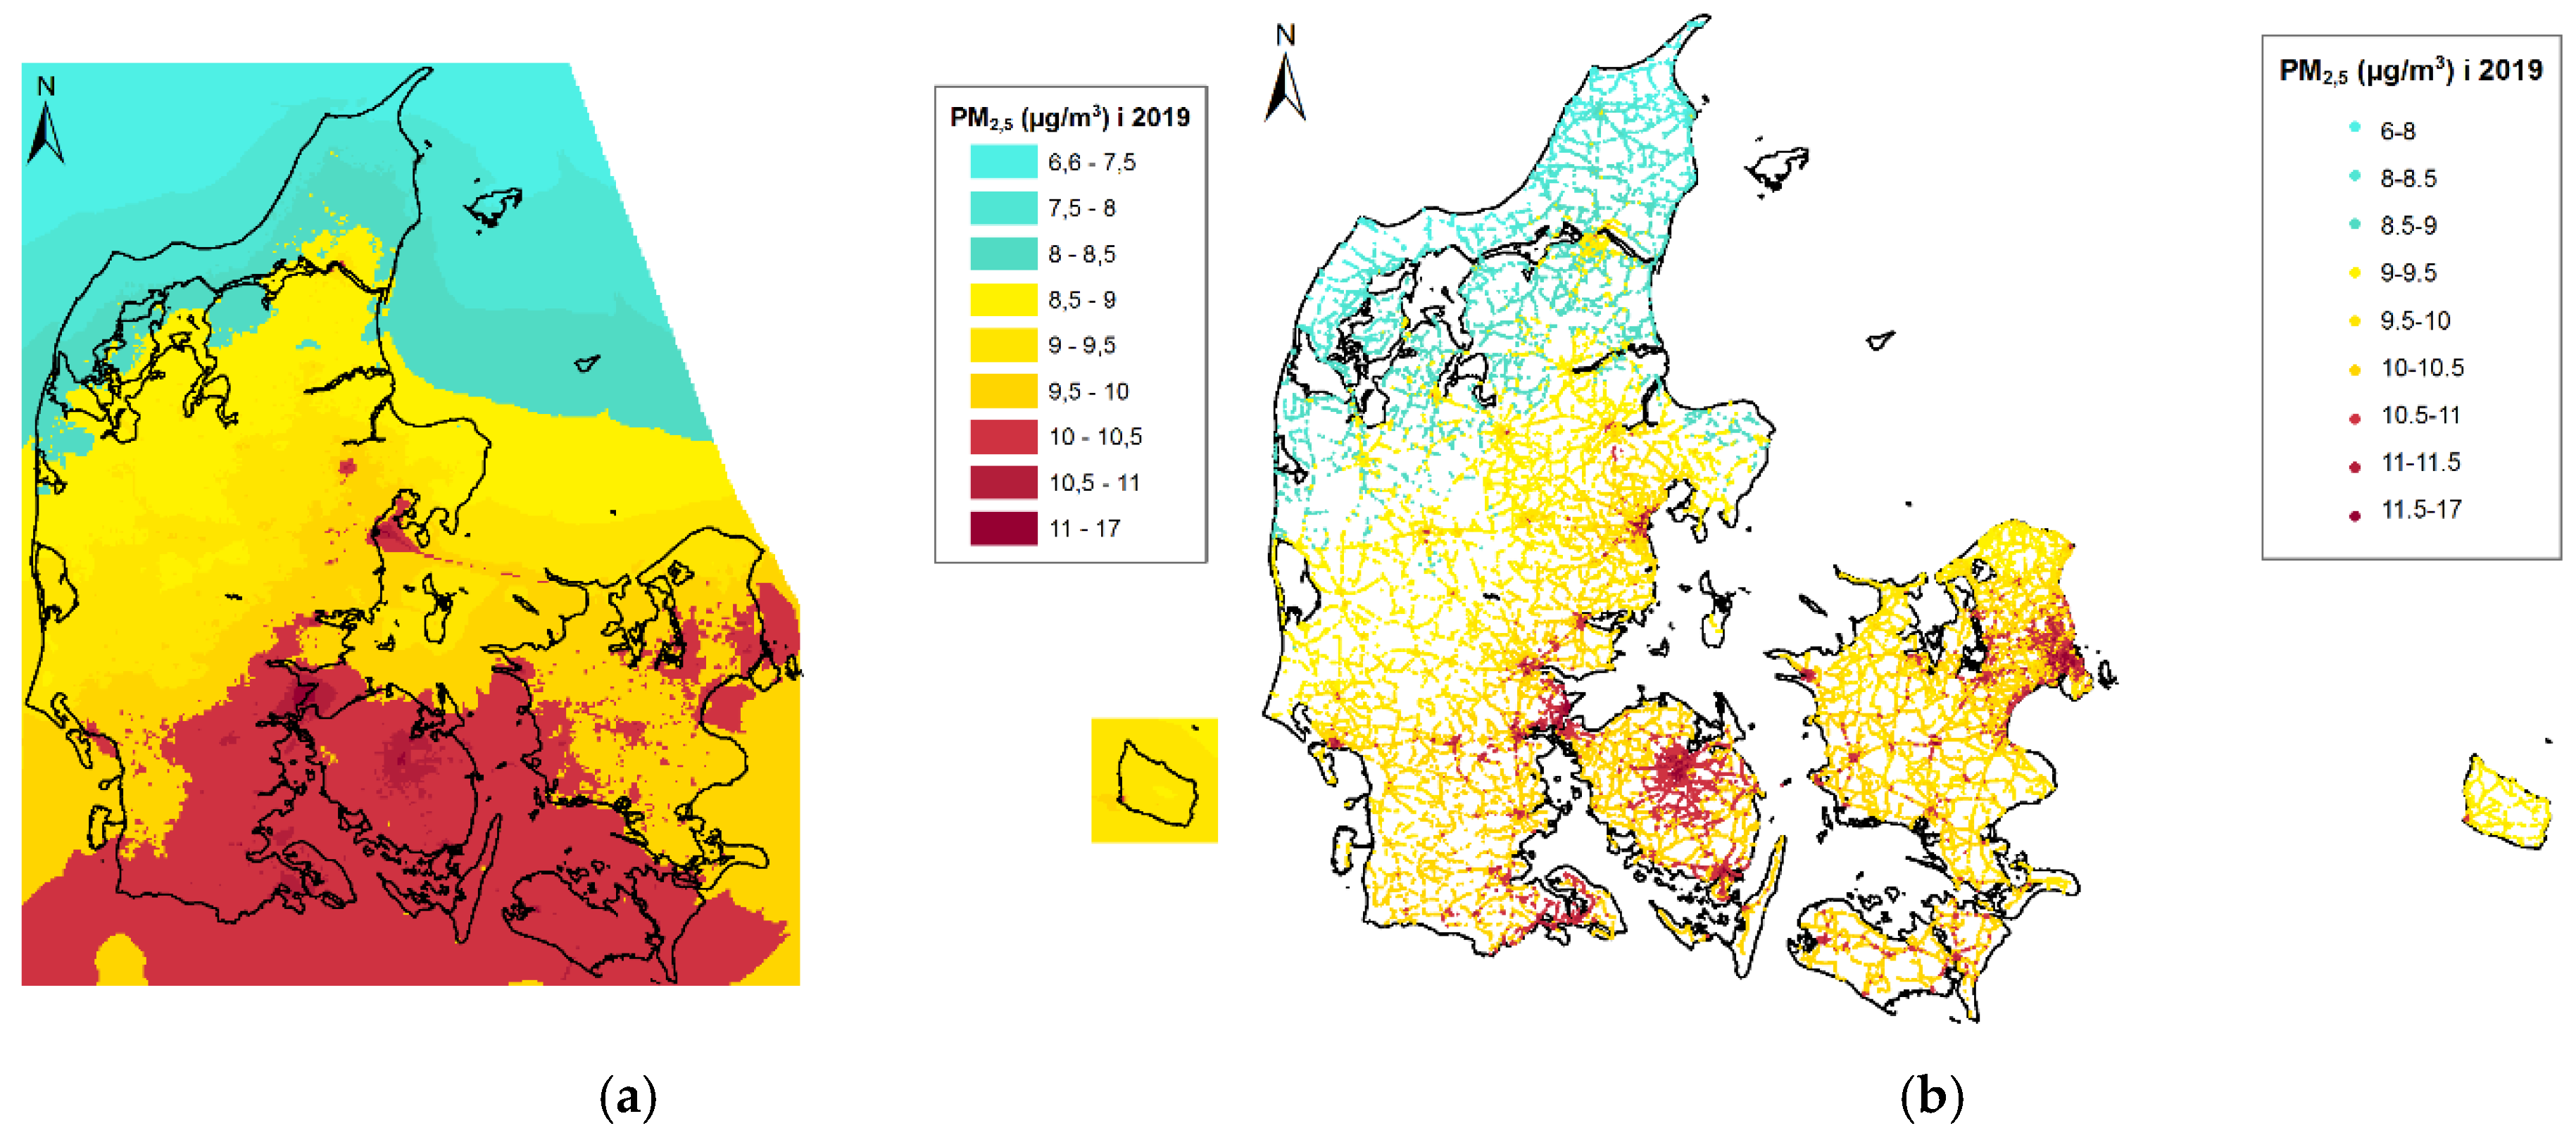
The geographical distribution of PM2.5 is shown in Figure 7.
The geographical distribution of background concentrations of PM2.5 (Figure 7a) has a different pattern from that of NO2, as there is a clear gradient from south to north, with higher PM2.5 concentrations in the southern than in the northern part of Denmark. This is because PM2.5 concentrations are dominated by regional background pollution, which again is dominated by long-range transport from Western and Central Europe.
The gradient from south to north is also shown in the street concentrations of PM2.5 (Figure 7b), but contributions from urban areas and busy streets are also seen to contribute to locally higher concentration levels.
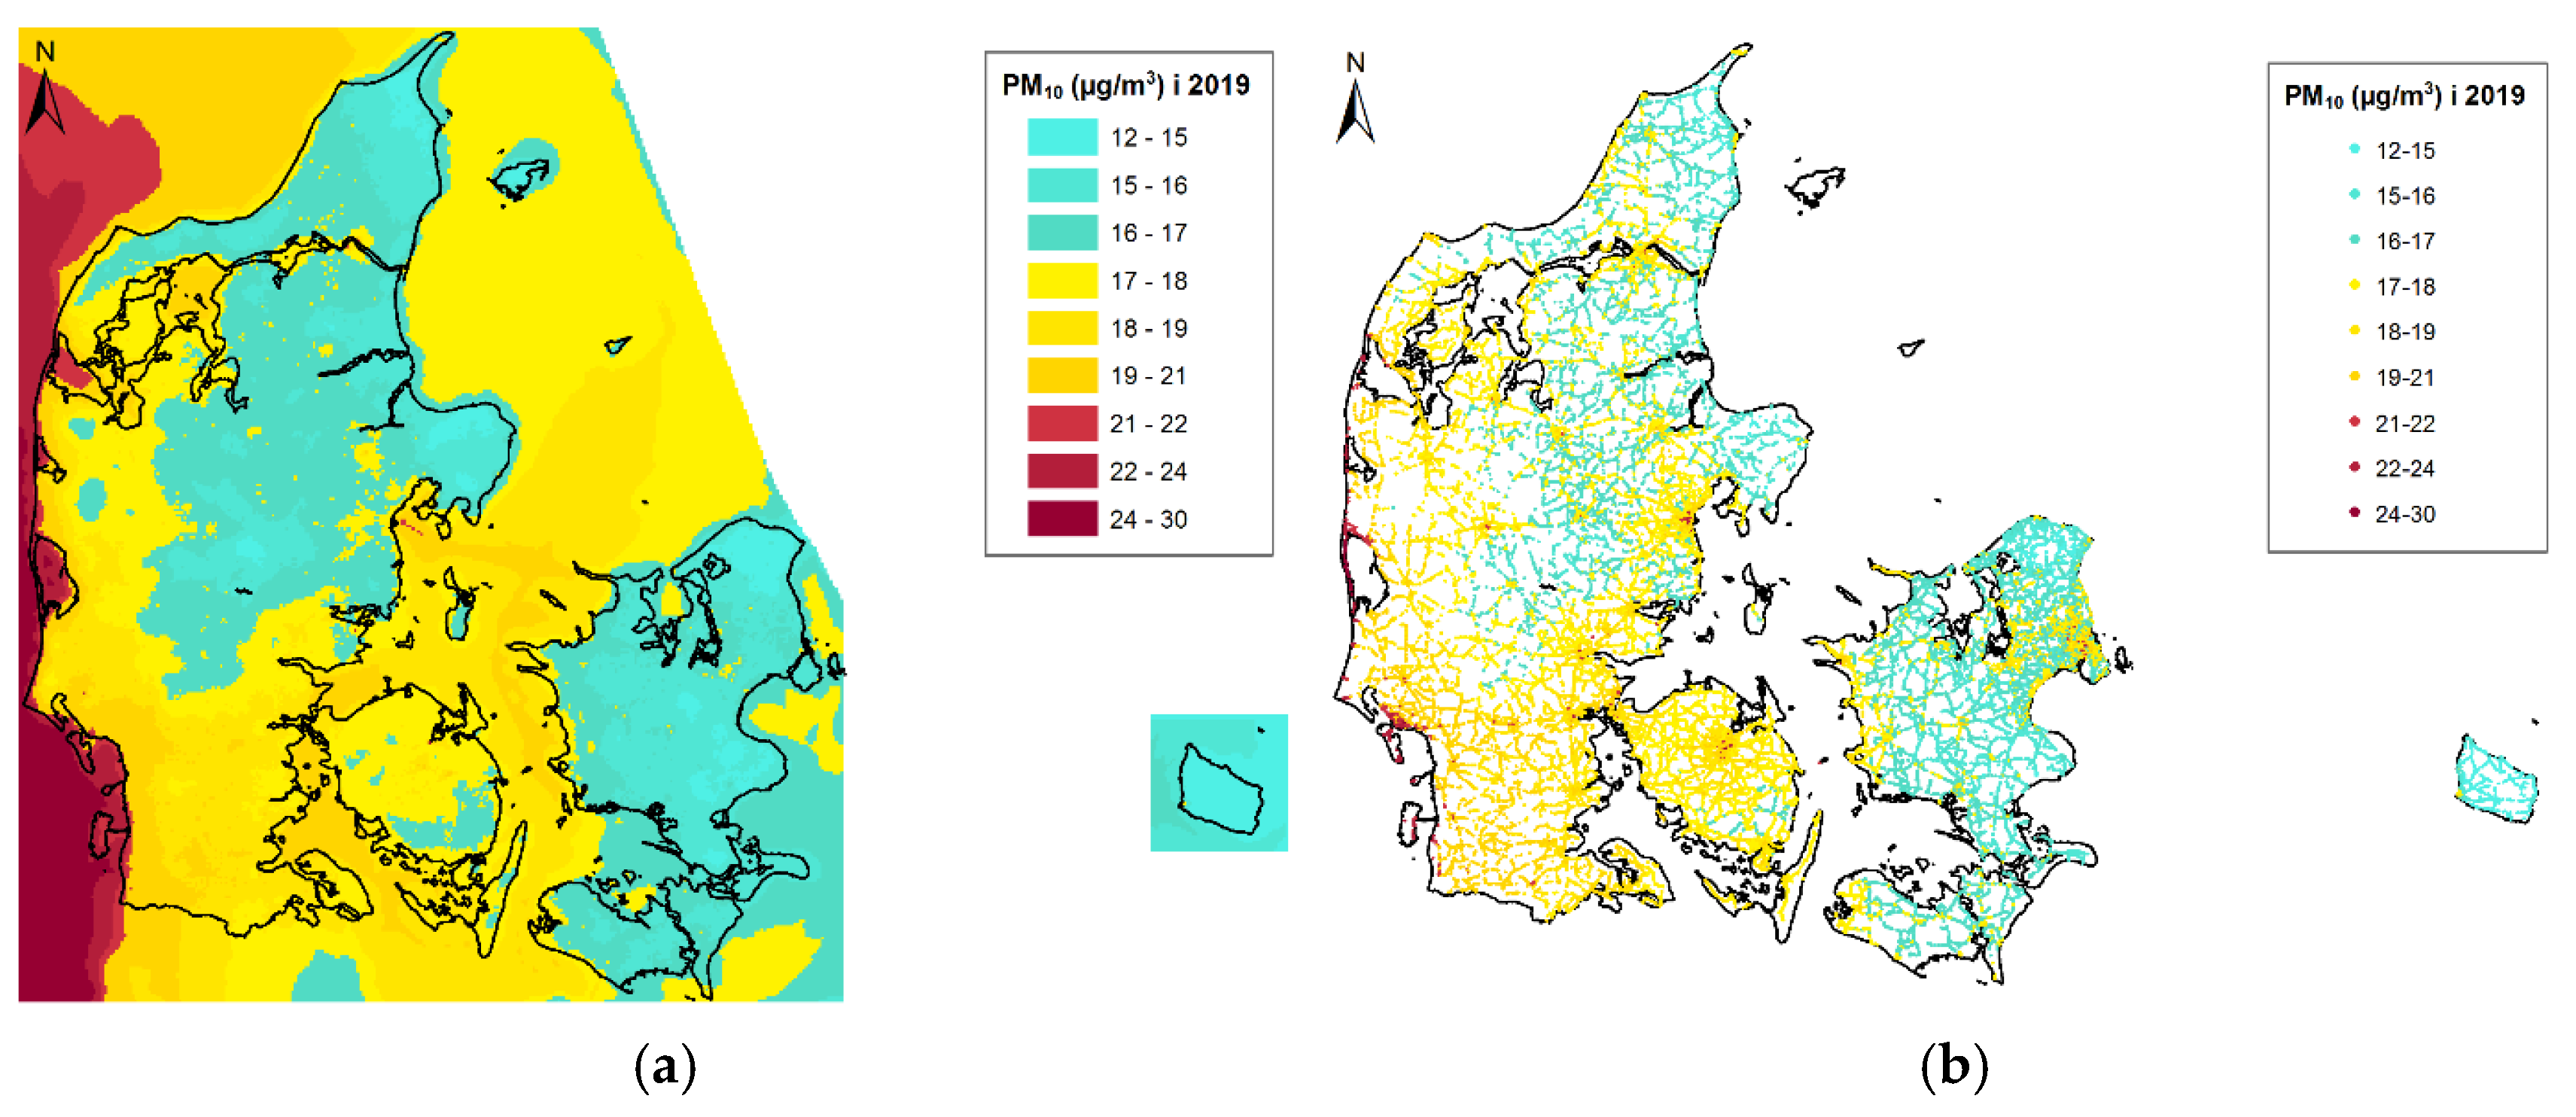
The geographical distribution of PM10 is shown in Figure 8.
The geographical distribution of background concentrations of PM10 is clearly influenced by contributions from sea salt formed by wind-driven emissions from sea spray (Figure 8a). This is seen as high PM10 concentrations along the west coast of Jutland and, to a lesser extent, on the western coasts of the islands in the inland waters. This is due to the predominant westerly wind. There are also generally high concentrations in the sea areas, but they decrease from the North Sea to the Baltic Sea due to a decrease in salinity. The geographical variation of street concentrations of PM10 (Figure 8b) can be seen to be characterized by the variation in background concentrations, and contributions from road traffic give rise to elevated concentrations, especially in the larger cities.
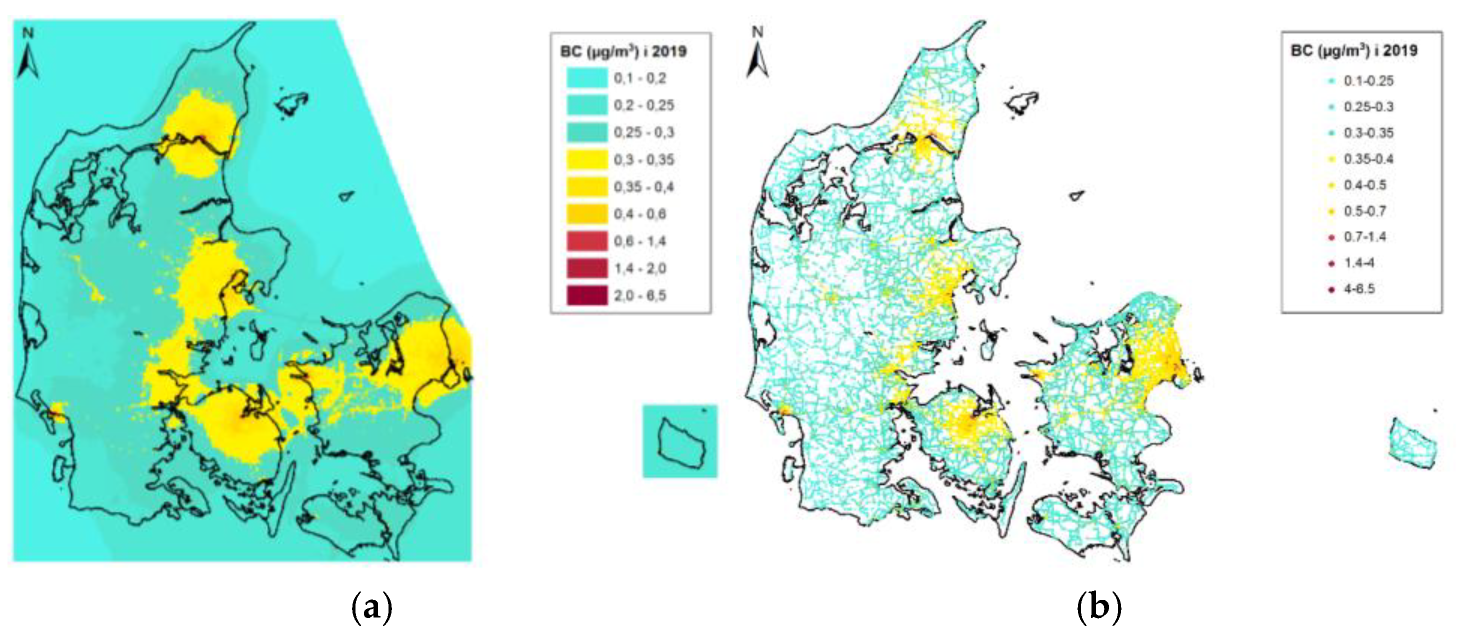
The geographical distribution of BC is shown in Figure 9.
In addition to regional contributions, the geographical distribution of background concentrations of BC is dominated by combustion sources from road traffic, residential wood combustion, and power plants, but also, to some extent, from ships. Elevated concentrations occur in and around major cities.
A detailed analysis of the geographic variation of modelled BC shows that the highest BC concentrations occur locally around power plants and large industrial plants, such as the cement factory of Aalborg Portland in the northern part of Jutland.
Background concentrations have a clear influence on the geographical variation of street concentrations. There are also increased BC concentrations on busy roads, and residential wood combustion can play a significant role locally in elevated BC concentrations.
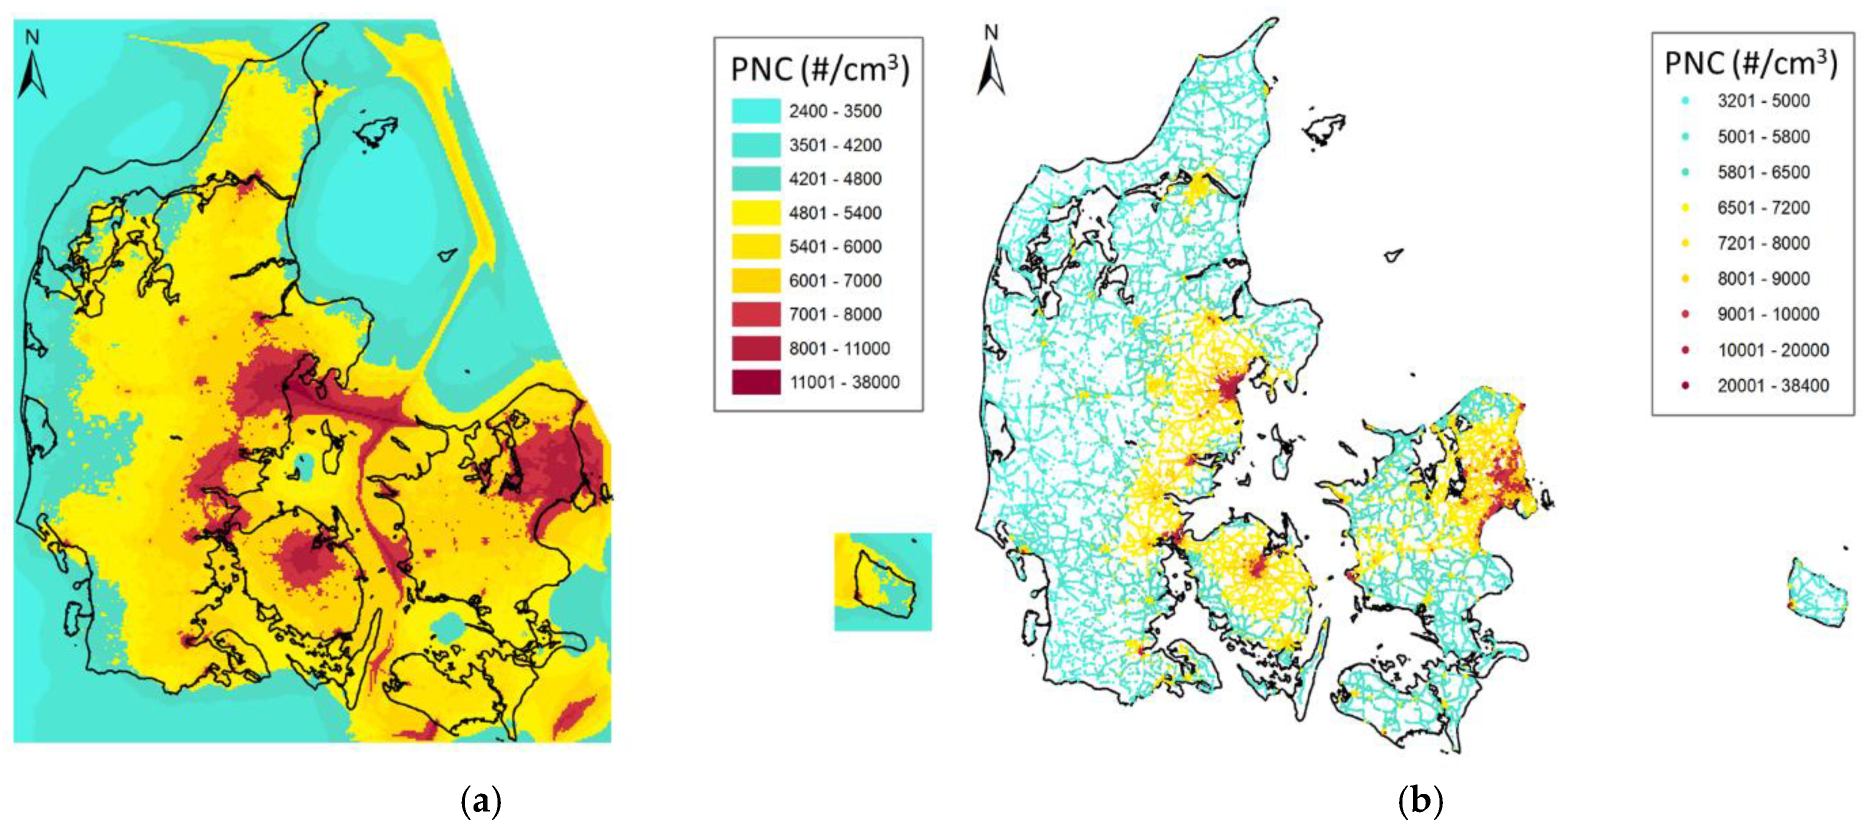
The geographical distribution of PNC is shown in Figure 10.
There is considerable uncertainty related to both the level and the geographical distribution of PNC, as the modelling system overestimates the background contribution [22] and underestimates the street contribution when compared with measurements [23]. There is therefore less geographical variation in the modelled particle number concentrations than the measurements suggest. An in-depth evaluation of model results from the model chain DEHM-UBM-OSPM against measurements stations spanning up to 18-year-long measurement time series is available in [23] for Danish measurement stations and in [22] for Danish and selected European measurement stations.

3.3. Comparison with Limit Values and WHO Guidelines and Trends in Exceedance from 2012 to 2019

Calculated concentrations were compared to limit values and WHO guidelines for air quality.
EU limit values from 2008 are valid legislation in Denmark for the two model years 2012 and 2019 [2]. The Ministry of the Environment/Danish Environmental Protection Agency is responsible for compliance with the limit values. The limit value for the annual mean of NO2 is 40 μg/m3, 25 μg/m3 for PM2.5, and 40 μg/m3 for PM10. Because the limit values are defined as an integer, there is exceedance if, for example, the concentration reaches a value of 40.5 μg/m3 for NO2. In the new air quality directive from October 2024 [1], the revised limit values for annual means are 20 μg/m3 for NO2, 10 μg/m3 for PM2.5, and 20 μg/m3 for PM10. Member states must comply with these limit values by 2030.
The World Health Organisation (WHO) provided new air quality guidelines in 2021 [28]. The WHO guidelines for annual average concentrations are substantially lower compared to former and current EU limit values for PM2.5 (5 μg/m3), PM10 (15 μg/m3), and NO2 (10 μg/m3). These guidelines are not legally binding.
There are no limit values or WHO guidelines for BC and PNC.
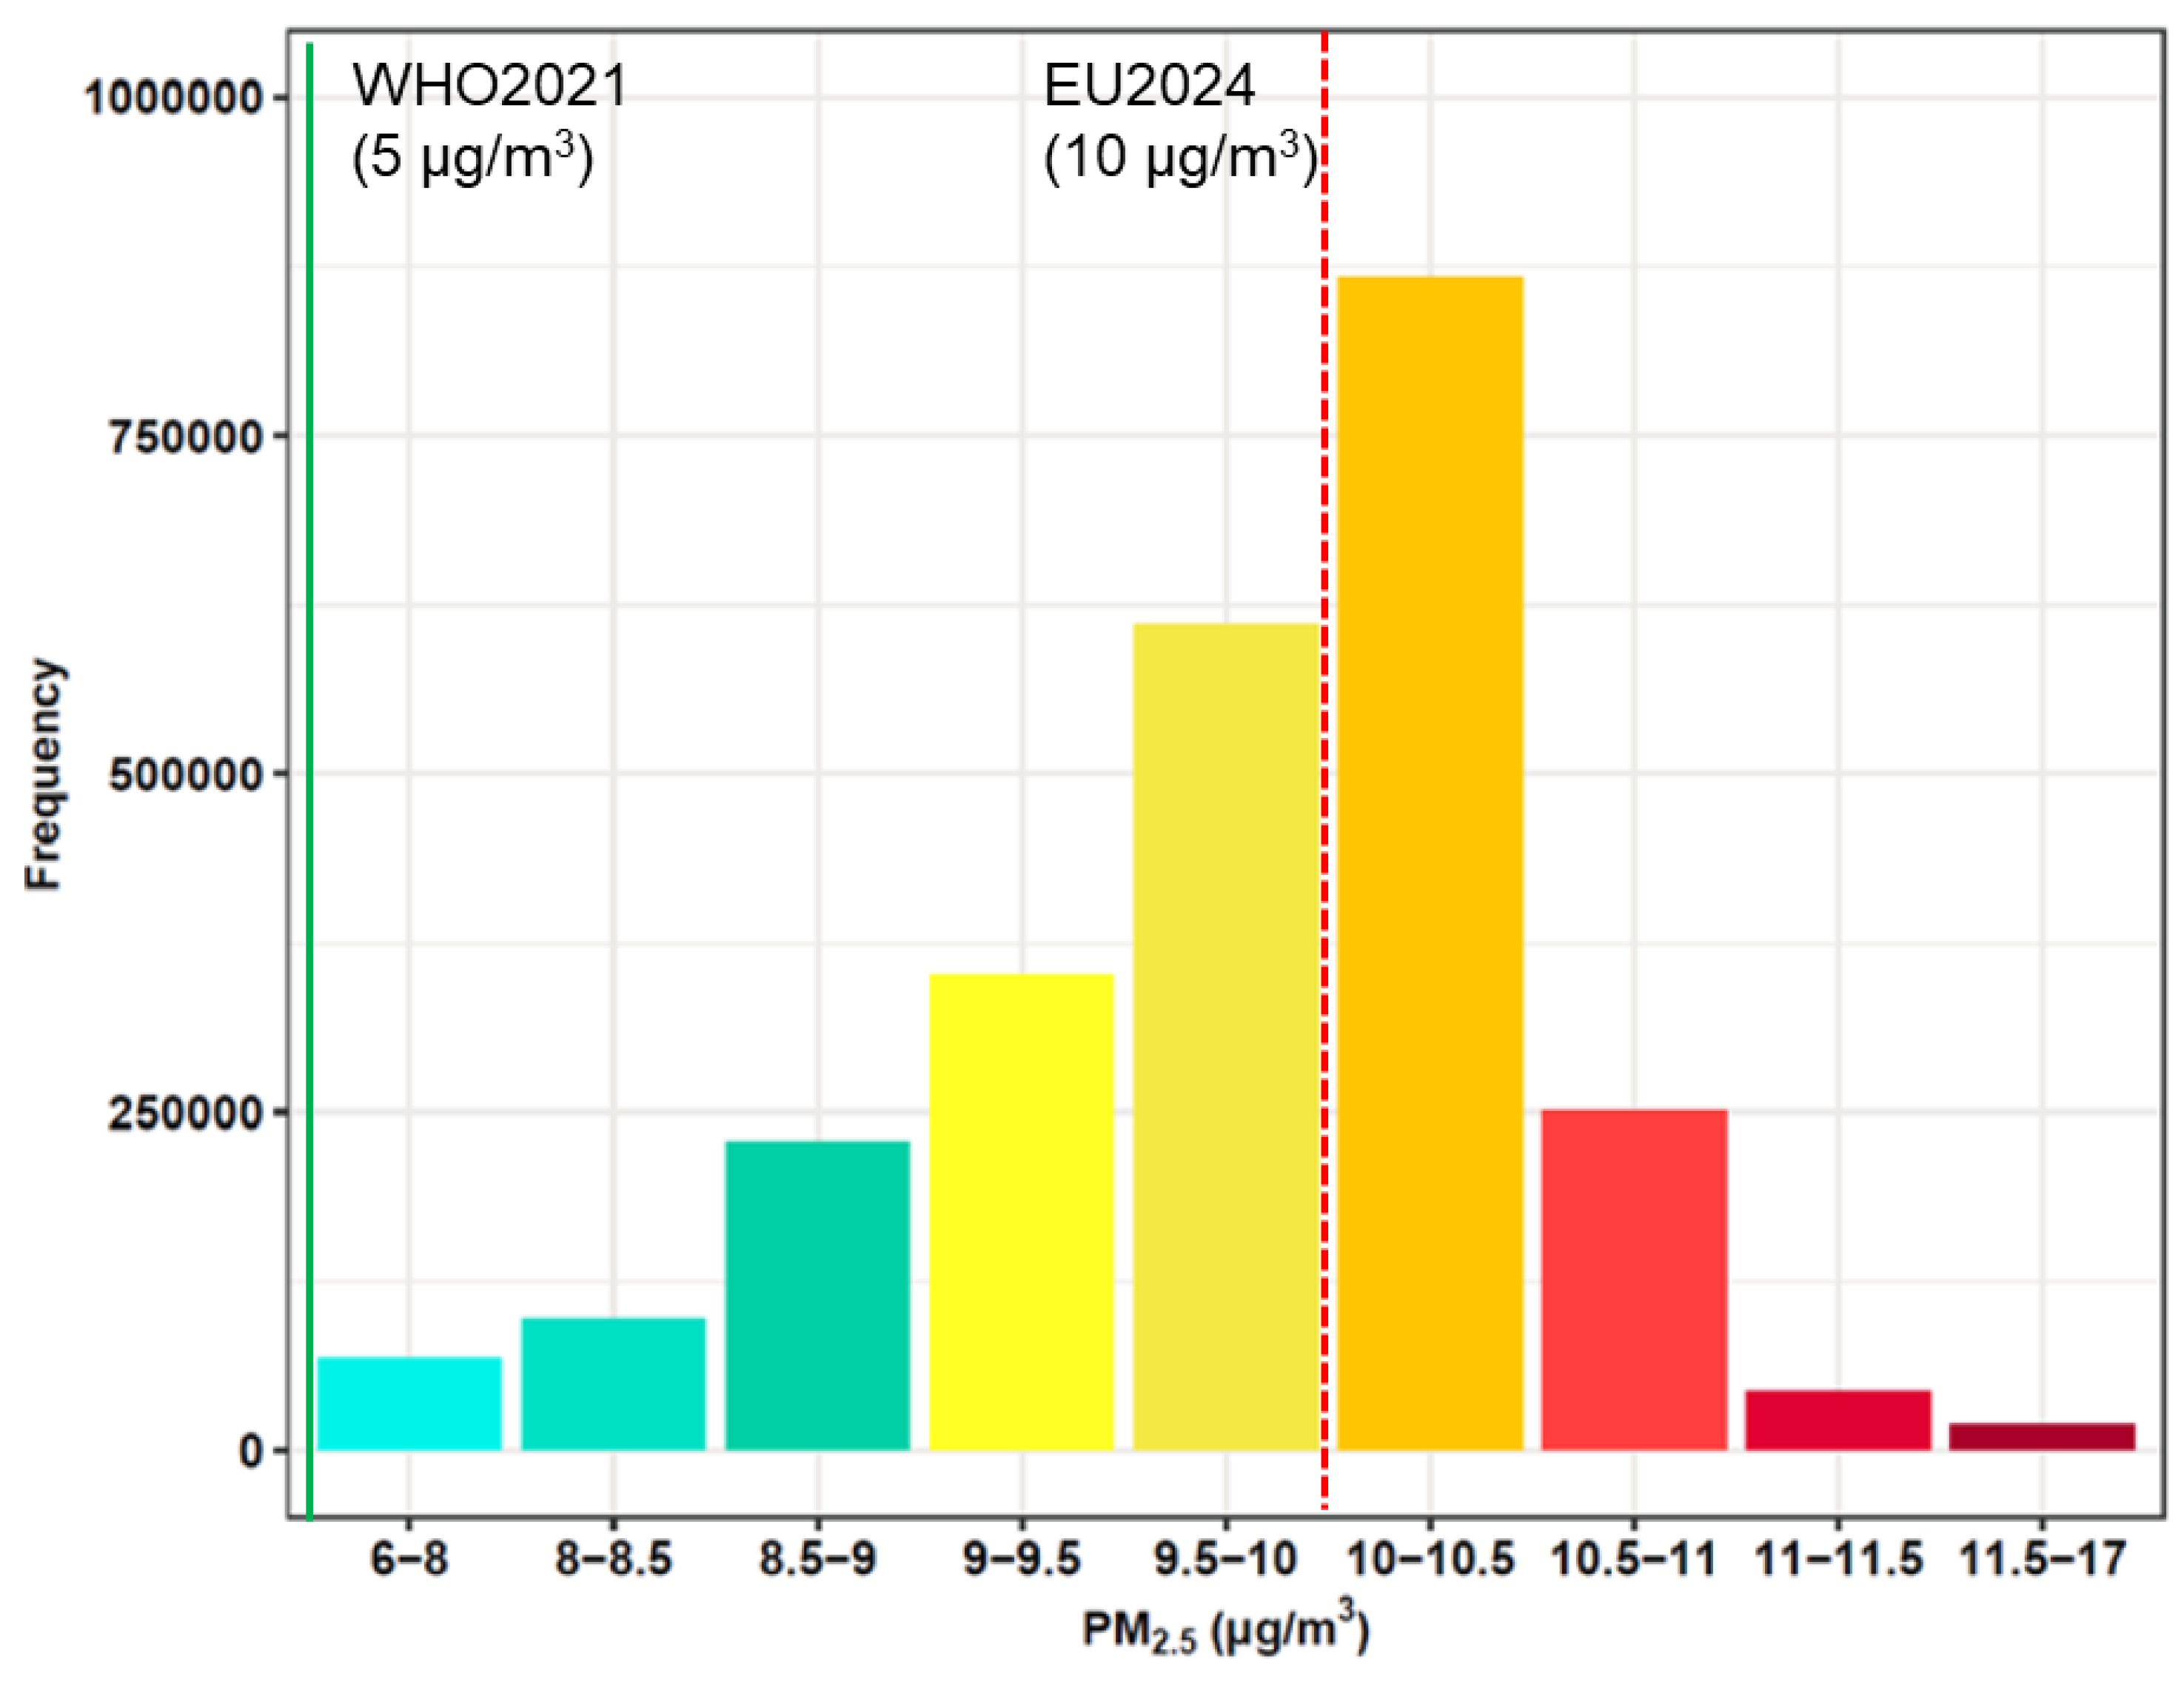
Figure 11, Figure 12 and Figure 13 show the frequency distributions of the annual average of modelled address-level concentrations in 2019 in Denmark for NO2, PM2.5, and PM10, respectively, besides the WHO guidelines and former [2] and current [1] EU limit values using the same colour bands as street concentrations in the above figures.
The frequency distribution for NO2 shows few exceedances of the former EU limit value and some exceedances of the new EU limit value, and approximately half of the addresses are exposed to levels above the WHO guideline.
In 2019, the value of 40.5 µg/m3 was exceeded for 27 addresses. Of these 27 indicative exceedances of the limit value for NO2, 24 were in Copenhagen and 3 were in Aarhus. Detailed analysis shows that in many cases, the traffic level in the Green Mobility Model (GMM) and the calculated street geometry are considered representative of the actual conditions. However, as the modelling system seems to overestimate NO2, it is possible that the number of exceedances of the limit value on the street segments is lower or even zero.
For 2012, 1123 indicative exceedances of the NO2 limit value were calculated by Air Quality at Your Street 1.0. There were exceedances in Copenhagen and the surrounding area, as well as in Aarhus and Aalborg in 2012. Thus, the number of indicative exceedances decreased drastically from 2012 to 2019. In addition, the calculated maximum concentration also decreased from 64.6 μg/m3 to 47.6 μg/m3. The decrease in the modelled concentrations and, thus, in the number of calculated indicative exceedances, is consistent with the general decrease in measured NO2 concentrations at the monitoring stations of Denmark’s air quality monitoring programme [24].
NO2 has been of particular interest in the air quality monitoring programme in Denmark, since the limit value for the annual mean value was exceeded at traffic stations until 2016 [24].
The frequency distribution for PM2.5 for 2019 shows that calculated levels are significantly below the former EU limit value for the annual mean of PM2.5. However, levels at many addresses exceed the new EU limit value. All addresses are exposed to levels above the WHO guideline. Calculated levels for 2012 were also well below the former EU limit values.
The frequency distribution for PM10 for 2019 shows that calculated levels are well below the former EU limit value, but levels at some addresses exceed the new EU limit value. Almost all addresses are exposed to levels above the WHO guideline. Calculated levels for 2012 were also well below the former EU limit values.

3.4. Comparison with Similar Systems

A comparable freely available air quality map based on multi-scale modelling was also launched by SHMI for Sweden in 2023, including NO2, PM2.5, and PM10 for 2019 ([29]; https://natmodluft.smhi.se, accessed on 20 November 2025). There are many similarities between the Danish and Swedish systems, as they both are based on multi-scale dispersion modelling with regional, urban background, and street models, and both street models consider street canyon effects using building footprint data and a national road database for traffic data. Some of the major differences are that the Danish system also includes BC and PNC and all roads, whereas the Swedish system only includes major roads. The Danish system provides background concentrations with a resolution of 1 km × 1 km and street concentrations for all addresses, whereas the Swedish system provides an interpolated concentration field based on points calculated at a 50 m × 50 m resolution based on a higher spatial resolution than 1 km × 1 km based on more detailed representations for road traffic, large point-sources, and small-scale residential heating. The Swedish system also provides predictions for 2030, assuming fulfilment of the national emission reduction commitments for 2030 in the NEC directive.

3.5. Potential Transferability and Scalability

Air Quality at Your Street is presently only applied to Denmark. However, the multi-scale model chain could also be applied to other countries, provided that the required input data are available. The regional scale model covers the Northern Hemisphere, and national emissions for a new country should be at a resolution of 1 km × 1 km to provide input for the urban-scale model. COPERT emissions are integrated into the street scale model and will match conditions in countries that rely on European emission standards, but it is also possible to adjust the emission module to other conditions. GIS data must be available at a national scale for roads with traffic data, building footprints with building heights and address points. Such data are becoming increasingly available in many countries but could also pose challenges in some countries.
Computer time is mainly related to the number of calculation points for the OSPM® and needs to be considered for the domain covered. Although OSPM® calculates one year of data for one location in approx. 10 s of computer time on a standard PC, these calculations would still take about ¾ of a year if calculations were made for all 2.5 million addresses in Denmark. In the Danish study, we limited the OSPM® calculations to address locations along the GMM road network, which reduced the number to approximately 331,000 addresses. The calculations were distributed across several servers to reduce the time required for calculations. Concentrations for the remaining address points (approximately 2,207,000) were retrieved from the value for urban background concentrations from the urban-scale model for the 1 km × 1 km grid cell they belong to. Generation of street configuration and traffic data for OSPM® with AirGIS also takes approx. 10 s per address.
Modelled concentrations at address locations can also be joined to population data, e.g., from the Danish Central Personal Registry (CPR), to provide an analysis of location-based population exposure to air pollution.
Exposure data can also be applied in integrated models to estimate health effects and welfare economic costs, as is the case in the Danish EVA-system (Economic Valuation of Air Pollution), where modelled concentrations from the regional- and urban-scale models are used together with population data, exposure–response relationship from the international literature, and valuation of health endpoints for premature deaths and morbidity [30].

3.6. Limitations of Model System

The air quality models DEHM/UBM/OSPM® and required inputs have undergone many improvements from 2012 to 2019.
The meteorological input for DEHM has been changed from output from the old NCAR MM5v37 weather forecast model [31], driven by NCEP FNL (Final) Operational Global Analysis data set on 1° × 1°, to output from the new NCAR WRFv4.1 model driven by ECMWF global ERA5 reanalysis on 0.25° × 0.25° [16]. The species were extended with, i.a., Secondary Organic Aerosols (SOA) and their precursors. Furthermore, emissions globally, regional to Europe, and close to Denmark have been updated with new, improved datasets with higher spatial resolutions, typically outside Denmark, from around a 50 km resolution to about 10 km, and close to Denmark from 50 km/1 km down to about a 10 km/1 km resolution. Finally, the parametrizations of the physics and chemistry processes in the DEHM model have been further improved.
Several major improvements have been achieved for UBM. In the 2012 version, the point sources were a part of the area sources. In the 2019 version, all major point sources are handled separately as separate plumes, released at the correct heights. There have also been major developments in the gridded emissions from the SPREAD model, where emissions in the different sectors have been improved. Three major improvements have been carried out for wood stoves. The number and location of wood stoves in 2012 were based on data from the Building and Housing Register (BBR), which relies on self-reporting of wood stoves. The 2019 dataset is based on data collected from registries of chimney sweepers, which provide more reliable data on numbers, type, and location. Emission factors have also been updated based on the international literature, and a model has been developed for the replacement and phasing out of wood stoves to better describe the stock and type of wood stoves. Emissions from railways, other mobile sources, and shipping, as well as their geographic distributions, have also been improved. For 2019, the model is driven by meteorological data using WRF instead of MM5.
A few improvements have been implemented in OSPM. The simplified emission model used in OSPM for the 2012 version has been changed to be fully consistent with the official COPERT methodology (EMEP/EEA, 2019), including all vehicle categories and subcategories, which led to an adjustment of some parameters in OSPM. Further, some tests have shown a certain ambiguity in defining street configurations, with exceptions for building heights, like streets with buildings on only one side. This ambiguity was eliminated by introducing the “general building height” parameter described in Ketzel et al. in 2012. Meteorological data from WRF are also used instead of MM5.
All the above-described changes have led to more consistent modelling results and better agreement between models and measurements.
The AirGIS system, which generates street configuration data and traffic data for OSPM® for each address based on GIS data for roads and traffic, buildings, and calculation points, has been streamlined and re-programmed from Esri ArcView (Avenue) to R and SQL to reduce computing time since Esri stopped supporting Avenue [15].
Despite improvements in the air quality models and input data, limitations related to spatial resolution remain in the 2012 and 2019 datasets, as both use a 1 km × 1 km resolution for background concentrations. This resolution in the background model is not sufficient to fully capture higher concentrations very close to local sources. These are, e.g., air pollution from highway traffic, railway traffic, wood-burning stoves and pellet boilers, and small industrial sources. The limitations of these sources are discussed in greater detail below.
Air quality at addresses very close to highways is underestimated, as the contribution from the highways is only accounted for within a 1 km × 1 km grid. All addresses are assigned to the nearby road, e.g., residential road and not to a highway, as the distance to the highway is longer. For addresses located close to a busy highway, the contribution from the highway can be substantial. Measurements of NO2 showed that concentrations close to a busy highway (~25 m) were about halved at a distance of ~100 m and reduced to about one third at ~400 m, and the model’s results show very little contribution above background levels at a distance of 1000 m ([4,32]). A possible approach to resolve the underestimation very close to highways and other main roads could be to develop a combined modelling system with both DEHM/UBM/OSPM and OML-Highway [33].
The modelling system also underestimates concentrations at addresses very close to the rail network with diesel-powered trains, as the contribution from the railways is only accounted for within a 1 km × 1 km grid. However, railway emissions are much lower than those from highways due to less traffic and the fact that more and more trains are electrified. A possible approach could be to develop a specific model setup for railways to more accurately account for the contribution from railways.
Air quality levels at address points located very close to busy intersections are directly influenced by vehicle emissions from more than one street. This may lead to underestimation, since OSPM® only accounts for vehicle emissions from the street where the calculation point is placed. This problem is partly addressed in the calculation procedure, as the busiest street is chosen to represent an address located close to an intersection.
The comparison between counted traffic volumes and traffic volumes predicted by GMM showed fairly high correlations, whereas the same did not apply for heavy-duty vehicles. Hence, assumptions were made with the standard vehicle distribution for heavy-duty vehicles depending on road type. This simplification adds to the uncertainty of the modelled concentrations when the standard share of heavy-duty vehicles differs from true values.
Although many improvements have been made in the emission inventory for residential wood combustion, the level and distribution of PM emissions from wood stoves are still uncertain in the emission inventory, as there are uncertainties in the specific wood use, and how specific user behaviour affects emissions [18,19]. Residential wood combustion is an important Danish emission source that constitutes approximately 58% of the national total primary PM2.5 emissions in Denmark in 2018 [17,34]. PM emissions from residential wood combustion are treated as an area source with a geographic resolution of 1 km × 1 km in the modelling of PM2.5 and PM10 concentrations, and hence, the impact of a single woodstove on the nearby environment—less than 1 km—is not reflected in the model approach. Therefore, the contribution from residential wood combustion is averaged. This means that the contribution of residential wood combustion is more smoothed out than can be expected in reality, since the contribution of each source is not modelled separately at an extremely high resolution. However, modelling the contributions of every wood stove within an area would require extensive information about each stove and its use. The same applies to small industrial sources. This would be possible to model within a smaller area, but would not be feasible for the entire country.
Based on the data quality for roads, railways, and wood stoves, it would be possible to increase the spatial resolution of the emission inventory to 100 m × 100 m to provide higher-resolution modelled background concentrations within manageable computer time.
Adjustment of the model results to obtain mass closure has been achieved by applying a factor for the missing mass for PM to obtain predicted PM2.5 and PM10 concentrations closer to measured concentrations for modelling of the background concentration with DEHM and UBM to be able to evaluate model results in comparison with air quality limit values and WHO guidelines. It is essential to achieve mass closure in the model to improve predictions for PM2.5 and PM10.
The reference year, 2019, represents the last full year before the COVID-19 pandemic, and it provides a robust pre-pandemic baseline that can be valuable for assessing long-term trends after recovery from the COVID-19 pandemic, e.g., traffic. In the national air quality monitoring programme, it is planned to update Air Quality at Your Street every five years, starting in 2026, to evaluate changes over time in population exposure. An update for a new year includes new traffic data from the Green Mobility Model (GMM), new address database and building footprints, and new emission and meteorology data for the applied air quality models, which are also constantly being improved.

4. Conclusions

This study evaluated the Air Quality at Your Street 2.0 modelling system to estimate annual mean concentrations of NO2, PM2.5, PM10, Black Carbon (BC), and particle number concentration (PNC) at the address level for all locations in Denmark in 2019. Modelling results showed good agreement with measured concentrations for NO2, PM2.5, PM10, and BC, with a slight general underestimation for PM2.5 and PM10. Indicative comparison between modelled and measured PNC indicates that modelled PNC was more uncertain, primarily due to overestimation of background levels and underestimation of street-level contributions, consistent with previous findings for other years by [22,23].
Key sources of model uncertainty include traffic input data, the spatial resolution of emission sources, and simplified treatment of, e.g., intersections. These uncertainties particularly affect predictions at individual addresses, where local conditions deviate from model assumptions. For example, concentrations may be underestimated near major roads, railways, or areas with residential wood combustion—sources represented with limited spatial detail. This affects the ability of the model to fully resolve exposure hotspots, even though it captures national-scale trends and geographic variation well.
Analysis of modelled concentrations against regulatory benchmarks revealed that exceedances of the former EU NO2 limit value nearly disappeared between 2012 and 2019, dropping from over 1100 addresses to fewer than 30, reflecting substantial air quality improvements. However, a large share of addresses still exceeds the new EU limit values and WHO guidelines (approximately half of the addresses).
For PM2.5, modelled concentrations remained well below the former EU limit value in both 2012 and 2019. However, a significant number of addresses exceeded the new EU limit value in 2019, and all addresses were above the WHO guideline, highlighting continued health concerns related to fine particulate matter.
Similarly, PM10 concentrations were consistently below the former EU limit value in both 2012 and 2019, yet some addresses exceeded the new EU limit in 2019, and nearly all exceeded the WHO guideline.
In general, the modelled street-level concentrations provide a reliable representation of annual mean air quality levels across Danish addresses, capturing the geographic distribution and relative differences between areas for NO2, PM2.5, PM10, and BC. In contrast, PNC estimates show higher uncertainty, with background concentrations generally overestimated and local street contributions underestimated.
Air Quality at Your Street 2.0 provides a robust framework for national-scale, high-resolution air quality screening. It supports regulatory assessment, environmental planning, and public access to local air pollution data via an interactive web platform (http://luftenpaadinvej.au.dk, accessed on 20 November 2025).

Supplementary Materials

The following supporting information can be downloaded at: https://www.mdpi.com/article/10.3390/atmos16121346/s1, Table S1. Comparison of annual means for modelled and measured NO2 concentrations in 2019. Table S2. Comparison of annual means for modelled and measured PM2.5 concentrations in 2019. Table S3. Comparison of annual means for modelled and measured PM10 concentrations in 2019. Table S4. Comparison of annual means for modelled BC and measured EC concentrations in 2019. Table S5. Indicative comparison of annual means for modelled and measured PNC. Model results for 2019 and measurements for 2020 are presented (11–478 nm).

Author Contributions

Conceptualization, S.S.J.; Methodology, S.S.J., M.K., J.B., J.H.C., J.K., V.H.V., L.M.F., C.G.; Software, M.K., J.B., J.H.C., J.K., V.H.V.; Validation, M.K., J.B., J.H.C., T.E., S.S.J.; Formal Analysis, M.K., J.B., J.H.C., J.K., V.H.V.; Investigation, M.K., J.B., J.H.C., J.K. and V.H.V.; Data Curation, S.S.J., M.K., J.B., J.H.C., J.K., V.H.V., L.M.F., C.G., T.E., O.-K.N. and M.S.P.; Writing—Original Draft Preparation, S.S.J.; Writing—Review and Editing, All; Visualization, M.K., J.K., J.B., S.S.J.; Supervision, S.S.J.; Project Administration, S.S.J. All authors have read and agreed to the published version of the manuscript.

Funding

This study was funded by the Danish National Monitoring and Assessment Programme for the Aquatic Environment and Nature (NOVANA).

Data Availability Statement

The original contributions presented in this study are included in the article/Supplementary Materials. Further inquiries can be directed to the corresponding author.

Acknowledgments

The Technical University of Denmark, Department of Transport (DTU Transport), provided a national road network (navteq) with modelled traffic data for 2020 from the national Green Mobility Model (GMM). The Danish Road Directorate provided travel speed data for 2016 (SpeedMap) for the national road network (navteq). The company HERMES performed map matching between the older and the newer GMM versions to transfer travel speed data. Thanks are expressed to the Danish Geodata Agency for making national address data, national building footprint data, and national elevation model data open source.

Conflicts of Interest

The authors declare no conflicts of interest. The funders had no role in the design of the study; in the collection, analyses, or interpretation of data; in the writing of the manuscript; or in the decision to publish the results.

References

  1. European Union. Directive (EU) 2024/2881 of The European Parliament and of the Council of 23 October 2024 on ambient air quality and cleaner air for Europe (recast). Off. J. Eur. Union. 20 November 2024. Available online: https://eur-lex.europa.eu/eli/dir/2024/2881/oj/eng (accessed on 20 November 2025).
  2. European Union. Directive 2008/50/EC of the European Parliament and of the Council of 21 May 2008 on Ambient Air Quality and Cleaner Air for Europe. Off. J. Eur. Union 2008, 152, 1–44. [Google Scholar]
  3. European Environmental Agency. European Air Quality Index, 18 November 2021. Available online: https://www.eea.europa.eu/themes/air/air-quality-index (accessed on 20 November 2025).
  4. Jensen, S.S.; Ketzel, M.; Becker, T.; Christensen, J.; Brandt, J.; Plejdrup, M.S.; Winther, M.; Nielsen, O.-K.; Hertel, O.; Ellermann, T. High Resolution Multi-scale Air Quality Modelling for All Streets in Denmark. Transp. Res. Part D Transp. Environ. 2017, 52, 322–339. [Google Scholar] [CrossRef]
  5. Rich, J.; Hansen, C.H. The Danish National Passenger Model. Eur. J. Transp. Infrastruct. Res. 2015, 1–29. [Google Scholar] [CrossRef]
  6. Jensen, S.S.; Ketzel, M.; Khan, J.; Valencia, V.H.; Brandt, J.; Christensen, J.H.; Frohn, L.M.; Nielsen, O.-K.; Plejdrup, M.S.; Ellermann, T. Air Quality At Your Street 2.0; Scientific Report from DCE No. 445; DCE—Danish Centre for Environment and Energy, Aarhus University: Aarhus, Denmark, 2021; 62p. [Google Scholar]
  7. Brandt, J.; Silver, J.D.; Frohn, L.; Geels, C.; Gross, A.; Hansen, A.B.; Hansen, K.M.; Hedegaard, G.B.; Skjøth, C.A.; Villadsen, H.; et al. An integrated model study for Europe and North America using the Danish Eulerian Hemispheric Model with focus on intercontinental transport. Atmos. Environ. 2012, 53, 156–176. [Google Scholar] [CrossRef]
  8. Christensen, J.H. The Danish Eulerian Hemispheric Model—A three-dimensional air pollution model used for the Arctic. Atmos. Environ. 1997, 31, 4169–4191. [Google Scholar] [CrossRef]
  9. Frohn, L.M.; Christensen, J.H.; Brandt, J.; Hertel, O. Development of a high resolution integrated nested model for studying air pollution in Denmark. Phys. Chem. Earth B 2001, 26, 769–774. [Google Scholar] [CrossRef]
  10. Brandt, J.; Christensen, J.H.; Frohn, L.M.; Berkowicz, R. Air pollution forecasting from regional to urban street scale––Implementation and validation for two cities in Denmark. Phys. Chem. Earth 2003, 28, 335–344. [Google Scholar] [CrossRef]
  11. Frohn, L.M.; Geels, C.; Andersen, C.; Andersson, C.; Bennet, C.; Christensen, J.H.; Im, U.; Karvosenoja, N.; Kindler, P.A.; Kukkonen, J.; et al. Evaluation of multidecadal high-resolution atmospheric chemistry transport modelling for exposure assessments in the continental Nordic countries. Atmos. Environ. 2022, 290, 119334. [Google Scholar] [CrossRef]
  12. Berkowicz, R. OSPM—A parameterised street pollution model. Environ. Monit. Assess. 2000, 65, 323–331. [Google Scholar] [CrossRef]
  13. Ketzel, M.; Jensen, S.S.; Brandt, J.; Ellermann, T.; Olesen, H.R.; Berkowicz, R.; Hertel, O. Evaluation of the Street Pollution Model OSPM for Measurements at 12 Streets Stations Using a Newly Developed and Freely Available Evaluation Tool. J. Civ. Environ. Eng. 2013, S1, 1–11. [Google Scholar] [CrossRef]
  14. Ketzel, M.; Berkowicz, R.; Hvidberg, H.; Jensen, S.S.; Raaschou-Nielsen, O. Evaluation of AirGIS—A GIS-Based Air Pollution And Human Exposure Modelling System. Int. J. Environ. Pollut. 2011, 47, 226–238. [Google Scholar] [CrossRef]
  15. Khan, J.; Kakosimos, K.; Raaschou-Nielsen, O.; Brandt, J.; Jensen, S.S.; Ellermann, T.; Ketzel, M. Development and Performance Evaluation of New AirGIS—A GIS Based Air Pollution and Human Exposure Modelling System. Atmos. Environ. 2019, 198, 102–121. [Google Scholar] [CrossRef]
  16. Skamarock, W.C.; Klemp, J.B.; Dudhia, J.; Gill, D.O.; Barker, D.; Duda, M.G.; Powers, J.G. A Description of the Advanced Research WRF Version 3; No. NCAR/TN-475+STR; University Corporation for Atmospheric Research; Mesoscale and Microscale Meteorology Division, National Center for Atmospheric Research: Boulder, CO, USA, 2008. [Google Scholar] [CrossRef]
  17. Nielsen, O.-K.; Plejdrup, M.S.; Winther, M.; Mikkelsen, M.H.; Nielsen, M.; Gyldenkærne, S.; Fauser, P.; Albrektsen, R.; Hjelgaard, K.H.; Bruun, H.G.; et al. Annual Danish Informative Inventory Report to UNECE. Emission Inventories from the Base Year of the Protocols to Year 2018; Scientific Report No. 369; DCE—Danish Centre for Environment and Energy, Aarhus University: Aarhus, Denmark, 2020; 559p. [Google Scholar]
  18. Plejdrup, M.S.; Nielsen, O.-K.; Brandt, J. High resolution gridding of emissions from residential wood combustion in Denmark. Atmos. Environ. 2016, 144, 389–396. [Google Scholar] [CrossRef]
  19. Plejdrup, M.S.; Nielsen, O.-K.; Gyldenkærne, S.; Bruun, H.G. Spatial High-Resolution Distribution of Emissions to Air—SPREAD 3.0; Technical Report No. 215; DCE—Danish Centre for Environment and Energy, Aarhus University: Aarhus, Denmark, 2021; 208p. [Google Scholar]
  20. Geels, C.; Winther, M.; Andersson, C.; Jalkanen, J.-P.; Brandt, J.; Frohn, L.M.; Im, U.; Leung, W.; Christensen, J.H. Projections of shipping emissions and the related impact on air pollution and human health in the Nordic region. Atmos. Chem. Phys. 2021, 21, 12495–12519. [Google Scholar] [CrossRef]
  21. EMEP/EEA. Air Pollutant Emission Inventory Guidebook 2019; EEA Report 13/2019; EMEP/EEA: Copenhagen, Denmark, 2019. [Google Scholar]
  22. Frohn, L.M.; Ketzel, M.; Christensen, J.H.; Brandt, J.; Im, U.; Massling, A.; Andersen, C.; Plejdrup, M.S.; Nielsen, O.-K.; Manders, A.; et al. Modelling ultrafine particle number concentrations at address resolution in Denmark from 1979 to 2018—Part 1: Regional and urban scale modelling and evaluation. Atmos. Environ. 2021, 264, 118631. [Google Scholar] [CrossRef]
  23. Ketzel, M.; Frohn, L.M.; Christensen, J.H.; Brandt, J.; Massling, A.; Andersen, C.; Im, U.; Jensen, S.S.; Khan, J.; Nielsen, O.-K.; et al. Modelling ultrafine particle number concentrations at address resolution in Denmark from 1979 to 2018—Part 2: Local and street scale modelling and evaluation. Atmos. Environ. 2021, 264, 118633. [Google Scholar] [CrossRef]
  24. Ellermann, T.; Nordstrøm, C.; Brandt, J.; Christensen, J.; Ketzel, M.; Massling, A.; Bossi, R.; Frohn, L.M.; Geels, C.; Jensen, S.S.; et al. Air Quality 2019. Status for the National Air Quality Monitoring; Scientific Report No. 410; DCE—Danish Centre for Environment and Energy, Aarhus University: Aarhus, Denmark, 2021; (In Danish with English Summary). [Google Scholar]
  25. Jensen, S.S.; Ketzel, M.; Im, U.; Løfstrøm, P.; Poulsen, M.B.; Monies, C.; Ellermann, T. Evaluation of the OML-Highway; Science Report No. 240; DCE—Danish Centre for Environmental and Energy, Aarhus University: Aarhus, Denmark, 2017; 49p. [Google Scholar]
  26. Nordstrøm, C.; Ellermann, T.; Brandt, J.; Christensen, J.; Ketzel, M.; Massling, A.; Bossi, R.; Frohn, L.M.; Geels, C.; Solvang Jensen, S.; et al. Air Quality 2023. Status for the National Air Quality Programme; Scientific report No. 627; DCE—Danish Centre for Environment and Energy, Aarhus University: Aarhus, Denmark, 2024; 158p, (In Danish with English Summary). [Google Scholar]
  27. Ellermann, T.; Massling, A.; Bossi, R.; Nordstrøm, C. The Particle Project 2021; Scientific Report No. 500; DCE—Danish Centre for Environment and Energy, Aarhus University: Aarhus, Denmark, 2022; 38p. [Google Scholar]
  28. WHO. WHO Global Air Quality Guidelines. Particulate Matter (PM2.5 and PM10), Ozone, Nitrogen Dioxide, Sulfur Dioxide and Carbon Monoxide; WHO: Geneva, Switzerland, 2021. [Google Scholar]
  29. Grundström, M.; Asker, C.; Segersson, D.; Wylde, H.A.; van Dongen EJakobsson, M.; Windmark, F. High Resolution Air Quality Modelling of NO2, PM10 and PM2.5 for Sweden. A National Study for 2019 Based on Dispersion Modelling from Regional Down to Street Canyon Level; Report Meteorology and Climatology No. 120; Swedish Meteorological and Hydrological Institute: Norrköping, Sweden, 2023; 76p. [Google Scholar]
  30. Brandt, J.; Silver, J.D.; Christensen, J.H.; Andersen, M.S.; Bønløkke, J.; Sigsgaard, T.; Geels, C.; Gross, A.; Hansen, A.B.; Hansen, K.M.; et al. Contribution from the ten major emission sectors in Europe to the Health-Cost Externalities of Air Pollution using the EVA Model System—An integrated modelling approach. Atmos. Chem. Phys. 2013, 13, 7725–7746. [Google Scholar] [CrossRef]
  31. Grell, G.A.; Dudhia, J.; Stauffer, D.R. A Description of the Fifth Generation Penn State/NCAR Mesoscale Model (MM5); NCAR Technical Note, NCAR/TN-398+STR; Mesoscale and Microscale Meteorology Division, National Centre for Atmospheric Research: Boulder, CO, USA, 1995; p. 114. [Google Scholar]
  32. Berger, J.; Walker, S.-E.; Denby, B.; Berkowicz, R.; Løfstrøm, P.; Ketzel, M.; Härkönen, J.; Nikmo, J.; Karppinen, A. Evaluation and inter-comparison of open road line source models currently in use in the Nordic countries. Boreal Environ. Res. 2010, 15, 319–334. [Google Scholar]
  33. Jensen, S.S.; Ketzel, M.; Khan, J. Mapping of Air Quality Along State Roads in Denmark; Scientific Report from DCE No. 537; DCE—Danish Centre for Environment and Energy, Aarhus University: Aarhus, Denmark, 2023; 51p, (In Danish with English Summary). [Google Scholar]
  34. Paunu, V.-V.; Karvosenoja, N.; Segersson, D.; López-Aparicio, S.; Nielsen, O.-K.; Plejdrup, M.S.; Thorsteinsson, T.; Niemi, J.V.; Vo, D.T.; Denier van der Gon, H.A.C.; et al. Spatial distribution of residential wood combustion emissions in the Nordic countries: How well national inventories represent local emissions? Atmos. Environ. 2021, 264, 118712. [Google Scholar] [CrossRef]
Figure 1. Correlation between observed Annual Average Daily Traffic (AADT) (x-axis) and modelled AADT from GMM (y-axis) for Aalborg (left panel) and Copenhagen (right panel). The 1:1 line is marked. The dotted lines indicate the following: values from GMM that are 50% higher than observed are above the upper dotted line, and values from the GMM that are lower than 50% of observed values are below the lower dotted line.
Atmosphere 16 01346 g001
Figure 2. Correlation between travel speed in monitoring program ((km/h) (x-axis) and travel speed from GMM (y-axis) for Aalborg (left panel) and Copenhagen (right panel). The 1:1 line is marked. The dotted lines indicate the following: values from GMM that are 50% higher than observed are above the upper dotted line, and values from the GMM that are lower than 50% of observed values are below the lower dotted line.
Atmosphere 16 01346 g002
Figure 3. Comparison of annual mean values of model results and observations for NO2 for fixed monitoring stations under the Danish Air Quality Monitoring Programme for the year 2019 [24]. The 1:1 line is also shown.
Atmosphere 16 01346 g003
Figure 4. Comparison of annual mean values of model results and observations for PM2.5 (left panel) and PM10 (right panel) for fixed monitoring stations under the Danish Air Quality Monitoring Programme for the year 2019 [24]. The 1:1 line is also shown.
Atmosphere 16 01346 g004
Figure 5. Comparison of annual mean values of model results for BC and observations for EC for 2019 Measurements are from fixed monitoring stations under the Danish Air Quality Monitoring Programme [24,27]. The 1:1 line is also shown.
Atmosphere 16 01346 g005
Figure 6. (a) Annual mean NO2 background concentrations in 2019 based on DEHM/UBM; (b) annual mean NO2 street concentrations along the road network of GMM in 2019 based on DEHM/UBM/AirGIS.
Atmosphere 16 01346 g006
Figure 7. (a) Annual mean PM2.5 background concentrations in 2019 based on DEHM/UBM; (b) annual mean PM2.5 street concentrations along the road network of GMM in 2019 based on DEHM/UBM/AirGIS.
Atmosphere 16 01346 g007
Figure 8. (a) Annual mean PM10 background concentrations in 2019 based on DEHM/UBM; (b) annual mean PM10 street concentrations along the road network of GMM in 2019 based on DEHM/UBM/AirGIS.
Atmosphere 16 01346 g008
Figure 9. (a) Annual mean BC background concentrations in 2019 based on DEHM/UBM; (b) annual mean BC street concentrations along the road network of GMM in 2019 based on DEHM/UBM/AirGIS.
Atmosphere 16 01346 g009
Figure 10. (a) Annual mean PNC background concentrations in 2019 based on DEHM/UBM; (b) annual mean PNC street concentrations along the road network of GMM in 2019 based on DEHM/UBM/AirGIS.
Atmosphere 16 01346 g010
Figure 11. Frequency distribution for NO2 in 2019 compared with WHO guidelines (green line), and former (solid red line) and new (dashed red line) EU limit values.
Atmosphere 16 01346 g011
Figure 12. Frequency distribution for PM2.5 in 2019 compared with WHO guidelines (green line) and new EU limit values (dashed red line). The former EU limit value is 25 µg/m3.
Atmosphere 16 01346 g012
Figure 13. Frequency distribution for PM10 in 2019 compared with WHO guidelines (green line) and new EU limit values (dashed red line). The former EU limit value is 40 µg/m3.
Atmosphere 16 01346 g013
Table 1. Overview of similarities and differences between versions 1.0 and 2.0 of Air Quality at Your Street.
TypeVersion 1.0Version 2.0
Model year20122019
Chemistry transport modelsDEHM/UBM/OSPMDEHM/UBM/OSPM
Classical pollutantsNO2, PM2.5, PM10NO2, PM2.5, PM10
New pollutantsn.a.BC, PNC
Global and European emissionsEDGAR, GEIA, EMEP, EPITOMEEDGAR, GEIA, EMEP, EPITOME
Danish emissionsSPREAD 1 km × 1 km, COPERT for OSPMSPREAD 1 km × 1 km, COPERT for OSPM
BC emissionsn.a.International and Danish emission inventories
PNC emissionsn.a.HERMES EU project
Mass closure adjustmentn.a.Factor applied
Meteorological dataMM5 (2012)WRF (2019)
National address dataset2.4 million2.5 million
National building footprintsFrom 2013From 2018
National traffic flow dataGMM (2010)GMM (2020)
Vehicle speed on road networkSPEEDMAP (2012)SPEEDMAP (2016)
Evaluation of modelled traffic data against traffic countsCopenhagen and Aalborg (2012)Copenhagen and Aalborg (2019)
Evaluation of modelled concentrations against measurementsNational monitoring network (2012)National monitoring network (2019) incl. BC and PNC
Comparison with limit values and WHOEU 2008EU 2008, 2024 and WHO 2021
Trend analysisn.a.From 2012 to 2019
Part of national AQ monitoringn.a.Since 2017
Disclaimer/Publisher’s Note: The statements, opinions and data contained in all publications are solely those of the individual author(s) and contributor(s) and not of MDPI and/or the editor(s). MDPI and/or the editor(s) disclaim responsibility for any injury to people or property resulting from any ideas, methods, instructions or products referred to in the content.